1. Introduction
In practical terms, in order to remain competitive, manufacturing companies must be able to effectively solve a range of production-related issues, such as bottlenecks and unbalanced production lines, shutdowns, late deliveries, extra work hours, inefficient material handling and movements, as well as high production costs, among others.
Regarding bottlenecks and unbalanced production lines, several studies have presented different types of case studies on manufacturing companies. For instance, Gu et al. [
1] presented two case studies where maintenance problems were caused by bottlenecks in complex manufacturing systems. In these cases, the result was the production loss. Similarly, Ren et al. [
2] displayed a case study where bottlenecks and unbalanced production lines caused low productivity in an assembly area. Specifically, in order to solve this problem, these authors performed a re-layout of the assembly and balanced in the production lines, therefore, productivity increased. Further, Zupan and Herakovic [
3] presented a case study of two production lines where bottlenecks caused them to become unbalanced, consequently, the company had low productivity. Furthermore, to increase productivity, these authors implemented the balancing line approach.
Respecting the shutdowns, Sonmez et al. [
4] addressed two case studies where shutdowns of equipment caused production loss in manufacturing systems. Likewise, Peng and Zhou [
5] investigated a multiple server scheduling problem in automobile assembly lines, where just-in-time (JIT) part-supply had become a critical issue. The authors mentioned that expensive line shutdowns represent a cause of this type of issue. In another case, Zhou and Peng [
6] mentioned that the mixed-model assembly lines are extensively adopted in the current automobile production to satisfy the ongoing customization, however, material shortages are not allowed, as it would be extremely expensive due to the production line shutdowns. Finally, Zhao et al. [
7] presented a case study of delay-time-based preventive maintenance (PM) modelling for a production plant system in a steel mill. In this case, shutdowns were caused by waiting for raw materials.
Moreover, delays in deliveries represent another problem for manufacturing companies. The literature review provides some examples. For instance, Fazlollahtabar [
8] presented a case of an assembly line where late deliveries of products caused a low overall manufacturing system performance. In order to solve this problem; this author proposed a parallel autonomous guided vehicle assembly line for a semi-continuous manufacturing system. Peng and Lu [
9] examined the impact of the delivery performance on customer transactions. As a result, these authors found that the measures of delivery performance affect customer transaction quantity and unit price differently. In the case of extra work hours, Hansson et al. [
10] performed a study to determine whether man-hour efficiency of picking is affected by the use of batch preparation, compared to the preparation of one kit at a time. In this study, these authors mentioned that kitting is associated with extra time for operations in the materials feeding. In fact, they performed two experiments, and they found that single-kit preparation took more time than batch preparation, and also represented a higher cost, i.e., extra time, more investments.
On the other hand, El-Namrouty and Abushaaban stated that inefficient material handling and movements do not add any value to the product. These authors pointed out that inefficient material handling between processing stages results in prolonging production cycle times, and the inefficient use of labor and space. In the case of movements, these involve poor ergonomics of production, where operators must stretch, bend, and pick up products when such actions could be avoided. All these problems cause high production costs [
11].
Several studies have confirmed that bottlenecks can cause production shutdowns [
1,
12] that critically affect the performance of the entire production system. In general, bottlenecks decrease the productivity of manufacturing systems, thereby limiting the systems total production capacity [
2,
13]. Similarly, Zupan and Herakovic [
3] declared that unbalanced production lines cause organizational problems, decrease performance, and increase costs. Specifically, production line balancing is a traditional production strategy that helps decrease bottlenecks. As for shutdowns, they may be responsible for production losses [
4] and increasing costs [
5,
6], especially when they occur unexpectedly and affect subsequent operations [
14]. In particular, according to Hossen et al. [
15], idling and major stoppages and breakdown losses account for 89.3% of total stoppage losses.
Manufacturing systems implement multiple strategies to mitigate problems in the production process. For instance, at the supplier selection stage, they pay close attention to attributes, such as punctuality and reliability [
9], which are crucial for the success of any business as well as allowing firms to entice their customers to order more products or pay a higher price for a specific item [
9]. Another clear example of a competitive strategy is the Fulfillment by Amazon (FBA) logistics service, which provides sellers more flexibility in their selling practices. The FBA manages the entire back-end fulfillment of a product or item from a third-party seller once it is purchased. A recent survey reported that 73% of the FBA sellers mentioned that unit sales have increased over 20% [
16]. Furthermore, a business-to-business (B2B) study conducted by Bain and Company indicated that firms with an appropriate delivery performance can charge higher prices for their products, and entice their customers to order more of them [
17]. Conversely, poor delivery performance causes sales decrements, or even losses.
In addition, multiple studies support that working extra hours are a relevant characteristic for certain tasks or departments within manufacturing systems. For instance, Hanson et al. [
10] undertook research on order batching and time efficiency in kit preparation, where it was found that kitting is associated with extra time for operators in the feeding of materials, where extra hours are usually necessary for achieving the proper overall performance of materials in a supply system that uses kitting. Moreover, Wang et al. [
18] found that inappropriate process planning can cause workers work additional time, which ultimately translates in higher costs. For material handling and movements, El-Namrouty and Abushaaban [
11] determined the effects of each of the seven manufacturing wastes (i.e., the overproduction, over-processing, waiting, defects, motion, transportation, and inventory) on the other six wastes, where it was found that insufficient worker motions caused unnecessary work-in-process and increased the rate of defective parts. Furthermore, it was found that non-standardized work increases both processing time, waste in the process, as well as the rate of defective parts, whereas insufficient and unsafe material handling equipment and machines lead to undue amounts of in-process inventory, product defects, and delays in final deliveries. As a result, all these problems cause major issues: low production levels and non-compliance with the demand.
Standardized work (SW) is a vital tool for solving manufacturing problems, which offers almost immediate results in terms of organizational performance by increasing productivity and reducing delivery times [
19]. SW is probably the most known method for performing a specific job, which in turn makes it the safest and most efficient method for complying with timely, orderly, and quality deliveries [
20]. SW is the set of specific directions that are needed to manufacture a product in the most efficient way, which allows defining the best methods and sequenced tasks for each process and operator, therefore, reducing wastes [
19,
21,
22].
SW defines how each task or job must be performed by each operator in the production system, hence, preventing employees from executing random tasks [
19,
23] that can adversely affect lifecycle times. In fact, SW draws upon takt time to ensure timely compliance with demand [
24]. In this sense, the aim of SW involves removing Mura [
25], that is, the general term of inequality, irregularity, or inconsistency in physical matter or the human spiritual condition, and it is also a key concept in the performance improvement systems, because it is one of three types of waste (Muda, Mura, Muri) [
26]. However, SW does not mean that a work routine can never be changed. Instead it implies “this is the best way we know how to do this type of work today” [
23,
27]. Furthermore, SW is integrated by three elements [
19]: takt time (i.e., the rate at which a finished product needs to be completed in order to fulfill the customers’ demand); the precise work sequence in which an operator performs tasks within takt time; and the standard inventory—including the units in machines—required to keep the process flowing smoothly.
Some studies report applications of SW to solve problems in production processes. For instance, Nallusamy and Saravanan [
28] implemented both line balancing and SW in a small manufacturing company, where it was managed to reduce cycle times to 350 s as it increases productivity. Then, Nallusamy [
29] applied the same two tools in the computer numerical control (CNC) industry, where non-value-added (NVA) activities were reduced by 17%, while production significantly increased, from five units a day per two operators to seven units a day per a single operator. From a similar perspective, Villalba-Diez and Ordieres-Mere [
30] applied SW to inter-process communication in an automotive manufacturing enterprise, where a performance optimization of 4% was achieved. Additionally, Mor et al. (2018b) implemented work standardization in the core making process in a manufacturing company, where a reduction of 31.6 s in cycle times was reported, as well as an increment of 6.5% in production.
The multiple applications of SW reveal that this method does much more than controlling processes. It also minimizes costs and maximizes efficiency [
31]. SW is an efficient lean manufacturing tool that helps increase competitiveness in firms. In the particular case of small and medium enterprises (SMEs), SW is an excellent method that can compensate for the lack of manufacturing technology (AMT) in the production process. However, SW is often under-implemented, not properly cared, or/and misunderstood [
19].
According to the literature review, from a critical realism approach, the single case study research methodology is enough to generalize empirical and theoretical findings. For example, Easton [
32] argued that critical realism is a coherent, rigorous, and a new philosophical position that not only substantiates single case research as a research method, but also provides helpful implications for both the theoretical development and research process. Moreover, Tsang [
33] stated that critical realism recognizes the role of a case study research in empirical generalization, theoretical generalization, and theory testing. This last author describes that fallibility of knowledge implies that once a theory is developed, it is necessary to subject it to further empirical tests, where case studies are a suitable way of conducting this type of test. Therefore, a single case study is enough to generalize results [
34].
According to that position, the main goal of this research is to demonstrate the impact of both SW and line balancing on the production process using a case study. Indeed, this study attempts to validate that these two tools can significantly reduce bottlenecks while increasing the production in SMEs. In other words, the current status of the company production process was analyzed, where several techniques and tools were applied to solve the identified problems in the production process. Then, this process was observed one more time to compare the before and after results. This case study was chosen due to two reasons: Firstly, the company reports several problems derived from the lack of balanced lines and standardized work, such as low production, a high rate in customers’ complaints, high costs of extra time, and physical fatigue in operators. Secondly, this case study is part of a project of the manufacturing processes’ improvement, where most participant companies are big companies. Therefore, before implementing SW and line balancing in a big company, it is implemented in a SME.
The innovation of this research is that it may allow the positive results to be shown from the impact of SW and line balancing on the production process in SMEs in the manufacturing sector with a single case study, which is based on the critical realism perspective.
2. Methodology
The methodology has a structure similar to the one proposed by Realyvásquez-Vargas et al. [
35], which includes major tasks, such as (a) analyzing the current state of the production process, (b) studying times and movements in operators, (c) visually standardizing workstations, (d) implementing standardization, and (e) analyzing the redesigned production process. In this sense, the research methodology comprises four stages: (1) collect and analyze data, (2) study times and motion, (3) make visual standardization, and (4) implement standardization.
2.1. Stage 1. Data Collection and Analysis
This stage is aimed to get information from the current status of the production process to make some preliminary analysis. The main tasks are:
Describe the workstation
Make diagrams of current production process
Monitor and analyze the production process
Identify critical production indexes
Propose a project to a manager to improve indexes
In this stage, the project proposal is presented to managers at the printing company, first by summarizing the shortcomings of the company current production process, and then, by describing the SW-based proposal, thus highlighting the potential benefits of a standardized process (e.g., reduced process times and costs, greater firm prestige, and decreased employee fatigue). Next, the production process is analyzed along with the operators, who know best the production process. In fact, the production tasks were monitored in order to identify potential opportunities for improvement. Subsequently, a process flowchart was designed to visually represent the precise work sequence in which the operators perform the observed tasks. Finally, a detailed description was made of each observed workstation and tasks, highlighting the precise way they must be performed as well as making a chart for each of them.
2.2. Stage 2. Study of Time and Motion
The second stage assumes that there is authorization from the manager to apply the SW in the production process, which is aimed at its analysis along with study time and motion in the workstations, demanding the collaboration from operators. The main tasks are:
Particularly, those tasks are aimed to discover and consequently, eliminate the time and motion inefficiencies to establish standardized and optimized procedures for activity execution, as well as to measure the operator performance [
36]. Regarding the time analysis, first, the number of cycles to observe is defined, as it is recommended by General Electric (GE) [
37]. Then, the average observed time (OT) is estimated for each repetitive work cycle, as well as the normal time (NT) for each task, considering the Westinghouse Rating System’s four factors for rating performance [
37,
38]. Similarly, the standard time (ST) is estimated, considering the constant and variable allowances recommended by the International Labor Organization (ILO). As for the study of motion, efficient and inefficient therbligs are analyzed, which are performed by the operators, therefore, the information is used to build the bimanual process chart. The inefficient therbligs must be removed since they cause bottlenecks. In this sense, the present motion study helped to determine which manual tools operators use more frequently and to place them at a closer distance from employees when redesigning the workstation [
37].
The following task at this stage involves line balancing, which is concerned with assigning tasks within an assembly line to meet the required production rate for optimization purposes [
39]. To this end, a cost per unit analysis was performed as follows: describe the tasks of each work cycle, convert time to decimal format, define the number of operators required by workstation, and estimate the totals required by line. Additionally, the time in the line was estimated, as well as the balancing percentage in each production line, the adjusted work cycle, and the production per hour, shift, and department. Subsequently, the approximate number of parts produced per operator and the production costs per unit were calculated. Next, a possible work sequence in which the tasks can be performed to maintain similar times across all the proposed workstations was defined. In addition, both efficiency and takt time in each line were determined. Finally, the number of operators required for each production line that can fulfill the needed demand was calculated.
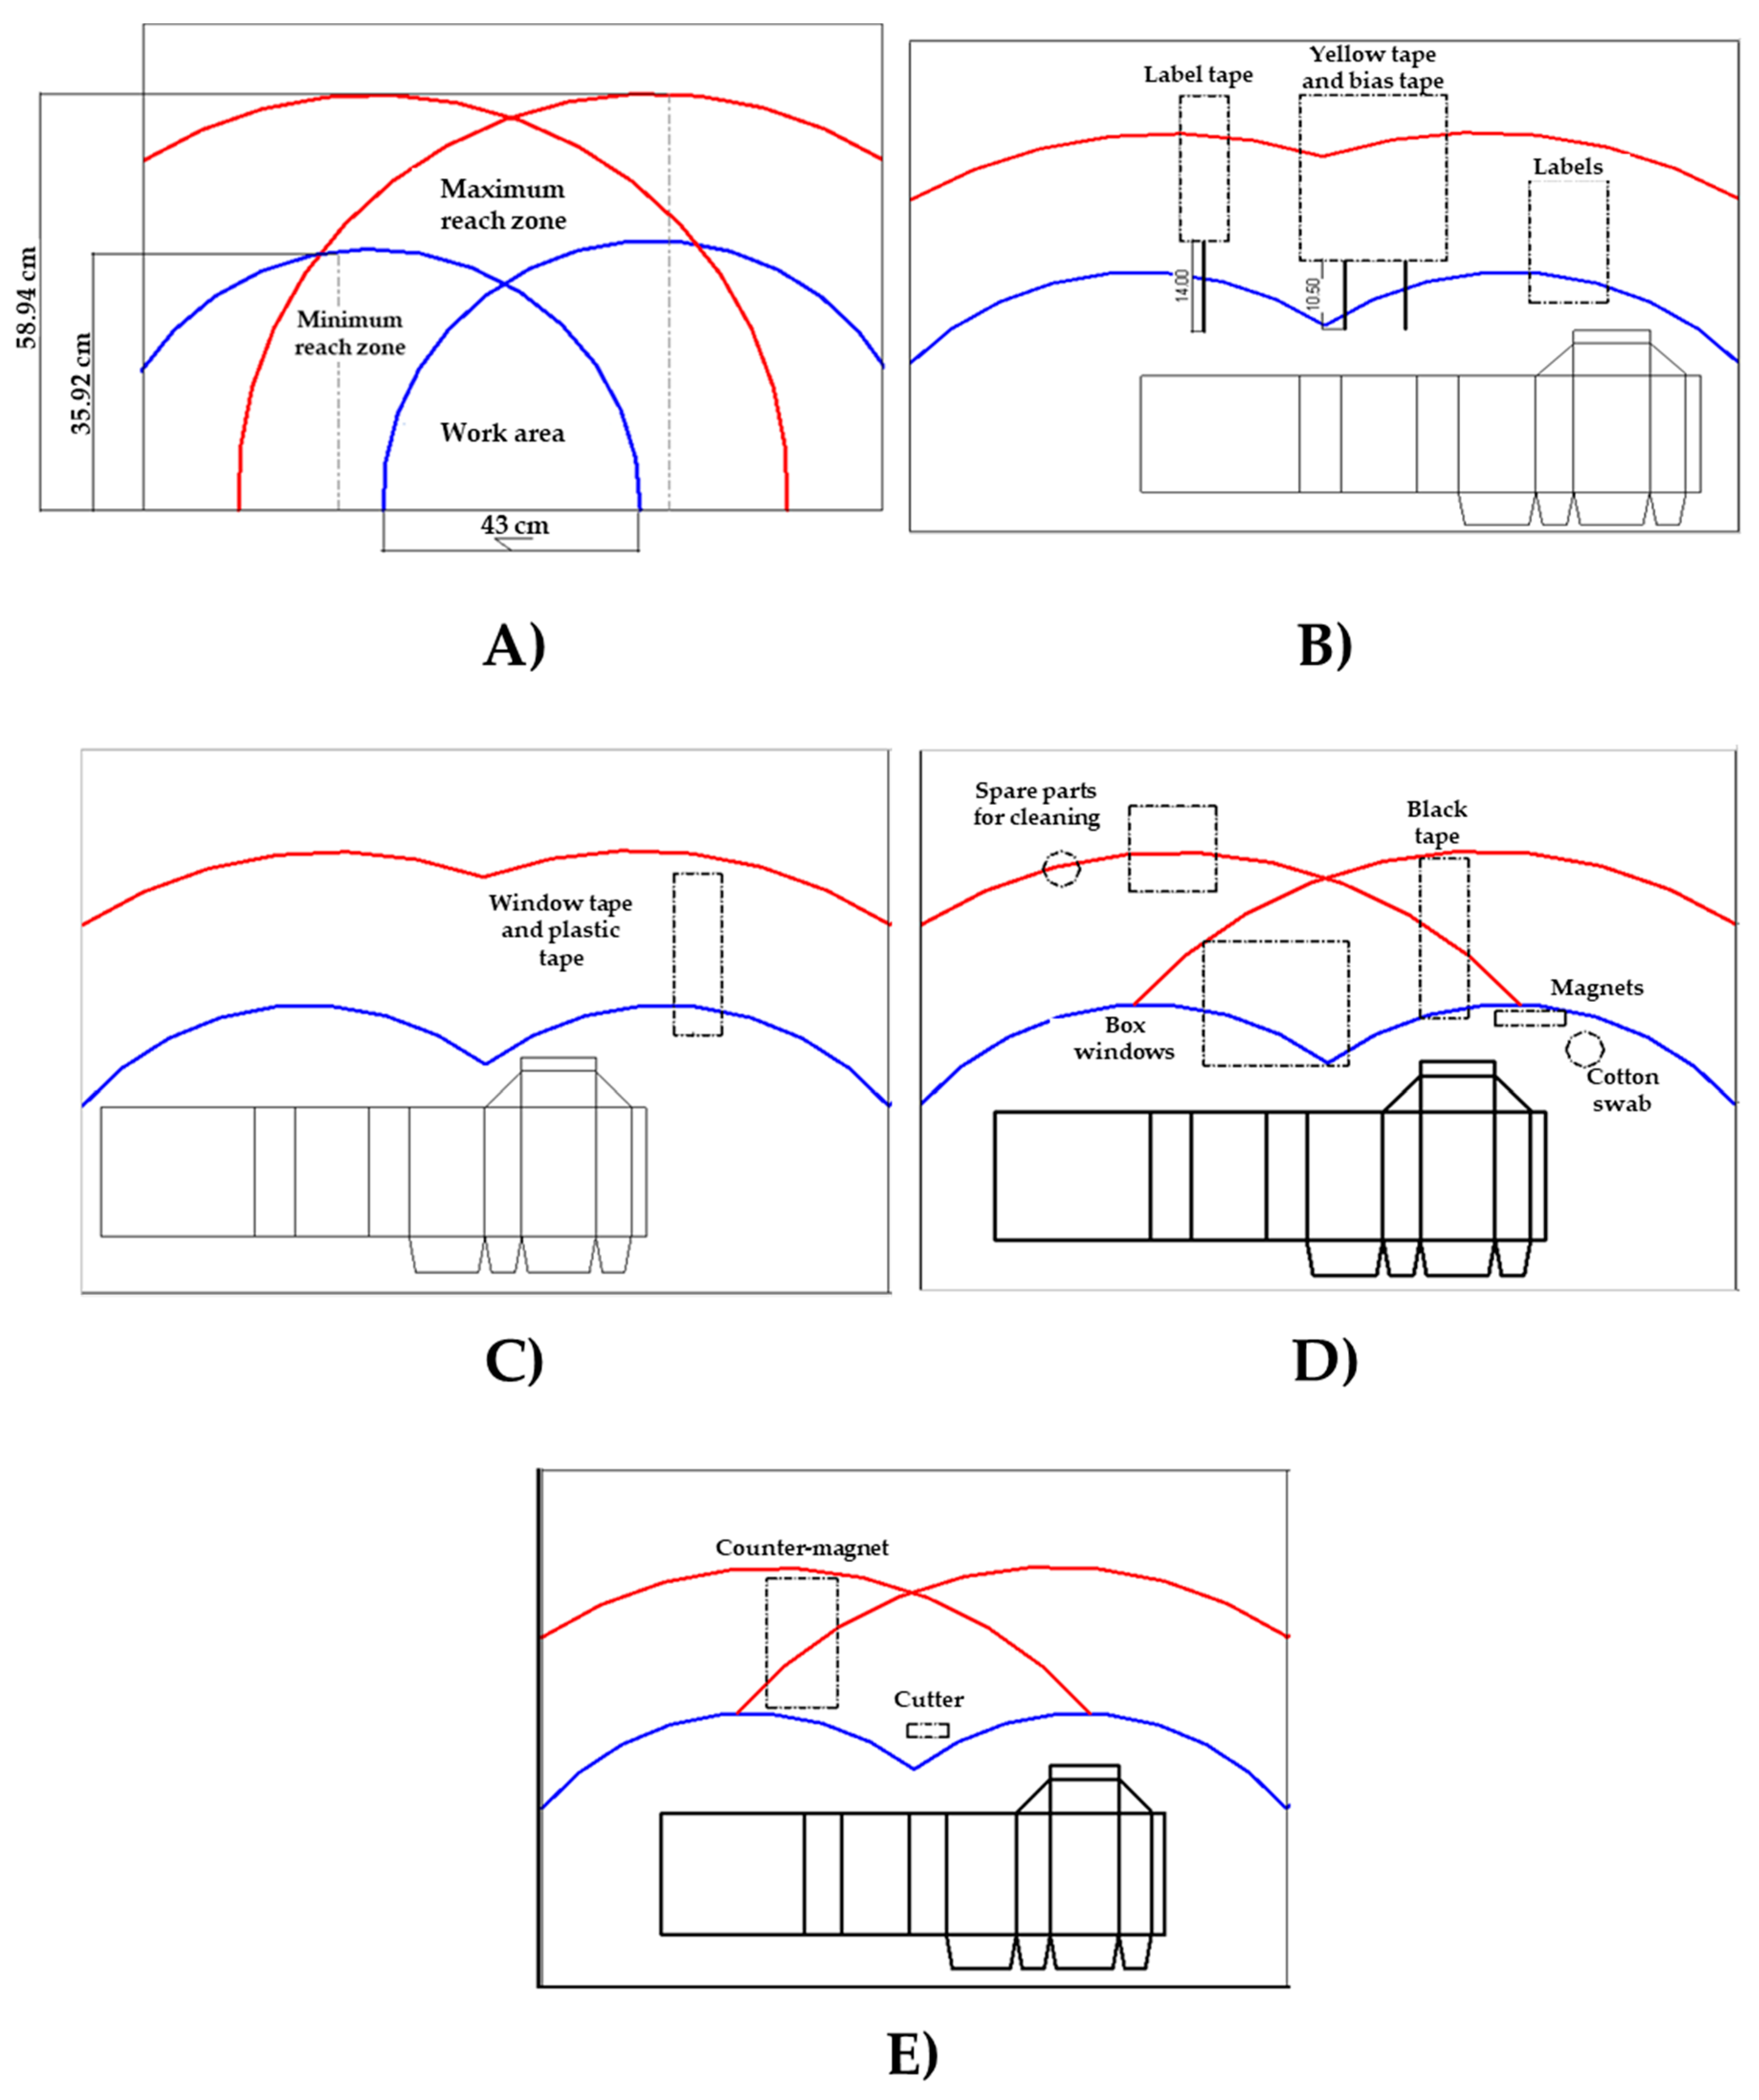
The last step at this stage involved redesigning the workstations. Specially, the bimanual process chart developed earlier at this stage was used. Then, an anthropometric study among the women operators to define both minimal and maximum reach zones was performed. The 5th percentile forearm-length and stretched-arm-length was used, as well as the 95th-percentile shoulder-length [
40]. Next, the workstations were redesigned, specifying the position of the minimum and maximum reach zones, where the work area represented the operators’ back width. Further, the location of the manual tools in the workstations according to their frequency of use was determined. Finally, experimental runs with the same studies on time and motion used earlier at the stage were performed, as well as a cost per unit analysis and a comparison of the results. In order to confirm the validity of the method from the authors of this research, one of the production lines kept the original method during seven days for comparative purposes.
2.3. Stage 3. Visual Standardization of Workstations
This stage assumes that the data analysis from production lines is finished, and that a new method is ready to be applied. The goal at this stage is to give visual support to the proposed method, where the main tasks are:
Make process flowcharts for the redesigned process
Create visual aids for operators
Design new templates for the workstation
At this stage, several flow charts were developed regarding the new method in order to visually represent the standardization in the production process. The charts were used to illustrate the precise work sequence of the tasks that must be performed at some time, as it was estimated in the bimanual progress chart. Then, visual aids for each workstation were created, which include photographs taken from tasks to highlight the fundamental points of them, as well as indicate the manual tools needed for each task. It is worth mentioning that the visual aids were developed by considering the creativity and criteria of the authors as analysts, therefore, paying attention to aspects, such as simplicity, clarity, visibility, and straightforwardness to ensure that they have an appropriate support acceptance from operators.
The last step at this stage involved making design templates for the workstations in order to indicate the positions of the manual tools, as well as help the operators place these tools by themselves. The templates were used to ensure that the process at each workstation runs smoothly and without bottlenecks. The templates were designed in real size, using pictures from workstations and bimanual progress chart, which were designed to remain in one side of the corresponding workstation.
2.4. Stage 4. Implementation of Standardized Work in the Production Lines
This stage is aimed to implement a new method as well as standardized work in the production lines. Once the new workstation design and the visual aids were ready, then the following task is done:
At this stage, the obtained results were compared with the initial goals to determine whether or not they were attained. If the method proves to be effective, the production lines are installed with the new production method, and the redesigned workstations are installed along with their corresponding visual aids and designed templates.
3. Results
3.1. Research Problem
In order to demonstrate the importance of SW, a case study conducted in a publishing company is presented, which employs 150 workers and has an operational infrastructure that comprises both mechanical tasks and manual tasks. The mechanical tasks are pre-press, printing, stapling, binding, and cutting, among others, whereas the manual tasks comprise of folding, collating, and box assembly. The main services that the company offers are the printing and publishing of manuals, box assembling, and packaging, which account for 70% of the company operations. The remaining 30% include the manufacturing of labels, file folders, magazines, books, and catalogues. The company has six major departments: Editing, Pre-Press, Machine Works, Manual Works, and Box Assembly.
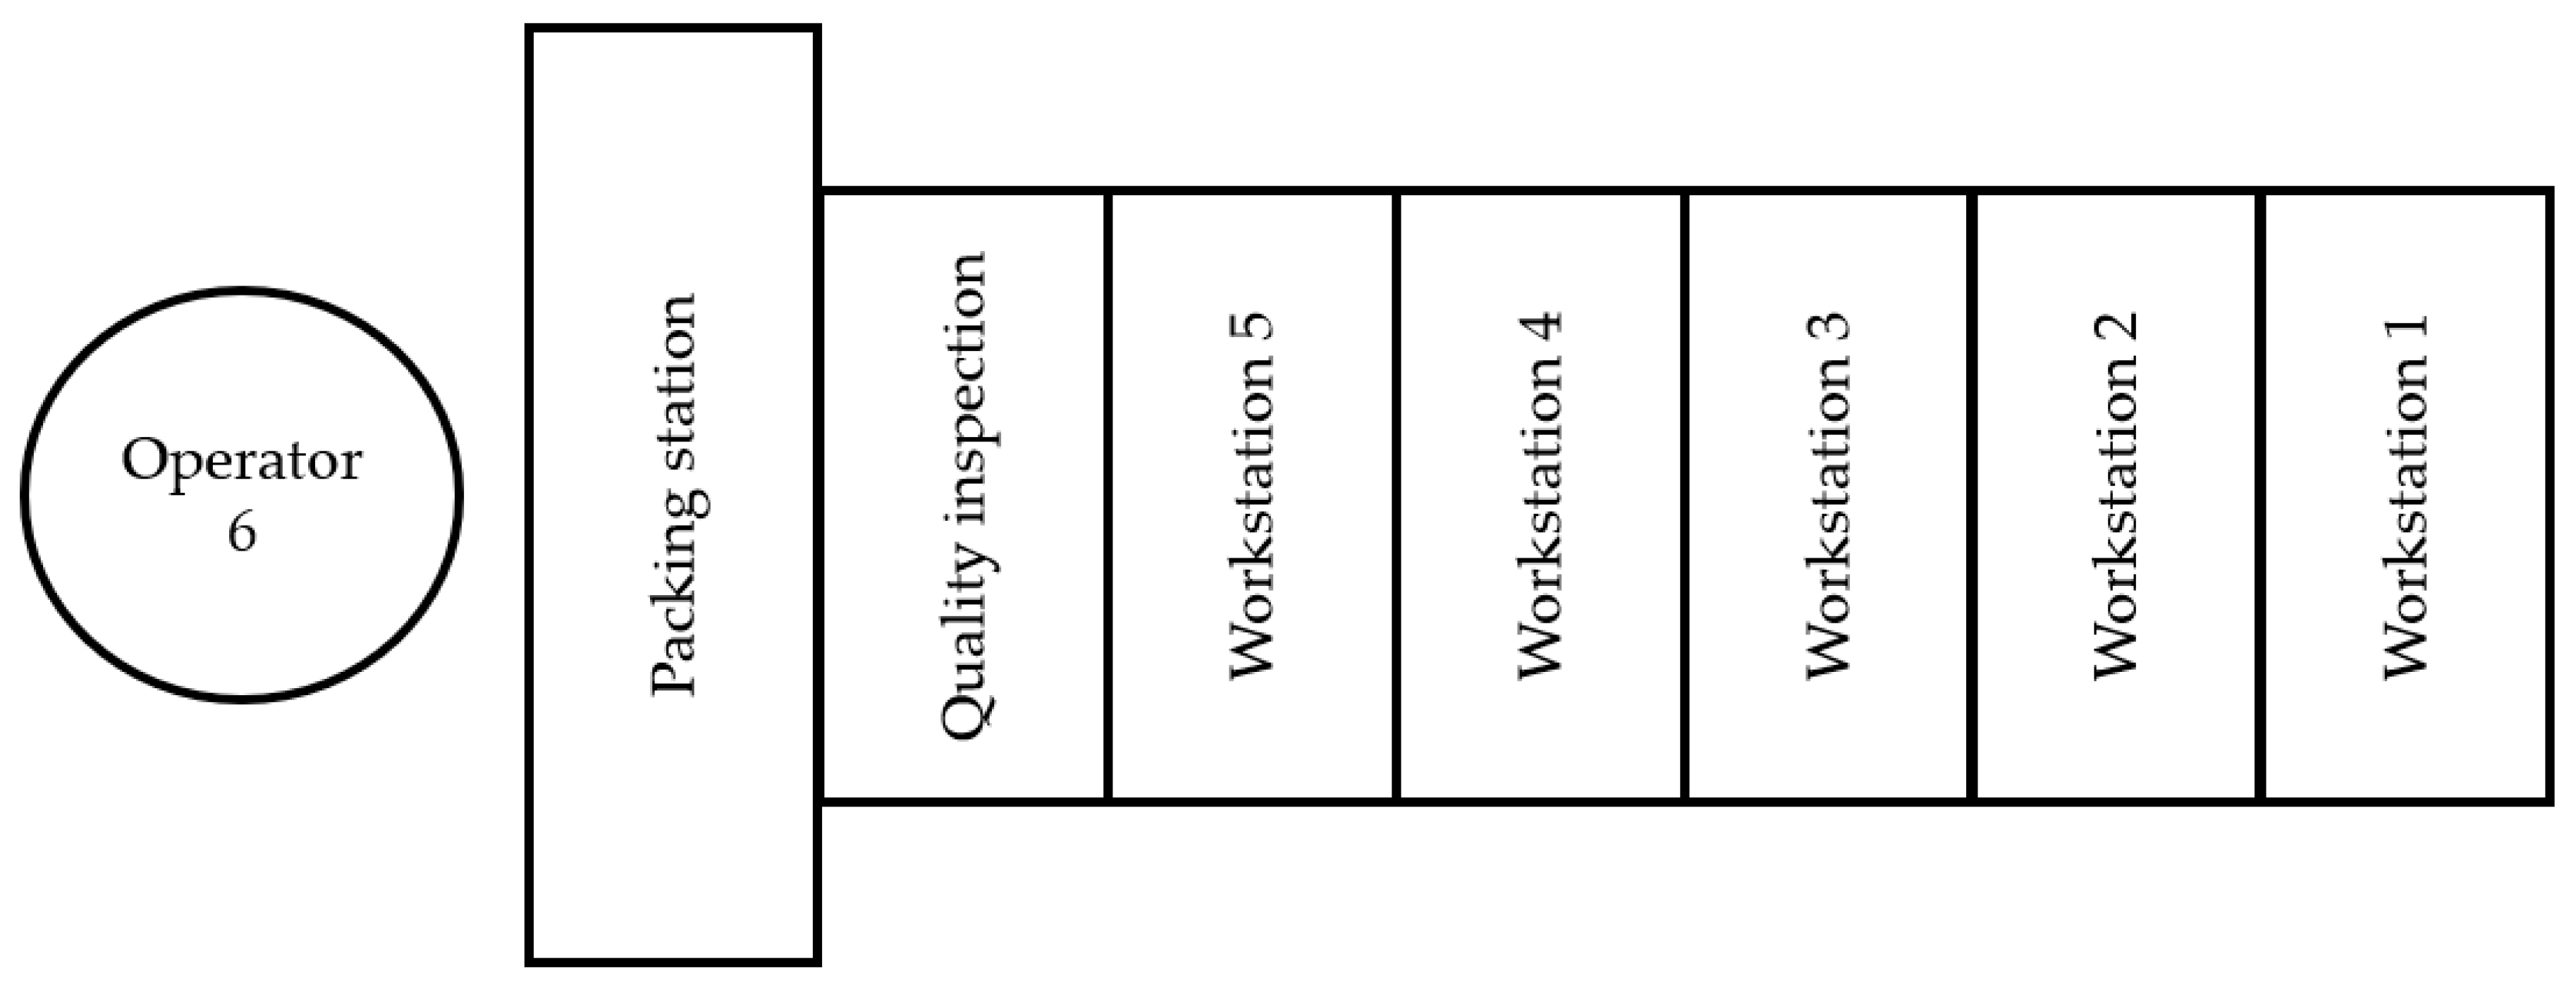
This research is conducted in the box assembly department, but it does not include the product packaging stage, since there arise production problems in different models. The production process comprises four assembly lines, and each line is run by five operators, a quality inspector, and a packing operator as it appears in
Figure 1.
The company offers an array of services to its customers, yet it shows multiple opportunities for improvement, such as increased production, more on-time deliveries, better inventory handling, and the implementation of visual aids, among others. The most common box model that is manufactured is the model A.
Notably, one line produces an average of 350 units daily, yet the demand is of 650 units daily, which is equivalent to one day and a half of extra work (see
Table 1). Unfortunately, extra hours involve higher production costs and sometimes, employees report fatigue and back pain due to long working hours.
It was found that the assembly lines in the Box Assembly department experience at least one of the following undesirable events: bottlenecks, production delays, late product deliveries, payment of extra hours to workers, unnecessary movements when employees perform their tasks, and high costs due to unbalanced production lines. Therefore, the costs per unit increase, and the corporation’s image is adversely affected by its inability to fulfill the demand. Box assembly is the last stage of the production process, before the final product is sent to the customers, however, the company is often unable to fulfill the demand on time. The overall goal of this research is to increase the corporation’s production rate and improve the employees’ performance through the standardization of the production process of box model A in the box assembly department. Similarly, the three specific objectives of the research include increasing production levels by 20%, reducing the standard time by at least 15%, and reducing costs per unit by 40%.
3.2. Results at Stage 1. Collect the Analyzed Data
After defining the problem with the information in
Table 1, at this stage, a flow chart is developed with the corporation’s current production system, as it is displayed in
Figure 2, where in order to have a better understanding about the manufacturing process of model A, a brief description of the operations required are given.
The operators at workstation 1 take the item on their right side and place it in front of them as they place a small strip of double-sided tape on the back of the box, where a label with the client’s name is included later. Next, the operator places four double-sided tape strips on the contour of a quadrangular perforation, which are then removed, leaving the rubber on display. Finally, the item is sent to workstation 2.
At workstation 2, the operators place a double-sided tape strip bending to the side of the box. Subsequently, they place a strip of double-sided mustard tape, and a quadrangular plastic in the rubber, exposing the tape strips placed in workstation 1. Finally, the operators clean the plastic with a cotton ball dipped in alcohol to remove fingerprints and pass the piece to workstation 3.
At workstation 3, the operators take the item and remove the cover of the double-sided label tape placed in the workstation 1. Subsequently, the label is placed with the customer’s name. Next, another double-sided fold tape is placed. In addition, they also place two positive magnets in the openings that are in the quadrangular shaped plastic. Next, the magnets are covered with black tape strips and the item is sent to workstation 4.
At station 4, the operators take the item and remove the counter of the mustard tape and the two-bending tape. Next, two counter magnets are placed on the bottom and top of the box. Subsequently, the box is folded to glue the lid, and the item is sent to workstation 5. Finally, the operators at workstation 5 take the item and place a double-sided tape (NITO) in the base of the box. Afterwards, double-sided tape is placed on a tab of the box, and then removed. Then, a tab is glued to the other side of the box to shape it. Then, the item is sent to the quality station.
3.3. Results at Stage 2. Study Time and Motion in Workstations
Table 2 lists the information about the performance factors and allowances assigned to each original workstation. For example, in the case of performance factors, the clearance of the skill factor for workstation 1 (operator 1) was 0.06, which indicates that the operator had good skill and ability. In the case of the effort factor, a clearance of 0.03 was obtained in workstation 1, which indicates that the operator made a good effort to reach the production goals. The same procedure is applied to the other slacks of the other factors for each workstation. In the last row, the slack scores are added for each workstation, and a 1 is added and the total is obtained. The same procedure is applied to obtain the constant and allowance variables.
Table 3 shows the estimated observed time (OT), the normal time (NT), and the standard time (ST). ST in workstations 3 and 4 reported a difference of 17 and 35 s, respectively, where the shortest ST was also found (workstation 5). The sum of all STs is equal to 4.07 min for the original production lines. The NT and the ST were obtained using the Equations (1) and (2) [
37].
Table 4 summarizes the results of the motion analysis. In fact, 230 inefficient therbligs were identified and 33 were detected in the number 9 task (i.e., placing plastic tape), consequently, it is the task with the greatest number of inefficient motions. On the other hand,
Table 5 summarizes the results on the cost per unit, that is, a line balancing analysis of the original assembly line with five operators. As it can be observed, the total production time for a box of Model A is 4.12 min and the control cycle is 1.18 min. Hence, it corresponds to the highest time among the operation times. The time in line is 5.92 min, which represents the product of multiplying the control cycle by the number of operators (5 in this case). The assembly lines are balanced in 70%, and the cost per unit is of
$1.39 Mexican pesos (i.e.,
$0.072 USD). Equations (3)–(9) were applied to complete
Table 5 [
41].
On the other hand,
Table 5 summarizes the results on the cost per unit, that is, a line balancing analysis of the original assembly line with five operators. As it can be observed, the total production time for a box of Model A is 4.12 min and the control cycle is 1.18 min. It corresponds to the highest time among the operations times. The time in line is 5.92 min, which represents the product by multiplying the control cycle by the number of operators (5 in this case). The assembly lines are balanced in 70%, and the cost per unit is of
$1.39 Mexican pesos (i.e.,
$0.072 USD).
Following these results, this study determined that tasks 1, 7, 8, 9, 10, and 11 (see
Table 4) could be performed at the same time before the remaining tasks. Similarly, it was further concluded that before task 14 is performed, the first 13 tasks must be completed. These results were used along with the report of each positional weight of the tasks (obtained after estimating the cycle times of tasks) to make a new distribution of the box assembly process across only four workstations, as displayed in
Table 6. It means that the length of a production line can be reduced by rebalancing the assembly line, because of the new times in tasks [
42]. Moreover, with this new distribution, the greatest difference of time between the two tasks is eight seconds, consequently reducing the gap by 27 s if compared to the original distribution of the process.
Figure 3 displays the redesigned workstations, where (A) illustrates the overall proposal, whereas (B), (C), (D), and (E) represent the individual redesigns for workstations 1, 2, 3, and 4 with their respective locations of the parts and tools. The findings indicate that ST estimated in the production line was 3.32 min, that is, 45 s shorter than the original ST (i.e., a time reduction of 18%).
Table 7 lists the time estimations in each new workstation, and as it can be observed, the difference in time between two workstations is not over six seconds.
Regarding the time analysis in the redesigned process, only 78 inefficient therbligs are found, thus representing a reduction of 66.1% if compared to the original process.
Table 8 summarizes the obtained results, and as it can be observed, the highest rate of inefficient motions was found in task 1.
Table 9 summarizes the results of the cost per unit and the line balancing analysis performed to the redesigned process. It is essential to notice that line balancing increased from 70% to 97%, and as a result indicates that production can flow smoothly and without bottlenecks. Similarly, the cost per unit decreased by 58.27%, that is, from
$1.39 to
$0.58 Mexican pesos (i.e., from
$0.072 to
$0.030 USD).
3.4. Results at Stage 3. Apply Visual Standardization in Workstations
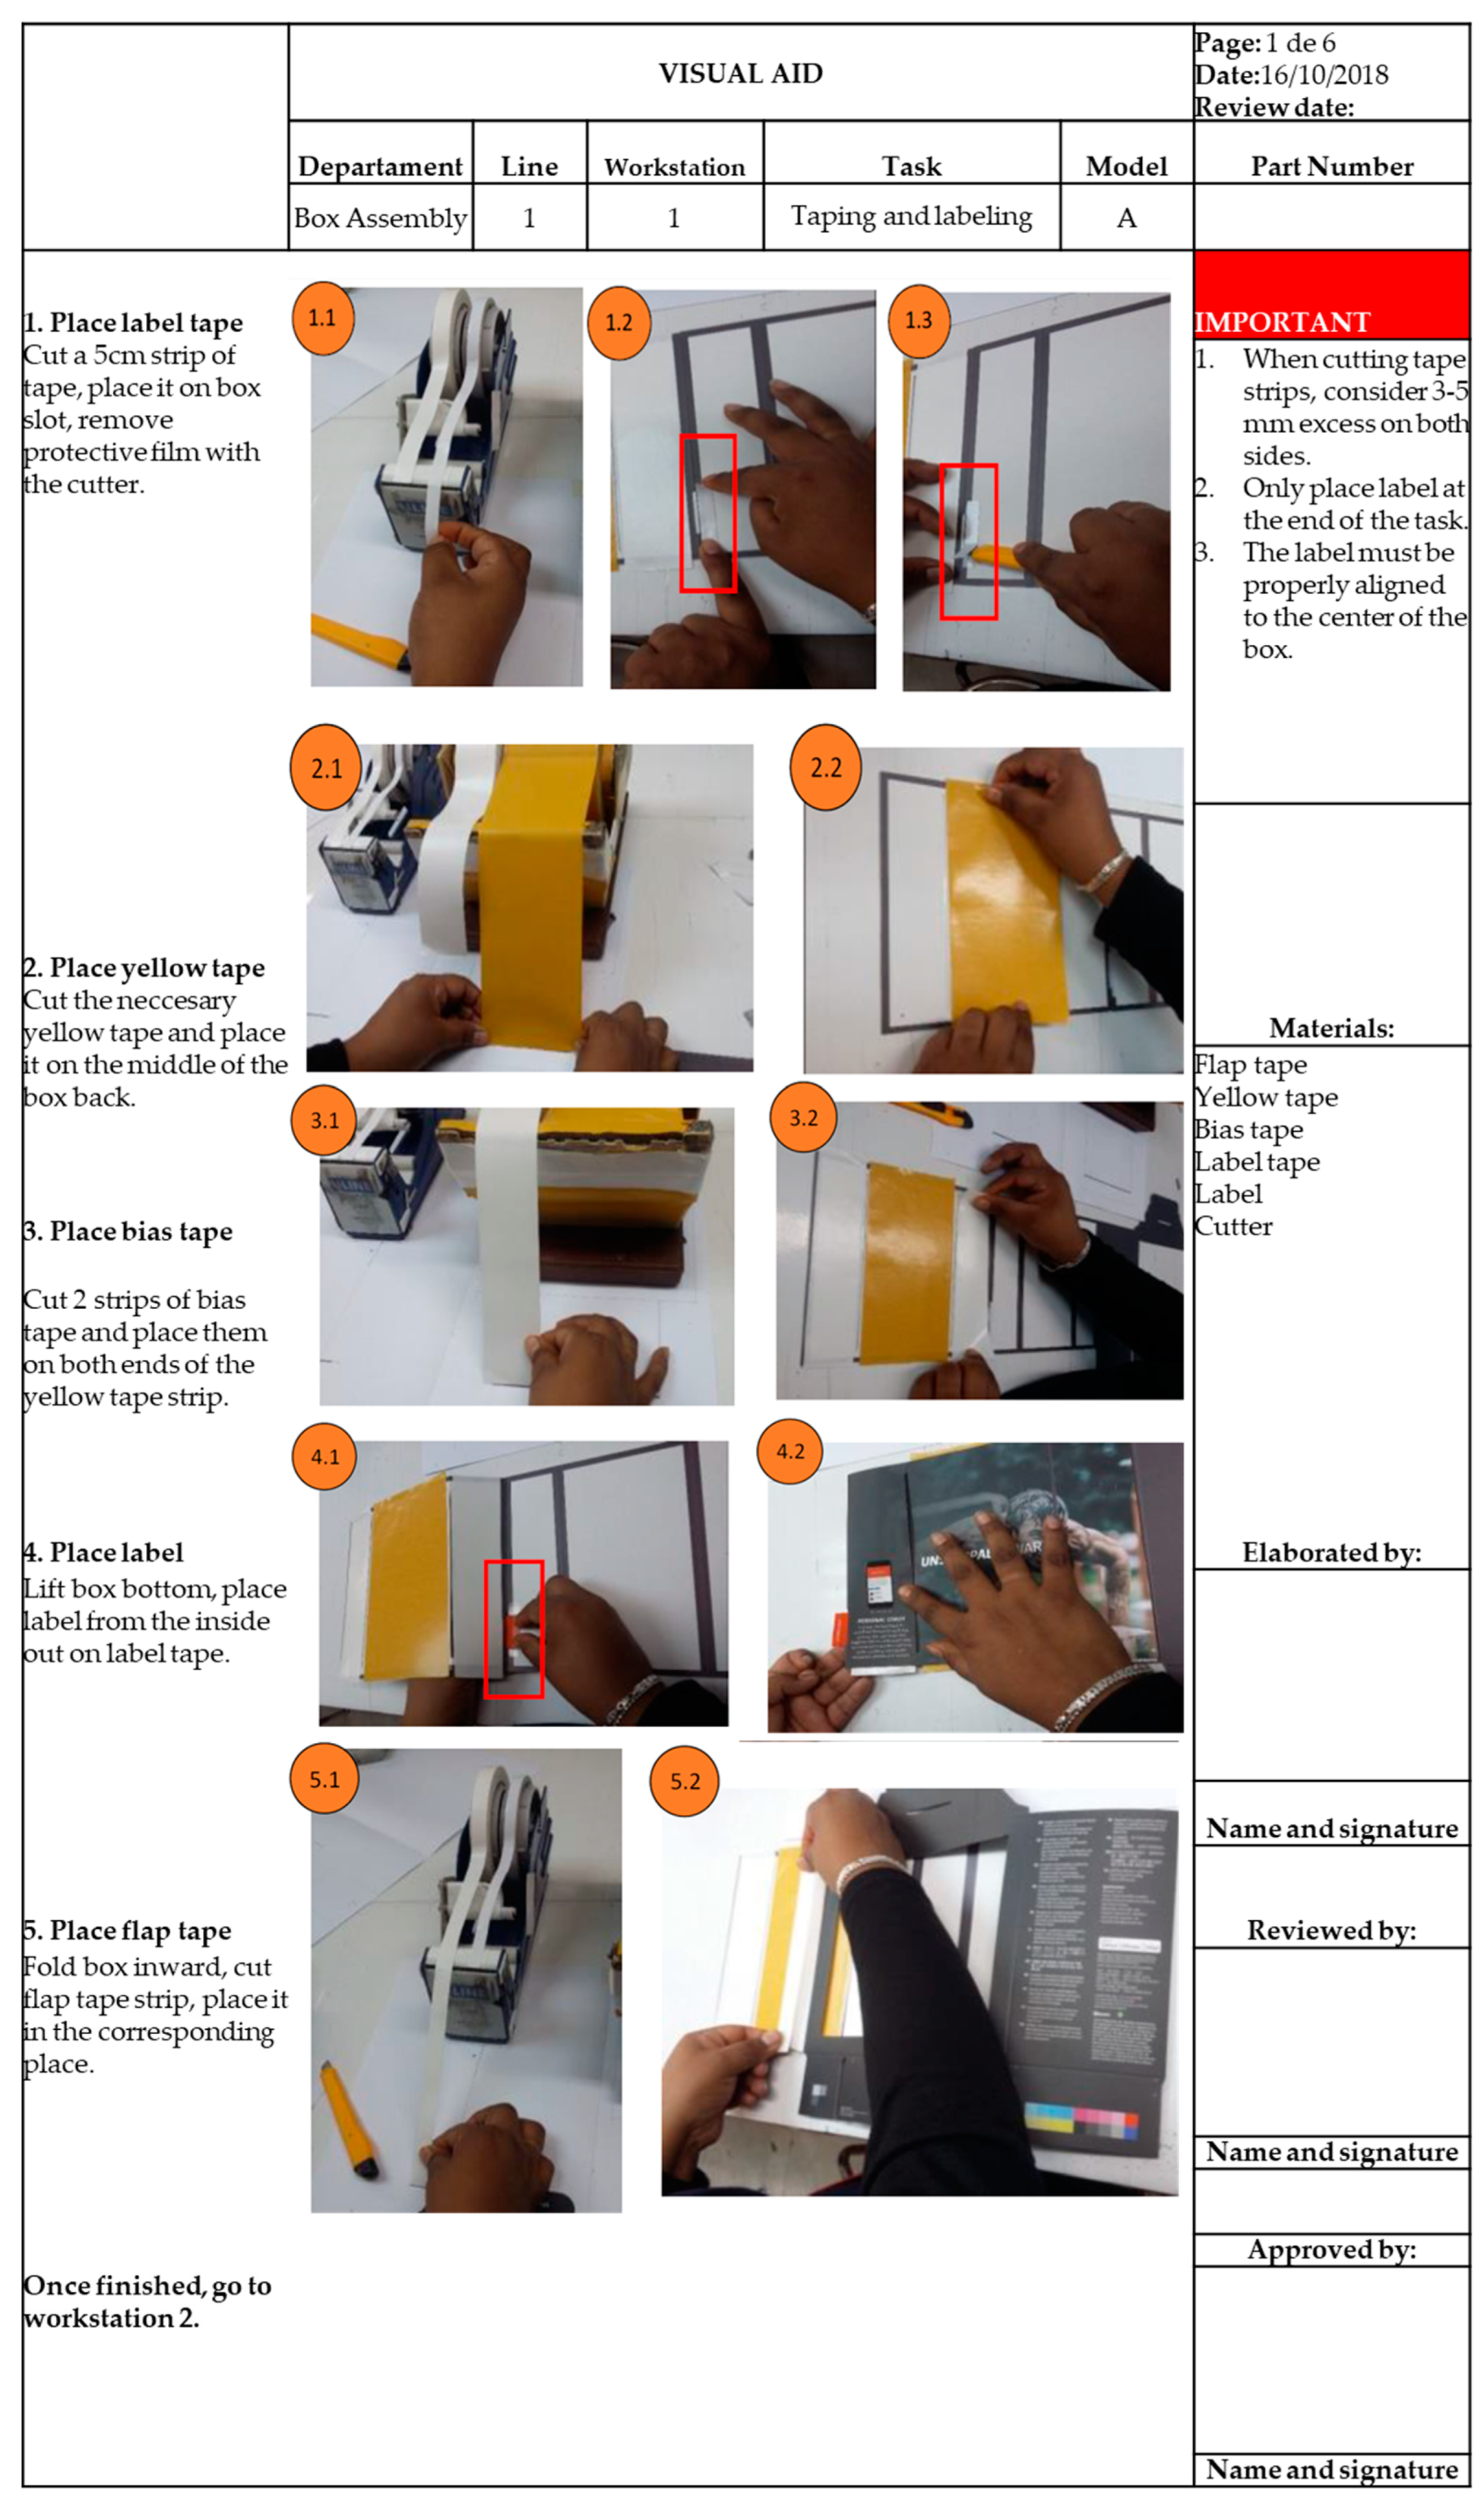
At this stage, visual aids and templates were generated for the redesigned workstations. The headings of the visual aid forms included the following information: department name, production line number, workstation number, task name, box model, sheet number, issue date, and last-reviewed date. Similarly, the right side of the form includes important information on the task to be performed. This information is not part of the directions, yet they remind operators about the importance of the details of each task. Below the details section, all visual aids must list the tools that are necessary in the task. In this sense, the operators must make sure that they have all the materials and tools in place before starting to perform a task. Below the material section, visual aids include information to be completed by those who develop the visual aids. The visual aids also contain a picture of each step for the tasks. Next, the operators are asked to perform the steps, one by one, while a picture is taken. In addition, the photographs must be as neat as possible and must clearly illustrate what the operator must do at a particular step. Further, close attention was paid to writing clear and concise descriptions on how each task step is to be performed. A description is related to each image in the aid, but it is not overloaded with information, since the pictures are the key for the aids. Finally, each step of a task was numbered to establish a precise and logic sequence of work events, and therefore, prevent errors and confusions. In total, six visual aids were developed: workstations 1 and 2 were installed with one visual aid each, whereas workstations 3 and 4 were installed with two aids each.
Figure 4 and
Figure 5 present two examples of the visual aids that were developed.
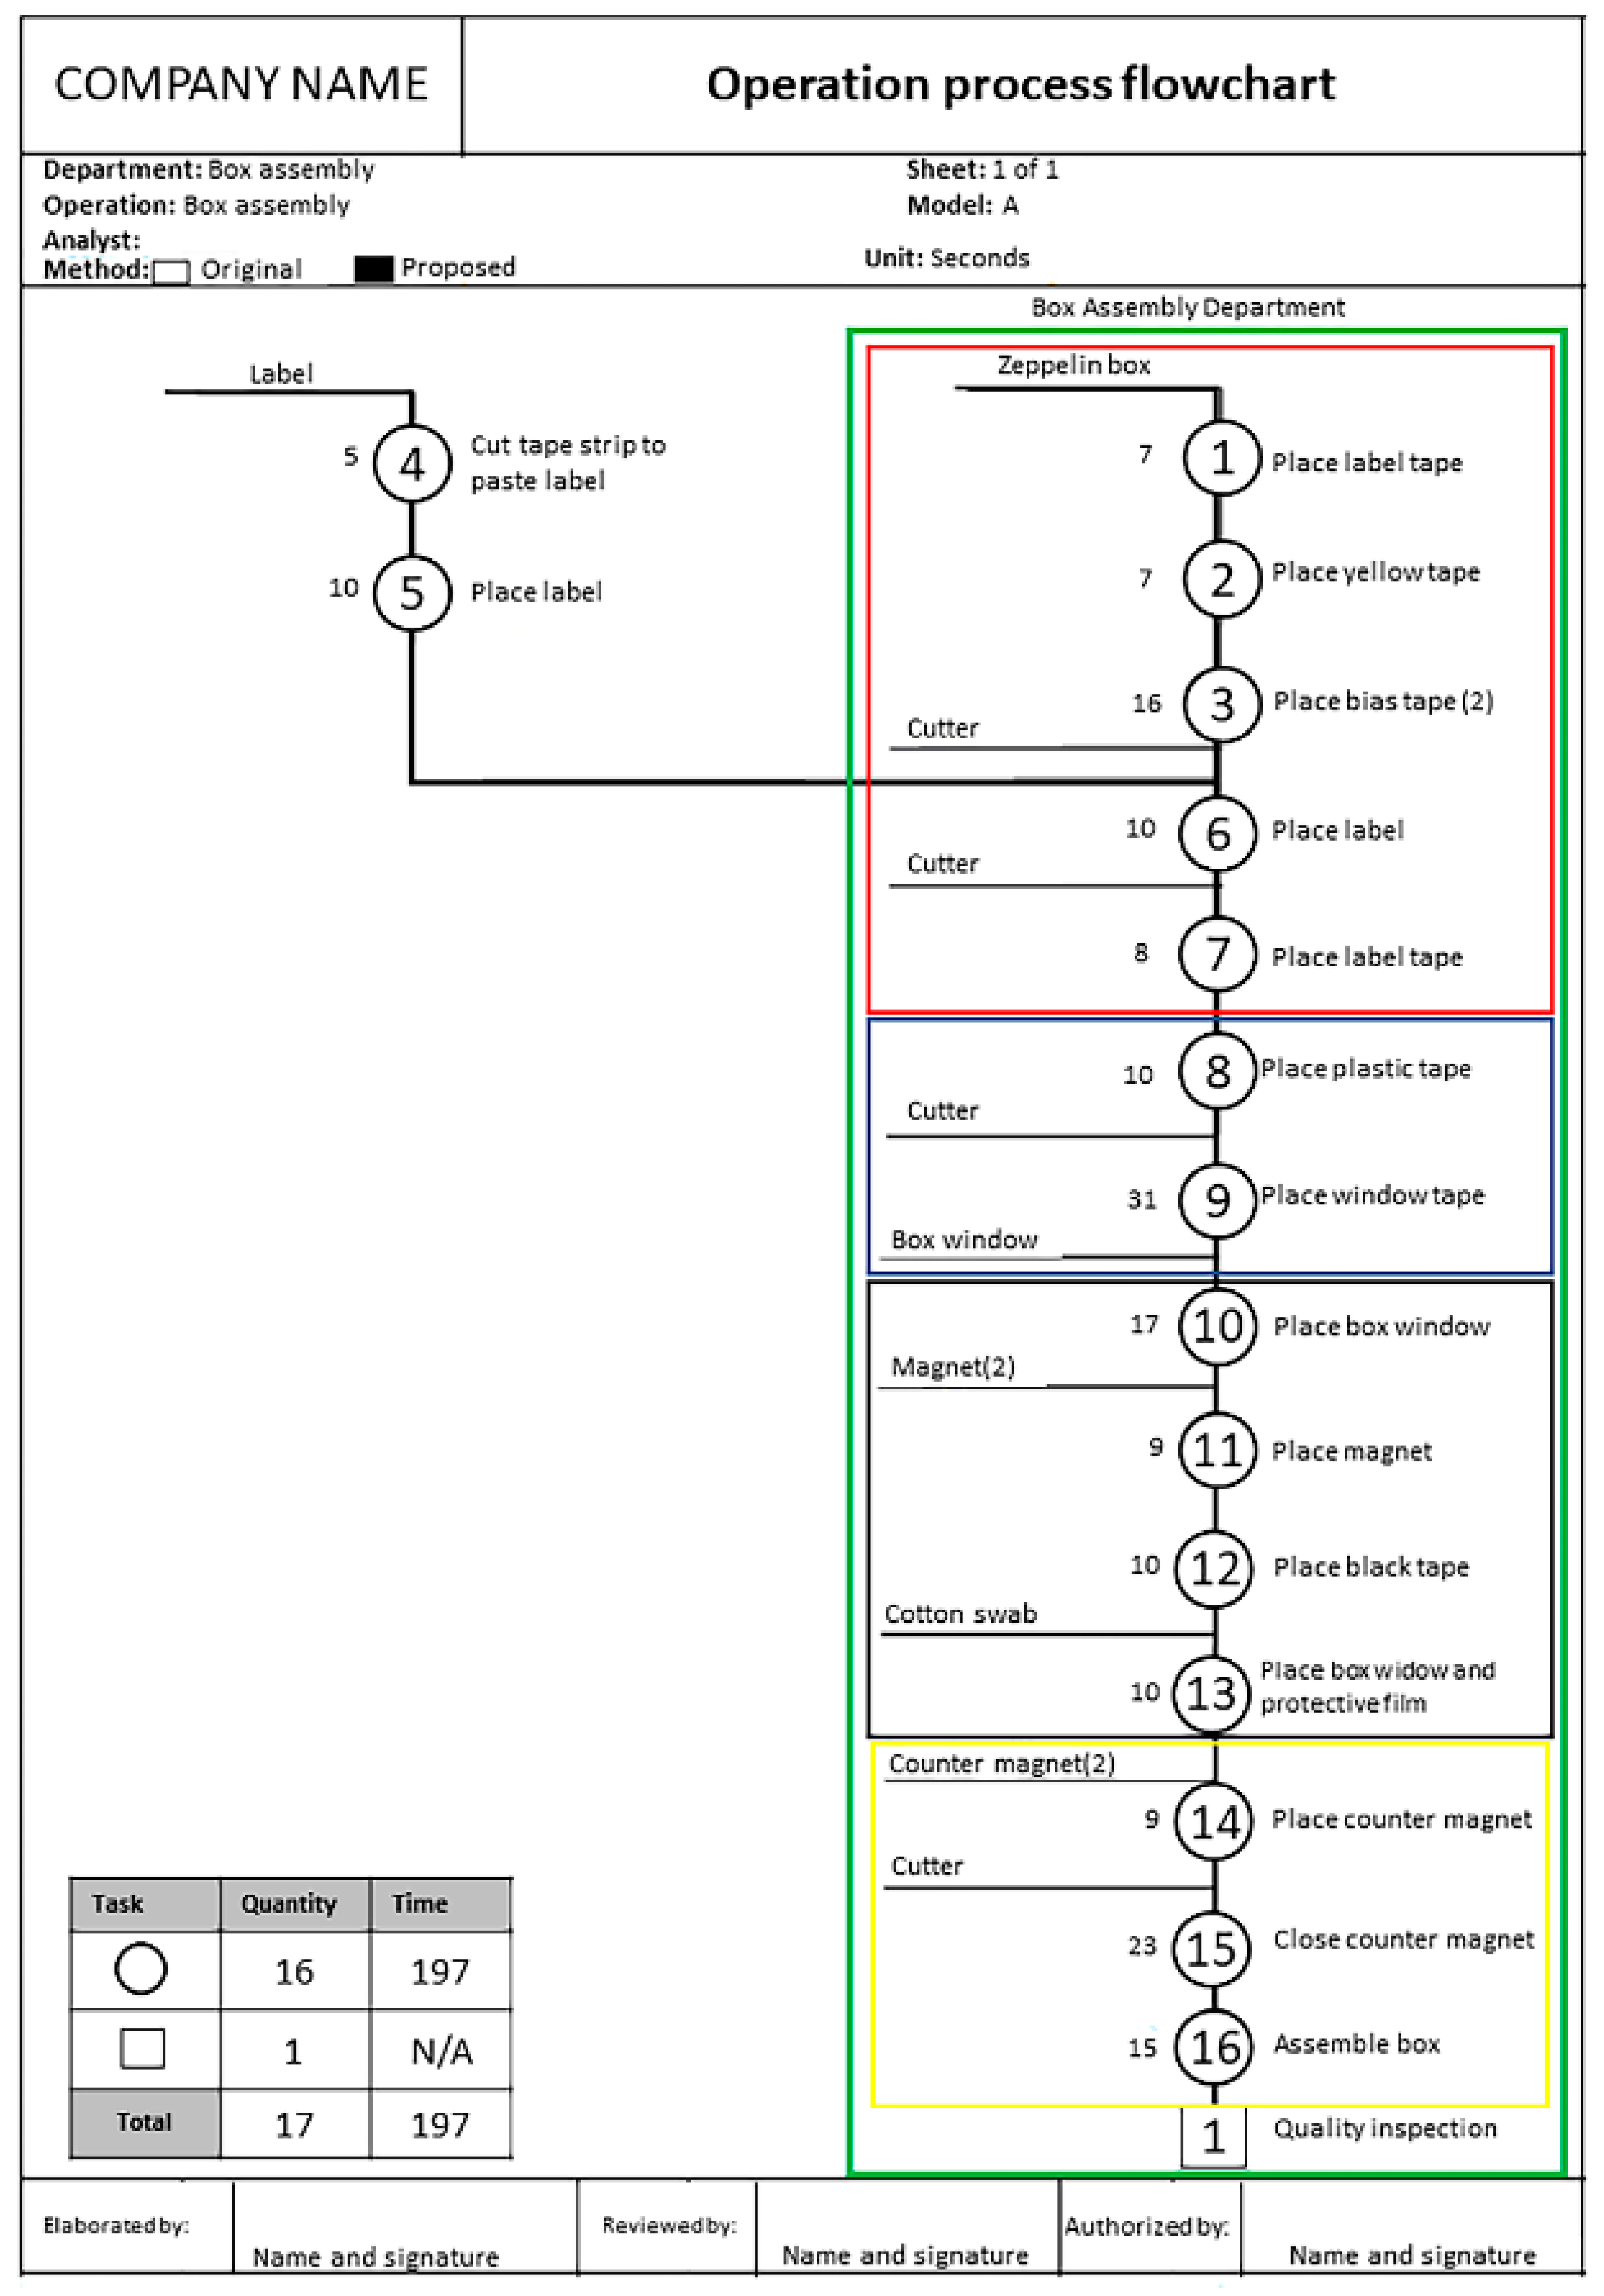
Figure 6 illustrates the flowchart process of the redesigned steps. As it can be observed, the methodology proposes a 16-task process with a total time of 144 s. Notice that tasks 4 and 5 are performed before the box assembly process or when there is no demand for box model A. This allows the operators to have several parts (e.g., labels and corresponding adhesive tape) ready before initiating the box assembly process. Further in
Figure 6, the green rectangle delineates the tasks of box assembly. The tasks from workstations 1, 2, 3, and 4 are marked in red, blue, black, and yellow rectangles, respectively. A processing time of 197 s was found, yet 15 min from tasks 4 and 5 were deduced, consequently, the estimated OT was 182 s. This is a value that is close enough to what is shown in
Table 7 (i.e., 186 s).
3.5. Overall Results
Once the production process was standardized, four assembly lines with four operators each were monitored for one week to assess the production increment. The first three assembly lines worked under the redesigned process, whereas the fourth line operated under the original methodology. As
Table 10 indicates, a significant increase of production in assembly line 3 was identified, where 2971 units were assembled, that is, 1158 units more than in production line 4 (i.e., the old methodology).
Figure 7 visually presents such results.
As a matter of fact, with the five assembly lines working fully under the redesigned process, the company reported a production increment of 42.62%. Further, by running five assembly lines instead of four, the company increased production by 45.9%. More specifically, the company increased on average their daily production from 1400 to 3050 units, which represents an increment of 1650 units.
Table 11 summarizes the results of this analysis.
Finally, it is crucial to mention that in the records of the company, there are no injuries and illnesses reported from the operators from the box assembling area, however, they did show pain in the arms, back and legs, in addition to physical fatigue. This is due to the positions they were forced to adopt with the original design of the workstations and the exposure time (working hours plus extra time). The anthropometric redesign of the workstations, as well as the work method, would positively affect the health and safety of the operators. In the specific case of the anthropometric design of workstations, this would prevent the operators from adopting uncomfortable body postures [
43]. On the other hand, the redesign of the working method eliminates repetitive movements and according to the literature review, uncomfortable body postures and repetitive movements are the cause of musculoskeletal disorders (MSDs) [
44]. Thus, with the new working method, the operators can be prevented from suffering from MSDs or from suffering physical fatigue by eliminating overtime.
4. Conclusions
The basic industrial engineering tools can have a significant impact on the performance of SMEs, since larger firms compete on international markets, which usually rely on expensive AMT. Moreover, basic industrial engineering tools help SMEs save costs, fulfill demand on time, and increase competitiveness. A proper analysis of the production process in aspects, such as timing, motions, workstation design, and task sequence can lead to changes that promote great results. The standardized work (SW) technique, combined with line balancing is an effective tool for minimizing waste, such as delays on deliveries and over-processing. In addition, an analysis of worker motions and anthropometric studies are effective techniques for redesigning workstations, and as a result, reduce the number of inefficient therbligs. In fact, in the present case study, inefficient motions were reduced by 66%, that is, from 230 to 78, while standard time decreased from 244 to 199 s, that is, by 18.44%.
The results also demonstrate that, when work is standardized, fewer operators are required per assembly line. This is an opportunity for companies to optimize human recourses by installing new assembly lines with the other operators, and consequently, increasing production at a much higher rate. In the present case study, the number of operators decreased by 20%, that is, from five to four operators. As a result, the company installed one more assembly line. Finally, the present findings allow the conclusion that both the implementation of SW and line balancing have a positive impact on the balancing percentage, which in turn helps minimize costs per unit and increase demand fulfillment rates. Notably in this case study, the balancing percentage rose from 70% to 97%, whereas production increased by 63.2%, that is, 229 units per assembly line per day. Therefore, the case study shows that SW and line balancing can have a positive impact for many SMEs in the manufacturing sector. Further, the present findings are consistent with those reported by Mor et al. [
19], Rahul and Kaler [
45], More et al. [
21], Bhardwaj et al. [
46], Mor et al. [
47], and Garg et al. [
48], where simple techniques have been implemented among SMEs to promote greater production and efficiency. As a practical value, these results, as well as the method and techniques applied, can be used as an improvement reference by SMEs in massive production processes with multiple operators. However, there is no practical value to those production processes where each produced unit is customized according to the requirements of a specific customer, since there is no specific production process for all units, and therefore, work standardization is not possible.
Finally, it is important to mention that this standardization process was applied to only one production line for assembling a specific box model. However, there are several processes in this company that can be standardized, hence, future research must be focused on other box models and other production areas, such as book production line or stamping lines. Moreover, in this case study, topics such as the production level, product demand, customers’ complaints, among others, can be explore further. Further, as mentioned before, this case study is part of a project of the manufacturing processes’ improvement. Therefore, more companies (most of them categorized as big) can participate, and more problems can be analyzed, more tools and techniques can be developed, applied and refined. Further, more results can be obtained that support the impact industrial engineering tools have in manufacturing processes.

 ,
, 


