Abstract
The literature has two different perspectives on which innovation types should be implemented to achieve innovation performance; some argue that they should pursue process-oriented innovation, while others maintain that both product- and process-oriented innovation should be performed. Though innovation efficiency should be measured, which takes both input and output variables into account, the research so far has been measured only with the performance of the innovation. Accordingly, this study identifies which innovation type is the most advantageous in terms of innovation efficiency for the chemical firms. We use data of 64 Korean chemical companies from a 2016 Korean innovation survey and perform data envelopment analysis to calculate innovation efficiency. Kruskal–Wallis one-way ANOVA and bootstrap DEA were also conducted to compare the difference of innovation efficiency among groups, depending on which innovation types are oriented. The result shows that focusing on process innovation rather than both product and process innovation is more appropriate to achieve higher innovation efficiency, and pursuing process innovation rather than product innovation tends to achieve a higher level of innovation efficiency in the Korean chemical industry.
1. Introduction
Abernathy and Utterback [1] suggested a three-stage model, which compares the rate of product innovation and process innovation in terms of the industry’s maturity. According to the model, product innovation is pursued more frequently compared to process innovation in the early stage (fluid phase), while process innovation is more commonly adopted when the industry becomes mature (after the transitional phase) [1]. Firms in a mature industry usually pursue cost reduction and/or increase in productivity as competition among them is based on price, and thereby process innovation is dominant [1,2,3]. Accordingly, firms in the chemical industry, which is a representative mature industry, could achieve higher performance by investing in process innovation [4,5].
On the other hand, diverse studies are arguing that both product innovation and process innovation are important in mature industries. They maintain that performance could become greater when firms pursue both types of innovation, as they are in complementary relations [5,6,7,8,9]. Moreover, Gilbert and Strebel [10] stated that companies with standard product values should chase lower cost, whereas others that already achieved low cost should increase product value to gain the upper hand. In the chemical industry, therefore, balancing between product and process innovation is an important issue [3]. For these reasons, the right innovation type of firms in the chemical industry is yet to make a consensus.
Furthermore, studies on the effect of two innovation strategies on firm performance until now have only measured the outcome itself. The performance of innovation should be measured as innovation efficiency, which considers the inputs required for the output as well. Studies maintain that innovation is not a linear process, and efficiency should be measured instead of the performance itself [11,12]. Eventually, studies on the effect of innovation strategy have been investigated in terms of innovation performance, but the effect of such types on innovation efficiency is still unanswered.
In this paper, we examine the effect of adopting each of the innovation types on innovation efficiency. To do so, we limit our scope to the chemical industry only, which is a representative mature industry. The result of the study is expected to determine the effect of each innovation types on innovation efficiency, and it could be compared with the result suggested by previous literature on the effect of them on innovation performance. This study is expected not only to broaden the understandings of the effect of innovation types but also to suggest appropriate innovation strategy to achieve a high level of innovation efficiency. We use 64 Korean chemical firm data from the 2016 Korean Innovation Survey (KIS) and perform data envelopment analysis (DEA) to measure the innovation efficiency of the firms. Moreover, we carried out Kruskal–Wallis one-way ANOVA and bootstrap DEA to verify the differences in innovation efficiency depending on firms’ innovation orientation. This study is expected to suggest the following implications;
- (1)
- First, while different arguments exist on the appropriate innovation strategy in mature industries, this study is expected to identify which innovation type is more appropriate for chemical firms.
- (2)
- On top of that, we verify the most appropriate innovation strategy in terms of innovation efficiency, with considering the inputs required to achieve innovation as well.
2. Theoretical Background
2.1. Innovation Types and the Industry’s Maturity
According to OECD’s Oslo Manual [13], product innovation is defined as “a new or improved good or service that differs significantly from the firm’s previous goods or services and that has been introduced on the market”, and process innovation is defined as “a new or improved business process for one or more business functions that differ significantly from the firm’s previous business processes and that has been brought into use by the firm”. Product innovation could improve the properties and performance of the finished product, whereas process innovation aims to reduce cost and increase productivity [13,14].
Figure 1 illustrates the relationship between product innovation and process innovation depending on industry maturity [1]. Utterback and Abernathy [15] categorized the main strategies of firms contingent upon three stages of industry’s maturity; “product performance-maximizing strategy” in the first, “sales-maximizing strategy” in the second, and “cost-minimizing strategy” in the last stage. Klepper [16] suggested another perspective that product innovation tends to be high in the early stage of the industry, since many new entrants offer diverse versions of products. When the industry becomes mature, however, firms exit from the market outnumber the entrants, which leads firms to endeavor to achieve process innovation, and the product’s diversity decreases [16,17]. This could also be supported by studies on the purpose of each innovation types, as product innovation is adopted to develop new products and to penetrate new markets, while process innovation is implemented to reduce cost and time and to increase flexibility [18]. In a similar vein, the more mature the industry, the better to adopt process innovation rather than product innovation [5]. Additionally, Brem et al. [19] argued that the existence of dominant design negatively affects innovative performance and radical innovation while having a positive impact on process innovation, which is consistent with earlier studies’ argument that process innovation occurs more actively over time than product innovation.
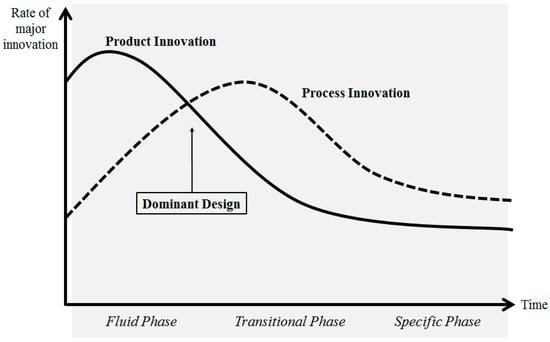
Figure 1.
The rate of product and process innovation depending on industry maturity (Source: Abernathy and Utterback, [1]).
2.2. Innovation in the Chemical Industry
Innovation in the chemical industry can be seen in Pavitt [20]’s study, which looked at the characteristics of innovation divided by industry. In chemical industries, the innovation developed by them is often used on their own, but the innovation developed by them is much more prevalent in other industries. Additionally, the characteristics of the chemical industry are revealed; the chemicals belong to the science-based industry, large enterprises tend to be more innovative, and most of the technological diversification is concentric and/or conglomerate rather than vertical [20]. A subsequent study by Robson et al. [21] classified the chemicals as one of the core sectors that account for the majority of innovation performed, along with mechanical, mechanical engineering, instruments, and electronics. Similar to the study of Pavitt [20], the innovation carried out in the chemical industry was found to be mainly used in other industries, such as rubber and plastic, textile, and vehicle industries [21].
In the chemical industry, product and process innovations are two important categories of innovation [3]. Linn [22] also stated that firms in a mature industry such as chemicals should be careful when adopting product innovation, as new product development is very risky. This statement is in line with the literature which elucidates the relationship between innovation types and industry maturity, as the chemical industry is a maturing science and innovative products are difficult to be found [22].
Though sufficient resources are required to achieve innovation [23], lack of resources exists as one of the major innovation constraints for many firms [24,25,26]. It points out the possibility that any chemical firm with insufficient resources has to allocate their limited resources to invest either on product or process innovation. It could also be supported by the fact that product and process innovation share R and D resources, and thus balancing between product and process innovation in the process industry is an important issue [3]. Accordingly, chemical firms with insufficient resources could not afford to pursue both product and process innovation but rather concentrate on a single type of innovation, and it is believed to be better to invest in process innovation considering the maturity of the chemical industry.
On the other hand, other studies pointed out that a firm in a mature industry should not disregard product innovation, and should perform both product and process innovation to achieve high innovation performance. They argued that product and process innovation are complementary, and thereby performing both types of innovation pays off the most [5,6,7,8,9]. Even dominant design exists in the chemical industry, therefore, product innovation is still important. In the chemical industry, as new product development heavily relies on process innovation, both product and process innovations are critical in determining successful innovation [27].
Given that the chemical industry is a mature industry, it can be summarized that two arguments exist that have not yet been agreed on the effect of types of innovations on innovation performance in the chemical industry; one argues that carrying out process innovation can have better results than carrying out product innovation, while the other says that performing both product innovation and process innovation is the most desirable strategy. Both arguments, however, agree that process innovation is important in the chemical industry.
2.3. Innovation Efficiency
Innovation is not a linear process in which innovation outputs are not always proportional to the amount of innovation inputs [11,12]. Innovation efficiency, which is a capability to convert innovation inputs into outputs, should be measured as innovation performance rather than the outcome of innovation itself [11,28]. In other words, the performance of innovation should be measured as innovation efficiency by the ratio of innovation outputs to inputs [11,28]. Table 1 summarizes input and output factors considered from recent studies on innovation efficiency.

Table 1.
Studies on innovation efficiency (adopted from Shin et al. [29]).
Successful innovation outcome is one of the top priorities that firms are eager to achieve. However, the management of resources for innovation is also an important issue for top managers at firms, as both product and process innovation share resources [3]. The significance of resource management could become even greater when firms do not have sufficient resources. However, no studies answer to firms in the mature industry what the best strategy is in terms of innovation efficiency.
In this paper, we limit our scope to the chemical industry only and set our goal to find out the answer to the following research question. To achieve successful innovation efficiency, should firms implement process innovation only? Or, should they implement both product and process innovation?
3. Research Method
3.1. Efficiency Measurement
Generally, data envelopment analysis (DEA) and stochastic frontier analysis (SFA) are two typical methodologies adopted to measure efficiency. SFA measures efficiency by assuming a particular function and distribution form [44]. On the other hand, DEA is an efficiency analysis technique based on linear programming, which measures the efficiency of the decision-making units (DMUs) under evaluation of the relative distance from the efficient frontier derived from input and output factors.
DEA has advantages over SFA under the relative distance concept, and various input and output factors can be used because any functional form is not assumed [45]. DEA also has an advantage in a small sample size compared to SFA, which requires many samples to ensure a sufficient degree of freedom [46]. In this regard, we use DEA to measure the innovation efficiency of chemical firms.
The efficiency distributions by innovation types are compared in this study by using Kruskal–Wallis one-way ANOVA; a nonparametric technique to compare distribution among groups by testing the difference in medians [47]. This is because the efficiency scores derived from DEA do not follow the assumption of normality [48], and it analyzes one or more independent group [49].
3.2. Research Model
As innovation types could be divided into product innovation and process innovation [13], innovation efficiency is also classified into two: process innovation efficiency and product innovation efficiency. Each firm could be categorized into four based on the innovation types they performed, as illustrated in Figure 2. In Figure 2, the x-coordinate value represents the degree of product innovation orientation for each DMU, and the y-coordinate value indicates the degree of process innovation orientation. The median of the x- and y-axes are used as the criteria for dividing each quadrant to determine the relative innovation orientation of the DMUs.
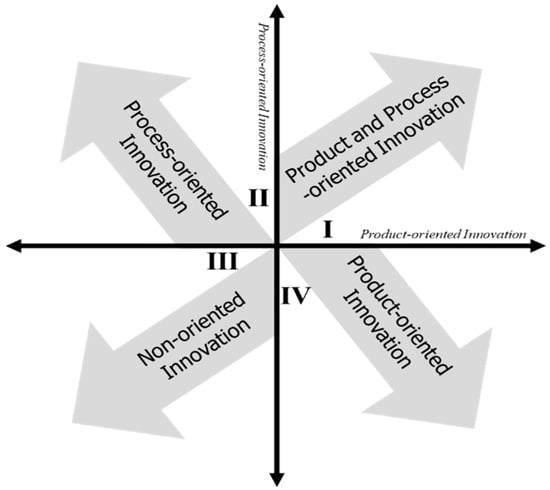
Figure 2.
Four innovation types derived from Abernathy and Utterback [1].
Companies that focus relatively more on both product and process innovation than others would be located in the first quadrant. Firms that focus primarily on process innovation but not on product innovation would be located on the second quadrant, while those who focus mostly on product innovation but not process innovation would be categorized into the fourth quadrant. Quadrant 3 refers to the firms that are non-innovation oriented, in terms of both product and process innovation.
In addition, based on the Aberanthy–Utterback model presented in Figure 1, the research questions in this study can be represented as in Figure 3 below. Performing product innovation will be more efficient for companies in the early stage of the industry. As the industry matures to the transitional phase in which dominant design is formed, on the contrary, it is expected that the more the companies aim for both product and process innovation, the more efficient they will be. However, as the industry matures further and enters into the specific phase, two different hypotheses could be established. The first hypothesis is as follows: companies performing process-oriented innovation will achieve the highest innovation efficiency, those performing both product- and process-oriented innovation will achieve a lower level of innovation efficiency and, finally, those performing product innovation will achieve the lowest level of innovation efficiency. The second hypothesis, on the other hand, is that innovation efficiency would be highest for the firms engaging in both product- and process-oriented innovation, followed by those pursuing process-oriented innovation, and companies with product-oriented innovation will achieve the lowest innovation efficiency.
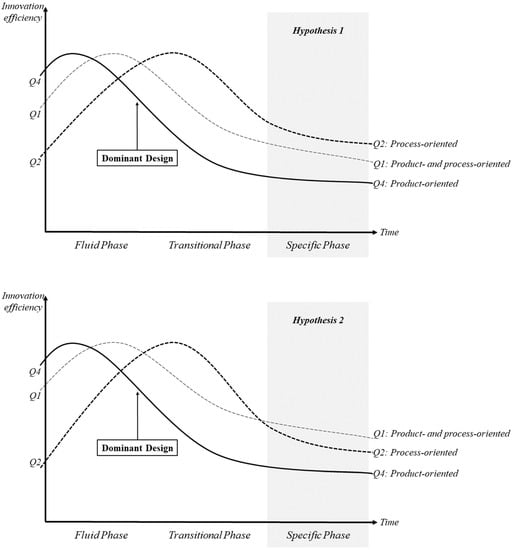
Figure 3.
Graphical representation of two hypotheses.
Since this study limits its scope to the chemical industry, which is already mature, an answer from the research question could be appropriate for the specific phase only. Two different hypotheses were established as follows:
Hypothesis 1 (H1).
Quadrant 2 shows the highest innovation efficiency, followed by quadrant 1, and finally quadrant 4 has the lowest efficiency.
Hypothesis 2 (H2).
Quadrant 1 shows the highest innovation efficiency, followed by quadrant 2, and finally quadrant 4 has the lowest efficiency.
3.3. Data
The purpose of this study is to find out which type of innovation is the most appropriate in terms of innovation efficiency in the chemical industry. To this end, data on the manufacturing sector of the 2016 Korean Innovation Survey (KIS) conducted by the Science and Technology Policy Institute (STEPI) was used. The data is appropriate because it encompasses overall innovation data including resources used for innovation, innovation performance, and the types of innovation performed. We extracted 164 samples of the specific industry type, which is ‘Manufacturing chemicals and chemicals; excluding medicines’. Finally, after excluding data with missing responses and unrealistic data, 64 out of 164 samples were used in the actual analysis.
The input and output variables are selected following Shin et al. [35]. The number of R and D employees and the total innovation cost are used as two input variables; the number of R and D employees is measured as the number of regular employees multiplied by the ratio of R and D employees, and total innovation cost is adopted from the actual response value. Though Shin et al. [35] measured product innovation performance as total sales multiplied by the ratio of innovation product sales, we used total sales itself as the output variable since we measure process innovation efficiency as well as product innovation efficiency. Total sales, which is the output variable, is adopted from the actual response value. The selection of variables is tabulated in Table 2 and descriptive statistics of input and output variables are shown in Table 3.
Table 2.
Variables selection.
Table 3.
Descriptive statistics.
4. Results
4.1. Kruskal–Wallis One-Way ANOVA
First, we carried out DEA to measure the efficiency scores of each firm. The result of the DEA is summarized in Appendix A. With the efficiency score, we performed Kruskal–Wallis one-way ANOVA, and the results of a pairwise comparison of the efficiency distribution of the four quadrants are as shown in Table 4.
Table 4.
Pairwise comparison test results.
As shown from Table 4, firms in the second quadrant show significant difference with those in quadrant 1 and quadrant 4. The result proves that firms pursuing process-oriented innovation tend to achieve a higher level of total sales compared to others performing both product- and process-oriented innovation and product-oriented innovation only.
The efficiency distribution by types of innovation is as shown in Figure 4. It shows that the median value of firms that focus solely on process innovation (0.702) is far higher than those of other types of innovation (median of Q1 = 0.094, Q3 = 0.228, and Q4 = 0.205). Thus, in achieving the efficiency of innovation for chemical companies, adopting process innovation only may be more advantageous than any other innovation strategies including product-oriented innovation only and both product- and process-oriented innovation.
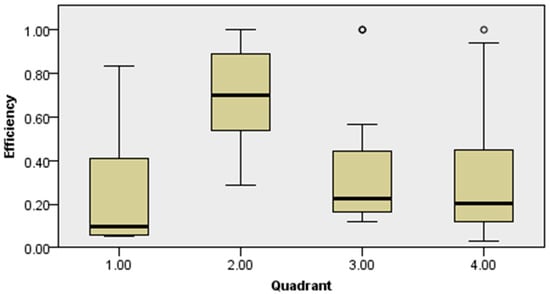
Figure 4.
Box and whisker plot of innovation efficiency by quadrants.
4.2. Asymptotics and Consistent Bootstraps for the Non-Parametric Model
Kruskal–Wallis one-way ANOVA was conducted for relative comparisons between innovation types since DEA is a non-parametric frontier model. To achieve more accurate efficiency scores, bootstrap DEA was performed in this study, following Simar and Wilson [57]. Furthermore, based on the suggestion of Kneip et al. [58], bootstrap efficiency mean value was calculated by performing 2000 times. The details of bootstrap DEA results are shown in Table 5.
Table 5.
Bootstrap DEA results.
The results of bootstrap DEA support the first hypothesis, as is the case with the Kruskal–Wallis one-way ANOVA, which proves that concentration on process-oriented innovation is the most beneficial among different types of innovation orientation. Since product and process innovation share R and D resources [3], firms pursuing both product- and process-oriented innovation are expected to have lower returns on process innovation compared to those with focusing only on process-oriented innovation. Since engaging in product innovation is risky in the chemical industry [22] and returns on process innovation are higher compared to product innovation in a mature industry [5], process-oriented innovation turns out to be the most desirable strategy for chemical firms, compared to product-oriented and both product- and process-oriented innovation. Moreover, the efficiency score of both product- and process-oriented innovation is lower than the efficiency of product-oriented and non-oriented.
Based on the results, the answers to the research question in this study can be obtained: focusing on process innovation rather than both product and process innovation is more appropriate to achieve higher innovation efficiency, and pursuing process innovation rather than product innovation tends to achieve a higher level of innovation efficiency.
5. Conclusions
5.1. Discussion
In light of Figure 3, the difference in innovation efficiency of quadrant 2 compared to quadrant 1 and quadrant 4, as predicted in Section 3, were statistically validated (See Figure 5 below). Thus, introducing process innovation could be an appropriate way to achieve higher innovation efficiency in the chemical industry, which belongs to the specific phase.
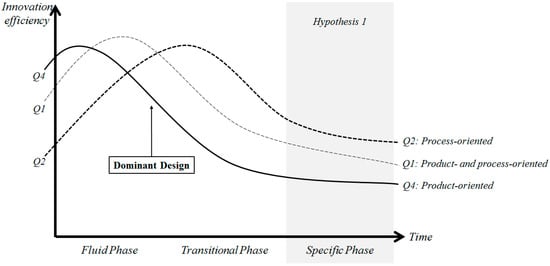
Figure 5.
Hypothesis supported by the result.
However, companies that perform process innovation do not show statistical differences against those that do not perform either product or process innovation. One possible explanation for the result is as follows: the chemical industry is already mature enough, and the value of performance achieved by process innovation is not significantly greater than inputs required for such innovation. Another possible explanation could be attributed to the characteristics of the chemical industry; innovations in the chemical industry do not only occur within the industry, but also leverage innovations in other industries, or transfer innovation to other industries [20,21]. Thus, measurements of innovation efficiency in the chemical industry may not have been captured well and, thus, the differences in innovation efficiency between process-oriented and non-oriented firms may not have been verified. However, why the exact reasons why the difference between quadrant 2 and 3 are could not be answered within the boundary of this study.
The literature on the innovation characteristics in the chemical industry is analyzed in the form of closed innovation [20,21]. However, according to a recent study, the chemical industry is also changing from closed innovation to open innovation, and thereby a chemical firm is changing in four processes: networks, organizational structures, evaluation processes, and knowledge management systems [59]. As the previous study analyzed several cases including a chemical firm changing from closed innovation to open innovation, future studies that qualitatively investigate the processes of firms are expected to validate the reason behind differences of innovation efficiency between process-oriented and non-oriented firms.
The present study categorized innovation into two, product and process innovation, and thereby strategies of innovation are divided into four: product and process-oriented, product-oriented, process-oriented, and non-oriented innovation. Unlike the classification of innovation strategies in this study, however, recent studies have determined that various factors may affect innovation performance, which could also be categorized as different innovation strategies depending on how innovation supportive factors are exploited, such as collaboration, trust, commitment, conscientiousness, agreeableness, and innovation investment [60,61,62,63,64,65,66].
On top of this, studies on such innovation-supportive factors have been proved in terms of innovation performance, but not on innovation efficiency. Given that the outcome of innovation should be measured as innovation efficiency [11,12,28], the study on the effect of such factors on innovation efficiency is expected to provide understandings of desirable ways to perform innovation and formulate correct strategies. Moreover, the combination of such factors with product and/or process innovation could also be subdivided into different innovation strategies, and studies on such strategies on innovation efficiency are expected to suggest more precise results to figure out the appropriate innovation strategy to achieve successful innovation efficiency.
This study presented the degree of innovation efficiency by innovation strategy based on the industry’s maturity. However, only the chemical industry which belongs to the specific phase was verified in this study. Based on the model presented in this study, it is expected that future research on the innovation efficiency by innovation types in fluid phase and transition phase could offer precious implications. Additionally, studies that encompass multiple time-periods may provide a more sophisticated standard, and in turn, could modify the model presented in this study more accurately.
5.2. Implications
This study determines which innovation orientation is the most appropriate strategy to achieve higher innovation efficiency in the chemical industry. The study figured out that performing process-oriented innovation tends to be a better way to achieve greater innovation efficiency than pursuing product-oriented innovation and/or both product- and process-oriented innovation. The possible implications of the study are shown below.
Academically, this study complements the studies on innovation strategies of the chemical industry that have been analyzed in terms of innovation performance. Focusing on the performance itself, the literature has two different perspectives on the effect of innovation types; some argue that process-oriented innovation is the best, while others maintain that both product- and process-oriented innovation is the most beneficial [3,4,5,6,7,8,9,22]. However, the present study measures innovation efficiency, which takes into account the cost and employees involved in the innovation as well, and proves that process-oriented innovation is appropriate for chemical companies to achieve successful innovation efficiency. The study does not support one argument is valid nor the other is inappropriate, but rather it enriches the studies on innovation in the chemical industry, as the previous studies focused on the innovation performance while this study considers both input and output factors of innovation.
Moreover, the study also suggested the possibility of various interpretations through discussion with considering the linkage among previous literature. First, according to the research that the innovation in the chemical industry is greatly related to the innovation of other industries, it was suggested that the innovation of the chemical industry should look at not only the analysis of the industry itself but also its relationship with other industries [20,21]. Second, the possibility that innovation in the chemical industry could be shifted from closed to open innovation was also presented [59]. Finally, the introduction of the factors that positively affect innovation could not only expand the discussion on sophisticated innovation strategy but also broaden its discussion in terms of innovation efficiency [60,61,62,63,64,65,66].
This study can also suggest practical implications for managers at chemical firms. Before this study, companies may have undertaken both types of innovation by the studies which pointed out the complementarities between product and process innovations. In contrast, firms might not engage in innovation sufficiently, because innovation performance may have failed to meet their expectations comparing to the inputs required to achieve innovation. In terms of the efficiency of innovation that takes into account both the input and output of innovation, however, this study may suggest that companies in the chemical industry pursue process innovation.
Moreover, for chemicals firms with resource constraints, the purpose of innovation is not simply improving performance itself, but rather increasing its efficiency with considering input required. Given that diverse firms actually experiencing resource constraints, it is expected that many chemical companies will be able to refer to this study as the basis for establishing an appropriate innovation strategy.
5.3. Limitations and Future Research
Several limitations of this study may be pointed out. First of all, the number of data utilized in the research is only 64, making it difficult to represent the entire chemical industry. This is due to the limitations of the data, as 100 samples out of total 164 do not contain overall variables required in this study. Though variables such as the number of patents and utility models are included as outputs in several studies, moreover, it was excluded in this study to avoid potential bias since most of the chemical firms utilized in this study answered the number of patents is 0. Future research is expected to provide a more accurate basis for innovation strategy in the chemical industry if more samples are exploited and sufficient variables capturing innovation efficiency are included.
Furthermore, we used the dataset from Korean chemical firms because of data accessibility. However, the comparison of the efficiency of chemical firms among diverse nations is believed to suggest important implications, and we leave it to future research. In addition, since this study limits its scope to the chemical industry only, it was difficult to compare how innovation efficiency could be different depending on industry maturity. It is expected that future research will be able to suggest an appropriate innovation strategy depending on industry maturity if various industries which belong to fluid and transitional phases are covered. While this study is limited to the domestic chemical industry, moreover, using data from various countries in the analysis may provide a more accurate standard for innovation strategy.
Author Contributions
J.S. and C.K. designed the model of this paper. And Y.K. revised important intellectual contents of the paper. H.Y. supervised whole project. All authors participated to submit and revise the paper.
Funding
This work was supported by Incheon National University Research Grant in 2019.
Conflicts of Interest
The authors declare no conflict of interest.
Appendix A. Data Envelopment Analysis Results
Table A1.
Efficiency Score.
Table A1.
Efficiency Score.
| DMU | Efficiency | RTS | DMU | Efficiency | RTS | ||
|---|---|---|---|---|---|---|---|
| CRS | VRS | CRS | VRS | ||||
| 1 | 0.0765 | 0.4545 | IRS | 33 | 0.1535 | 0.2045 | IRS |
| 2 | 0.0508 | 0.0587 | IRS | 34 | 0.2764 | 0.3846 | IRS |
| 3 | 0.0979 | 0.1556 | IRS | 35 | 0.1333 | 0.1500 | IRS |
| 4 | 0.1947 | 0.4488 | IRS | 36 | 0.0559 | 0.1181 | IRS |
| 5 | 0.6719 | 1.0000 | IRS | 37 | 0.0948 | 0.2021 | IRS |
| 6 | 0.0557 | 0.0582 | IRS | 38 | 0.1939 | 0.3792 | DRS |
| 7 | 0.3935 | 0.4247 | IRS | 39 | 0.4212 | 1.0000 | DRS |
| 8 | 0.0528 | 0.4412 | IRS | 40 | 0.1551 | 0.1623 | IRS |
| 9 | 0.0595 | 0.1282 | IRS | 41 | 0.0947 | 0.1379 | IRS |
| 10 | 0.0264 | 0.2381 | IRS | 42 | 0.1164 | 0.2632 | IRS |
| 11 | 0.1947 | 1.0000 | IRS | 43 | 0.445 | 0.4830 | IRS |
| 12 | 0.0065 | 0.0292 | IRS | 44 | 0.0573 | 0.1193 | IRS |
| 13 | 0.9268 | 0.9390 | IRS | 45 | 0.0356 | 0.1027 | IRS |
| 14 | 0.1377 | 0.1830 | IRS | 46 | 0.2225 | 0.2415 | IRS |
| 15 | 0.0786 | 0.4545 | IRS | 47 | 0.3894 | 0.6581 | IRS |
| 16 | 0.0668 | 0.1312 | IRS | 48 | 0.0311 | 0.0509 | IRS |
| 17 | 0.1549 | 0.364 | DRS | 49 | 0.0441 | 0.0744 | IRS |
| 18 | 0.0195 | 0.0564 | IRS | 50 | 0.0587 | 0.0702 | IRS |
| 19 | 0.0855 | 0.1431 | DRS | 51 | 0.4988 | 1.0000 | DRS |
| 20 | 0.0822 | 0.1353 | IRS | 52 | 0.1331 | 0.1366 | IRS |
| 21 | 0.3171 | 0.5629 | IRS | 53 | 0.0388 | 0.0541 | IRS |
| 22 | 0.0834 | 0.3272 | IRS | 54 | 1.0000 | 1.0000 | CRS |
| 23 | 0.0834 | 0.4286 | IRS | 55 | 0.4906 | 0.7020 | IRS |
| 24 | 0.0949 | 0.1141 | IRS | 56 | 0.2453 | 0.2856 | IRS |
| 25 | 0.0844 | 0.1611 | IRS | 57 | 0.5209 | 0.5566 | IRS |
| 26 | 0.1362 | 0.5297 | IRS | 58 | 0.1244 | 0.8333 | IRS |
| 27 | 0.0927 | 0.2094 | IRS | 59 | 0.2225 | 0.5225 | IRS |
| 28 | 0.0927 | 0.3243 | IRS | 60 | 0.0619 | 0.7353 | IRS |
| 29 | 0.1601 | 0.2148 | DRS | 61 | 0.2235 | 0.8824 | IRS |
| 30 | 0.1994 | 0.2177 | DRS | 62 | 0.071 | 0.5906 | IRS |
| 31 | 0.1443 | 0.1512 | IRS | 63 | 0.0314 | 0.1066 | IRS |
| 32 | 0.0621 | 0.1054 | IRS | 64 | 0.6123 | 0.7741 | IRS |
References
- Abernathy, W.J.; Utterback, J.M. Patterns of industrial innovation. Technol. Rev. 1978, 80, 40–47. [Google Scholar]
- Pries, F.; Janszen, F. Innovation in the construction industry: The dominant role of the environment. Constr. Manag. Econ. 1995, 13, 43–51. [Google Scholar] [CrossRef]
- Lager, T. Product and process development intensity in process industry: A conceptual and empirical analysis of the allocation of company resources for the development of process technology. Int. J. Innov. Manag. 2002, 6, 105–130. [Google Scholar] [CrossRef]
- Sinclair, G.; Klepper, S.; Cohen, W. What’s experience got to do with it? Sources of cost reduction in a large specialty chemicals producer. Manag. Sci. 2000, 46, 28–45. [Google Scholar] [CrossRef]
- Bauer, M.; Leker, J. Exploration and exploitation in product and process innovation in the chemical industry. R D Manag. 2013, 43, 196–212. [Google Scholar] [CrossRef]
- Pisano, G.P. The Development Factory: Unlocking the Potential of Process Innovation; Harvard Business School Press: Boston, MA, USA, 1997. [Google Scholar]
- Martinez-Ros, E. Explaining the decisions to carry out product and process innovations: The Spanish case. J. High Technol. Manag. Res. 1999, 10, 223–242. [Google Scholar] [CrossRef]
- Damanpour, F.; Gopalakrishnan, S. The dynamics of the adoption of product and process innovations in organizations. J. Manag. Stud. 2001, 38, 45–65. [Google Scholar] [CrossRef]
- Reichstein, T.; Salter, A. Investigating the sources of process innovation among UK manufacturing firms. Ind. Corp. Chang. 2006, 15, 653–682. [Google Scholar] [CrossRef]
- Gilbert, X.; Strebel, P. Strategies to outpace the competition. J. Bus. Strategy 1987, 8, 28–36. [Google Scholar] [CrossRef]
- Hollanders, H.J.G.M.; Celikel-Esser, F. Measuring innovation efficiency. In 2007 European Innovation Scoreboard; European Commission: Brussels, Belgium, 2007. [Google Scholar]
- Guan, J.; Chen, K. Modeling the relative efficiency of national innovation systems. Res. Policy 2012, 41, 102–115. [Google Scholar] [CrossRef]
- Manual, O. Guidelines for Collecting, Reporting and Using Data on Innovation, 4th ed.; OECD Publishing: Paris, France, 2018. [Google Scholar]
- Lim, L.P.; Garnsey, E.; Gregory, M. Product and process innovation in biopharmaceuticals: A new perspective on development. R D Manag. 2006, 36, 27–36. [Google Scholar] [CrossRef]
- Utterback, J.M.; Abernathy, W.J. A dynamic model of process and product innovation. Omega 1975, 3, 639–656. [Google Scholar] [CrossRef]
- Klepper, S. Entry, exit, growth, and innovation over the product life cycle. Am. Econ. Rev. 1996, 86, 562–583. [Google Scholar]
- Adner, R.; Levinthal, D. Demand heterogeneity and technology evolution: Implications for product and process innovation. Manag. Sci. 2001, 47, 611–628. [Google Scholar] [CrossRef]
- Boer, H.; During, W.E. Innovation, what innovation? A comparison between product, process and organizational innovation. Int. J. Technol. Manag. 2001, 22, 83–107. [Google Scholar] [CrossRef]
- Brem, A.; Nylund, P.A.; Schuster, G. Innovation and de facto standardization: The influence of dominant design on innovative performance, radical innovation, and process innovation. Technovation 2016, 50, 79–88. [Google Scholar] [CrossRef]
- Pavitt, K. Sectoral patterns of technical change: Towards a taxonomy and a theory. Res. Policy 1984, 13, 343–373. [Google Scholar] [CrossRef]
- Robson, M.; Townsend, J.; Pavitt, K. Sectoral patterns of production and use of innovations in the UK: 1945–1983. Res. Policy 1988, 17, 1–14. [Google Scholar] [CrossRef]
- Linn, R.A. Product development in the chemical industry: A description of a maturing business. J. Prod. Innov. Manag. 1984, 1, 116–128. [Google Scholar] [CrossRef]
- Hivner, W.; Hopkins, W.E.; Hopkins, S.A. Facilitating, accelerating, and sustaining the innovation diffusion process: An epidemic modeling approach. Eur. J. Innov. Manag. 2003, 6, 80–89. [Google Scholar] [CrossRef]
- Frenkel, A. Barriers and Limitations in the Development of Industrial Innovation in the Region. Eur. Plan. Stud. 2003, 11, 115–137. [Google Scholar] [CrossRef]
- Fernandes, C.I.; Ferreira, J.J.; Raposo, M.L. Drivers to firm innovation and their effects on performance: An international comparison. Int. Entrep. Manag. J. 2013, 9, 557–580. [Google Scholar] [CrossRef]
- Ee Shiang, L.; Nagaraj, S. Impediments to innovation: Evidence from Malaysian manufacturing firms. Asia Pac. Bus. Rev. 2011, 17, 209–223. [Google Scholar] [CrossRef]
- Barnett, B.D.; Clark, K.B. Technological newness: An empirical study in the process industries. J. Eng. Technol. Manag. 1996, 13, 263–282. [Google Scholar] [CrossRef]
- Liu, Z.; Chen, X.; Chu, J.; Zhu, Q. Industrial development environment and innovation efficiency of high-tech industry: Analysis based on the framework of innovation systems. Technol. Anal. Strateg. Manag. 2018, 30, 434–446. [Google Scholar] [CrossRef]
- Shin, J.; Kim, C.; Yang, H. Does Reduction of Material and Energy Consumption Affect to Innovation Efficiency? The Case of Manufacturing Industry in South Korea. Energies 2019, 12, 1178. [Google Scholar] [CrossRef]
- Asimakopoulos, G.; Revilla, A.J.; Slavova, K. External Knowledge Sourcing and Firm Innovation Efficiency. Br. J. Manag. 2019. [Google Scholar] [CrossRef]
- Li, H.; He, H.; Shan, J.; Cai, J. Innovation efficiency of semiconductor industry in China: A new framework based on generalized three-stage DEA analysis. Socio Econ. Plan. Sci. 2019, 66, 136–148. [Google Scholar] [CrossRef]
- Kim, C.; Shin, W.S. Does Information from the Higher Education and R and D Institutes Improve the Innovation Efficiency of Logistic Firms? Asian J. Shipp. Logist. 2019, 35, 70–76. [Google Scholar] [CrossRef]
- Shi, X.; Wu, Y.; Fu, D. Does University-Industry collaboration improve innovation efficiency? Evidence from Chinese Firms. Econ. Model. 2019. [Google Scholar] [CrossRef]
- Wang, Y.; Zhu, Z.; Liu, Z. Evaluation of technological innovation efficiency of petroleum companies based on BCC–Malmquist index model. J. Pet. Explor. Prod. Technol. 2019, 9, 2405–2416. [Google Scholar] [CrossRef]
- Shin, J.; Kim, C.; Yang, H. The effect of sustainability as innovation objectives on innovation efficiency. Sustainability 2018, 10, 1966. [Google Scholar] [CrossRef]
- Park, J.H. Open innovation of small and medium-sized enterprises and innovation efficiency. Asian J. Technol. Innov. 2018, 26, 115–145. [Google Scholar] [CrossRef]
- Wang, Q.; Hang, Y.; Sun, L.; Zhao, Z. Two-stage innovation efficiency of new energy enterprises in China: A non-radial DEA approach. Technol. Forecast. Soc. Chang. 2016, 112, 254–261. [Google Scholar] [CrossRef]
- Suh, Y.; Kim, M.S. A taxonomy of service innovations based on the innovative activity efficiency of service firms: A DEA approach. Int. J. Serv. Technol. Manag. 2014, 20, 267–289. [Google Scholar] [CrossRef]
- Cruz-Cázares, C.; Bayona-Sáez, C.; García-Marco, T. You can’t manage right what you can’t measure well: Technological innovation efficiency. Res. Policy 2013, 42, 1239–1250. [Google Scholar] [CrossRef]
- Wang, C.H.; Lu, Y.H.; Huang, C.W.; Lee, J.Y. R and D, productivity, and market value: An empirical study from high-technology firms. Omega 2013, 41, 143–155. [Google Scholar] [CrossRef]
- Claudio, C.C.; Teresa, G.M.; Cristina, B.S. Does technological innovation efficiency really matter for firm performance. Res. Policy 2013, 42, 1239–1250. [Google Scholar]
- Chen, K.; Guan, J. Measuring the efficiency of China’s regional innovation systems: Application of network data envelopment analysis (DEA). Reg. Stud. 2012, 46, 355–377. [Google Scholar] [CrossRef]
- Bae, Y.; Chang, H. Efficiency and effectiveness between open and closed innovation: Empirical evidence in South Korean manufacturers. Technol. Anal. Strateg. Manag. 2012, 24, 967–980. [Google Scholar] [CrossRef]
- Aigner, D.; Lovell, C.K.; Schmidt, P. Formulation and estimation of stochastic frontier production function models. J. Econ. 1977, 6, 21–37. [Google Scholar] [CrossRef]
- Theodoridis, A.M.; Anwar, M.M. A comparison of DEA and SFA methods: A case study of farm households in Bangladesh. J. Dev. Areas 2011, 45, 95–110. [Google Scholar] [CrossRef]
- Andor, M.; Hesse, F. A Monte Carlo Simulation Comparing DEA, SFA and Two Simple Approaches to Combine Efficiency Estimates. Master’s Thesis, Center of Applied Economic Research Münster (CAWM), University of Münster, Münster, Germany, 2011. [Google Scholar]
- Kruskal, W.H.; Wallis, W.A. Use of ranks in one-criterion variance analysis. J. Am. Stat. Assoc. 1952, 47, 583–621. [Google Scholar] [CrossRef]
- Dasgupta, S.; Sarkis, J.; Talluri, S. Influence of information technology investment on firm productivity: A cross-sectional study. Logist. Inf. Manag. 1999, 12, 120–129. [Google Scholar] [CrossRef]
- Talluri, S.; Vickery, S.K.; Droge, C.L. Transmuting performance on manufacturing dimensions into business performance: An exploratory analysis of efficiency using DEA. Int. J. Prod. Res. 2003, 41, 2107–2123. [Google Scholar] [CrossRef]
- Guan, J.; Chen, K. Measuring the innovation production process: A cross-region empirical study of China’s high-tech innovations. Technovation 2010, 30, 348–358. [Google Scholar] [CrossRef]
- Zhong, W.; Yuan, W.; Li, S.X.; Huang, Z. The performance evaluation of regional R and D investments in China: An application of DEA based on the first official China economic census data. Omega 2011, 39, 447–455. [Google Scholar] [CrossRef]
- Shun-Cai, L.; Ling, C.; Feng-zhu, L.I.U. The analysis of innovation efficiency of enterprises in Hubei Province based on DEA method. Int. Assoc. Manag. Technol. 2015, 3, 1244–1260. [Google Scholar]
- Qin, X.; Du, D. Do external or internal technology spillovers have a stronger influence on innovation efficiency in China? Sustainability 2017, 9, 1574. [Google Scholar]
- Diaz-Balteiro, L.; Herruzo, A.C.; Martinez, M.; González-Pachón, J. An analysis of productive efficiency and innovation activity using DEA: An application to Spain’s wood-based industry. For. Policy Econ. 2006, 8, 762–773. [Google Scholar] [CrossRef]
- Hashimoto, A.; Haneda, S. Measuring the change in R and D efficiency of the Japanese pharmaceutical industry. Res. Policy 2008, 37, 1829–1836. [Google Scholar] [CrossRef]
- Gascón, F.; Lozano, J.; Ponte, B.; de la Fuente, D. Measuring the efficiency of large pharmaceutical companies: An industry analysis. Eur. J. Health Econ. 2017, 18, 587–608. [Google Scholar] [CrossRef]
- Simar, L.; Wilson, P.W. Sensitivity analysis of efficiency scores: How to bootstrap in nonparametric frontier models. Manag. Sci. 1998, 44, 49–61. [Google Scholar] [CrossRef]
- Kneip, A.; Simar, L.; Wilson, P.W. Asymptotics and consistent bootstraps for DEA estimators in nonparametric frontier models. Econ. Theory 2008, 24, 1663–1697. [Google Scholar] [CrossRef]
- Chiaroni, D.; Chiesa, V.; Frattini, F. Unravelling the process from Closed to Open Innovation: Evidence from mature, asset-intensive industries. R D Manag. 2010, 40, 222–245. [Google Scholar] [CrossRef]
- Wang, C.H.; Chen, K.L. Do Relationships have a Dark Side for Innovation Performance in the High-Tech Industry? Int. J. Innov. Technol. Manag. 2018, 15, 1850018. [Google Scholar] [CrossRef]
- Guimaraes, T.; Paranjape, K.; Cornick, M.; Armstrong, C.P. Empirically testing factors increasing manufacturing product innovation success. Int. J. Innov. Technol. Manag. 2018, 15, 1850019. [Google Scholar] [CrossRef]
- Alexander, B.; Joe, T. (Eds.) Managing Innovation: What do We Know about Innovation Success Factors? World Scientific: London, UK, 2019; Volume 33. [Google Scholar]
- Rauter, R.; Globocnik, D.; Perl-Vorbach, E.; Baumgartner, R.J. Open innovation and its effects on economic and sustainability innovation performance. J. Innov. Knowl. 2018. [Google Scholar] [CrossRef]
- Nylund, P.A.; Arimany-Serrat, N.; Ferras-Hernandez, X.; Viardot, E.; Boateng, H.; Brem, A. Internal and external financing of innovation: Sectoral differences in a longitudinal study of European firms. Eur. J. Innov. Manag. 2019. [Google Scholar] [CrossRef]
- Aronson, Z.H.; Reilly, R.R.; Lynn, G.S. Understanding the Role of Team Member Personal Style in Project Performance: Does the Type of Innovation Matter? Int. J. Innov. Technol. Manag. 2019, 16, 1940002. [Google Scholar] [CrossRef]
- Trachuk, A.; Linder, N. Innovation and performance: An empirical study of Russian industrial companies. Int. J. Innov. Technol. Manag. 2018, 15, 1850027. [Google Scholar] [CrossRef]


© 2019 by the authors. Licensee MDPI, Basel, Switzerland. This article is an open access article distributed under the terms and conditions of the Creative Commons Attribution (CC BY) license (http://creativecommons.org/licenses/by/4.0/).