Abstract
Liquid–liquid two-phase flow in microchannels has attracted much attention, due to the superiority of mass transfer enhancement. One of the biggest unresolved challenges is the low mixing efficiency at the microscale. Suitable mixing efficiency is important to promote the mass transfer of two-phase flow in microchannels. In this paper, the mixing efficiency in three junction configurations, including a cross-shaped junction, a cross-shaped T-junction, and a T-junction, is investigated by the volume of fluid (VOF) method coupled with user-defined scalar (UDS) model. All three junction configurations are designed with the same hydraulic diameter of 100 μm. Mixing components are distributed in the front and back parts of the droplet. The mixing efficiency in the droplet forming stage and the droplet moving stage are compared quantitatively. Results show that different junction configurations create very different mixing efficiencies, and the cross-shaped T-junction performs best, with relatively lower disperse phase fractions. However, with an increase of the disperse phase fraction, the cross-shaped junction is superior.
1. Introduction
Microfluidic systems are widely used in chemical synthesis, drug delivery, and solvent extraction, due to their superiority in heat and mass transfer enhancement [1,2,3]. Mixing efficiency is an important parameter for evaluating the microfluidic system. However, at the microscale, the fluid flow is laminar and is confined by a narrow space. Thus, mixing in microfluidic systems is diffusion dominated, so that it is very difficult to achieve a satisfactory mixing efficiency. An increasingly adopted approach for solving this problem is to adopt the droplet-based method. When the continuous phase and the disperse phase are injected into the microchannel, the interaction of two phases cuts the disperse phase into small droplets, and the mixing process is confined inside the droplet. The reduced diffusion distance and enhanced inner circulation inside droplets can highly promote the mixing performance [4,5].
Research has been carried out to investigate the mixing performance inside droplets using experimental and numerical methods. The first attempt to clarify the mixing performance in droplets was made by Burns [6]. The author conducted experiments in an acid–base reaction. The pH indicator was added in the aqueous phase, and the mixing performance was decided by measuring the color variation length of the aqueous phase along the microchannel. Later, Tice et al. [7] conducted an experimental study on the droplet formation and mixing process in a straight microchannel. Water and PFD (perfluorodecaline) were injected as the disperse phase and the continuous phase, respectively. To visualize the mixing process, the Fe(SCN)x(3−x)+ complexes were added in the disperse phase to investigate the mixing performance with different droplet lengths. Results showed that the maximum mixing efficiency was achieved only at a suitable droplet length, and the disperse phase fraction played a crucial role for determining the droplet length. Kashid et al. [8] and Kinoshita et al. [9] carried out experiments to visualize the droplet flow in microchannels using the particle image velocimetry (PIV) method. The author pointed out that the inner circulation inside droplets, which was generated by the shear stress between the wall and the droplets, promoted the surface renewal and reduced the thickness of the boundary layer at the phase interface. Thus, the mixing performance was greatly enhanced. The stronger the inner circulation was, the higher mixing efficiency was. Harshe et al. [10] also studied the mixing process in droplets experimentally. Two streams of the disperse phase with different concentrations of Lucifer yellow fluorescent were injected into the microchannel to produce droplets. Due to the different concentrations of fluorescent, the concentration gradient existed in droplets at the beginning. With droplets moving through the microchannel, the fluorescent redistributed due to the asymmetrical inner circulation caused by the serpentine microchannel. The mixing time on the droplet size and the droplet moving velocity was analyzed by calculating the uniformity of fluorescent in droplets. Moreover, Bai et al. [11] investigated the mixing performance in ionic liquid droplets. The mixing performance was visualized using micro laser-induced fluorescence (micro-LIF) techniques. To enhance the mixing inside the droplet, a modified microchannel with T-junction and deformed main channel were proposed.
Except for experiments, numerical methods are also important ways to analyze the mixing performance under various conditions. The main simulation methods for analyzing the mixing performance are the volume of fluid (VOF) method coupled with the user-defined scalar (UDS) model, the level set coupled with the species transport model, and the lattice Boltzmann method (LBM) coupled with the passive tracer model. Scalars/species/tracers are usually added for visualizing the mixing process in droplets and calculating the mixing efficiency quantitatively. Tung et al. [12] investigated the mixing performance and hydrodynamics inside droplets by 2D simulation and experiments. The planar serpentine microchannel was introduced for promoting the mixing efficiency, and the effect of droplet size on mixing performance was studied. Results identified that the improved mixing efficiency was achieved when the droplet size was comparable with the channel width, which were also validated by Wang et al. [13]. The author studied the hydrodynamics and mixing process in droplets in a serpentine microchannel using VOF coupled with the user-defined scalar model, where the disperse phases were injected into the microchannel oppositely. Scalars were added in one stream of the disperse phase at the beginning, so that at the moment the droplet was formed, the scalars only occupied half of the droplet. With droplets moving along the microchannel, the scalars relocated and distributed uniformly. The mixing degree in droplets was calculated based on the concentrations of scalars in droplets, and comparisons of mixing degree in different droplets were made. Results showed that the droplet length had a significant effect on the mixing efficiency. The time required for completing the mixing process in a larger droplet was longer than that of the smaller one. The best mixing performance was acquired when the droplet length was similar to the channel width. Madadelahi et al. [14] also investigated the mixing performance inside droplets with a novel VOF method, which had the ability to conduct the chemical reactions inside droplets. Results showed that whether the reactions occurred or not, the smaller droplet was able to achieve a better mixing performance. In addition, results also indicated the mixing efficiency was greatly enhanced after the droplet flow through the curve bend. This can be attributed to the secondary flow which was generated due to the dean flow effect, since the secondary flows can induce a great increment of mixing efficiency.
Özkan et al. [15] gave a comprehensive study on the effect of microchannel geometry on mixing performance inside droplets using the level set coupled with species transport model. Sinusoidal microchannels were designed with different cross-section area and curvature radius. Multiple spherical nanoparticles were introduced in droplets. By tracking the motion of particles inside droplets, the mixing performance in different microchannels was easily captured. Results showed that the mixing in a sinusoidal microchannel had a better mixing performance than that in a straight microchannel. Furthermore, the sinusoidal microchannel with smaller cross-section area and the smaller curvature radius performed better for achieving fast mixing. The same method was also used by Yang et al. [16]. The author studied the mixing performance inside droplets in the T-junction microchannel and sinusoidal microchannel with the level set method. Results showed that the mixing efficiency was significantly influenced by the twirling effect in the T-junction microchannel. However, in the sinusoidal microchannel, the mixing efficiency was highly enhanced, due to dean vortices and droplet deformation. Based on the results, an optimized microchannel structure was proposed by combining a T-junction inlet with a sinusoidal microchannel.
The lattice Boltzmann method (LBM) coupled with passive tracer model is another effective simulation method for investigating mixing performance in droplets [17,18,19,20]. Zhao et al. [17,18] identified the mixing efficiency in microchannels with different inlet junctions and main channel structures. Mixing efficiency in droplet forming stage and droplet moving stage was analyzed separately. In addition, the effect of droplet size on mixing efficiency was analyzed. The droplet length ranged from equal to half of the channel width, to twice the channel width. Results showed that when the droplet length increased from 0.95 w to 1.08 w (w represents the channel width), the mixing efficiency increased dramatically. Similarly, Fu et al. [19] investigated the effect of microchannel structure on mixing process, and a baffled channel was used to disturb the inner circulation in droplets to enhance the mixing performance in droplets.
At present, the mixing performance inside droplets is widely studied by many researchers. Most of them focus on the mixing efficiency when droplets move along the microchannel. However, there is little research focusing on the mixing efficiency during the droplet forming stage. The mixing efficiency in this stage also accounts for a large proportion on the overall mixing efficiency. The main aim of this paper is to clarify the mixing efficiency in the droplet forming stage and the droplet moving stage, respectively. Meanwhile, the effects of junction configuration and the disperse phase fraction on mixing efficiency in the two stages are analyzed accordingly.
2. Computational Model
2.1. Governing Equations
In this paper, the simulation is conducted using the VOF method in ANSYS Fluent 17.2. The VOF method is capable of transient tracking on the liquid–liquid/gas interface and it is accurate for conducting the liquid–liquid two-phase flow in microchannel [13,14,21]. In the VOF model, each additional fluid phase in the model is identified by the volume fraction of the specific fluid αq in the computational cell. In every control volume, the volume fraction of all phases sum to unity. Here, αq = 1 represents that the computational cell is full of q phase, while αq = 0 represents that the computational cell is empty of the q phase. Similarly, 0 < αq < 1 represents the situation whereby the computational cell contains both the q phase and the other fluids.
Interface tracking between the phases is solved by the solution of a continuity equation as shown in Equation (1):
A single momentum equation is solved throughout the domain, as shown in Equation (2).
In a two-phase system, water (continuous phase)/oil (disperse phase) system in this paper, the density and viscosity in each computational cell is calculated by Equations (3) and (4):
The surface tension force F is solved by Equation (5):
where ρ and μ are the average density and average viscosity, respectively. ρ and μ keep constant; p and v represent the pressure and velocity, respectively; σ is the surface tension; and k is the local surface curvature and is defined in terms of the divergence of the normal . Subscripts c and d represent the continuous phase and the disperse phase, respectively.
In addition, for visualizing and quantifying during the mixing process, the UDS is defined and added in the disperse phase, as shown in Equation (7):
where ϕ represents the scalar, and Γ represents the diffusion coefficient. In order to reduce the effect of molecular diffusion on the mixing efficiency and highlight the effect of convection on the mixing efficiency, the diffusion coefficient is set as 1 × 10⁻²⁰ m2/s.
2.2. Geometrical Model and Boundary Conditions
Three junction configurations, including the cross-shaped junction, the cross-shaped T-junction, and the T-junction, are designed as shown in Figure 1. wc, wd, and h represent the continuous phase channel width, the disperse phase channel width, and channel depth, respectively. They share the same size as 100 μm.
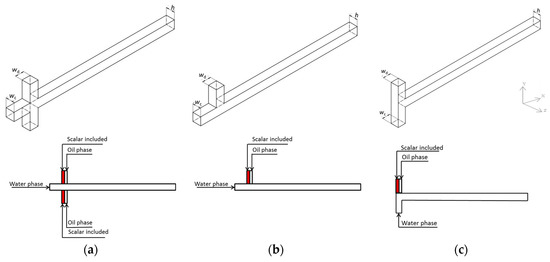
Figure 1.
Schematic diagram of the microchannel. wc = wd = h = 100 μm. (a) Cross-shaped junction; (b) Cross-shaped T-junction; (c) T-junction.
Both the two-phase inlets are set as the velocity inlet and the phase in each inlet is marked in Figure 1. Physical properties of the continuous phase and the disperse phase are shown in Table 1. The mixing component is distributed in the front and back parts of the disperse phase initially, which is marked with the red color in Figure 1. The outlet is set as the outflow and the wall is set as a no-slip boundary condition. To eliminate the effect of the wall wettability, the contact angle is set as 180°. The PISO (pressure-implicit with splitting of operators) is used for the pressure–velocity coupling. The PRESTO! (pressure staggering option) is used for pressure interpolation. The second-order upwind differencing is applied for solving transport equations.

Table 1.
Physical properties of the continuous phase and the disperse phase.
2.3. Methods for the Mixing Efficiency Analysis
In the simulation, the mixing efficiency in a specific droplet is calculated by Equation (8):
where ci is the arbitrary node concentration of the scalar, is the ideal concentration (in this paper, = 0.5), and N is the number of the nodes in the droplet. ME is the abbreviation of the mixing efficiency, which is based on the standard deviation to the ideal condition.
3. Validation of Numerical Method
Validation of the numerical method is an important step before conducting the whole simulation. The experimental results of Cao et al. [22] are selected for validation of the VOF method. The hydraulic diameter and the phase properties which are used for simulation are all kept consistent with the experiment.
Figure 2 shows the droplet formation process of simulation results and experimental results which are presented in Ref. [22]. It can be seen that the general trend of the droplet formation process is highly consistent, and the overall droplet formation time spent in the simulation is much higher than that in the experiment. These tiny differences are caused by the time recorded by the camera and the calculations in the simulation, which both contribute to deviations.
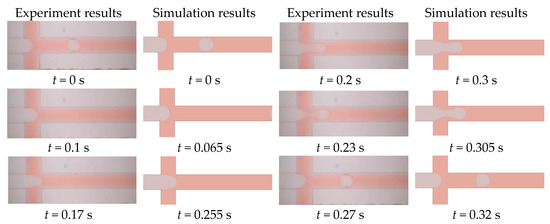
Figure 2.
Comparisons of the droplet formation process between the experiment results by Cao et al. [22] and the simulation results. Qd = 1 mL/h, Qc = 20 mL/h.
4. Results and Discussion
4.1. Mesh Independence Check
A suitable mesh size can not only capture the interface precisely, but also can save the computation time and the storage space. Table 2 shows the variation of dimensionless droplet length and mixing efficiency in different mesh sizes. It can be seen that when the mesh size decreases from 8 μm to 4.25 μm, the dimensionless droplet length varies at a very small range, within the maximum relative error less than 5%, which is calculated by Equation (9).
where RE is the abbreviation of relative error; Vi represents the dimensionless droplet length (or the mixing efficiency) in different mesh size, i = 4.25, 4.5, 5, 5.5, 6, 7, 8; and V5 represents the value measured in mesh size of 5 µm.
Table 2.
Dependency of the dimensionless droplet length and the mixing efficiency to the mesh size.
However, the mixing efficiency is affected by the mesh size greatly. With the mesh refinement, the mixing efficiency dropped from 66.3% to 36.6%. When the mesh size is less than 5.5 µm, the mixing efficiency becomes gradually independent of the mesh numbers, hence, a suitable mesh size 5 µm is selected.
4.2. Droplet Formation Process
The continuous phase and disperse phase encountered at the junction of the microchannel and interacted with each other. The competition between the viscosity force, the surface tension force, and the pressure gradient makes droplets, which separate from the disperse phase to move along the microchannel. Droplet features have an important influence on the mixing efficiency, which are affected by many factors, such as fluids physical properties, fluids velocities, and channel dimensions. In the numerical simulation, the droplet moves along the microchannel with a total velocity of 50 mm/s. The capillary numbers of the disperse phase and the continuous phase are 2 × 10⁻³ < Cad < 8 × 10⁻³ and 5.8 × 10⁻⁴ < Cac < 2.3 × 10⁻³, respectively. Both of them are far below 0.1 (a critical number for producing droplet flow pattern in two-phase liquid–liquid flow [23]). Thus, stable droplet production can be obtained in the numerical simulation.
Figure 3 presents the droplet formation process in three junction configurations. It can be seen that the droplet formation frequency in the cross-shaped junction is much lower than that in the cross-shaped T-junction and the T-junction. That is because in the cross-shaped junction, the disperse phase is divided into two streams. That means with same disperse phase fraction, the disperse phase velocity of each stream accounts for only half of the total disperse phase velocity, so that the lower velocity makes a longer droplet formation time.
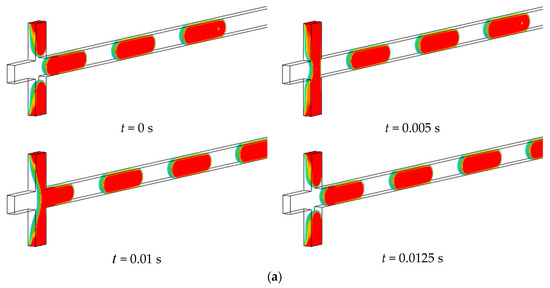
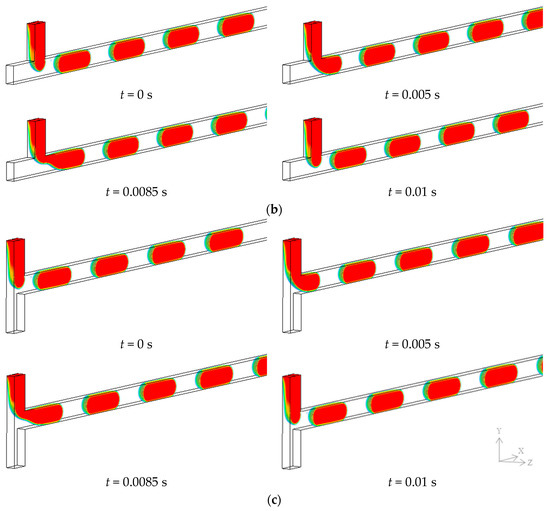
Figure 3.
Droplet formation process in three junction configurations. utotal = 50 mm/s, εd = 0.5. (a) Droplet formation process in the cross-shaped junction; (b) Droplet formation process in the cross-shaped T-junction; (c) Droplet formation process in the T-junction.
In addition, the droplet feature can be easily changed by adjusting the disperse phase fraction, which is defined as the ratio of disperse phase velocity to the total droplet moving velocity, as shown in Equation (10).
where εd, ud, and utotal represent the disperse phase fraction, the disperse phase velocity, and the total droplet moving velocity, respectively. The total droplet moving velocity remains constant at 50 mm/s. The disperse phase fraction ranges from 0.2 to 0.7. Accordingly, the disperse phase velocity and the continuous phase velocity are obtained in different disperse phase fractions.
Figure 4 presents the variation of the droplet feature with different disperse phase fractions in the cross-shaped junction. It can be seen that with the increase of the disperse phase fraction, the droplet formation frequency increases first, but then decreases.
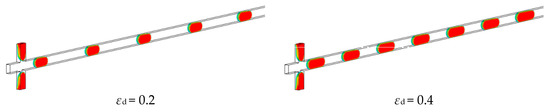
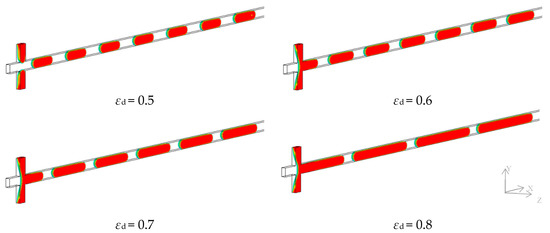
Figure 4.
Droplet features with different disperse phase fractions in the cross-shaped junction. utotal = 50 mm/s, t = 0.085 s.
Here, a quantitative analysis is carried out. The droplet length and the droplet formation frequency are calculated in different junction configurations and different disperse phase fractions. Figure 5 and Figure 6 show the trend of the dimensionless droplet length and the dimensionless droplet formation frequency under different conditions. The dimensionless droplet length is defined as the ratio of the droplet length to the microchannel width, and the dimensionless droplet formation frequency is defined based on the characteristic time t0 [24], as shown in Equation (13).
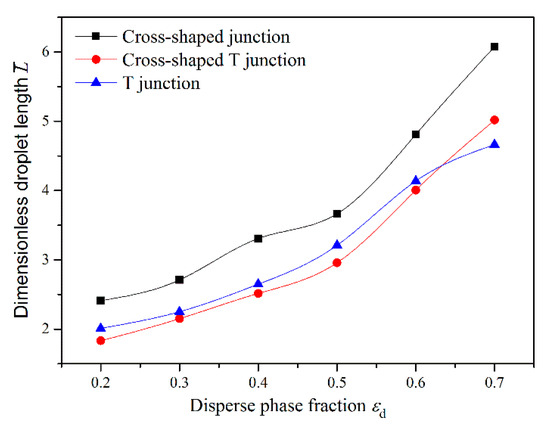
Figure 5.
Variation of the dimensionless droplet length with different disperse phase fractions in three different junction configurations.
Figure 6.
Variation of dimensionless droplet formation frequency with different disperse phase fractions in three different junction configurations.
It can be seen that the droplet features in the cross-shaped T-junction and the T-junction are similar to each other. The maximum difference on the droplet length is less than 10%, and the maximum difference on the droplet formation frequency is less than 7%. The maximum droplet formation frequency is achieved when the disperse phase fraction is 0.4. However, in the cross-shaped junction, the maximum droplet frequency is achieved when the disperse phase fraction is 0.5. In addition, results show that the droplet length increases with the increase of the disperse phase fraction, while the droplet formation frequency changes parabolically with the increase of the disperse phase fraction. The same results are also investigated by Tice et al. [7], but the difference is that the droplet formation frequency is represented by the distance from the droplet center to the adjacent droplet center. In the small disperse phase fraction, once the droplet is formed, the disperse phase retracts a small distance away from the disperse phase inlet, while the retracting distance increases with the decrease of the disperse phase fraction, which is shown in Figure 7. That means that the smaller the disperse phase fraction, the longer time spent in the retracting distance. Thus, it can lead to a longer droplet formation time and a smaller droplet length. The variation of droplet formation frequency in different disperse phase fractions is caused mainly by the variation of the disperse phase velocity. According to findings of Glawdel et al. [25], the time spent in the retracting stage represented 2%–10% of the total formation time. The retracting stage is affected by microchannel geometry, disperse phase velocity, and disperse phase viscosity, and an increase of the disperse phase velocity or the disperse phase viscosity may lead to the decrease of retracting distance. Furthermore, the correlation for calculating the dimensionless volume produced in the retracting stage was presented by Glawdel et al. [26]. The correlation highlights the effect of channel dimension on the retracting stage. In this paper, the disperse phase viscosity and the channel dimension are both kept constant, so that the disperse phase velocity is the only parameter responsible for the retracting stage. The decrease of the disperse phase fraction leads to the decrease of the disperse phase velocity, and the retracting distance increases with the decrease of the disperse phase fraction.
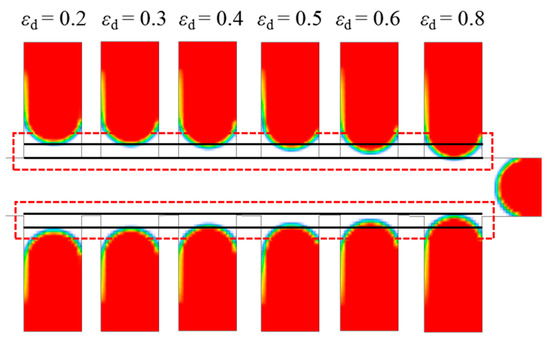
Figure 7.
Retracting distance of the disperse phase at the moment of the droplet formed in different disperse phase fractions.
4.3. Mixing Efficiency in the Droplet Forming Stage
Figure 8 shows the mixing process during the droplet forming stage in three junction configurations. The mixing process in the cross-shaped junction is different from the process in the cross-shaped T-junction and the T-junction. In the cross-shaped junction, the disperse phase is injected in the microchannel symmetrically. With the interaction of the disperse phase and the continuous phase, the circulation zones are gradually formed at the tip of each disperse phase stream. When the two streams encounter, circulation zones separate symmetrically in the forming droplet. The scalar is distributed symmetrically in the forming droplet and the scalar concentration decreases from the droplet axis to the wall. However, in the cross-shaped T-junction and the T-junction, the disperse phase is injected in the microchannel in one direction. With the interaction of the disperse phase and the continuous phase, the circulation zone is formed at the tip of the forming droplet firstly. During the droplet forming stage, the circulation zone moves from the tip of the droplet to the upper part of the droplet. In the droplet forming stage, only one main circulation zone exists, and the other circulation zones occur until the droplet forming stage is finished. The scalar concentration in the lower part of the droplet is higher than that in the upper part.
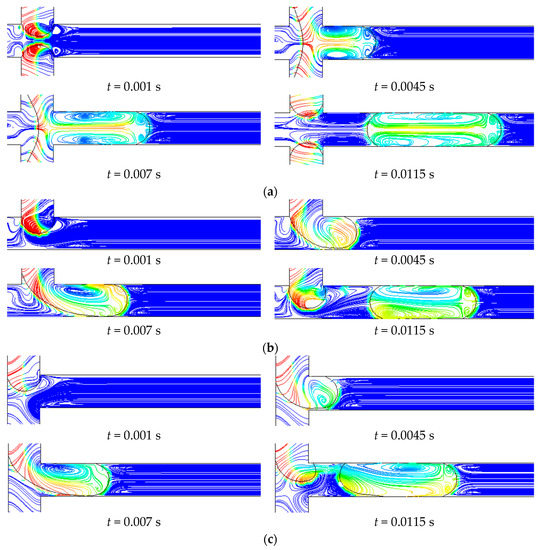
Figure 8.
Scalar distribution in the droplet forming stage. utotal = 50 mm/s, εd = 0.5. (a) Cross-shaped junction; (b) Cross-shaped T-junction; (c) T-junction.
For quantitative analysis, the mixing efficiency during the droplet formation process is calculated by Equation (8). Figure 9 shows the mixing efficiency when droplets are formed in different junction configurations and different disperse phase fractions. Generally, the mixing efficiency decreases with the increase of the disperse phase fraction. This is because the mixing efficiency is closely associated with the droplet length. Shorter droplets have a higher mixing efficiency due to the strong twirling effect [7]. The best mixing performance is achieved when the droplet length is approximately equal to the microchannel width [12,13,18].
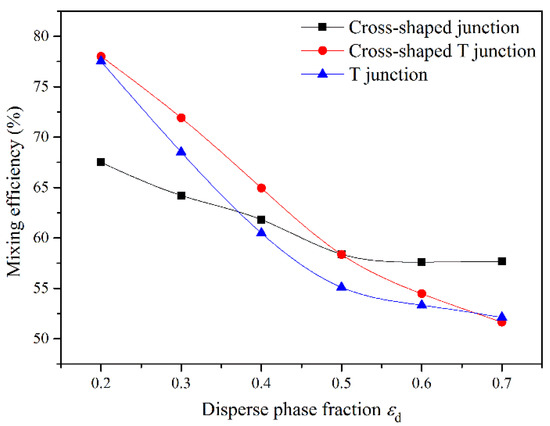
Figure 9.
Mixing efficiency in different disperse phase fractions at the moment of droplet formation.
The mixing efficiency in cross-shaped junctions is the worst among the three junction configurations when the disperse phase fraction is less than 0.35. With an increase of the disperse phase fraction, the cross-shaped junction is superior. When the disperse phase fraction is higher than 0.5, the cross-shaped junction has the best mixing efficiency among all three junction configurations.
4.4. Mixing Efficiency in the Droplet Moving Stage
Figure 10 gives a visual presentation of the scalar distribution in the droplet moving stage. It can be found that with droplets moving along the microchannel, the scalar distribution gradually becomes more uniform. The cross-shaped junction performs better than the other two junctions in the droplet moving stage.
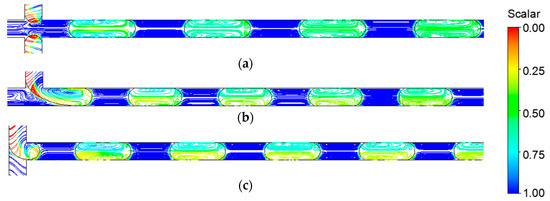
Figure 10.
Scalar distribution in droplet moving stage. utotal = 50 mm/s, εd = 0.5. (a) Cross-shaped junction; (b) Cross-shaped T-junction; (c) T-junction.
For quantitative analysis, the mixing efficiency in three junction configurations is shown in Figure 11, calculated by Equation (8). The moment of the droplet formed is considered as the beginning, setting the time sets as 0, and then the mixing efficiency is calculated after the droplet moves for 0.01, 0.02, 0.03, 0.04, 0.05, and 0.06 s. This shows that the cross-shaped junction has the best performance among all three junction configurations, and the mixing efficiency approaches 95% after 0.06 s of the droplet moving. However, the T-junction presents the worst mixing efficiency and is only 70% after the droplet moves for 0.06 s.
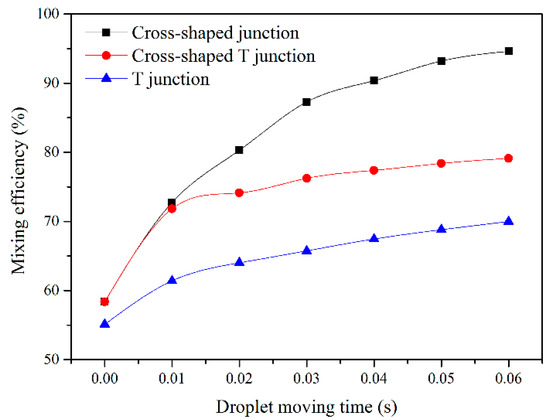
Figure 11.
Mixing efficiency in different droplet moving time. utotal = 50 mm/s, εd = 0.5.
In addition, when the droplet moves in the first 0.01s, the mixing efficiency in the cross-shaped junction and the cross-shaped T-junction is nearly the same, which can be explained by the different scalar distributions of the three junction configurations. It can be seen from the droplet forming stage that the junction configurations determine the scalar distribution in droplets. At the moment of droplet formation, two main circulation zones exist in the droplet, and then separate symmetrically along the droplet axis. However, the scalar distribution is symmetrical only in the cross-shaped junction. In the cross-shaped T-junction and the T-junction, the scalar concentration in lower part of the droplet is much larger than that in the upper part of the droplet. When the droplet moves along the microchannel, the scalar is redistributed due to the inner circulation, and it takes place separately in two circulation zones. Therefore, in the cross-shaped T-junction and the T-junction, the scalar concentration in lower part of the droplet is always larger than that in the upper part of the droplet, which can be adverse for achieving uniform mixing in a short time.
5. Conclusions
In this paper, the mixing efficiency in three junction configurations, including the cross-shaped junction, the cross-shaped T-junction, and the T-junction, is investigated. The mixing efficiency are studied separately for the droplet forming stage and the droplet moving stage. The UDS is defined and added in the disperse phase as an indicator for quantifying the mixing efficiency. The remarkable conclusions are made as follows.
At a constant disperse phase fraction, the cross-shaped junction produces longer droplets comparing with the cross-shaped T-junction and the T-junction. The droplet length and the droplet formation frequency in the cross-shaped T-junction and the T-junction have small differences. The maximum difference in droplet length is less than 10%, and the maximum difference in droplet formation frequency is less than 7%. Increase of the disperse phase fraction leads to an increase of the droplet length. However, the droplet formation frequency changes parabolically with an increase of the disperse phase fraction. In the cross-shaped junction, the maximum droplet frequency is achieved when the disperse phase fraction is 0.5, and the maximum droplet formation frequency is achieved when the disperse phase fraction is 0.4 in the cross-shaped T-junction and the T-junction.
In the droplet forming stage, the mixing efficiency in the cross-shaped T-junction is always higher than in T-junction. The mixing efficiency in the cross-shaped junction is worst at low disperse phase fraction, but with an increase of the disperse phase fraction, the superiority of the cross-shaped junction is gradually presented. When the disperse phase fraction is larger than 0.5, the mixing efficiency in the cross-shaped junction is the best among all three junction configurations. Junction configurations determine the scalar redistribution in droplets. At the moment of droplet formation, the scalar distribution is symmetrical in the cross-shaped junction. In the cross-shaped T-junction and the T-junction, the scalar concentration in the lower part of the droplet is much larger than that in the upper part of the droplet. Therefore, in the droplet moving stage, the cross-shaped junction has the best mixing efficiency performance. Considering the overall mixing performance, when the mixing component is distributed in the front and the back part of the disperse phase initially, the cross-shaped junction is selected as an optimum junction configuration.
Author Contributions
Conceptualization, X.-j.L. and J.-y.Q.; methodology, X.-j.L. and J.-y.Q.; software, X.-j.L.; validation, X.-j.L. and Z.-x.G.; formal analysis, X.-j.L.; investigation, Z.-x.G.; resources, J.-y.Q.; data curation, J.-y.Q.; writing—original draft preparation, X.-j.L.; writing—review and editing, J.-y.Q.; visualization, J.-y.Q.; supervision, Z.-j.J.; project administration, J.-y.Q.; funding acquisition, acquisition, J.-y.Q. and Z.-j.J.
Funding
This research was funded by National Natural Science Foundation of China through, grant number 51805470; the Fundamental Research Funds for the Central Universities, grant number 2018QNA4013 and 2018FZA213; and the Youth Funds of the State Key Laboratory of Fluid Power and Mechatronic Systems (Zhejiang University), grant number SKLoFP-QN-1801.
Conflicts of Interest
The authors declare no conflict of interest.
References
- Zhao, Y.; Cheng, Y.; Shang, L.; Wang, J.; Xie, Z.; Gu, Z. Microfluidic synthesis of barcode particles for multiplex assays. Small 2015, 11, 151–174. [Google Scholar] [CrossRef] [PubMed]
- Qian, J.; Chen, M.; Liu, X.; Jin, Z. A numerical investigation of the flow of nanofluids through a micro tesla valve. J. Zhejiang Univ.-Sci. A 2019, 20, 50–60. [Google Scholar] [CrossRef]
- Murphy, T.W.; Zhang, Q.; Naler, L.B.; Ma, S.; Lu, C. Recent advances in the use of microfluidic technologies for single cell analysis. Analyst 2017, 143, 6–8. [Google Scholar] [CrossRef] [PubMed]
- Leman, M.; Abouakil, F.; Griffiths, A.D.; Tabeling, P. Droplet-based microfluidics at the femtolitre scale. Lab Chip 2016, 15, 753–765. [Google Scholar] [CrossRef]
- Ward, K.; Fan, Z.H. Mixing in microfluidic devices and enhancement methods. J. Micromech. Microeng. 2015, 25, 94001. [Google Scholar] [CrossRef] [PubMed]
- Burns, J.; Ramshaw, C. The intensification of rapid reactions in multiphase systems using slug flow in capillaries. Lab Chip 2001, 1, 10–15. [Google Scholar] [CrossRef] [PubMed]
- Tice, J.D.; Song, H.; Lyon, A.D.; Ismagilov, R.F. Formation of droplets and mixing in multiphase microfluidics at low values of the reynolds and the capillary numbers. Langmuir 2003, 19, 796–802. [Google Scholar] [CrossRef]
- Kashid, M.N. Internal Circulation within the Liquid Slugs of a Liquid−Liquid Slug-Flow Capillary Microreactor. Ind. Eng. Chem. Res. 2005, 44, 5003–5010. [Google Scholar] [CrossRef]
- Kinoshita, H.; Kaneda, S.; Fujii, T.; Oshima, M. Three-dimensional measurement and visualization of internal flow of a moving droplet using confocal micro-PIV. Lab Chip 2007, 7, 338–346. [Google Scholar] [CrossRef]
- Harshe, Y.; Eijk, M.V.; Kleijn, C.R.; Kreutzer, M.T.; Boukany, P.E. Scaling of mixing time for droplets of different size traveling through a serpentine microchannel. RSC Adv. 2016, 6, 98812–98815. [Google Scholar] [CrossRef]
- Bai, L.; Fu, Y.; Yao, M.; Cheng, Y. Enhancement of mixing inside ionic liquid droplets through various micro-channels design. Chem. Eng. J. 2018, 332, 537–547. [Google Scholar] [CrossRef]
- Tung, K.Y.; Li, C.C.; Yang, J.T. Mixing and hydrodynamic analysis of a droplet in a planar serpentine micromixer. Microfluid. Nanofluid. 2009, 7, 545–557. [Google Scholar] [CrossRef]
- Wang, J.; Wang, J.; Feng, L.; Lin, T. Fluid mixing in droplet-based microfluidics with a serpentine microchannel. RSC Adv. 2015, 5, 104138–104144. [Google Scholar] [CrossRef]
- Madadelahi, M.; Shamloo, A.; Madadelahi, M.; Shamloo, A. Droplet-based flows in serpentine microchannels: Chemical reactions and secondary flows. Int. J. Multiph. Flow 2017, 97, 186–196. [Google Scholar] [CrossRef]
- Özkan, A.; Erdem, E.Y. Numerical analysis of mixing performance in sinusoidal microchannels based on particle motion in droplets. Microfluid. Nanofluid. 2015, 19, 1101–1108. [Google Scholar] [CrossRef]
- Yang, L.; Li, S.; Liua, J.; Cheng, J. Fluid mixing in droplet-based microfluidics with T junction and convergent-divergent sinusoidal microchannels. Electrophoresis 2018, 39, 512–520. [Google Scholar] [CrossRef] [PubMed]
- Zhao, S.; Wang, W.; Zhang, M.; Shao, T.; Jin, Y.; Cheng, Y. Three-dimensional simulation of mixing performance inside droplets in micro-channels by lattice boltzmann method. Chem. Eng. J. 2012, 207–208, 267–277. [Google Scholar] [CrossRef]
- Zhao, S.; Riaud, A.; Luo, G.; Jin, Y.; Cheng, Y. Simulation of liquid mixing inside micro-droplets by a lattice boltzmann method. Chem. Eng. Sci. 2015, 131, 118–128. [Google Scholar] [CrossRef]
- Fu, Y.; Bai, L.; Zhao, S.; Bi, K.; Jin, Y.; Cheng, Y. Droplet in droplet: Lbm simulation of modulated liquid mixing. Chem. Eng. Sci. 2016, 155, 428–437. [Google Scholar] [CrossRef]
- Fu, Y.; Bai, L.; Zhao, S.; Zhang, X.; Jin, Y.; Cheng, Y. Simulation of reactive mixing behaviors inside micro-droplets by a lattice boltzmann method. Chem. Eng. Sci. 2018, 181, 79–89. [Google Scholar] [CrossRef]
- Rocha, L.; Miranda, J.M.; Campos, J.B. Wide Range Simulation Study of Taylor Bubbles in Circular Milli and Microchannels. Micromachines 2017, 8, 154. [Google Scholar] [CrossRef]
- Cao, Z.; Wu, Z.; Sundén, B. Dimensionless analysis on liquid-liquid flow patterns and scaling law on slug hydrodynamics in cross-junction microchannels. Chem. Eng. J. 2018, 344, 604–614. [Google Scholar] [CrossRef]
- Cubaud, T.; Mason, T.G. Capillary threads and viscous droplets in square microchannels. Phys. Fluids 2008, 20, 053302. [Google Scholar] [CrossRef]
- Christopher, G.F.; Noharuddin, N.; Taylor, J.A.; Anna, S.L. Experimental observations of the squeezing-to-dripping transition in T-shaped microfluidic junctions. Phys. Rev. E 2008, 78. [Google Scholar] [CrossRef] [PubMed]
- Glawdel, T.; Elbuken, C.; Ren, C.L. Droplet formation in microfluidic T-junction generators operating in the transitional regime. I. Experimental observations. Phys. Rev. E 2012, 85. [Google Scholar] [CrossRef] [PubMed]
- Glawdel, T.; Elbuken, C.; Ren, C.L. Droplet formation in microfluidic T-junction generators operating in the transitional regime. II. modeling. Phys. Rev. E 2012, 85. [Google Scholar] [CrossRef] [PubMed]


© 2019 by the authors. Licensee MDPI, Basel, Switzerland. This article is an open access article distributed under the terms and conditions of the Creative Commons Attribution (CC BY) license (http://creativecommons.org/licenses/by/4.0/).