Article

Agent-Based Modeling of Immune Response to Study the Effects of Regulatory T Cells in Type 1 Diabetes

1
Department of Biomedical Engineering, Illinois Institute of Technology, Chicago, IL 60616, USA
2
Department of Chemical and Biological Engineering, Illinois Institute of Technology, Chicago, IL 60616, USA
*
Author to whom correspondence should be addressed.
Processes 2018, 6(9), 141; https://doi.org/10.3390/pr6090141
Submission received: 27 June 2018 / Revised: 14 August 2018 / Accepted: 21 August 2018 / Published: 27 August 2018
(This article belongs to the Special Issue Modeling & Control of Disease States)

Abstract

:
Regulatory T cells (Tregs) have an important role in self-tolerance. Understanding the functions of Tregs is important for preventing or slowing the progress of Type 1 Diabetes. We use a two-dimensional (2D) agent-based model to simulate immune response in mice and test the effects of Tregs in tissue protection. We compared the immune response with and without Tregs, and also tested the effects of Tregs from different sources or with different functions. The results show that Tregs can inhibit the proliferation of effector T cells by inhibiting antigens presenting via dendritic cells (DCs). Although the number and function of Tregs affect the inhibition, a small number of Tregs compared to CD4+ T cells can effectively protect islets in pancreatic tissue. Finally, we added Tregs to the system in the middle phase of the immune response. The simulation results show that Tregs can inhibit the production of effector CD8+ T cells and maintain a good environment for β cell regeneration.

Graphical Abstract

1. Introduction

Type 1 Diabetes (T1D) is caused by auto-immune deficiency, where cell tolerance to auto-antigen is damaged, and leads to tissue destruction by the self-immune system. In the immune system, regulatory T cells (Tregs) and other tolerogenic cells play a key role in self-tolerance [1,2]. The balance in the number and function of Tregs and destructive T cells affects the results of the immune response [3,4]. Currently, many therapies developed for T1D focus on Tregs intervention [5,6,7]. Therefore, investigating the relationship between Tregs and other immune system components is important in preventing or slowing the progress of auto-immune disease.
Computational modeling can be used to assess rapidly the potential performance of new therapies and treatment under development. Computational models of T1D with different goals have been developed [8,9]. Besides economic models [10] and glucose-insulin models [11], models that describe the autoimmune pathogenesis of T1D were also proposed [12,13,14]. Shoda et al. developed a relatively complex mathematical model describing the dynamics of immune response [12]. Wedgwood et al. built a multiscale model combining ordinary differential equations (ODE) and agent-based modeling in simulating interactions among β cells, T cells and B cells [14]. Agent-based modeling (ABM) can simulate behaviors and interactions of individual entities, and offers flexibility in simulating heterogeneous interactions and complex individual behaviors which can be characterized by if-then rules and thresholds. It also provides a framework that can easily adjust the size and complexity of a system through adding new agents and rules of behaviors or interactions [15].
In our previous work, we developed an ABM to simulate the interactions between β cell and CD8+ T cells in pancreatic tissue of mice [16]. In this work, we further developed the ABM of disease progression within the pancreatic lymph node and tissue in mice. By describing the activities of Tregs and dendritic cells (DCs), the model estimates the effect of Tregs in achieving cell tolerance and protecting islets.

2. The Model

The model developed extends our previous model [16] built by using the Repast High Performance Computing (HPC) toolkit [17]. It is composed of cell agents, rules of cell behaviors, environments for interactions of cell agents with each other and their environments. As with previous work, the model is two-dimensional (2D) and the time resolution is 1 min. Simulation starts from 3-week age of mice to 14-week age of mice, lasting for 11 weeks. The model has two “spaces” of 200 × 200 grids representing pancreatic tissue (10 µm/grid) and pancreatic lymph node (PLN, 15 µm/grid), respectively. The cell agents in this model include β cells, α cells, dendritic cells (DCs), CD8+ T cells, CD4+ T cells and regulatory T cells (Tregs). The β cells, α cells and Basement Membrane (BM) constitute the islets which are dispersed in the pancreatic tissue space (Figure 1). The parameters of cell agents are listed in Table 1. The behaviors of cells and the rules of cell agents in the model are presented in Section 2.1, Section 2.2, Section 2.3, Section 2.4 and Section 2.5. The schematic diagram of cell interactions in pancreatic lymph node (PLN) and pancreatic tissue is displayed in Figure 2, and a flowchart of agent behavior is given in Figure 3. The parameters and the rules of cell behaviors are based on information from the literature cited in references.

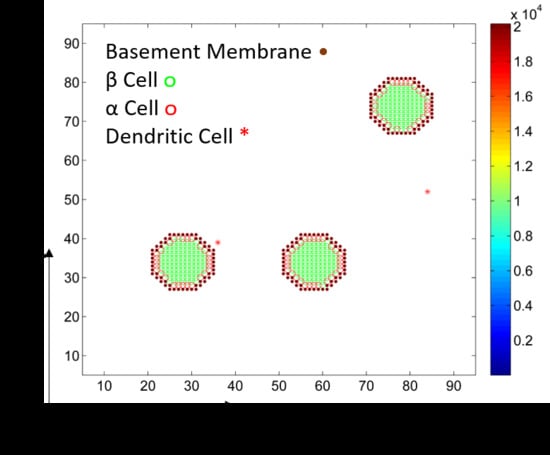
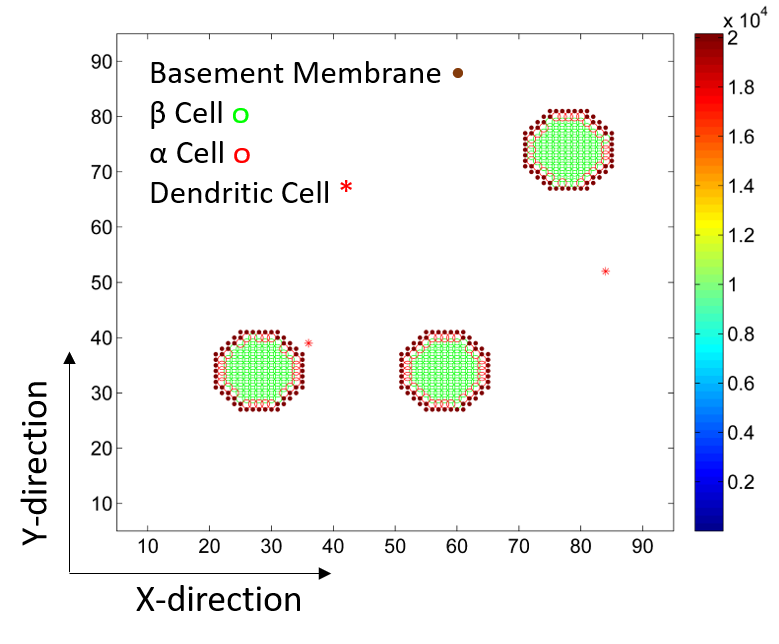
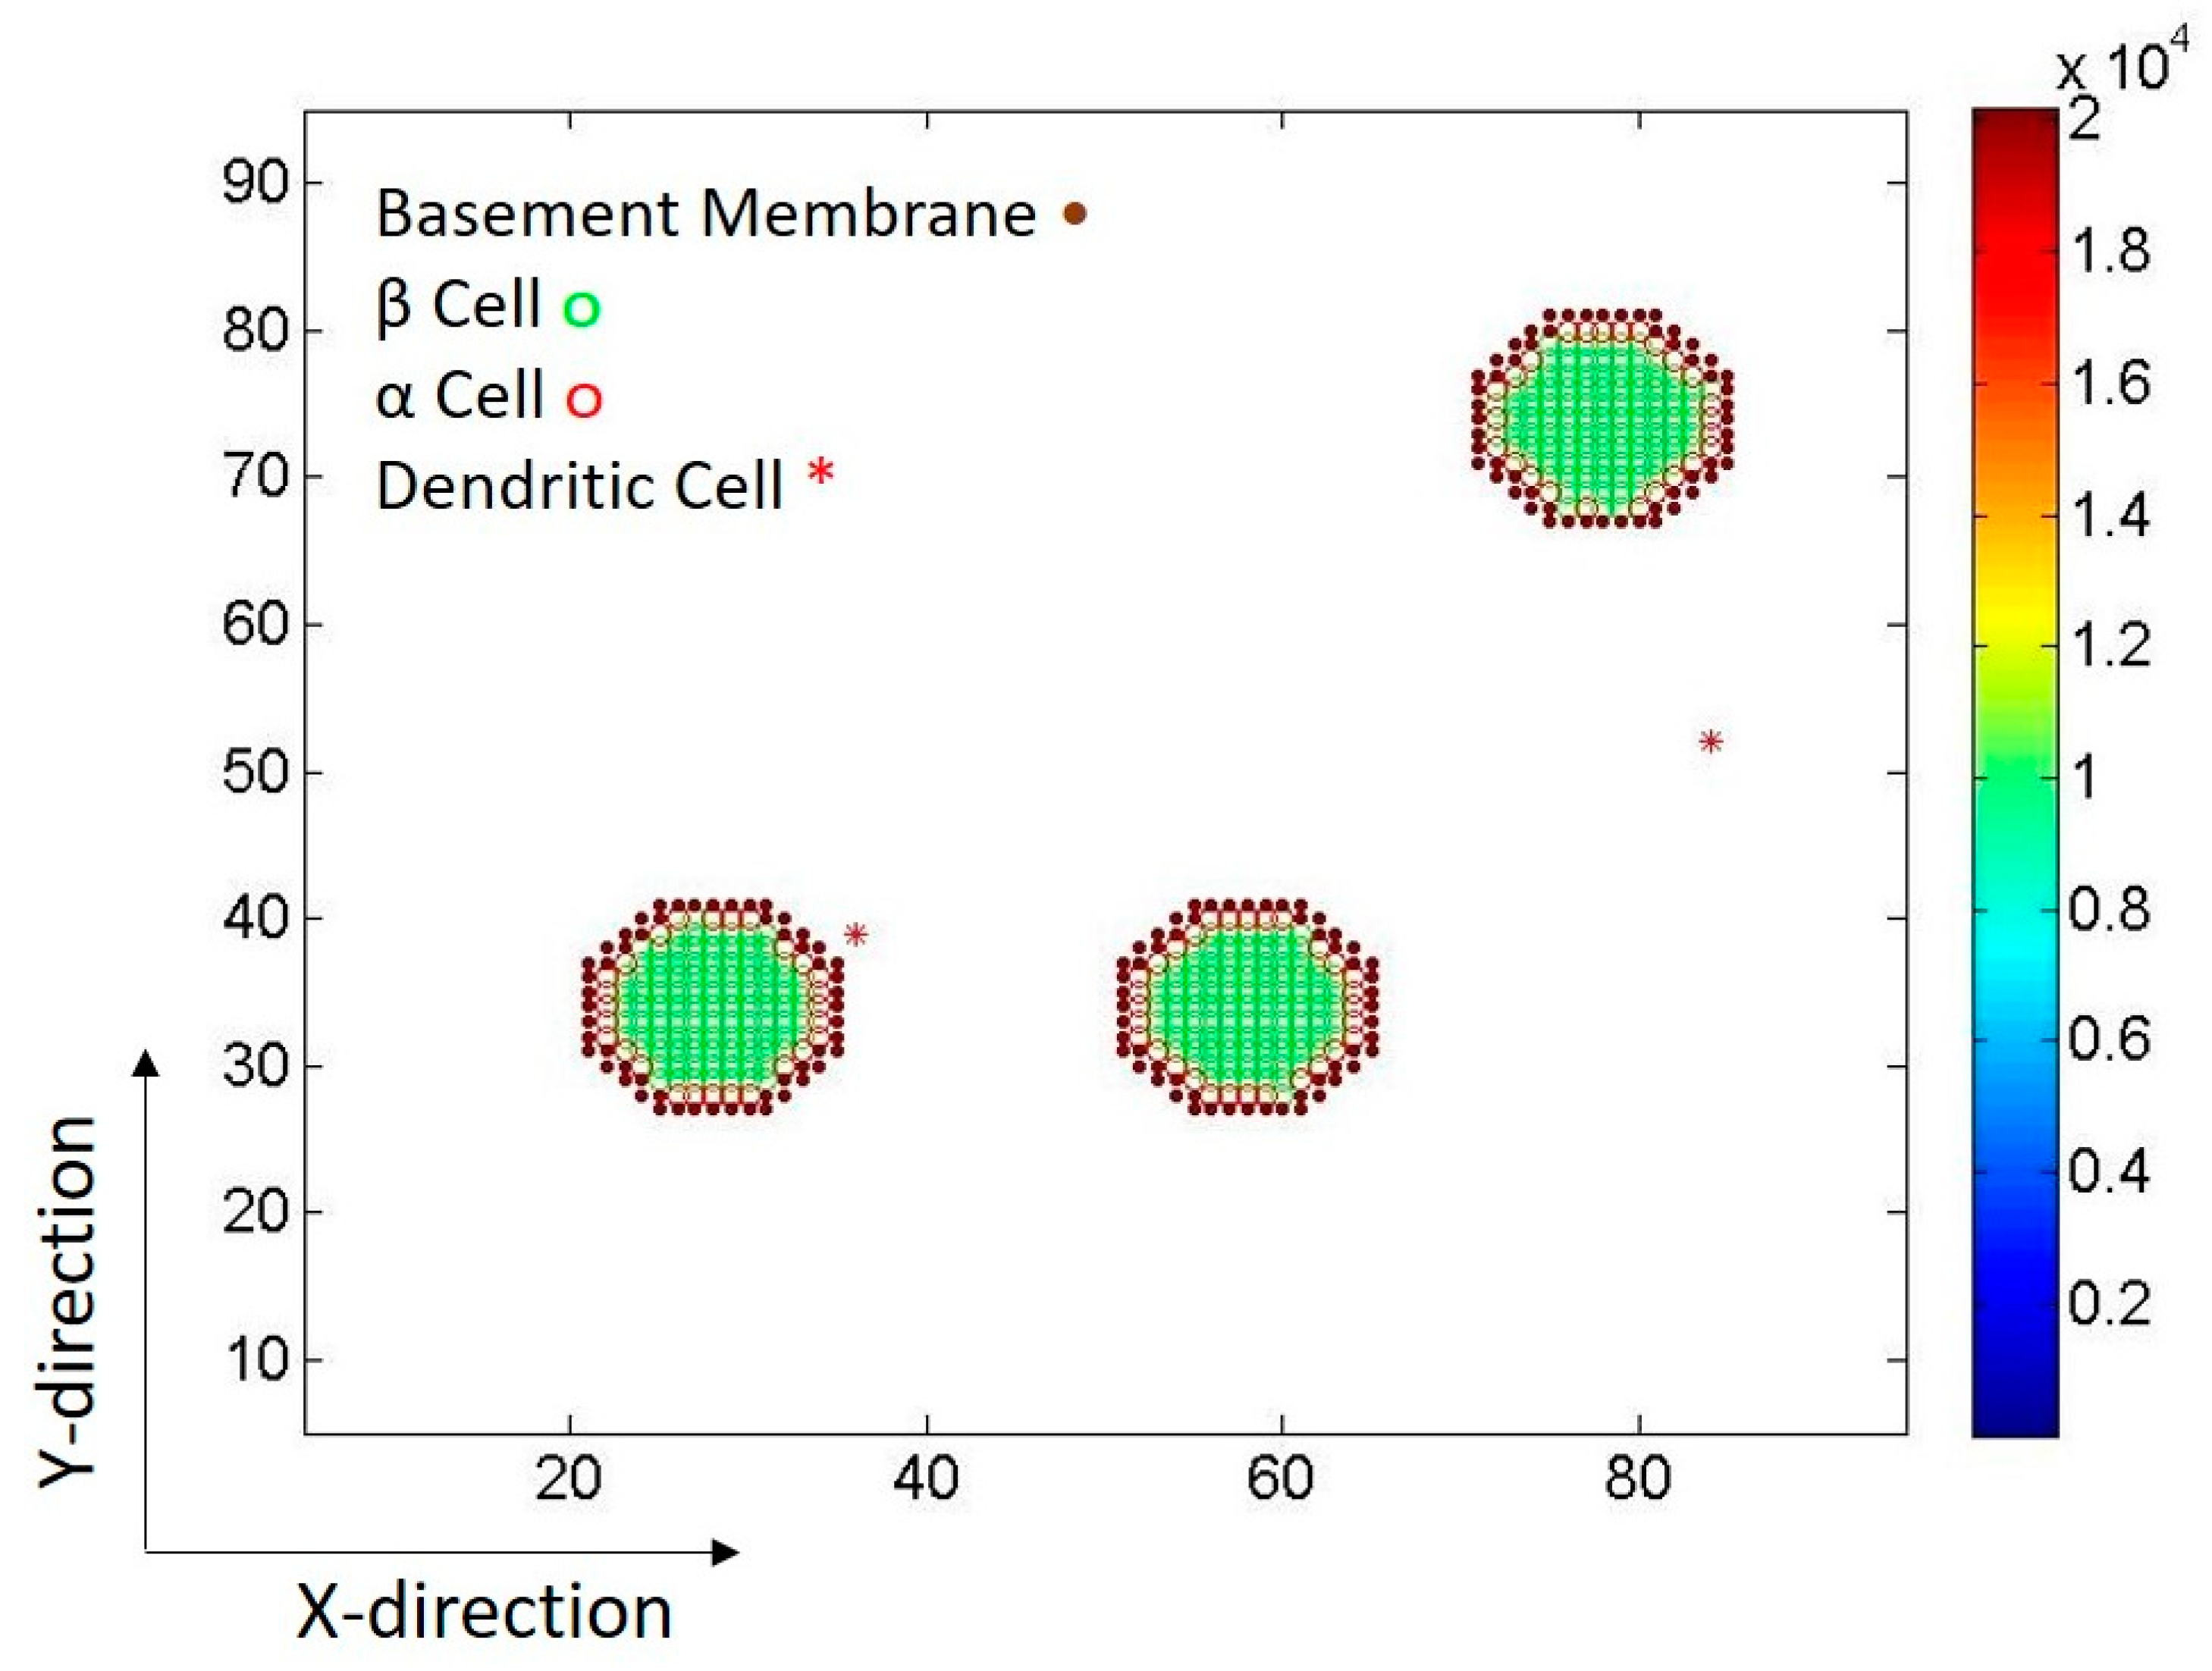
2.1. Islets of Langerhans

New β cells are generated from three sources during the progression of T1D: non-β cell precursors (such as the duct epithelium), existing β cells, and α cells [33]. In mice, α cells transdifferentiate to β cells upon Pax4 ectopic expression [34] with or without cell division [29]. In this model, β cell self-renewal and α cell conversion were implemented. Within two weeks [29], the islets in the model, whose β cells were almost destroyed, are composed of neogenic β cells and almost reach the original number of β cells if no destructive lymphocytes exist in pancreatic tissue. The mouse islets present a core-mantle arrangement of α cells and β cells [35]. In this model, the α cells enclose β cells and account for ~20% of islets cells (Figure 1).

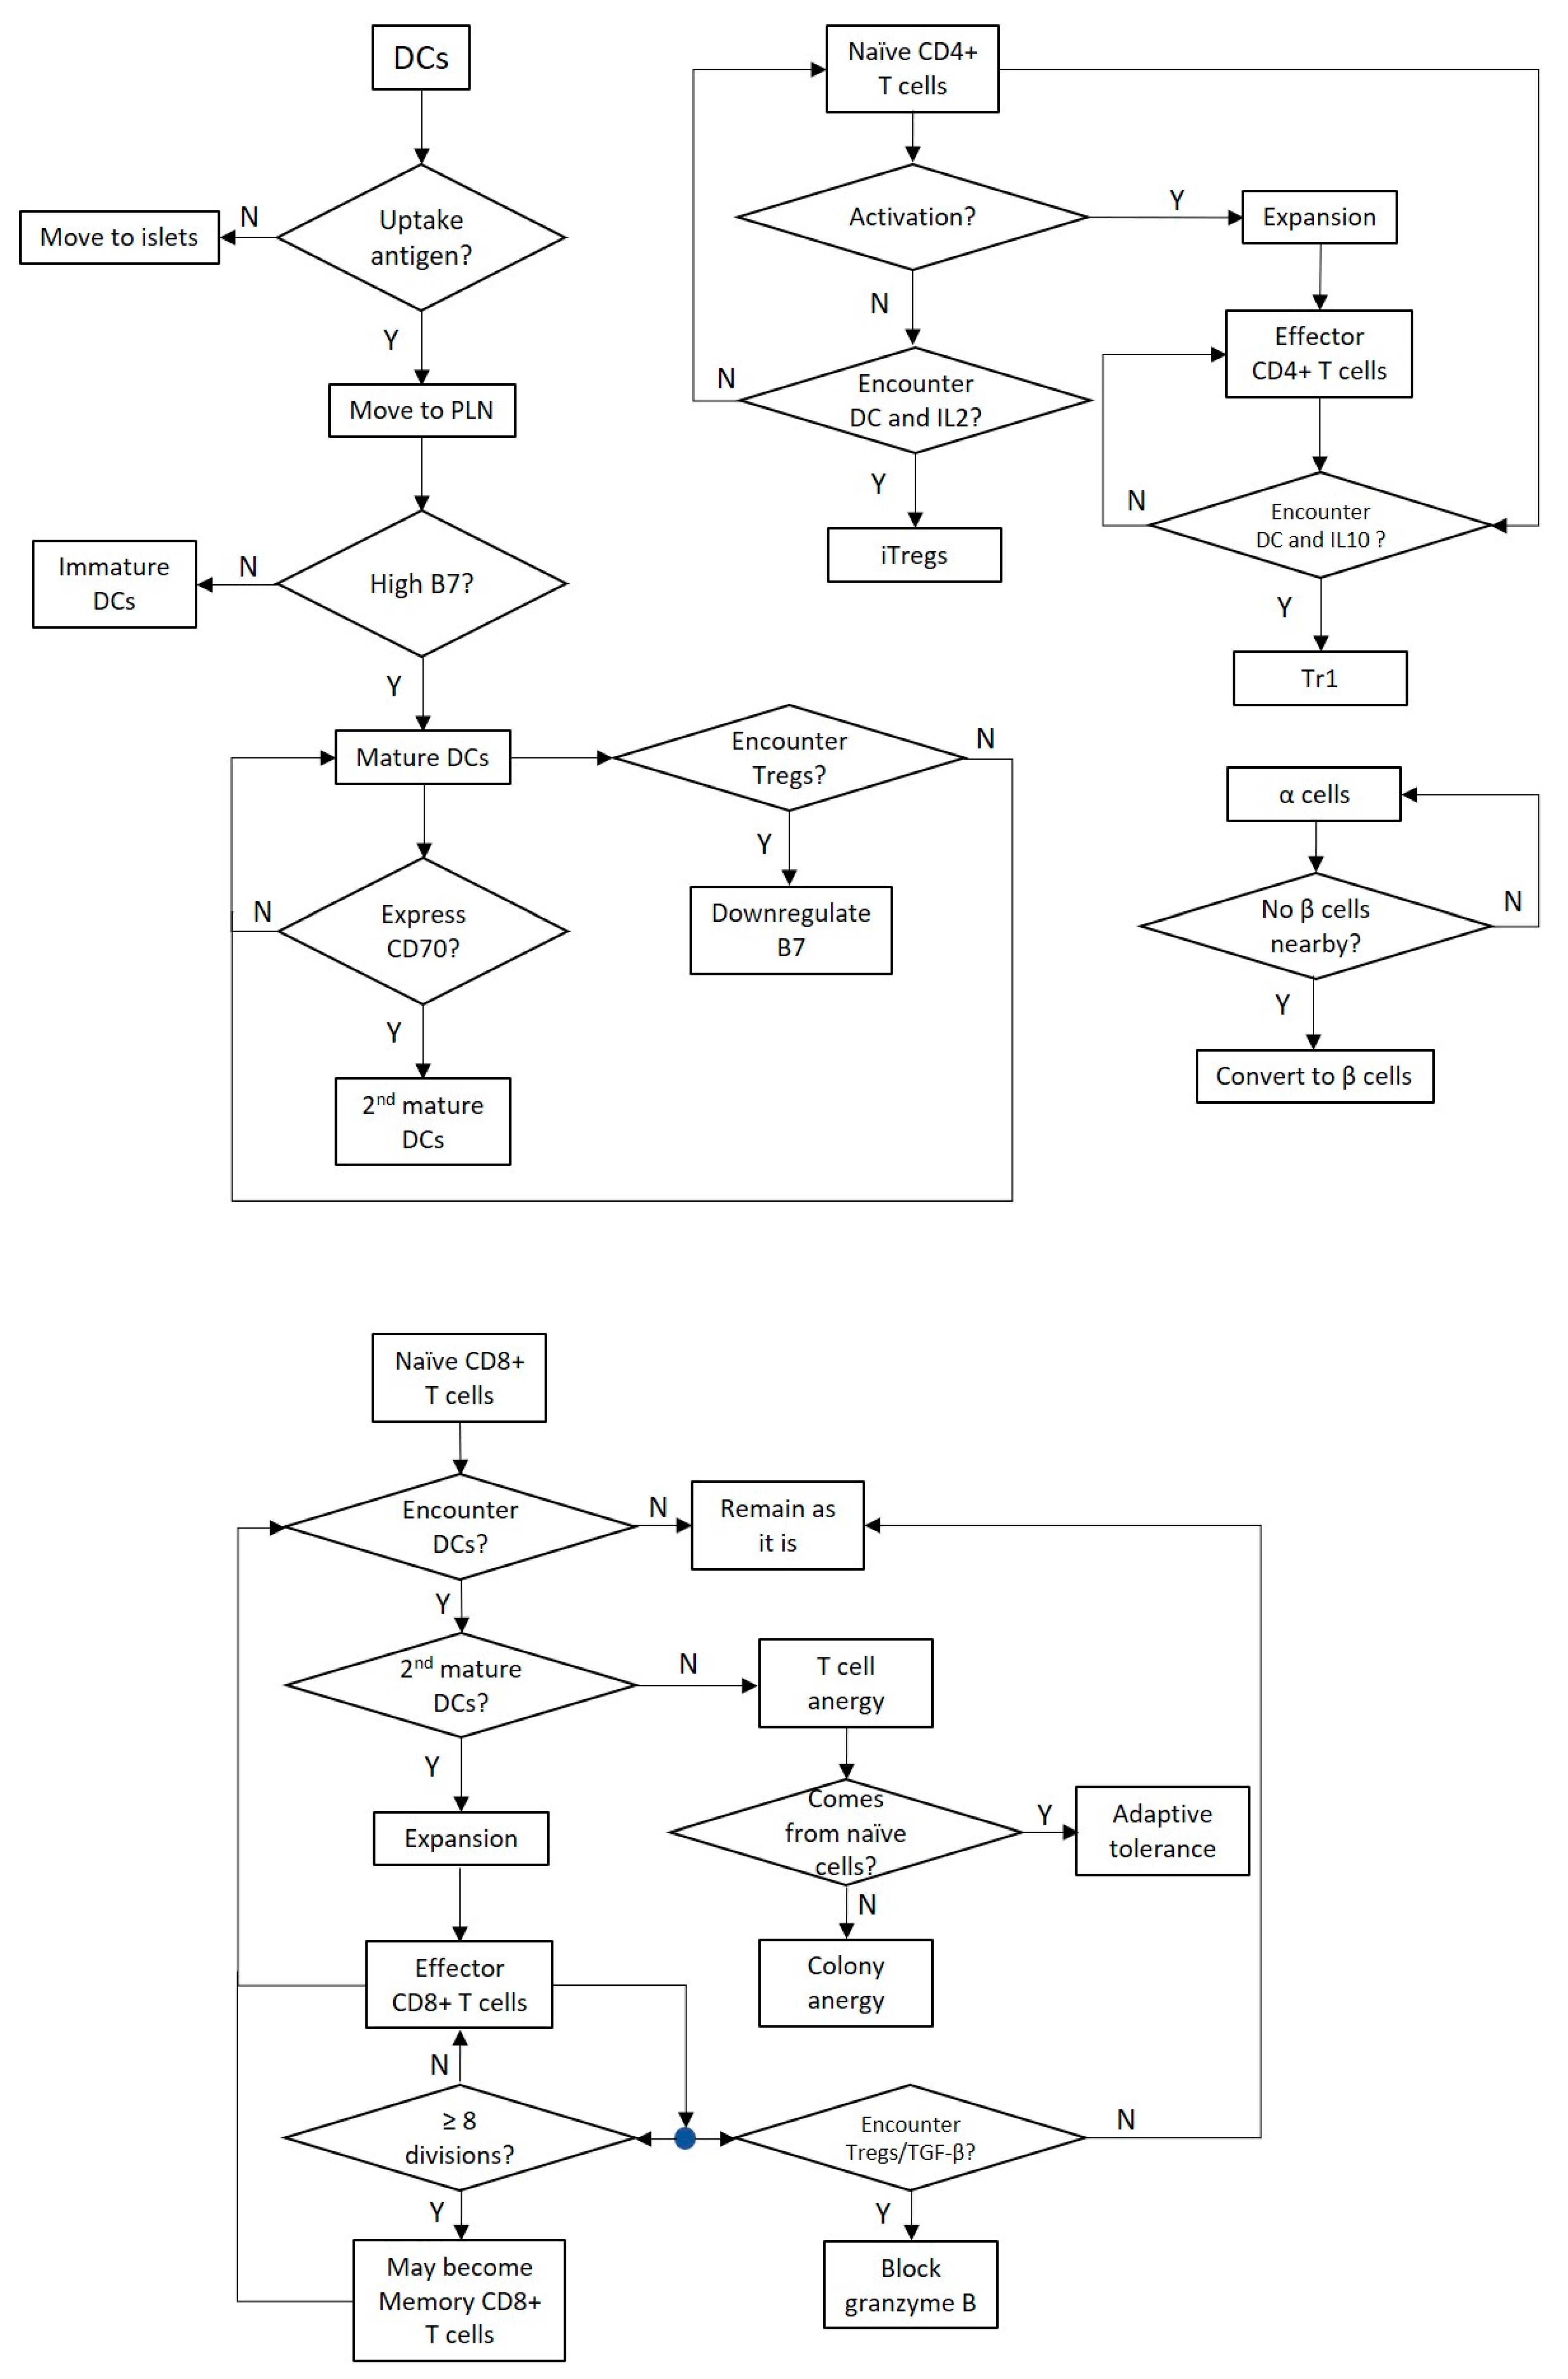
2.2. Dendritic Cells

Dendritic cells are one of the antigen-presenting cell types. DCs can be recruited to islets by monocyte chemoattractant protein (MCP) and macrophage inflammatory protein (MIP), which are secreted by β cells, endothelial cells, macrophages, DCs and lymphocytes [36,37,38]. The immature DCs in this model move toward the nearest islet, stop and secrete molecules to dissolve Basement membrane (BM) when they encounter it. After the BM is dissolved, they invade the islet and contact β cells.
After uptake of antigen, DCs migrate to lymph nodes through the afferent lymph [39], gradually go to maturation [40], and stimulate CD4+ and CD8+ T cells with/without the presence of regulatory T cells (Tregs) [24,41,42]. Lymphatic vessels are always located near blood vessels and close to the islets in mouse model and humans [36,43]. DCs migrate to lymphatic vessels through responding to the gradient of CCR7 ligands [44]. In steady-state tissue, the uptake of self-antigen by DCs can cause tolerance of autoreactive cells; in inflammation, they induce effector T cells [42]. The expression of costimulatory molecules on DCs is important for activation of T cells (both CD4+ and CD8+ T cell) [45,46]. Mature DCs express a high level of costimulatory molecules such as CD80/86 (B7-1/B7-2) and CD40, and produce IL-12 [40], while Tregs can downregulate CD80/86 on DCs to inhibit their maturation [47]. The CD27/CD70-interaction is important for priming CD8+ T cells [46,48]. The CD27 is expressed on CD8+ T cells while the CD70 is expressed by DCs under the help of CD4+ T cells [49]. Therefore, only the mature DCs can activate CD4+ T cells and the mature DCs with the help of CD4+ T cells can successfully activate CD8+ T cells (Figure 2). The number of DCs in pancreatic tissue was kept constant in the early period of islet destruction and moderately increased in the later period (Table 2).

2.3. CD8+ T Cells

CD8+ T cells can kill β cells via direct contact or cytokine secretion [50] under complete activation. Their killing ability (55%), motility pattern (random walk) and proliferation behavior (naïve T cell → effector T cell → memory T cell) are similar to our previous model [16]. CD8+ T cell activation occurs in pancreatic lymph node. When their activation is not complete (i.e., when they encounter DCs with low costimulatory molecules), they go to anergy [51]. Activated T cells with clonal anergy are inhibited in their proliferation but maintain their destructive function on β cells, while naïve T cells with adaptive tolerance reduce their proliferation rate and weaken their killing ability [51] (Table 3). Besides, the complete activation of memory cells also needs the help of costimulatory molecules. If memory cells are not completely activated, their progenies would lose their ability to survive under second stimulation [52].

2.4. CD4+ T Cells

CD4+ helper T cells (Th cells) help CD8+ T cell activation via CD40 pathway [48,49,52,53]. CD4+ T cells express CD40L which can bind to CD40 on DCs [54], and then DCs are induced to express CD70 [49] which affect CD8+ T cell responses [48]. Besides, IL-2 secreted by CD4+ T cells is needed in iTregs conversion [55].
Tregs with CD4+ Foxp3+/Foxp3 can inhibit inflammation through many pathways, such as targeting DCs, secreting inhibitory cytokines, and producing Granzyme B/A to kill effector T cells directly [56]. In this model, several pathways were implemented (Figure 2). First, the killing capacity of CD8+ T cells can be inhibited by contacting Tregs within the presence of Transforming Growth Factor-β (TGF-β) [57]. Secondly, Tregs downregulate the expression of B7 on the surface of DCs [47] and maintain immaturity of DCs [58]. Third, IL-10 which is secreted by Tregs can induce naïve CD4+ T cells and destructive CD4+ T cells to differentiate into induced-Tregs (iTregs) or Foxp3 IL-10+ regulatory Type-1 T cells (Tr1) [41].
Natural regulatory T cells (nTregs) mature in thymus while iTregs differentiate from naïve CD4+ T cells [41,59,60]. iTregs is induced from naïve CD4+ T cells under the presence of TGF-β and IL-2 [55]. In this model, we assume that there is enough TGF-β in the environment. Besides, Tr1 can be induced from CD4+ T cells under the presence of IL-10 [61]. In this model, the Tregs include nTregs and iTregs (including Tr1) (Table 4). Tregs can also migrate into pancreatic tissue [27,62].

2.5. Compartments

Pancreatic lymph node (PLN): Antigen presentation to T cells first happens in PLN. This process involves different cell types and complex control (Figure 2 and Figure 3). nTregs exist in homeostasis and would expand themselves under the presence of DCs with high B7 (DCs-B7high). Activated Tregs migrate to DCs-B7high and then downregulate B7 expression, inhibiting DCs’ maturation. Tregs can inhibit the killing ability of progenies of naïve CD8+ T cells and the proliferation of effector T cells through inhibition of DCs, which lead to T cell anergy. If DCs with antigen successfully obtain high B7, they would activate naïve CD4+ T cells which then differentiate and expand effector CD4+ T cells. These effector T cells help DCs-B7high secrete CD70. Then the DCs can activate CD8+ T cells.
CD8+ T cells can be activated by mature DCs with the help of CD4+ T cells and expand effector CD8+ T cells (Figure 2 and Figure 3). However, if naïve CD4+ T cell activation occurs upon presence of IL-10 (secreted by Tregs), they would differentiate to Tr1 (also secrete IL-10) [41]. After several proliferations, effector CD4+, CD8+ T cells and Tregs would migrate to tissue.
Pancreatic tissue: β cells can self-replicate when islets are under attack and α cells have the ability to convert to β cells. These are sources of new β cells during progression of disease. DCs take up antigen from islets in tissue and then migrate to lymph node, inducing adaptive immune response (Figure 2). Through TGF-β pathway, Tregs can also inhibit the killing ability of effector T cells.

3. Results

This model was used for simulating disease progress in mice model from 3-week age to 14-week age with or without Tregs. In Figure 4 and subsequent figures, the x-axis shows the time (days) from the beginning of the simulation (week 3). We use box-and-whisker plots to present the dynamics of immune response. Each case was performed through 15 repeated simulations. Boxes cover data from the first quartile to the third quartile, and circles show the median and whiskers show the locations of the maximum and minimum values. The variations in data are caused by from stochastic variations such as cell motility and killing probability.

3.1. Without Tregs

Figure 4 and Figure 5 depict the variation in different cells without Tregs in pancreatic tissue and in pancreatic lymph node. With the increase of effector CD8+ T cells, the number of β cells decrease starting from day 12 (Figure 4a,b). After a sharp decrease, β cells go to a gradually decreasing stage on day 18 when the number of effector CD8+ T cells decreases. Afterwards, the β cell count shows a small fluctuation during the decrease as a result of β cell regeneration and destructive function of CD8+ T cells. Memory CD8+ T cells descend from effector cells and can be reactivated to effector cells; therefore, they increase relatively later than effector CD8+ T cells and their numbers fluctuate.
Meanwhile, DCs which uptake antigen in pancreatic tissue migrate to lymph nodes. After maturation, they can stimulate the differentiation of naïve CD4+ T cells into effector CD4+ T cells. Therefore, the number of effector CD4+ T cells (Figure 5f) increases following the appearance of mature DCs (Figure 4f). The 2nd mature DCs represent mature DCs which were helped by effector CD4+ T cells and then can activate CD8+ T cells. Because in this model, the DCs which prefer to activate CD4+ T cells and the DCs which prefer to activate CD8+ T cells were represented by only one kind of DC agents, the 2nd mature DCs can also activate CD4+ T cells. The effector CD8+ T cells arise after day 10 (Figure 5b) after the emergence of 2nd mature DCs (~day 9) (Figure 4e). The number of memory CD8+ T cells in PLN goes up corresponding with the increase of effector CD8+ T cells. Although most of DCs are matured DCs, CD8+ T cells with colony anergy still arise (Figure 5d) because of the large number of effector CD8+ T cells. The anergic T cells with adaptive tolerance increase near the beginning of simulation (~day 7) due to the larger number of naive T cells at that time (Figure 5a).

3.2. Effect of Tregs

Tregs usually account for 5–10% of CD4+ T cells in lymph node [32]. In this model, the number of initial Tregs added also accounts for 10% of CD4+ T cells at the beginning of simulation. Besides, Tregs also can be descended from naive CD4+ T cells or effector CD4+ T cells under certain conditions [41]. The effect of Tregs on the progression of diabetes is shown in Figure 6 and Figure 7. In pancreatic tissue, β cells were rarely attacked by effector CD8+ T cells. The number of effector CD8+ T cells (maximal median: 0; box: 0~340) in pancreatic tissue (Figure 6b) was much less than that (maximal median: 1000; box: 200~2000) in the case without Tregs (Figure 4b), and CD8+ T cells disappear after several weeks. In lymph nodes, following the rise of mature DCs in several phases (e.g., day 7~8, day 25~27, day 43~55) shown in Figure 6, the activated Tregs and effector CD4+ T cells increased (Figure 7e,f). The multiple waves of mature DCs observed in Figure 6f is related to the number of activated Tregs (Figure 7e). When the number of Tregs becomes small, the probability of increase in mature DCs is high. Also, the 2nd mature DCs which can activate CD8+ T cells scarcely appear. Note that, effector CD8+ T cells in PLN arise on day 11 in several simulations, the 2nd mature DCs also appeared close to this time although they cannot be observed in the Figure 6. Day 45~55, the fact that the 2nd mature DCs increase but the effector CD8+ T cells cannot be observed may be attributed to the decreased naive CD8+ T cells and reduced encounter probability. With the presence of Tregs, the reduction in naive CD8+ T cells is consistent with increase of anergic T cells (Figure 7a,d); therefore, they primarily convert to anergic T cells in this scenario.

3.3. Effects of Tregs from Different Sources

Tregs come from two sources: resident Tregs and induced Tregs from CD4+ T cells. To check their individual effect on immune response, we block one of them in specific simulations. We can observe that the results of the case with only resident Tregs (Figure A1 and Figure A2 in Appendix A, case III) is similar to the case with both resident and induced Tregs (Figure 6 and Figure 7, case II). This could be due to the number of Tregs satisfying the condition to inhibit the activation of CD8+ T cells. However, after day 50, the peak of activated Tregs is about 10,000 in case II and it is only ~4500 in case III. This difference could contribute to the addition of induced Tregs. Note that, the effector CD4+ T cells show the 4th wave in the case without induced Tregs (Figure A2f), while there is no 4th wave in the case with induced Tregs (Figure 7f). This could be attributed to the possibility that induction of Tregs from CD4+ T cells reduce the probability of effector cell differentiation from CD4+ T cells. For the case with only induced Tregs (Figure A3 and Figure A4), the effector CD8+ T cells first increase and kill β cells, then Tregs converted from CD4+ T cells gradually increase. Tregs without activation appear first on approximately day 12 and keep a low level until day 40, and the activated Tregs first arise after day 15. After day 45, the activated Tregs increase appreciably. The number of 2nd mature DCs remains low on day 20~40 and day 47~77 which may be affected by Tregs. The increase in 2nd mature DCs on around day 45 could be due to the abrupt DC increase in tissue (Table 2), as well as the deficiency of activated Tregs at same time. And then, the production of effector CD8+ T cells are relatively inhibited and β cells gradually recover (Figure A3 and Figure A4).
Tregs inhibit immune response through two pathways in this model: inhibiting DCs to further inhibit CD8+ T cells and directly inhibiting CD8+ T cells’ destructive function. The inhibition of DCs maturation would inhibit the effector T cells, while the direct inhibition by Tregs inhibit their killing ability. To test this effect on immune response, the inhibition through DCs was blocked. Figure A5 and Figure A6 show the results. The effector CD8+ T cells increase in pancreatic tissue during day 12~35, leading to decrease of β cell at the same time. The peak of effector CD8+ T cells appeared on day 25, however, the β cells on day 25 did not decrease. The reason is shown on Figure A6f, almost all effector CD8+ T cells in pancreatic tissue were inhibited directly by Tregs, and these deactivated cells cannot secrete granzyme to kill β cells. The peaks of effector CD8+ T cells (Figure A5b and Figure A6b) are relatively lower than the case without Tregs (Figure 4b and Figure 5b). In this case, Tregs lose the function of downregulating costimulatory molecules on DCs, but they remain capable of tracking DCs in a small area. The occupied space near DCs may reduce the contact probability between CD4/8+ T cells and DCs. β cells decrease and finally recover, which shows downregulation of costimulatory molecules can partly prevent β cell destruction.

3.4. External Addition of Tregs

Based on the first case, where no Tregs exist in PLN and tissue and the ability of CD4+ T cells conversion to Tregs is blocked, we add Tregs at 8-week age and let the Tregs keep the lowest level. And then we can observe that the 2nd mature DCs were inhibited (Figure 8e) accompanied with activated Tregs increase (Figure 9b). Similarly, effector CD4+ T cells and effector CD8+ T cells were both inhibited after Tregs arise (Figure 5b,f and Figure 9c,d). As a result, the β cells in tissue recovered quickly and kept a relatively constant number during the rest of simulation (Figure 8a). Therefore, the Tregs added in the middle phase can successfully inhibit new effector CD8+ T cell production and keep a protective environment for β cell regeneration.

4. Discussion

This work simulates immune response in mice from 3-weeks old to 14-weeks old. DCs and macrophages can be observed early in pancreatic tissue at 3-week old mice [63] and T cells can be observed at 4th week [30]. Here the effector CD8+ T cells arise in pancreatic tissue approximately 10 days after beginning of the simulation (week 3) (Figure 4 and Figure 8), using about one week for presenting antigen, expansion and migration. In experiments, Treg-deficiency can lead to much more CD4+ T cell proliferation [64] and variations in the ratio of Tregs to CD8+ T cells can suppress T cell proliferation in different degrees [3]. For our model, in the case without Tregs (Section 3.1), the effector CD4+ T cells can increase to 2000~4000 cells (Figure 5f) and CD8+ T cells can reach to 2000 in lymph node (Figure 5b), while they are reduced in the case with Tregs (Section 3.2) to 500~1500 for CD4+ T cells and 0~20 for CD8+ T cells in PLN (Figure 7f,b). The results suggest that Tregs partially inhibit effector CD4+ T cell production and largely inhibit effector CD8+ T cell proliferation, relatively matching with experiment results.
In the case without induced Tregs, the cell behavior and number variations are similar to the case with Tregs and there is no β cell damage and T cells are inhibited (Figure A1 and Figure A2). When there are only induced Tregs (Figure A3 and Figure A4), they cannot inhibit T cell expansion in the former phase, however, they gradually inhibit destructive T cells in later phase with increase of Tregs. Compared to the case with external addition of Tregs (Section 3.4), they cannot effectively prevent β cell damage (Figure A3) by T cells at the beginning of apparent Treg increase (day 15~40) (Figure A4e,f). The first peak of activated Treg number after day 45 is ~700 (Figure A4f) while in Section 3.4 the peak reaches to ~1200 cells (Figure 9b). This may be caused by the number deficiency in Tregs without activation at the time they were activated.
In Section 3.4, after the Tregs were added to the system, they inhibit 2nd mature DCs production (Figure 8e) and effectively prevent the increase in CD8+ T cells (Figure 9c). This work did not consider the effect of tertiary lymphoid organ (TLO), which can recruit and activate naive T cells in inflammatory tissue [65]. Although the experiment by Lee et al. [65] shows it can replace PLN to induce disease after 16 weeks, the naive T cells appear in inflammatory tissue far earlier than this time [30]. The Tregs intervention can effectively prevent effector T cells produced in PLN, but its effect on this structure was not determined.
When Tregs function that downregulate the expression of costimulatory molecules CD80/86 on DCs (case V, Figure A5 and Figure A6) is blocked, the β cell damage by CD8+ T cells cannot be effectively inhibited. In this work, β cells can recover quickly to maintain intact islets because the rules of regeneration rate chosen here is relatively high (recovery within two weeks). Although there are 2nd wave of effector CD8+ T cells, they did not significantly reduce the number of β cells. The large increase in DCs induce a large increase in Tregs. Although these Tregs cannot downregulate costimulatory molecules on DCs, it seems that the occupation of DC neighbor space effectively separate DCs and CD8/4+ T cells.
The α cells can convert to β cells [29,66,67], and since they are not targeted by T cells, they provide β cells a good source for regeneration. Even in the case without Tregs, they continuously convert to β cells. However, the consecutive generated β cells lead to the long-term existence of effector T cells in inflammatory tissue. And these effector T cells prevent more neogenic β generation. In case VI, with the help of Tregs, β cell population can go back to its initial number by high-speed regeneration. Induction of conversion from α cell to β cell and promotion of β regeneration could be a good treatment for T1D. Considering that neogenic β cell may lead to more lymphocytes, Tregs can inhibit antigen presentation by DCs to some extent and provide a better environment for islet recovery (neogenesis of β cell and BM reconstruction). Therefore, considering the treatment of this disease, combining Tregs intervention and promotion of β cell regeneration may be a good way to recover healthy islet function.
The pathogenesis of T1D is very complex. It involves many kinds of lymphocytes and antigen presenting cells. This work only focused on DC-CD8+ T cell pathway in immune response. B cellscan also stimulate CD4+ T cells and activate CD8+ T cells with expression of CD40. Macrophages can present antigen, help to recruit DCs, and secrete molecules to kill β cells. There are several pathways (DC/B-CD8+ T cell, CD/B-CD4+ T cell, and macrophage pathway) to kill β cells. They are cross-linked and the study of each pathway is necessary. In the future, the other pathway to kill β cells and their regulation would be implemented, such as B cells and their regulation, more functions of Tregs, and other functions of CD4+ T cells with/without macrophages.

5. Conclusions

An ABM is developed for simulating different cell interactions during the potential periods of disease progression in T1D. The Tregs that exist in the immune system can regulate the number and function of effector T cells. α cells could be a good source for β cell regeneration. Tregs intervention shows effective prevention of new waves of effector T cells which bring a good environment for β cell recovery in treatment of disease. Simulations with various conditions can provide insight about potential treatments can may be more promising in slowing β cell death and promote β cell regeneration.

Author Contributions

All authors contributed to the initial design and subsequent development of the model. Q.X. developed code to run simulations and analyzed results from them. M.C.O. provided support for code validation. All authors drafted, edited the manuscript.

Funding

This research was funded by National Science Foundation [IIS-1125412].

Acknowledgments

This research is partially supported by National Science Foundation (IIS-1125412).

Conflicts of Interest

The authors declare no conflict of interest.

Appendix A

Figure A1. Simulation results for case with initial Tregs (case III). There are initial Tregs but no conversion ability of CD4+ T cells. The number of (a) β cells, (b) effector CD8+ T cells, (c) memory CD8+ T cells- in pancreatic tissue are shown on the left column. The number of (d) total DCs, (e) 2nd mature DCs, (f) mature DCs in PLN are shown on the right column. Inserts (number of cells vs. time) show small change of cell number in the bottom figures. t = 0 days correspond to 3-week age of mouse.
Processes 06 00141 g0a1
Figure A2. Simulation results for case with initial Tregs (case III). There are initial Tregs but no conversion ability of CD4+ T cells. The number of (a) naive CD8+ T cells, (b) effector CD8+ T cells, (c) memory CD8+ T cells, (d) CD8+ T cells with adaptive tolerance, (e) activated Tregs, (f) effector CD4+ T cells in PLN are shown. Inserts (number of cells vs. time) show small change of cell number in the bottom figures. t = 0 days correspond to 3-week age of mouse.
Processes 06 00141 g0a2
Figure A3. Simulation results for case with induced Tregs (case IV). There are no initial Tregs but conversion ability of CD4+ T cells. The number of (a) β cells, (b) effector CD8+ T cells, (c) memory CD8+ T cells- in pancreatic tissue are shown on the left column. The number of (d) total DCs, (e) 2nd mature DCs, (f) mature DCs in PLN are shown on the right column. Inserts (number of cells vs. time) show small change of cell number in the bottom figures. t = 0 days correspond to 3-week age of mouse.
Processes 06 00141 g0a3
Figure A4. Simulation results for case with induced Tregs (case IV). There are no initial Tregs but conversion ability of CD4+ T cells. The number of (a) naive CD8+ T cells, (b) effector CD8+ T cells, (c) CD8+ T cells with colony anergy, (d) CD8+ T cells with adaptive tolerance, (e) unactivated Tregs, (f) activated Tregs in PLN are shown. Inserts (number of cells vs. time) show small change of cell number in the bottom figures. t = 0 days correspond to 3-week age of mouse.
Processes 06 00141 g0a4
Figure A5. Simulation results for case without inhibiting DCs (case V). Tregs cannot inhibit DCs but can directly inhibit T cells. The number of (a) β cells, (b) effector CD8+ T cells, (c) memory CD8+ T cells- in pancreatic tissue are shown on the left column. The number of (d) total DCs, (e) 2nd mature DCs, (f) mature DCs in PLN are shown on the right column. Inserts (number of cells vs. time) show small change of cell number in the bottom figures. t = 0 days correspond to 3-week age of mouse.
Processes 06 00141 g0a5
Figure A6. Simulation results for case without inhibiting DCs (case V). Tregs cannot inhibit DCs but can directly inhibit T cells. The number of (a) naive CD8+ T cells, (b) effector CD8+ T cells, (c) CD8+ T cells with colony anergy, (d) CD8+ T cells with adaptive tolerance, (e) activated Tregs in PLN and the number of (f) deactivated CD8+ T cells in pancreatic tissue are shown. t = 0 days correspond to 3-week age of mouse.
Processes 06 00141 g0a6

References

  1. ElEssawy, B.; Li, X.C. Type 1 diabetes and T regulatory cells. Pharmacol. Res. 2015, 98, 22–30. [Google Scholar] [CrossRef] [PubMed]
  2. Morel, P.A. Dendritic cell subsets in type 1 diabetes: Friend or foe? Front. Immunol. 2013, 4, 415. [Google Scholar] [CrossRef] [PubMed]
  3. Piccirillo, C.A.; Shevach, E.M. Cutting edge: Control of CD8+ T cell activation by CD4+ CD25+ immunoregulatory cells. J. Immunol. 2001, 167, 1137–1140. [Google Scholar] [CrossRef] [PubMed]
  4. Waid, D.M.; Vaitaitis, G.M.; Pennock, N.D.; Wagner, D.H., Jr. Disruption of the homeostatic balance between autoaggressive (CD4+ CD40+) and regulatory (CD4+ CD25+ FoxP3+) T cells promotes diabetes. J. Leukoc. Biol. 2008, 84, 431–439. [Google Scholar] [CrossRef] [PubMed]
  5. Bluestone, J.A.; Buckner, J.H.; Fitch, M.; Gitelman, S.E.; Gupta, S.; Hellerstein, M.K.; Herold, K.C.; Lares, A.; Lee, M.R.; Li, K.; et al. Type 1 diabetes immunotherapy using polyclonal regulatory T cells. Sci. Transl. Med. 2015, 7, 315ra189. [Google Scholar] [CrossRef] [PubMed]
  6. Zhao, Y.; Lin, B.; Darflinger, R.; Zhang, Y.; Holterman, M.J.; Skidgel, R.A. Human cord blood stem cell-modulated regulatory T lymphocytes reverse the autoimmune-caused type 1 diabetes in nonobese diabetic (NOD) mice. PLoS ONE 2009, 4, e4226. [Google Scholar] [CrossRef] [PubMed]
  7. Roncarolo, M.-G.; Battaglia, M. Regulatory T-cell immunotherapy for tolerance to self antigens and alloantigens in humans. Nat. Rev. Immunol. 2007, 7, 585–598. [Google Scholar] [CrossRef] [PubMed]
  8. The Mount Hood 4 Group. Computer modeling of diabetes and its complications. Diabetes Care 2007, 30, 1638–1646. [Google Scholar] [CrossRef] [PubMed]
  9. Balakrishnan, N.P.; Rangaiah, G.P.; Samavedham, L. Review and analysis of blood glucose (BG) models for type 1 diabetic patients. Ind. Eng. Chem. Res. 2011, 50, 12041–12066. [Google Scholar] [CrossRef]
  10. Henriksson, M.; Jindal, R.; Sternhufvud, C.; Bergenheim, K.; Sorstadius, E.; Willis, M. A systematic review of cost-effectiveness models in type 1 diabetes mellitus. Pharmacoeconomics 2016, 34, 569–585. [Google Scholar] [CrossRef] [PubMed]
  11. Makroglou, A.; Li, J.; Kuang, Y. Mathematical models and software tools for the glucose-insulin regulatory system and diabetes: An overview. Appl. Numer. Math. 2006, 56, 559–573. [Google Scholar] [CrossRef]
  12. Shoda, L.; Kreuwel, H.; Gadkar, K.; Zheng, Y.; Whiting, C.; Atkinson, M.; Bluestone, J.; Mathis, D.; Young, D.; Ramanujan, S. The type 1 diabetes physiolab® platform: A validated physiologically based mathematical model of pathogenesis in the non-obese diabetic mouse. Clin. Exp. Immunol. 2010, 161, 250–267. [Google Scholar] [CrossRef] [PubMed]
  13. Martínez, I.V.; Hernando, M.E.; Gómez, E.J.; Villares, R.; Mellado, M. Definition of an agent-based model of the autoimmune response in type 1 diabetes. In Proceedings of the 7th Iberian Conference on Information Systems and Technologies (CISTI 2012), Madrid, Spain, 20–23 June 2012; pp. 1–4. [Google Scholar]
  14. Wedgwood, K.C.; Richardson, S.J.; Morgan, N.G.; Tsaneva-Atanasova, K. Spatiotemporal dynamics of insulitis in human type 1 diabetes. Front. Physiol. 2016, 7, 633. [Google Scholar] [CrossRef] [PubMed]
  15. Bonabeau, E. Agent-based modeling: Methods and techniques for simulating human systems. Proc. Natl. Acad. Sci. USA 2002, 99, 7280–7287. [Google Scholar] [CrossRef] [PubMed] [Green Version]
  16. Ozturk, M.C.; Xu, Q.; Cinar, A. Agent-based modeling of the interaction between CD8+ T cells and beta cells in type 1 diabetes. PLoS ONE 2018, 13, e0190349. [Google Scholar] [CrossRef] [PubMed]
  17. Collier, N.; North, M. Repast HPC: A platform for large-scale agent-based modeling. In Large-Scale Computing; Dubitzky, W., Kurowski, K., Schott, B., Eds.; John Wiley & Sons, Inc.: New York, NY, USA, 2012. [Google Scholar]
  18. Zhang, X.; Giangreco, L.; Broome, H.E.; Dargan, C.M.; Swain, S.L. Control of CD4 effector fate: Transforming growth factor beta 1 and interleukin 2 synergize to prevent apoptosis and promote effector expansion. J. Exp. Med. 1995, 182, 699–709. [Google Scholar] [CrossRef] [PubMed]
  19. Den Braber, I.; Mugwagwa, T.; Vrisekoop, N.; Westera, L.; Mogling, R.; de Boer, A.B.; Willems, N.; Schrijver, E.H.; Spierenburg, G.; Gaiser, K.; et al. Maintenance of peripheral naive T cells is sustained by thymus output in mice but not humans. Immunity 2012, 36, 288–297. [Google Scholar] [CrossRef] [PubMed]
  20. Matheu, M.P.; Othy, S.; Greenberg, M.L.; Dong, T.X.; Schuijs, M.; Deswarte, K.; Hammad, H.; Lambrecht, B.N.; Parker, I.; Cahalan, M.D. Imaging regulatory T cell dynamics and CTLA4-mediated suppression of T cell priming. Nat. Commun. 2015, 6, 6219. [Google Scholar] [CrossRef] [PubMed] [Green Version]
  21. Schmitz, I.; Krueger, A.; Baumann, S.; Schulze-Bergkamen, H.; Krammer, P.H.; Kirchhoff, S. An IL-2-dependent switch between CD95 signaling pathways sensitizes primary human T cells toward CD95-mediated activation-induced cell death. J. Immunol. 2003, 171, 2930–2936. [Google Scholar] [CrossRef] [PubMed]
  22. Coppieters, K.; Amirian, N.; von Herrath, M. Intravital imaging of CTLs killing islet cells in diabetic mice. J. Clin. Investig. 2012, 122, 119–131. [Google Scholar] [CrossRef] [PubMed] [Green Version]
  23. Kinjyo, I.; Qin, J.; Tan, S.Y.; Wellard, C.J.; Mrass, P.; Ritchie, W.; Doi, A.; Cavanagh, L.L.; Tomura, M.; Sakaue-Sawano, A.; et al. Real-time tracking of cell cycle progression during CD8+ effector and memory T-cell differentiation. Nat. Commun. 2015, 6, 6301. [Google Scholar] [CrossRef] [PubMed]
  24. Bousso, P. T-cell activation by dendritic cells in the lymph node: Lessons from the movies. Nat. Rev. Immunol. 2008, 8, 675–684. [Google Scholar] [CrossRef] [PubMed]
  25. Kamath, A.T.; Henri, S.; Battye, F.; Tough, D.F.; Shortman, K. Developmental kinetics and lifespan of dendritic cells in mouse lymphoid organs. Blood 2002, 100, 1734–1741. [Google Scholar] [PubMed]
  26. Coppieters, K.; Martinic, M.M.; Kiosses, W.B.; Amirian, N.; Herrath, M.V. A novel technique for the in vivo imaging of autoimmune diabetes development in the pancreas by two-photon microscopy. PLoS ONE 2010, 5, e15732. [Google Scholar] [CrossRef] [PubMed] [Green Version]
  27. Fisson, S.; Darrasse-Jeze, G.; Litvinova, E.; Septier, F.; Klatzmann, D.; Liblau, R.; Salomon, B.L. Continuous activation of autoreactive CD4+ CD25+ regulatory T cells in the steady state. J. Exp. Med. 2003, 198, 737–746. [Google Scholar] [CrossRef] [PubMed]
  28. Yamazaki, S.; Iyoda, T.; Tarbell, K.; Olson, K.; Velinzon, K.; Inaba, K.; Steinman, R.M. Direct expansion of functional CD25+ CD4+ regulatory T cells by antigen-processing dendritic cells. J. Exp. Med. 2003, 198, 235–247. [Google Scholar] [CrossRef] [PubMed]
  29. Chung, C.H.; Hao, E.; Piran, R.; Keinan, E.; Levine, F. Pancreatic β-cell neogenesis by direct conversion from mature alpha-cells. Stem Cells 2010, 28, 1630–1638. [Google Scholar] [CrossRef] [PubMed]
  30. Magnuson, A.M.; Thurber, G.M.; Kohler, R.H.; Weissleder, R.; Mathis, D.; Benoist, C. Population dynamics of islet-infiltrating cells in autoimmune diabetes. Proc. Natl. Acad. Sci. USA 2015, 112, 1511–1516. [Google Scholar] [CrossRef] [PubMed] [Green Version]
  31. Chintinne, M.; Stange, G.; Denys, B.; Ling, Z.; Veld, P.I.; Pipeleers, D. Beta cell count instead of beta cell mass to assess and localize growth in beta cell population following pancreatic duct ligation in mice. PLoS ONE 2012, 7, e43959. [Google Scholar] [CrossRef] [PubMed]
  32. Wing, K.; Sakaguchi, S. Regulatory t cells exert checks and balances on self tolerance and autoimmunity. Nat. Immunol. 2010, 11, 7–13. [Google Scholar] [CrossRef] [PubMed]
  33. Wu, J.; Yang, X.; Chen, B.; Xu, X. Pancreas β cell regeneration and type 1 diabetes (review). Exp. Ther. Med. 2015, 9, 653–657. [Google Scholar] [CrossRef] [PubMed]
  34. Collombat, P.; Xu, X.; Ravassard, P.; Sosa-Pineda, B.; Dussaud, S.; Billestrup, N.; Madsen, O.D.; Serup, P.; Heimberg, H.; Mansouri, A. The ectopic expression of pax4 in the mouse pancreas converts progenitor cells into α and subsequently β cells. Cell 2009, 138, 449–462. [Google Scholar] [CrossRef] [PubMed]
  35. Marcela, B.; Michael, J.F.; Wendell, E.N.; Anita, C.; Boaz, H.; David, M.H.; Alvin, C.P. Assessment of human pancreatic islet architecture and composition by laser scanning confocal microscopy. J. Histochem. Cytochem. 2005, 53, 1087–1097. [Google Scholar] [CrossRef]
  36. Korsgren, E.; Korsgren, O. An apparent deficiency of lymphatic capillaries in the islets of langerhans in the human pancreas. Diabetes 2016, 65, 1004–1008. [Google Scholar] [CrossRef] [PubMed]
  37. Dieu, M.-C.; Vanvervliet, B.; Vicari, A.; Bridon, J.-M.; Oldham, E.; Ait-Yahia, S.; Briere, F.; Zlotnik, A.; Lebecque, S.; Caux, C. Selective recruitment of immature and mature dendritic cells by distinct chemokines expressed in different anatomic sites. J. Exp. Med. 1998, 188, 373–386. [Google Scholar] [CrossRef] [PubMed]
  38. Caux, C.; Vanbervliet, B.; Massacrier, C.; Ait-Yahia, S.; Vaure, C.; Chemin, K.; Dieu-Nosjean, M.-C.; Vicari, A. Regulation of dendritic cell recruitment by chemokines. Transplantation 2002, 73, S7–S11. [Google Scholar] [CrossRef] [PubMed]
  39. Caux, C.; Dubois, B. Antigen uptake by dendritic cells. Methods Mol. Med. 2001, 64, 369–376. [Google Scholar] [CrossRef] [PubMed]
  40. Banchereau, J.; Steinman, R.M. Dendritic cells and the control of immunity. Nature 1998, 392, 245–252. [Google Scholar] [CrossRef] [PubMed]
  41. Pletinckx, K.; Dohler, A.; Pavlovic, V.; Lutz, M.B. Role of dendritic cell maturity/costimulation for generation, homeostasis, and suppressive activity of regulatory T cells. Front. Immunol. 2011, 2, 39. [Google Scholar] [CrossRef] [PubMed]
  42. Price, J.D.; Tarbell, K.V. The role of dendritic cell subsets and innate immunity in the pathogenesis of type 1 diabetes and other autoimmune diseases. Front. Immunol. 2015, 6, 288. [Google Scholar] [CrossRef] [PubMed]
  43. Regoli, M.; Bertelli, E.; Orazioli, D.; Fonzi, L.; Bastianini, A. Pancreatic lymphatic system in rodents. Anat. Rec. 2011, 263, 155–160. [Google Scholar] [CrossRef] [PubMed]
  44. Randolph, G.J.; Angeli, V.; Swartz, M.A. Dendritic-cell trafficking to lymph nodes through lymphatic vessels. Nat. Rev. Immunol. 2005, 5, 617–628. [Google Scholar] [CrossRef] [PubMed]
  45. Vasilevko, V.; Ghochikyan, A.; Holterman, M.J.; Agadjanyan, M.G. CD80 (B7-1) and CD86 (B7-2) are functionally equivalent in the initiation and maintenance of CD4+ T-cell proliferation after activation with suboptimal doses of PHA. DNA Cell Biol. 2002, 21, 137–149. [Google Scholar] [CrossRef] [PubMed]
  46. Schildknecht, A.; Miescher, I.; Yagita, H.; van den Broek, M. Priming of CD8+ T cell responses by pathogens typically depends on CD70-mediated interactions with dendritic cells. Eur. J. Immunol. 2007, 37, 716–728. [Google Scholar] [CrossRef] [PubMed]
  47. Onishi, Y.; Fehervari, Z.; Yamaguchi, T.; Sakaguchi, S. Foxp3+ natural regulatory T cells preferentially form aggregates on dendritic cells in vitro and actively inhibit their maturation. Proc. Natl. Acad. Sci. USA 2008, 105, 10113–10118. [Google Scholar] [CrossRef] [PubMed]
  48. Taraban, V.Y.; Rowley, T.F.; Al-Shamkhani, A. Cutting edge: A critical role for CD70 in CD8 T cell priming by CD40-licensed APCs. J. Immunol. 2004, 173, 6542–6546. [Google Scholar] [CrossRef] [PubMed]
  49. Sanchez, P.J.; McWilliams, J.A.; Haluszczak, C.; Yagita, H.; Kedl, R.M. Combined TLR/CD40 stimulation mediates potent cellular immunity by regulating dendritic cell expression of CD70 in vivo. J. Immunol. 2007, 178, 1564–1572. [Google Scholar] [CrossRef] [PubMed]
  50. Eizirik, D.L.; Mandrup-Poulsen, T. A choice of death-the signal-transduction of immune-mediated beta-cell apoptosis. Diabetologia 2001, 44, 2115–2133. [Google Scholar] [CrossRef] [PubMed]
  51. Schwartz, R.H. T cell anergy. Annu. Rev. Immunol. 2003, 21, 305–334. [Google Scholar] [CrossRef] [PubMed]
  52. Feau, S.; Garcia, Z.; Arens, R.; Yagita, H.; Borst, J.; Schoenberger, S.P. The CD4+ T-cell help signal is transmitted from APC to CD8+ T-cells via CD27-CD70 interactions. Nat. Commun. 2012, 3, 948. [Google Scholar] [CrossRef] [PubMed]
  53. Bevan, M.J. Helping the CD8+ T-cell response. Nat. Rev. Immunol. 2004, 4, 595–602. [Google Scholar] [CrossRef] [PubMed]
  54. Van Kooten, C.; Banchereau, J. CD40-CD40 ligand. J. Leukoc. Biol. 2000, 67, 2–17. [Google Scholar] [CrossRef] [PubMed] [Green Version]
  55. Davidson, T.S.; DiPaolo, R.J.; Andersson, J.; Shevach, E.M. Cutting edge: IL-2 is essential for TGF-β-mediated induction of Foxp3+ T regulatory cells. J. Immunol. 2007, 178, 4022–4026. [Google Scholar] [CrossRef] [PubMed]
  56. Vignali, D.A.; Collison, L.W.; Workman, C.J. How regulatory T cells work. Nat. Rev. Immunol. 2008, 8, 523–532. [Google Scholar] [CrossRef] [PubMed] [Green Version]
  57. Mempel, T.R.; Pittet, M.J.; Khazaie, K.; Weninger, W.; Weissleder, R.; von Boehmer, H.; von Andrian, U.H. Regulatory T cells reversibly suppress cytotoxic T cell function independent of effector differentiation. Immunity 2006, 25, 129–141. [Google Scholar] [CrossRef] [PubMed]
  58. Par, S.; Amrani, A.; Yamanouchi, J.; Han, B.; Thiessen, S.; Utsugi, T.; Verdaguer, J.; Santamaria, P. CD40 ligation releases immature dendritic cells from the control of regulatory CD4+ CD25+ T cells. Immunity 2003, 19, 877–889. [Google Scholar] [CrossRef]
  59. Belkaid, Y. Regulatory T cells and infection: A dangerous necessity. Nat. Rev. Immunol. 2007, 7, 875–888. [Google Scholar] [CrossRef] [PubMed]
  60. Sakaguchi, S.; Yamaguchi, T.; Nomura, T.; Ono, M. Regulatory t cells and immune tolerance. Cell 2008, 133, 775–787. [Google Scholar] [CrossRef] [PubMed]
  61. Roncarolo, M.G.; Gregori, S.; Battaglia, M.; Bacchetta, R.; Fleischhauer, K.; Levings, M.K. Interleukin-10-secreting type 1 regulatory T cells in rodents and humans. Immunol. Rev. 2006, 212, 28–50. [Google Scholar] [CrossRef] [PubMed]
  62. Burzyn, D.; Benoist, C.; Mathis, D. Regulatory T cells in nonlymphoid tissues. Nat. Immunol. 2013, 14, 1007–1013. [Google Scholar] [CrossRef] [PubMed] [Green Version]
  63. Bluestone, J.A.; Herold, K.; Eisenbarth, G. Genetics, pathogenesis and clinical interventions in type 1 diabetes. Nature 2010, 464, 1293–1300. [Google Scholar] [CrossRef] [PubMed]
  64. Tang, Q.; Adams, J.Y.; Tooley, A.J.; Bi, M.; Fife, B.T.; Serra, P.; Santamaria, P.; Locksley, R.M.; Krummel, M.F.; Bluestone, J.A. Visualizing regulatory T cell control of autoimmune responses in nonobese diabetic mice. Nat. Immunol. 2006, 7, 83–92. [Google Scholar] [CrossRef] [PubMed]
  65. Lee, Y.; Chin, R.K.; Christiansen, P.; Sun, Y.; Tumanov, A.V.; Wang, J.; Chervonsky, A.V.; Fu, Y.X. Recruitment and activation of naive T cells in the islets by lymphotoxin β receptor-dependent tertiary lymphoid structure. Immunity 2006, 25, 499–509. [Google Scholar] [CrossRef] [PubMed]
  66. Thorel, F.; Népote, V.; Avril, I.; Kohno, K.; Desgraz, R.; Chera, S.; Herrera, P.L. Conversion of adult pancreatic α-cells to β-cells after extreme β-cell loss. Nature 2010, 464, 1149–1154. [Google Scholar] [CrossRef] [PubMed] [Green Version]
  67. Zhang, Y.; Fava, G.E.; Wang, H.; Mauvais-Jarvis, F.; Fonseca, V.A.; Wu, H. PAX4 gene transfer induces α-to-β cell phenotypic conversion and confers therapeutic benefits for diabetes treatment. Mol. Ther. 2016, 24, 251–260. [Google Scholar] [CrossRef] [PubMed]
Figure 1. Islet cell arrangement in two-dimensional space grid. α cells (red circle) surround β cells (green circle) and Basement Membrane (BM) (brown dot) encloses all the cells. Islets present core-mantle structure. Color bar shows strength value of BM during disease progression during a simulation.
Processes 06 00141 g001
Figure 2. Schematic diagram of cell interactions in pancreatic lymph node (PLN) and pancreatic tissue in the agent-based modeling (ABM). In the beginning, DCs take up antigen from β cells and then migrate to lymph node. Meanwhile, they produce more B7 and go to maturation. Then, mature dendritic cells (DCs) activate naive CD4+ T cells which subsequently differentiated into effector CD4+ T cells. With the help of the effector CD4+ T cells, mature DCs can activate naive CD8+ T cells (These DCs are called 2nd mature DCs in this model). Similarly, when the memory CD8+ T cell are activated, they need the help of effector CD4+ T cells. These effector CD4+ and CD8+ T cells would migrate to pancreatic tissue after several proliferations. In pancreatic tissue, the effector CD8+ T cells kill β cells. In response, β cells start to replicate and α cells also convert to β cells. Regulatory T cells (Tregs) can downregulate B7, induce CD4+ T cell to Tregs by secreting molecules, and inhibit CD8+ T cell function directly.
Processes 06 00141 g002
Figure 3. The flow chart of cell agent behaviors.
Processes 06 00141 g003
Figure 4. Simulation results for case without Tregs (case I). There are no initial Tregs and also no conversion ability of CD4+ T cells. The number of (a) β cells, (b) effector CD8+ T cells, (c) memory CD8+ T cells- in pancreatic tissue are shown on the left column. The number of (d) total DCs, (e) 2nd mature DCs, (f) mature DCs in PLN are shown on the right column. Inserts (number of cells vs. time) show small change of cell number in the bottom figures. t = 0 days correspond to 3-week age of mouse.
Processes 06 00141 g004
Figure 5. Simulation results for case without Tregs (case I). The number of (a) naive CD8+ T cells, (b) effector CD8+ T cells, (c) memory CD8+ T cells, (d) CD8+ T cells with colony anergy, (e) CD8+ T cells with adaptive tolerance, (f) effector CD4+ T cells in PLN are shown. Inserts (number of cells vs. time) show small change of cell number in the bottom figures. t = 0 day corresponds to 3-week age of mouse.
Processes 06 00141 g005
Figure 6. Simulation results for case with Tregs (case II). There are initial Tregs and conversion ability of CD4+ T cells. The number of (a) β cells, (b) effector CD8+ T cells, (c) memory CD8+ T cells- in pancreatic tissue are shown on the left column. The number of (d) total DCs, (e) 2nd mature DCs, (f) mature DCs in PLN are shown on the right column. Inserts (number of cells vs. time) show small change of cell number in the bottom figures. t = 0 day corresponds to 3-week age of mouse.
Processes 06 00141 g006
Figure 7. Simulation results for case with Tregs (case II). The number of (a) naive CD8+ T cells, (b) effector CD8+ T cells, (c) memory CD8+ T cells, (d) CD8+ T cells with adaptive tolerance, (e) activated Tregs, (f) effector CD4+ T cells in PLN are shown. Inserts (number of cells vs. time) show small change of number. t = 0 day corresponds to 3-week age of mouse.
Processes 06 00141 g007
Figure 8. Simulation results for case with Tregs intervention (case VI). There are no initial Tregs and also no conversion ability of CD4+ T cells. Tregs were added at 8th week. The number of (a) β cells, (b) effector CD8+ T cells, (c) memory CD8+ T cells- in pancreatic tissue are shown on the left column. The number of (d) total DCs, (e) 2nd mature DCs, (f) mature DCs in PLN are shown on the right column. Inserts (number of cells vs. time) show small change of cell number in the bottom figures. t = 0 days correspond to 3-week age of mouse.
Processes 06 00141 g008
Figure 9. Simulation results for case with Tregs intervention (case VI). Tregs were added at 8th week. The number of (a) unactivated Tregs, (b) activated Tregs, (c) effector CD8+ T cells, (d) effector CD4+ T cells in PLN are shown. t = 0 days correspond to 3-week age of mouse.
Processes 06 00141 g009
Table 1. The parameters of spaces and cell agents.
Cells/Micro-OrganInitial Amount 1Lifespan (Days)Move Speed (µm/min)Proliferation Rate (hours/cell)
EffectorNaivePLN 2Tissue
CD4+ T cells15766 [18]27 [19]15 3 [20] 1036
CD8+ T cells6766 [21]70 [19]15 [22]10 [22]~14.3 [23]
DCs63 d in PLN [24,25]7.55 [26]/
Tregs1765 d61 [27]15 [20]1036 [28]
β cells/islets~1100/11//42 4 [29]
1 The amount proportionally reduced according to [19,30,31,32]; 2 Pancreatic lymph node. 3 2µm/min less than Tregs [20], to simplify model we set same speed with Tregs; 4 Adjust cell-cycle to satisfy that islet can recover within 2 weeks.
Table 2. The number of DCs in pancreatic tissue.
Week3~99~1010~1212~14
DC number (cell) 1668136170
1 Calculated approximately from [30].
Table 3. Properties of anergic T cell [51,52].
TypeAffected CellEffector FunctionProliferationReactivation
Clonal anergyActivated T cellNormalInhibited/
Adaptive toleranceNaïve T cellReduce killing probability to 10%3 times longer cell cyclePersist under strong stimulation
Death under weak stimulation
Table 4. IL-10 producing (activated) Treg sources [41].
SourcesCondition
nTregsDendritic cell (DC) with strong B7
Naive CD4+ T cellsStep 1 DC with weak B7 and IL-2
Step 2 DC with strong B7
Naive CD4+ T cellsDC with strong B7 and IL-10
Effector CD4+ T cellsDC with strong B7 and IL-10

