Article

Systematic Design and Evaluation of an Extraction Process for Traditionally Used Herbal Medicine on the Example of Hawthorn (Crataegus monogyna JACQ.)

Institute for Separation and Process Technology, Clausthal University of Technology, 38678 Clausthal-Zellerfeld, Germany
*
Author to whom correspondence should be addressed.
Processes 2018, 6(7), 73; https://doi.org/10.3390/pr6070073
Submission received: 29 May 2018 / Revised: 7 June 2018 / Accepted: 19 June 2018 / Published: 21 June 2018

Abstract

:
Traditionally used herbal medicines are deep in the consciousness of patients for the treatment of only minor diseases by self-medication. However, manufacturers of herbal medicinal products suffer from major problems such as increasing market pressure by e.g., the food supplement sector, increasing regulations, and costs of production. Moreover, due to more stringent regulation and approval processes, innovation is hardly observed, and the methods used in process development are outdated. Therefore, this study aims to provide an approach based on modern process engineering concepts and including predictive process modelling and simulation for the extraction of traditional herbal medicines as complex extracts. The commonly used solvent-based percolation is critically assessed and compared to the so-called pressurized hot water extraction (PHWE) as a new possible alternative to replace organic solvents. In the study a systematic process design for the extraction of hawthorn (Crataegus monogyna JACQ.) is shown. While for traditional percolation the solvent is optimized to a mixture of ethanol and water (70/30 v/v), the PHWE is run at a temperature of 90 °C. The extracts of various harvest batches are compared to a commercially available product based on a chromatographic fingerprint. For the first time, natural batch variability was successfully incorporated into the physico-chemical process modelling concept. An economic feasibility study reveals that the PHWE is the best choice not only from a technical point of view but also from economic aspects.

1. Introduction

Herbal medicine is widely used to cure a myriad of diseases such as gastrointestinal complaints, high blood pressure, sore throat, colds, skin disorders and other sicknesses. They are considered to be natural, compatible and healthy. On account of its long tradition, the use and production of herbal medicine must not be overtaken by modern engineering technologies for production and quality management. Assessing small-molecule pharmaceuticals approved between 1981 and 2002 shows that approximately half are either natural products or natural product derivatives [1,2]. In the future, natural products will continue to play a major role as active substances, model molecules for the discovery and validation of drug targets [1].
Therefore, this paper highlights the systematic process development, simulation and cost assessment for a commonly used herbal drug represented by hawthorn (Crataegus monogyna JACQ.). The conventional solvent extraction is compared with the so-called pressurized hot water extraction (PHWE) [3,4,5,6] which shows significant potential for the eco-friendly and solvent-free extraction of plant matrices [3,4,6]. Hawthorn leaves are a representative system for a medical extract. It is used to treat cardiac insufficiency [7]. The flavonoid hyperoside is chosen as a marker substance. The extracts will be characterized by their content of hyperoside and the drug-extract ratio (DER). The DER is defined as the ratio between the plant material used for extraction and the amount of dry matter remaining in the fluid extract after the extraction process has taken place, according to Equation (1).
DER = m Plant m Dry   matter   :   1
Corresponding monographs in the European Pharmacopoeia define no specific DER for hawthorn extracts [8]. An overview of the drug market shows that common products are extracted within a range of DER values between 4–7:1 [9,10,11,12,13]. This range is therefore taken as a benchmark.

2. Material and Methods

2.1. Raw Material

Raw hawthorn leaves (Crataegus monogyna JACQ. folium cum flore) were purchased from CfM Oskar Tropitzsch (Markredwitz, Germany). The herb was ground to approximately 1 mm size prior to extraction in a knife mill Retsch® Grindomix® 200 (Haan, Germany). The plant material was stored in the refrigerator at −20 °C to minimize decomposition. Pure hyperoside was purchased from CfM Oskar Tropitzsch (Markredwitz, Germany), as well. The purity was >98%.

2.2. Solvent Screening

Solvent screening is performed in 50 mL Falcons® (VWR®, Darmstadt, Germany) using 3 g of ground plant material and 40 mL of solvent. The mixtures are agitated on a tilting table for 24 h before a sample is taken and analyzed. All solvents are in analytical grade.

2.3. Solid-Liquid Extraction

The conventional extraction is performed as maceration for the equilibrium measurements and as percolation for the determination of the extraction kinetics as well as the overall amount. The maceration device is a stirred tank of approximately 1.5 L. It is equipped with a three-way top were the joint in the middle is used to insert a stirrer, driven by a lab stirrer motor from IKA® (Staufen, Germany). A PTFE seal prevents solvent from leaking through the gap between the top and the vessel. The device can be tempered. Percolation is performed in a stainless steel tube equipped with frits to ensure proper solid retention during extraction. A P110 preparative HPLC pump from VWR® as well as a Foxy Jr. fraction collector are used. Both are controlled by the EZChrom Elite® HPLC Software (Agilent®, Santa Clara, CA, USA). The experimental setups have already been described by the authors [14,15].

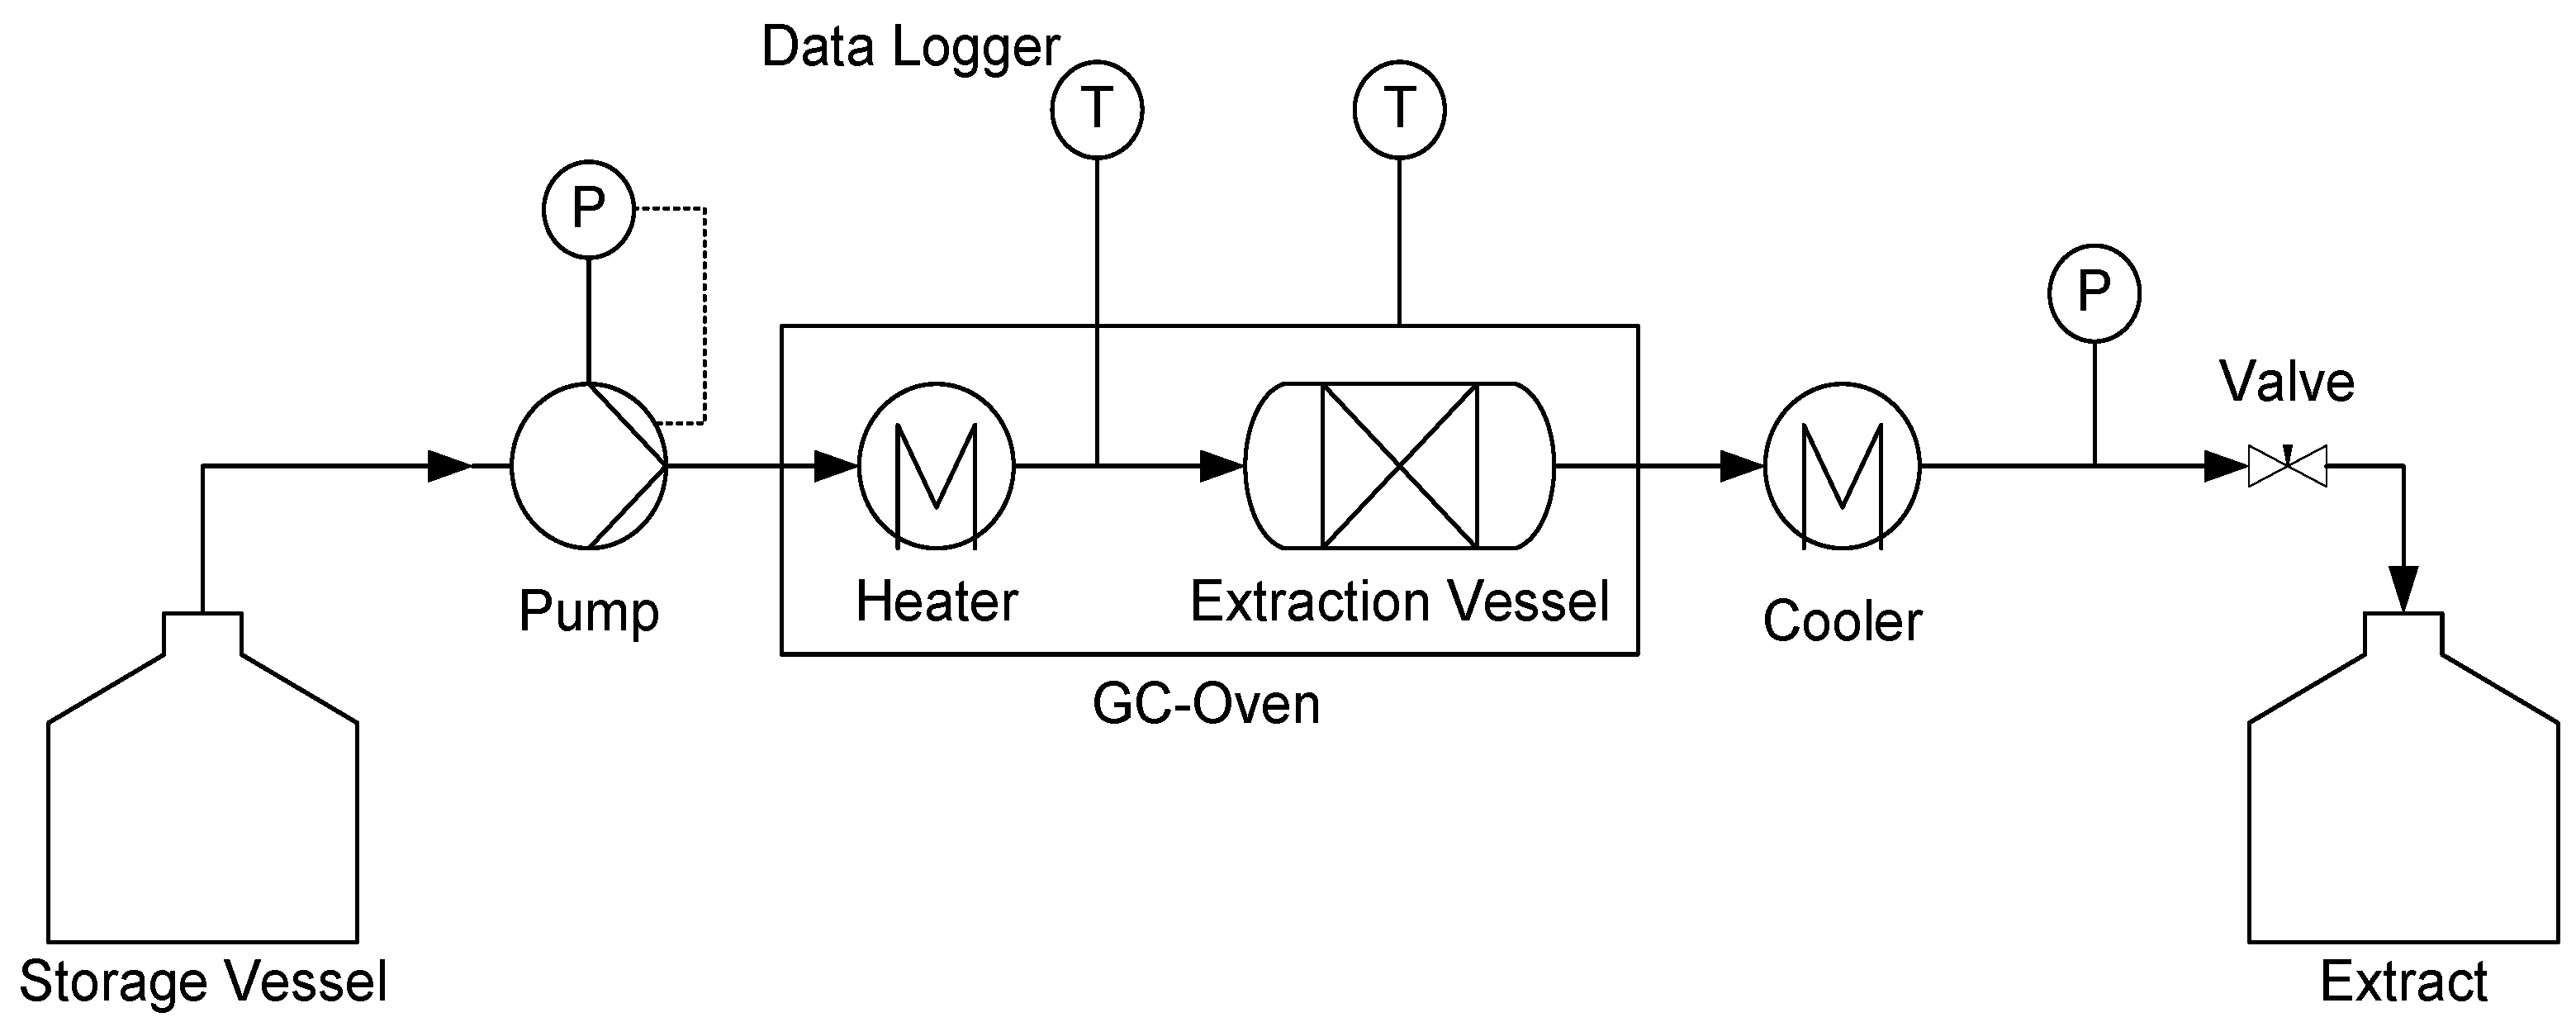
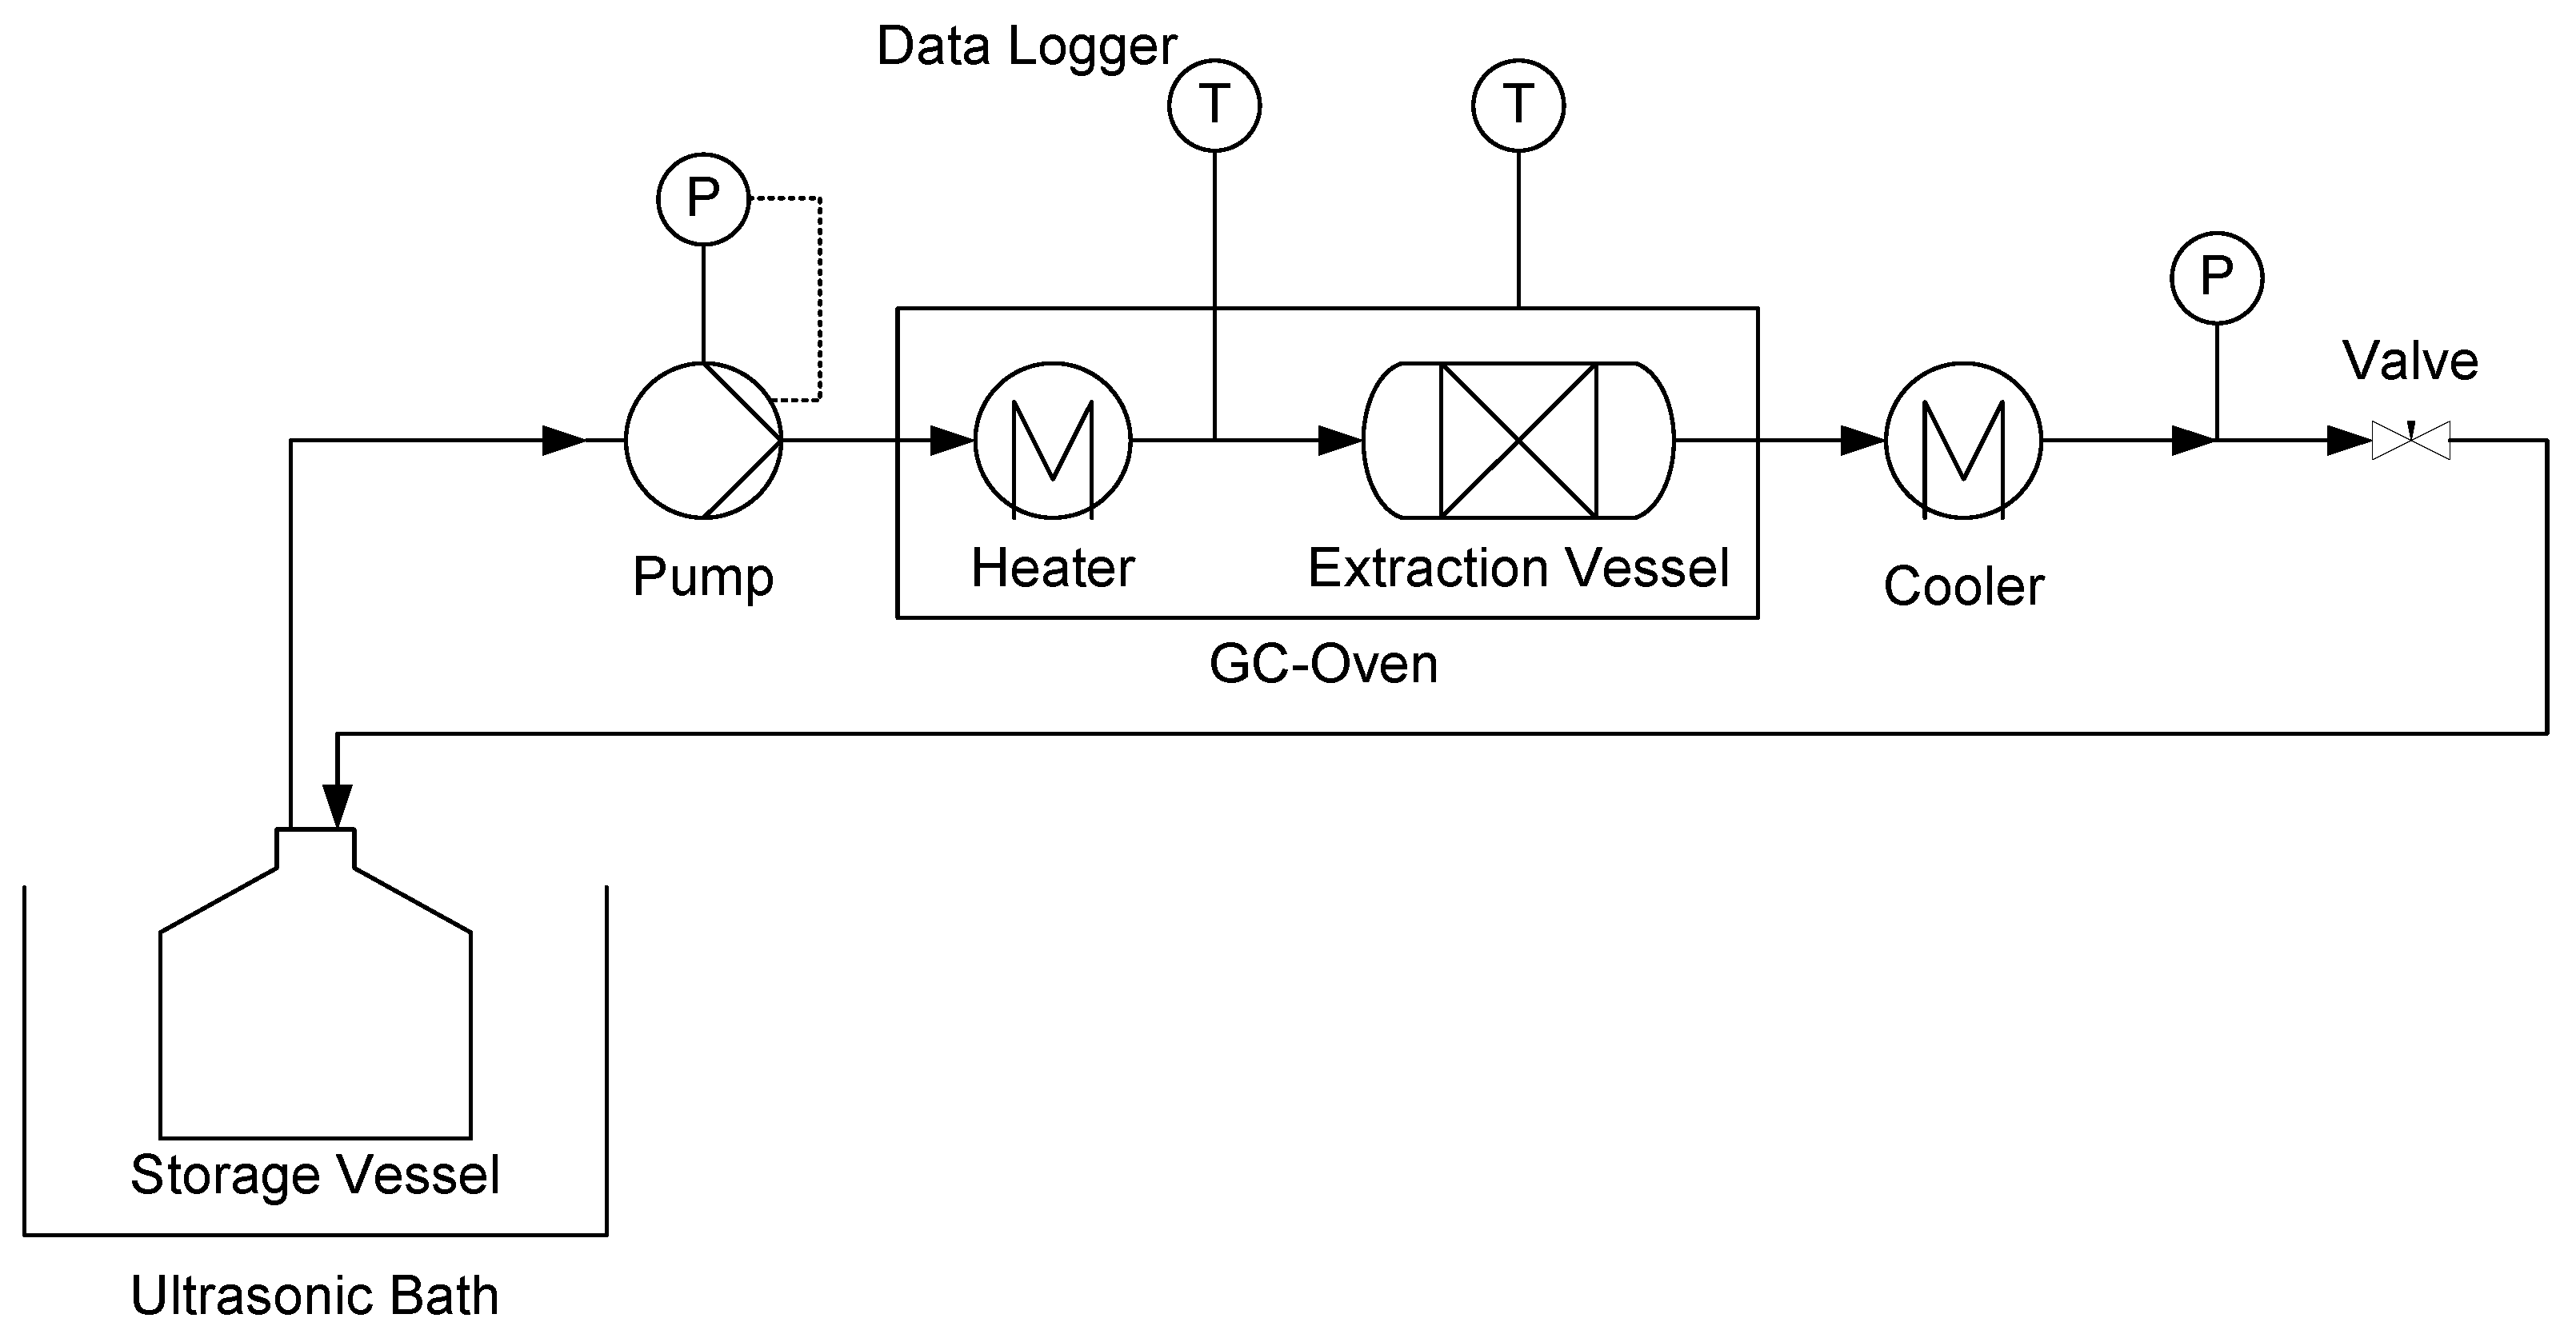
2.4. Pressurized Hot Water Extraction (PHWE)

The flow diagram of the PHWE equipment for batch extraction experiments is shown in Figure 1. The water is pumped from a storage vessel by a HPLC pump P130 from VWR® (Darmstadt, Germany) to the extraction column filled with ground plant material. The extraction column is made from stainless steel with 10 mm i.d. × 100 mm (approx. 7.85 mL). The column itself and a coil made of a steel capillary (length = 3 m, i.d. = 1 mm) are placed in a GC oven HP 5890 Series II Plus (Palo Alto, CA, USA) serving as heating device. The water is preheated in the coil before reaching the extraction column. The extract leaves the extraction column at the back-end where a filter frit serves for solid-liquid separation. The extract is transferred into a second coil for effective cooling (length = 3 m, i.d. = 1 mm). The pressure drop is adjusted by a valve to keep the water in liquid state.
To determine the thermal degradation of the investigated components during extraction, the milli-scale device is modified to operate in recycling mode. This setup is shown in Figure 2. The extract is transferred into the storage vessel (max. 100 mL) and is recycled during the whole process. Thus, the target component accumulates in the system and occurring degradation effects can be studied. The storage vessel itself is in an ultrasonic bath for mixing and avoiding possible agglomerates as well as concentration gradients inside the vessel.
Both setups have already been introduced by the authors [5,6].

2.5. Analytics

The analytics for hyperoside in the extract is performed by HPLC using an Elite LaChrom® (Agilent®, Santa Clara, CA, USA) device equipped with a diode array detector DAD-L 2455 from Hitachi® (Tokyo, Japan). The eluents are in analytical grade (VWR®, Darmstadt, Germany) and water is taken from a Sartorius® arium® pro (Göttingen, Germany). All samples are passed through a 0.2 µm syringe filter prior to analysis. Calibration was performed with external standards ordered from CfM Oskar Tropitzsch (Marktredwitz, Germany). The purity was greater 98%. The column was a 250-4 mm PharmPrep RP18 from Merck® (Darmstadt, Germany), the column temperature is 25 °C the flow rate is 1 mL/min and the isocratic eluent consists of methanol/acetonitrile/water (pH 2.5 with ortho-phosphoric acid) 16/21/63 v/v/v. The detection wavelength was 355 nm and the injection volume 5 µL. The chromatogram is shown in Figure 3. The coefficient of determination of the calibration was 0.99 and the limit of quantification 0.02 g/L. The side components (SCs) SC1 to SC3 are referred to the calibration of hyperoside and expressed as pseudo-concentrations. IR-spectroscopy was performed with a FTIR Bruker® alpha (Billerica, MA, USA). Principal Component Analysis was calculated using Unscrambler® X from Camo® (Oslo, Norway).

3. Results and Discussion

Remark. 
Every experiment is carried out in triplicates. The error bars represent the standard deviation of the measurements. If no error bars are visible they are within the symbol size of the individual data points.
The scope of this article is to introduce the reader to a modern process engineering attempt for the manufacturing of traditionally used herbal extracts including physico-chemical process modelling and experimental parameter determination on lab-scale. The benefits of the modelling and simulation approach for phytoextraction are documented in detail by various studies of the authors [5,6,14,15,16,17,18,19,20,21,22,23]. The cited articles focused mostly on the extraction of valuable compounds for plants in order to perform a further purification until a pure substance in pharma-grad is obtained, e.g., for 10-deacetylbaccatin III from yew [6,18] or artemisinin from annual mugworth [5]. In the present study, the engineering toolbox will be broadened to the processing of complex extracts that are characterized by marker substances and the DER in a regulated environment, within the area of conflict of being economical on the one side and fulfilling approvals on the other side. Therefore, modern and in-silico-based approaches are needed, especially if there is a new approval of existing processes considered to broaden the area of application or to just modernize the production procedure.
In general, solid-liquid extraction is described by several partial models. The corresponding equations and assumptions can be found in detail in the literature [14,15,17]. The mass balance in the liquid phase is described by the so-called distributed plug flow model (DPF). It serves for modeling the macroscopic mass transport in the percolation column. For the solid phase a pore diffusion model describes the mass transport in the plant material’s pores. The raw material’s residual load of target components and the corresponding extract’s concentration is accounted for by equilibrium curves. The target component’s mass balance in the fluid phase (Equation (2)) considers accumulation, axial dispersion, convective mass transport and mass transfer from the plant material’s pores into the bulk phase.
c L ( z , t ) t   =   D ax     2 c L ( z , t ) z 2     u z ε     c L ( z , t ) z     1 ε ε     k f     a P     [ c L ( z , t )     c P ( r , z , t ) ]  
Under the assumption of spherical particulates, the following equation can be derived as a mass balance for the target component in the plant material. The effective diffusion coefficient Deff must be measured by real extraction experiments.
q ( z , r , t ) t = D eff ( r ) ( 2 c P ( z , r , t ) r 2   +   2 r c P ( z , r , t ) r )   +   D eff ( r ) r c P ( z , r , t ) r
The adsorption/desorption equilibrium inside the pores is described through equilibrium curves. Herein q is the plant material’s residual load linking the equilibrium curve with the pore diffusion model. A well-known approach is e.g., the Langmuir-equilibrium. The parameters KL and qmax can be derived from measurements. The maximum load qmax is the total amount of the regarded target and side components. The equilibrium curves are measured with multistep macerations. The approach is described in detail in the literature [14,15].
q = q max K L     c 1 + K L     c

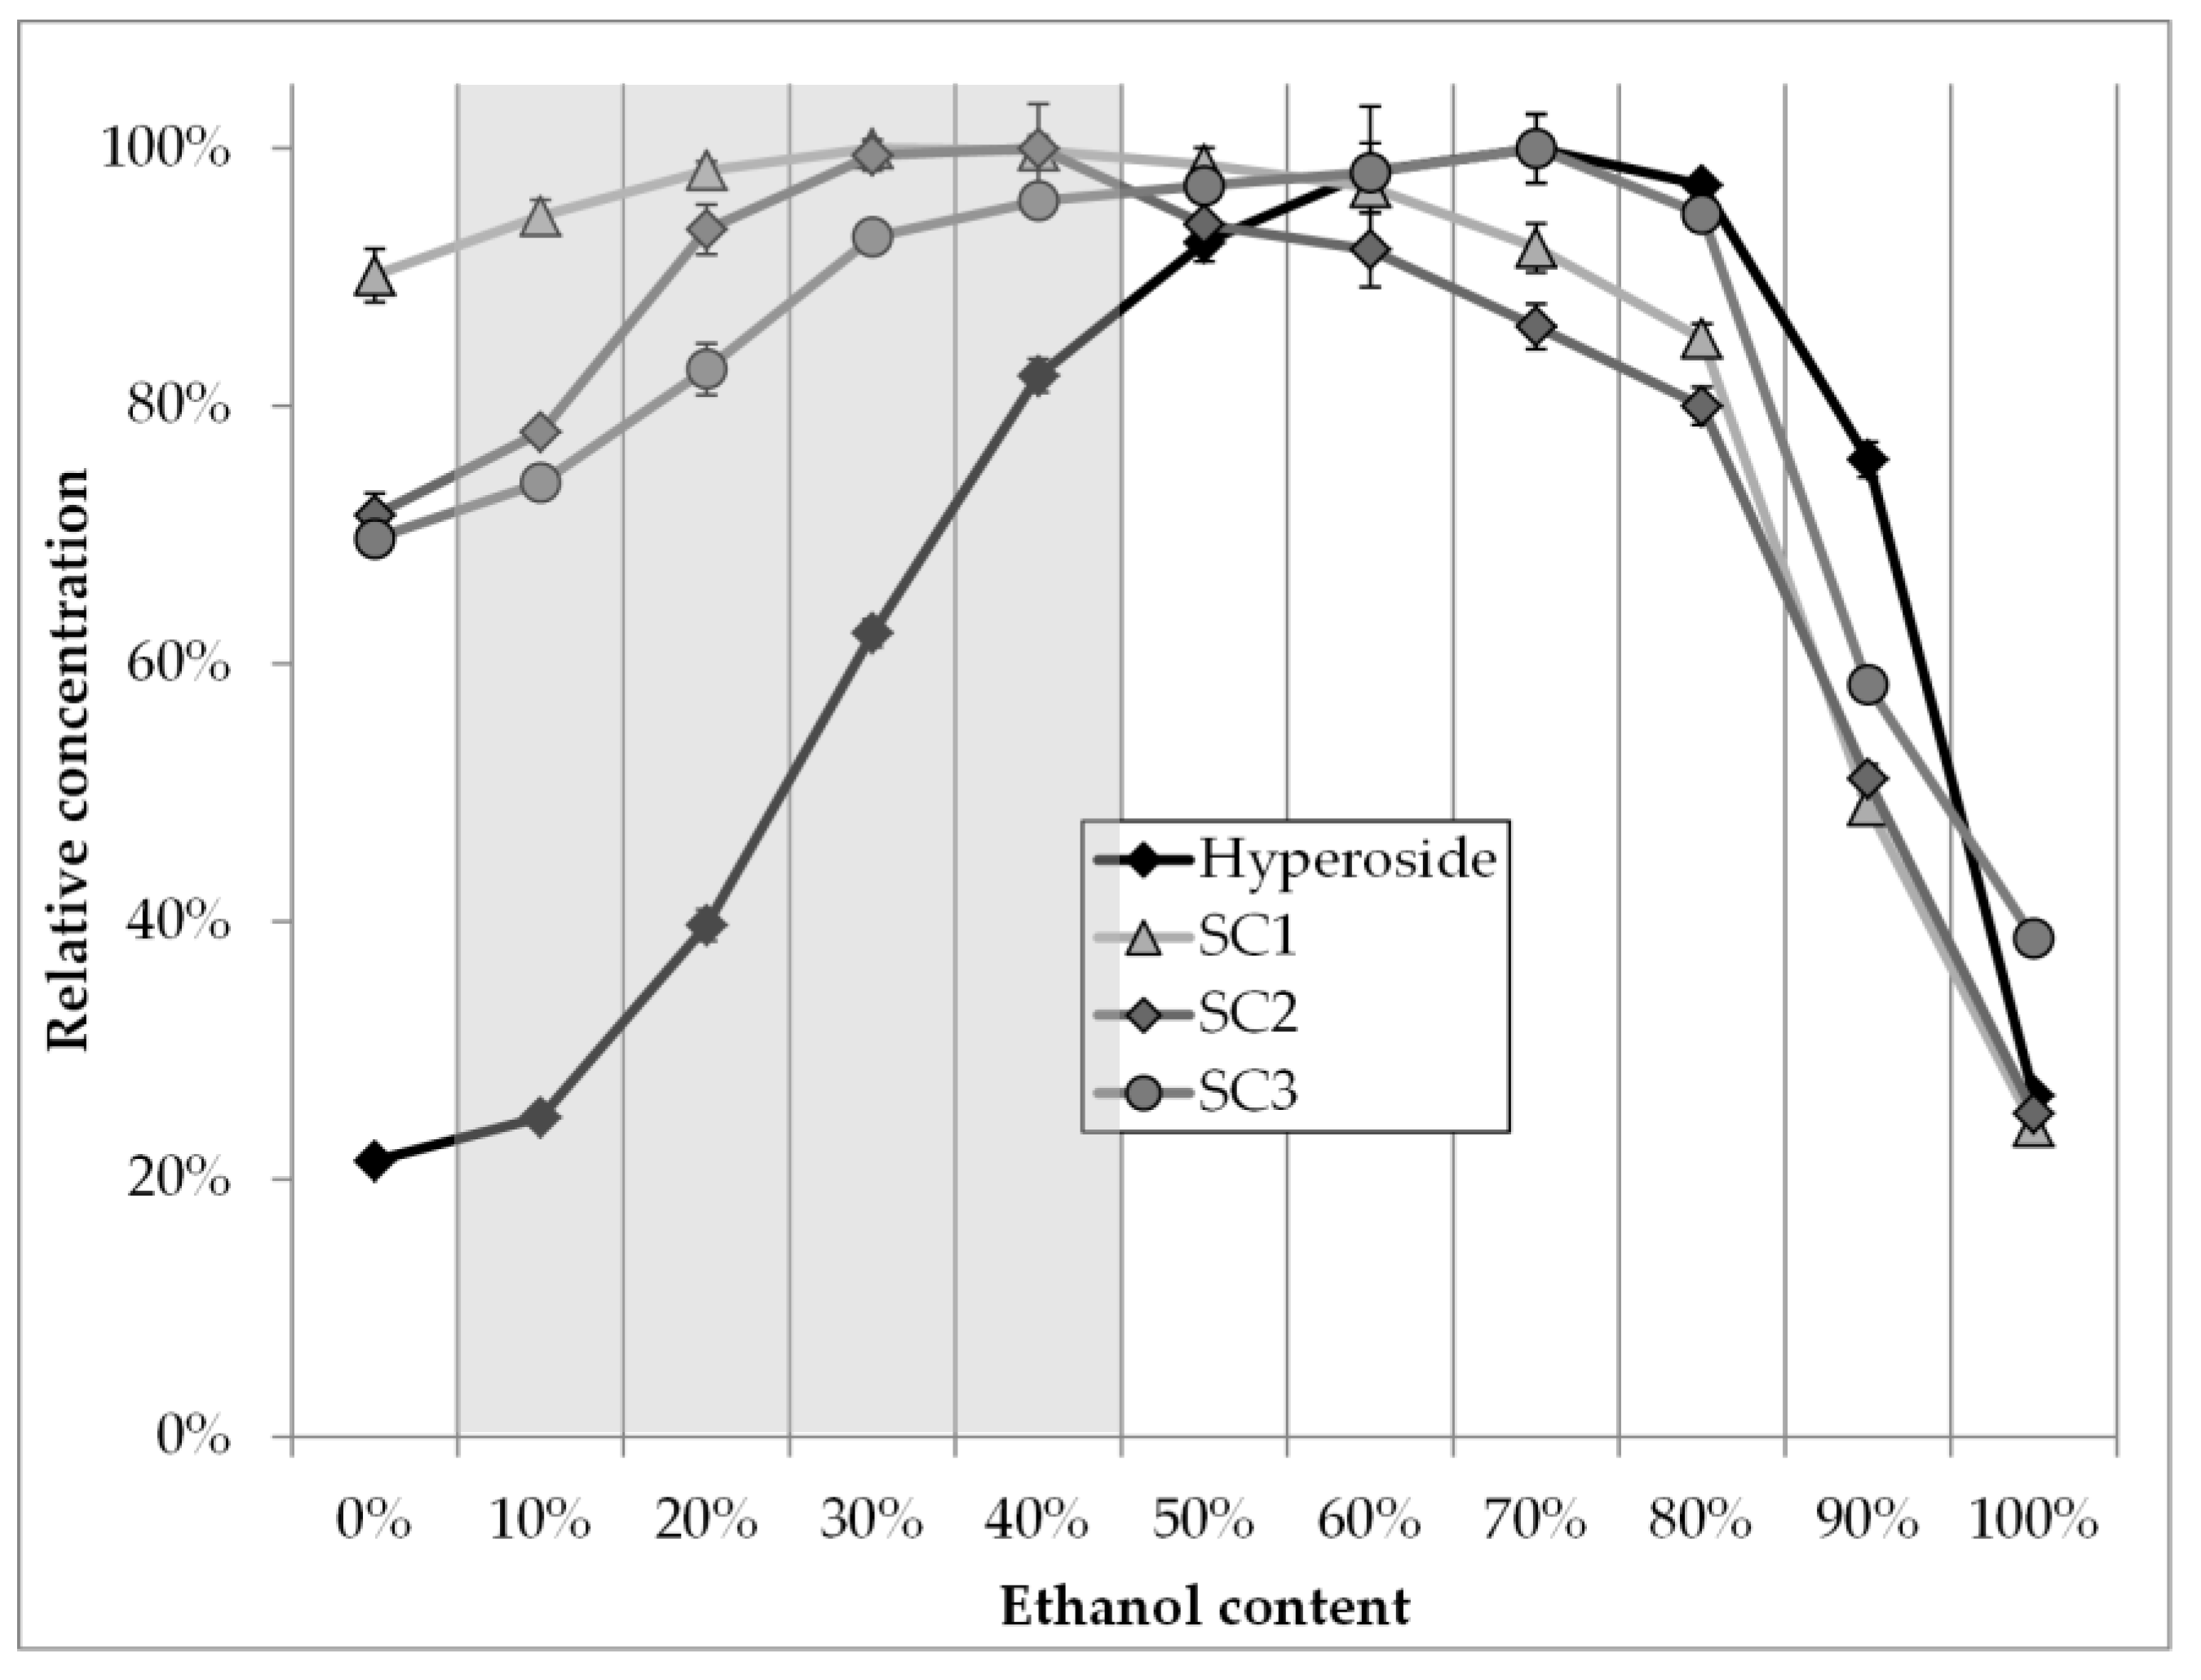
3.1. Solvent Screening

To achieve a high extraction performance, solvent selection is crucial. Because hawthorn extract is used as a traditional herbal medicine, not every solvent that is ideal from an engineering point of view is suitable. Commonly solvents or their aqueous solutions which are described in monographs are used. According to the European Pharmacopeia, water or ethanol water solutions with more than 45 vol. % of ethanol are used for the production of a siccum that is afterwards processed to a dry extract [8]. To provide a realistic study, ethanol water solutions ranging from pure water to pure ethanol in 10 vol. % steps are screened. The results are presented in Figure 4. The grey section contains ethanol water solutions that are not reported in the European Pharmacopeia, as depicted earlier. Besides hyperoside three other side components are regarded in the screening. They are referred to hyperoside by pseudo-concentrations. A solution of 70 vol. % ethanol rest water shows the highest capacity towards the target molecule hyperoside. Therefore, it is chosen as solvent for the conventional process design. Both, pure water and pure ethanol have significantly lower capacities towards hyperoside than their mixtures have. Moreover, they are at approximately the same level of relative solubility. This indicates that screening for completely different pure solvents, such as e.g., n-propanol or methanol, is not sufficient but aqueous solutions have to be considered.
According to the screening following solvent compositions are preferred:
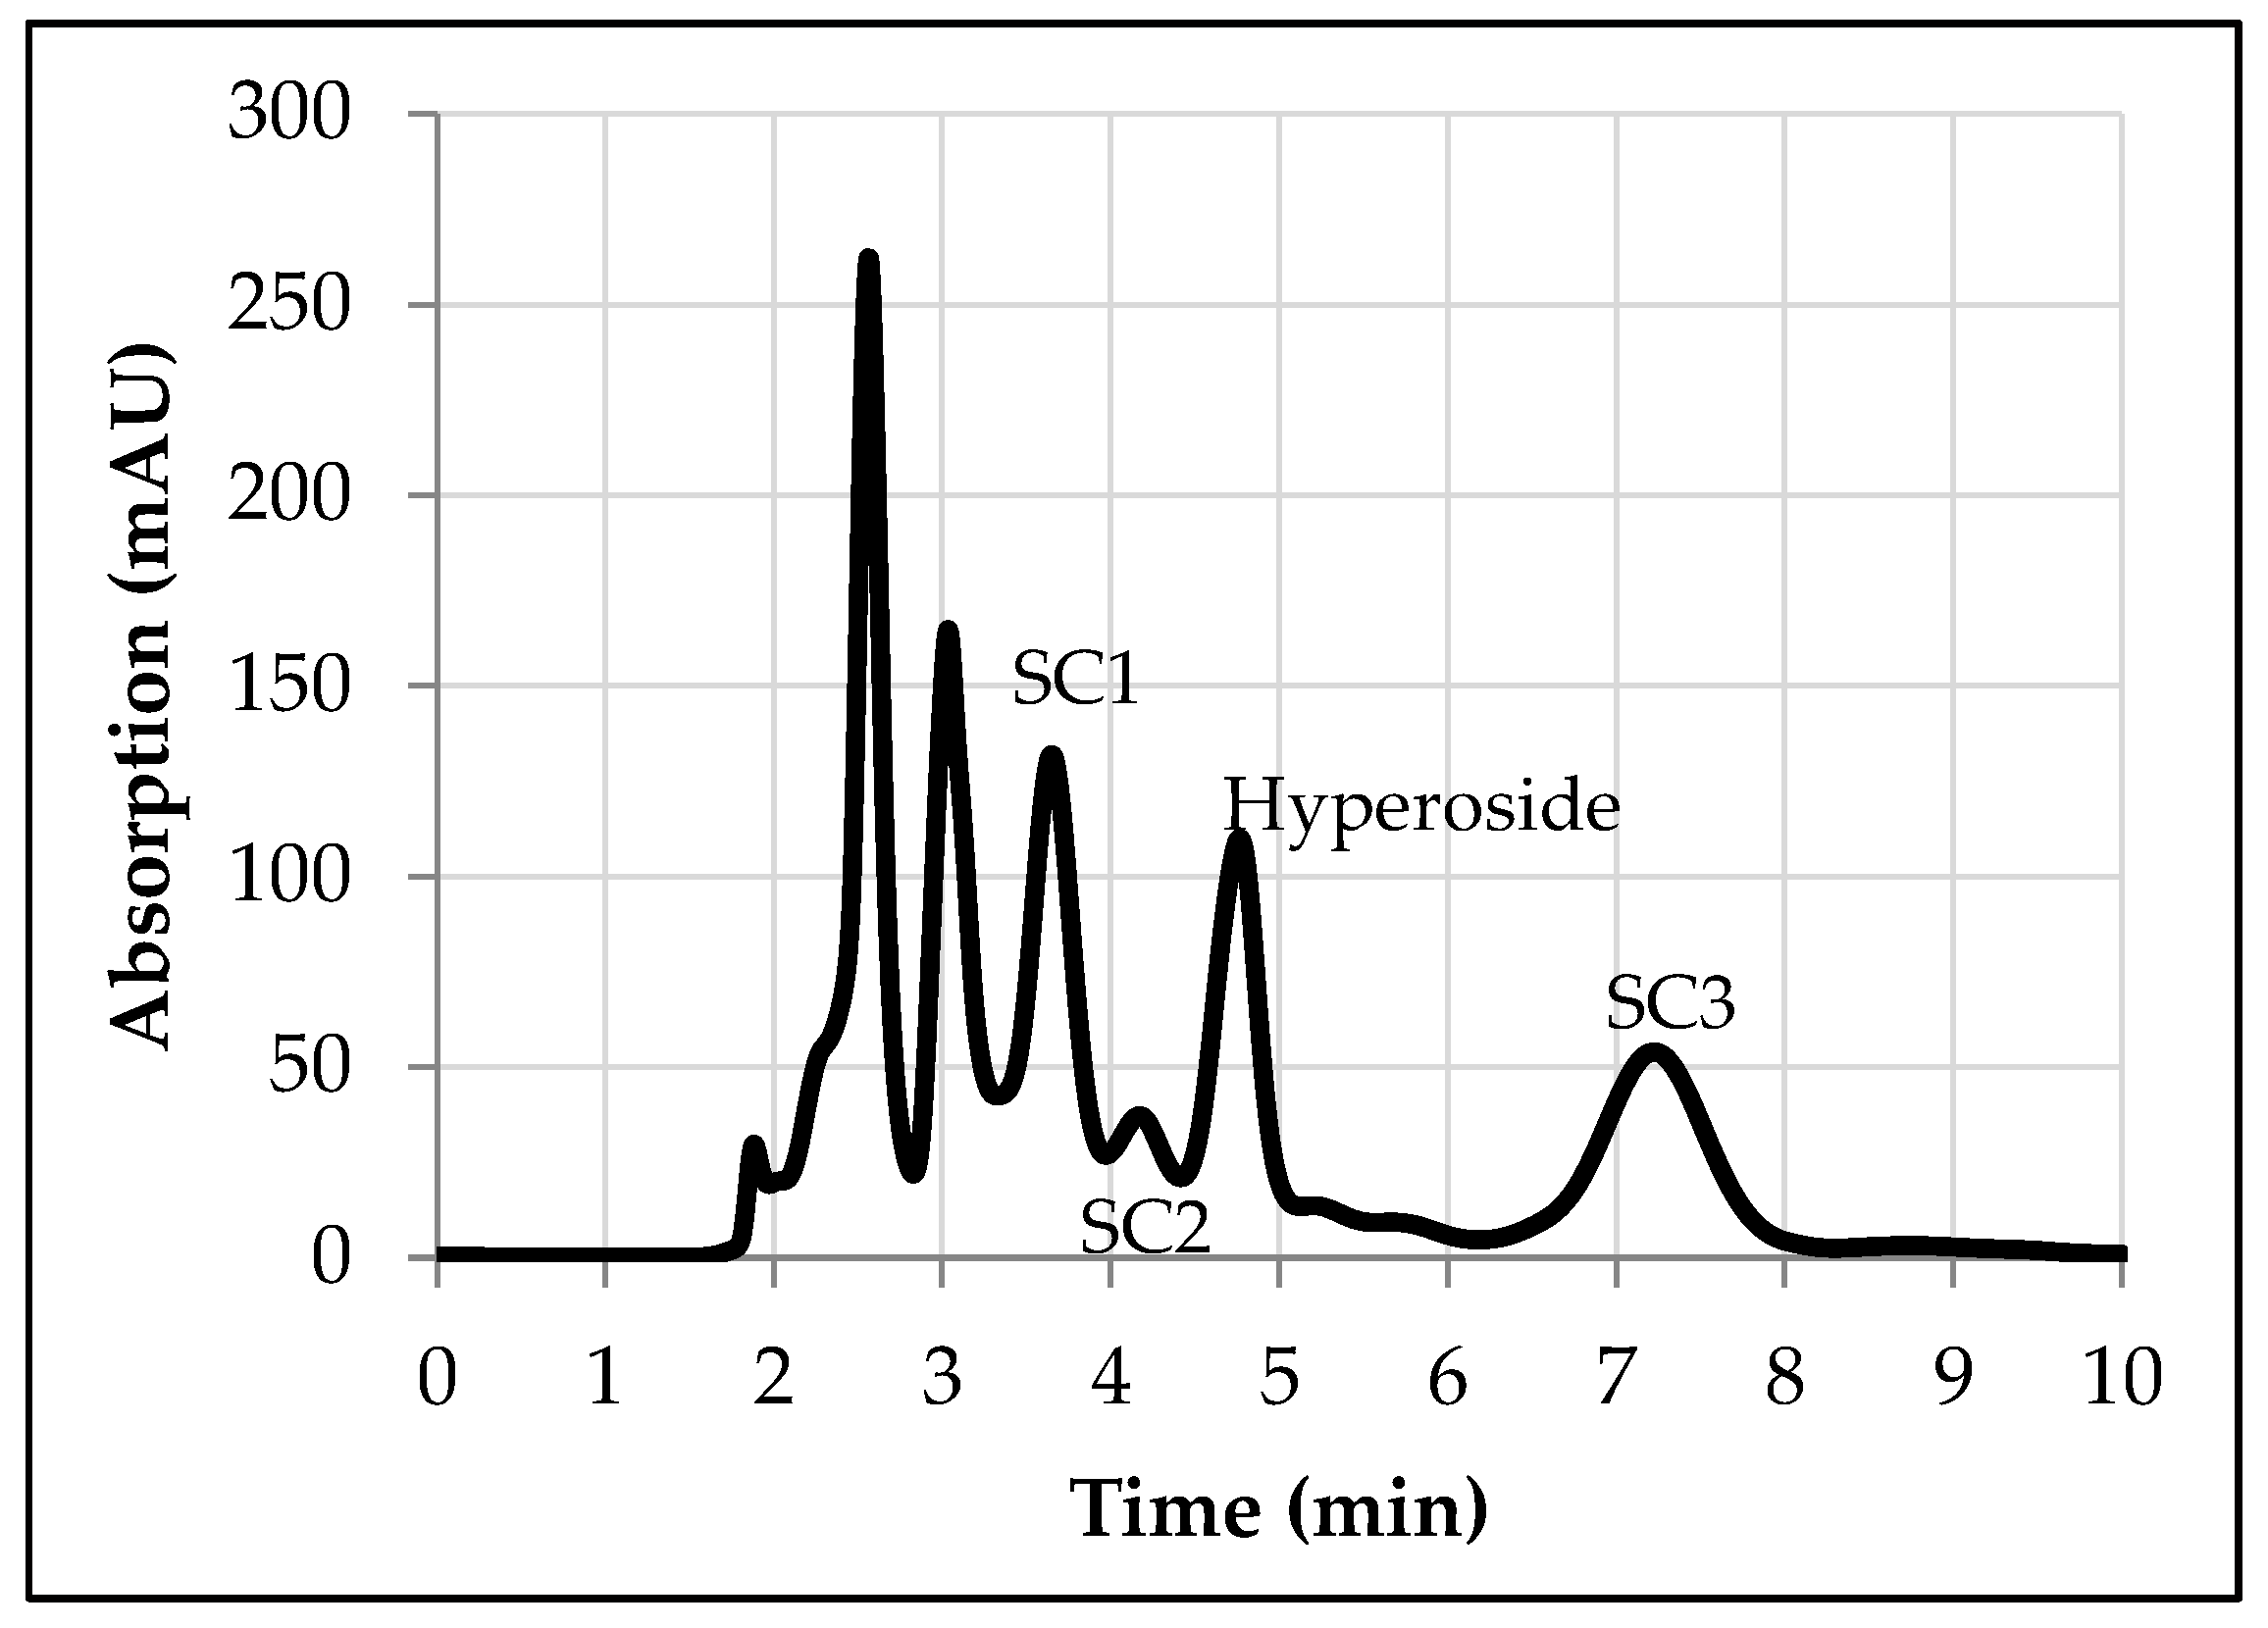
  • Hyperoside, 70 vol. % ethanol, rest water
  • SC1, 30 vol. % ethanol, rest water
  • SC2, 30–40 vol. % ethanol, rest water
  • SC3, 70 vol. % ethanol, rest water
Probably SC1 to SC3 are flavonoids as well, because their adsorption maxima in UV/VIS-spectra show significant bands at 207–215 nm, 257–270 nm and 332–359 nm [24]. Established products are commonly extracted with 45 vol. % ethanol, rest water [9,10,11,12,13]. Assuming SC1 to SC3 are also flavonoids, this solvent is a preferable mixture to achieve high total flavonoid content in the extract.

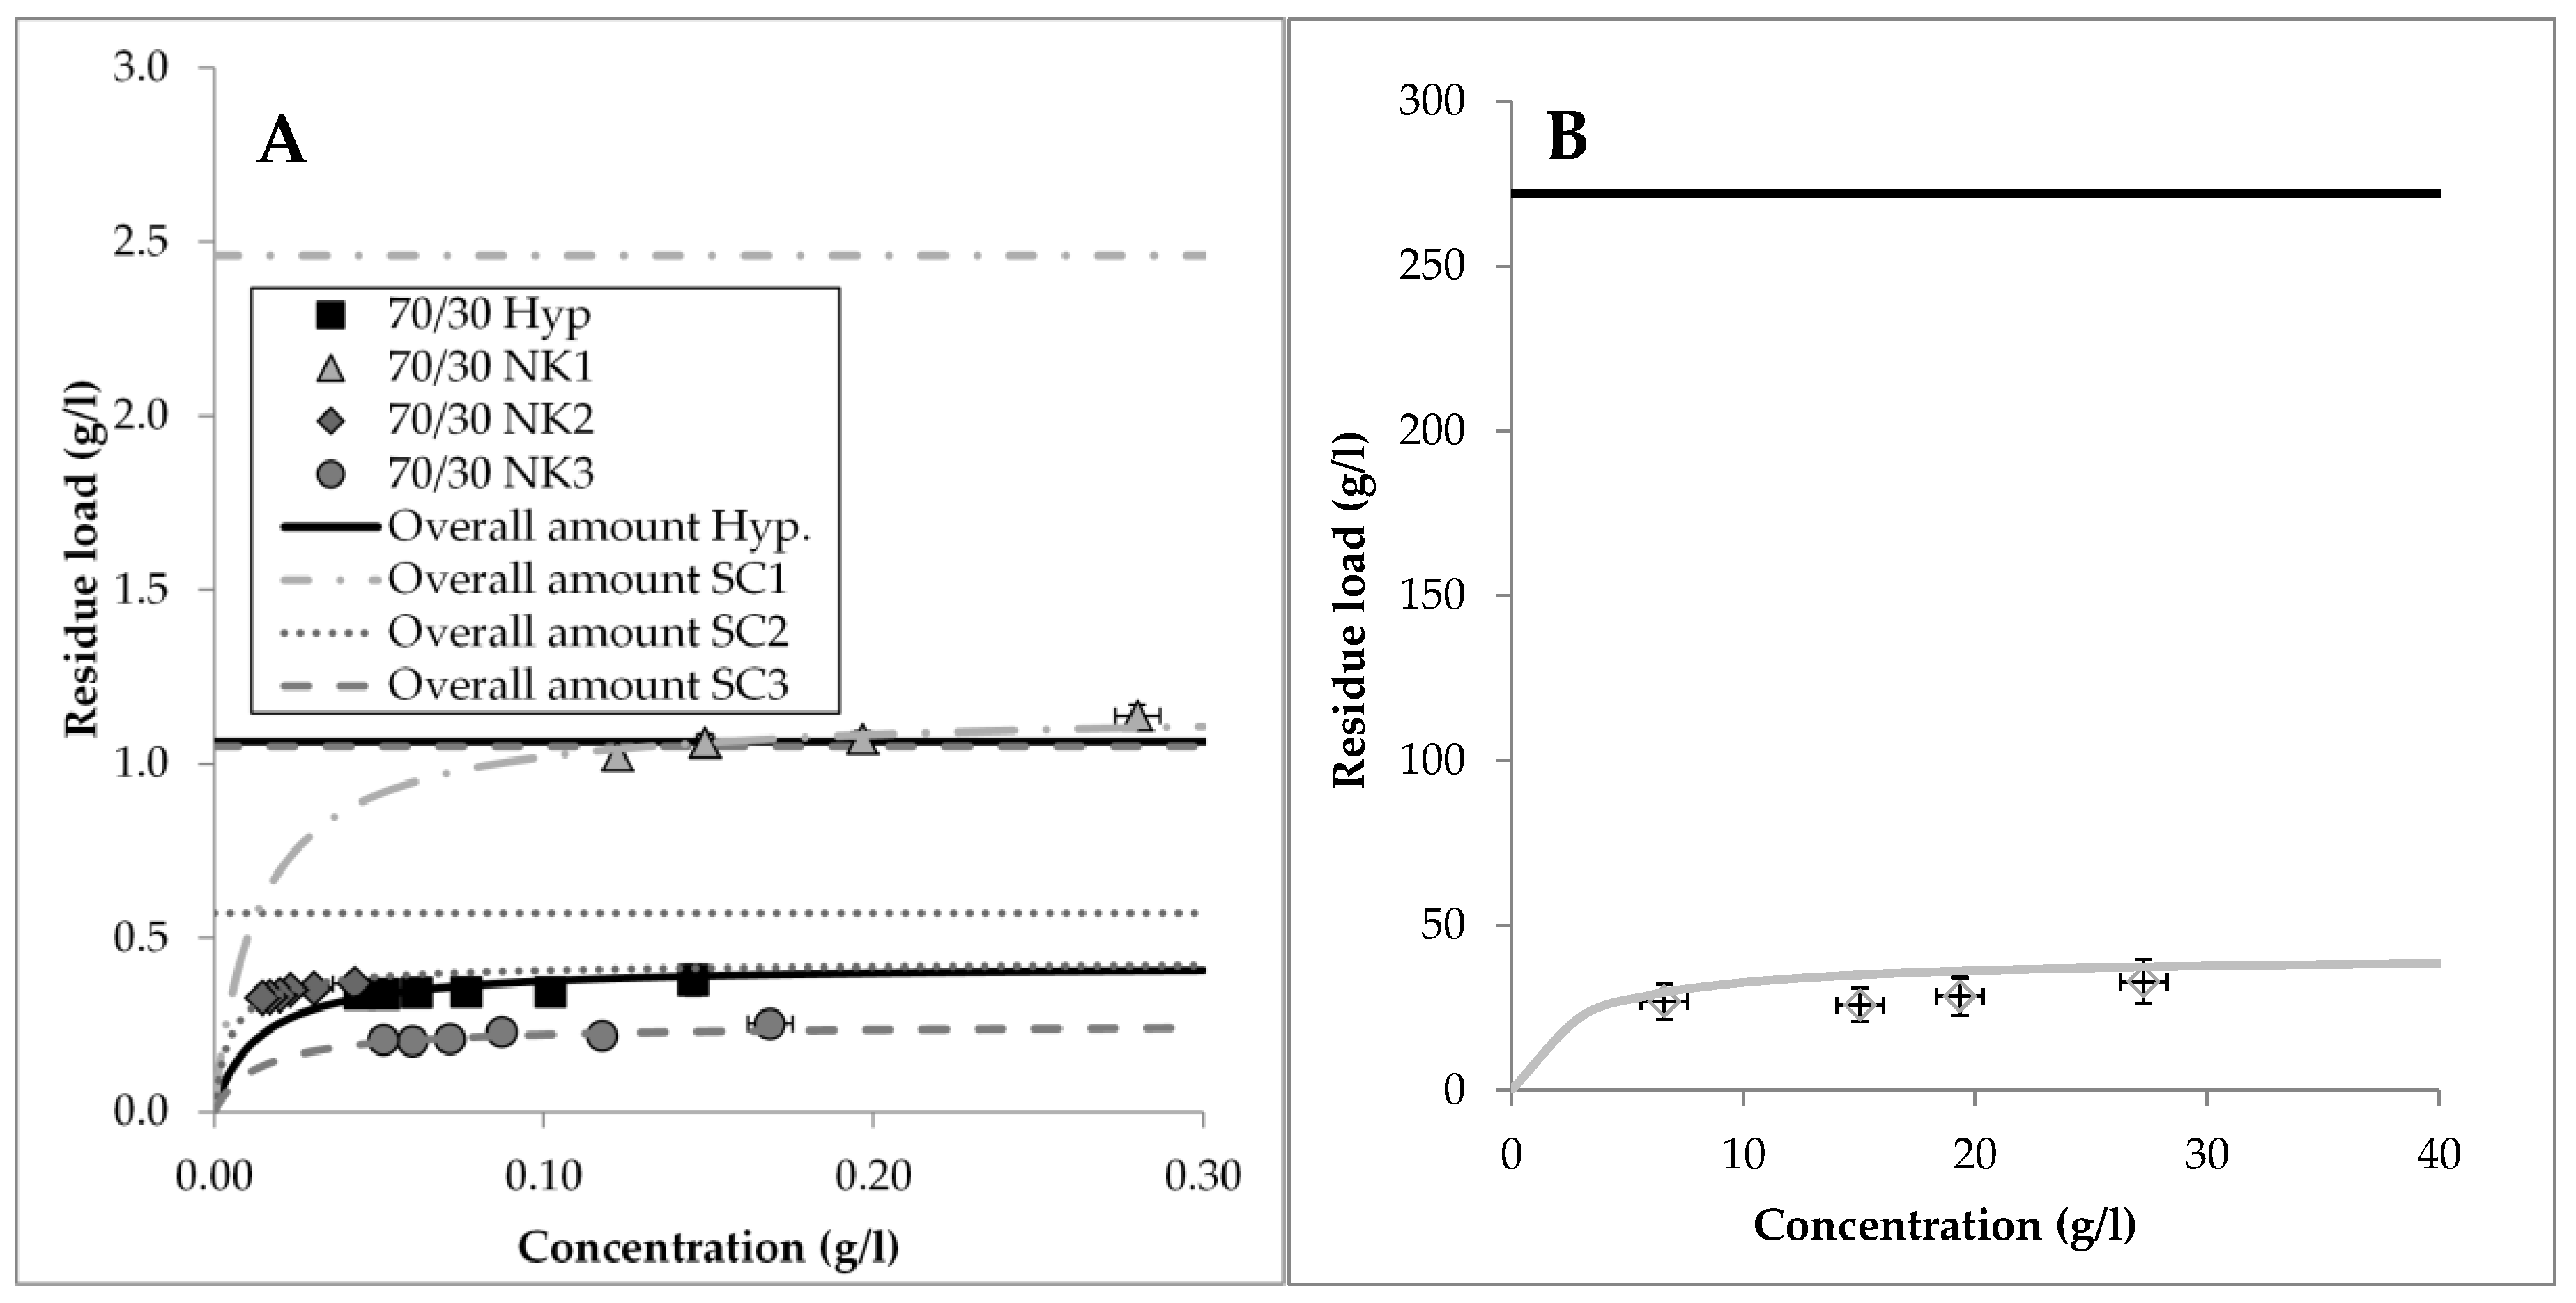
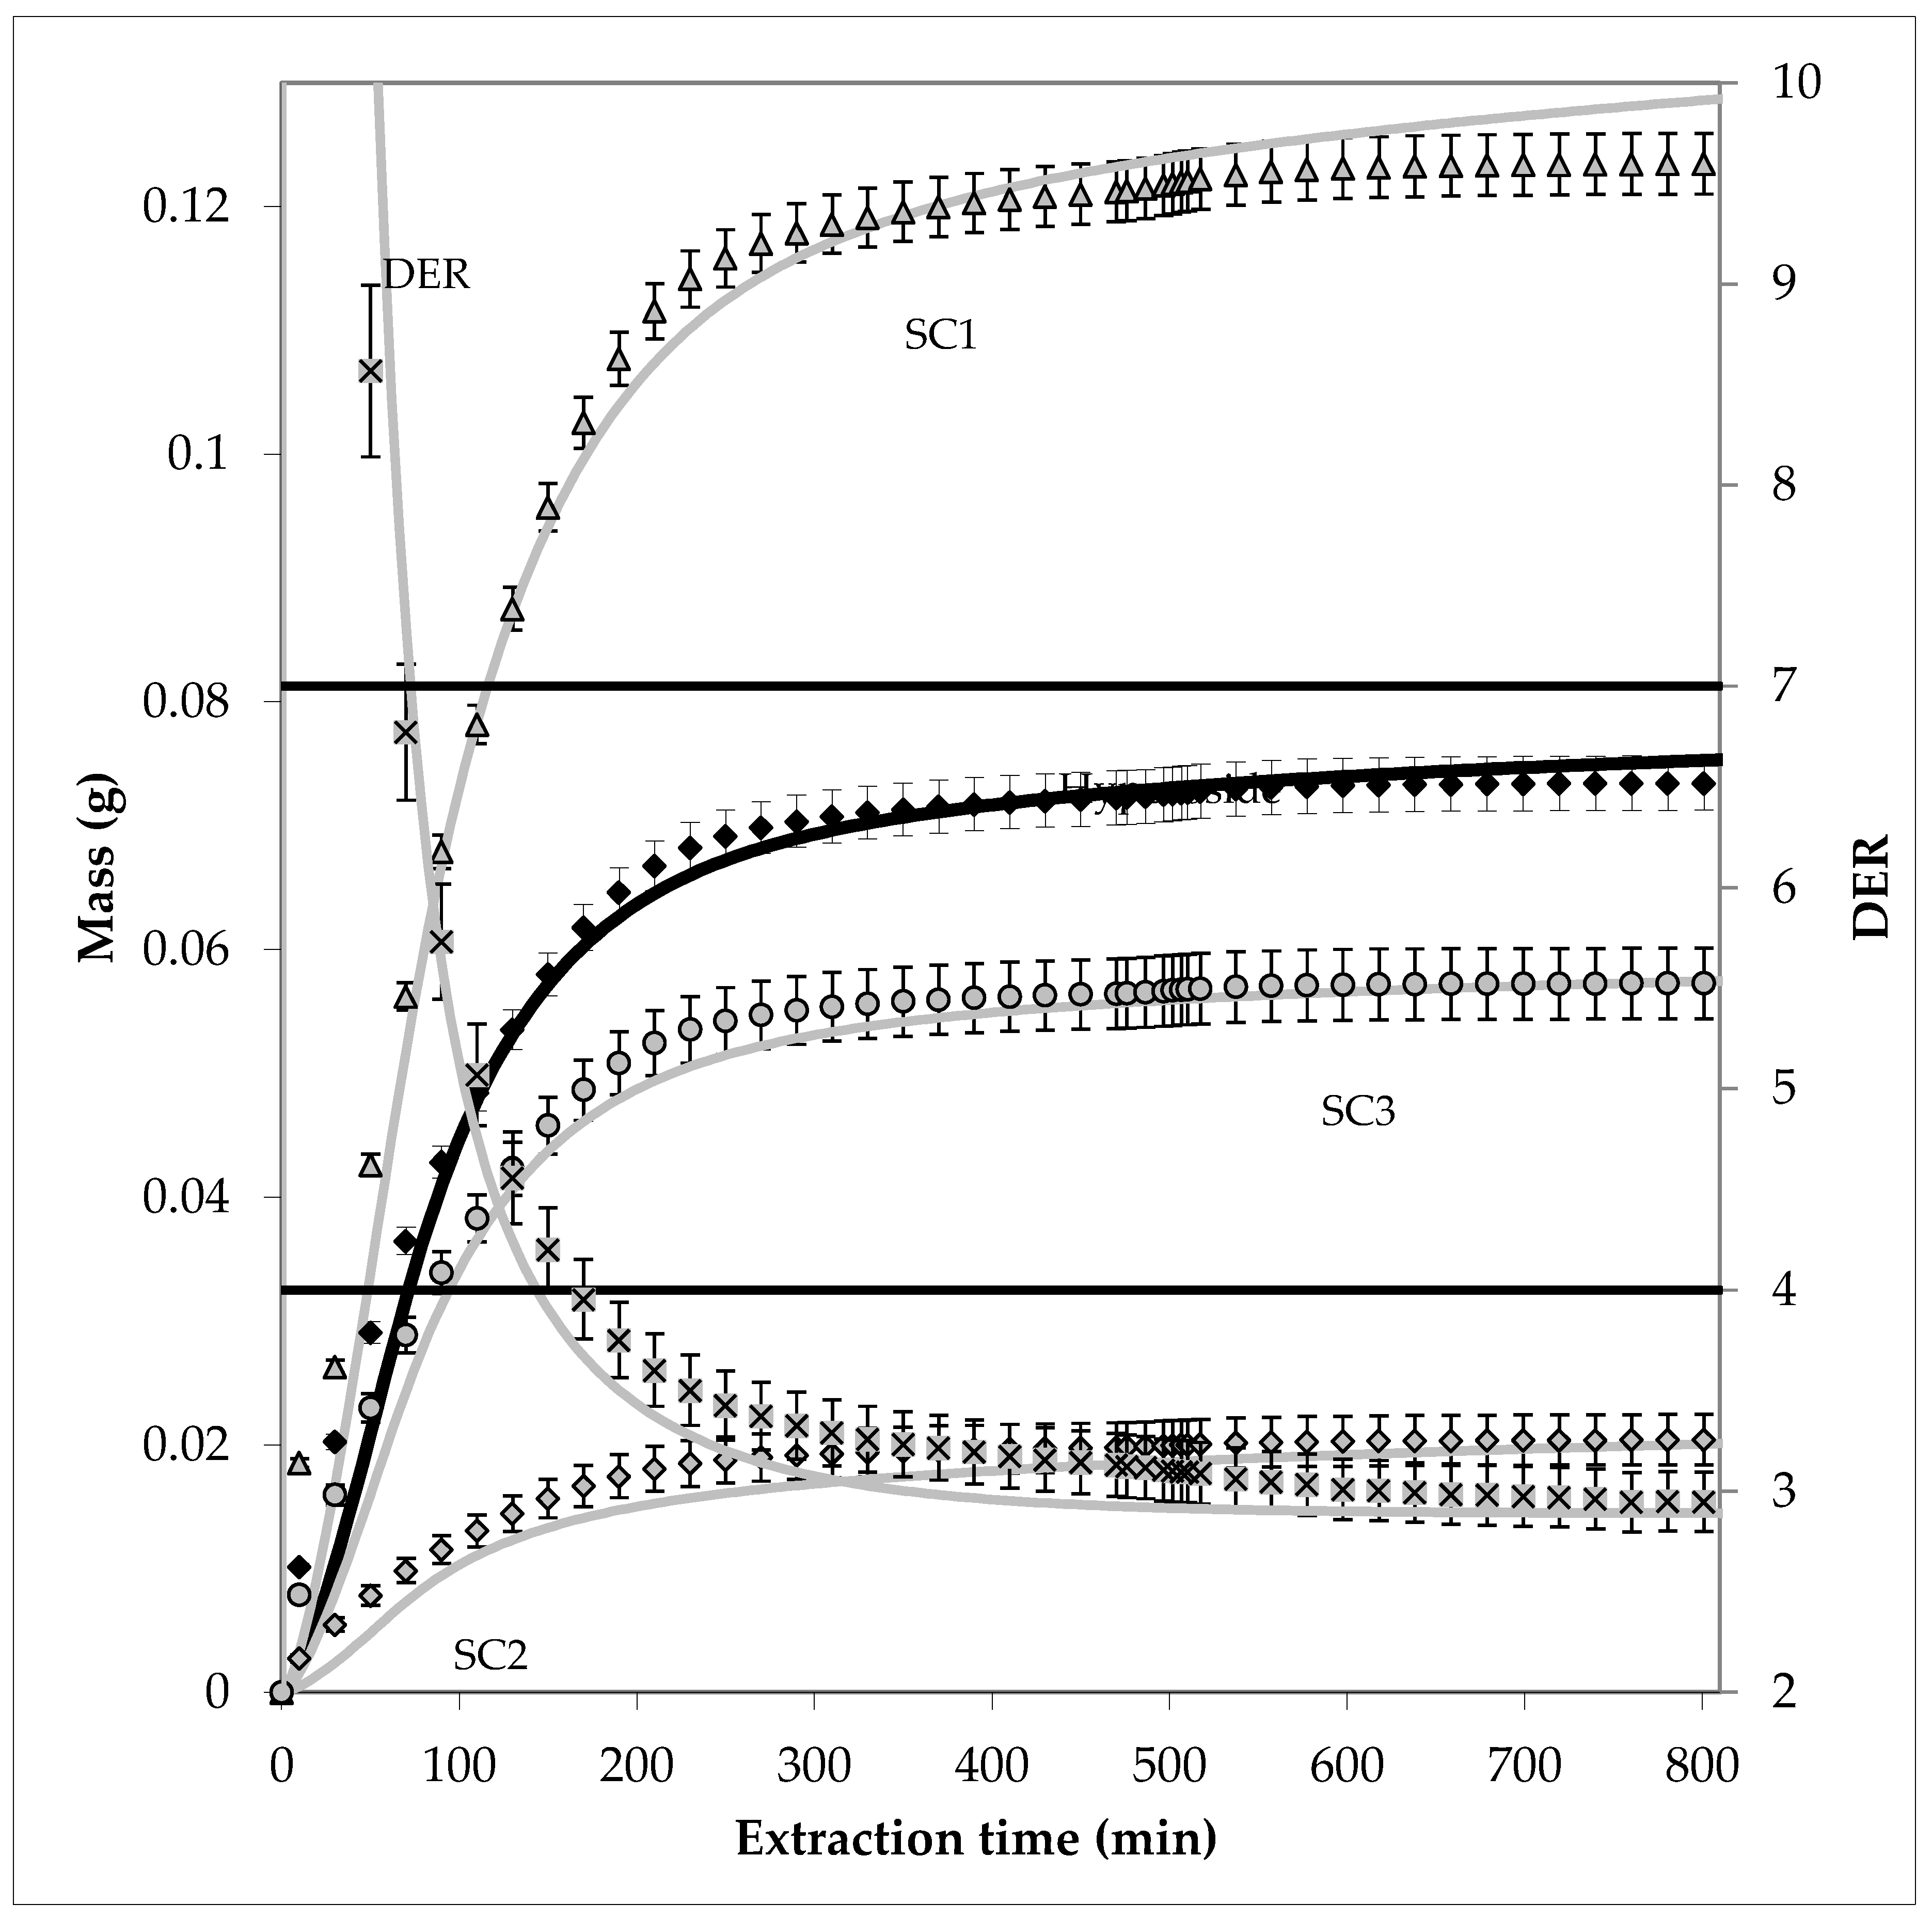
3.2. Model Parameter Determination for Conventional Extraction

For proper modeling and simulation, the model parameters equilibrium and overall amount must be determined. The overall amount of hyperoside is derived by exhaustive percolation experiments using ethanol/water (70/30 v/v). It is 0.35% ± 0.02% referred to dry mass. The overall amounts of SC1 to SC3 regarding hyperoside are 0.82%, 0.19% and 0.35%, respectively. In literature values for the overall flavonoid amount between 1–2% are given [7].
The equilibrium data was measured by multi step maceration experiments and is shown in Figure 5. The Langmuir-type distribution equilibrium for hyperoside and SC3 are both rather flat, confirming the chosen ethanol water mixture as well-chosen solvent. The equilibrium curves for SC1 and SC2 are almost approaching to their specific overall amount, on the contrary. There is a relatively high amount of these components remaining in the plant matrix, so the solvent is not ideally chosen for these components. This finding is consistent to the solvent screening of Section 3.1. Figure 5 also contains the equilibrium relationship of the whole dry matter extracted from the hawthorn leaves. This parameter is further needed for proper modeling of the DER during extraction. The overall amount of dry matter was determined to 34%, thus the minimum DER would be 2.9:1.

3.3. Model Parameter Determination for PHWE

For modeling and simulation of the PHWE process a suitable extraction temperature must be defined. Therefore, a temperature screening was performed ranging from 80 °C to 140 °C in 20 °C steps. Afterwards the individual degradation kinetics are determined. The pressure was kept constant to 15 bars in all experiments, to ensure the best possible comparability.

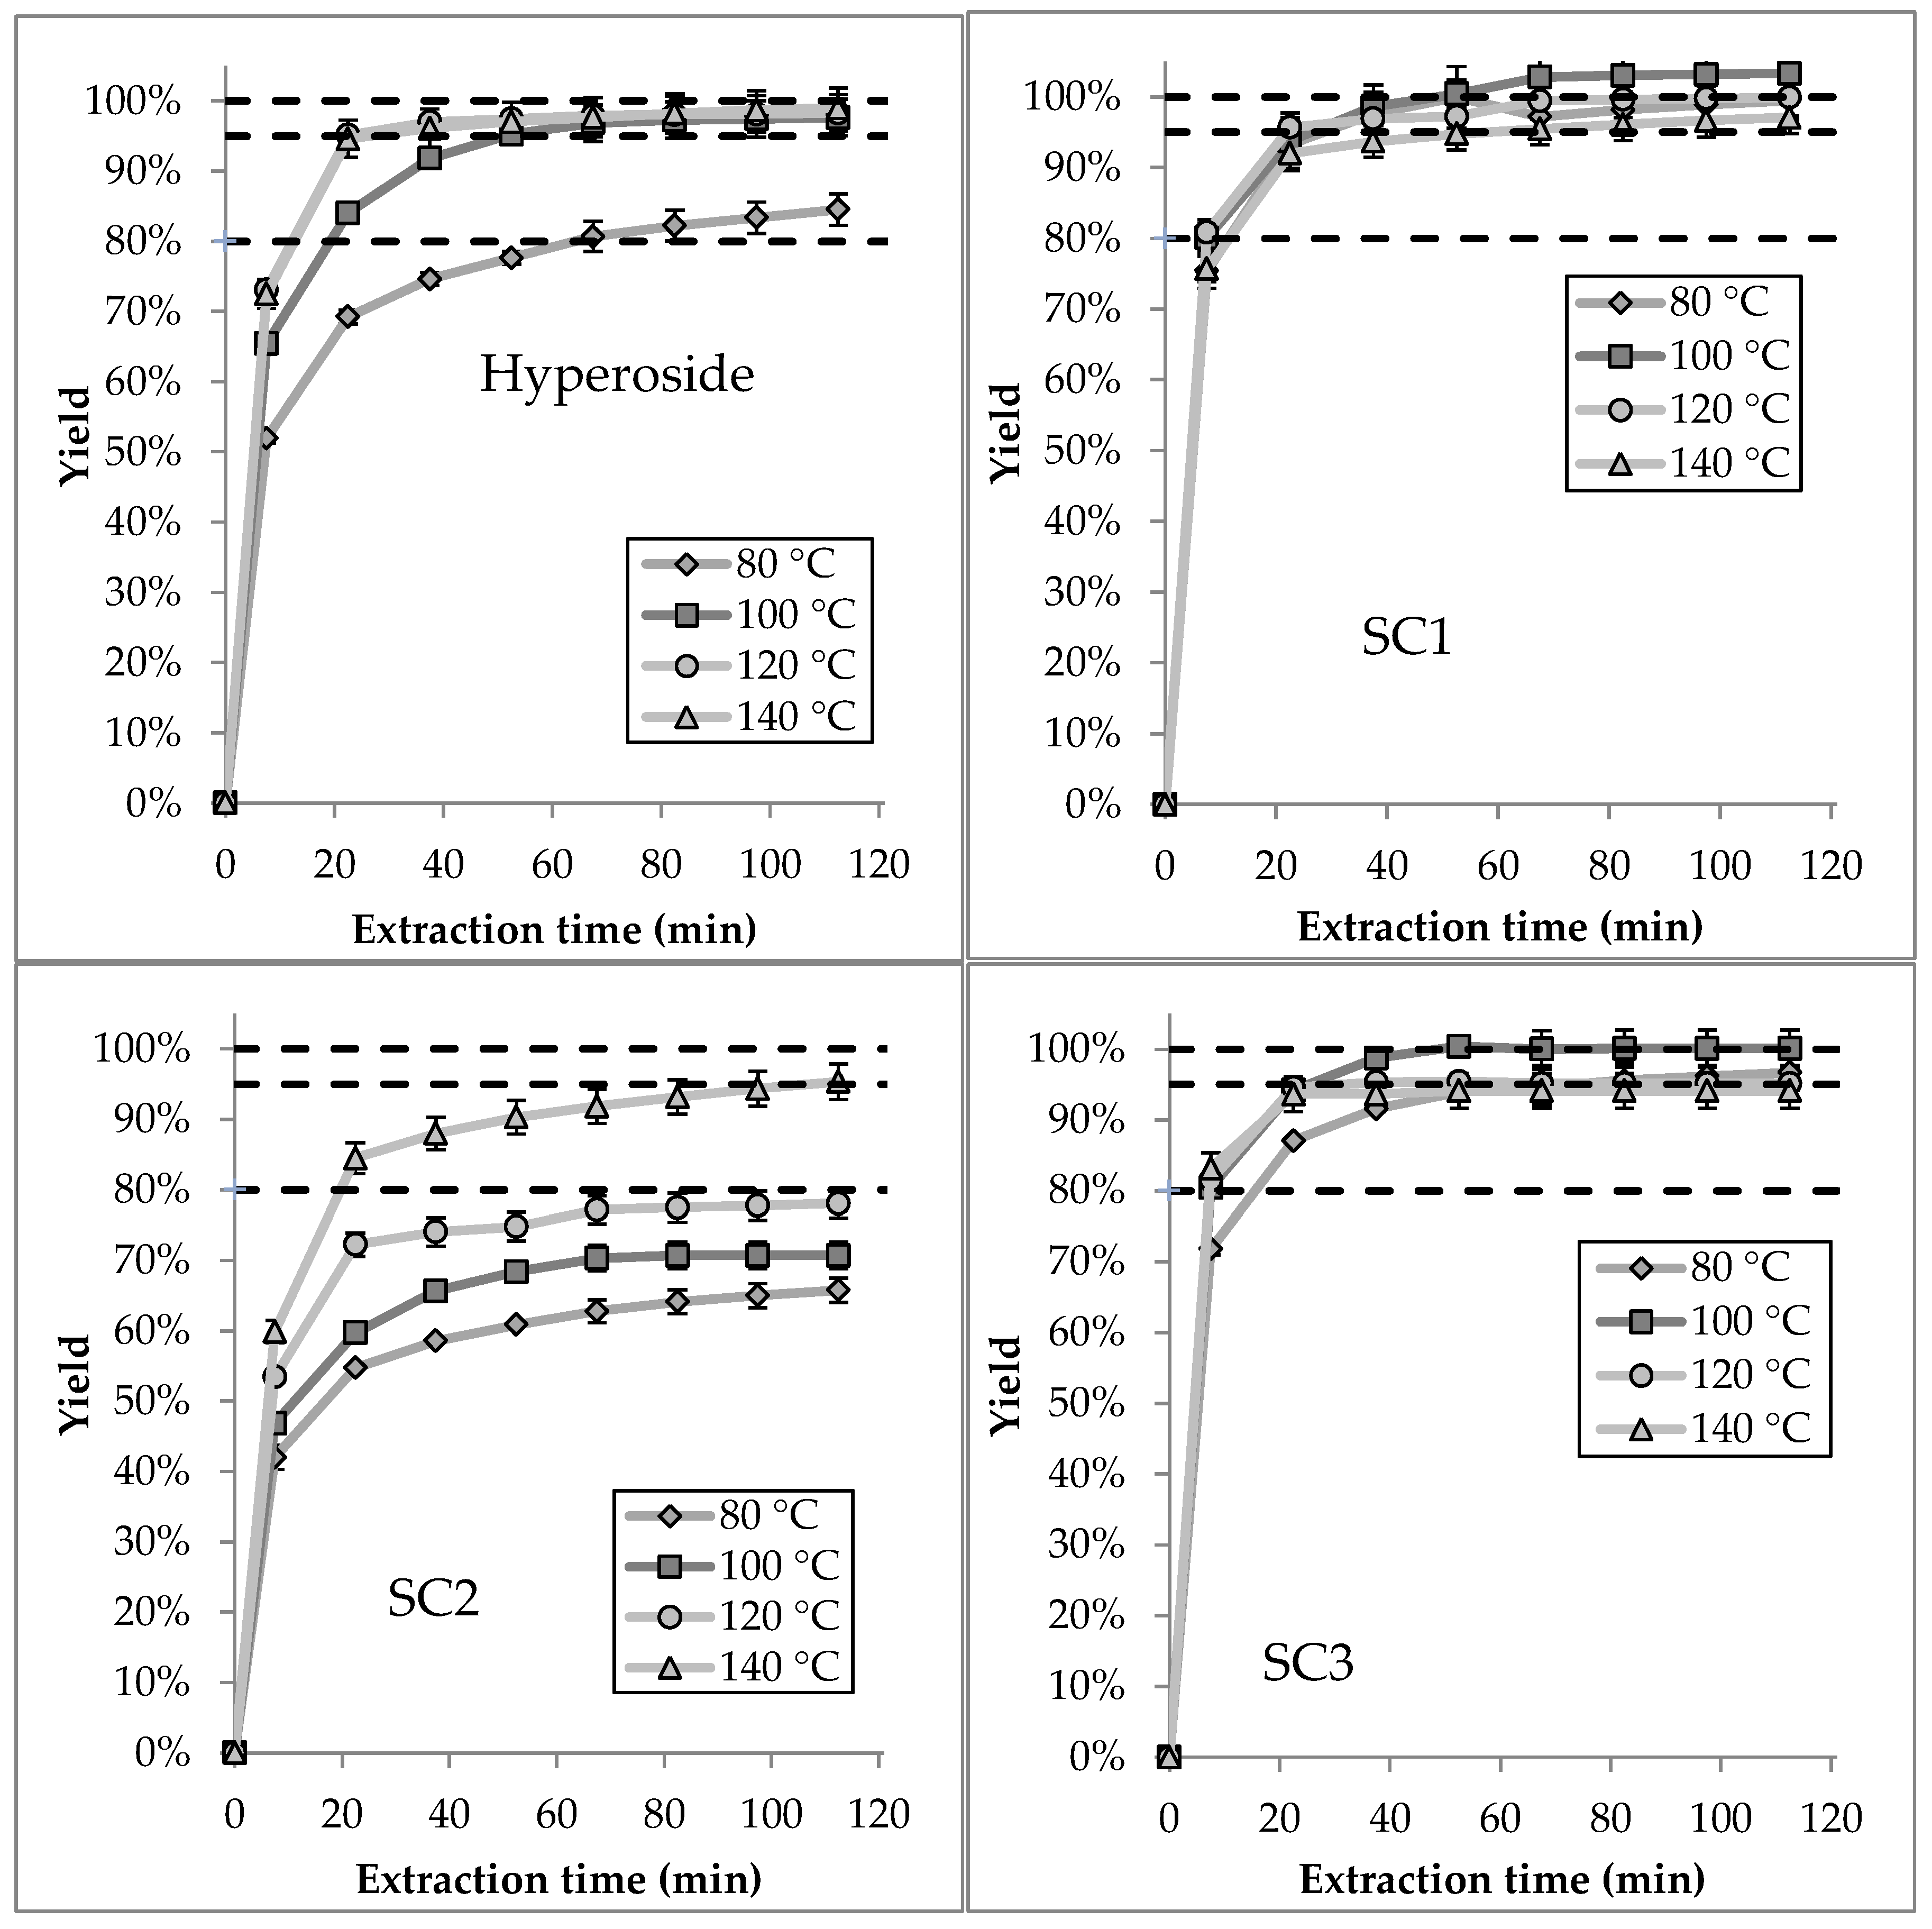
3.3.1. Extraction Temperature

The results of the screening are presented in Figure 6.
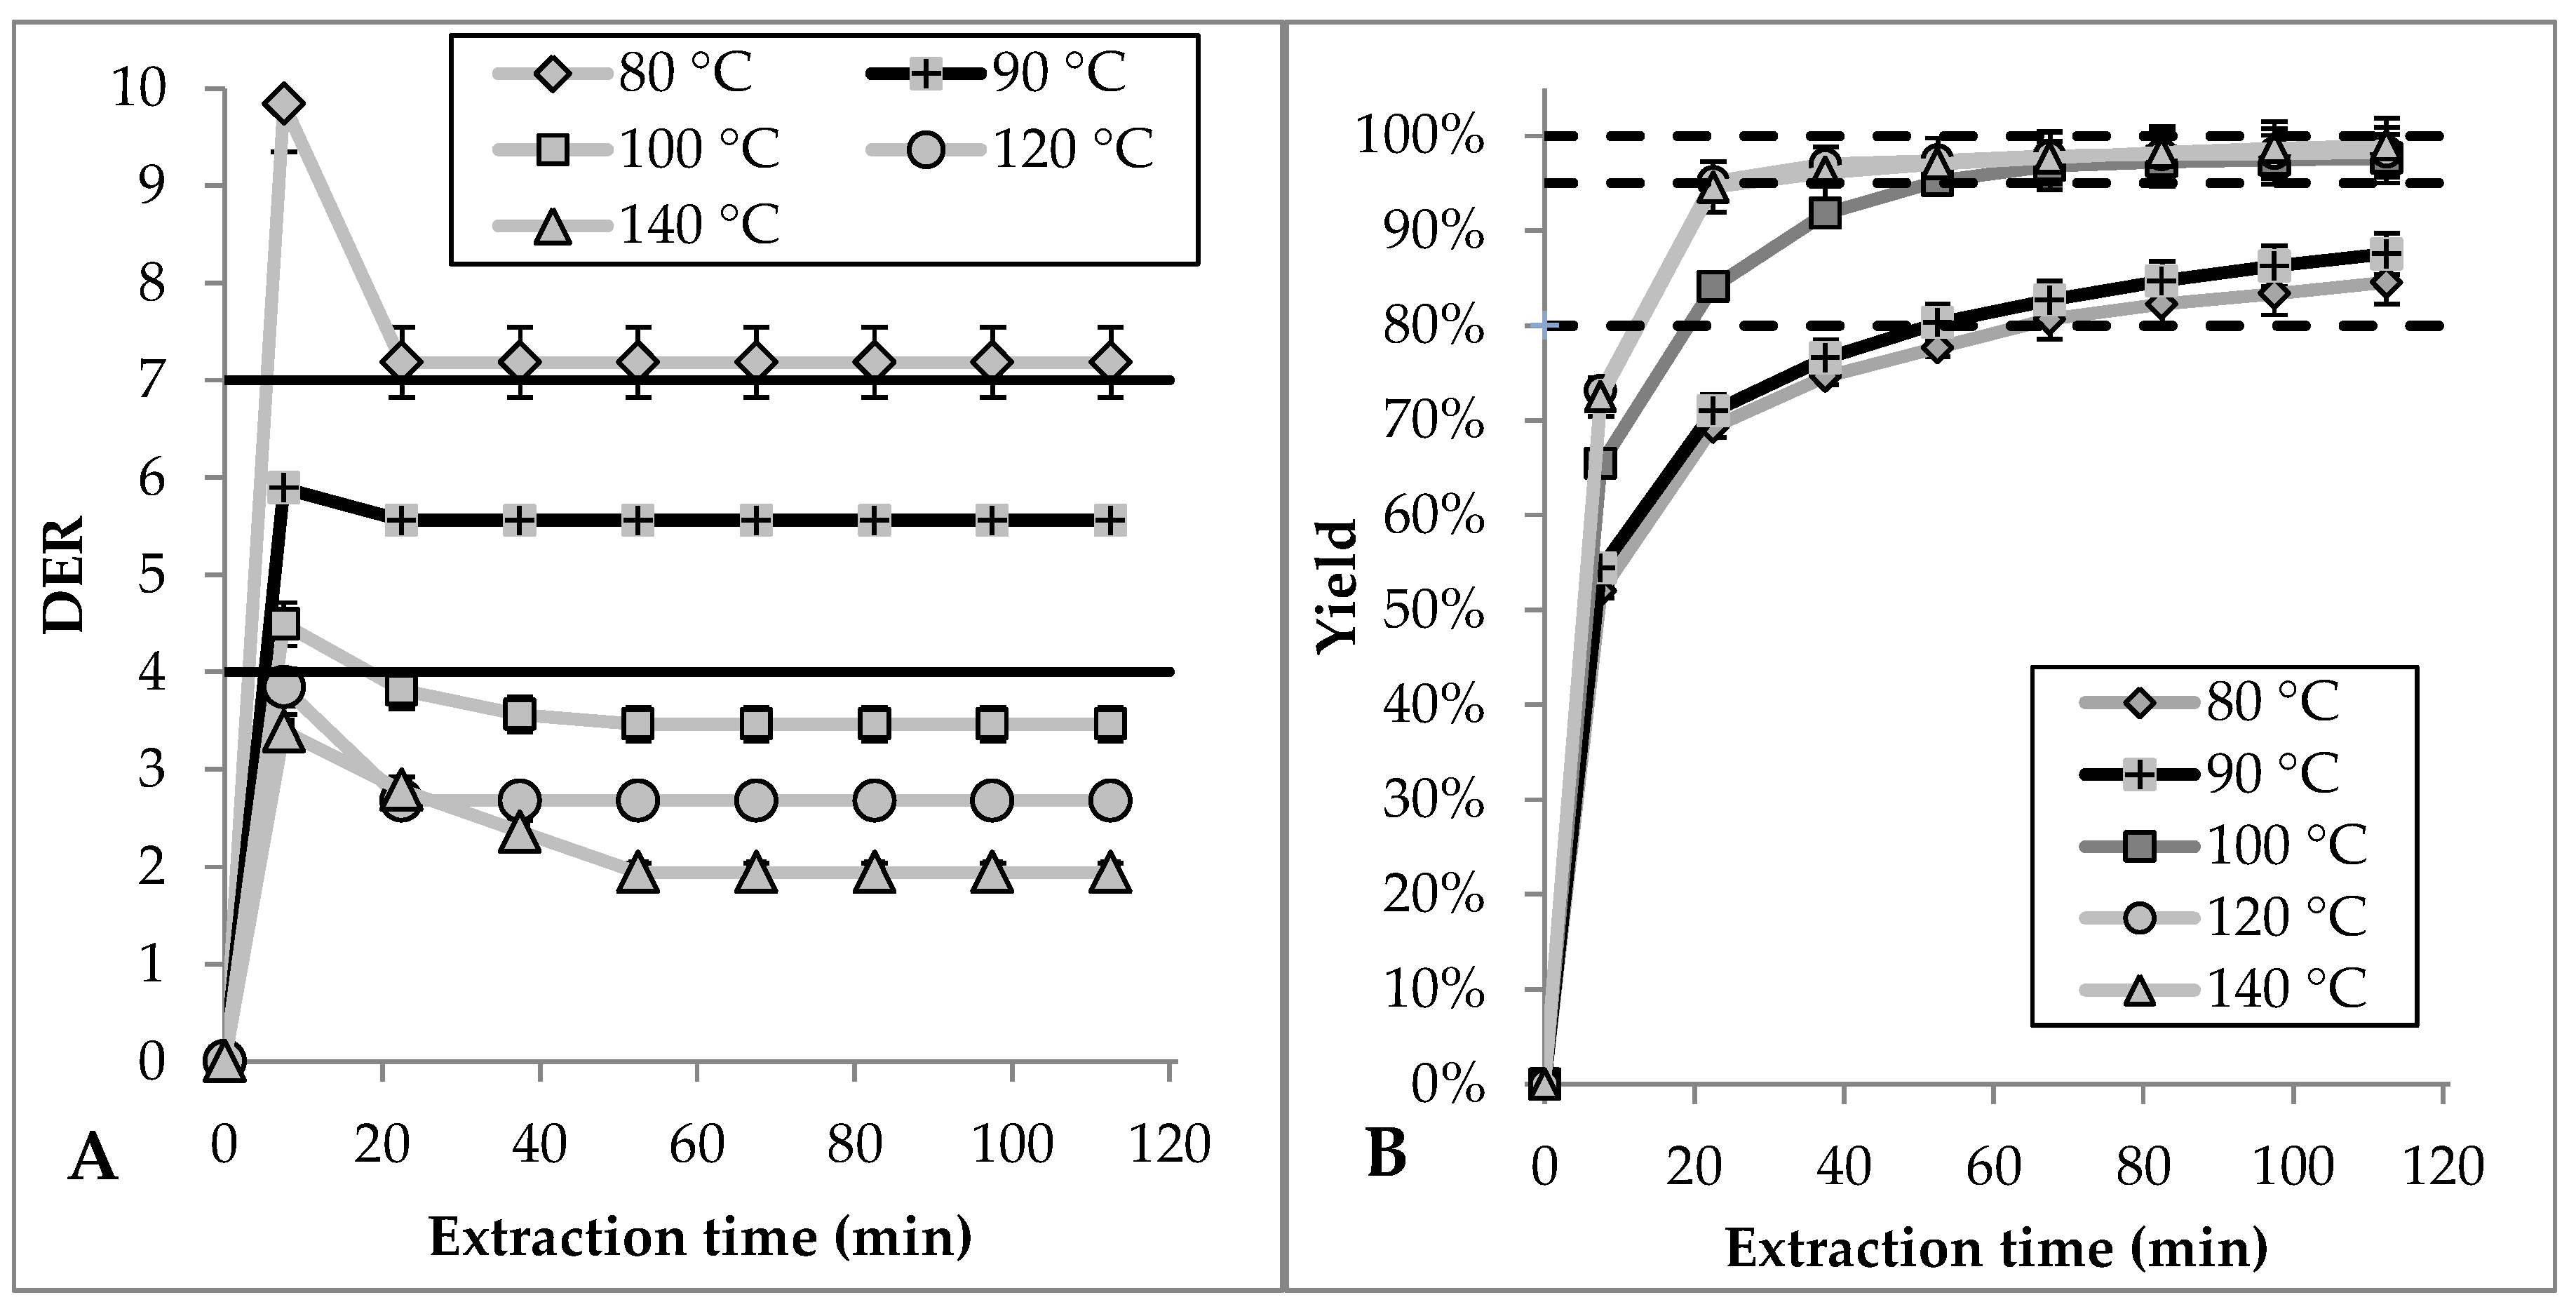
  • Hyperoside: The screening shows that hyperoside is almost entirely extracted after 60 min at 100 °C. A Yield of 95% is reached after about 20 min at 120 °C and 140 °C. At that temperature, the productivity is 250% higher compared to 100 °C and 700% higher compared to 80 °C. A decline in yield with rising temperature cannot be observed, indicating a high thermal stability of hyperoside.
  • Side component 1: The productivity of extraction is nearly constant in the regarded temperature range from 80 °C to 140 °C. Thermal decay does not seem to appear, as well.
  • Side component 2: SC2 shows the greatest dependency on temperature among the regarded substances. At 80 °C a yield of only about 70% is reached after 120 min. This yield is reached at 140 °C after just 15 min. The increase in productivity is approximately 800%. Thermal degradation cannot be traced based on this data.
  • Side component 3: SC3 shows high productivity among the whole temperature field. Besides that, the yields at 80 °C and 140 °C are under the level of 100 °C (90% yield after 120 min). At a temperature of 140 °C this can indicate thermal decomposition, which is investigated in the following section. At 80 °C the productivity is limited because the temperature is not well-chosen for this substance.
Already commercialized hawthorn drugs are extracted to a specific DER ranging from 4:1 to 7:1. To ensure a good comparability towards established products, that parameter is investigated as well. Figure 7 shows the extraction curves for hyperoside and the DER in the investigated temperature range.
At 80 °C a yield of 85% regarding hyperoside is reached after 120 min of extraction. The corresponding DER is approximately 7.2:1. In that case only a small amount of dry extract is obtained that contains a relatively high quantity of hyperoside, so the extraction is rather selective. By rising temperature almost complete extraction of hyperoside is achieved. At the same time, the DER decreases to values of 3.5:1 at 100 °C, 2.7:1 at 120 °C and 2:1 at 140 °C, being smaller than the minimum value obtained at conventional percolation with ethanol/water. None of the examined temperature matches a high yield of hyperoside and a DER in the desired range at the same time. Therefore, an extraction at 90 °C was performed. A yield of hyperoside of 90% and a DER of 5.5:1 after 120 min of extraction have been measured, thus this temperature is chosen for hot water extraction of hyperoside from hawthorn. In that case, the process cannot be named pressurized hot water extraction by definition. From a process engineers point of view this is not decisive, because the shown model parameter determination concept does not change and moreover, the extraction is now possible without additional pressure, thus reducing investment and operating costs at the same time.

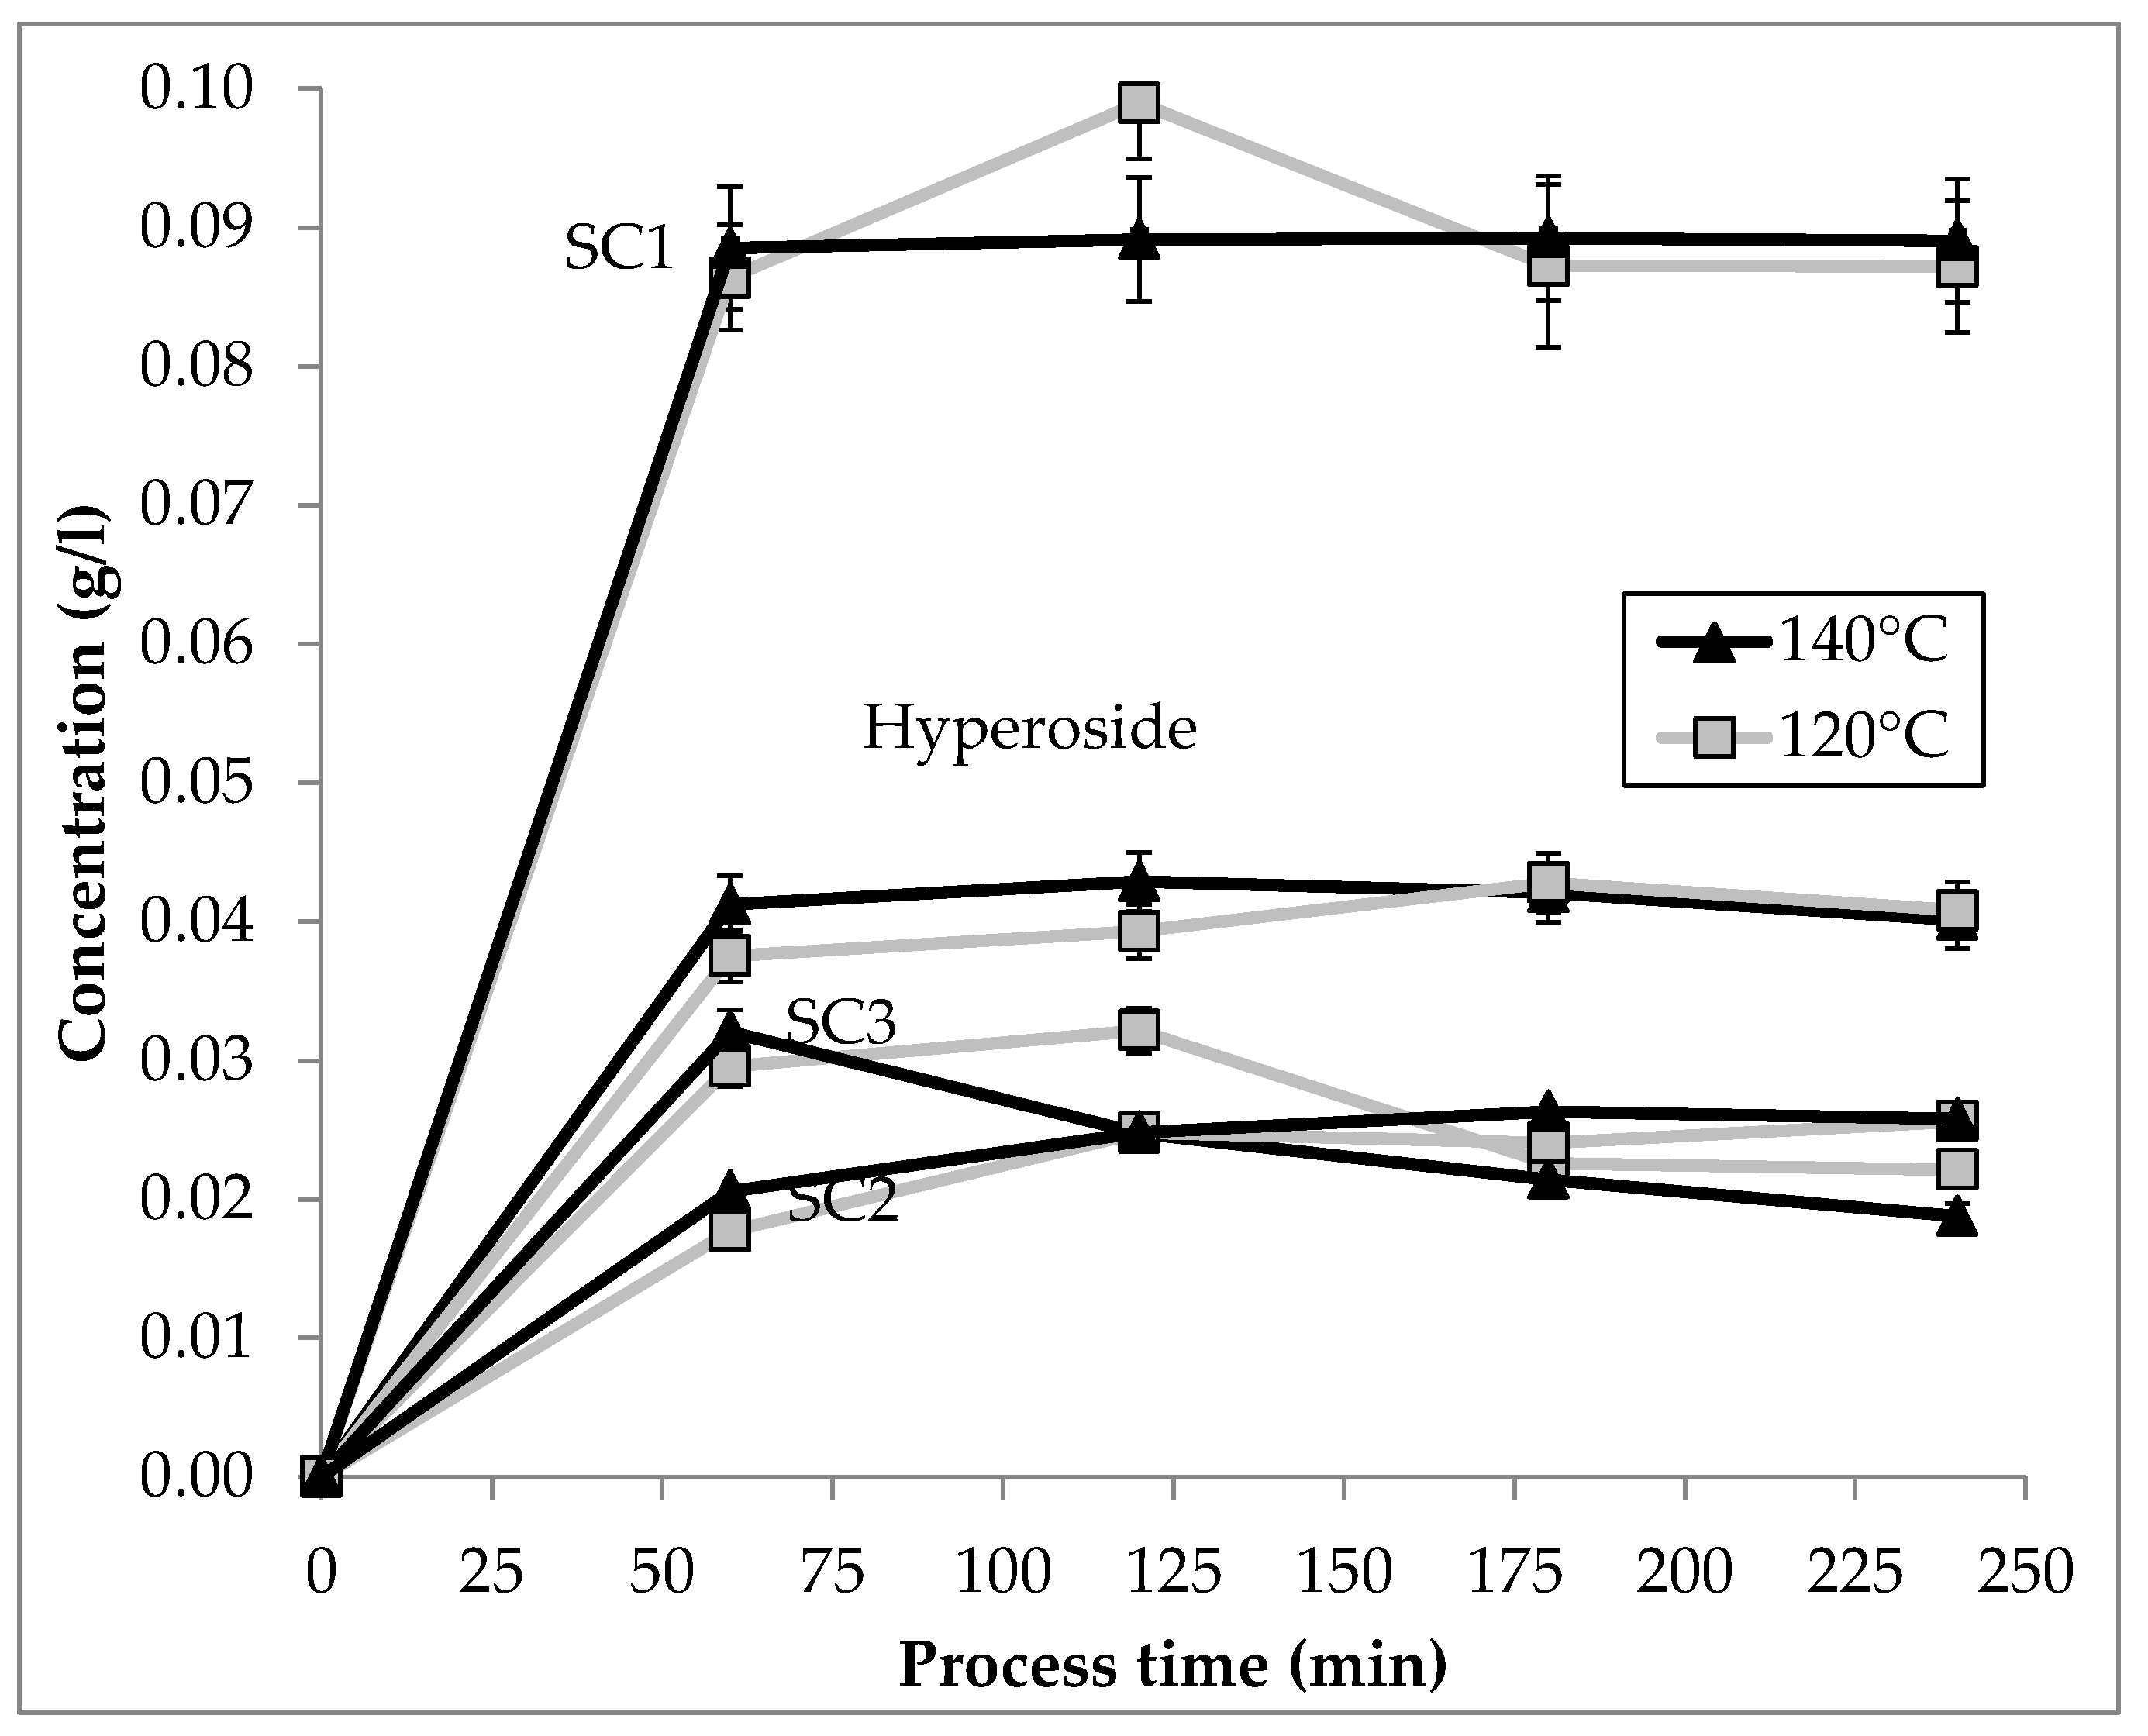
3.3.2. Thermal Degradation

To be aware of thermal degradation in hot water extraction is the key parameter for successful extraction [5,6]. As shown in the screening, no clear thermal decay could be traced by the provided data. For that, recycling-mode experiments were performed at 120 °C and 140 °C to assess the impact of high temperature toward hyperoside. The results are given in Figure 8. As it can be seen, all regarded components are quite stable at high temperatures. Only SC3 shows a rather small decline in concentration after 4 h of process time. At the chosen extraction temperature of 90 °C no thermal decay occurs, and the degradation kinetics can be neglected in the physico-chemical extraction model.

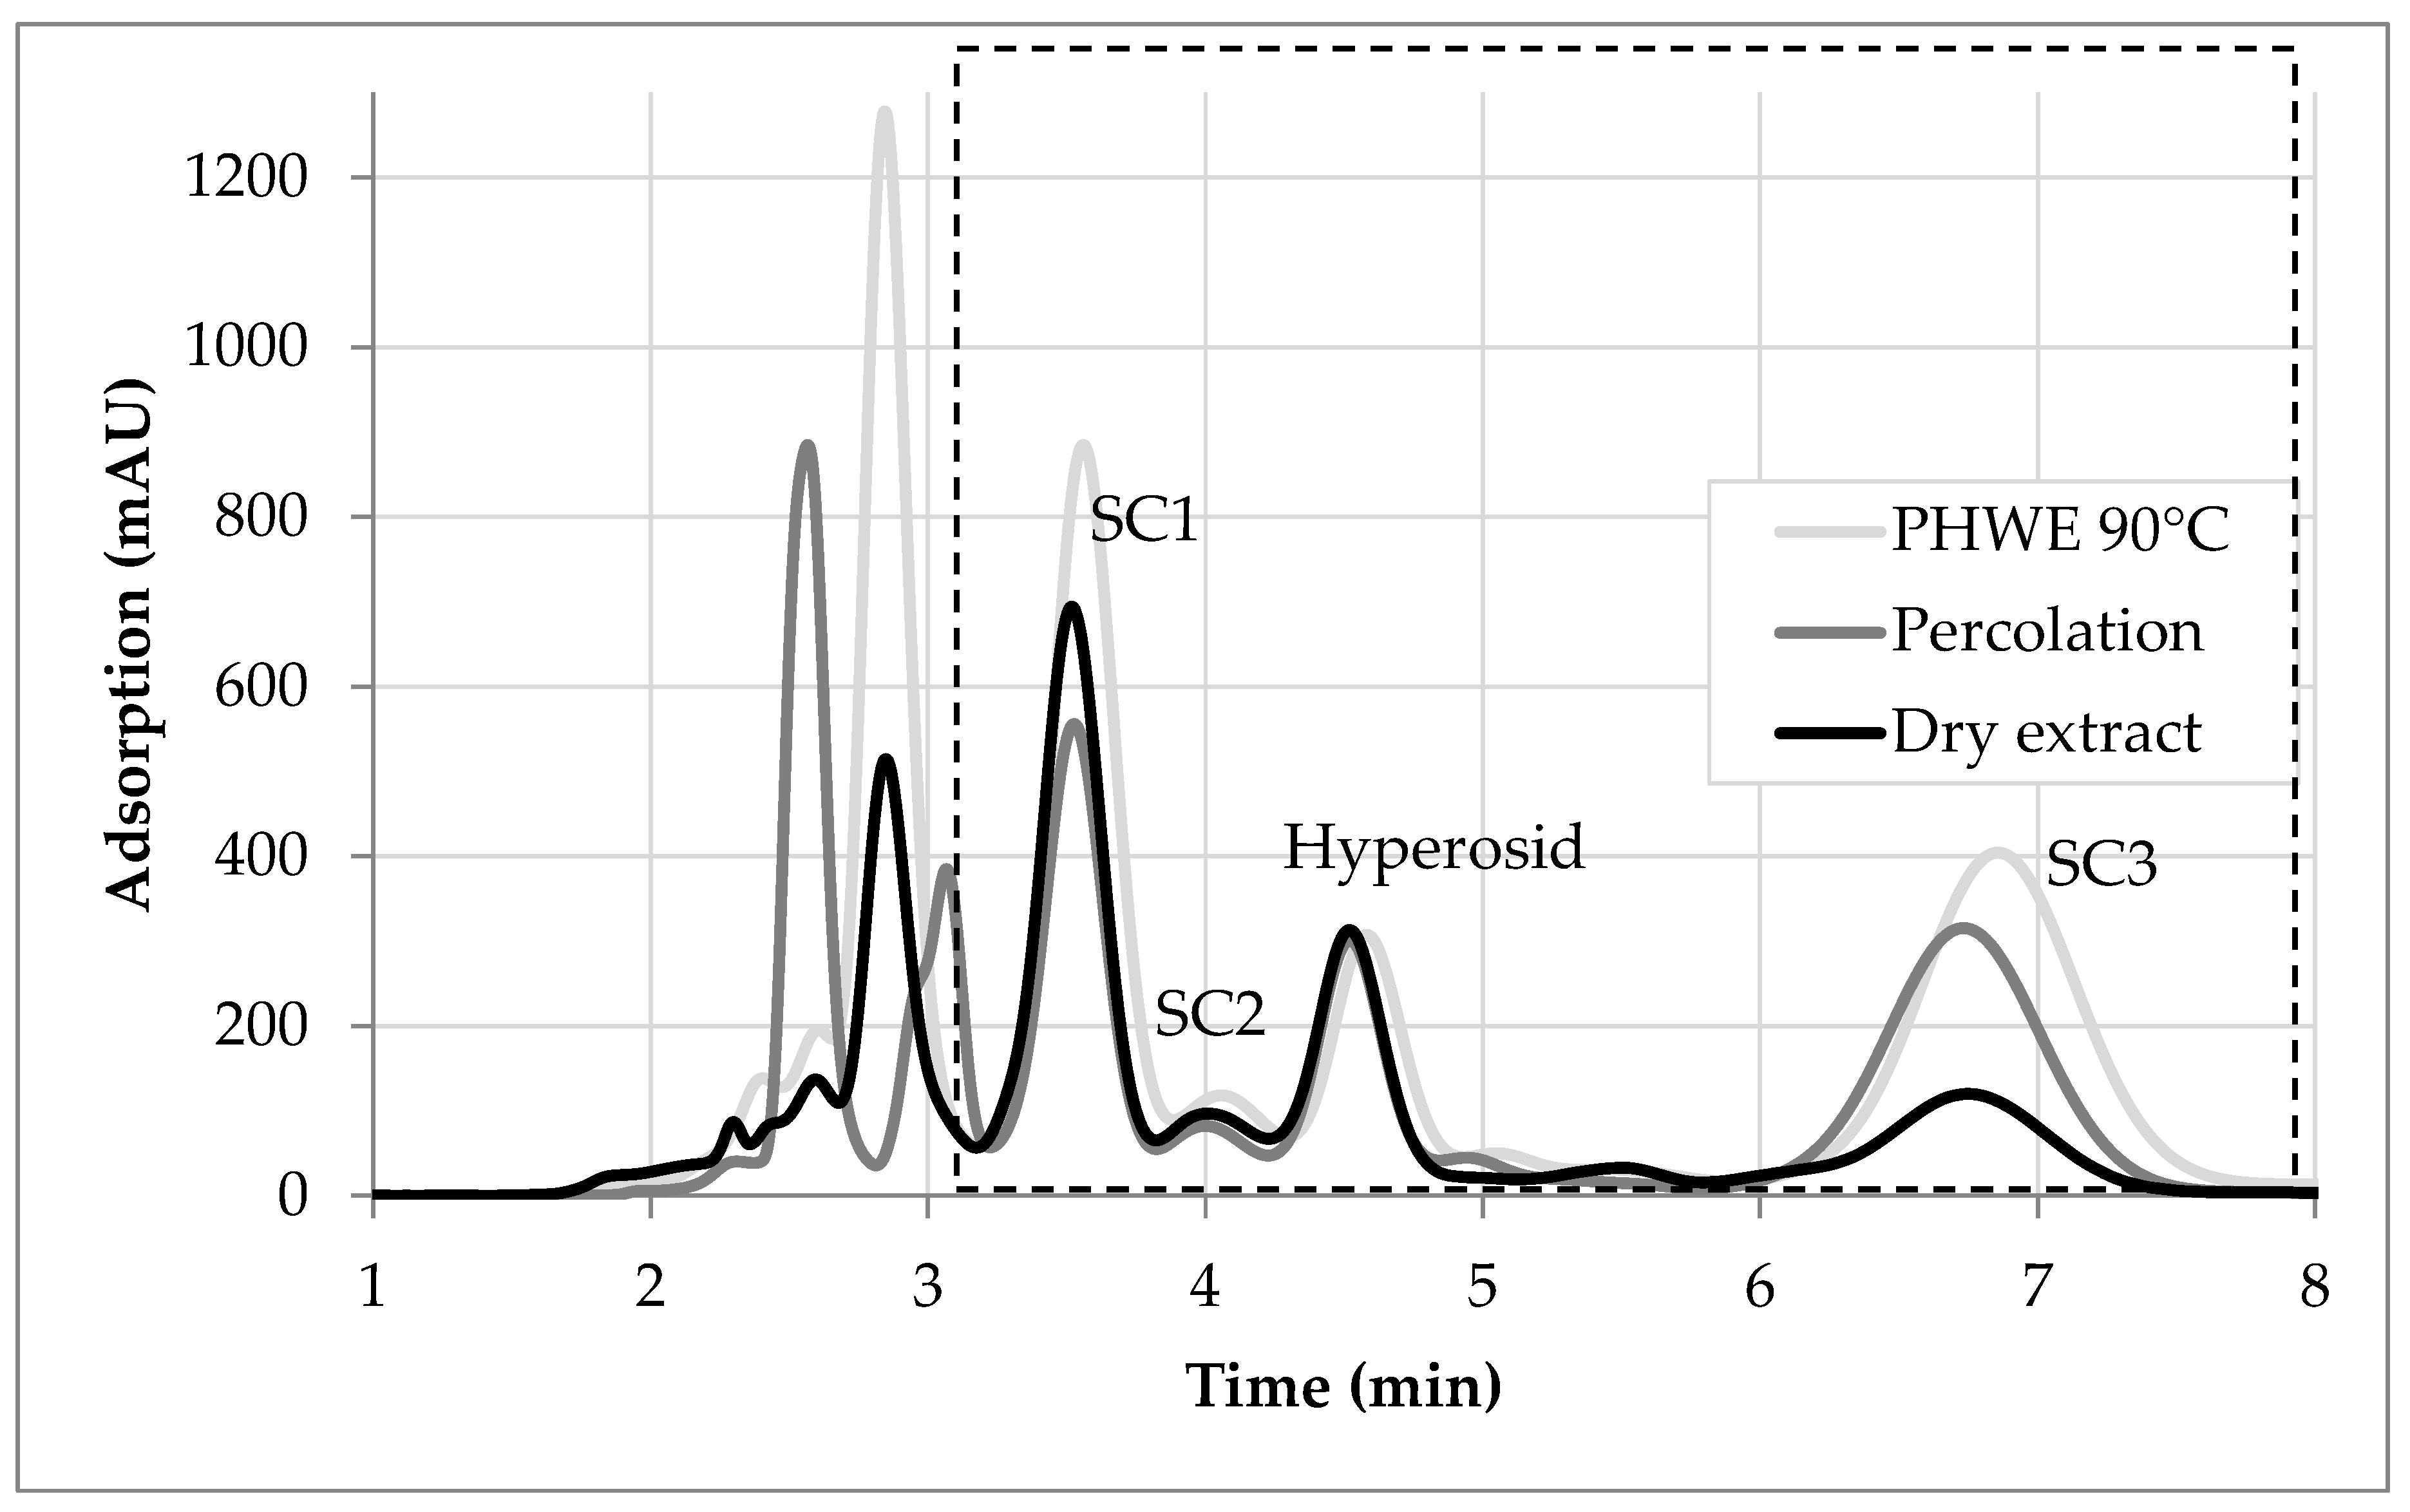
3.4. Evaluation of Hot Water Extraction and Solvent-Based Percolation

Experimental data (points) as well as the simulation results (drawn lines) of the conventional percolation of hawthorn are shown in Figure 9. Between 80 and 180 min of extraction, the acceptable range of the DER between 7:1 and 4:1 is exceeded. The extraction curves of the components show a strong bend in this timespan and according to economic considerations, the extraction should be aborted after 250 min at the latest. The DER shows a strong correlation with the individual substances, as expected. In that case the DER is a suitable tool for a basic process control, besides being technically overtaken by various procedures of in-line monitoring ranging from Raman-spectroscopy [20,25], IR-spectroscopy [25] or simple conductivity measurement. Because the simulation of the pressurized hot water extraction simplifies to a percolation, due to the thermal decay not being considered, the approach of modeling and model parameter determination is similar to that already shown and therefore is not shown in detail once again.
Besides process engineering aspects, the extract composition plays an important role. For an evaluation extracts of both, percolation and PHWE with a DER of 6:1 were compared to a commercially available product (ethanol 45 vol. %, DER 4–7:1). Assessed are the ratios of the side components relative to hyperoside. The chromatograms are shown in Figure 10 and are normalized to the peak of hyperoside.
  • Side component 1: SC1 shows a minor content in percolation compared to the commercially available product. According to the solvent screening, SC1 dissolves better in the solvent of the reference product. A significantly higher amount of SC1 is extracted during hot water extraction.
  • Side component 2: SC2 shows the same behavior as SC1. According to the solvent screening, it dissolves better in the solvent used to produce the reference extract.
  • Side component 3: The relative amount of SC3 in the reference extract is smaller than in the percolation performed in this study. According to the solvent screening the used mixture of 70 vol. % ethanol and 30 vol. % water has a much higher capacity towards this substance compared to the solution of the reference product. Again, the PHWE delivers an even higher amount.
The chromatograms match the observations of the solvent screening. The PHWE reaches the highest values of all side components, therefore it can be considered as less selective, compared to the percolation. It must be considered that the reference extract was not obtained from the same batch of plant material used for the shown extraction experiments of this study, but the place and year of harvest are the same. Moreover, it is not the objective of the shown fingerprint approach, to evaluate the quality or efficacy of the extracts, besides it is not yet known, which substances or group of substances are responsible for it [26]. Products that are only specified by the DER, commonly pass an internal quality management process, where fingerprint methods are widely used [8]. With the shown approach of experimental model parameter determination on lab scale and physico-chemical modeling, it is now possible to predictively simulate markers, which are monitored in fingerprint methods, anyway, while monitoring the DER at the same time. Advanced process control and a model-based endpoint decision are possible [20]. This requires a process development with regards to the principles of Quality-by-Design (QbD) in a new approval of the product [19].

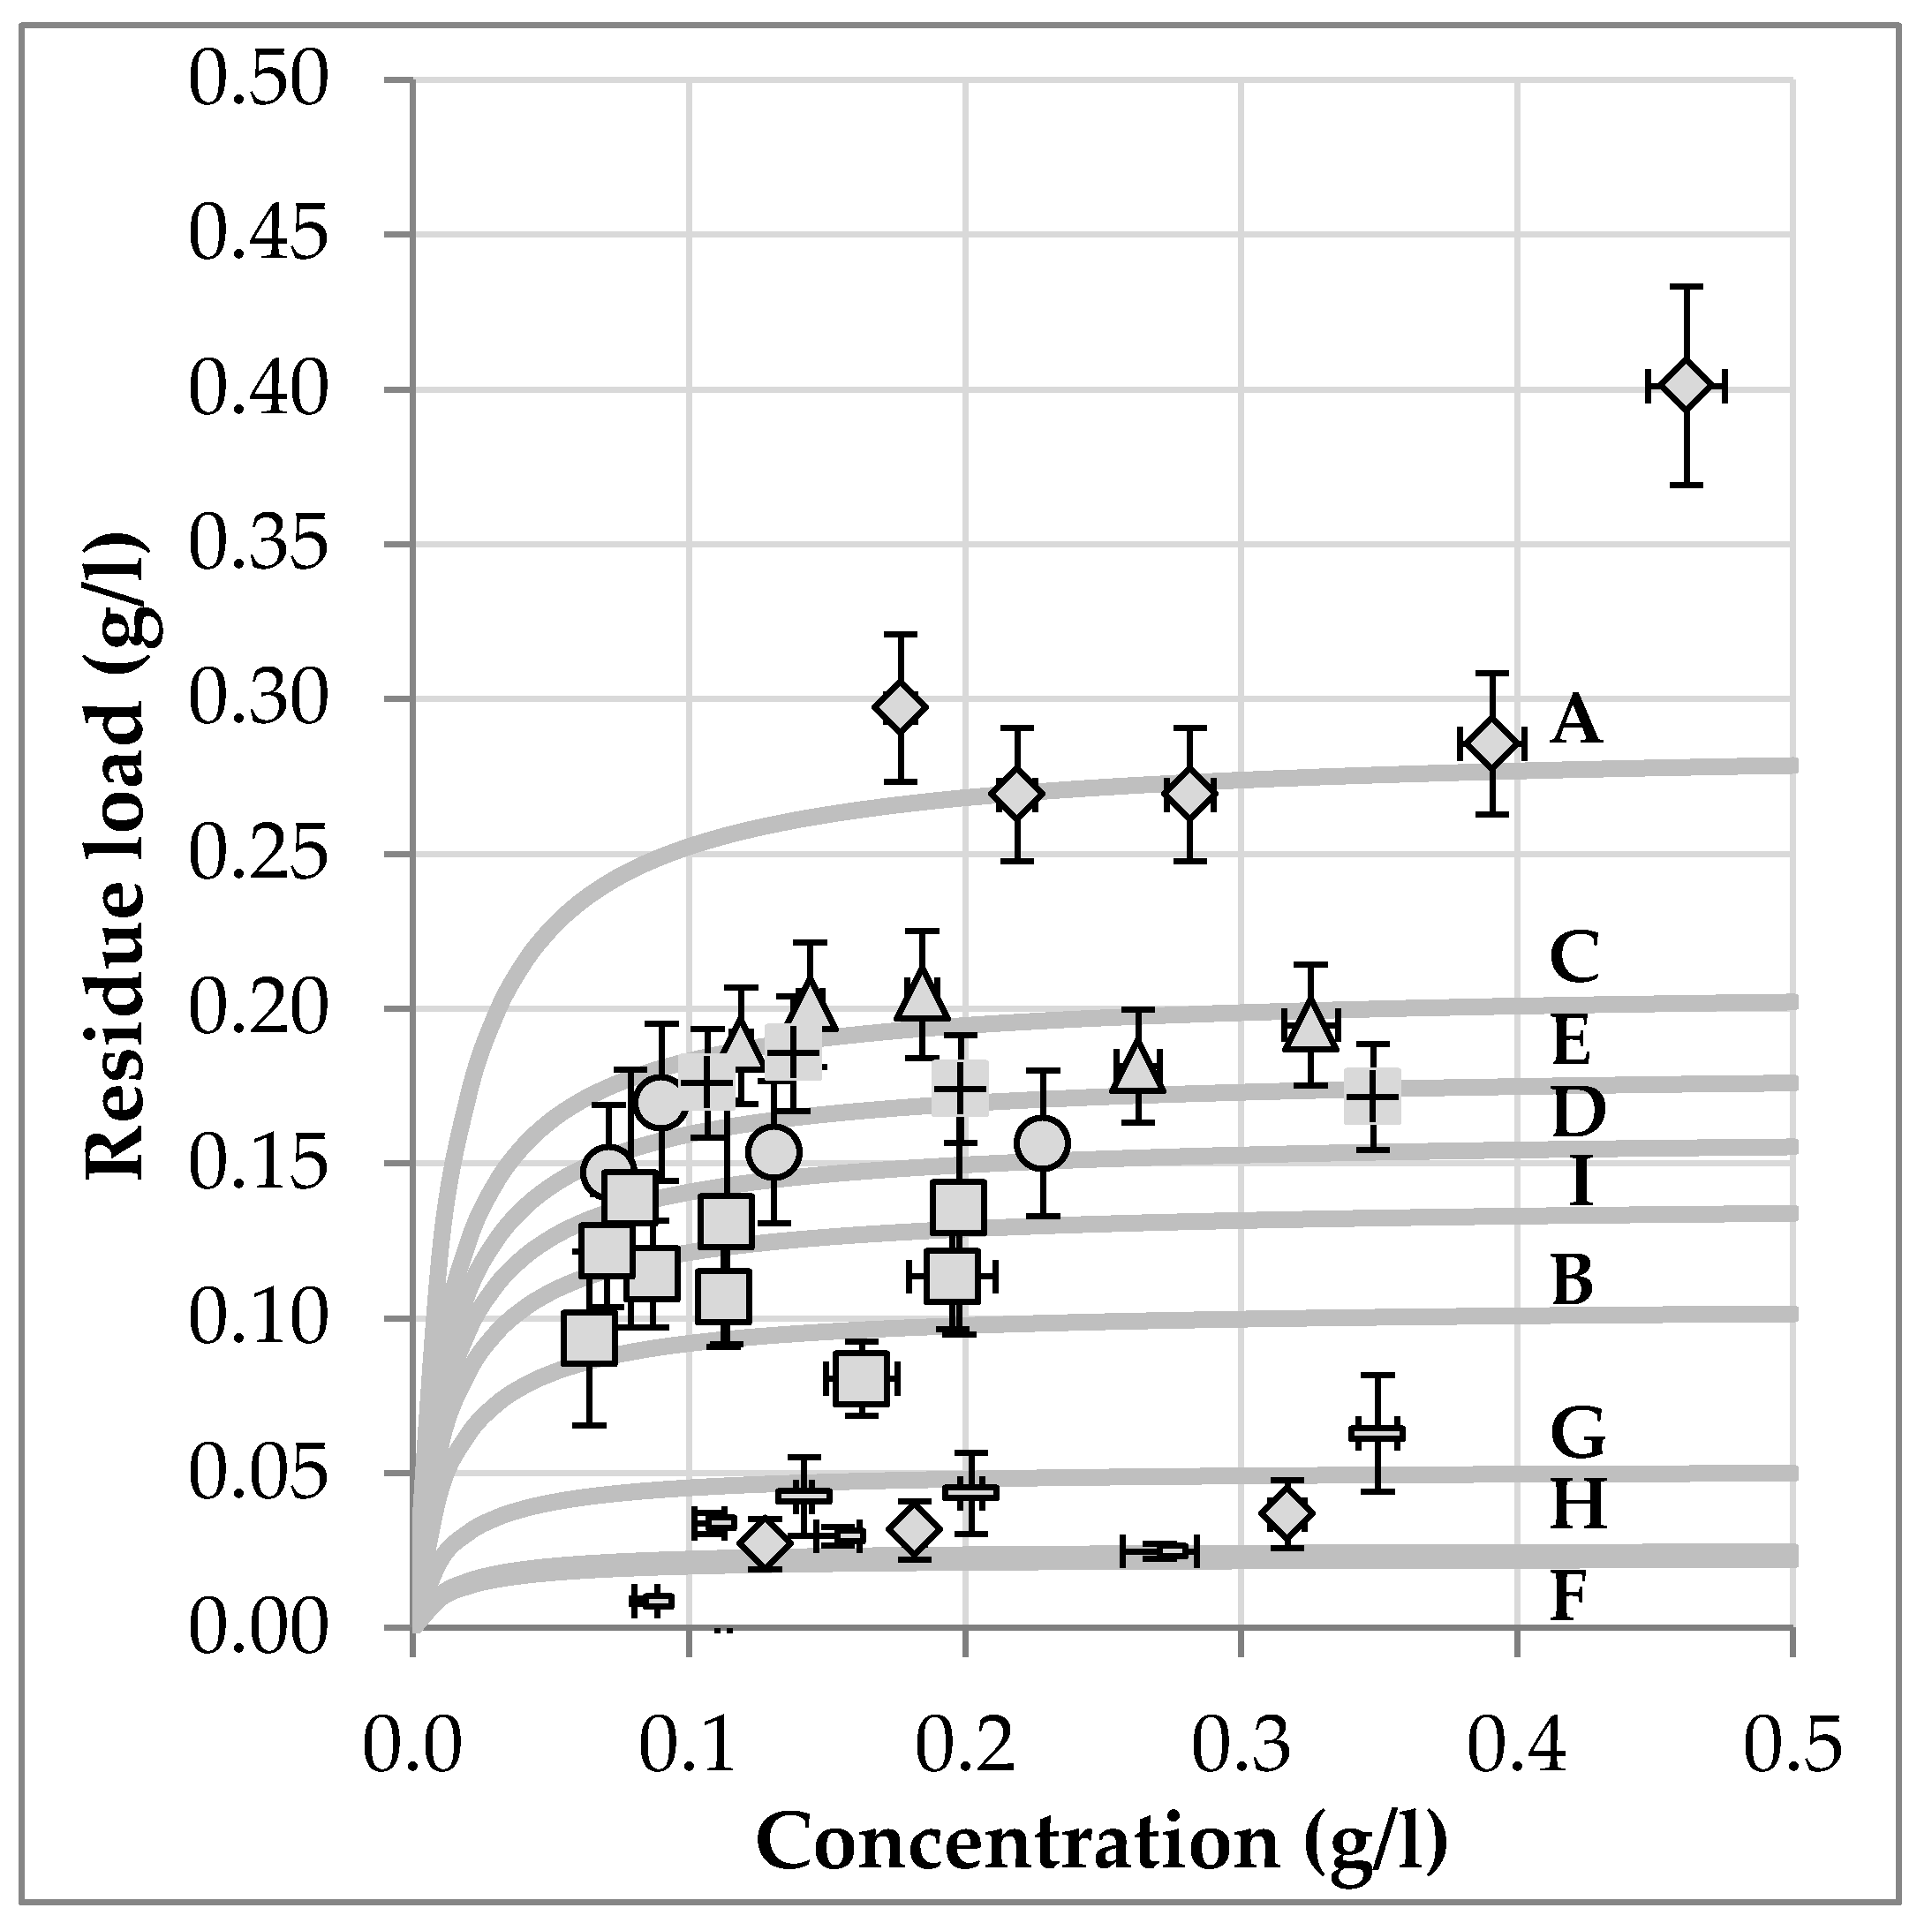
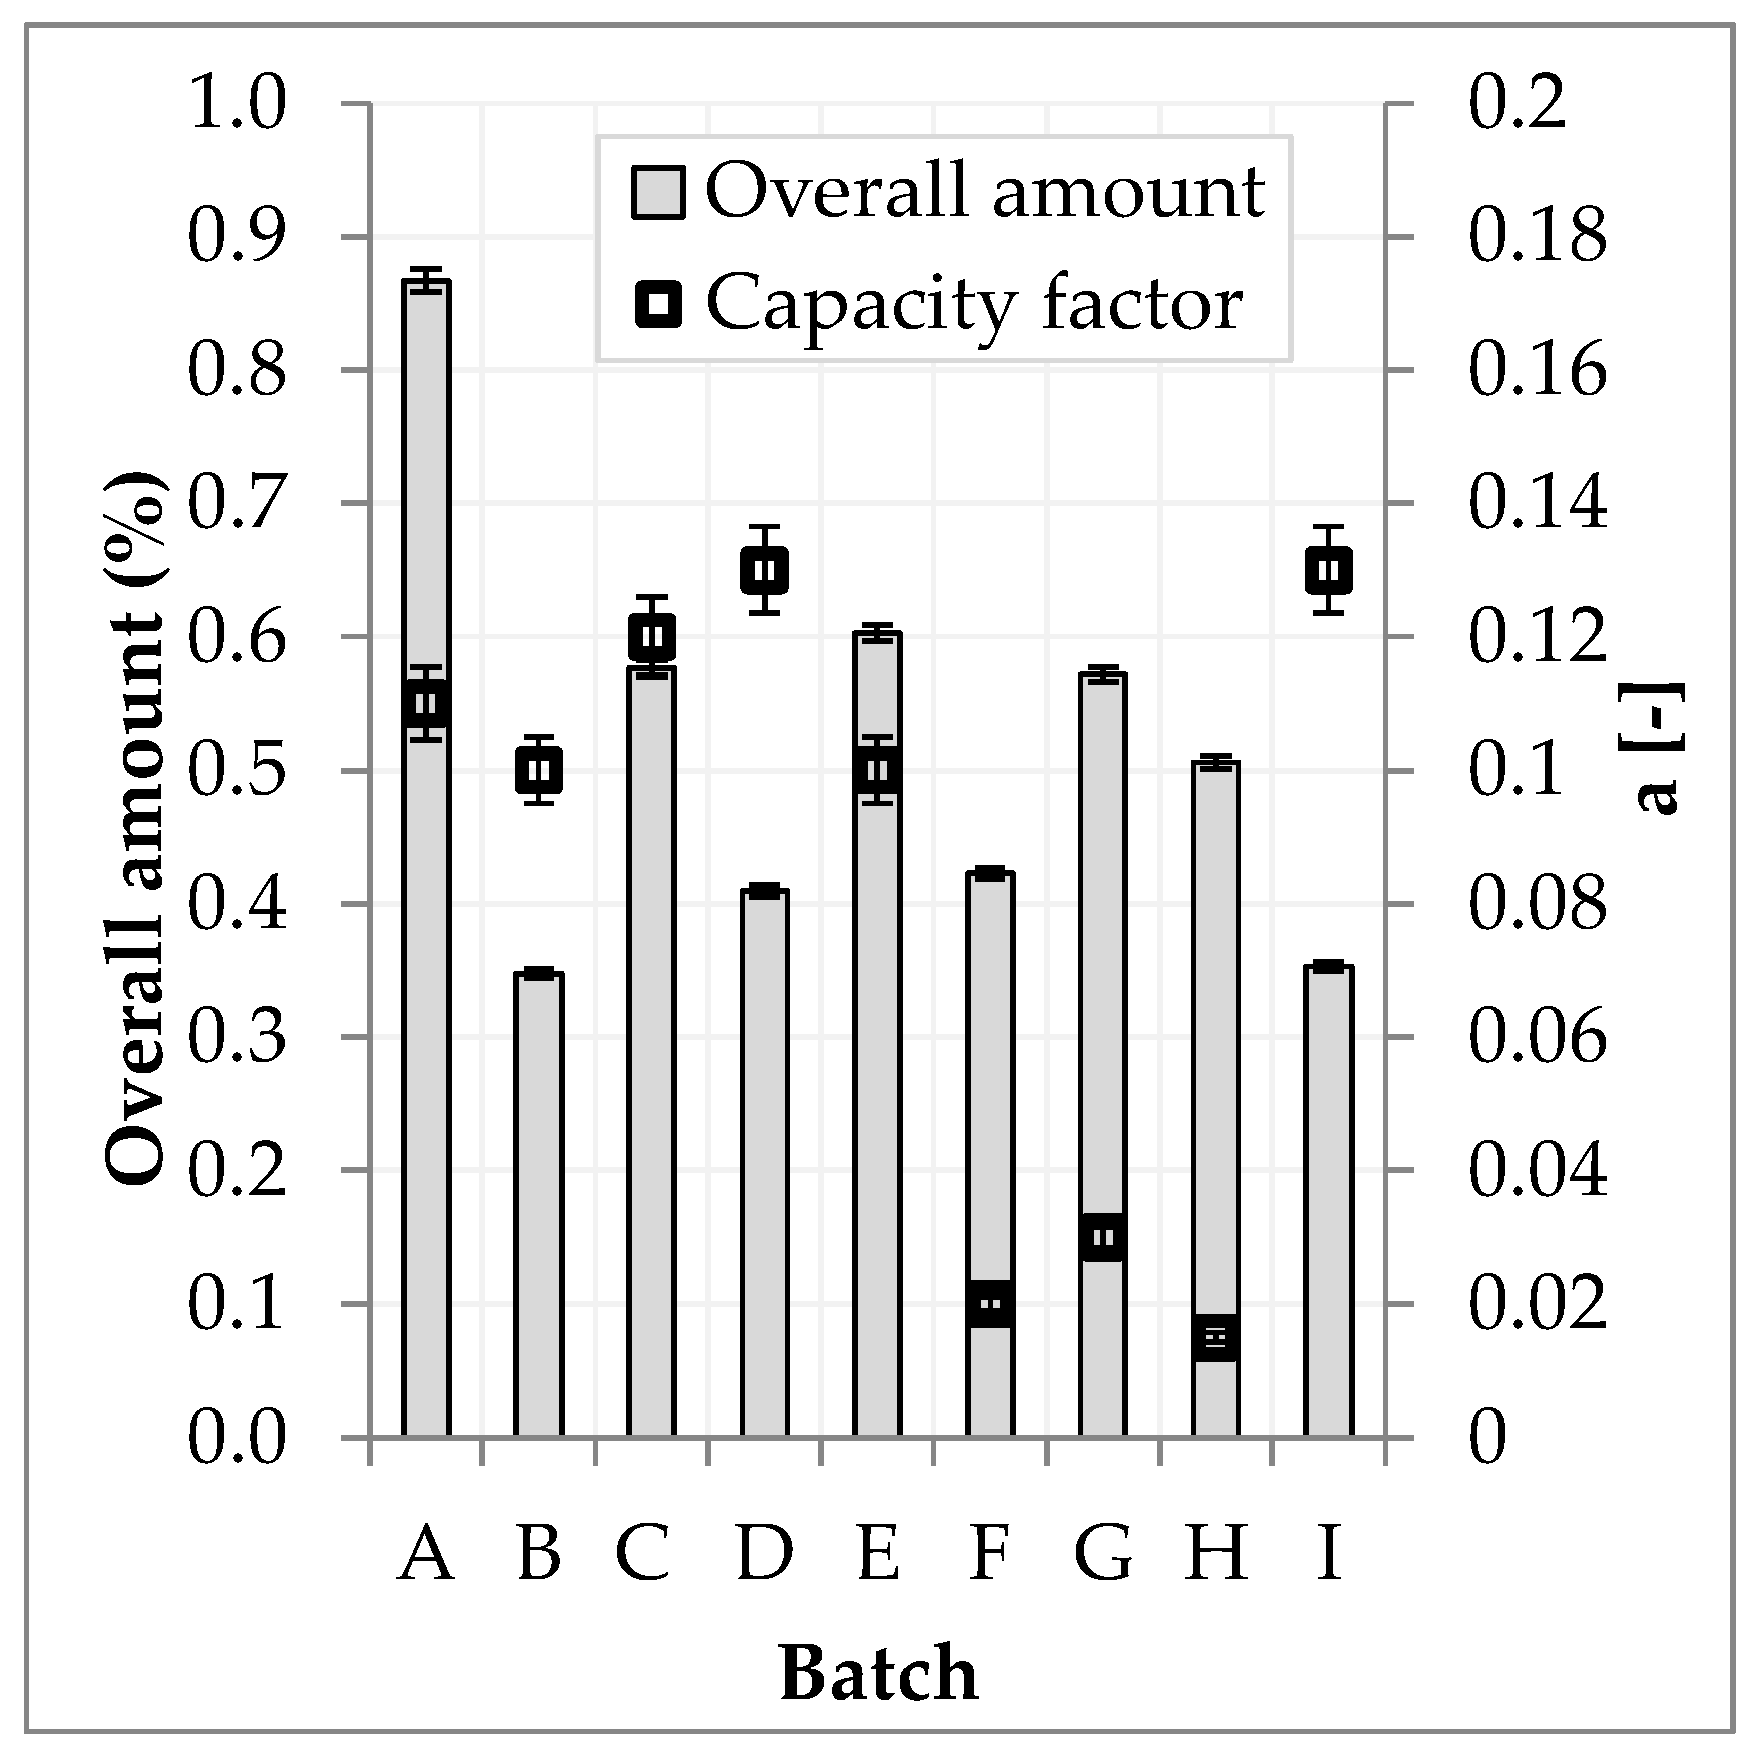
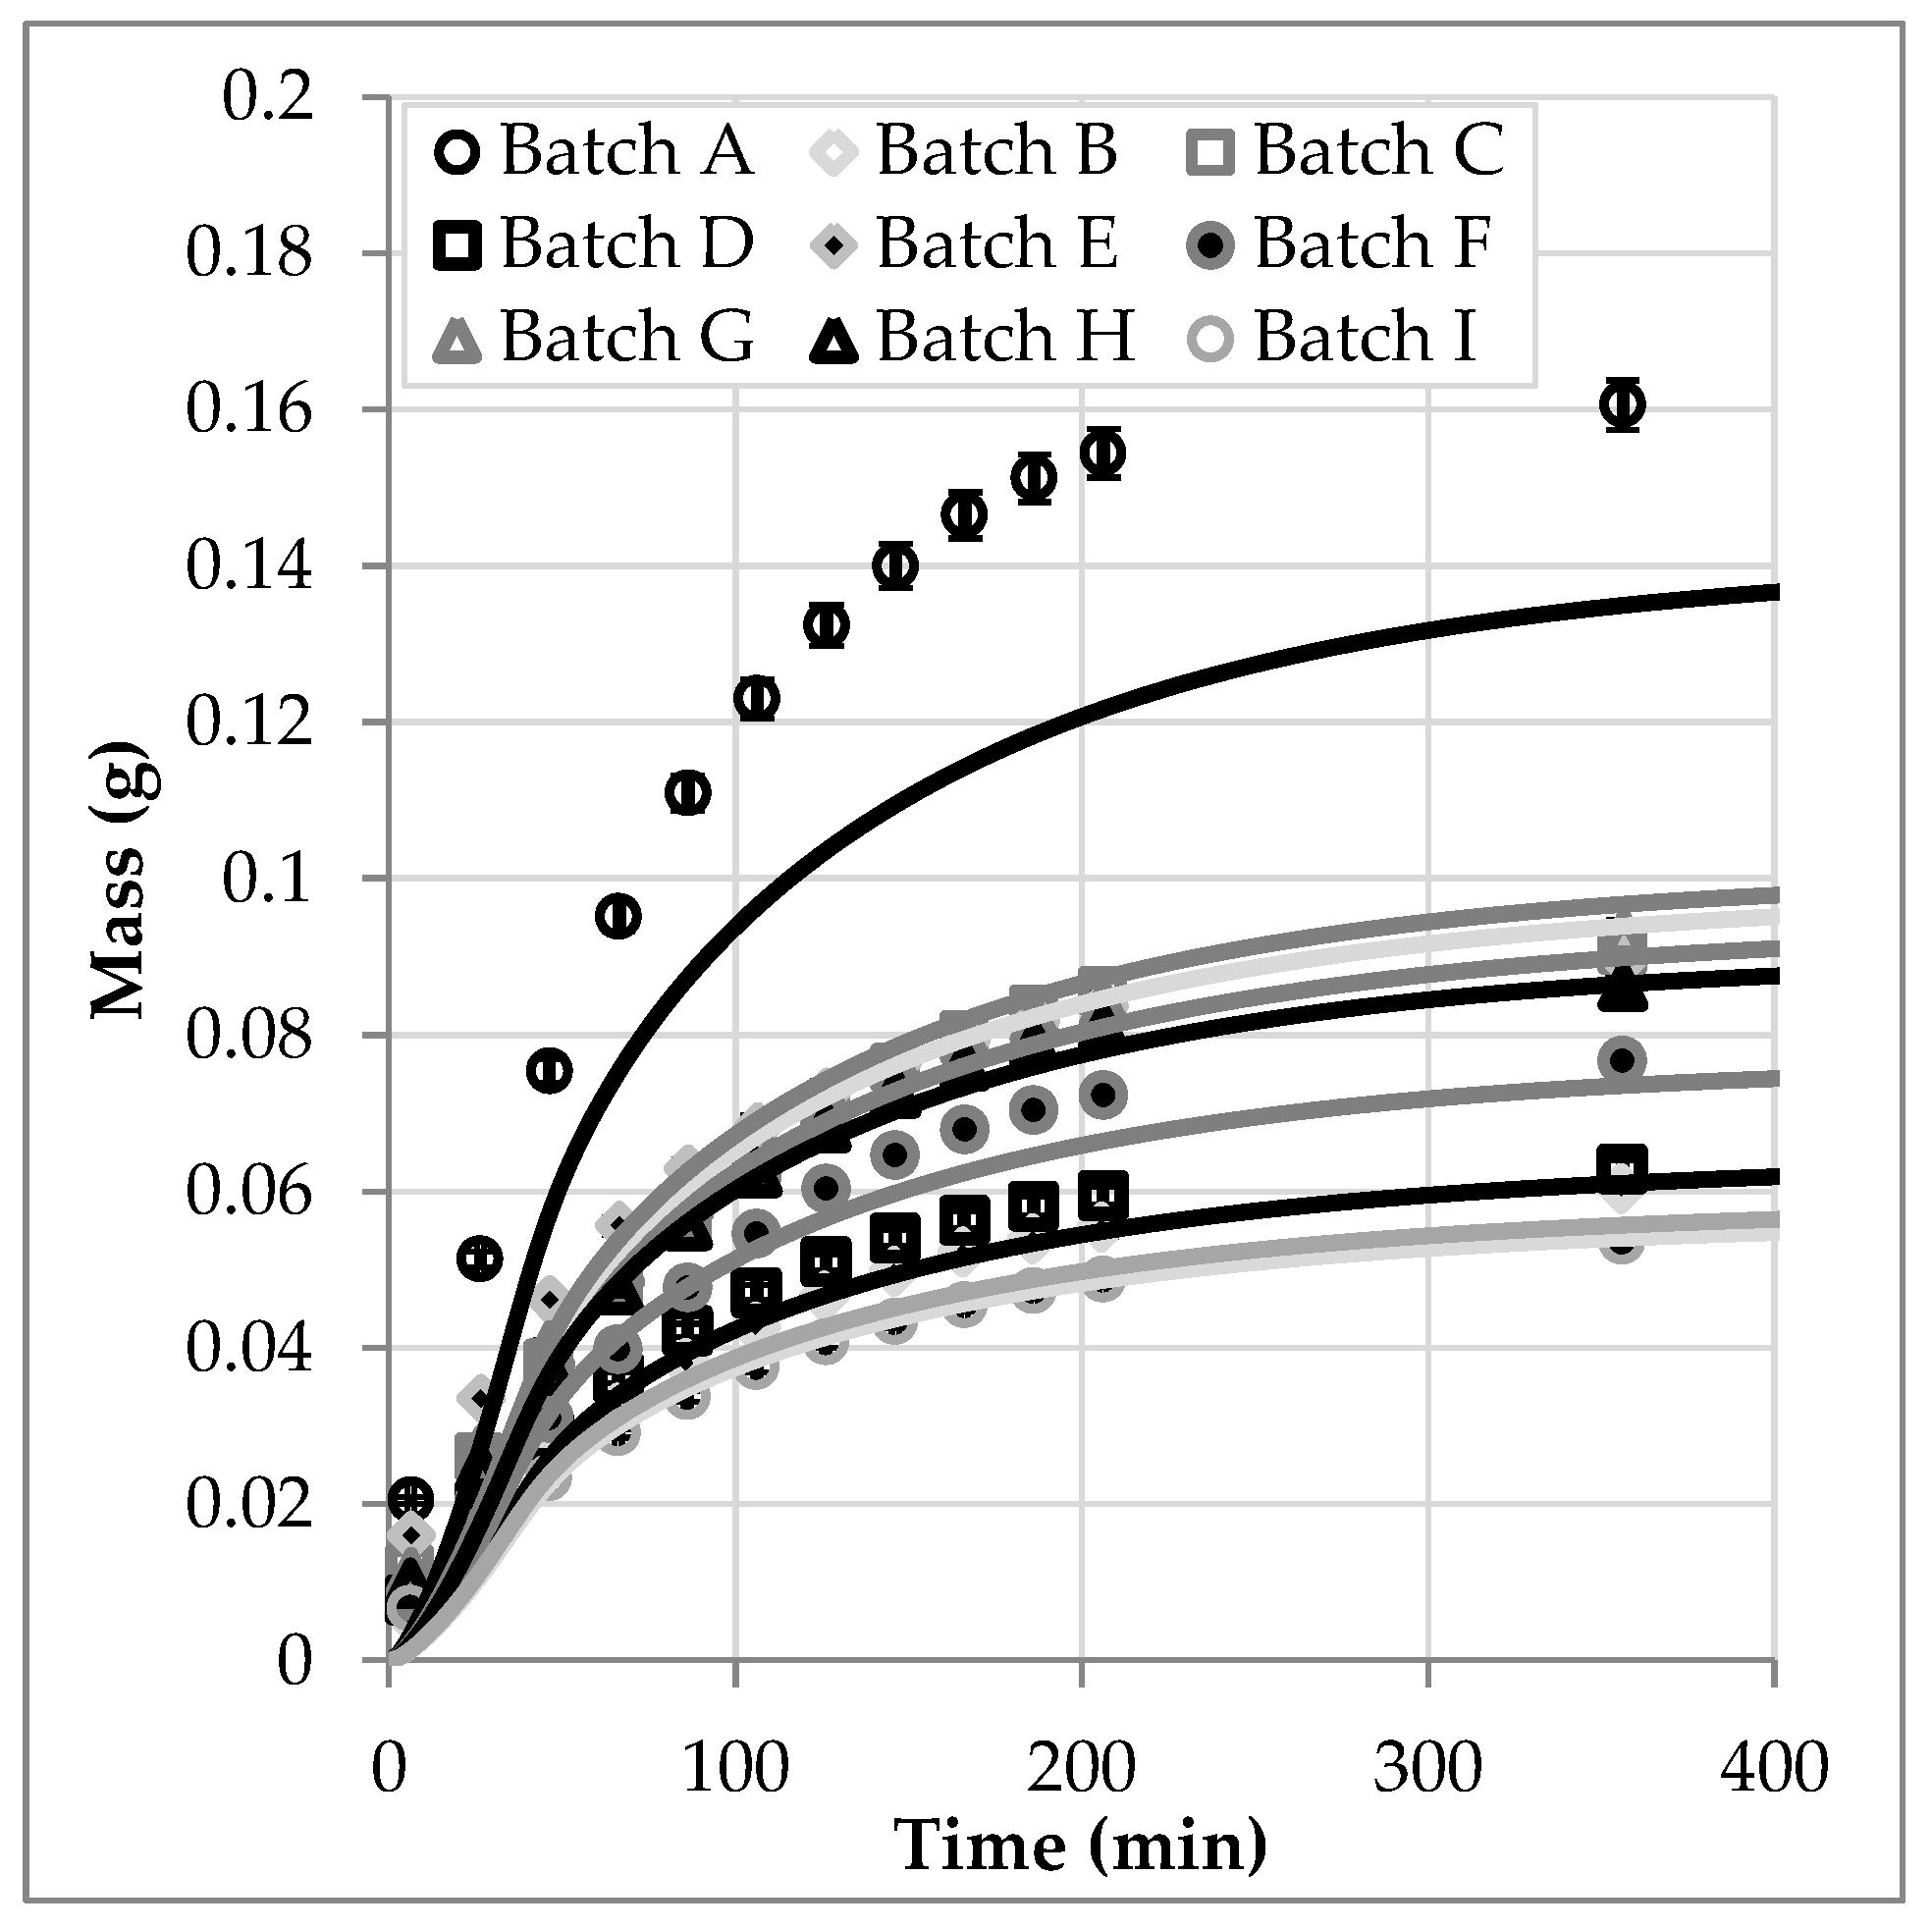
3.5. Batch Variablity

A fundamental challenge in extracting plants is the content of the ingredients, which fluctuates due to natural growth and site conditions. In terms of a model description of the solid-liquid extraction, the total content and the equilibrium per batch would have to be re-measured, if no systematics can be derived between the two parameters. To determine a possible dependency, a total of nine different batches, which differ by crop year (and thus storage life) and location, were examined. The equilibrium data are shown in Figure 11 and are interpreted as Langmuir-isotherms.
The Langmuir coefficient is considered constant for all curves. The maximum load qmax is basically determined by the total content of the respective component. Experimentally, however, it is observed that the equilibrium practically never reaches this final value. The deviation is described based on a model parameter a, which is referred to below as the capacity factor according to Equation (5).
q = q max     a     K L     c 1   +   K L     c
Obviously, in the equilibrium relationships, the maximum loading is not reached, which indicates that there is no pure ad- or desorption equilibrium in the extraction of plants. A high partition of the valuable substance is dissolved e.g., in the vacuole or in cell interspaces. This corresponds to the model concept ‘Broken and Intact Cells’ by Sovová [27]. Kassing et al. have taken up this concept in the pore diffusion model and implemented it using a radial target component distribution [14,15]. If the target component distribution can be measured by methods such as Raman mapping [25], this can be implemented. If no corresponding data are available, the introduction of the capacity factor as a macroscopic parameter reflects the basic idea of the ”Broken and Intact Cells” model, which is based on discontinuously differentiable equilibrium lines [28,29]. If the solvent can dissolve and transport away a large amount of the target substances, or if it is accessible, only a small fraction, which is actually adsorbed in the cell or between the cells, remains. An extreme example is the fennel fruit, in which the essential oil is localized in channels around the actual fruit and in principle only has to be displaced by the solvent, which leads to very flat or barely measurable equilibrium lines [30]. If, on the other hand, the solvent has only a small capacity, then much of the dissolved substance remains in the cell or a large amount of solvent must be made available. In this case, clearly pronounced equilibrium lines result.
The resulting equilibrium lines for the respective systems hyperoside-hawthorn-ethanol/water (70/30 v/v) are shown in Figure 11. The Langmuir coefficient was chosen to be the same for all datasets (75). There are differences only in the measured total content and in the capacity factor. The total content, year and country of harvest and the capacity factor a are summarized in Table 1. Batch I is the reference batch used in the previous experiments.
The overall amount with respect to the reference batch I varies from −1% to +146%. The capacity factor assumes values between 0.10 and 0.13 for all batches except F to G. Batches F to G showed significantly fewer flowers in the extraction material; the capacity factor for these samples was 0.021 ± 0.006. The results are shown graphically in Figure 12.
Obviously, the capacity factor does not correlate with the total content. It is, therefore, not batch-specific. Since it is understood in the model concept as a macroscopic implementation of the Broken and Intact Cell model, the data support this hypothesis. In addition, batches F, G and H show a parameter which is clearly different from the other batches and is very probably related to the lower share of flowers in the extraction material. The comminution of the extraction material here apparently causes a different, reproducible cell disruption, which consequently results in a different capacity factor. With the same pre-treatment and a visual inspection to determine the share of flowers in each batch, so only the total content must be measured. The capacity factor can then be assumed to be constant.
This data is the basis to simulate the individual percolations of the different batches, as shown in Figure 13. The capacity factor is constant at 0.115 for batches A to E and I and 0.021 for batches F, G and H. Apart from the individual total content of the respective batch, no further value is changed in the simulation.
The deviations between simulation and experiment relative to the experimentally determined total mass of hyperoside are listed in Table 2. The simulations of batches A and B are underestimated by 16% and 10%, respectively. For these two batches, the average particle size was probably smaller than expected, which limits the diffusion in the simulation more than was the case in the experiment. The remaining batches have maximum deviations of +5% and 4%, respectively.
Examination of individual hawthorn batches showed large fluctuations of the hyperoside content. Nevertheless, the equilibrium could be described uniformly across all batches. Using this database, only the total content of a new batch must be measured and a predictive simulation is possible. In addition, the capacity factor can be correlated with complex matrix IR-spectra of the powdered plant material. These fingerprint spectra, which are determined as triplicates, are shown in Figure 14A. A principal component analysis (PCA) of the second derivative of these spectra shows a detailed clustering of the different batches, as depicted in Figure 14B. The batches F, G and H with the lower share of flowers are clearly separated from the batches with high share of flowers. Therefore, the fast track data acquisition for predictive simulation of the lot variety can be performed with IR-spectroscopy using the raw material.

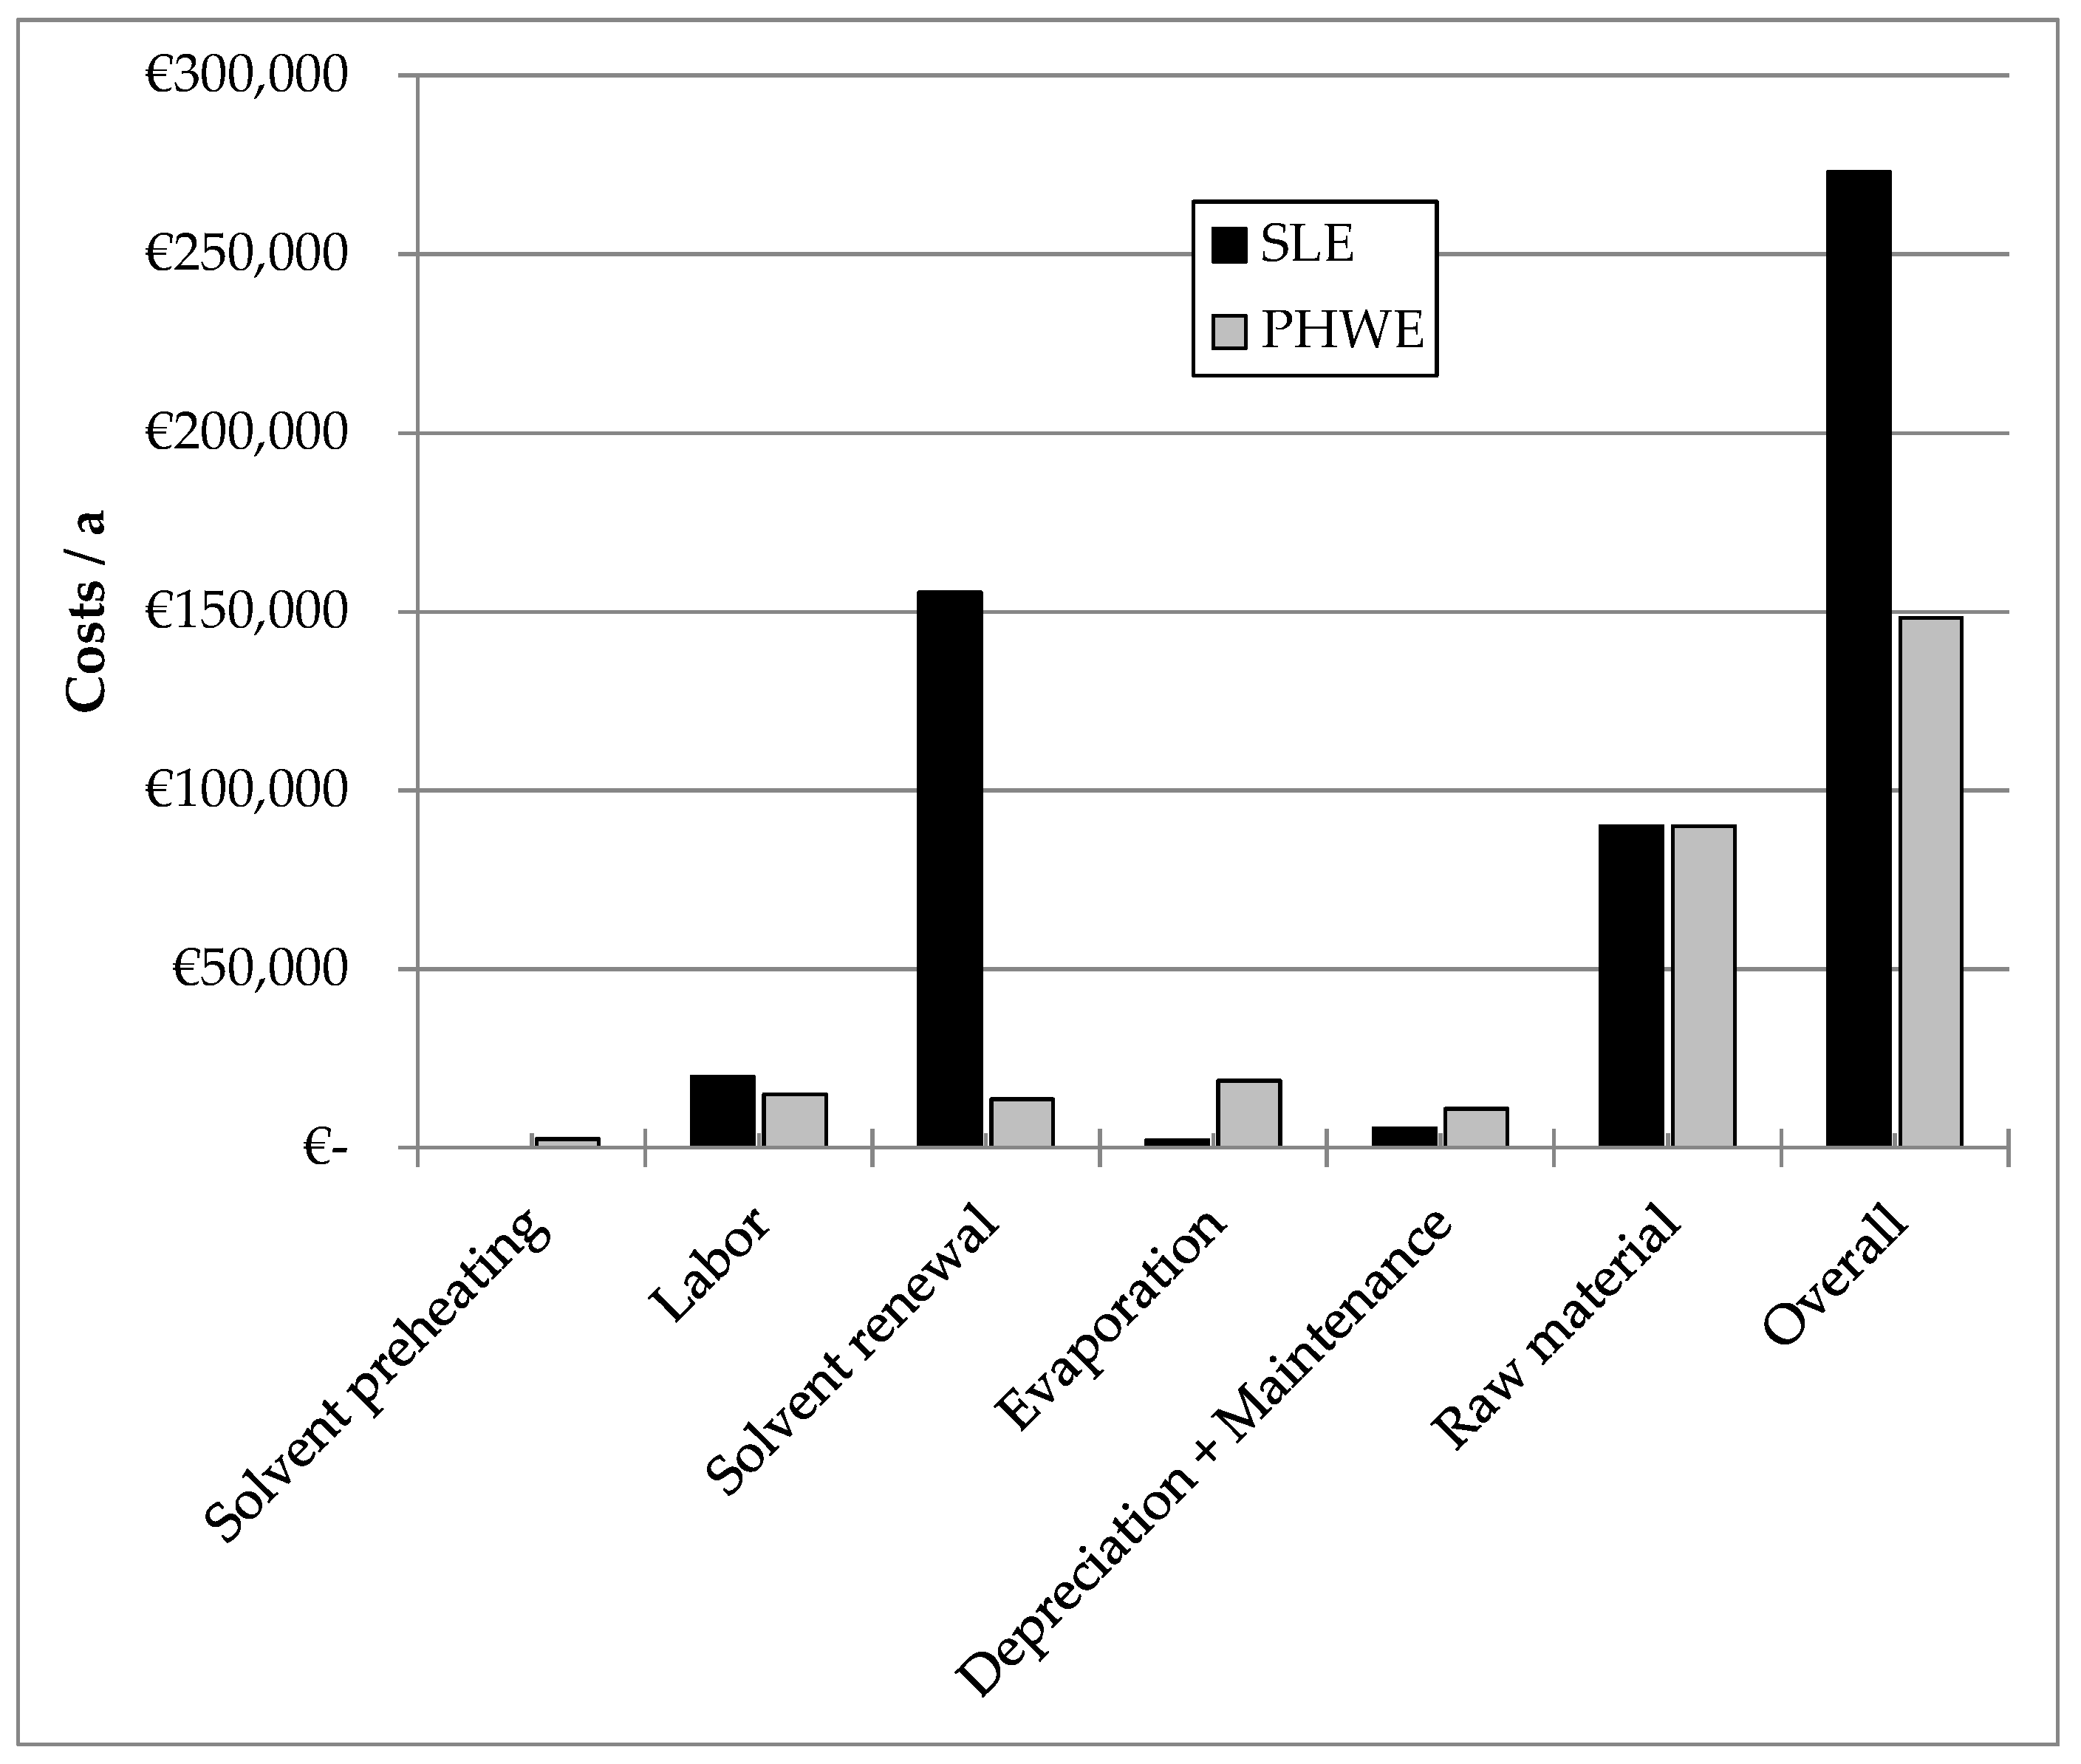
4. Economic Feasibility Study

Both hot water extraction and conventional percolation have their own specific advantages and disadvantages. Based on a profitability analysis, economic aspects should be considered in addition to the purely procedural aspects. To make the cost study, the following assumptions were made:
  • 30 tons of hawthorn leaves are to be extracted annually in 60 batches on a multi-product device. The purchase price is 3 €/kg. The annual occupancy of the system with this product should be 25%.
  • For the SLE as well as for the PHWE, an extractor of 2 m3 empty volume is available. The investment costs for the SLE amount to 200,000 €. The high-pressure equipment is 100% more expensive than the conventional technology and amounts to 400,000 €.
  • Operating parameters and process times up to 95% yield are directly taken from the laboratory studies.
  • The energy costs are split into solvent preheating (here PHWE only) and evaporation. To operate the evaporators and the preheating steam (120 °C, 5 bar, 2.7 MJ/kg) is used at a price of 13 €/t.
  • 10% of the solvent quantity per extraction is lost due to losses and must be renewed continuously. In addition, once a year, the entire pre-existing solvent, which is assumed to be 20 m3, is replaced. For the ethanol, a price of 3 €/L and for water 0.08 €/L is assumed.
  • A worker is scheduled for the operation of the plant. The labor costs amount to 100,000 €/a and are weighted according to the total process time of the extraction of hawthorn added (multi-product plant!).
  • The costs for depreciation and maintenance for this product amount to 2.5% of the total system costs (multi-product investment!).
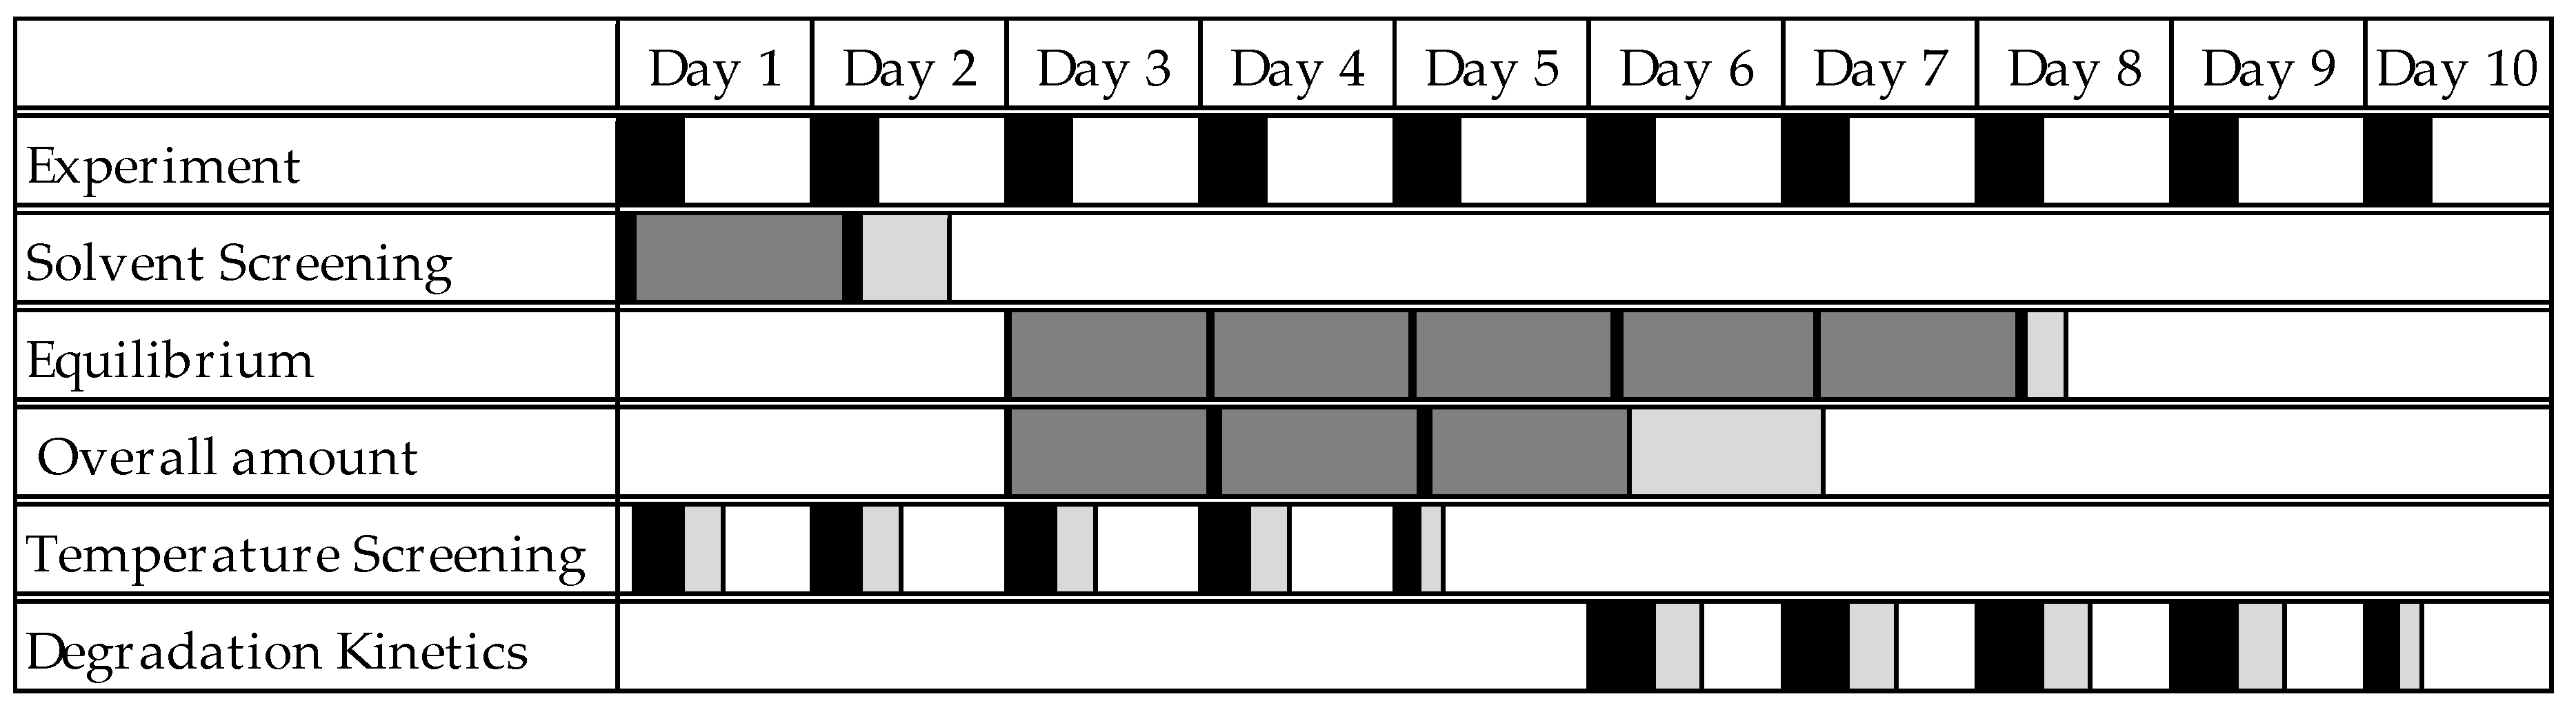
The result of the cost study is shown in Figure 15. The total annual PHWE costs are about 50% less than conventional extraction. The biggest difference is the annual solvent change. Hot water extraction can save about 99% of the costs compared to SLE. If the solvent is not renewed annually, the PHWE is still about 30% cheaper. However, the evaporation of the aqueous extract takes up about 10 times the amount of energy. The significantly shorter process time for hot water extraction means that staff can be used much more efficiently, which means that the personnel costs of this product are around 20% lower than in the comparative process.
The cost calculation shows that the PHWE is competitive, even if the equipment is much more expensive. In addition, it can be seen that the cost of conventional extraction is dominated by the solvent. This means that often procedurally sensible operating points, here 70% ethanol and 30% water as solvent, are not feasible for economic reasons. In this case, this results in the industry-preferred solvent mixture of only 45% ethanol, which drastically reduces the cost of solvent renewal but is not the optimum according to solvent screening. Here, PHWE offers the opportunity to implement the optimum process technology at reasonable costs.

5. Effort Analysis

The evaluation of hot water extraction and conventional percolation is based on a valid model parameter determination which can be handled under sensible experimental effort. For the modelling and simulation of extraction processes to become routine industrial processes, the path shown must be superior to a purely empirical design using statistical experimental design. For this purpose, Figure 16 shows a schedule for a complete parameter determination which must be handled by a person with the corresponding equipment. Black is the actual working time, dark gray are the times in which the experiment does not have to be supervised and light gray is the time in which the analysis takes place.
For a complete parameter determination, with each assay being run as a triple determination, appr. 10 days are required. The classical extraction experiments can be left unattended most of the time, which is why the more labor-intensive model parameter determination for hot water extraction can take place in parallel. To determine all parameters, only appr. 300 g of plant material and 8 L of solvent are consumed. If a statistical test plan is used instead of model parameter determination and simulation, one percolation can be carried out daily with the same equipment. Even with only three parameters and one center point, a full-factorial experimental design results in 11 experiments, which, taken together, have a much lower information density than the shown path of model parameter determination and a predictive process simulation. The model-based approach is therefore to be preferred in any case, especially since with increasing experience the results can be very quickly checked for plausibility or can be transferred to other material systems.

6. Conclusions

The study showed a systematic and model-based comparison of two different ways of manufacturing a traditionally used herbal extract. Both a percolation using a mixture of ethanol and water (70/30 v/v) as solvent as well as an extraction with water at 90 °C show high productivities and yields. A high yield of the main flavonoid hyperoside as well as the desired range of the DER is reached. The chromatographic fingerprints revealed that all extracts are comparable to a commercially available one. The combination of experimental model parameter determination and rigorous process model is an efficient method of predictive process simulation, not only for the extraction of substances which are afterwards purified to pharma-grade, but also for the processing of traditionally used complex extracts. For the first time, natural batch variability was successfully incorporated into the physico-chemical process modelling concept. These generated data sets are required by regulatory authorities demanding Quality-by-Design (QbD) and Process Analytical Technology (PAT) approaches as modern tools with data-driven decisions documented for filing due to technological change, entering of markets of other countries as well as changes of regional regulations and authority inquiry. An economic feasibility study showed that the PHWE can overcome the financial drawbacks of solvent storage and renewal efficiently, thereby justifying the higher investment costs for the necessary high-pressure equipment.

Author Contributions

M.S. did the conceptuation, experiments, simulations and validation. J.S. did the supervision and the reviewing of the manuscript.

Funding

We also acknowledge the financial support obtained from the Deutsche Forschungsgemeinschaft (DFG) in Bonn, Germany (project Str 586/4-2). The authors want to thank the Bundesministerium für Wirtschaft und Energie (BMWi), especially M. Gahr (Projektträger FZ Jülich), for funding this scientific work.

Acknowledgments

We gratefully acknowledge the support of the ITVP lab-team. Special thank is also addressed to M. Tegtmeier (Schaper and Brümmer) for providing the different harvest batches of hawthorn and fruitful discussions.

Conflicts of Interest

The authors declare no conflict of interest.

Abbreviations

aPSpecific surface area, 1/m
cLConcentration in the liquid phase, kg/m3
cPConcentration in the porous particle, kg/m3
DaxAxial dispersion coefficient, m/s2
DeffEffective diffusion coefficient, m2/s
KLEquilibrium constant, m3/kg
PePéclet number
qLoading, kg/m3
qmaxMaximum Loading, kg/m3
ReReynolds number
RRadius, m
ScSchmidt number
SCSide Component
ShSherwood number
tTime, s
uzSuperficial velocity, m/s
zCoordinate in axial direction, m
εDielectric constant, -
εVoids fraction, -
DPFDistributed plug flow
HPLCHigh performance liquid chromatography
i.d.Inner diameter
PHWEPressurized hot water extraction
PTFEPolytetrafluoroethylene
SLESolid-liquid extraction

References

  1. Vuorela, P.; Leinonen, M.; Saikku, P.; Tammela, P.; Rauha, J.; Wennberg, T.; Vuorela, H. Natural Products in the process of finding new drug candidates. Curr. Med. Chem. 2004, 11, 1375–1389. [Google Scholar] [CrossRef]
  2. Koehn, F.E.; Carter, G.T. The evolving role of natural products in drug discovery. Nat. Rev. Drug Discov. 2005, 4, 206–220. [Google Scholar] [CrossRef] [PubMed]
  3. Teo, C.C.; Tan, S.N.; Yong, J.W.H.; Hew, C.S.; Ong, E.S. Pressurized hot water extraction (PHWE). J. Chromatogr. A 2010, 1217, 2484–2494. [Google Scholar] [CrossRef] [PubMed]
  4. Plaza, M.; Turner, C. Pressurized hot water extraction of bioactives. TrAC Trends Anal. Chem. 2015, 71, 39–54. [Google Scholar] [CrossRef]
  5. Sixt, M.; Strube, J. Systematic and Model-Assisted Evaluation of Solvent Based- or Pressurized Hot Water Extraction for the Extraction of Artemisinin from Artemisia annua L. Processes 2017, 5, 86. [Google Scholar] [CrossRef]
  6. Sixt, M.; Strube, J. Pressurized hot water extraction of 10-deacetylbaccatin III from yew for industrial application. Resour. Effic. Technol. 2017, 3, 177–186. [Google Scholar] [CrossRef]
  7. Hiller, K.; Melzig, M.F. Lexikon der Arzneipflanzen und Drogen, 2. Auflage; Spektrum Akademischer: Heidelberg, Germany, 2010. [Google Scholar]
  8. Europäisches Arzneibuch. Europäisches Arzneibuch DVD-ROM 8. Ausgabe, Grundwerk 2014 (Ph. Eur. 8.0) inkl. 1. bis 8. Nachtrag (Ph.Eur. 8.1 bis 8.8). Amtliche deutsche Ausgabe, 1. Auflage; Deutscher Apotheker Verlag: Stuttgart, Germany, 2016. [Google Scholar]
  9. Hevert. Bomacorin 450 mg Weißdorntabletten N: Nussbaum. 2004. Available online: https://www.docmorris.de/medias/sys_master/8452192362128000/3137679.pdf (accessed on 7 January 2018).
  10. Schwabe. Gebrauchsinformation. Crataegutt® novo 450 mg: Karlsruhe. 2006. Available online: https://www.docmorris.de/medias/sys_master/h91/hdf/8845213073438/GI-Crataegutt-novo-450-mg.pdf (accessed on 7 January 2018).
  11. Hexal. Gebrauchsinformation: Information für den Anwender. Craegium novo 450 mg, Holzkirchen. 2007. Available online: https://m.apotal.de/images/ecommerce/01/35/01359849_2007-07_de_o.pdf (accessed on 7 January 2018).
  12. Aliud Pharma. Gebrauchsinformation: Information für Anwender. Crataegus® AL 450 mg Filmtabletten, Laichingen. 2012. Available online: https://www.aliva.de/images/ecommerce/00/01/00013178_2012-05_de_o.pdf (accessed on 7 January 2018).
  13. Schaper und Brümmer. Gebrauchsinformation: Information für den Anwender. Esbericard® novo Dragees: Salzgitter. 2013. Available online: http://www.schaper-bruemmer.de/fileadmin/docs/beipackzettel/Gebrauchsinformationen_Esbericard_novo_Dragees.pdf (accessed on 7 January 2018).
  14. Kaßing, M. Process Development for Plant-Based Extract Production; Shaker: Aachen, Germany, 2012. [Google Scholar]
  15. Kaßing, M.; Jenelten, U.; Schenk, J.; Hänsch, R.; Strube, J. Combination of Rigorous and Statistical Modeling for Process Development of Plant-Based Extractions Based on Mass Balances and Biological Aspects. Chem. Eng. Technol. 2012, 35, 109–132. [Google Scholar] [CrossRef]
  16. Both, S.; Koudous, I.; Jenelten, U.; Strube, J. Model-based equipment-design for plant-based extraction processes—Considering botanic and thermodynamic aspects. C. R. Chim. 2014, 17, 187–196. [Google Scholar] [CrossRef]
  17. Both, S. Systematische Verfahrensentwicklung für Pflanzlich Basierte Produkte im Regulatorischen Umfeld; Shaker: Aachen, Germany, 2015. [Google Scholar]
  18. Sixt, M.; Koudous, I.; Strube, J. Process design for integration of extraction, purification and formulation with alternative solvent concepts. C. R. Chim. 2016, 19, 733–748. [Google Scholar] [CrossRef]
  19. Uhlenbrock, L.; Sixt, M.; Strube, J. Quality-by-Design (QbD) process evaluation for phytopharmaceuticals on the example of 10-deacetylbaccatin III from yew. Resour. Effic. Technol. 2017, 3, 137–143. [Google Scholar] [CrossRef]
  20. Sixt, M.; Strube, J. In-Line Raman Spectroscopy and Advanced Process Control for the Extraction of Anethole and Fenchone from Fennel Fruits (Foeniculum vulgare L. MILL.). C. R. Chim. 2018, 21, 97–103. [Google Scholar] [CrossRef]
  21. Kaßing, M.; Jenelten, U.; Schenk, J.; Strube, J. A New Approach for Process Development of Plant-Based Extraction Processes. Chem. Eng. Technol. 2010, 33, 377–387. [Google Scholar] [CrossRef] [Green Version]
  22. Koudous, I.; Both, S.; Gudi, G.; Schulz, H.; Strube, J. Process design based on physicochemical properties for the example of obtaining valuable products from plant-based extracts. C. R. Chim. 2014, 17, 218–231. [Google Scholar] [CrossRef]
  23. Both, S.; Eggersgluess, J.K.; Lehnberger, A.; Schulz, T.; Strube, J. Optimizing Established Processes like Sugar Extraction from Sugar Beets—Design of Experiments versus Physicochemical Modeling. Chem. Eng. Technol. 2013, 36, 2125–2136. [Google Scholar] [CrossRef]
  24. Wang, C.-H.; Wang, Y.-X.; Liu, H.-J. Validation and application by HPLC for simultaneous determination of vitexin-2″-O-glucoside, vitexin-2″-O-rhamnoside, rutin, vitexin, and hyperoside. J. Pharm. Anal. 2011, 1, 291–296. [Google Scholar] [CrossRef] [PubMed]
  25. Gudi, G.; Krähmer, A.; Koudous, I.; Strube, J.; Schulz, H. Infrared and Raman spectroscopic methods for characterization of Taxus baccata L.—Improved taxane isolation by accelerated quality control and process surveillance. Talanta 2015, 143, 42–49. [Google Scholar] [CrossRef] [PubMed]
  26. Fintelmann, V.; Weiß, R.F. Lehrbuch der Phytotherapie; Hippokrates-Verlag: Stuttgart, Germany, 2002. [Google Scholar]
  27. Sovová, H. Rate of the vegetable oil extraction with supercritical CO2-I. Modelling of extraction curves. Chem. Eng. Sci. 1994, 49, 409–414. [Google Scholar] [CrossRef]
  28. Perrut, M.; Clavier, J.Y.; Poletto, M.; Reverchon, E. Mathematical Modeling of Sunflower Seed Extraction by Supercritical CO2. Ind. Eng. Chem. Res. 1997, 36, 430–435. [Google Scholar] [CrossRef]
  29. Sovová, H. Mathematical model for supercritical fluid extraction of natural products and extraction curve evaluation. J. Supercrit. Fluids 2005, 33, 35–52. [Google Scholar] [CrossRef]
  30. Koudous, I. Stoffdatenbasierte Verfahrensentwicklung zur Isolierung von Wertstoffen aus Pflanzenextrakten, 1. Auflage; Shaker: Herzogenrath, Germany, 2017. [Google Scholar]
Figure 1. Flow diagram of the milli-scale PHWE equipment for batch extraction experiments.
Processes 06 00073 g001
Figure 2. Flow diagram of the milli-scale PHWE equipment in recycling mode.
Processes 06 00073 g002
Figure 3. Chromatogram of the hawthorn extract.
Processes 06 00073 g003
Figure 4. Solvent screening for hyperoside from hawthorn in ethanol water solutions.
Processes 06 00073 g004
Figure 5. (A) Equilibrium data for the system hawthorn-hyperoside/SC1/SC2/SC3-EtOH/Water (70/30 v/v); (B) equilibrium data for the system hawthorn-dry matter-EtOH/Water (70/30 v/v).
Processes 06 00073 g005
Figure 6. Temperature screening.
Processes 06 00073 g006
Figure 7. (A) DER during the PHWE of hawthorn; (B) Extraction curve of hyperoside during PHWE.
Processes 06 00073 g007
Figure 8. Concentration during the recycling experiment for all respective substances.
Processes 06 00073 g008
Figure 9. Conventional extraction of hawthorn, experiments and simulation for hyperoside and side components SC1 to SC3.
Processes 06 00073 g009
Figure 10. Chromatogram of the hawthorn extract and exemplified finger print region.
Processes 06 00073 g010
Figure 11. Equilibria of different harvest batches of hawthorn in the system hawthorn-hyperoside-EtOH/Water (70/30 v/v).
Processes 06 00073 g011
Figure 12. Evaluation of the batch screening regarding the overall amount and the capacity factor.
Processes 06 00073 g012
Figure 13. Simulation of the extraction of different hawthorn batches.
Processes 06 00073 g013
Figure 14. (A) Spectra of the different harvest batches, black: batches F, G, H (low share of flowers), grey: rest (high share of flowers); (B) PCA of the second derivative of the hawthorn harvest batches spectra.
Processes 06 00073 g014
Figure 15. Comparison of the annual costs of the hawthorn extraction for conventional solid-liquid extraction and PHWE.
Processes 06 00073 g015
Figure 16. Time schedule of the experimental setup.
Processes 06 00073 g016
Table 1. Overview of the hawthorn batches.
BatchHarvest YearOriginOverall AmountDeviation to ReferenceaDeviation to Reference
A2017Southeast Europe0.87%146%0.11−15%
B2016Macedonia0.35%−1%0.10−23%
C2017Bulgaria0.58%64%0.12−8%
D2017Romania0.41%16%0.130%
E2014Bulgaria0.60%71%0.10−23%
F2017Albania0.42%20%0.02−84%
G2017Southeast Europe0.57%62%0.03−77%
H2017Serbia0.51%43%0.015−88%
I (Reference)2017Germany0.35%-0.13-
Table 2. Overview of the simulation results.
BatchMass Experiment (g)Mass Simulation (g)Difference (g)Deviation
A0.1350.161−0.026−16%
B0.0540.060−0.006−10%
C0.0900.091−0.001−1%
D0.0610.063−0.002−3%
E0.0940.0900.0045%
F0.0740.077−0.003−4%
G0.0970.0930.0044%
H0.0870.0860.0000%
I (Reference)0.0560.0540.0023%

