Article

Geotechnical Properties of Effluent-Contaminated Cohesive Soils and Their Stabilization Using Industrial By-Products

1
Birudo Engineers, 107/C, PAF Officers Colony, Lahore 54810, Pakistan
2
Department of Hydraulic Engineering, Tsinghua University, Beijing 100084, China
3
Department of Civil Engineering, University of Engineering and Technology Lahore, Lahore 54890, Pakistan
*
Author to whom correspondence should be addressed.
Processes 2018, 6(10), 203; https://doi.org/10.3390/pr6100203
Submission received: 18 September 2018 / Revised: 16 October 2018 / Accepted: 17 October 2018 / Published: 22 October 2018
(This article belongs to the Special Issue Fluid Flow in Fractured Porous Media)

Abstract

:
The unchecked and unnoticed disposal of industrial leachates is a common malpractice in developing countries. Untreated effluents from industries drastically deteriorate the soil, altering nearly all of its characteristics. An increase in urbanization has led to construction on these deteriorated lands. In this study, the chemical impact of two industrial effluents, dyeing (acidic) and tannery (basic), is studied on two cohesive soils, i.e., high plastic clay (CH) and low plastic clay (CL). Properties such as liquid limit, plasticity index, specific gravity, maximum dry density, unconfined compressive strength, swell potential, swell pressure, and compression indices decrease with effluent contamination, with the exception of the basic effluent, for which the trend changes after a certain percentage. This study also examines the time variation of properties at different effluent percentages, finding that unconfined compressive strength of both soils increases with time upon dyeing (acidic) contamination and decreases with tannery (basic). The stabilizing effect of two industrial by-products, i.e., marble dust and ground granulated blast furnace slag (GGBFS) have been evaluated. Unlike their proven positive effect on uncontaminated soils, these industrial by-products did not show any significant stabilization effect on leachate-contaminated cohesive soils, thereby emphasizing the need to utilize special remediation measures for effluent treated soils.

1. Introduction

It has long been recognized that changes in pore fluid chemistry can exert a strong effect on soil strength characteristics [1]. In recent years, the growing rate of soil contamination has prompted a number of studies in which the effects of chemicals on the geotechnical properties of fine-grained soils have been studied [2]. Industrial effluents are often discharged untreated, a practice which contaminates water channels (and ultimately the soil) through seepage.
A substantial volume of effluent waste is generated annually. These effluents consist of toxic heavy metals and highly reactive chemical compounds which, upon disposal, alter the shape and composition of the soil structure following certain chemical reactions. Such reactions cause changes in the soil behavior related to various geotechnical properties. In recent years, a number of studies have been performed to investigate the effect of pore water chemistry on the strength characteristics of soil. Anson and Hawkins [3], Moore and Brunsden [4], and Tiwari et al. [5] have studied the effect of calcium and sodium chloride on the residual shear strength of weathered mudstone, and reported that high concentrations of ions in the pore water can significantly decrease the diffuse double layer of clay particles, a process that would lead to a greater residual shear strength. Ratnaweera and Meegoda [6] have researched the influence of organic fluids on the stress–strain behavior of soil and noted that changes in strength mostly depended on the dielectric constant of the organic fluids. Gratchev et al. [7,8] performed studies on the effect of the pore fluid chemistry on the undrained cyclic behavior of artificial soil mixtures and natural clays and reported that the cyclic shear strength can be greatly influenced by the type of ions and their concentrations in the pore water. Gratchev and Towhata [9] reported that a decrease in pH correlates with increases in compression indices and liquid limit and plastic limit of soils, due to the dissolution of calcium carbonate. Sunil et al. [10,11] dealt with an attempt to study the effect of leachate on the Atterberg limits, shear strength properties and chemical characteristics of lateritic soil. The liquid limit and the plasticity index of the lateritic soils increases with municipal solid waste leachate concentration. The increase in clay content of lateritic soil after interaction with the leachate led to an increase in cohesion parameter and decreases of the friction angle. The pH measurements of lateritic soil contaminated with municipal solid waste (MSW) leachate indicated an increase in pH values. This is also accompanied by a slight increase in the cation exchange capacity of the soil. The change in chemical characteristics of lateritic soil contributed due to the addition of leachate may be detrimental to foundation concrete in real field conditions.
A geotechnical engineer’s responsibility has therefore become cumbersome as conventional geotechnical principles and theories fail to account for the behavior of contaminated soils. It has been necessary to modify design methodologies to consider the effects of contaminants on soil properties to ensure accurate design of foundations and underground structures in the era of industrial evolution.
Rapid urbanization in various metropolitan areas of Pakistan has forced developers to construct in places that were previously used as dumping sites for industrial effluents. Geotechnical investigation reveals that the top soil layer in major part of Pakistan is mainly composed of cohesive soils [12]; thus, these soils were selected for this study in an attempt to understand the effects of industrial effluents on the geotechnical properties of contaminated cohesive soils. Furthermore, mitigation of such effects using industrial by-products has been discussed.

2. Materials and Methods
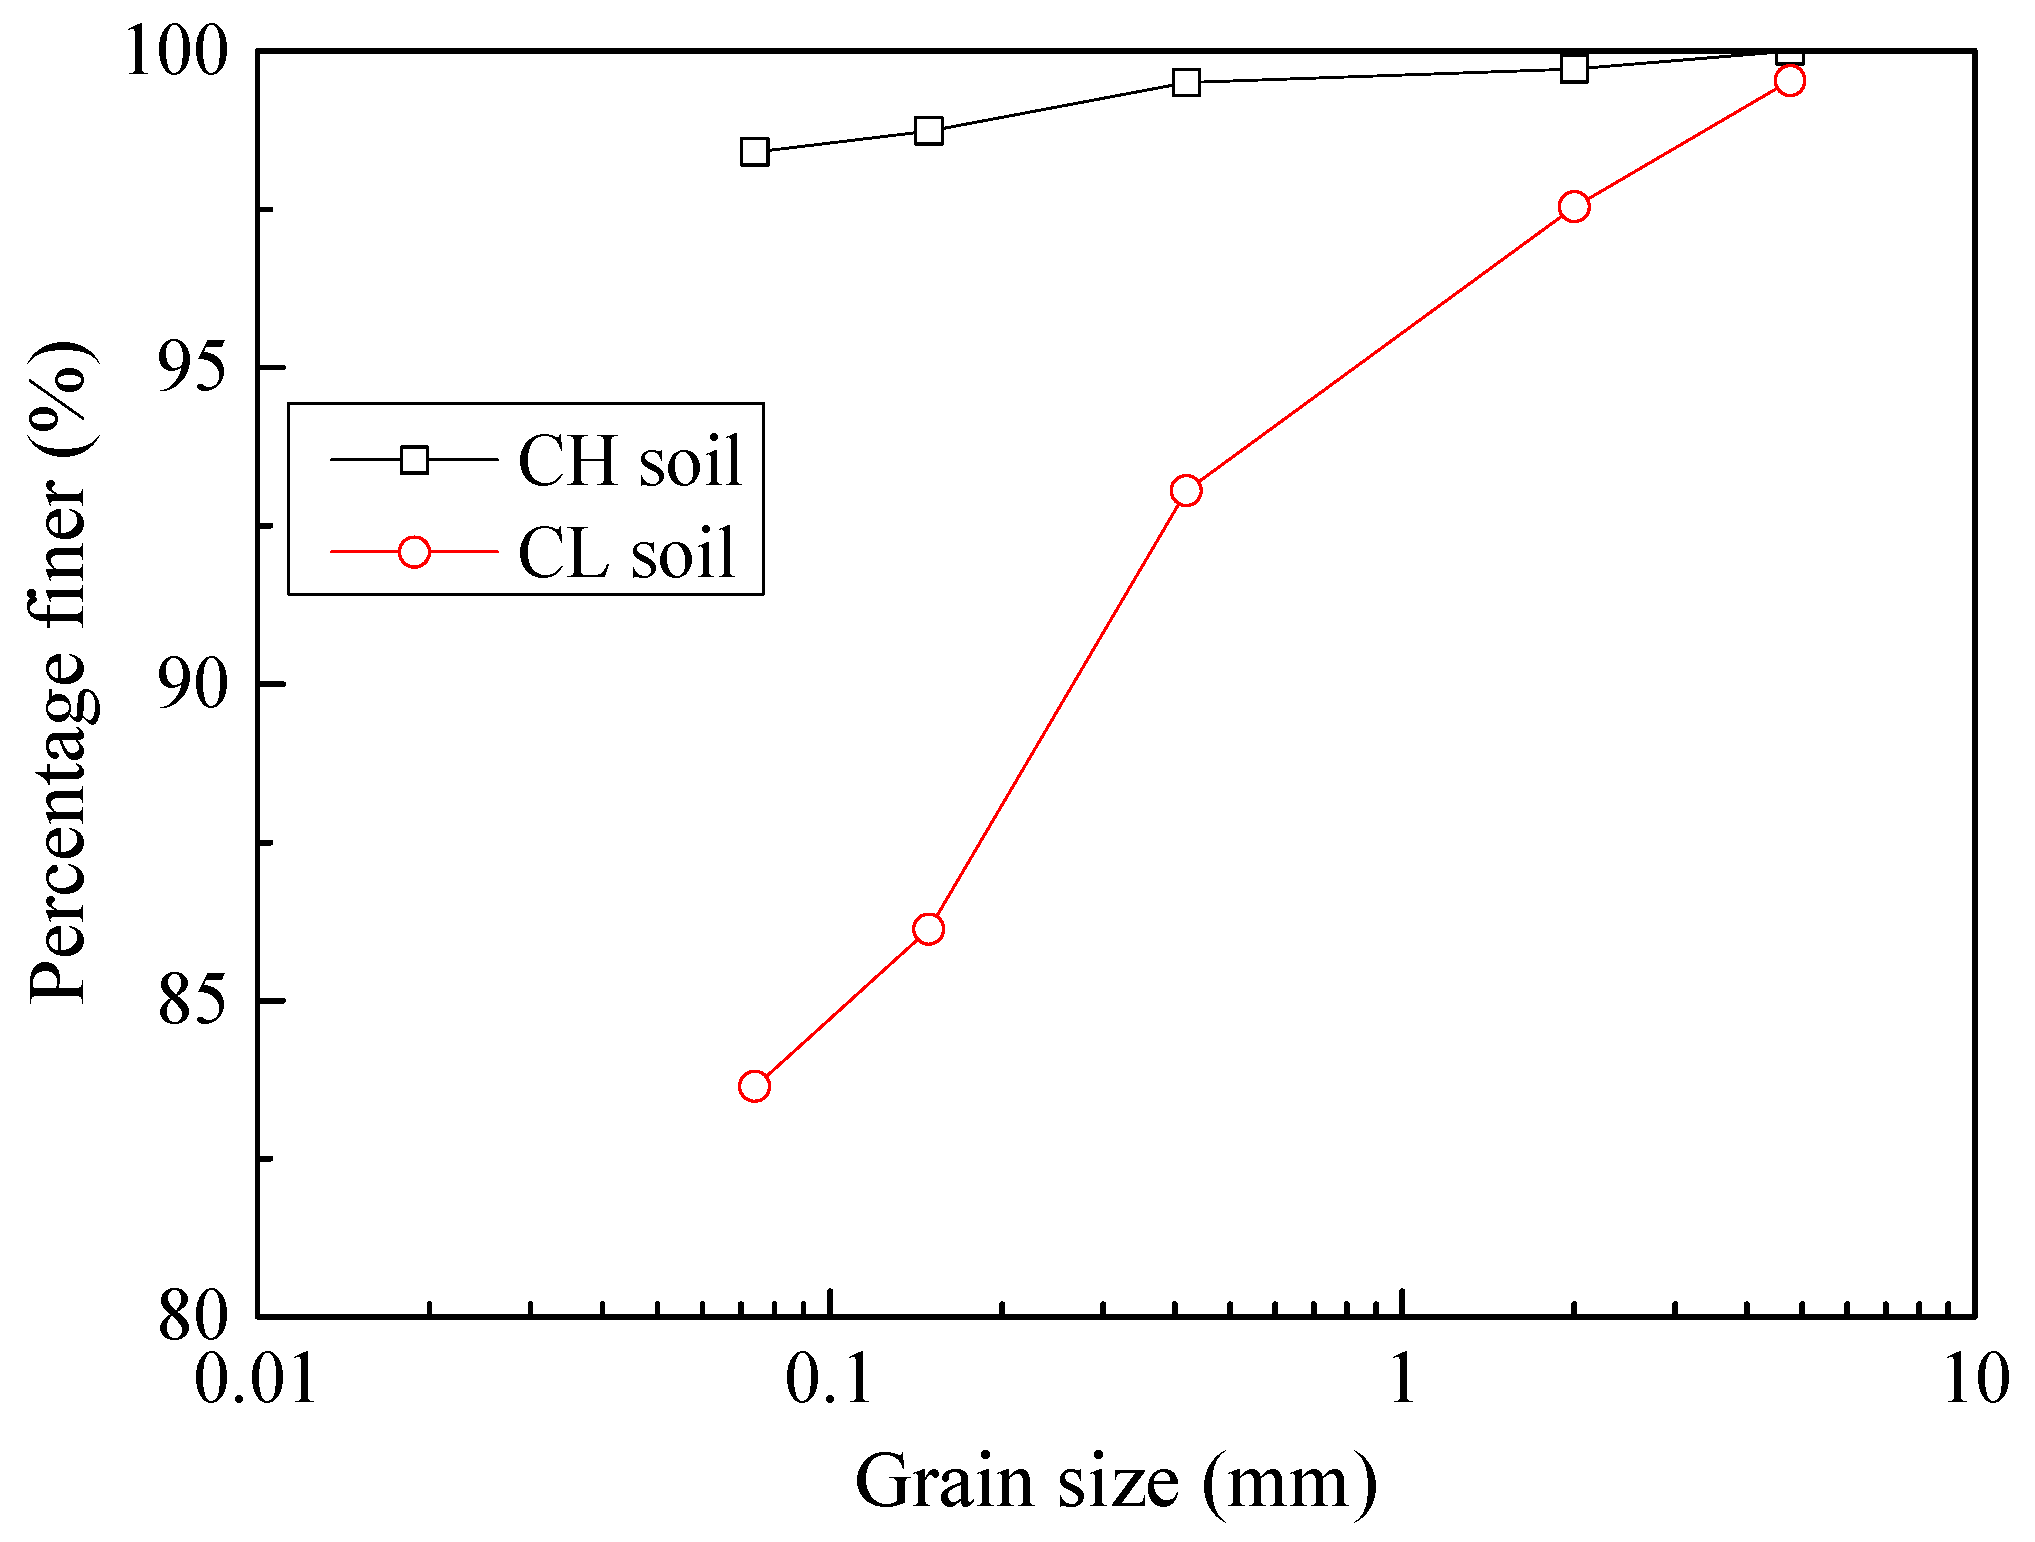
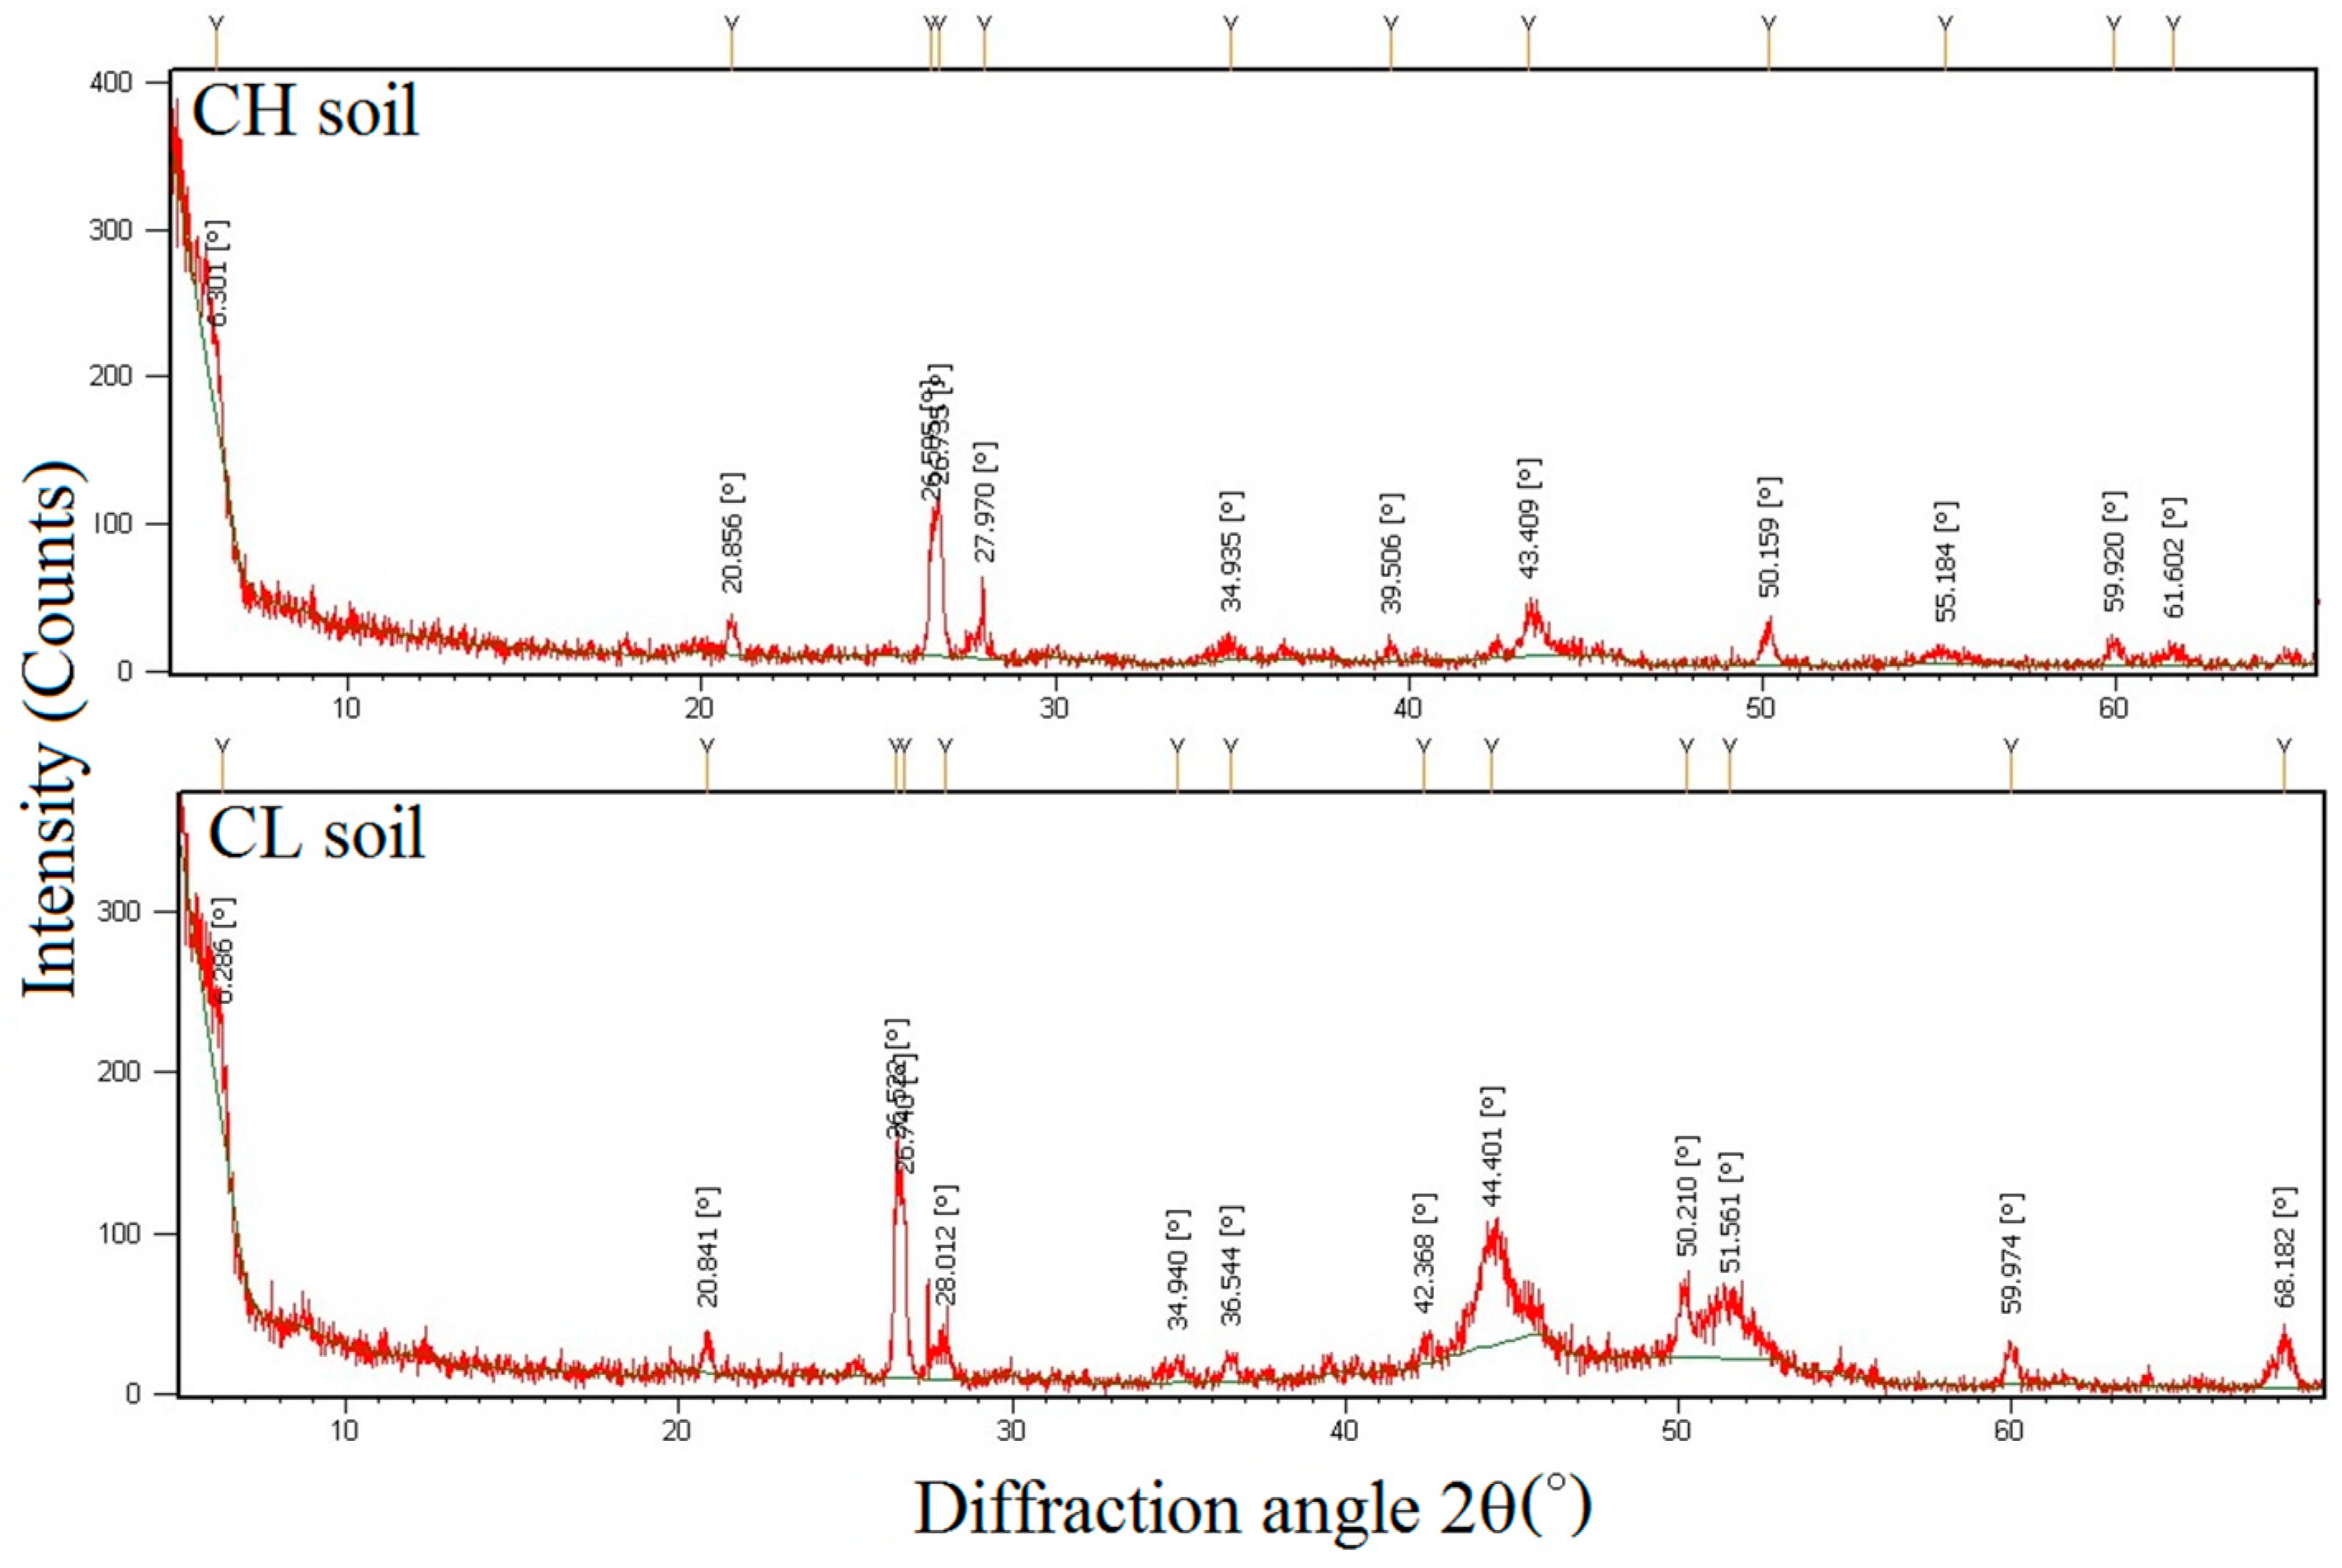
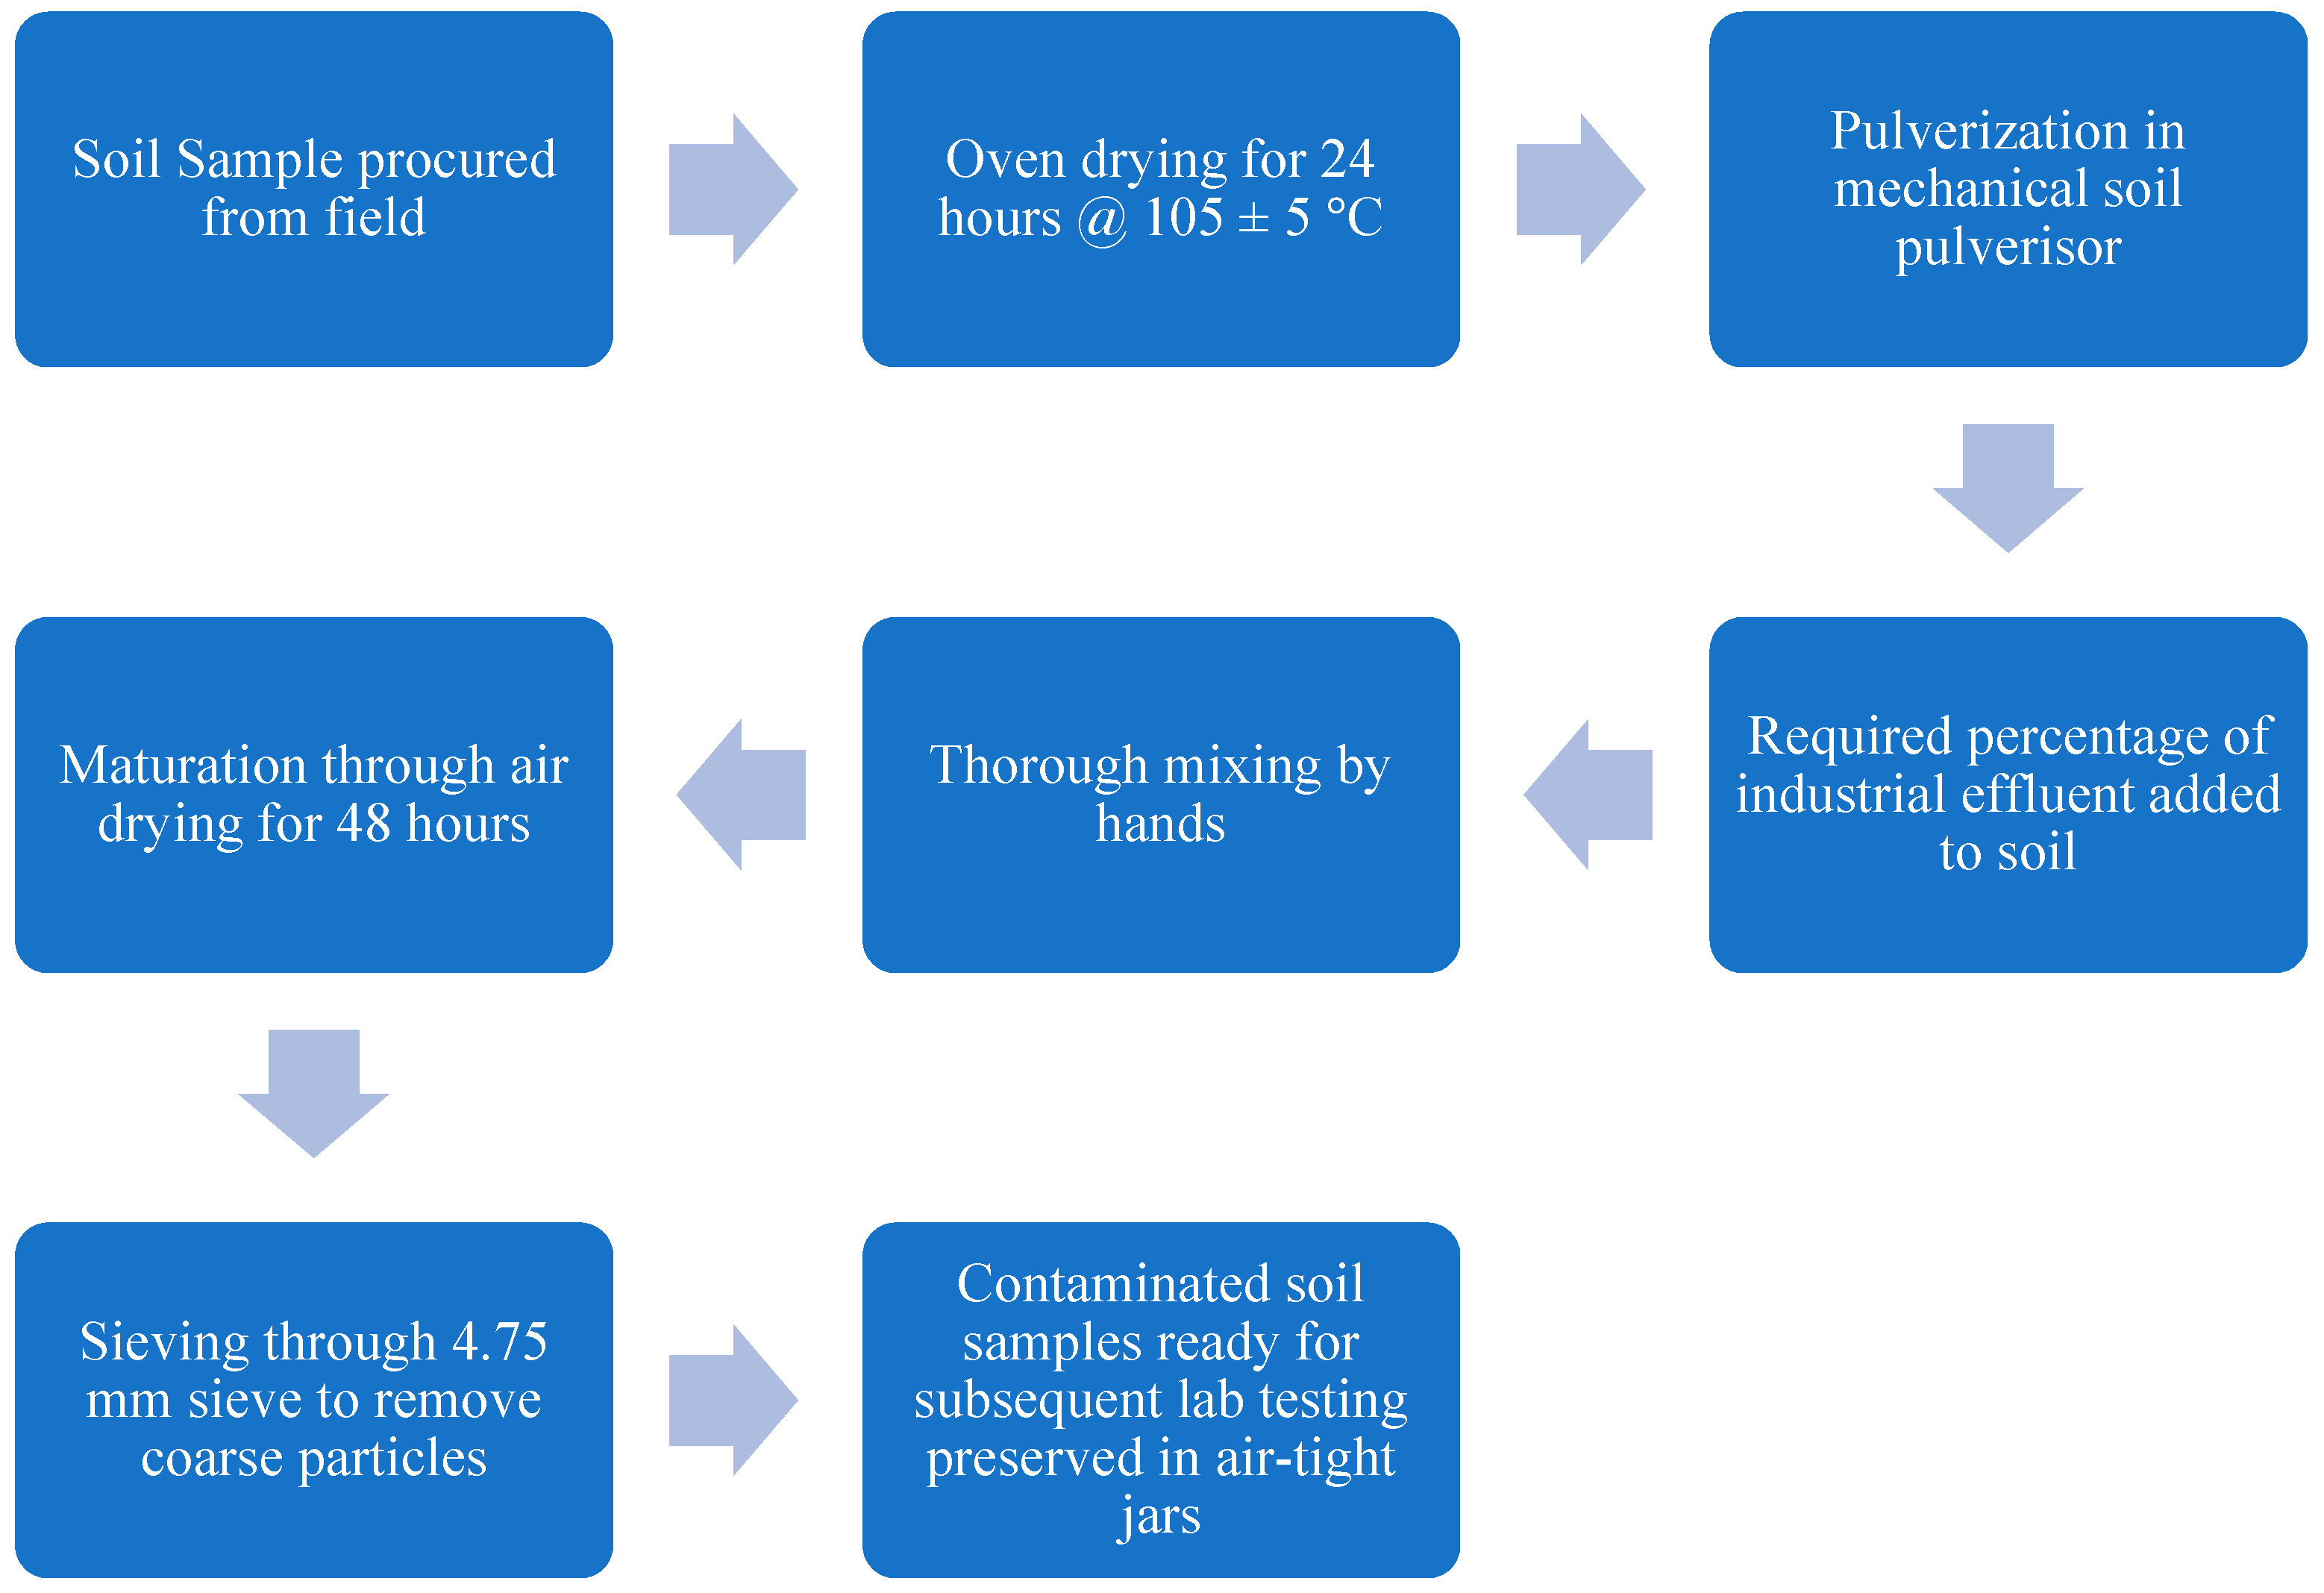
2.1. Soil Samples

Two samples of locally available natural cohesive soils were used in this study. The samples were obtained close to the soil surface and were representative of natural alluvial deposits common in major parts of Punjab province in Pakistan. One of the samples was procured from Nandipur near Gujranwala, Punjab and the other from Defence Housing Authority (DHA), Lahore. Grain size distribution, illustrated in Figure 1, shows the Nandipur and DHA soil samples to be classified as CH (A-6 (10)) and CL (A-7-6 (20)) per the Unified (AASHTO) Soil Classification System. To avoid the possible influence of vegetation, fill material and other organic matter, soil samples were procured from around 1.0 m deep test pits rather than from the surface. X-ray diffraction (XRD) analysis of the soil samples (see Figure 2) revealed the presence of kaolinite in CL soil and illite in CH soil as dominant minerals. The soil samples’ physical and chemical properties are summarized in Table 1.

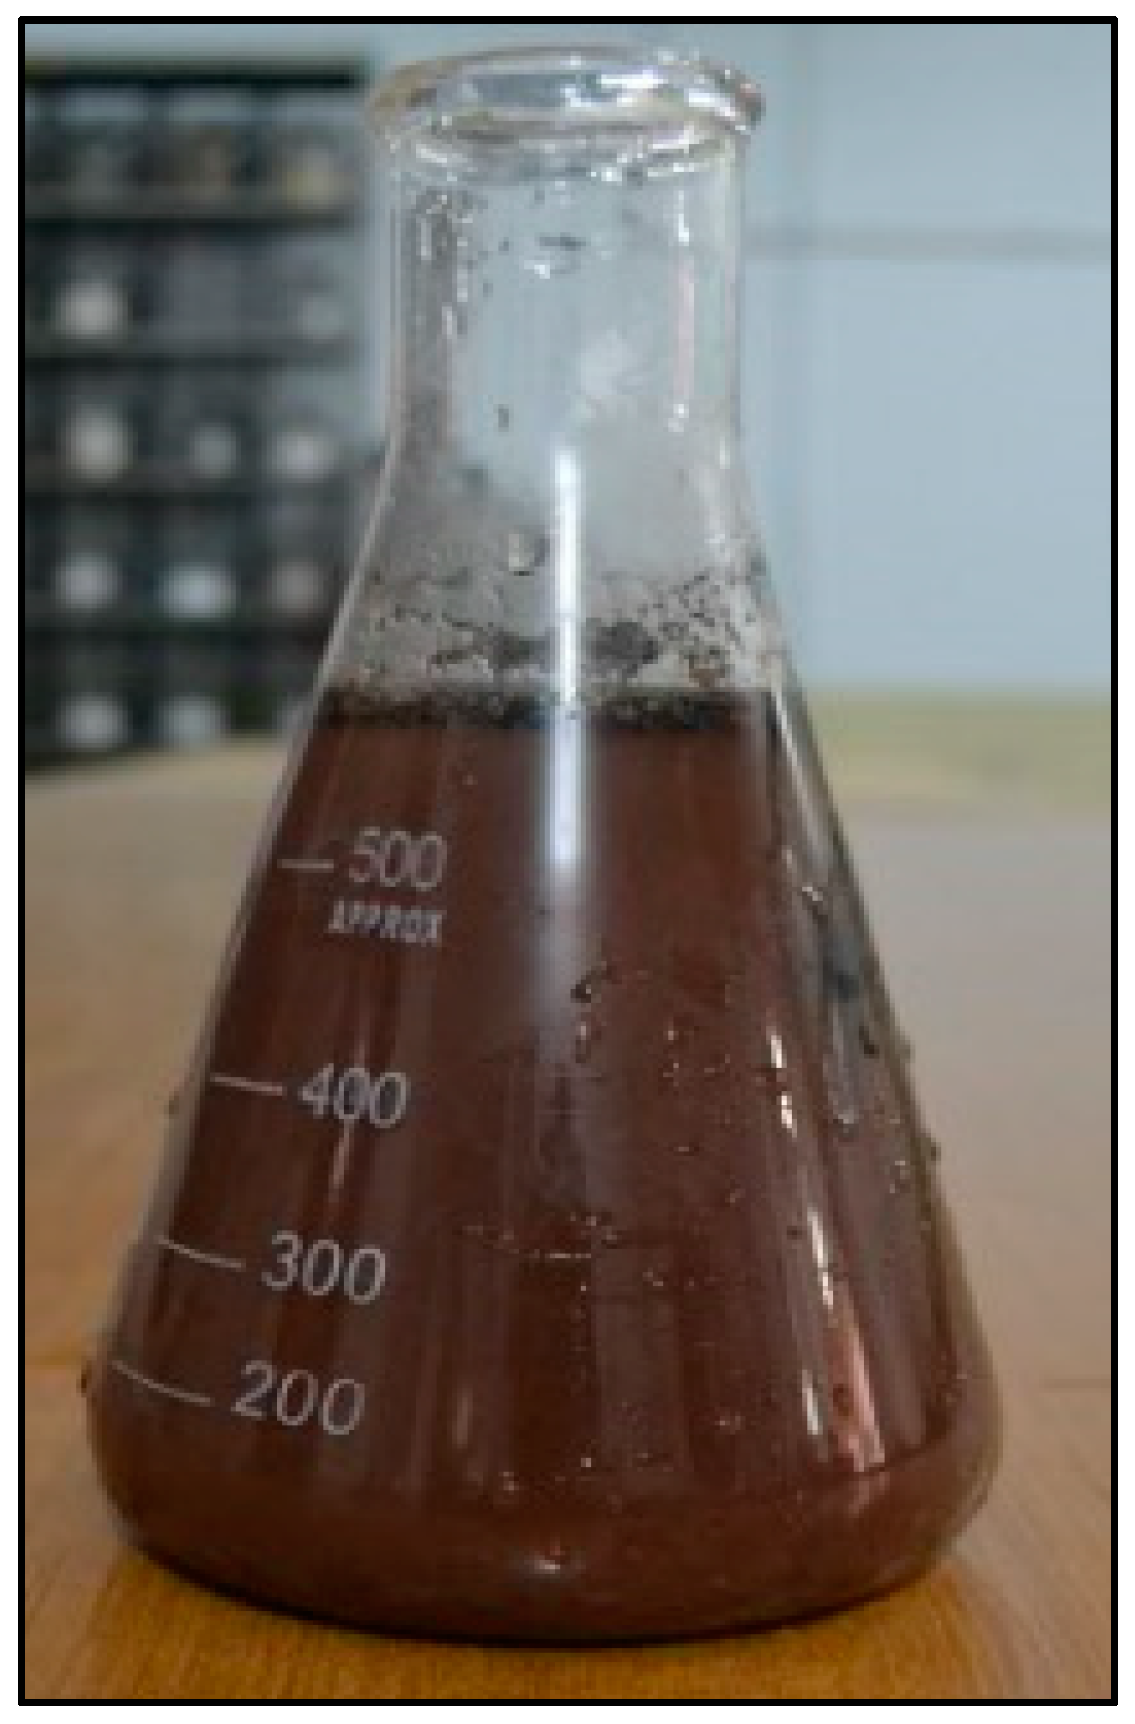
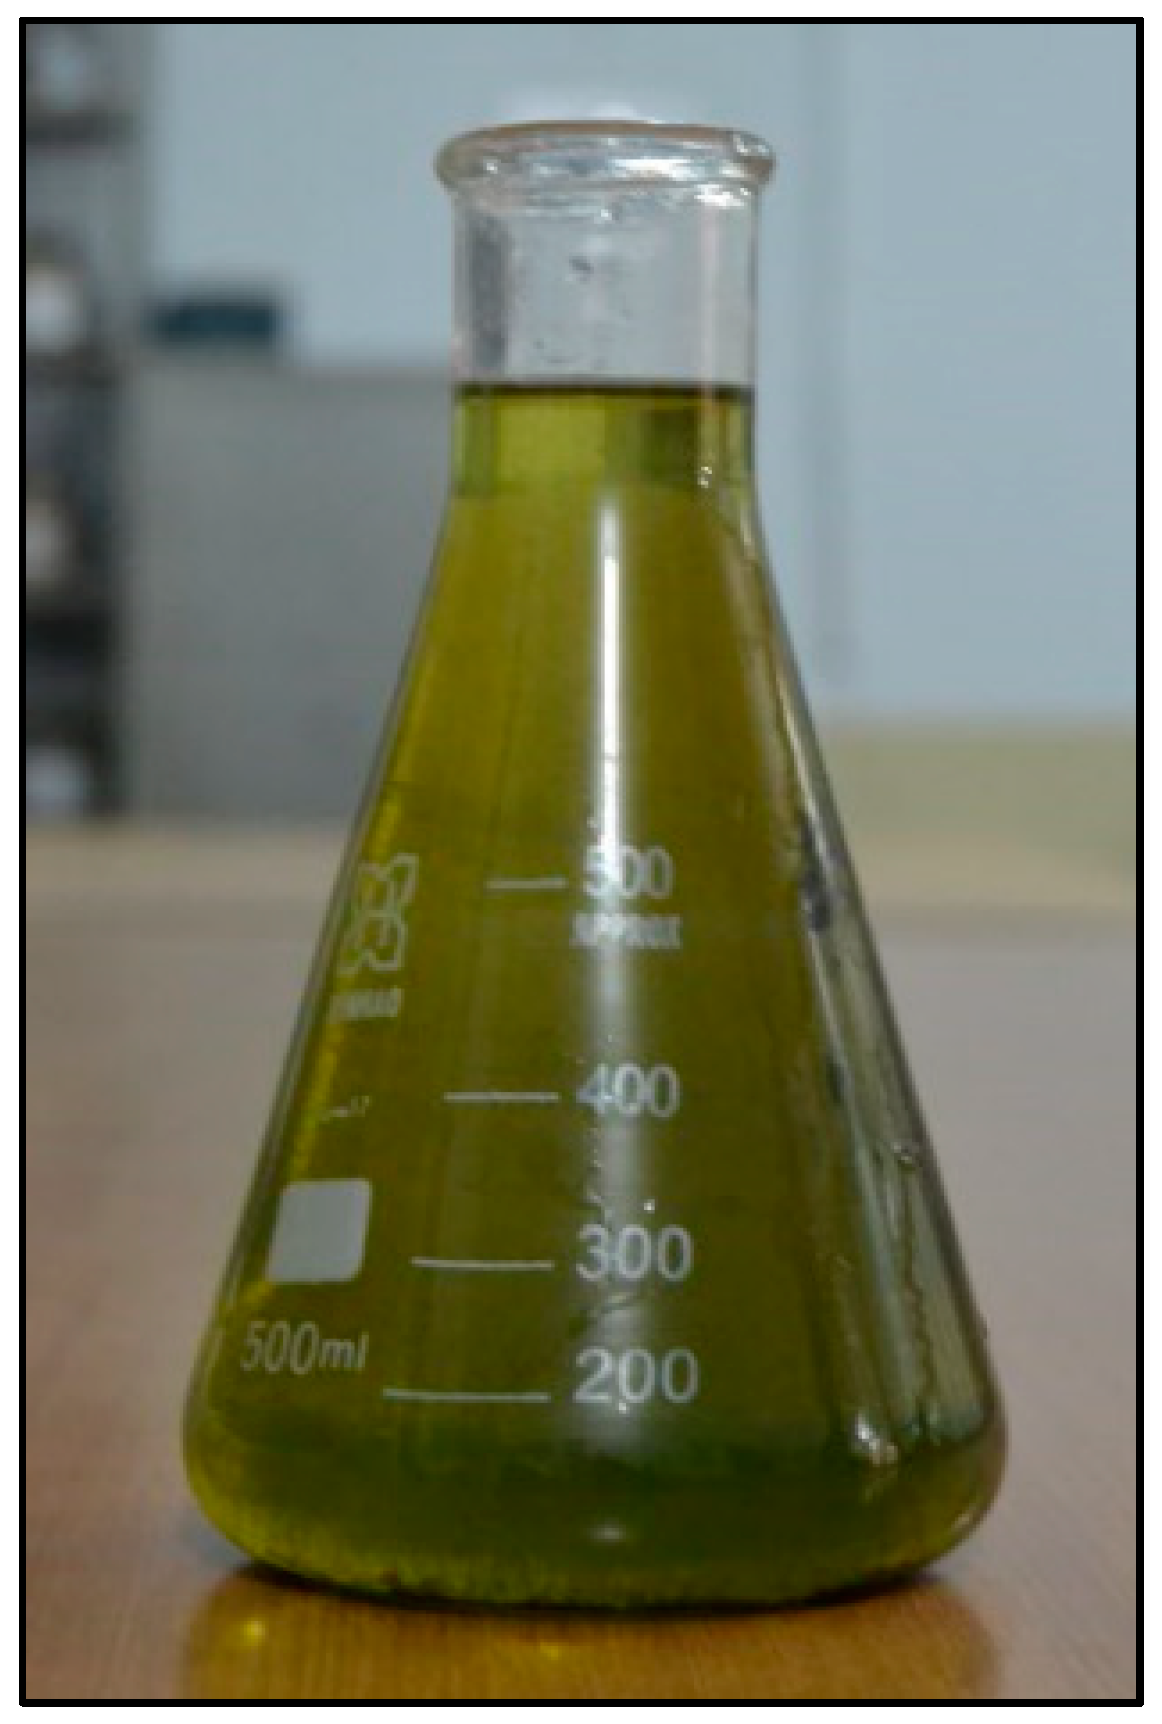
2.2. Industrial Effluents

Two industrial effluents, representing extreme ends of the pH scale, were selected to examine their effects on the engineering characteristics of cohesive soil. An acidic effluent collected from the outfall of a dyeing industry (see Figure 3) and a basic effluent collected from a tannery (see Figure 4) were used in this research. Fresh samples of industrial effluents were collected from drains of a dyeing industry located in Sheikhupura, Punjab, whereas wastes from a tannery were procured from Sialkot, Punjab. The collected effluent samples were subjected to chemical examination, the summary of these results are presented in Table 2.

2.3. Industrial By-Products

Industrial by-products were used to stabilize the effluent-contaminated soils obtained in phase I of this research. Specifically, by-products from the marble industry (marble dust) and steel industry (ground granulated blast furnace slag (GGBFS) were procured from local industries in Lahore; their chemical composition is summarized in Table 3.

2.4. Testing Scheme

A systematic methodology was adopted to prepare the leachate contaminated soil specimens. The cohesive soil samples were first oven-dried and pulverized. Industrial effluents were then thoroughly mixed with the soil samples at the indicated percentages of 0%, 5%, 10%, 15%, and 20% by dry weight of soil. The soil-effluent blends were left for 48 h for maturation before initiating laboratory testing. The contaminated soil samples were then air-dried and sieved through 4.75 mm mesh to remove coarse particles as well as large lumps. The dried and sieved soil was stored in airtight containers ready for laboratory testing. Sixteen polluted specimens, with different effluent proportions, were prepared for each soil type. A typical flow-chart depicting the specimen preparation process is shown in Figure 5.
A systematic nomenclature was established to represent the contaminated soil samples. The initial two letters indicate soil type, either low plastic (CL) or high plastic (CH) clay. The third letter corresponds to the effluent source, either the dyeing industry (D) or tannery industry (T). The digits depict the percentage of pollutant (e.g., “CH-T5” corresponds to a high plastic clay sample with 5% contamination from the tannery industry). The contaminated soil samples as well as the two virgin soil samples were then subjected to different tests to ascertain the corresponding effects on geotechnical characteristics. Soil properties assessed as a component of this investigation included Atterberg limits, specific gravity, modified compaction, one-dimensional consolidation, unconfined compression, and pH. Chemical analyses on the contaminated soils including total solids, dissolved solids, suspended solids, settleable solids, nitrates, sulfates, chlorides, oxygen demand (OD), biochemical oxygen demand (BOD), and chemical oxygen demand (COD) were also conducted. All tests were performed using the applicable American Society for Testing and Materials (ASTM) standard.
Further, two industrial by-products, marble dust and GGBFS, were added to each soil sample at percentages of 5%, 10%, 15%, and 20% by weight of the dry contaminated soil samples in order to improve soil properties. The effects of different percentages of effluent contamination on soils with the passage of time (i.e., 2 days, 7 days, 15 days, 21 days, 28 days and 2 months) were also investigated.

3. Results and Discussion

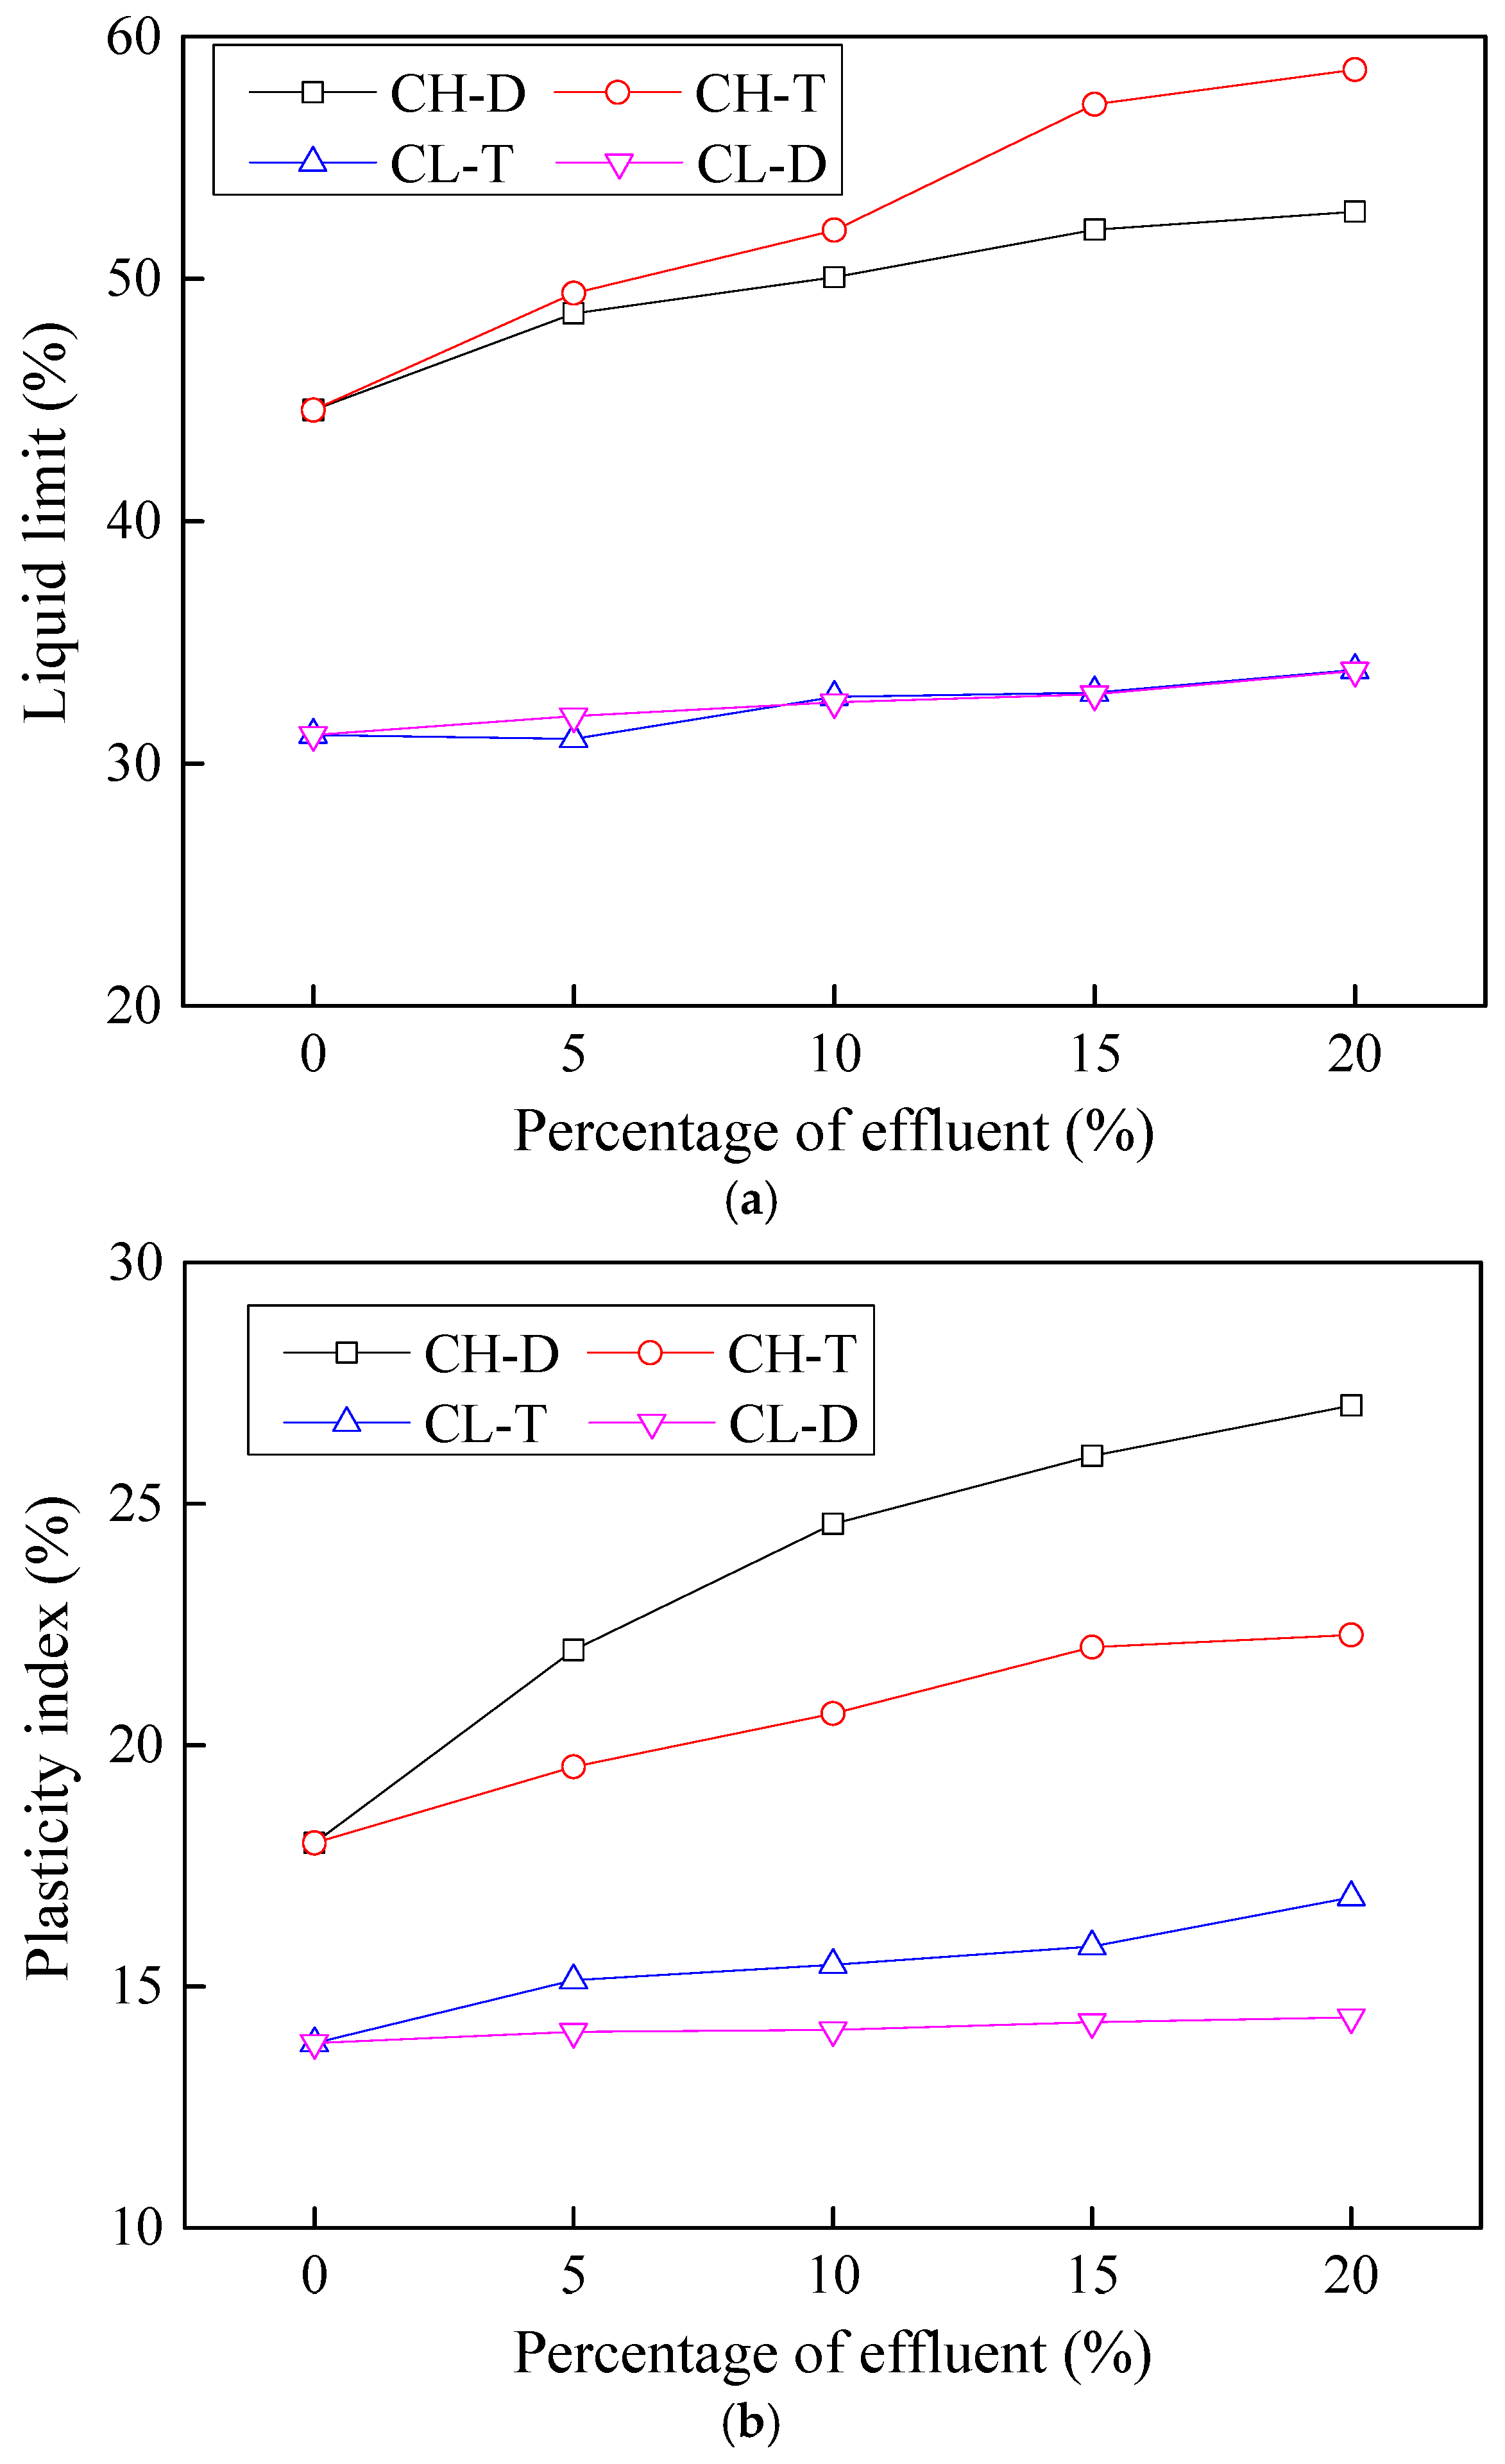
3.1. Effects of Contamination on Atterberg Limits

Atterberg limits are considered as index properties of soil and are used to predict their nature, as well as mechanical behavior. Many important characteristics of cohesive soils including shear strength, permeability, consolidation and deformation behavior, etc. are a function of Atterberg limits. A variation in Atterberg limits upon effluent contamination can be used as a precursor to predict change in other soil characteristics.
Increases in the liquid limit and plasticity indices of the soils with the addition of acidic and basic effluents are illustrated in Figure 6. The liquid limit of CH soil was found to increase from 44.58% to 52.77% upon contamination from the acidic effluent. With the basic effluent, CH soil’s liquid limit increased to 58.63% at a 20% addition of the contaminant. CL soil showed an increase in liquid limit from 31.18% to 33.82% and 33.86% upon addition of acidic and basic contamination, respectively.
The plasticity index of CH soil also showed a similar trend. That is, the plasticity index increased from 17.97% to 27.03% at 20% contamination of acidic effluent, and 22.28% at 20% contamination of basic effluent.
The increase in Atterberg limits of soil is mainly because of the chemical action between soil particles and effluent. The increase in liquid limit indicates an increase in consolidation potential of contaminated soils. High plasticity of contaminated soils also causes problems related to increased swell potential and high collapsibility. These observations are in-line with the previous findings by [13,14]. Contamination by industrial effluents would therefore deteriorate the quality of soil as an engineering material.

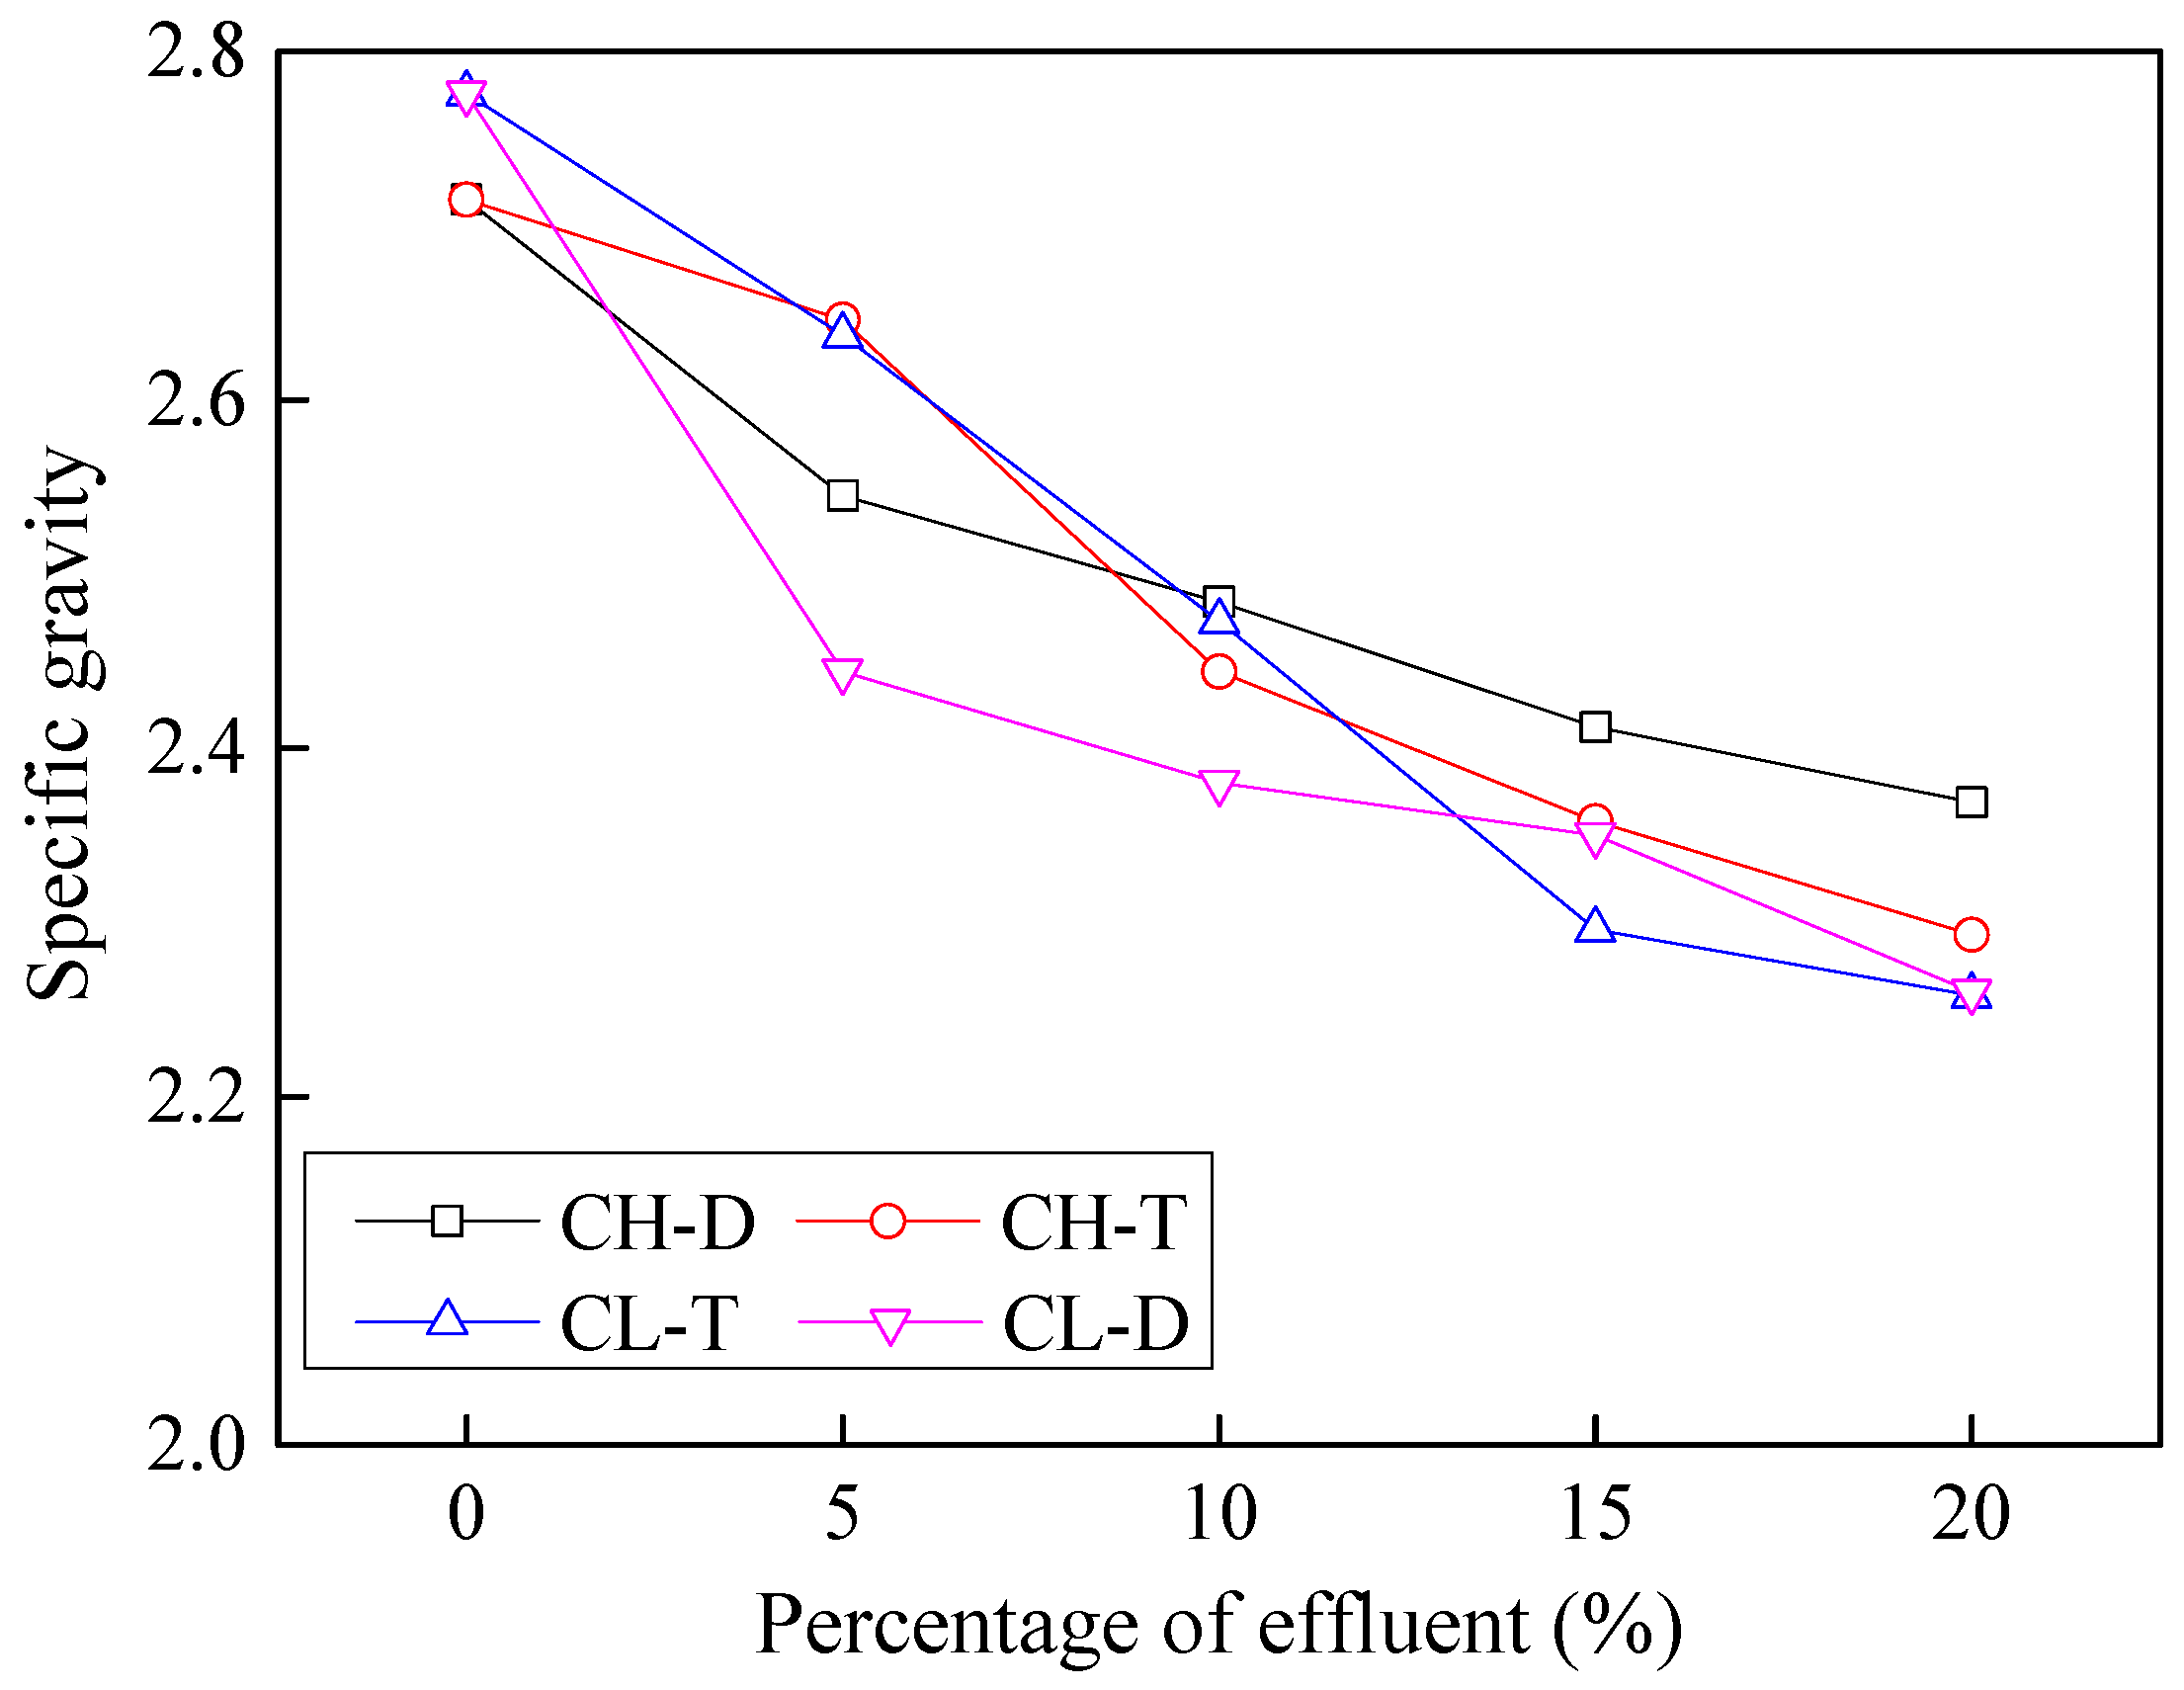
3.2. Effects of Contamination on Specific Gravity

Specific gravity of soil solids indicates how much heavier or lighter the soil particles are compared to water at 25 °C. This characteristic is important, specifically with regards to settlement evaluations in soils. The effects of contaminants on specific gravity are illustrated in Figure 7. The specific gravity of both the soil samples decreased with the addition of contaminants. CH soil showed a decrease in specific gravity by 12.5% and 15.5% for the acidic and basic effluents, respectively. CL-specific gravities decreased by 22.83 and 22.94 for the acidic and basic effluents, respectively.

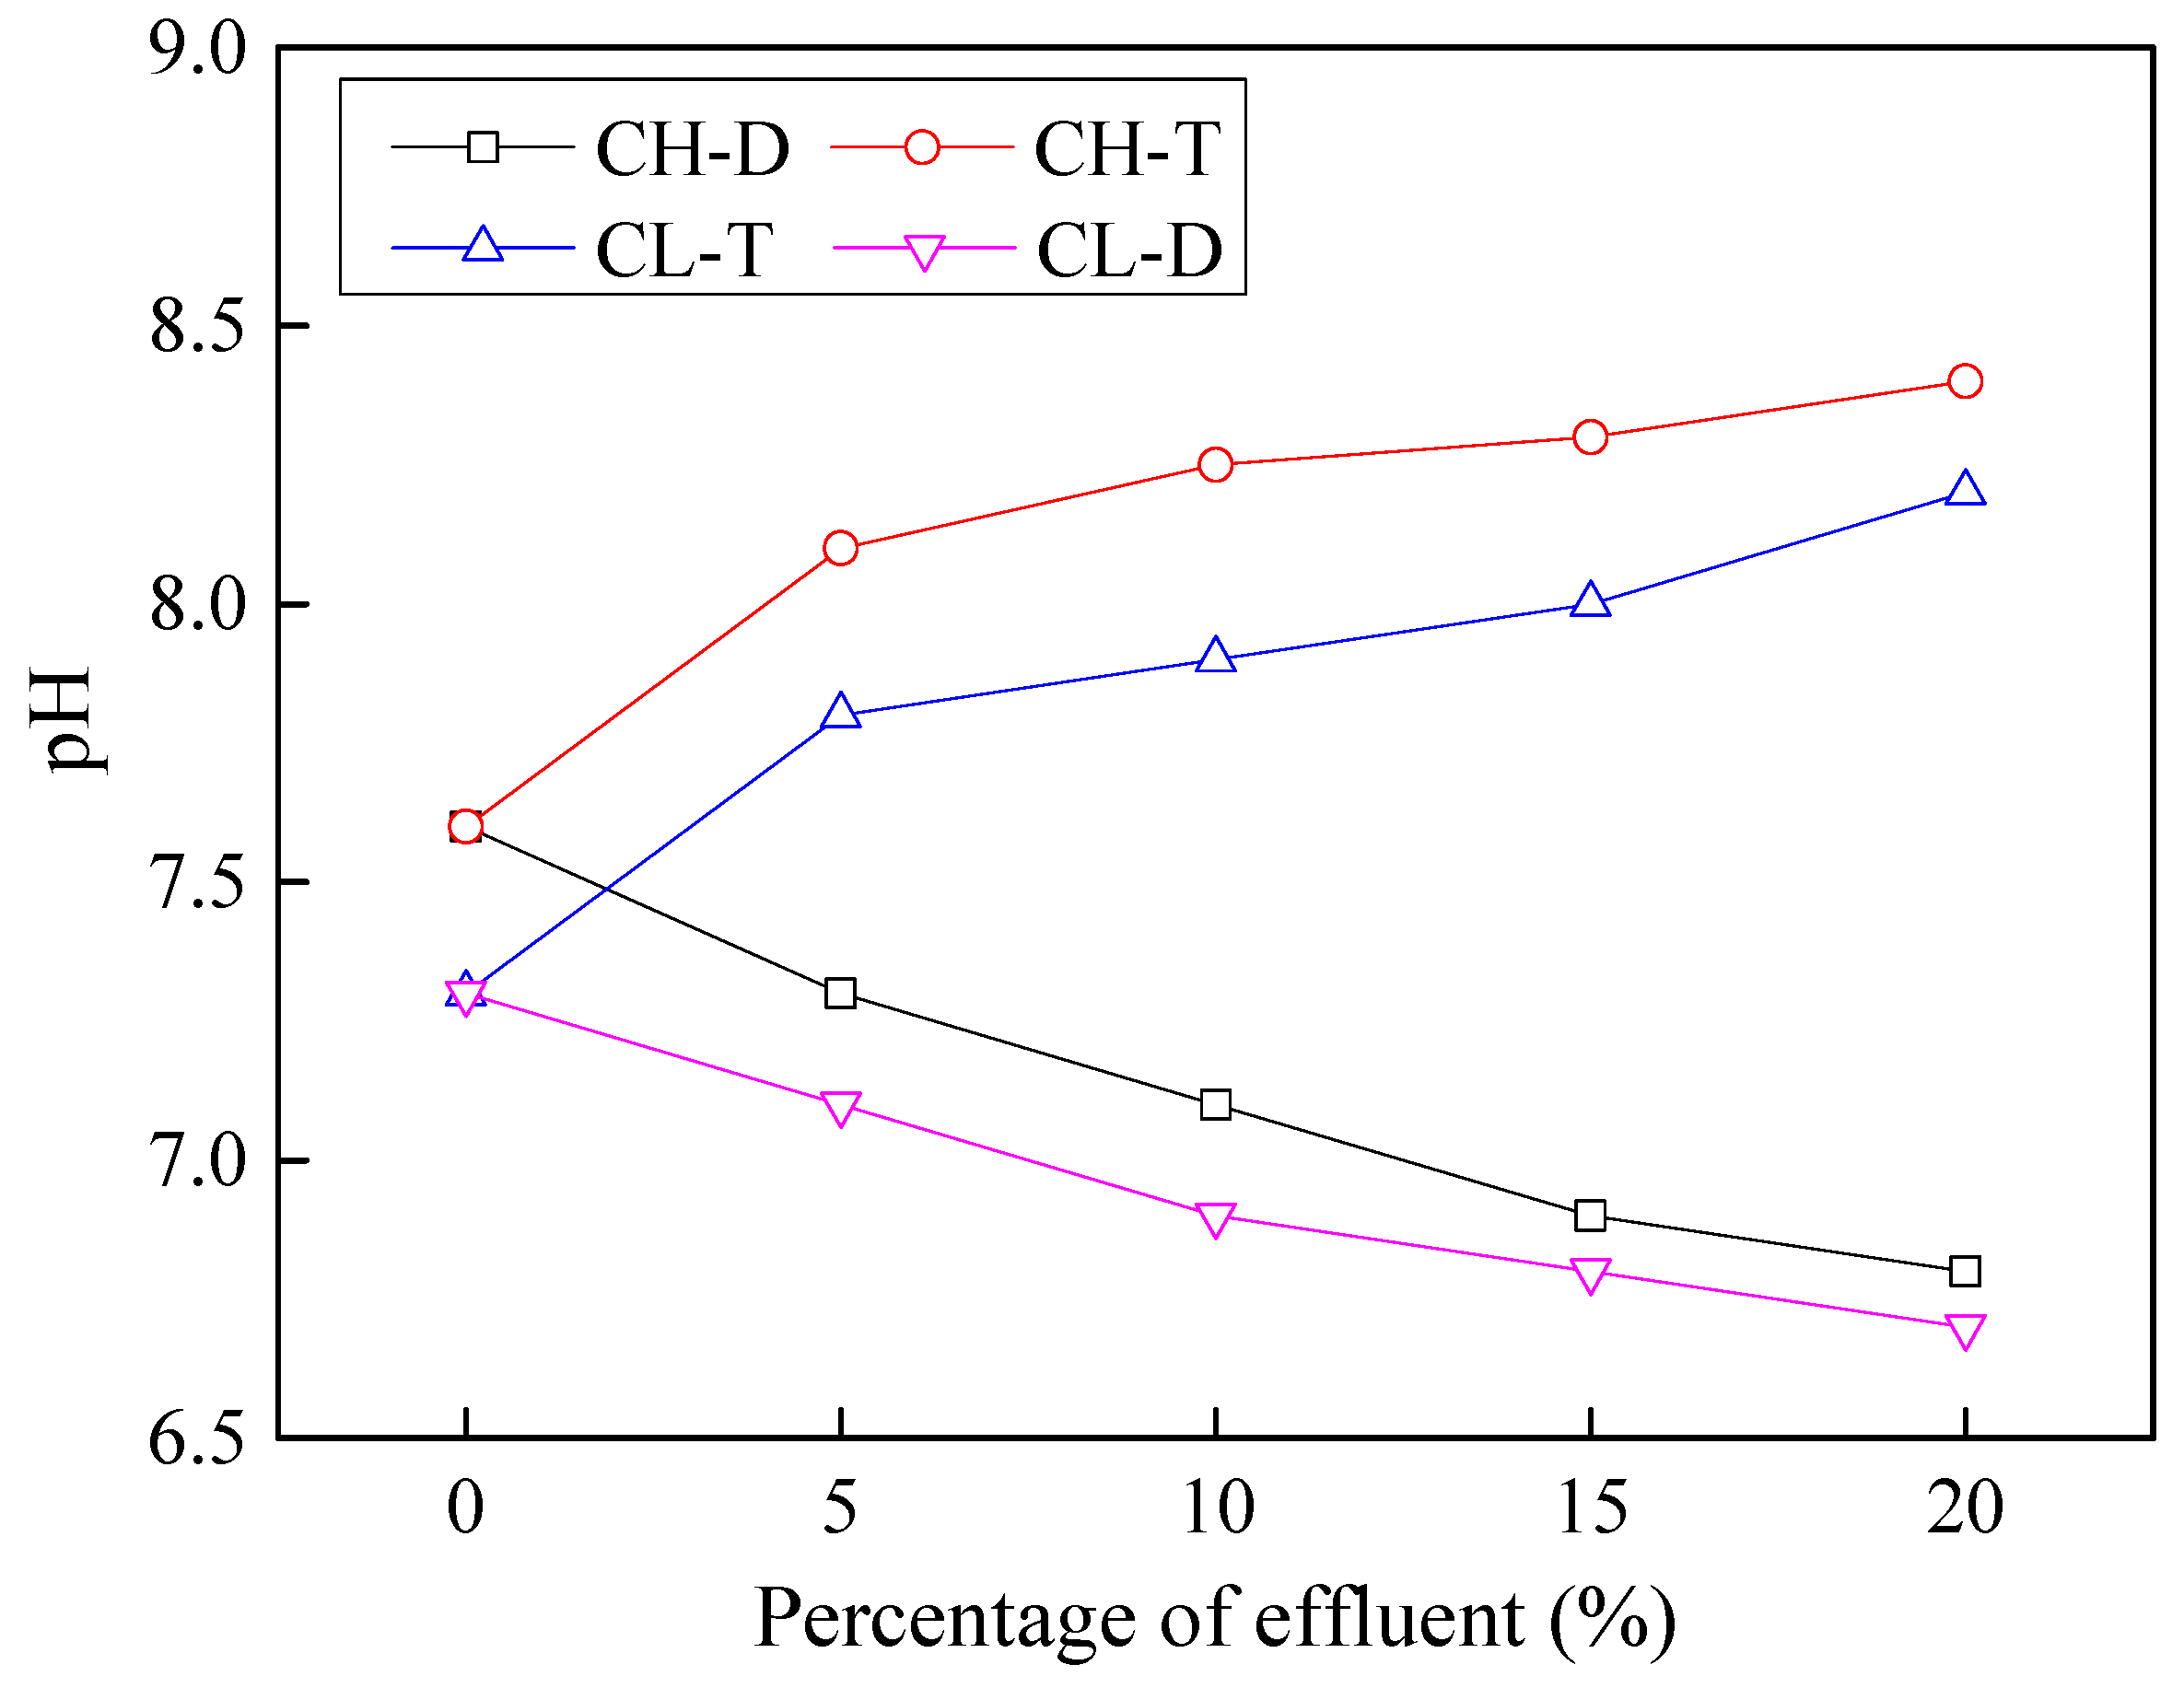
3.3. pH Value of Contaminated Soils

The two effluents used in this study comprised of samples recovered from dyeing industry and a tannery. Specimen from dyeing industry was acidic (pH = 5.1) in nature whereas the one from tannery was basic (pH = 11.5) in characteristic. Changes in the pH of soil can increase its chemical aggressivity which can cause excessive deterioration of the structural materials placed over it. The effects of contaminants on the pH of cohesive soils appear in Figure 8. At 5% contamination, the pH of all soils showed a sudden increase in pH value compared to unaffected soils. The basic effluent at 20% concentration caused an increase in pH to 8.2 and 8.4 for CL and CH soils, respectively. The acidic effluent at the same concentration caused a decrease to 6.7 and 6.8 for CL and CH soils, respectively.

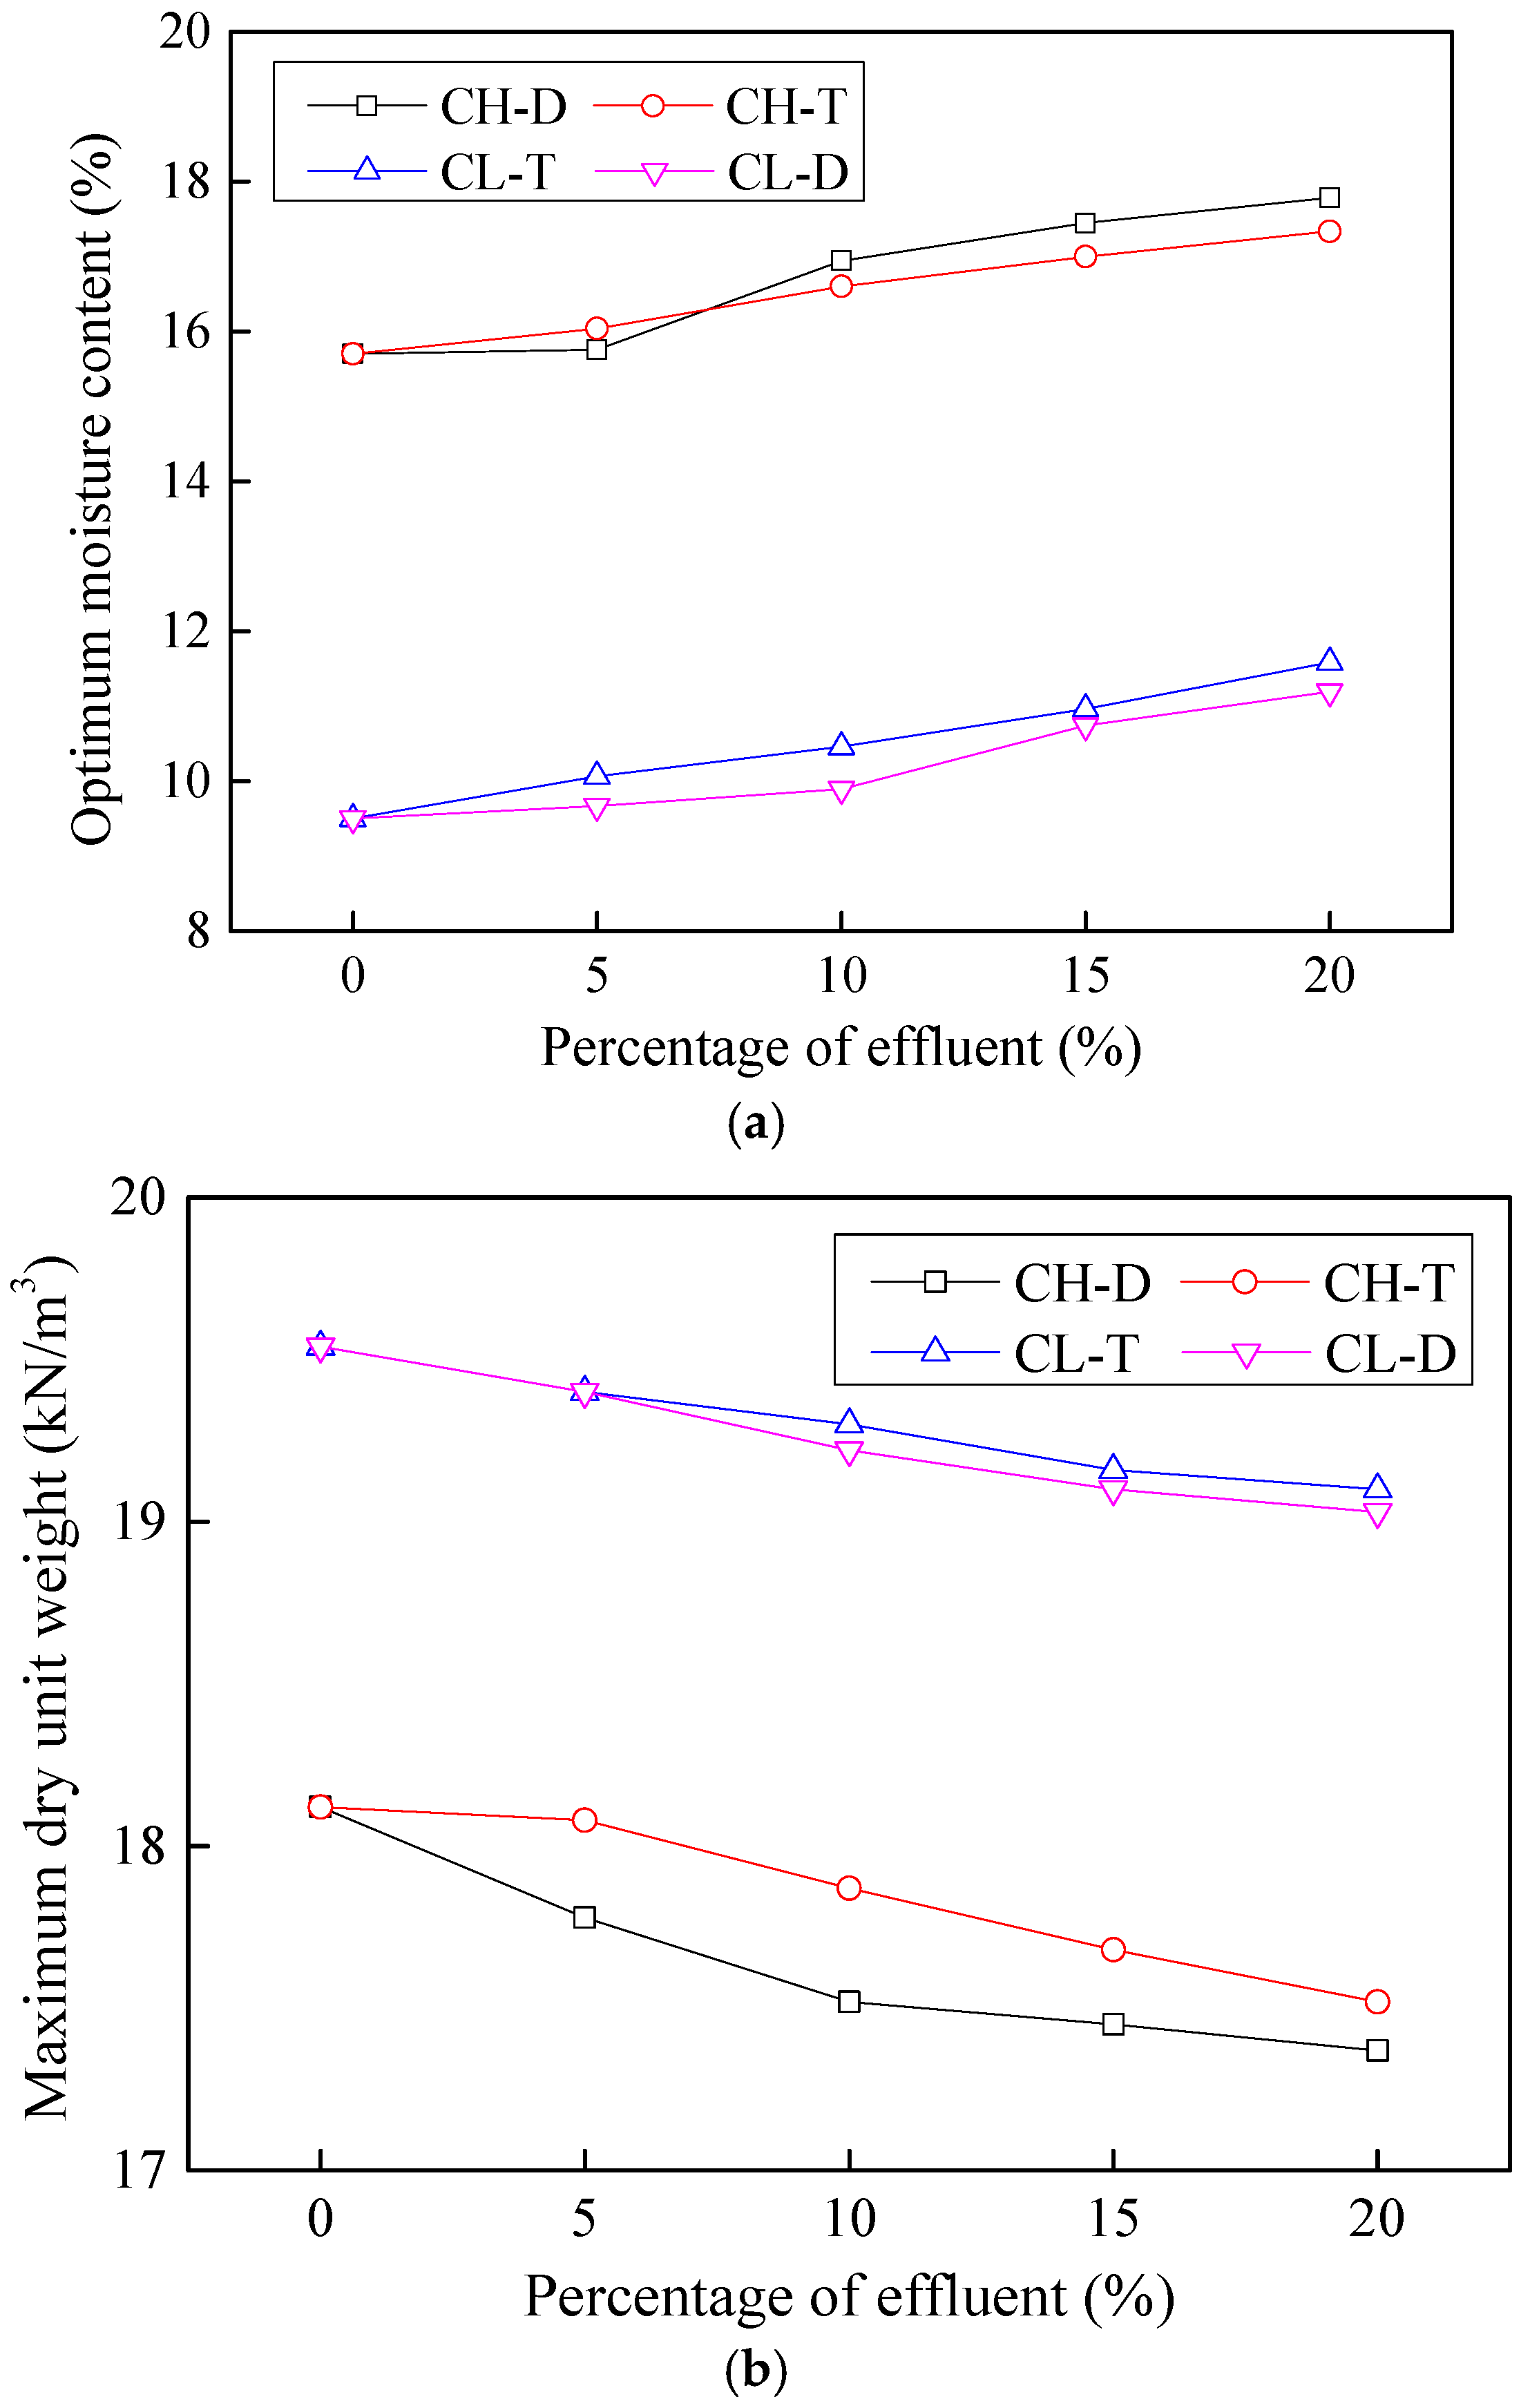
3.4. Effects on Compaction Characteristics

Compaction characteristics of soil, i.e., optimum moisture content and maximum dry unit weight, are important engineering characteristics with regards to subgrade preparation for roads, highways, and building structures. An increase in optimum moisture content of soil indicates a high water demand to achieve a certain density under same compactive effort. A higher maximum dry unit weight, on the other hand, indicates a relatively stronger material having better engineering utility. The effects of contaminants on the compaction characteristics of cohesive soils are shown in Figure 9. In general, the optimum moisture content was observed to increase by around 21.9% for CL soil and around 13.2% for CH soil with the addition of contaminants. On contrary, the effluents consistently decreased the maximum dry density of cohesive soils with an increase in contaminant percentage for all types of soils.
The variation in the compaction characteristics of cohesive soils with contaminant addition can be explained on the basis of soil plasticity. Optimum moisture content of cohesive soils increases whereas the maximum dry unit weight obtained through compaction tests decreases with plasticity index of soil. Similar phenomenon was previously observed by Pandian et al. [15] and Sridharan et al. [16]. Increase in contamination concentration makes the soil more plastic, thereby leading to an increase in optimum moisture content and a decrease in maximum dry unit weight. From engineering applications perspective, this means a high water demand to attain optimum moisture in the field; which, in general, increases the project cost and is typically undesirable. In other words, soil with high contaminant concentration would be difficult to compact and would yield a lower unit weight compared to uncontaminated soil under the same compactive effort and moisture conditions.

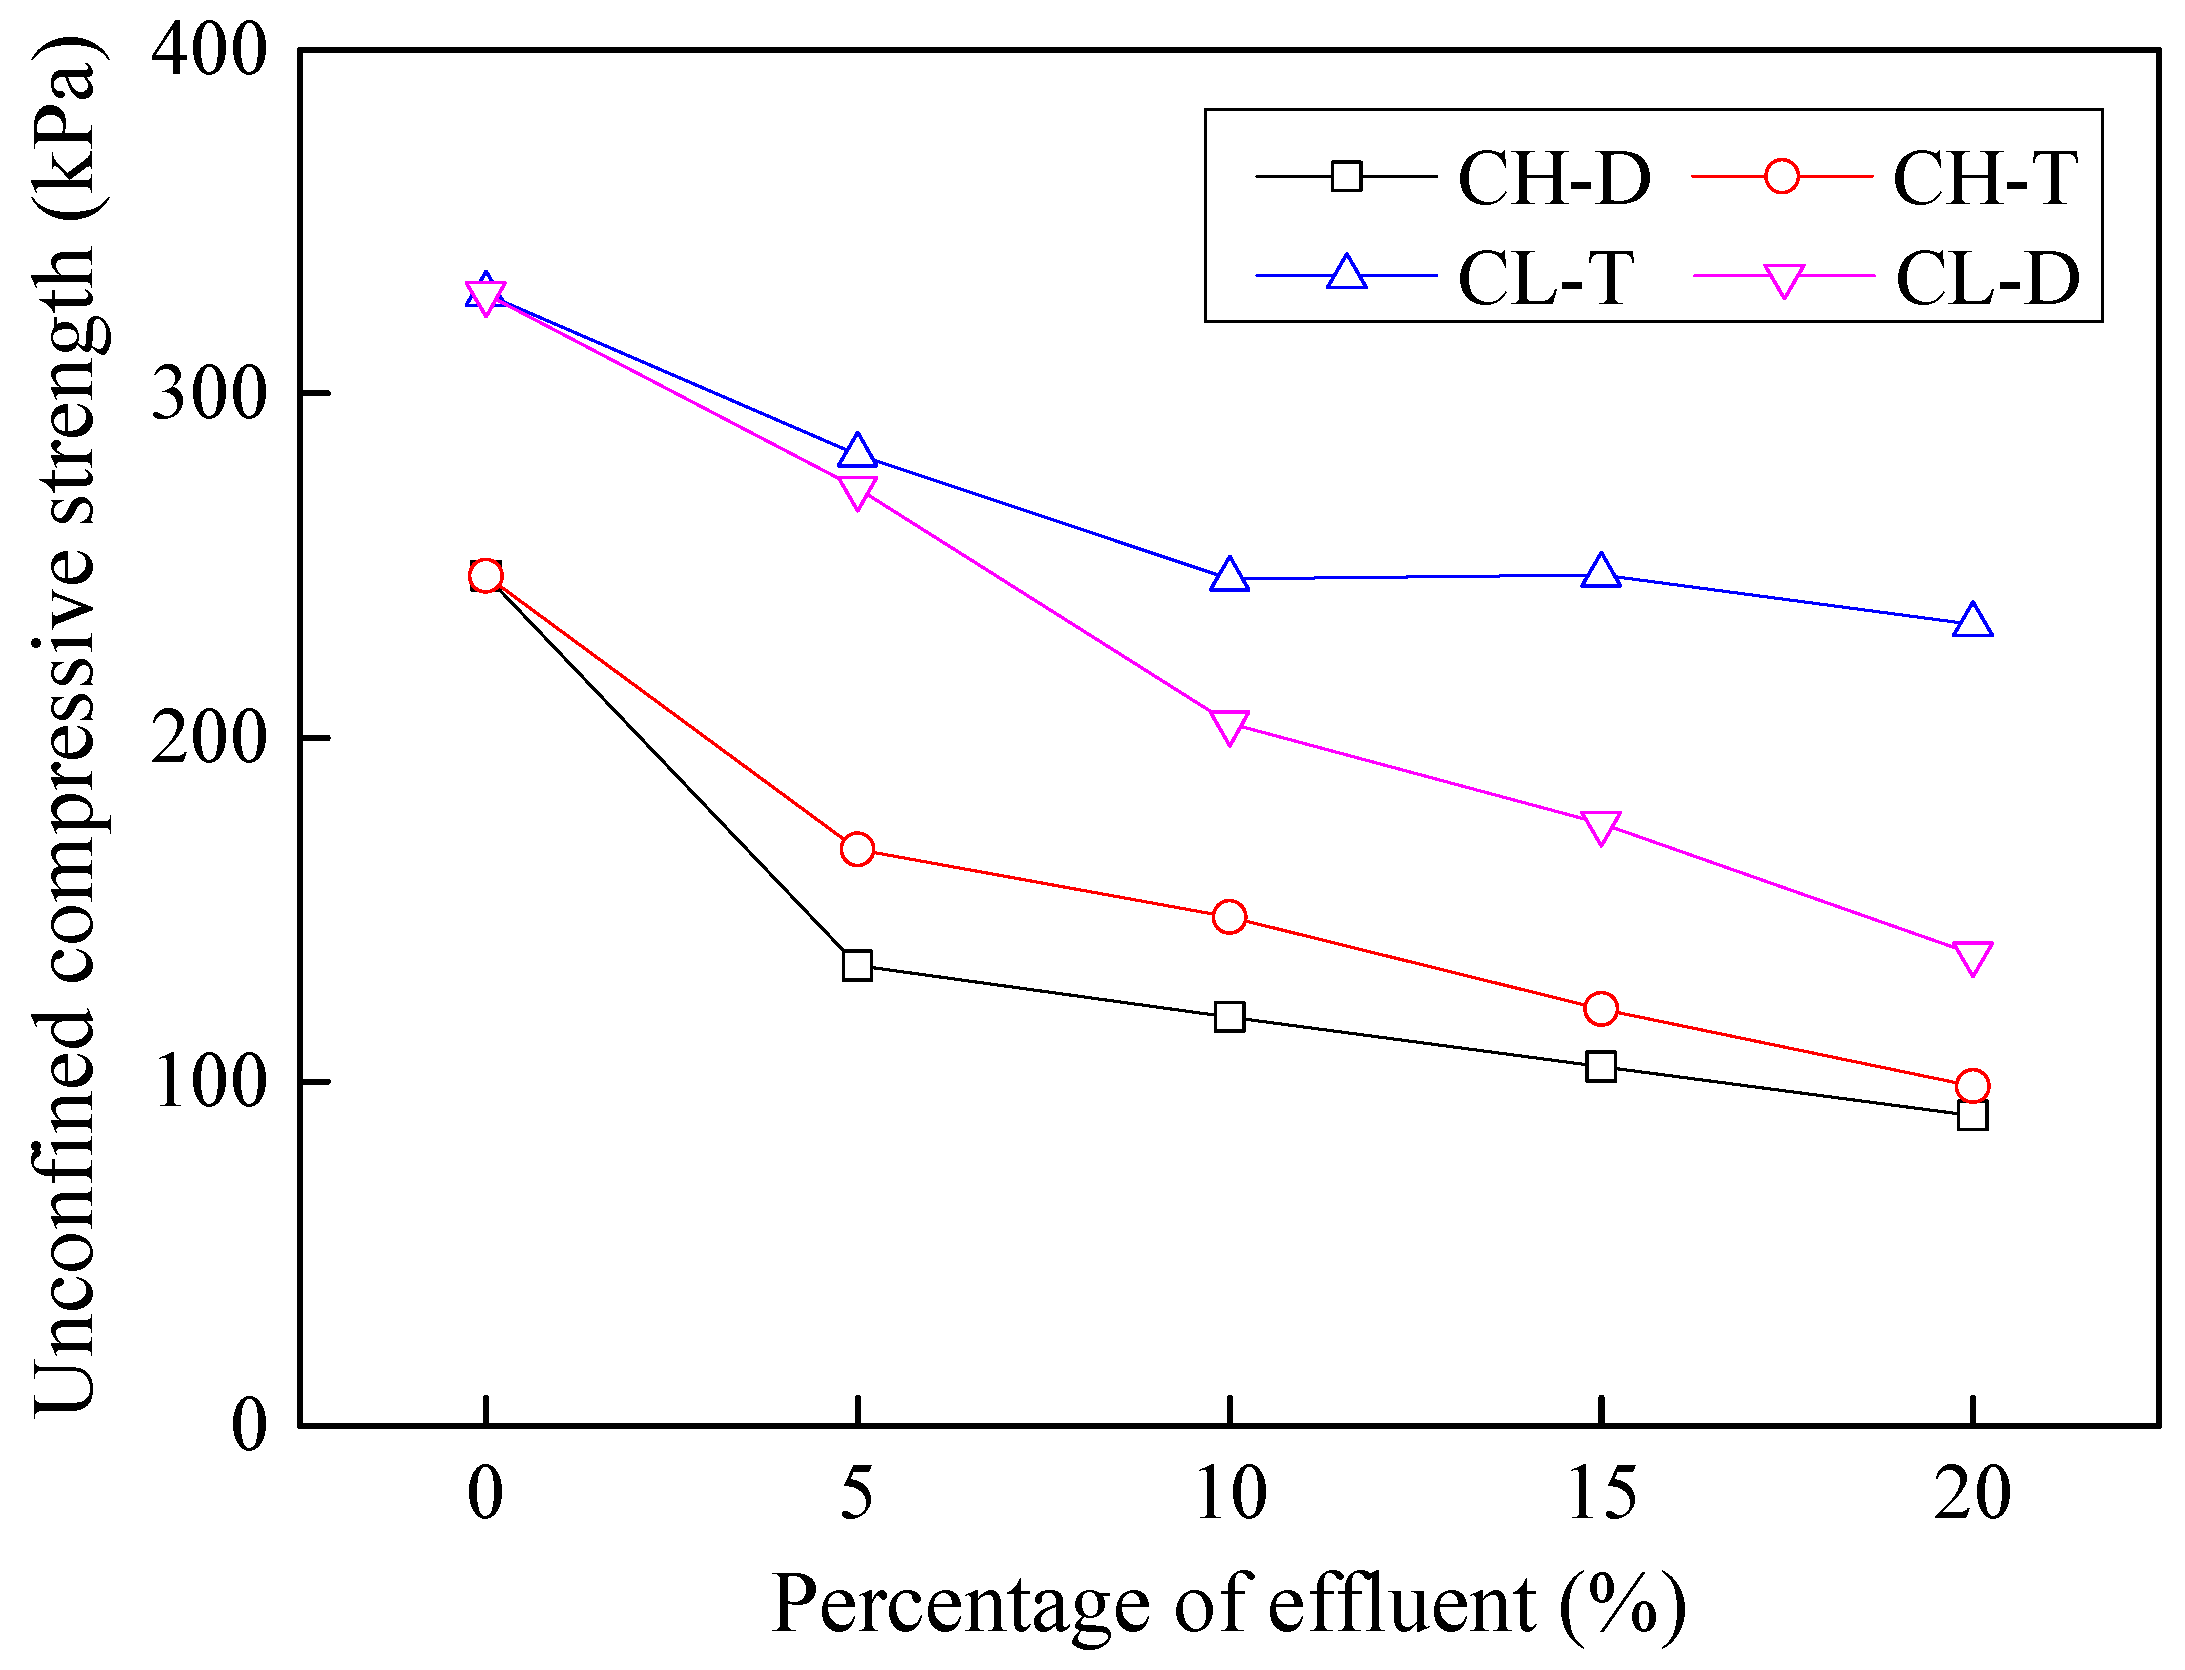
3.5. Effects of Contamination on Unconfined Compressive Strength

Unconfined compressive strength is a direct measure of strength for cohesive soils. A higher value indicates a better soil and vice versa. The behavior of cohesive soils upon contamination of acidic and basic effluents in terms of unconfined compressive strength is illustrated in Figure 10. CH soil showed a decrease in unconfined compressive strength from 246.96 kPa to 98.66 kPa and 90.18 kPa for basic and acidic effluents, respectively. Both effluents decreased the unconfined compressive strength of the cohesive soils to almost 60%. The reduction of strength due to contamination can be attributed to the possible breakage of internal bonds as was previously shown by Umesha et al. [17].
The reason for the decrease in unconfined compressive strength may also be due to the decrease in cementing material. Cementing agents in soil help to bond the finer particles together, forming aggregates. Due to leaching, however, these aggregates disintegrate along with the cementing agents. Thus, it stands to reason that both effluents alter the cementing agents in the soil particles and hence decrease unconfined compressive strength.
Industry effluents contain various sulfides in the form of iron pyrites (FeS2). Oxidation of FeS2 produces H2SO4, which may produce gypsum in the presence of calcium carbonate. Therefore, gypsum may be present in the natural soil. Reactions are shown below.
2FeS2 + 2H2O +7O2 = 2FeSO4 + 2H2SO4
CaCO3 + H2SO4 + H2O = CaSO4·2H2O + CO2
In the presence of excess water, hydrated sulfates formed in the reaction are already present in the effluent, and attack the binding material on soil particles. This weakens the bonds thereby decreasing soil strength.
The undrained unconfined compressive strength of soil samples contaminated with the tannery effluent decreased with an increase in tannery percentage. These results correspond with those of Stalin et al. [18], who studied the effect of tannery waste on the behavior of two natural soil samples collected from Madras City, India.

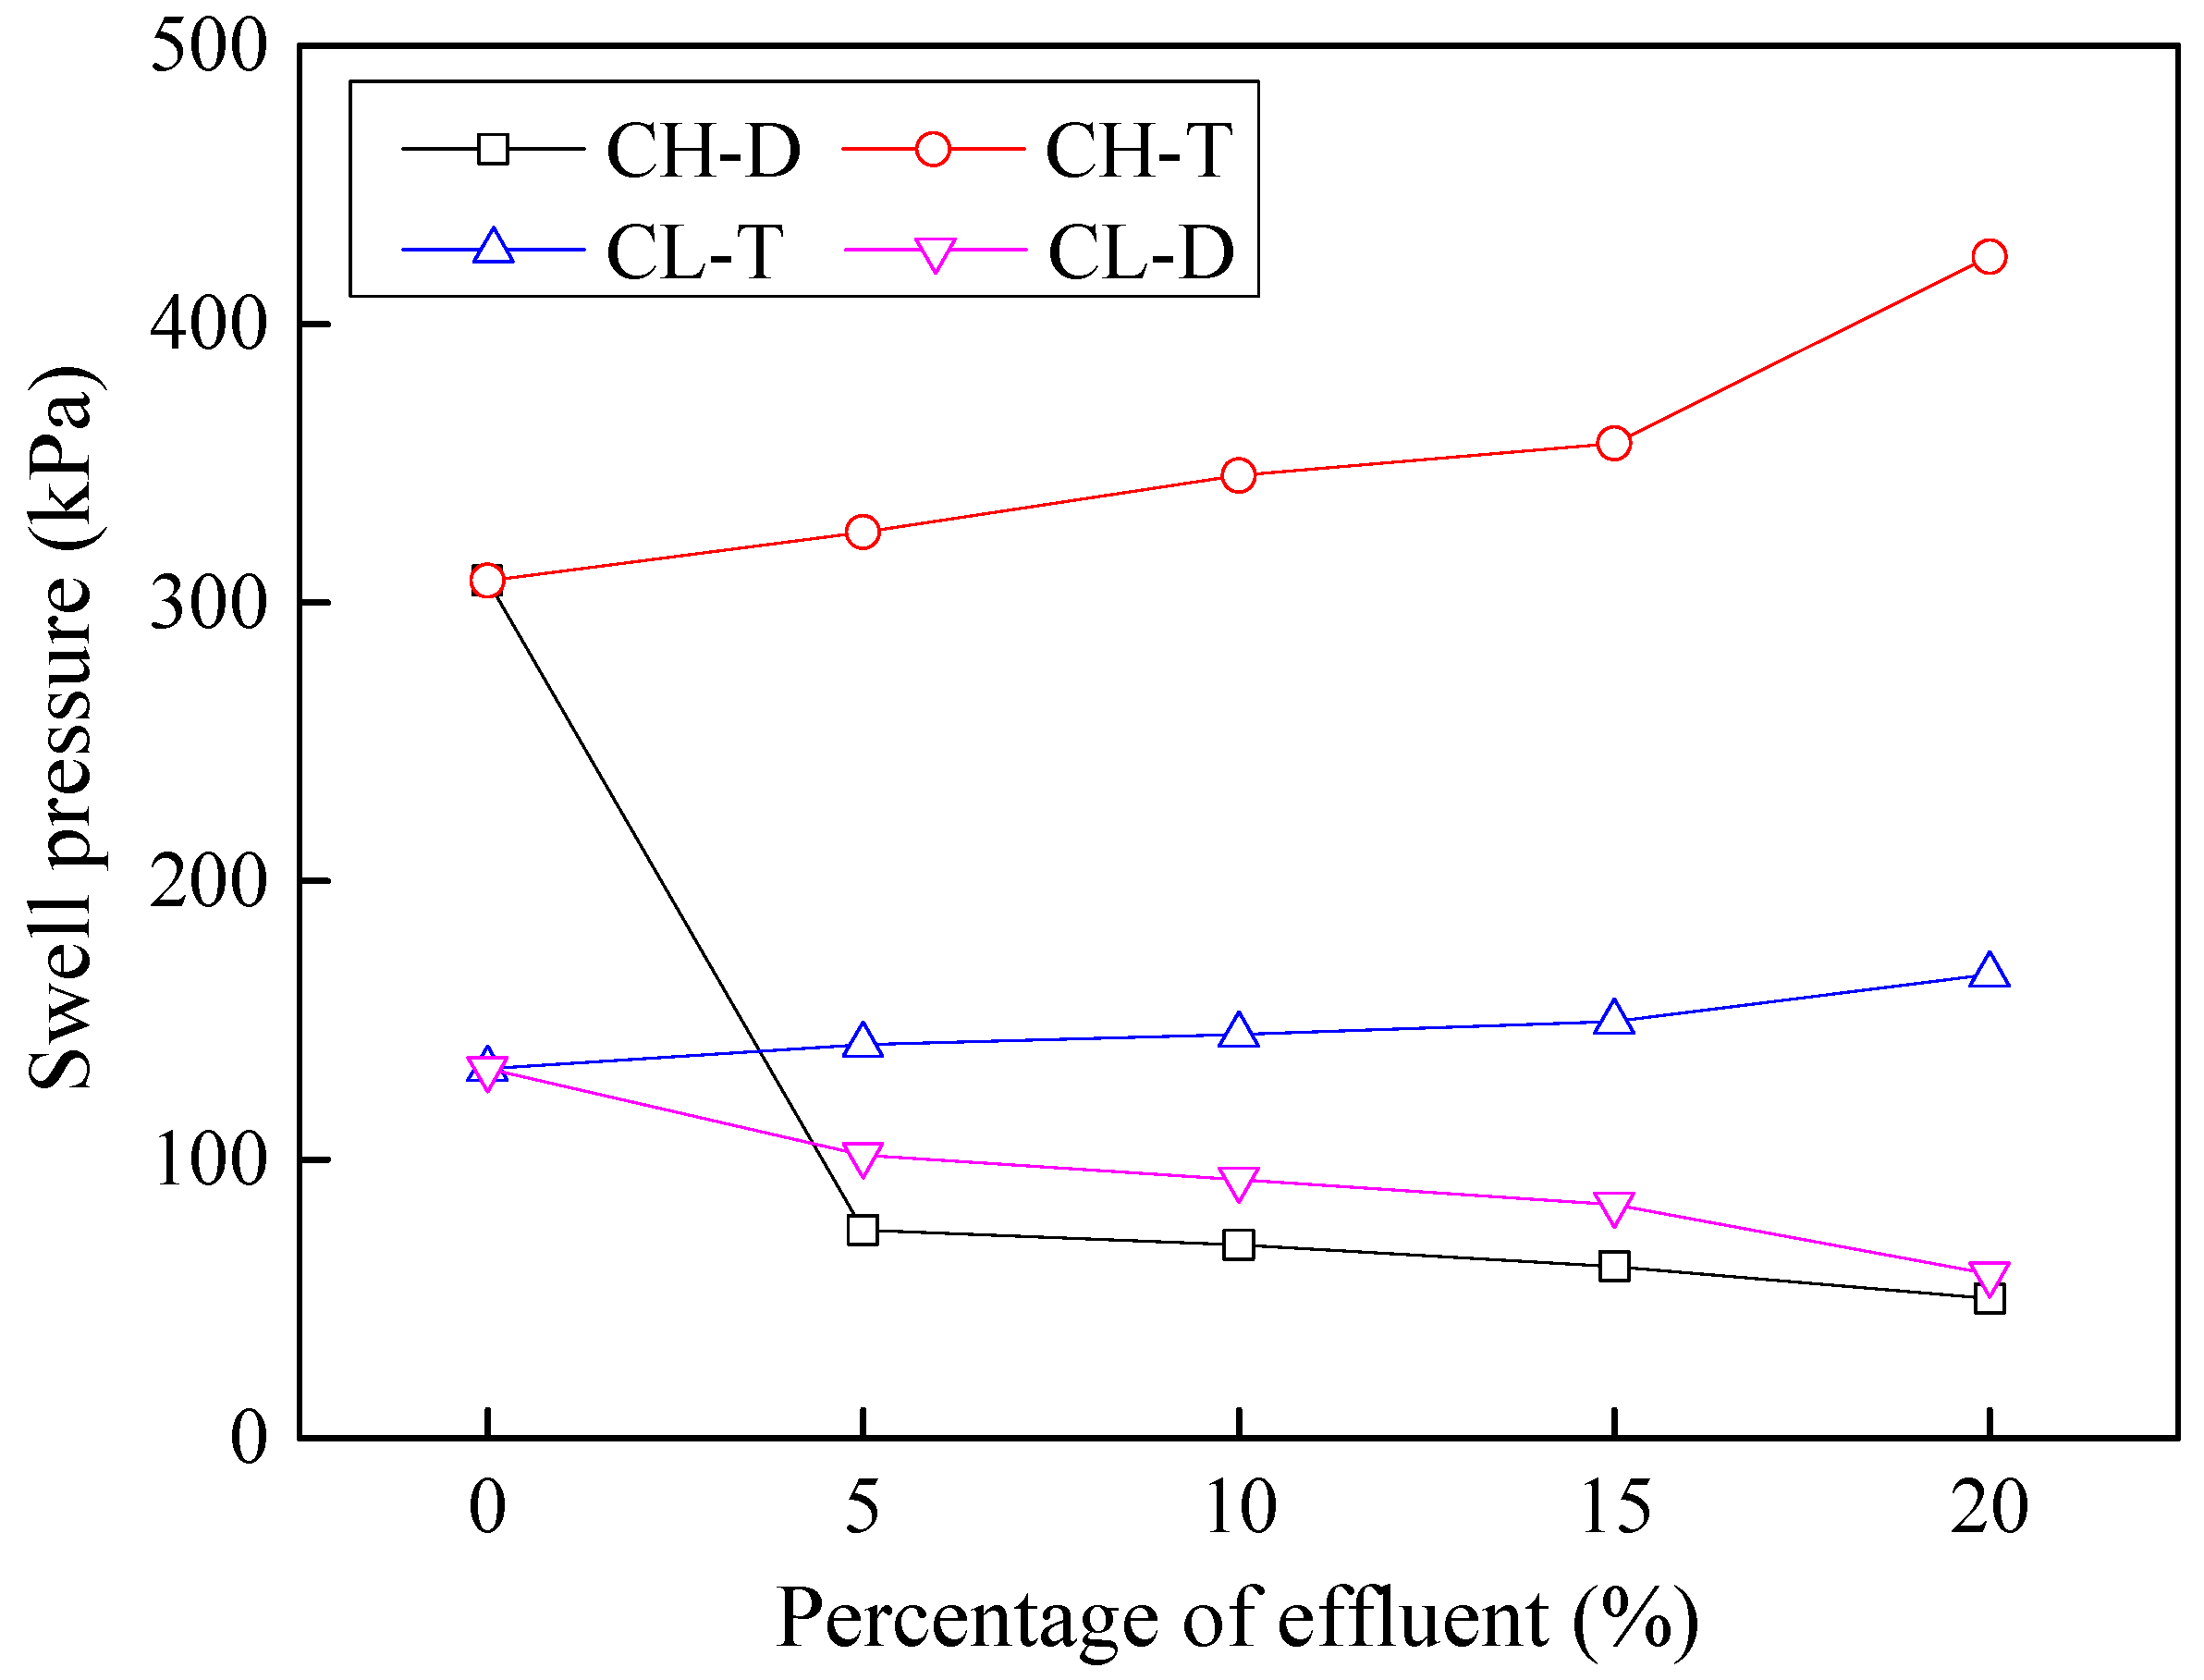
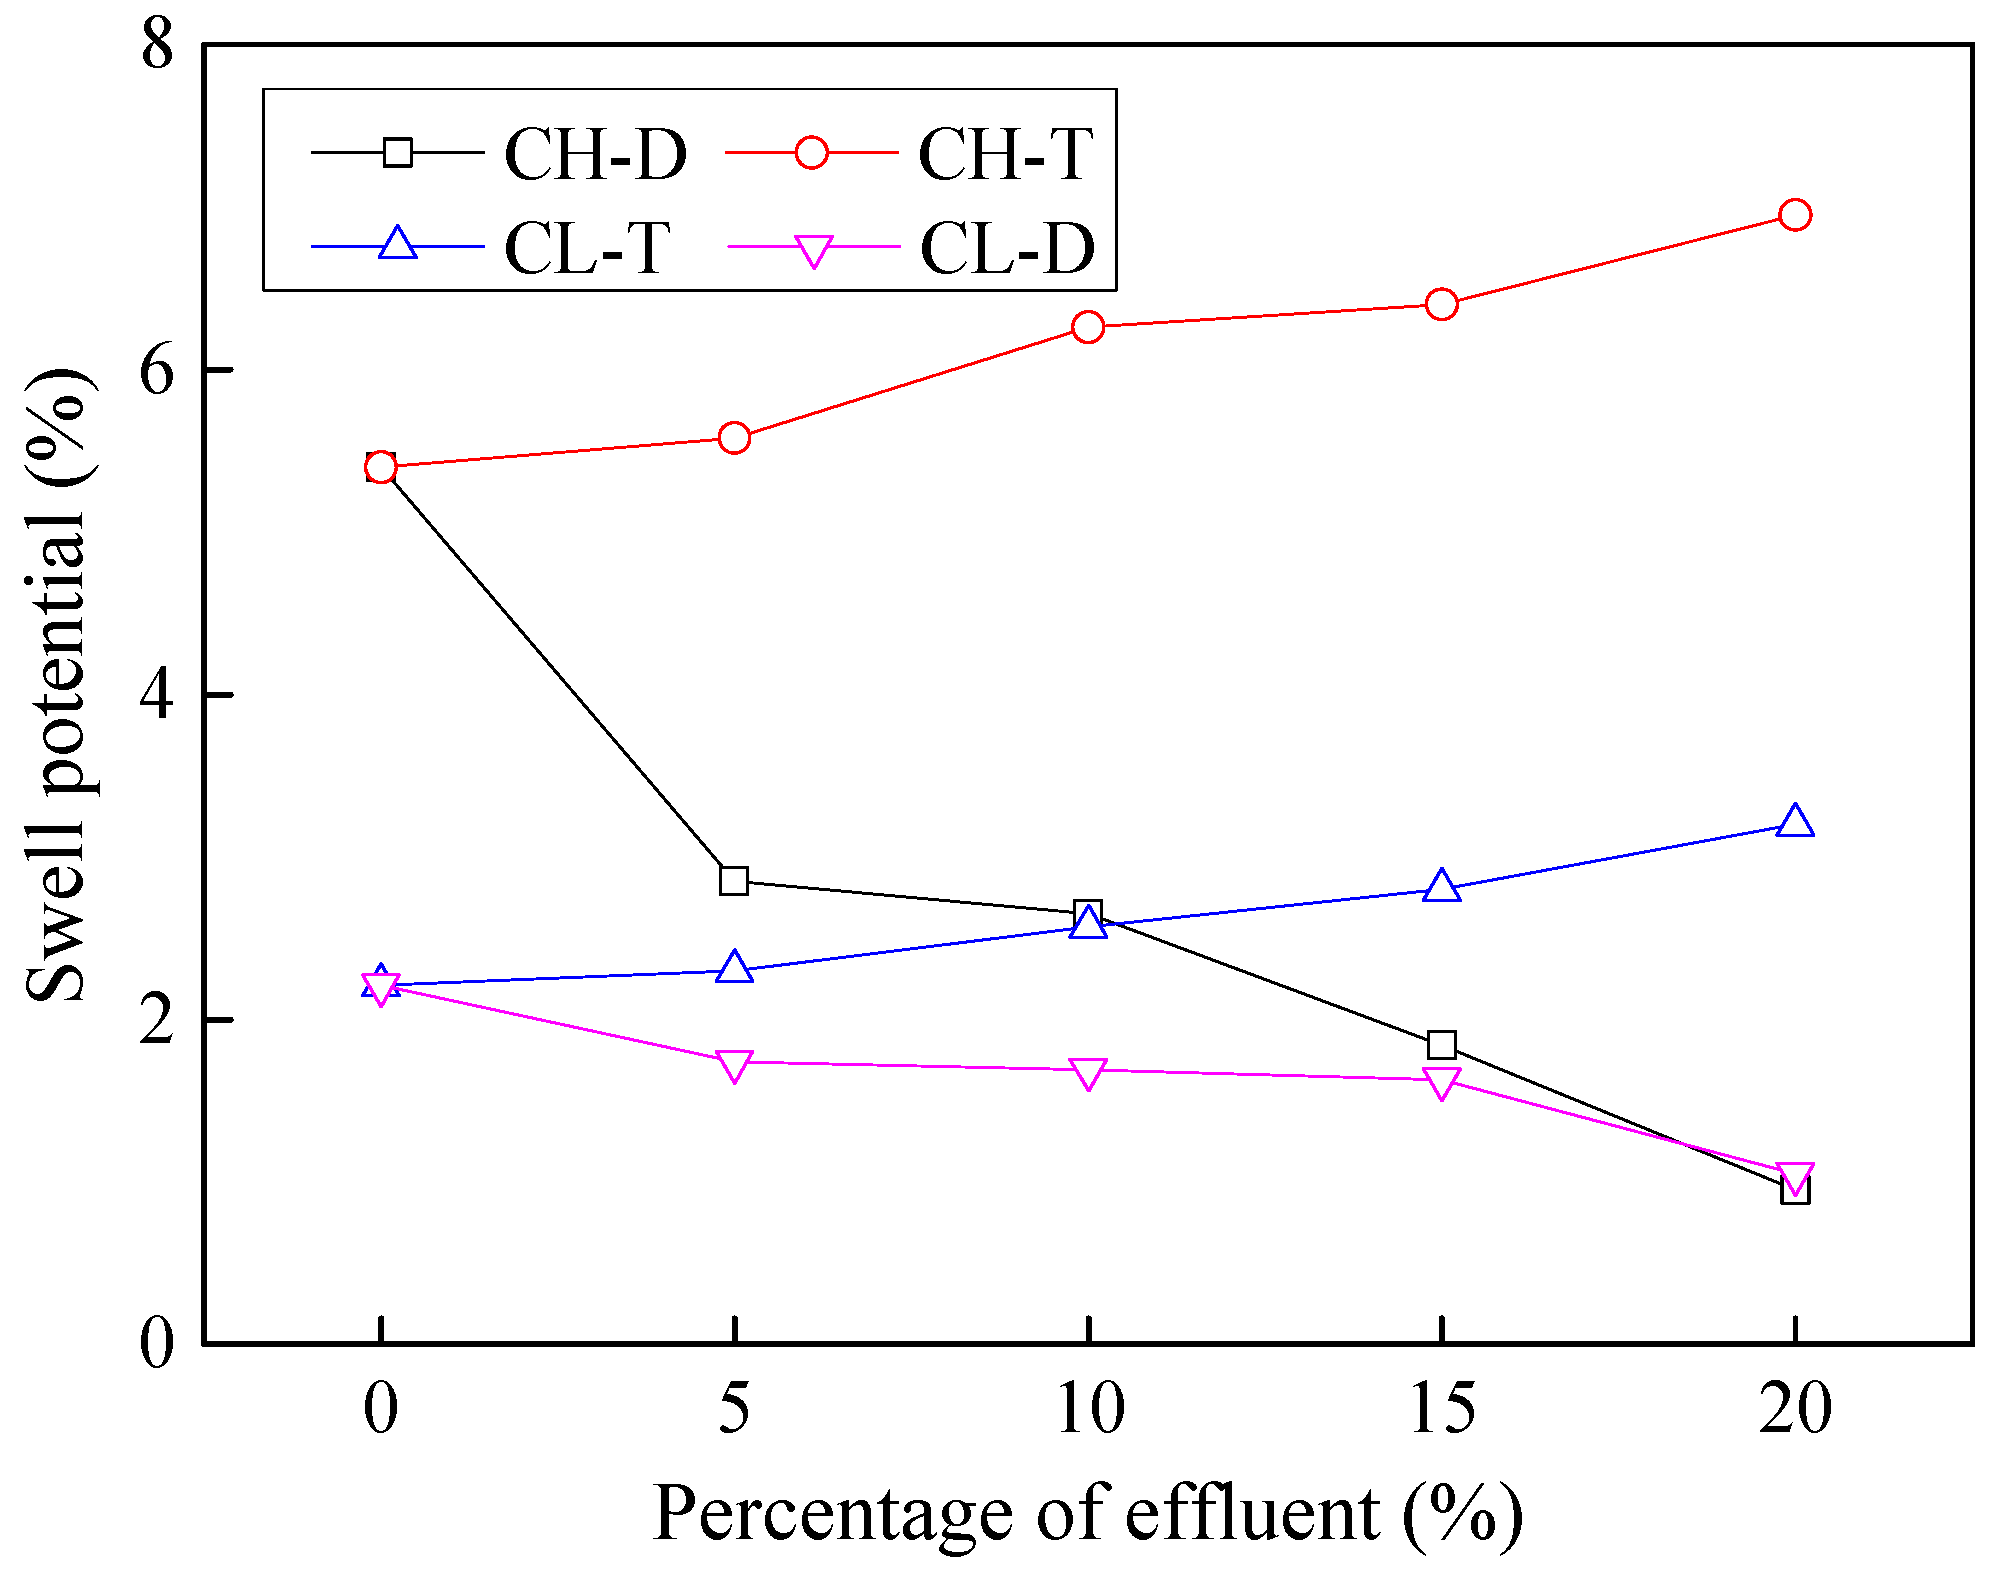
3.6. Effects of Contamination on Swelling Characteristics

The swell potential of soil indicates its ability to swell upon wetting. A higher swell potential (and the corresponding swell pressure) is highly undesirable for the structures as it can cause severe cracks and destress in the buildings. The effects of contaminants on soils’ swell potential appear in Figure 11. The swell potential of CL and CH soil samples increased by 44.8% and 28.7% with the addition of 20% basic effluent. On the contrary, the swell potential of both the soil samples decreased with the addition of effluent from dyeing industry because of its acidic nature. The observed decrease in swell potential of CL and CH soil samples with 20% contamination of acidic effluent was 52.5% and 82.4% respectively.
The effects of contaminants on soil swell pressure are illustrated in Figure 12. Swell pressure showed a decreasing trend with acidic contamination (i.e., dyeing). In particular, CH swell pressure suddenly decreased with a slight addition of 5% of acidic effluent. Whereas the swell pressure increased with basic effluent.
It can be seen from Figure 11 and Figure 12 that in case of acidic contamination, the swell potential and pressure of both the soils were decreased; whereas the swell potential and pressure of both the soils increased when contaminated with basic effluent. This difference can be attributed to the reactions of the clay soil minerals with effluent contamination. The surfaces of most clay particles carry an unbalanced negative charge, which attracts cations. These positive ions become strongly attracted to the clay surface leading to the formation of diffuse double layer around clay particles. The interaction of the diffuse double layers of neighboring units result in a net repulsive force between them.
An increase in the concentration of H+ in the pore fluid because of acidic contamination would depress the thickness of the diffuse double layer, thus reducing the repulsion force between clay particles. As a result, the net attractive van der Waal forces would increase [19], leading to the formation of larger clay aggregates in which the clay particles would be closer to each other. Such arrangements are expected to produce “denser” clay microfabrics with a lower void ratio, which leads to the decrease in the swell potential and pressure.
The addition of basic contamination has the opposite effect on the swell potential and pressure of cohesive fine-grained soils. Such changes in the soil behavior can be attributed to the further transformation of clay microfabric. In particular, the charge on the edges of the clay particles becomes negative, leading to the formation of more open, flocculated structures [20]. Sridharan et al. [21] noted that such flocculated arrangements of the clay particles would enclose large spaces for water entrapment; thus, higher swell potential and pressure would be exhibited.

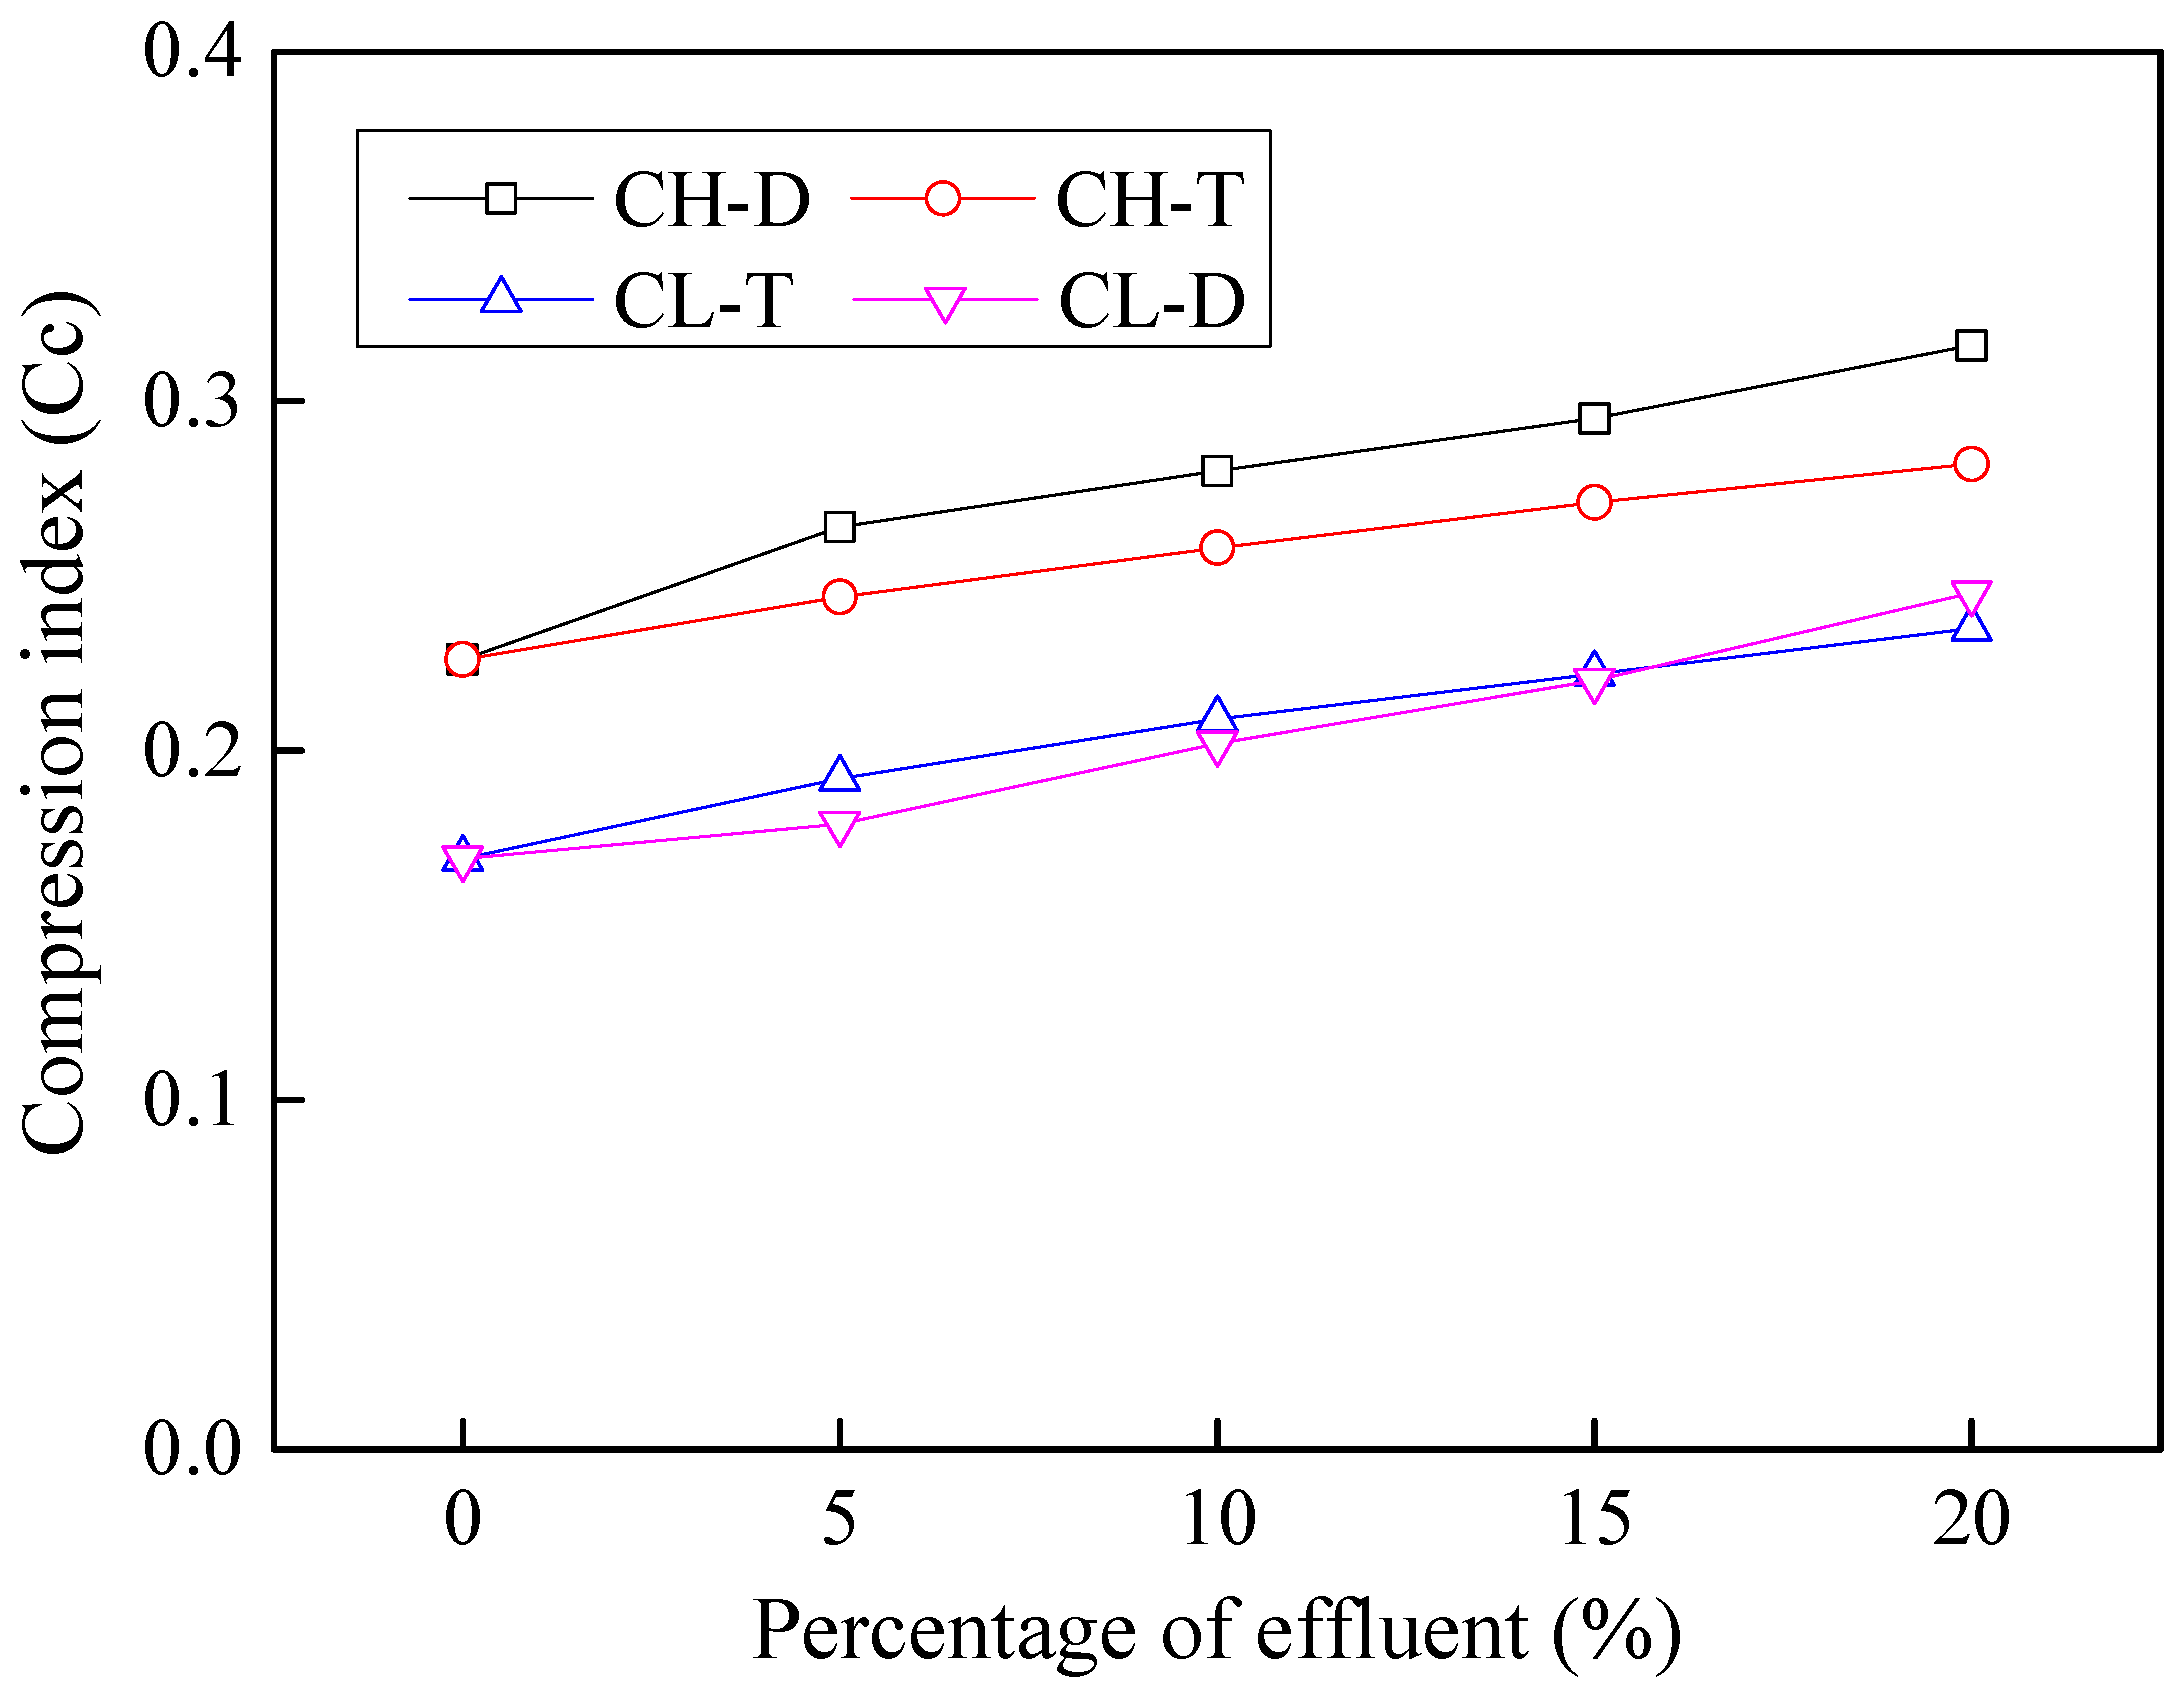
3.7. Effects of Contamination on Compression Index

Compression index (Cc) of cohesive soils is a direct indicative of its tendency to settle under the applied load. Higher compression index indicates a higher tendency to settle which ultimately leads to structural destress. The trends for compression indices in contaminated cohesive soils are shown in Figure 13. In CH soil, the compression index increased from 0.226 to 0.316 and 0.282 for acidic and basic contamination, respectively. In CL soil, the Cc value increased from 0.169 to 0.235 and 0.245 for basic and acidic contaminants, respectively. These findings show that the consolidation potential of contaminated soils is greater than that of affected soils. The same behavior can also be seen in soil plasticity with an increase in effluent concentration (see Figure 6), as Cc is a direct measure of soil plasticity [13].

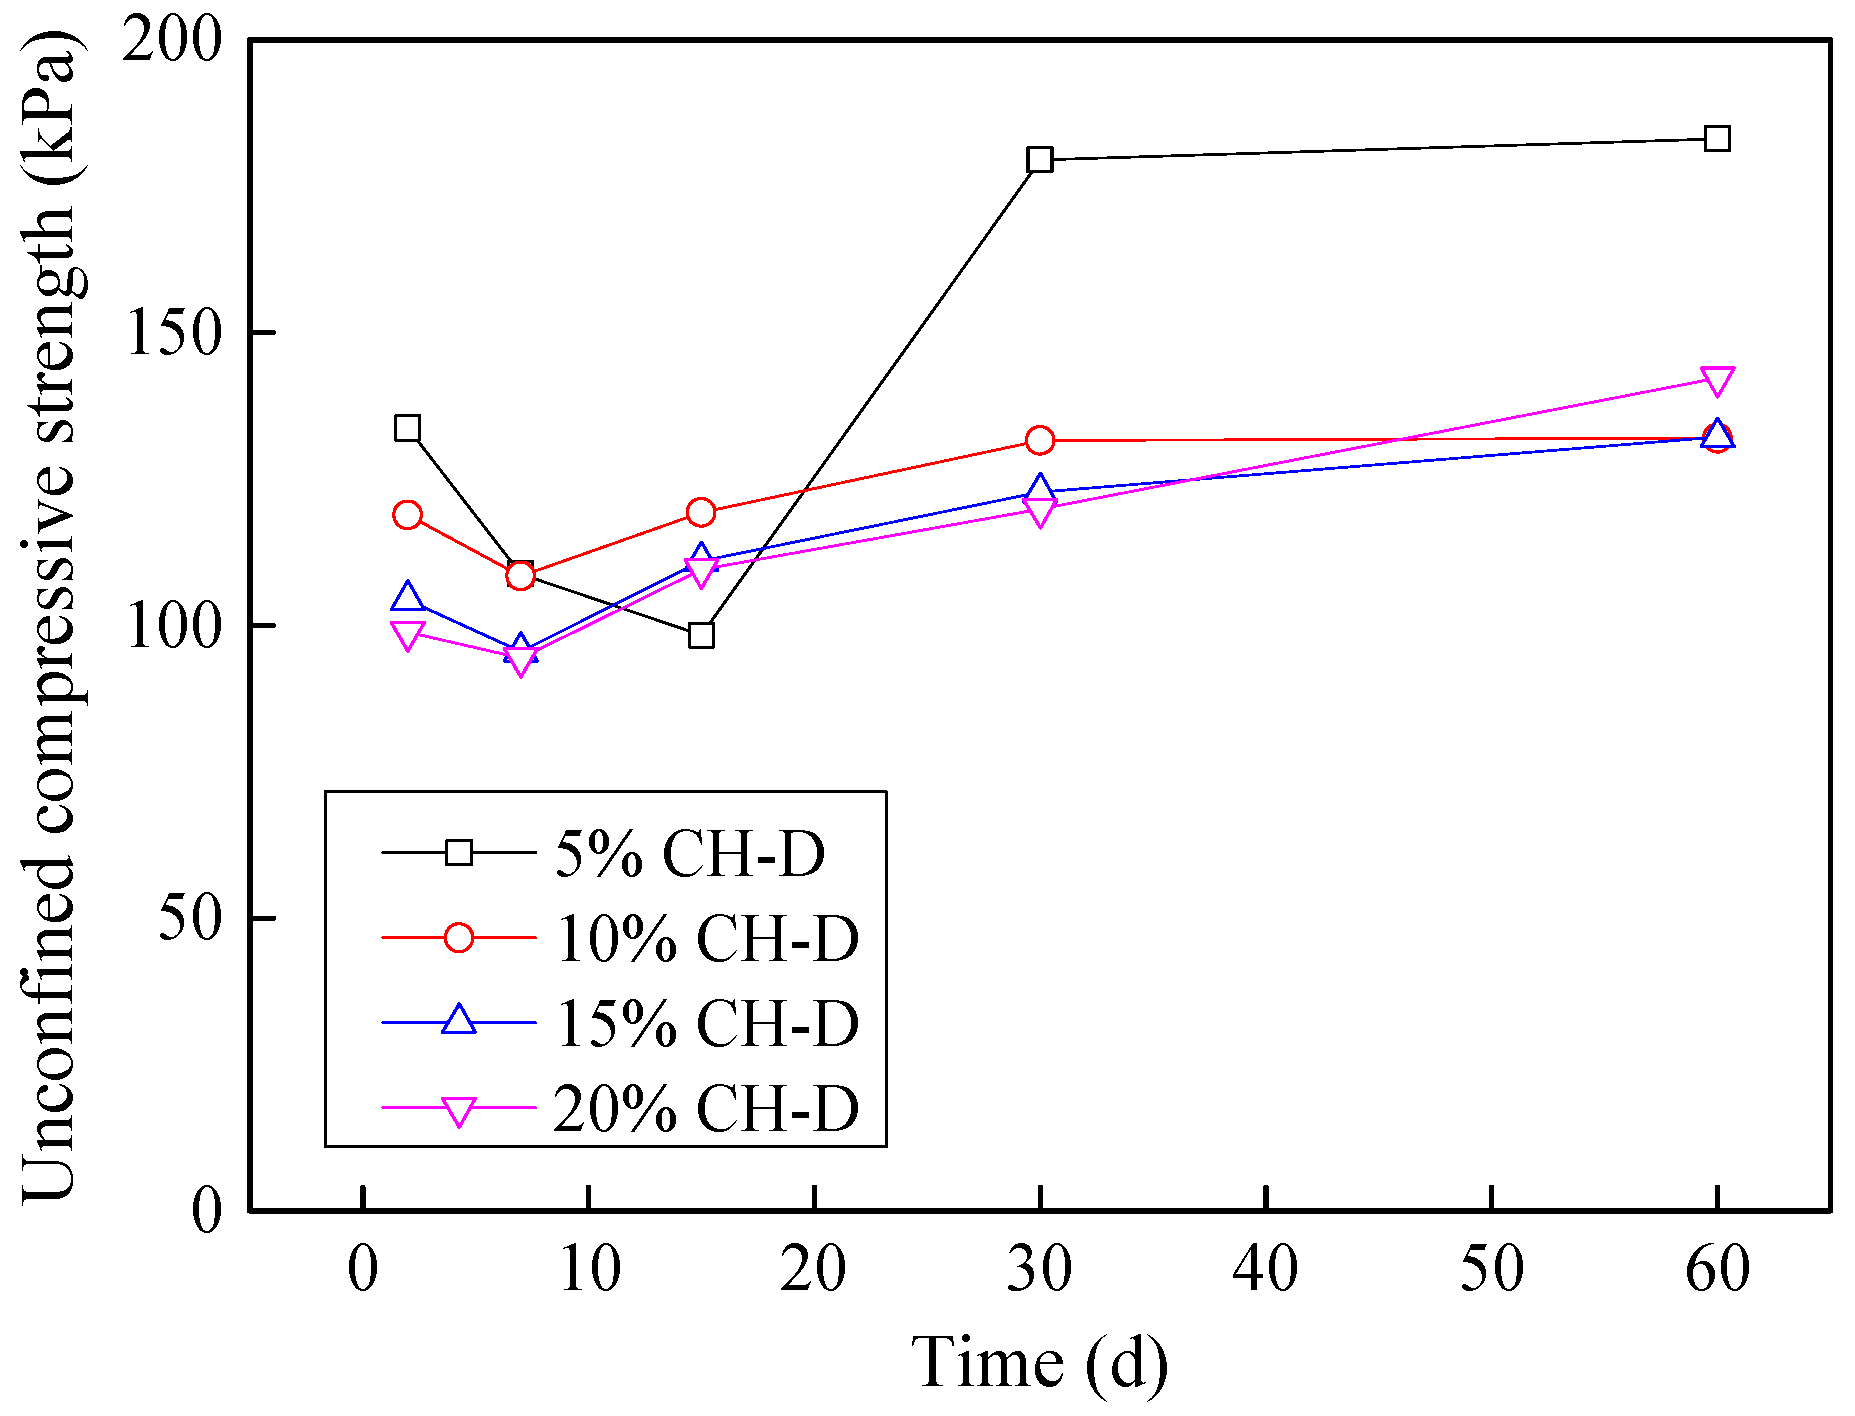
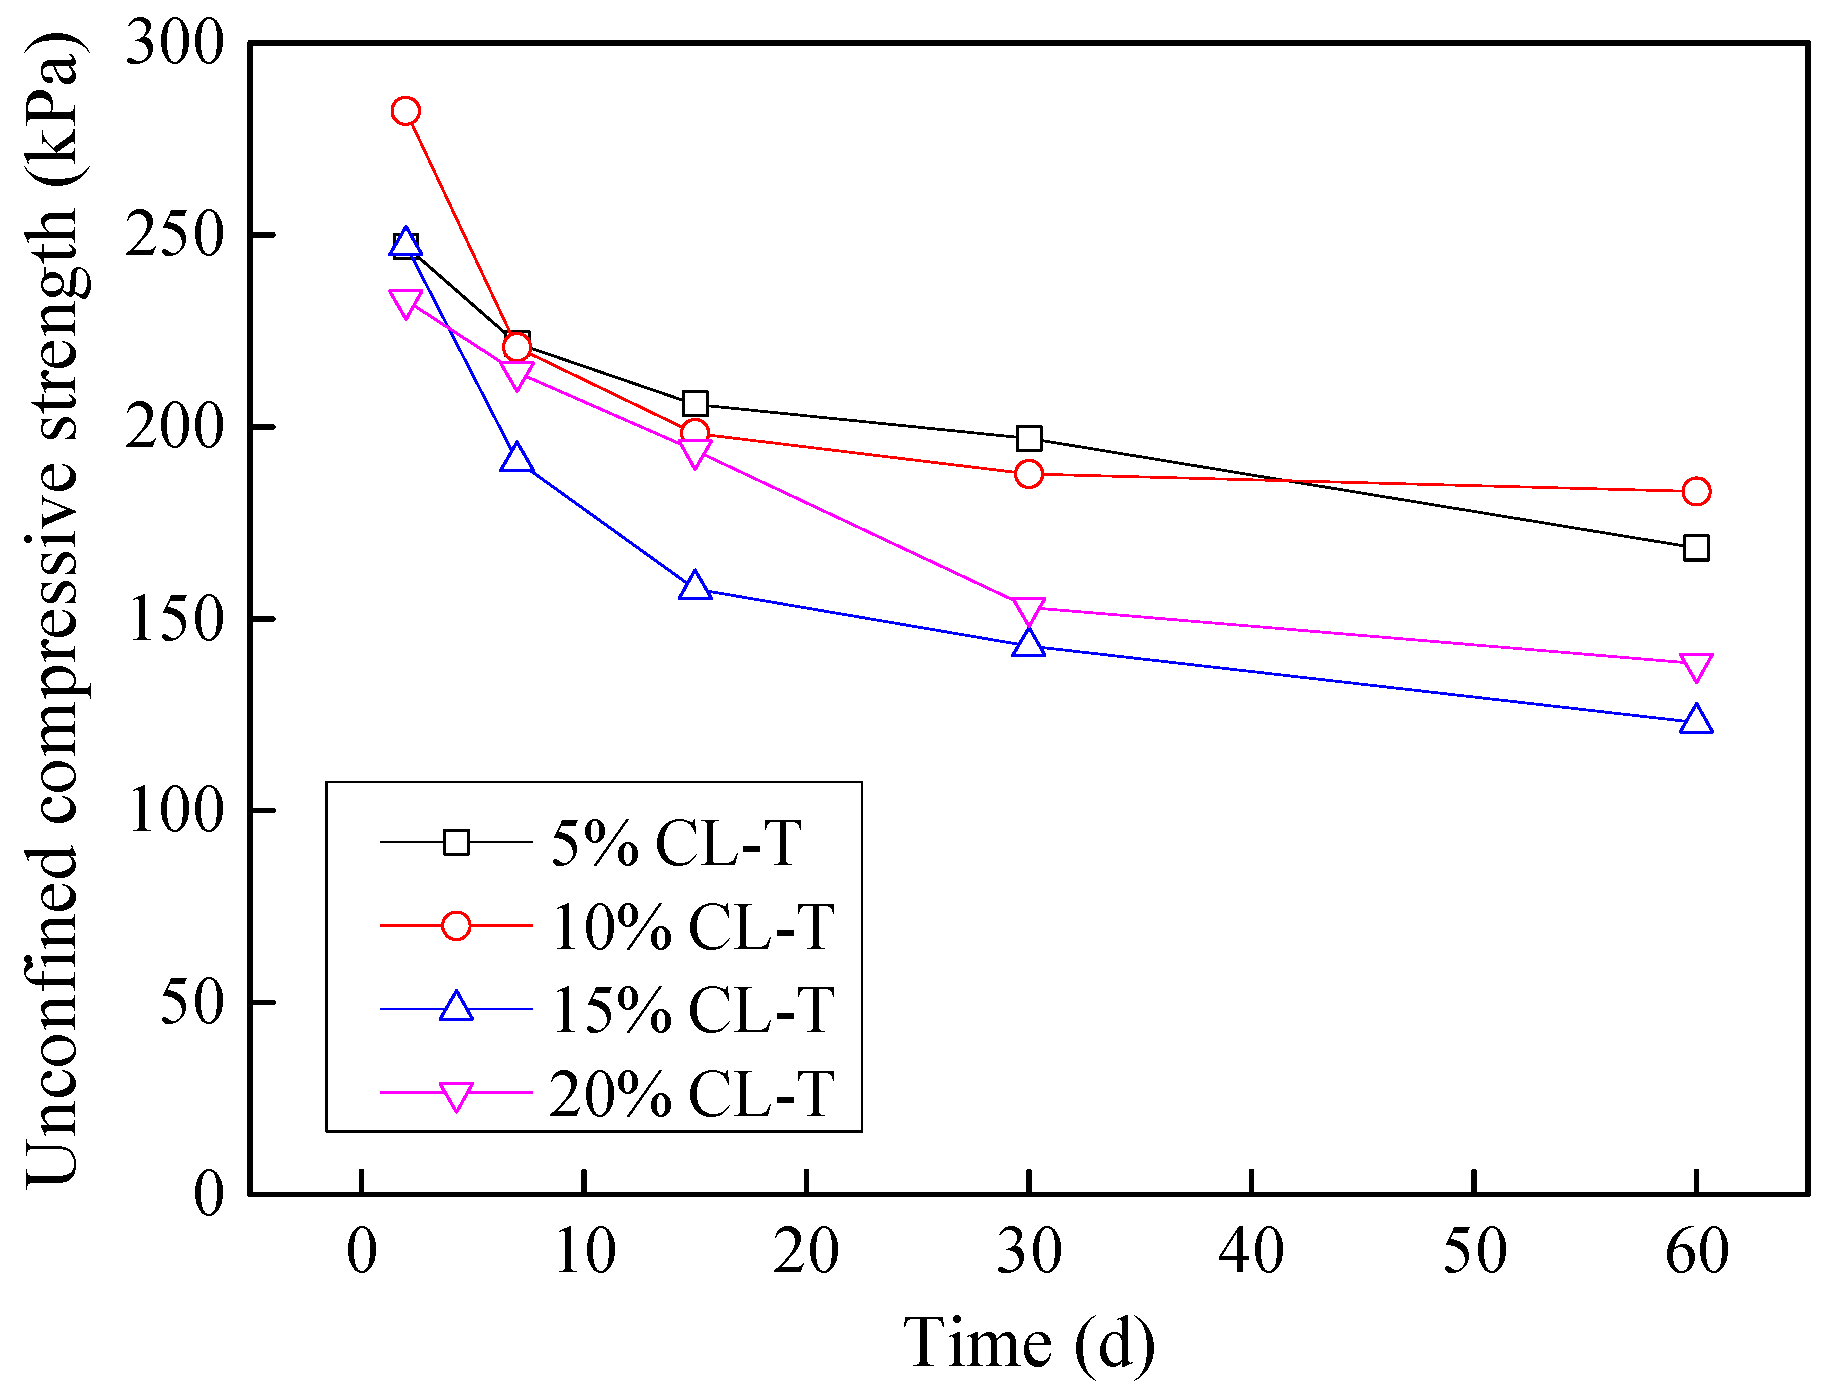
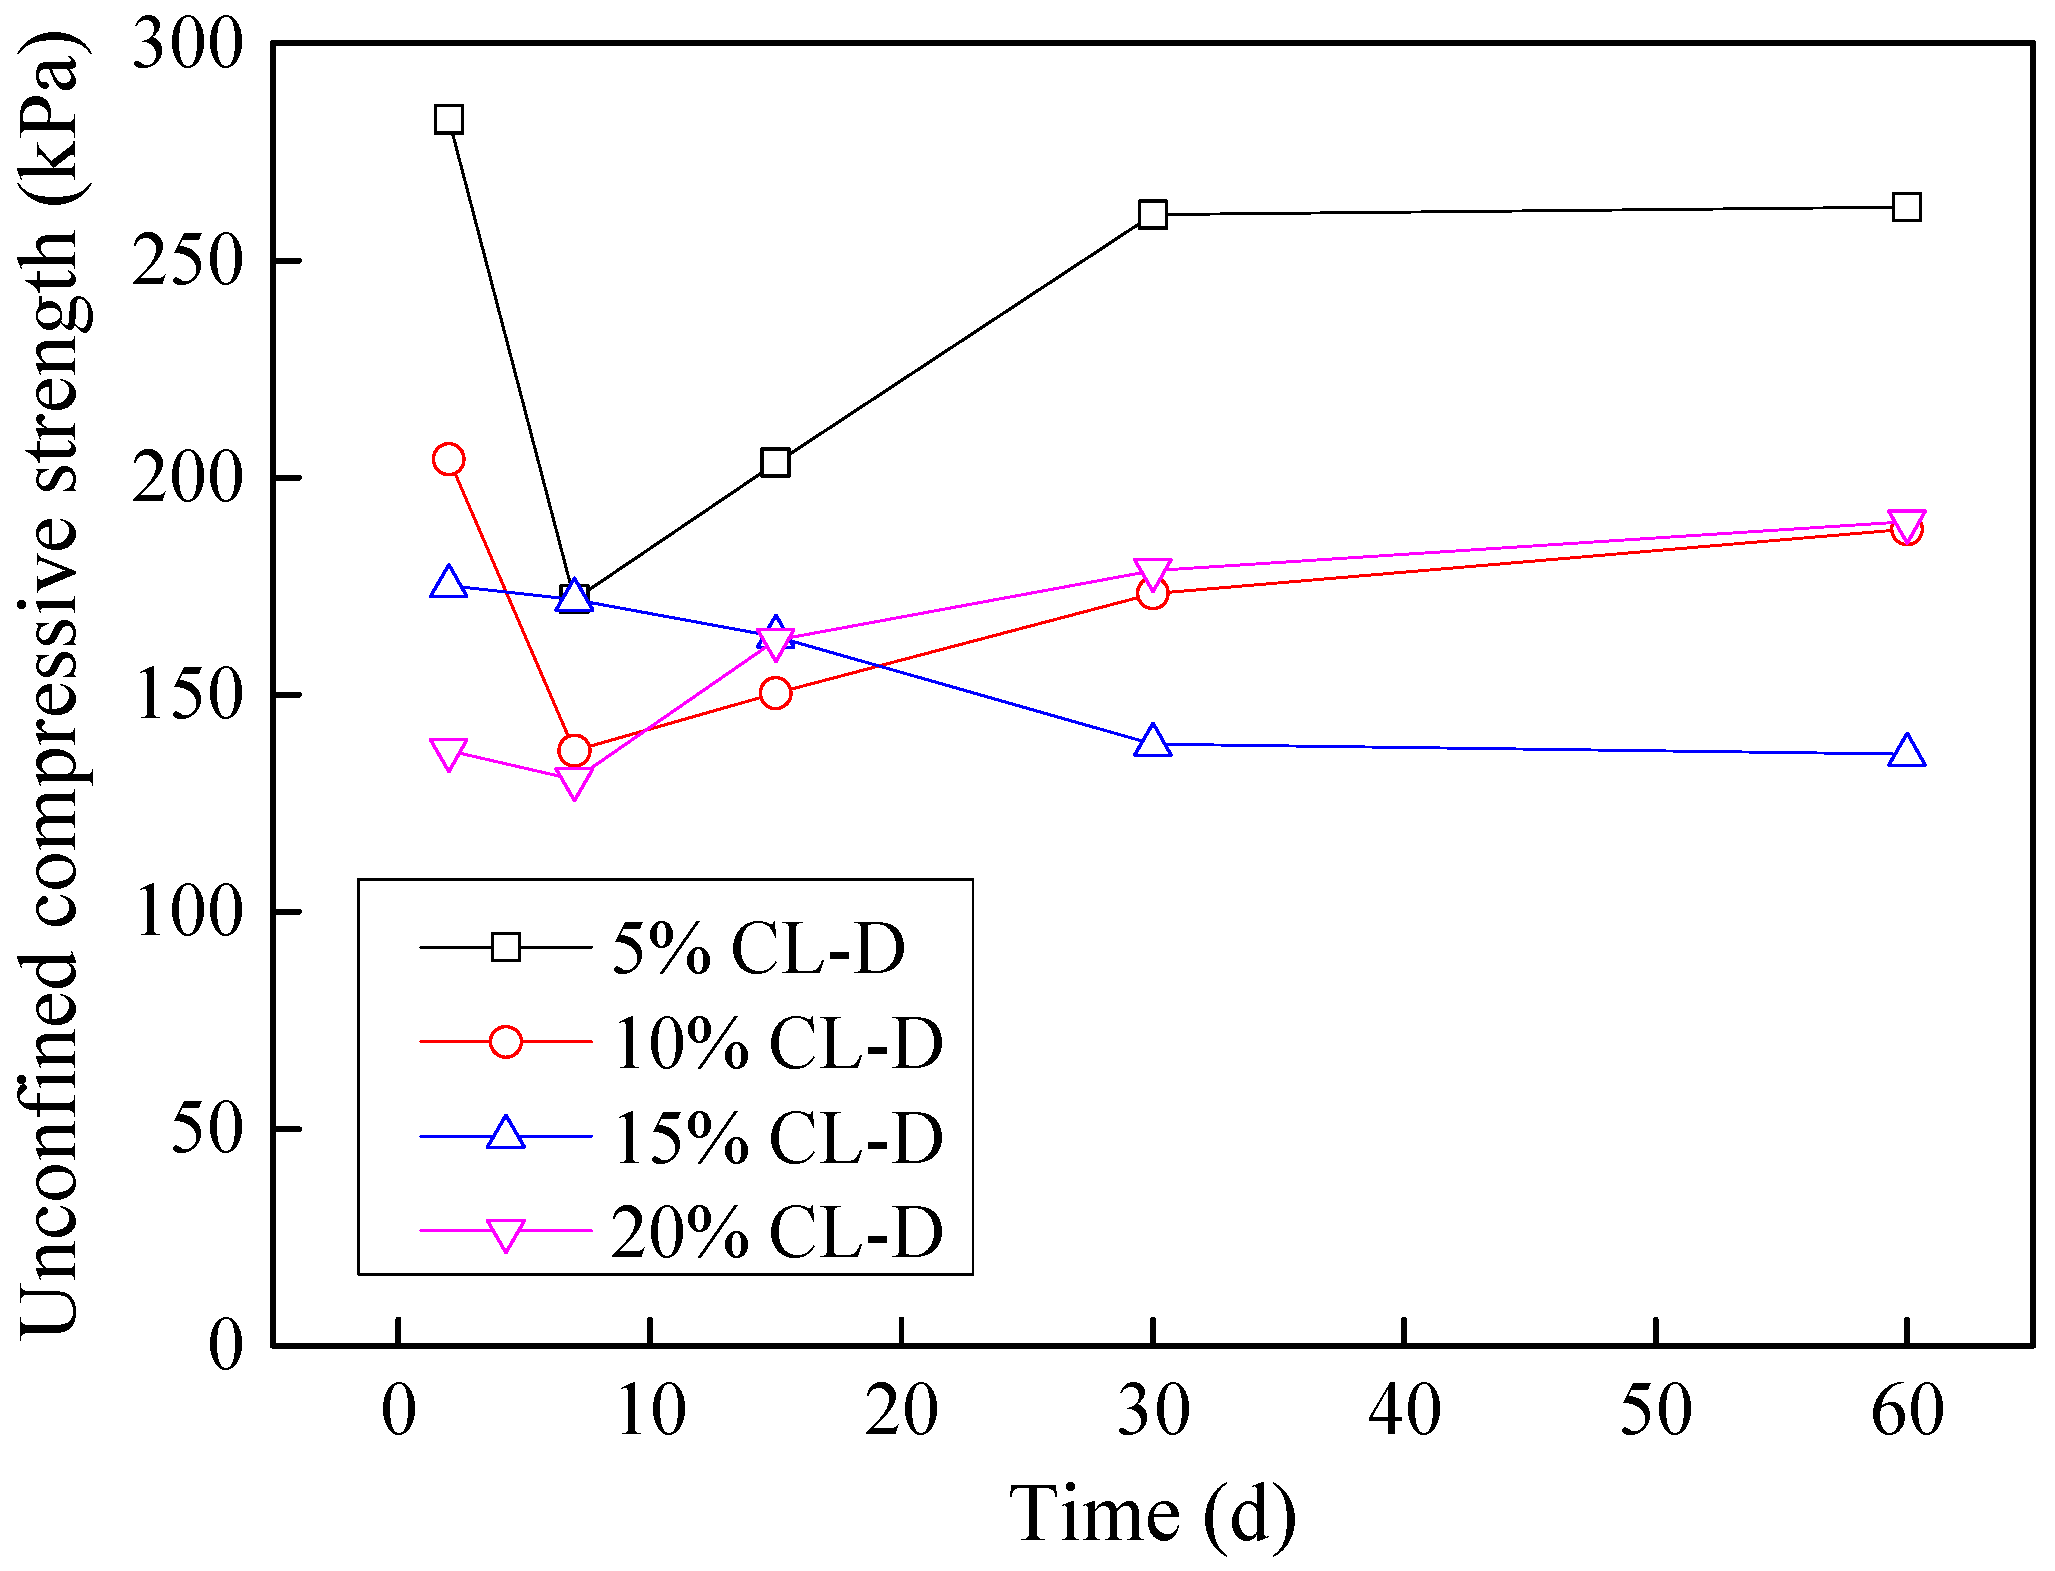
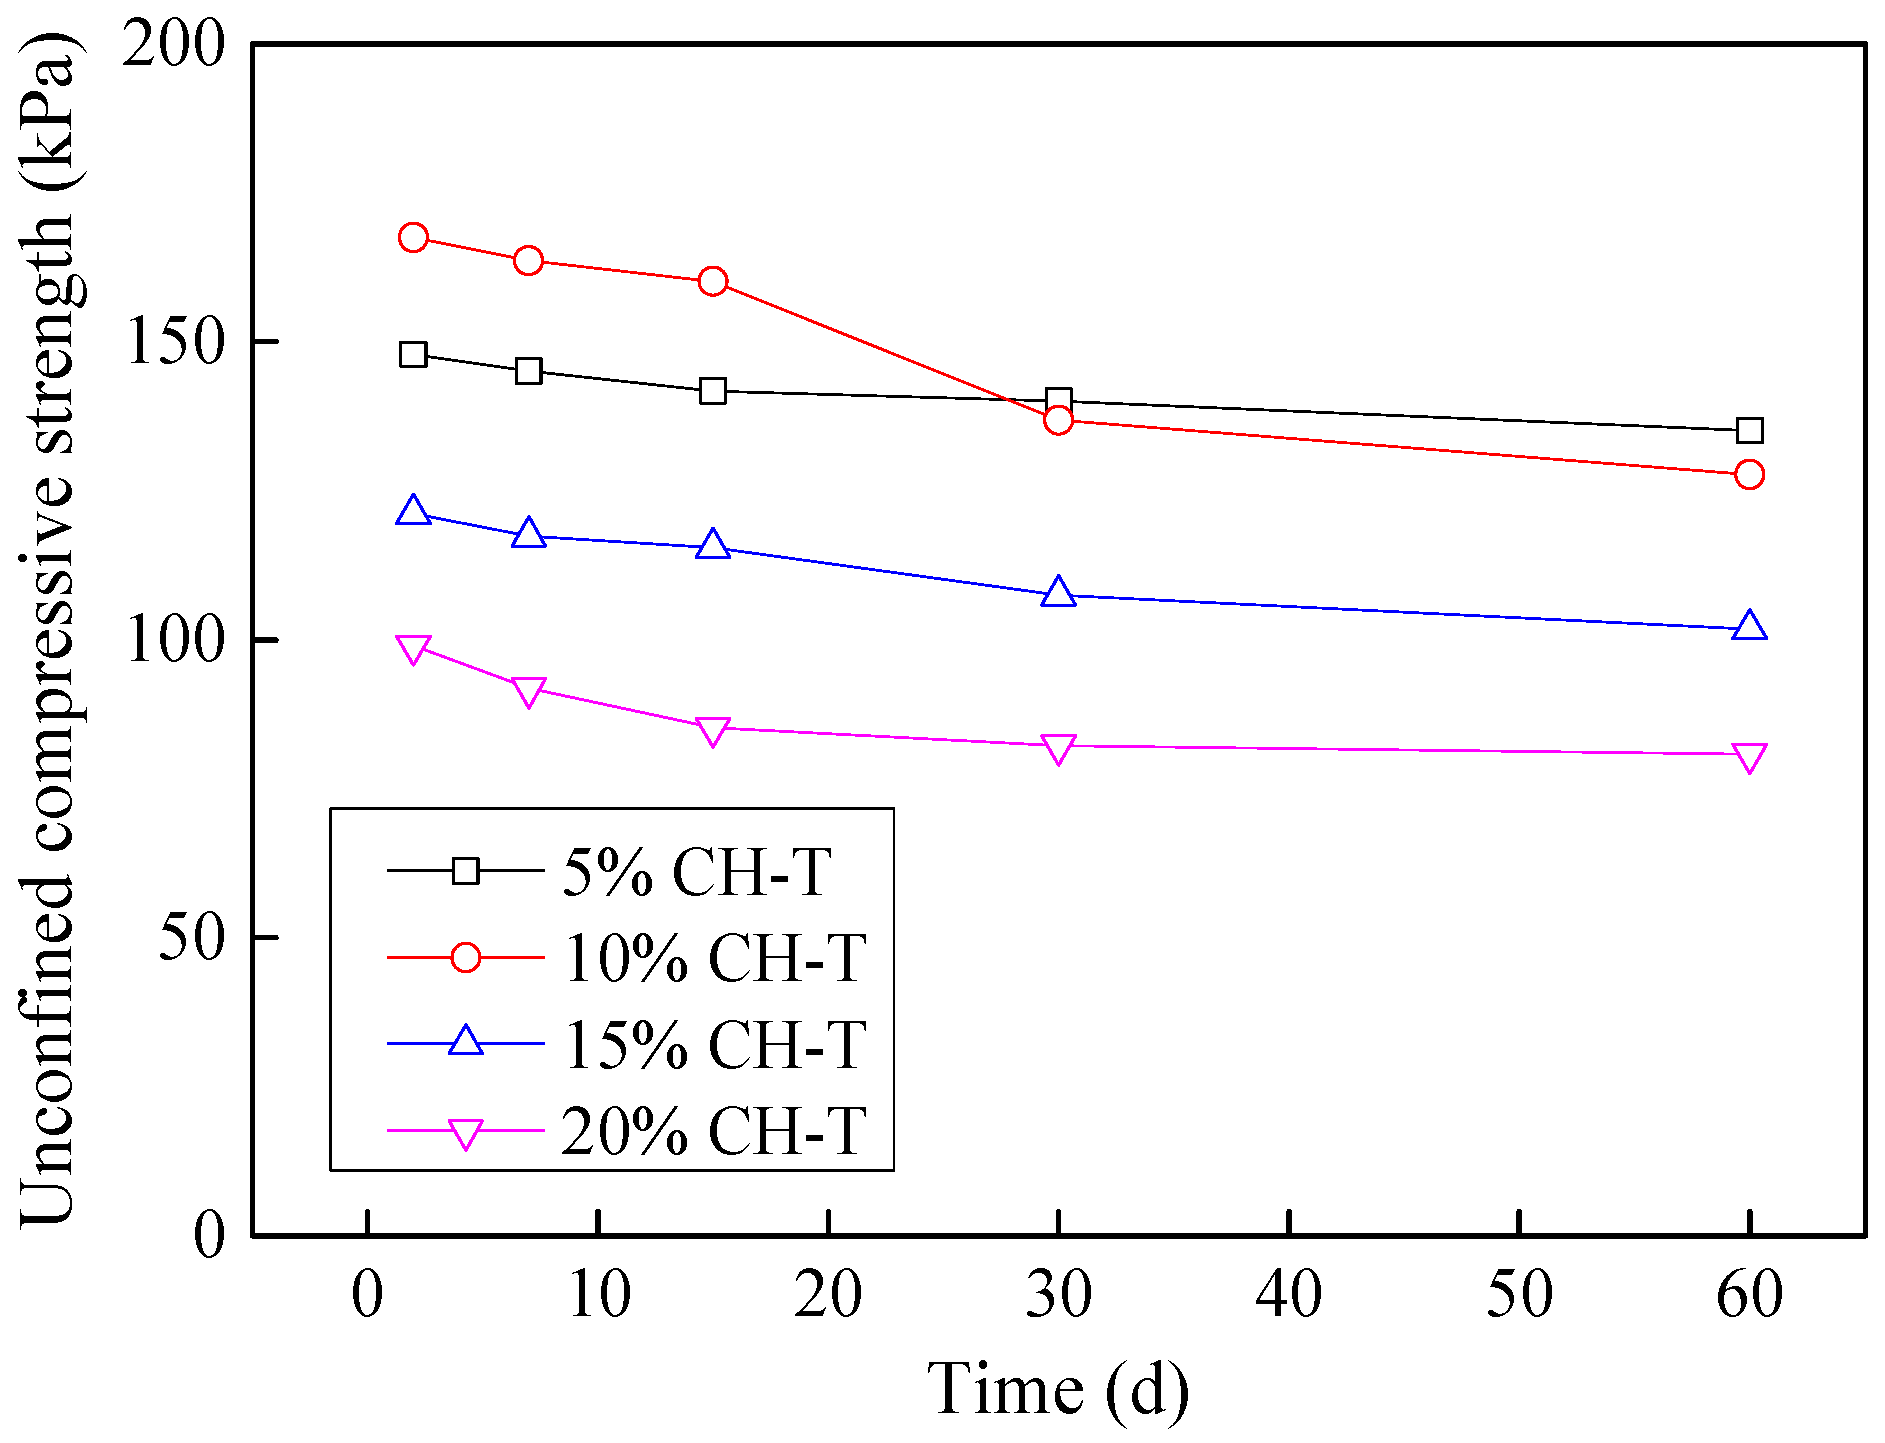
3.8. Time-Dependent Variation of Unconfined Compressive

3.8.1. Effects of Acidic Effluent

In order to study the time dependent effects of leachate contamination on cohesive soils, specimens prepared at different contamination percentage were preserved in controlled environment for up to 60 days. The results of unconfined compression tests performed on CL soil samples contaminated with dyeing effluent are shown in Figure 14.
The unconfined compressive strength for 15% CL-dyeing constantly decreased from 2 days to 2 months, while the unconfined compressive strength for the other samples began to increase after 7 days. However, the final strength after 60 days was still less than the unconfined compressive strength of the original (i.e., virgin) soil samples, suggesting that effluent effects diminished after a certain period after which the soil began to regain its strength. As such, dyeing effluent appears to have a temporary effect on CL soil.
The effects of dyeing effluent on unconfined compressive strength of CH soil are shown in Figure 15. The observed behavior is quite similar to the one observed for CL soils, i.e., temporary loss but regaining strength after around 15 days.

3.8.2. Effects of the Basic Effluent

The time-dependent variation of unconfined strength of CL soil samples with addition of tannery effluent is depicted in Figure 16. The unconfined compressive strength for all samples decreased constantly with time. The rate of decrease however, slowed down gradually and strength became nearly constant after 60 days.
The effect of tannery effluent on undrained strength of CH soil samples is similar, but less pronounced compared to CL soils. The summary of time dependent behavior of CH soil contaminated with tannery effluent is shown in Figure 17.

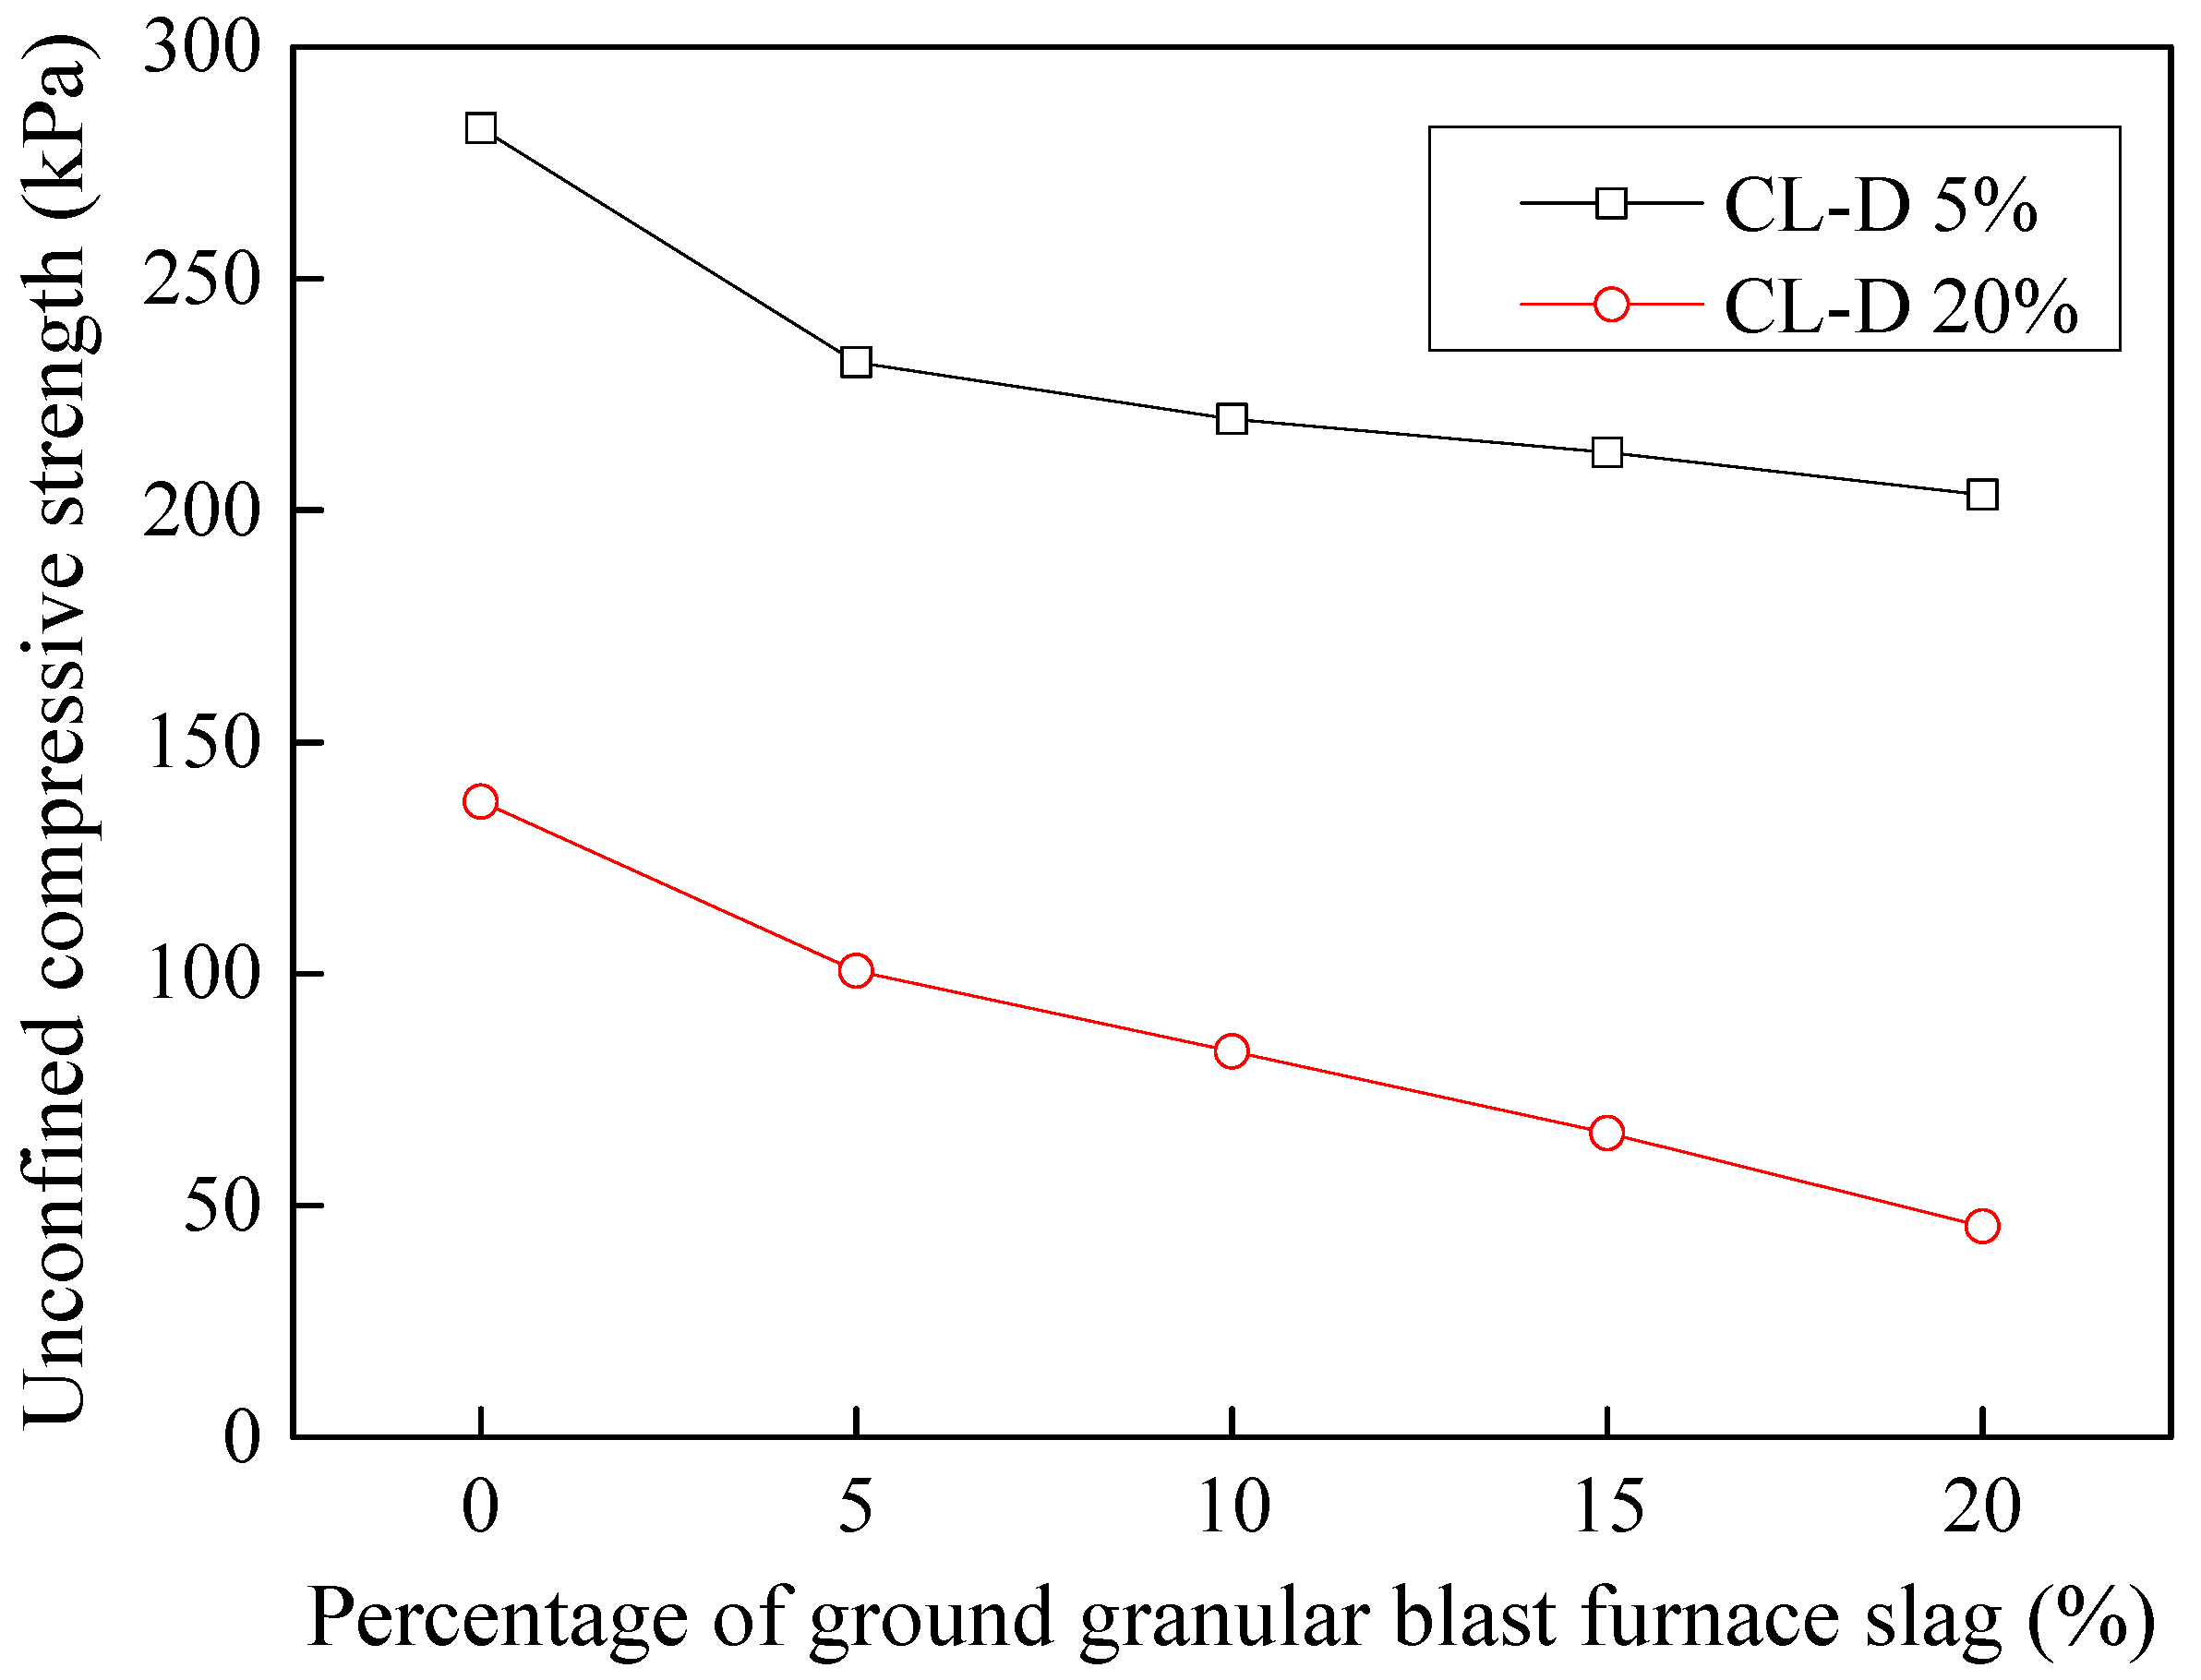
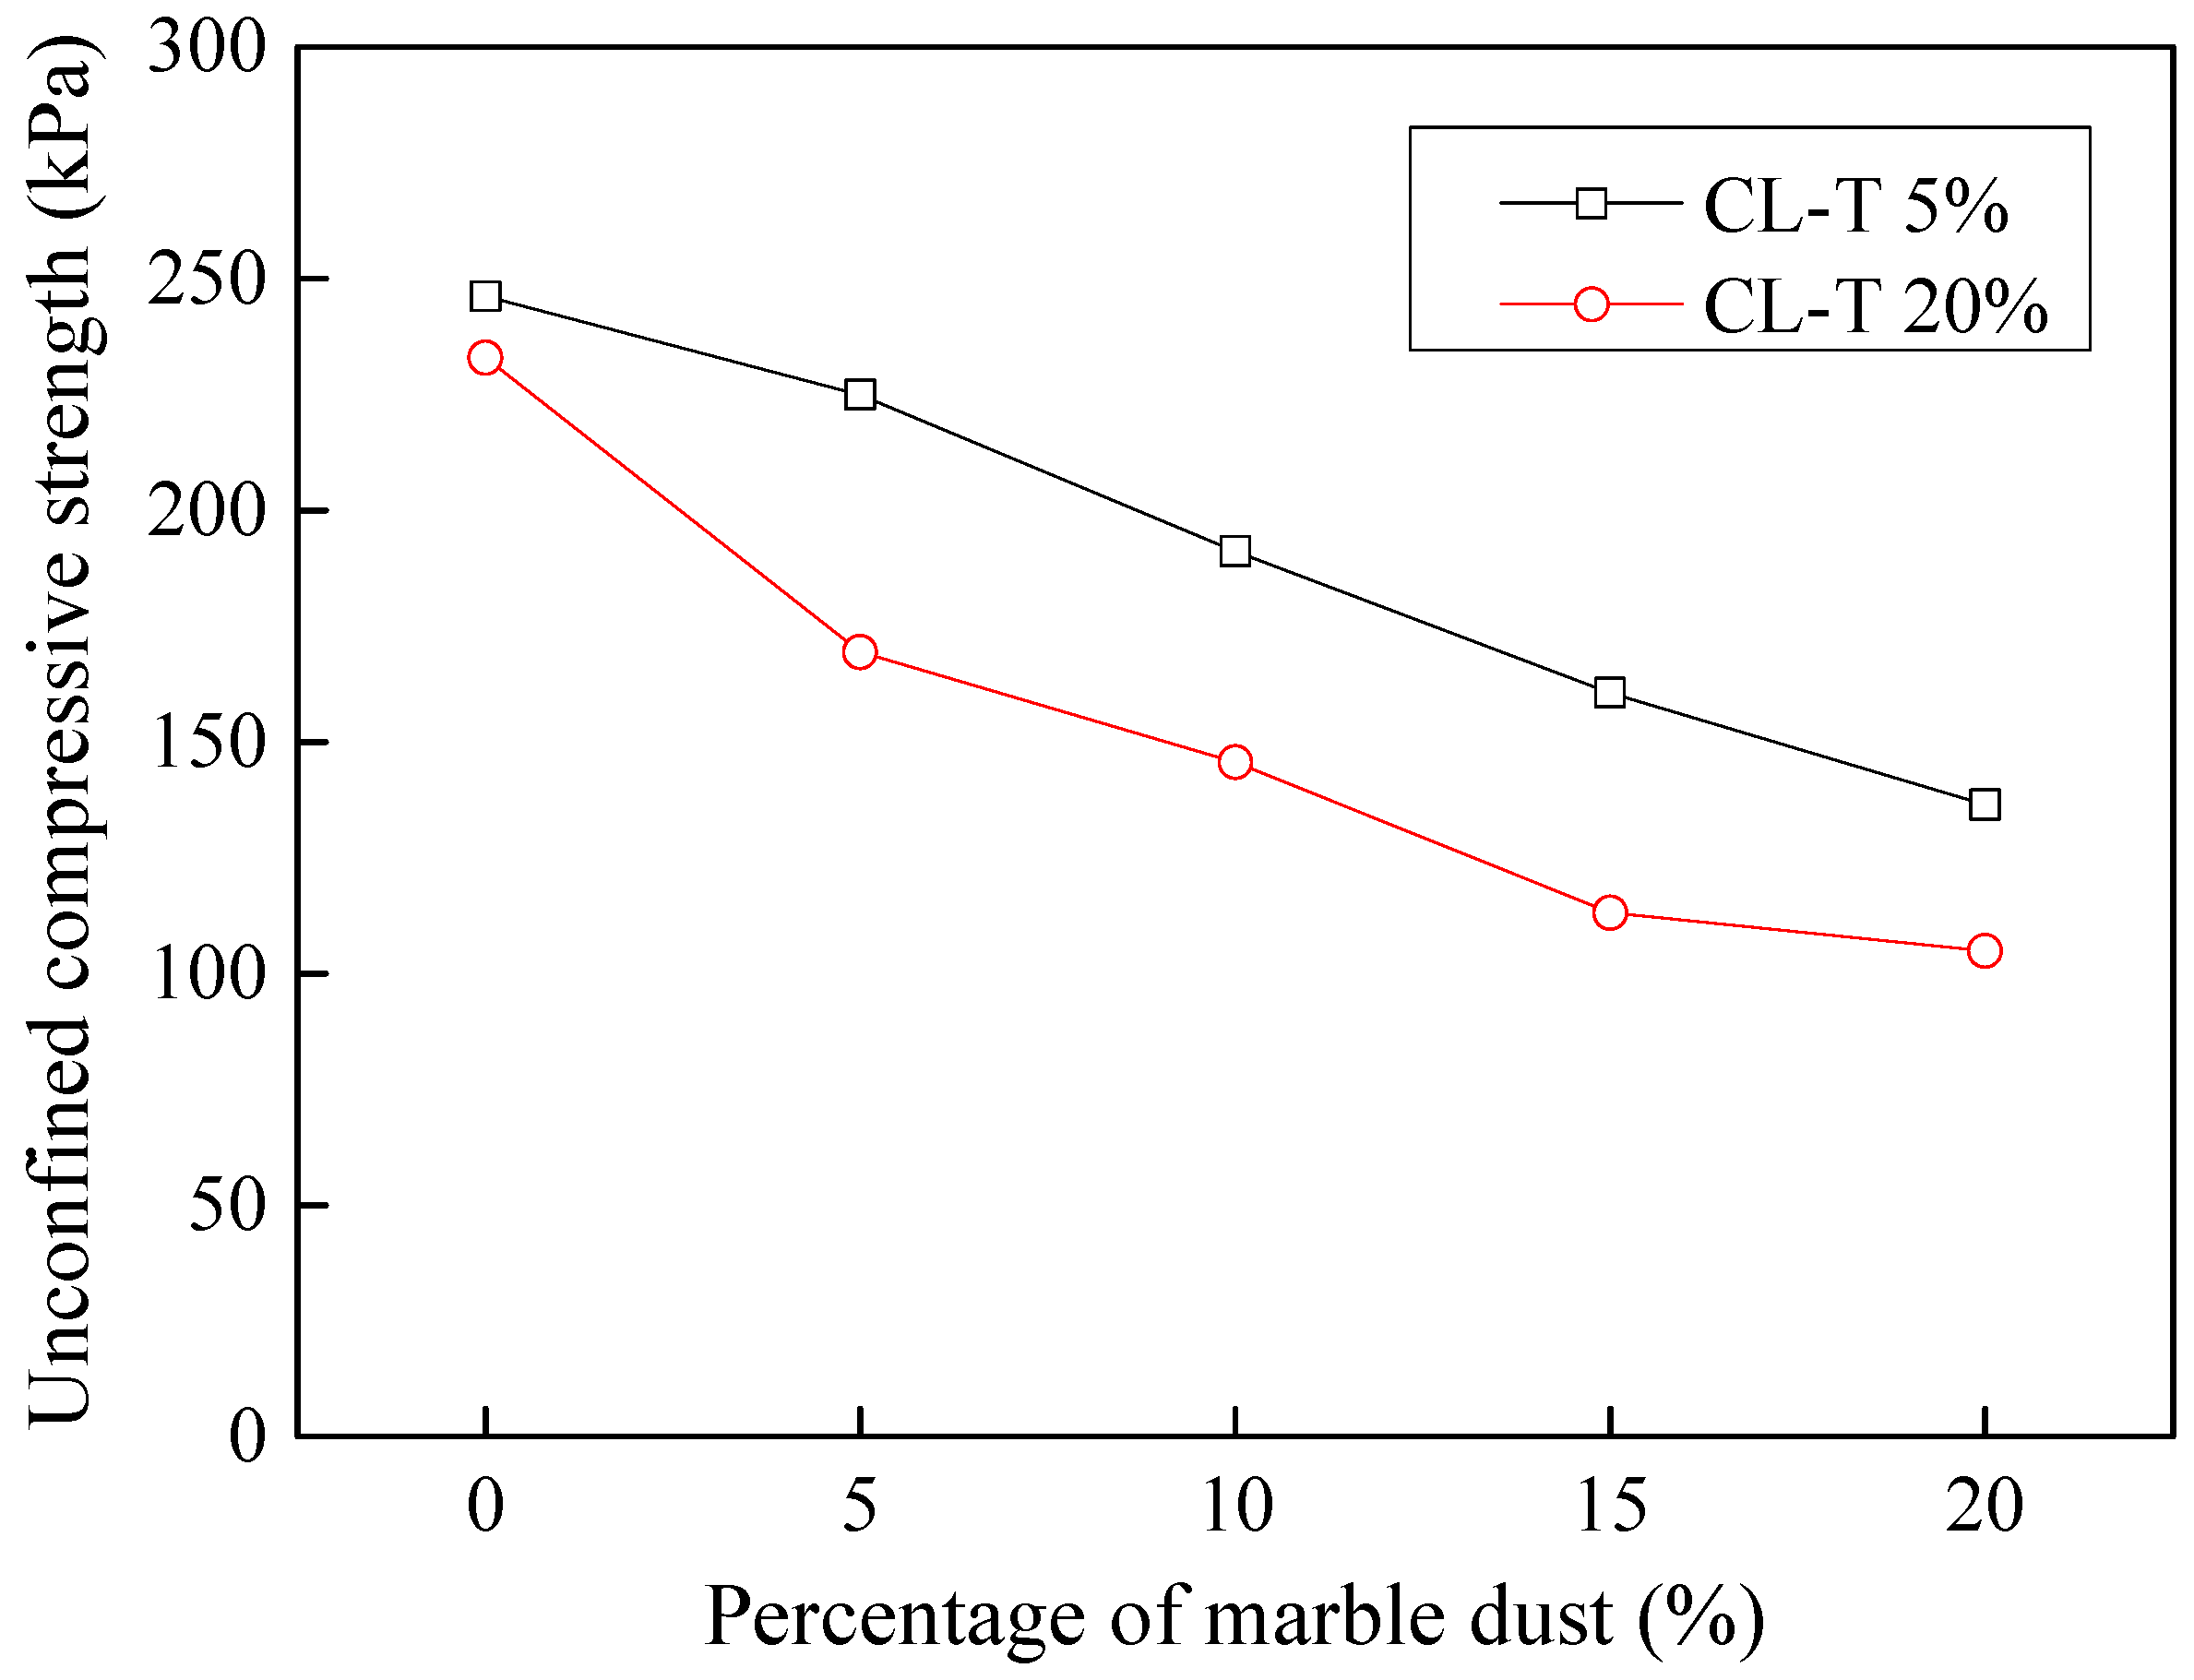
3.9. Effect of Industrial by-Products on Leachate Contaminated Soils

Improvement of weak soil by using various industrial by-products is a well-established practice worldwide. Several studies have successfully shown the significance of using different industrial by-products like marble dust [22,23], glass dust, blast furnace slag [24,25], rice husk ash [26], sugar cane waste, fly ash [27,28], coal ash [29], xanthan gum [30], etc., for soil improvement. As phase-2 of this research, the possibility of stabilization of leachate contaminated cohesive soils (CL-dyeing, CL-tannery, CH-dyeing and CH-tannery) using marble dust and ground granulated blast furnace slag (GGBFS) was explored. Soil specimens (CL and CH) having 5% and 20% effluent contamination were mixed with varying percentages of marble dust as well as GGBFS and their effect on unconfined compressive strength was explored. The main objective was to access possible enhancement in undrained strength of contaminated soils, as is the case with soils having no such contamination.

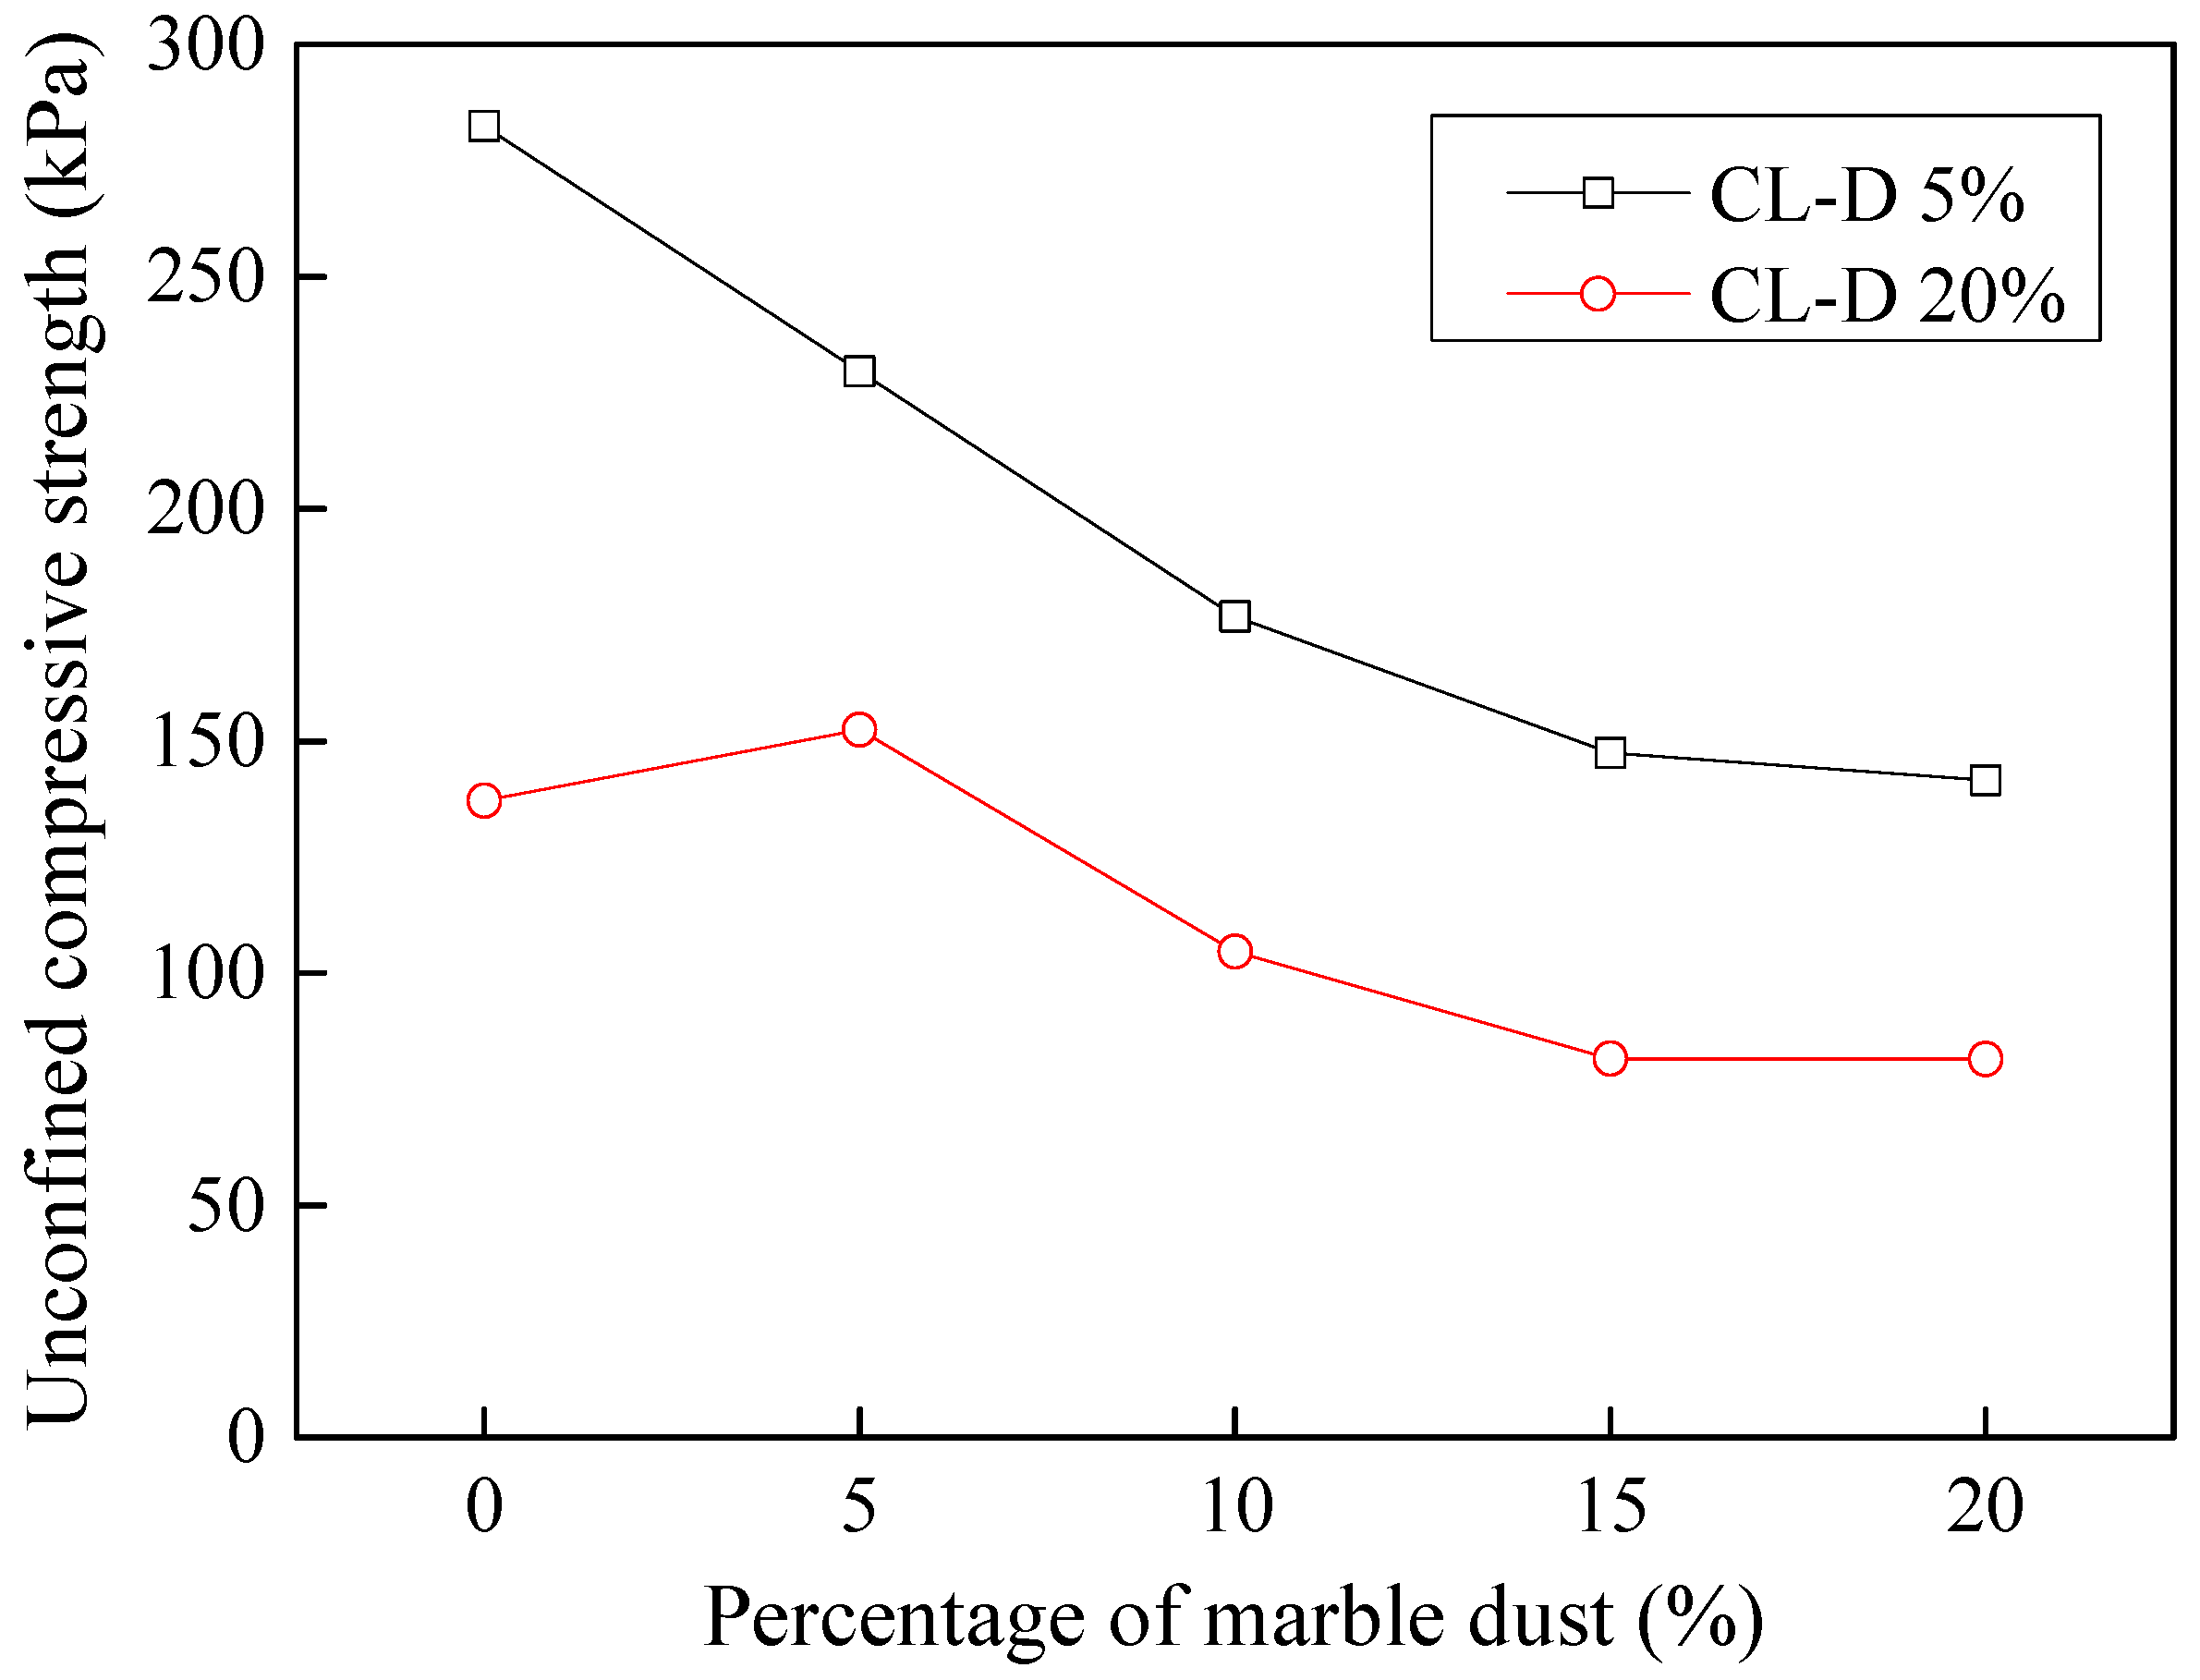
3.9.1. Stabilization of Acid-Affected CL Soil

Figure 18 illustrates the trends observed when different percentages of marble dust were added to the acid-affected CL soil. An increase in marble dust concentration caused a rapid decline in unconfined compressive strength from 282.42 kPa to 141.55 kPa at 5% acidic contamination. At 20% acidic contamination, unconfined compressive strength decreased from 137.14 kPa to 81.49 kPa when marble concentration reached 20%. A possible reason for this trend is that CaO, a primary and basic component of marble dust, reacted with the acidic part of the effluent present in the soil. This would have produced salts that were responsible for the rapid decrease in unconfined compressive strength. Although it is a renowned soil stabilizer, marble dust was unable to improve soil strength to match that of the original soil “i.e., 328.9 kPa”.
Figure 19 shows the trends observed when different percentages of GGBFS were added to the basic-affected CL soil. With an increase in GGBFS, unconfined compressive strength decreased rapidly from 282.42 kPa to 203.33 kPa at 5% acidic contamination. At 20% acidic contamination, it decreased from 137.14 kPa to 45.51 kPa when GGBFS concentration reached 20%.
GGBFS has a pH that varies between 10 and 12. As such, there may have been a possible reaction between acid from the contaminated soil and the basic compounds present in the GGBFS, which could have produced salts that ultimately resulted in a decrease in unconfined compressive strength. It may therefore be concluded that GGBFS is not an effective stabilizer in acid-contaminated soils.

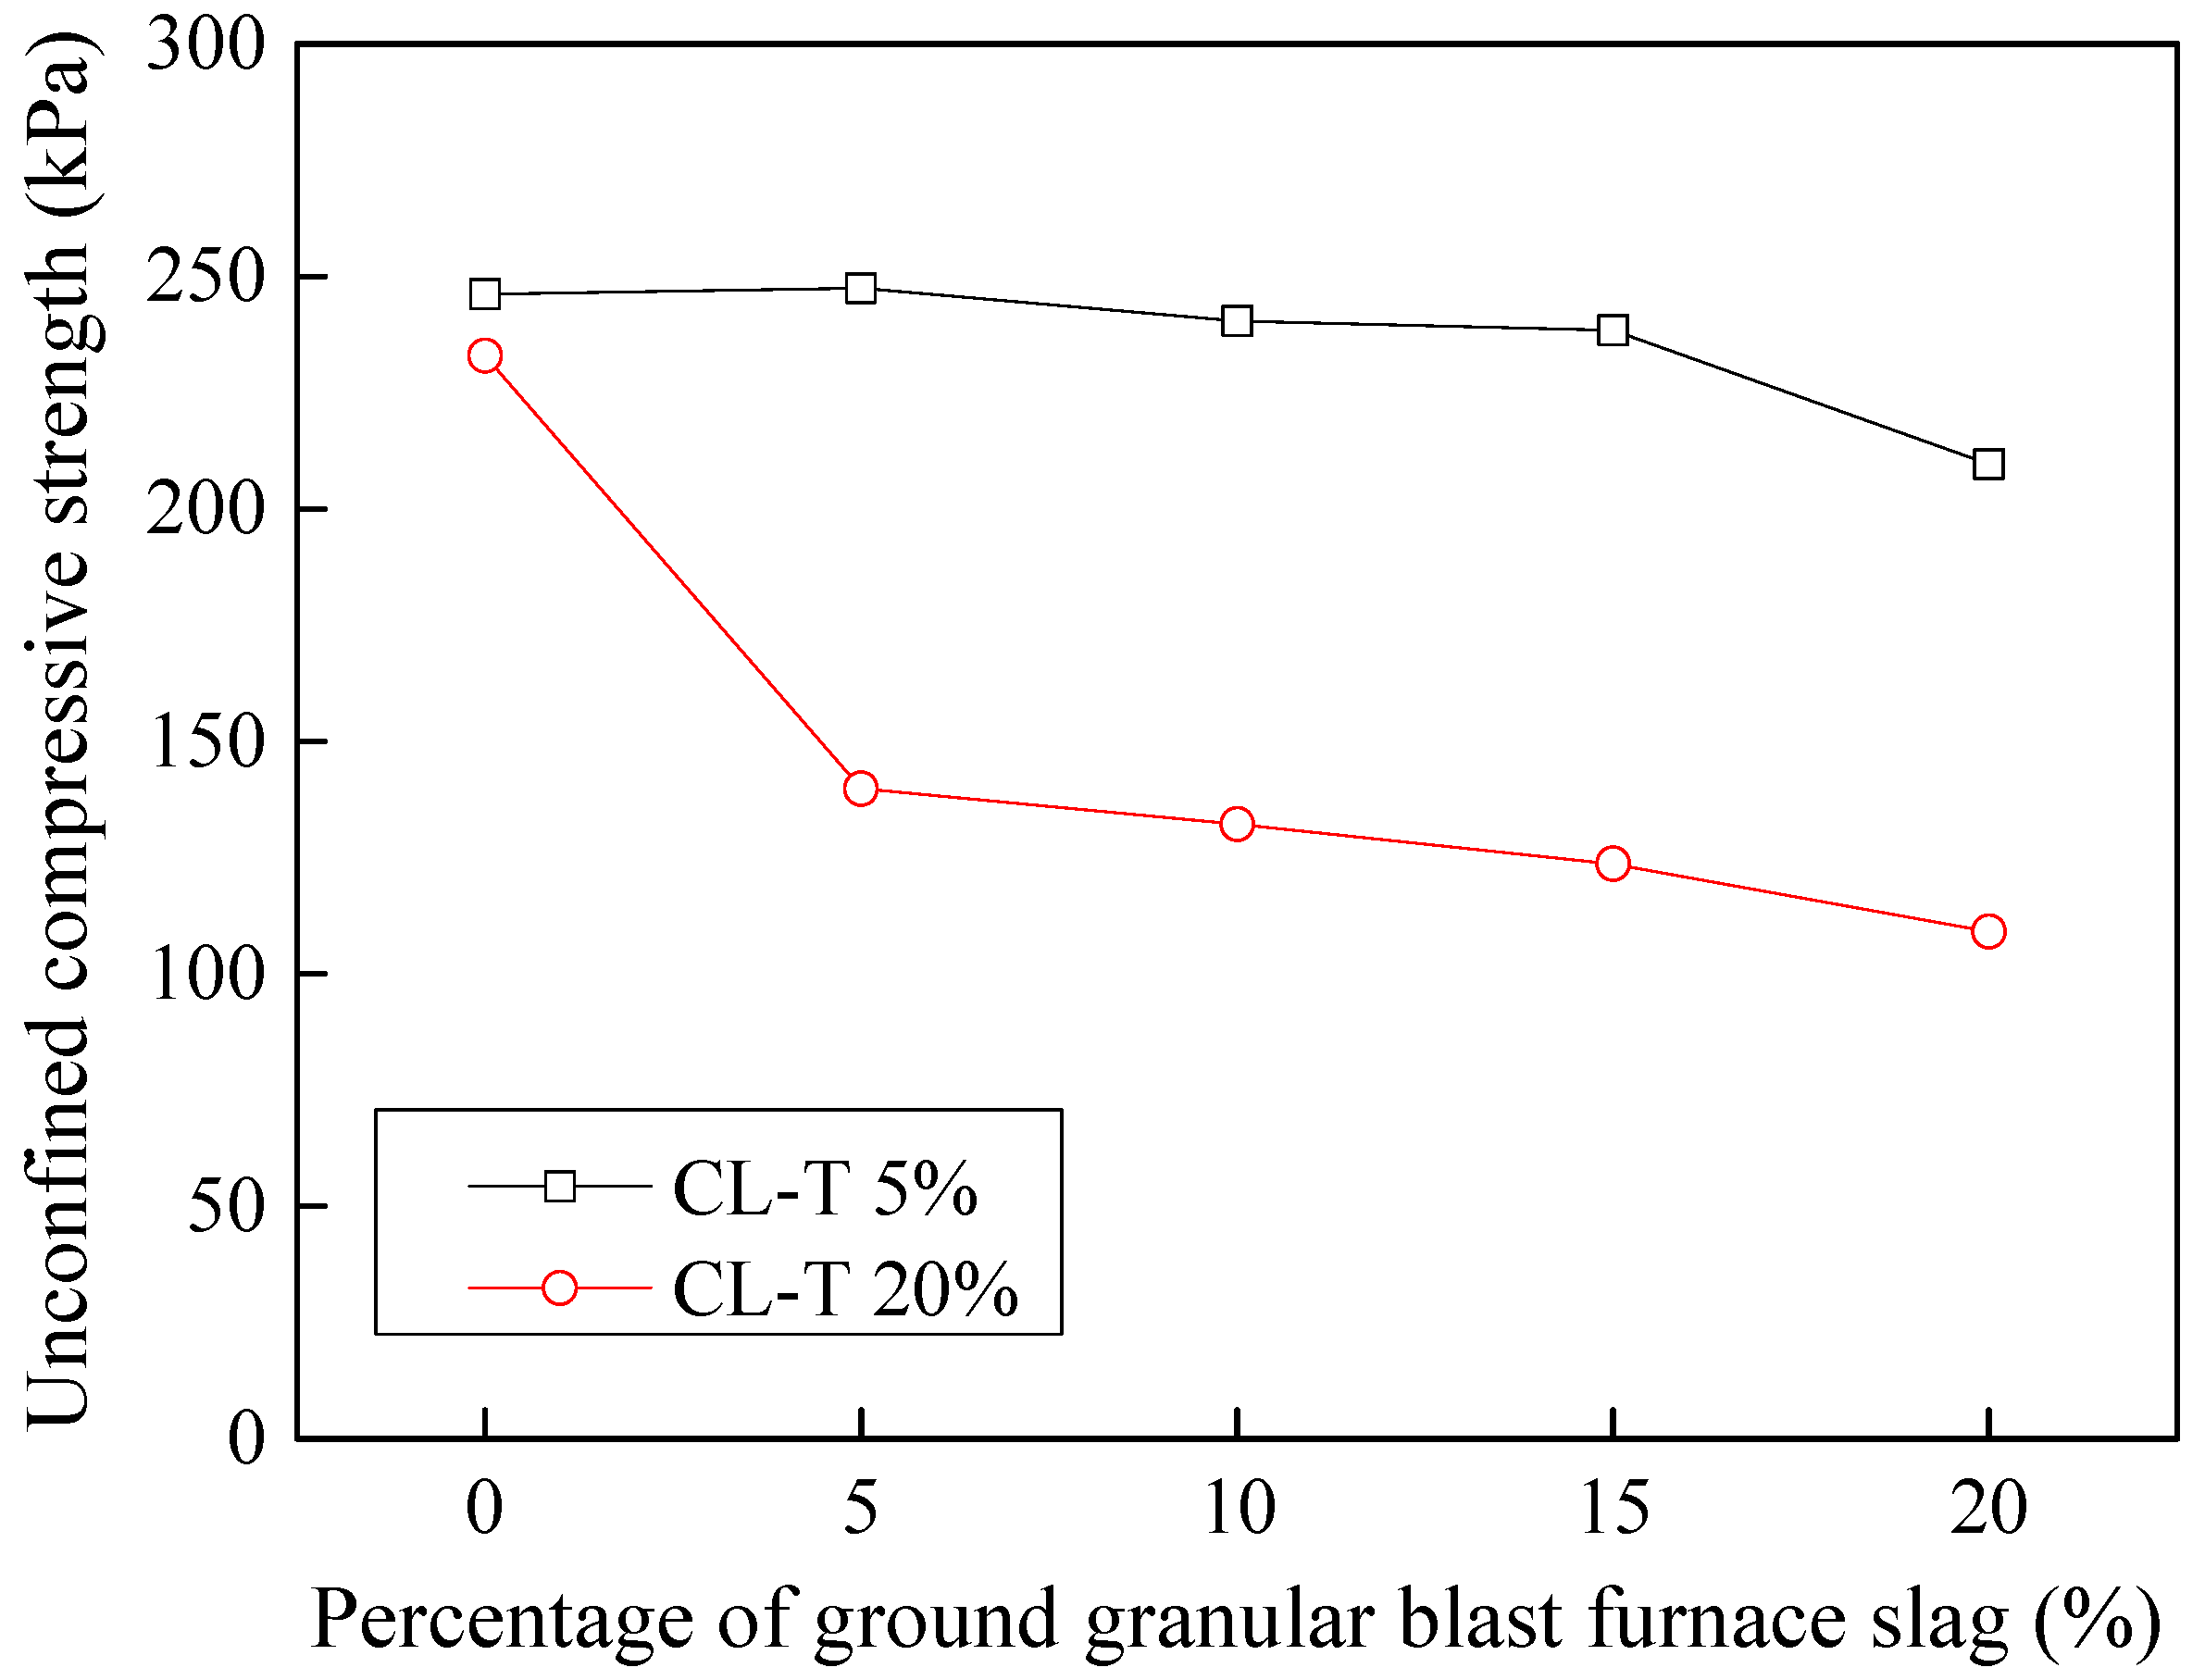
3.9.2. Stabilization of Tannery-Affected CL Soil

Figure 20 indicates trends observed when different percentages of GGBFS were added to the alkali-affected CL soil. With an increase in the blast furnace slag, unconfined compressive strength decreased rapidly from 246.22 kPa to 209.54 kPa at 5% basic contamination. At 20% basic contamination, it decreased from 232.91 kPa to 109.00 kPa when GGBFS concentration reached 20%. GGBFS was unable to increase soil strength to match that of the original soil. Thus, GGBFS appears not to be an effective stabilizer of base-contaminated soils.
Figure 21 shows the trends observed when different percentages of marble dust were added to alkali-affected CL soil. With an increase in GGBFS, unconfined compressive strength decreased rapidly from 246.22 kPa to 136.45 kPa at 5% basic contamination. At 20% basic contamination, it decreased from 232.91 kPa to 104.80 kPa when GGBFS concentration reached 20%.

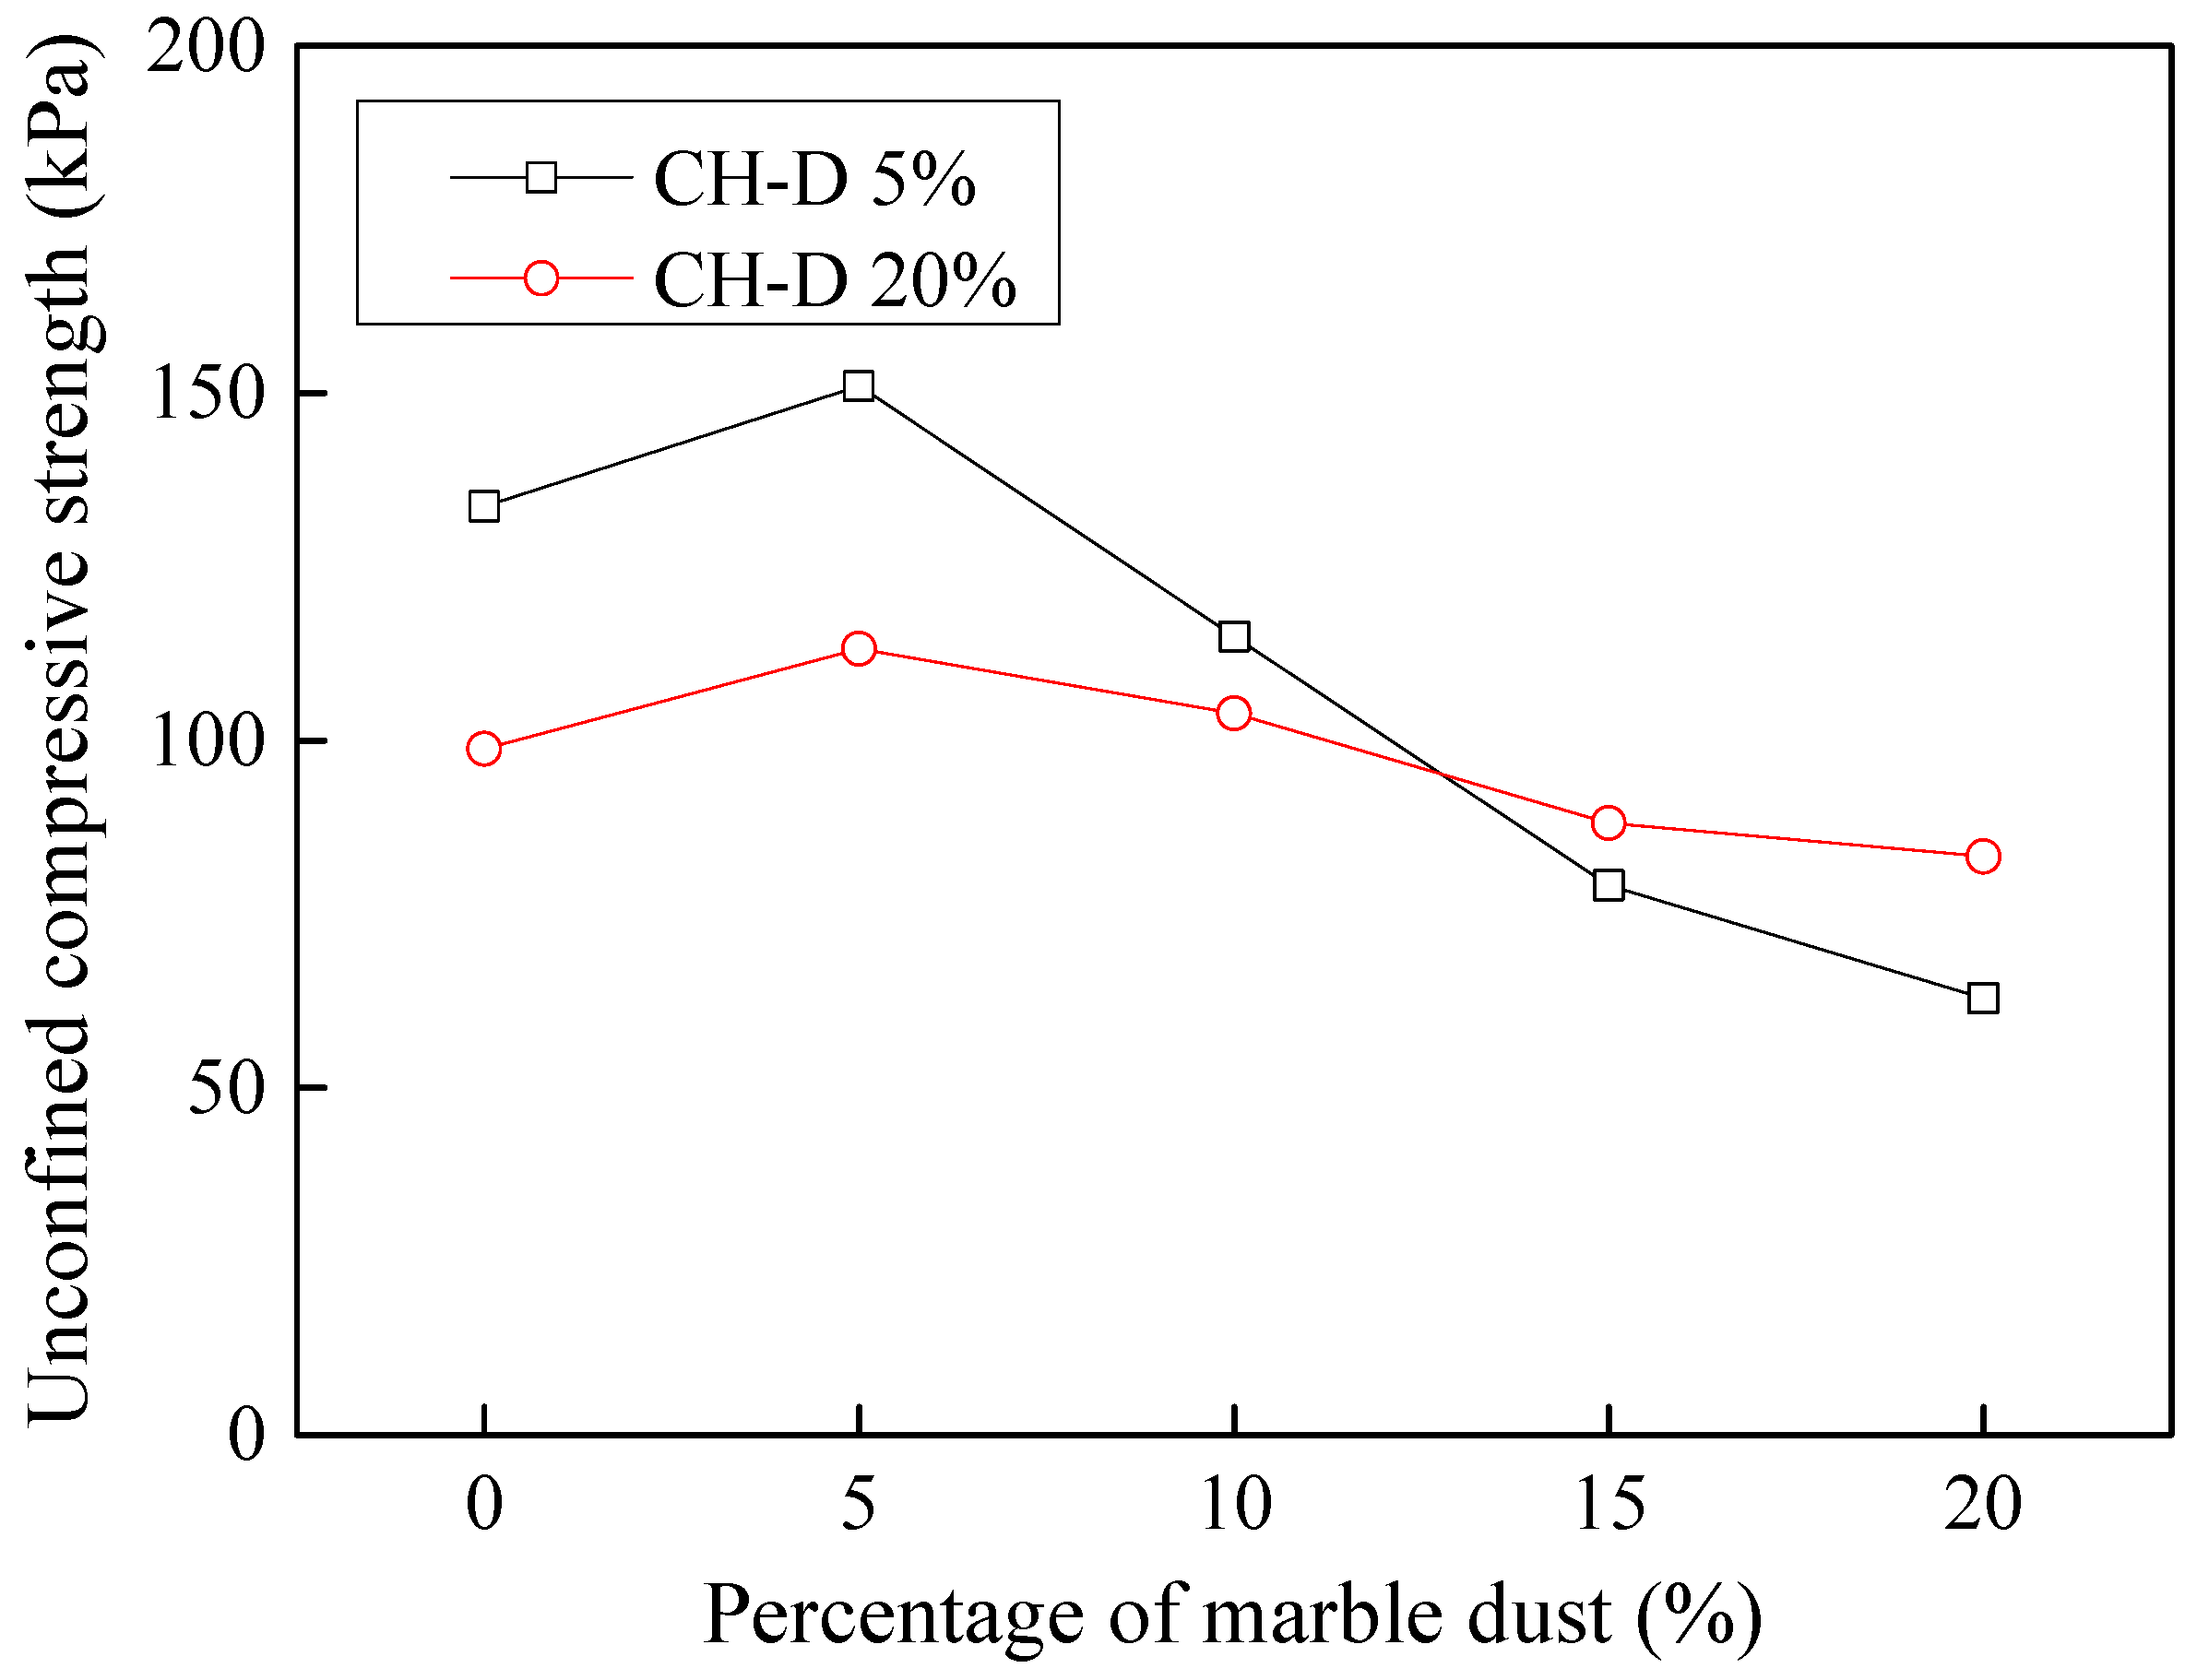
3.9.3. Stabilization of Dyeing-Affected CH Soil

Figure 22 displays the trends observed when different percentages of marble dust were added to acid-affected CH soil. With an increase in marble dust concentration, unconfined compressive strength decreased rapidly from 133.69 kPa to 62.88 kPa at 5% acid contamination. At 20% acid contamination, it decreased from 98.81 kPa to 83.29 kPa when marble dust concentration reached 20%.
Figure 23 shows the trends observed when different percentages of GGBFS were added to acid-affected CH soil. With an increase in GGBFS concentration, unconfined compressive strength decreased rapidly from 133.69 kPa to 76.12 kPa at 5% acid contamination. At 20% acid contamination, it decreased from 98.81 kPa to 83.22 kPa when GGBFS concentration reached 20%.

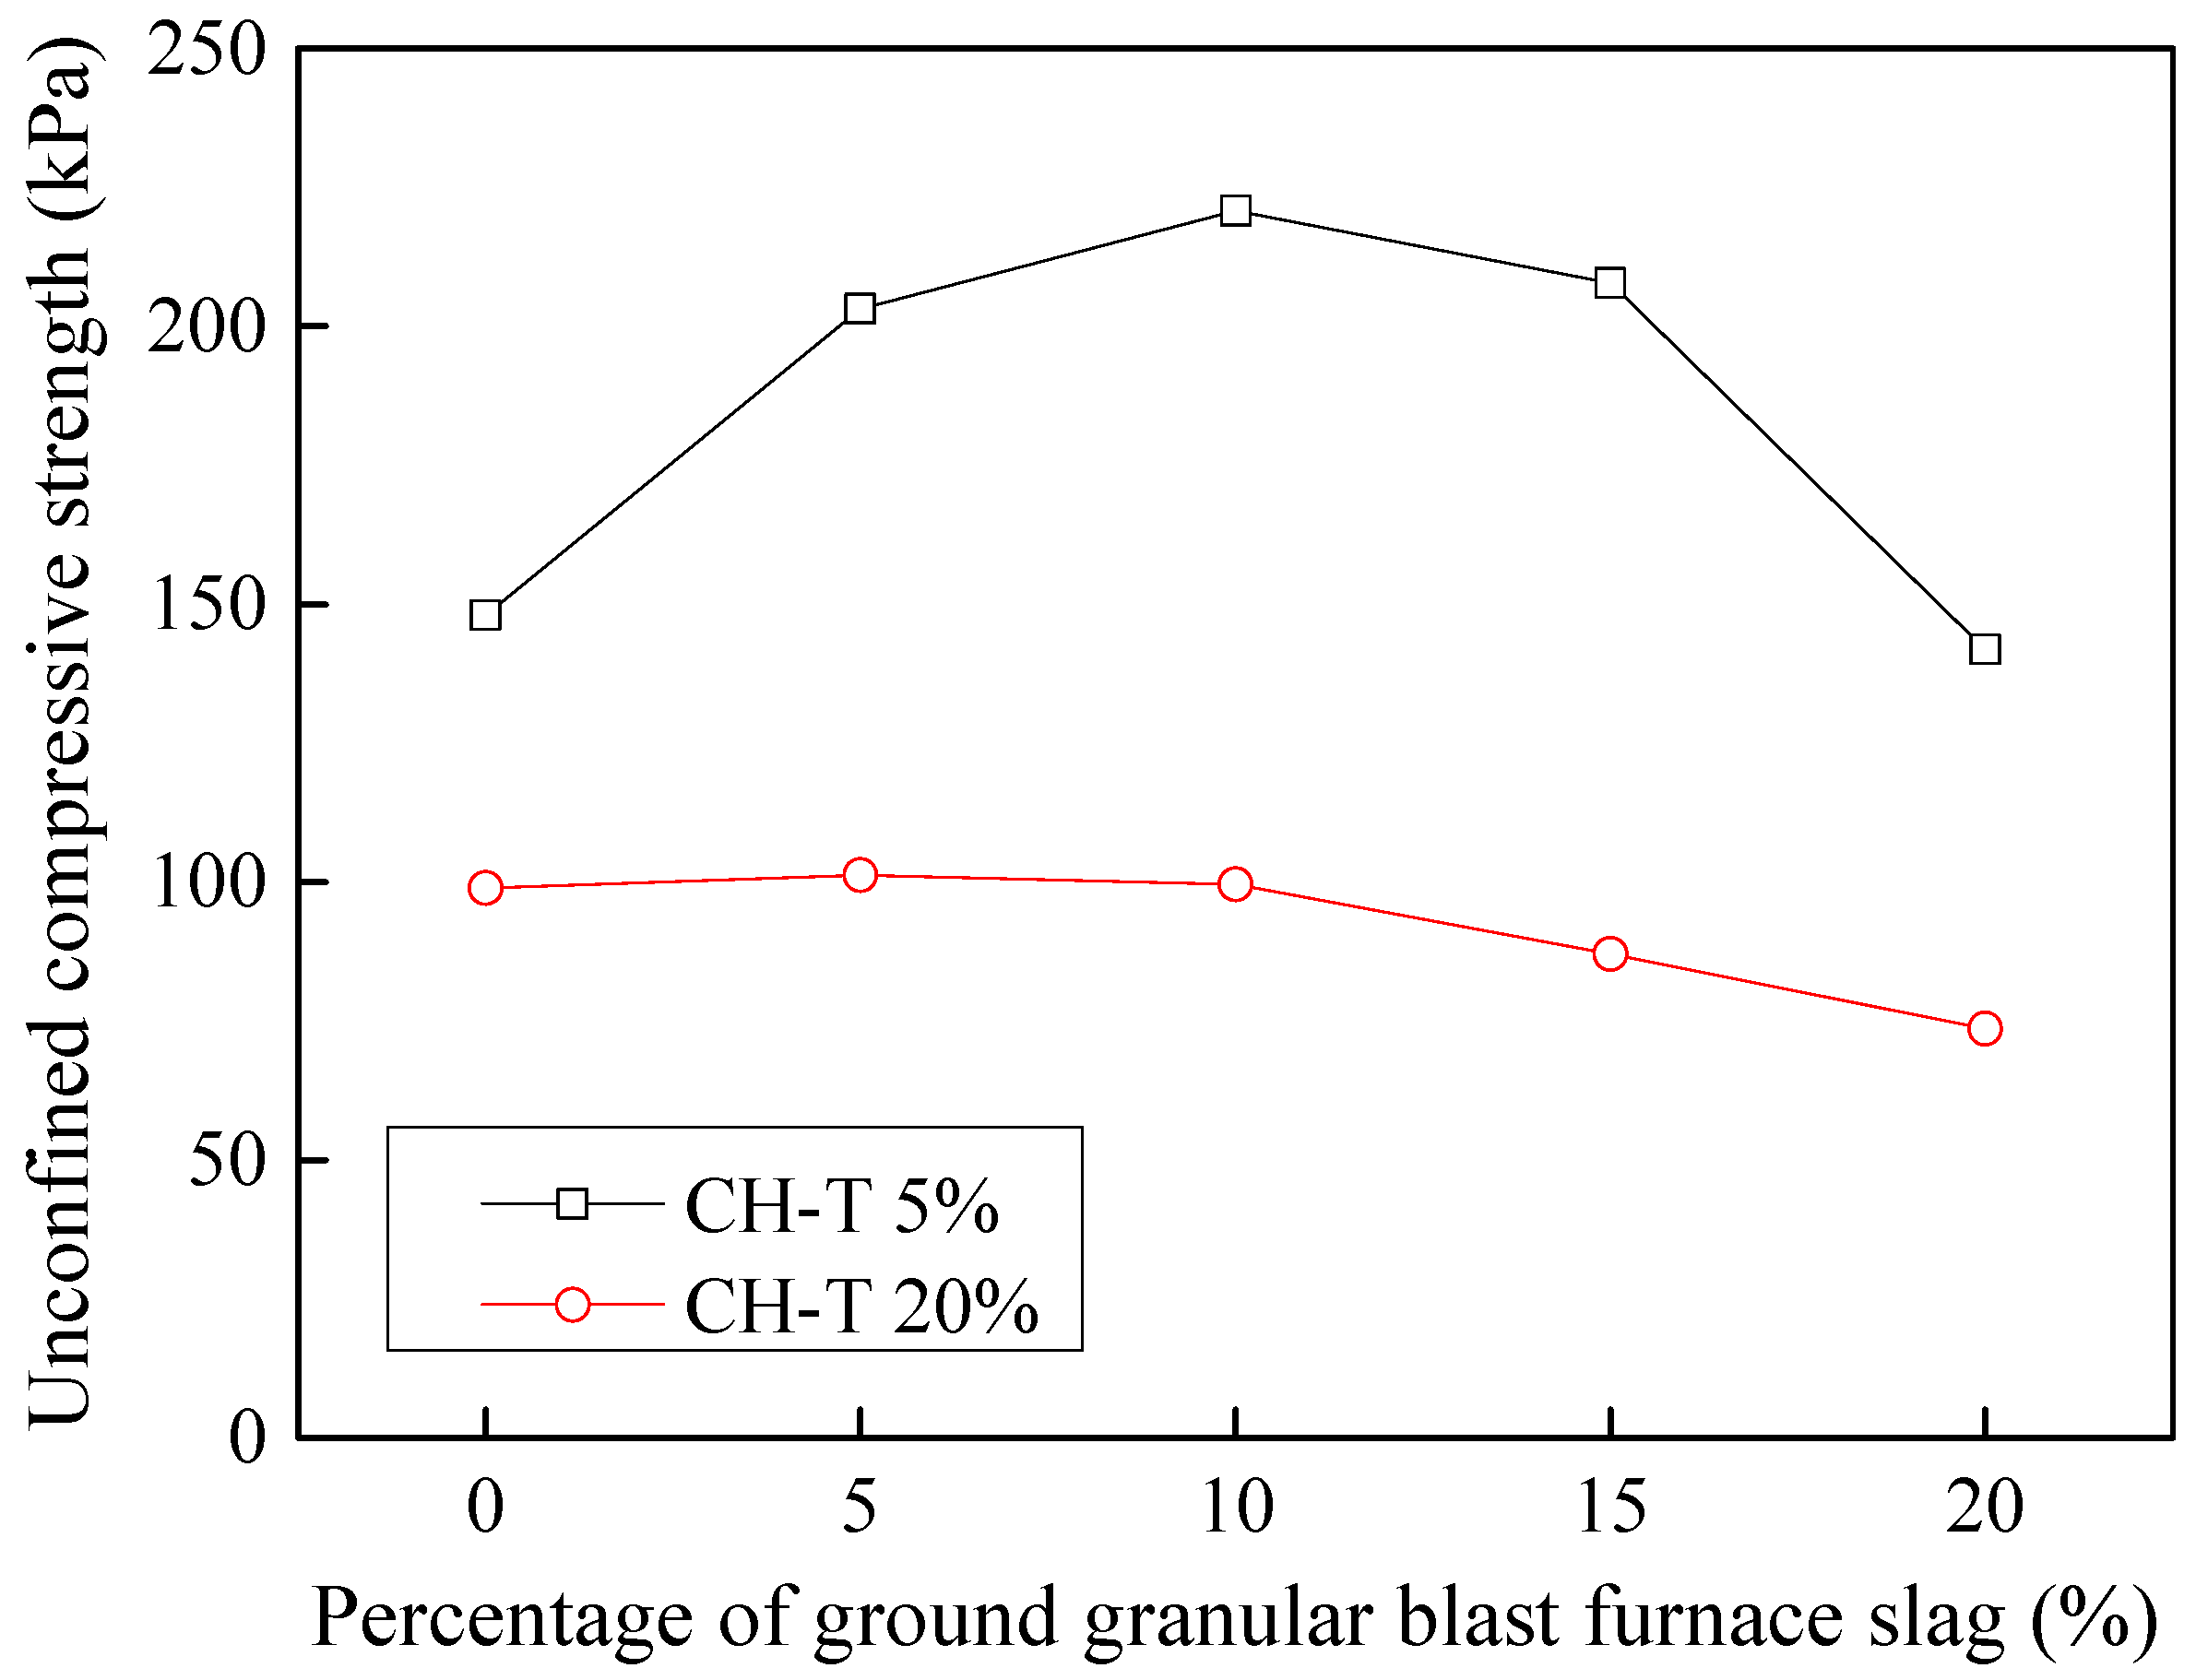
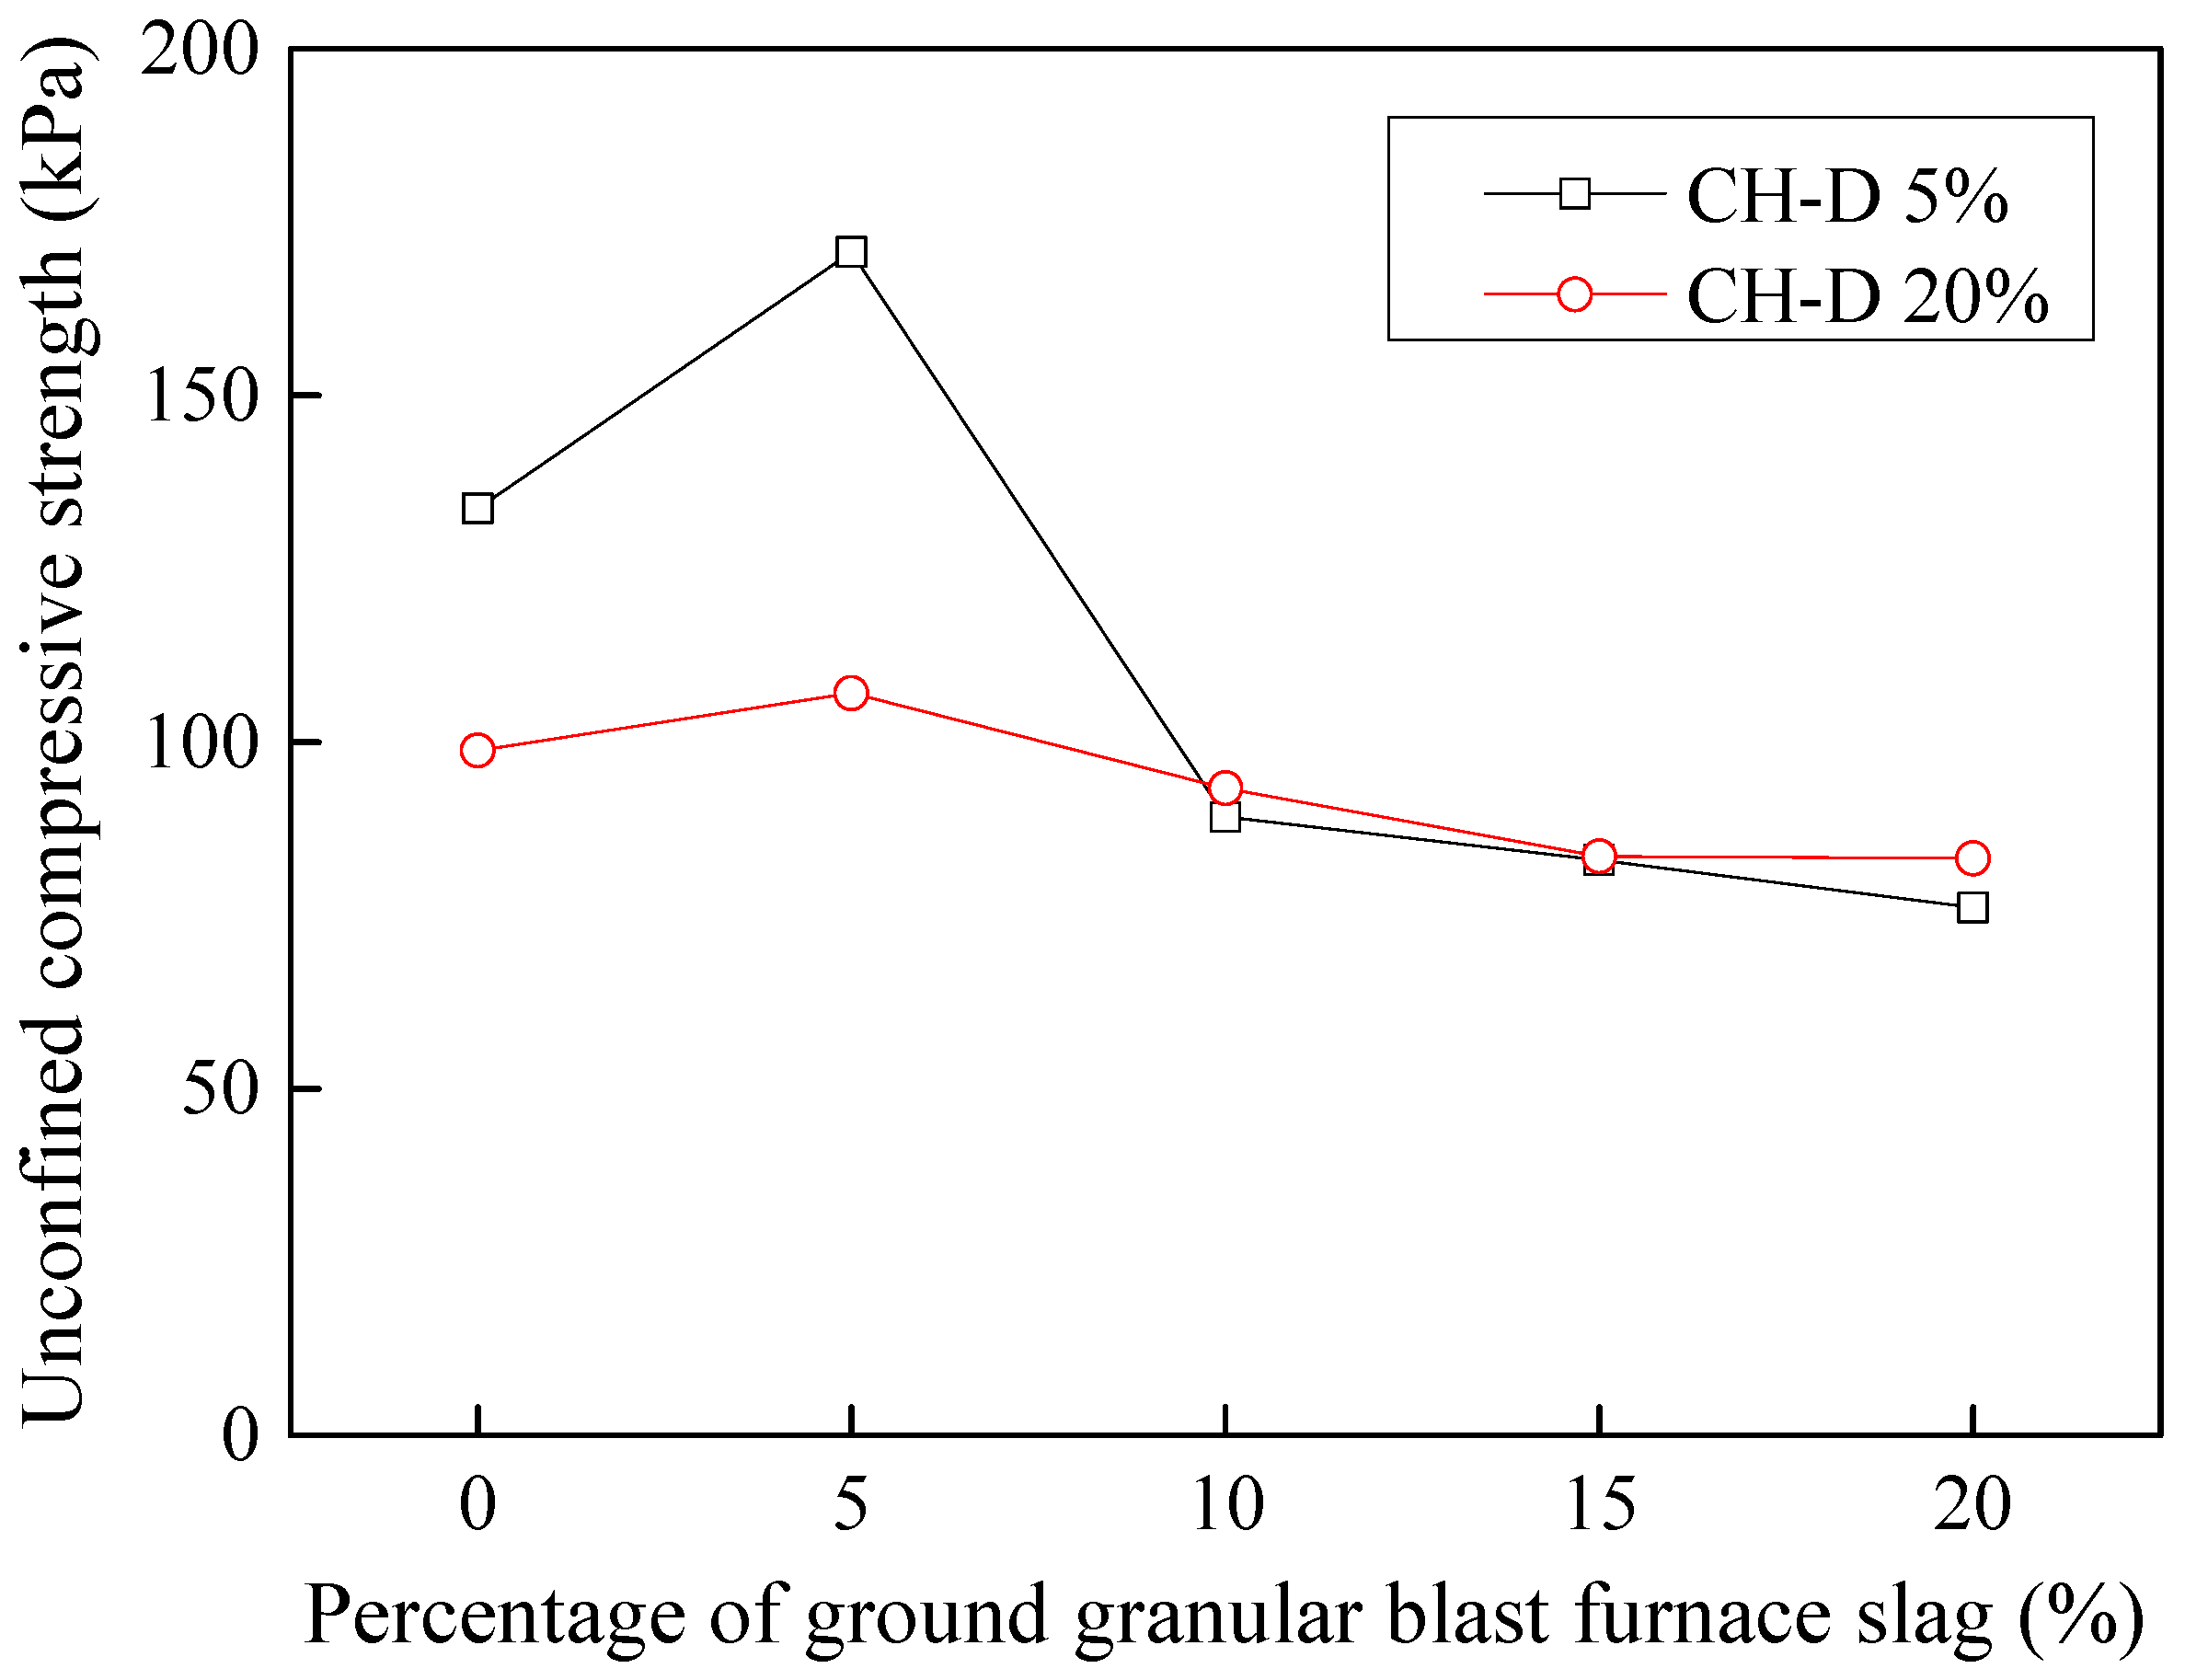
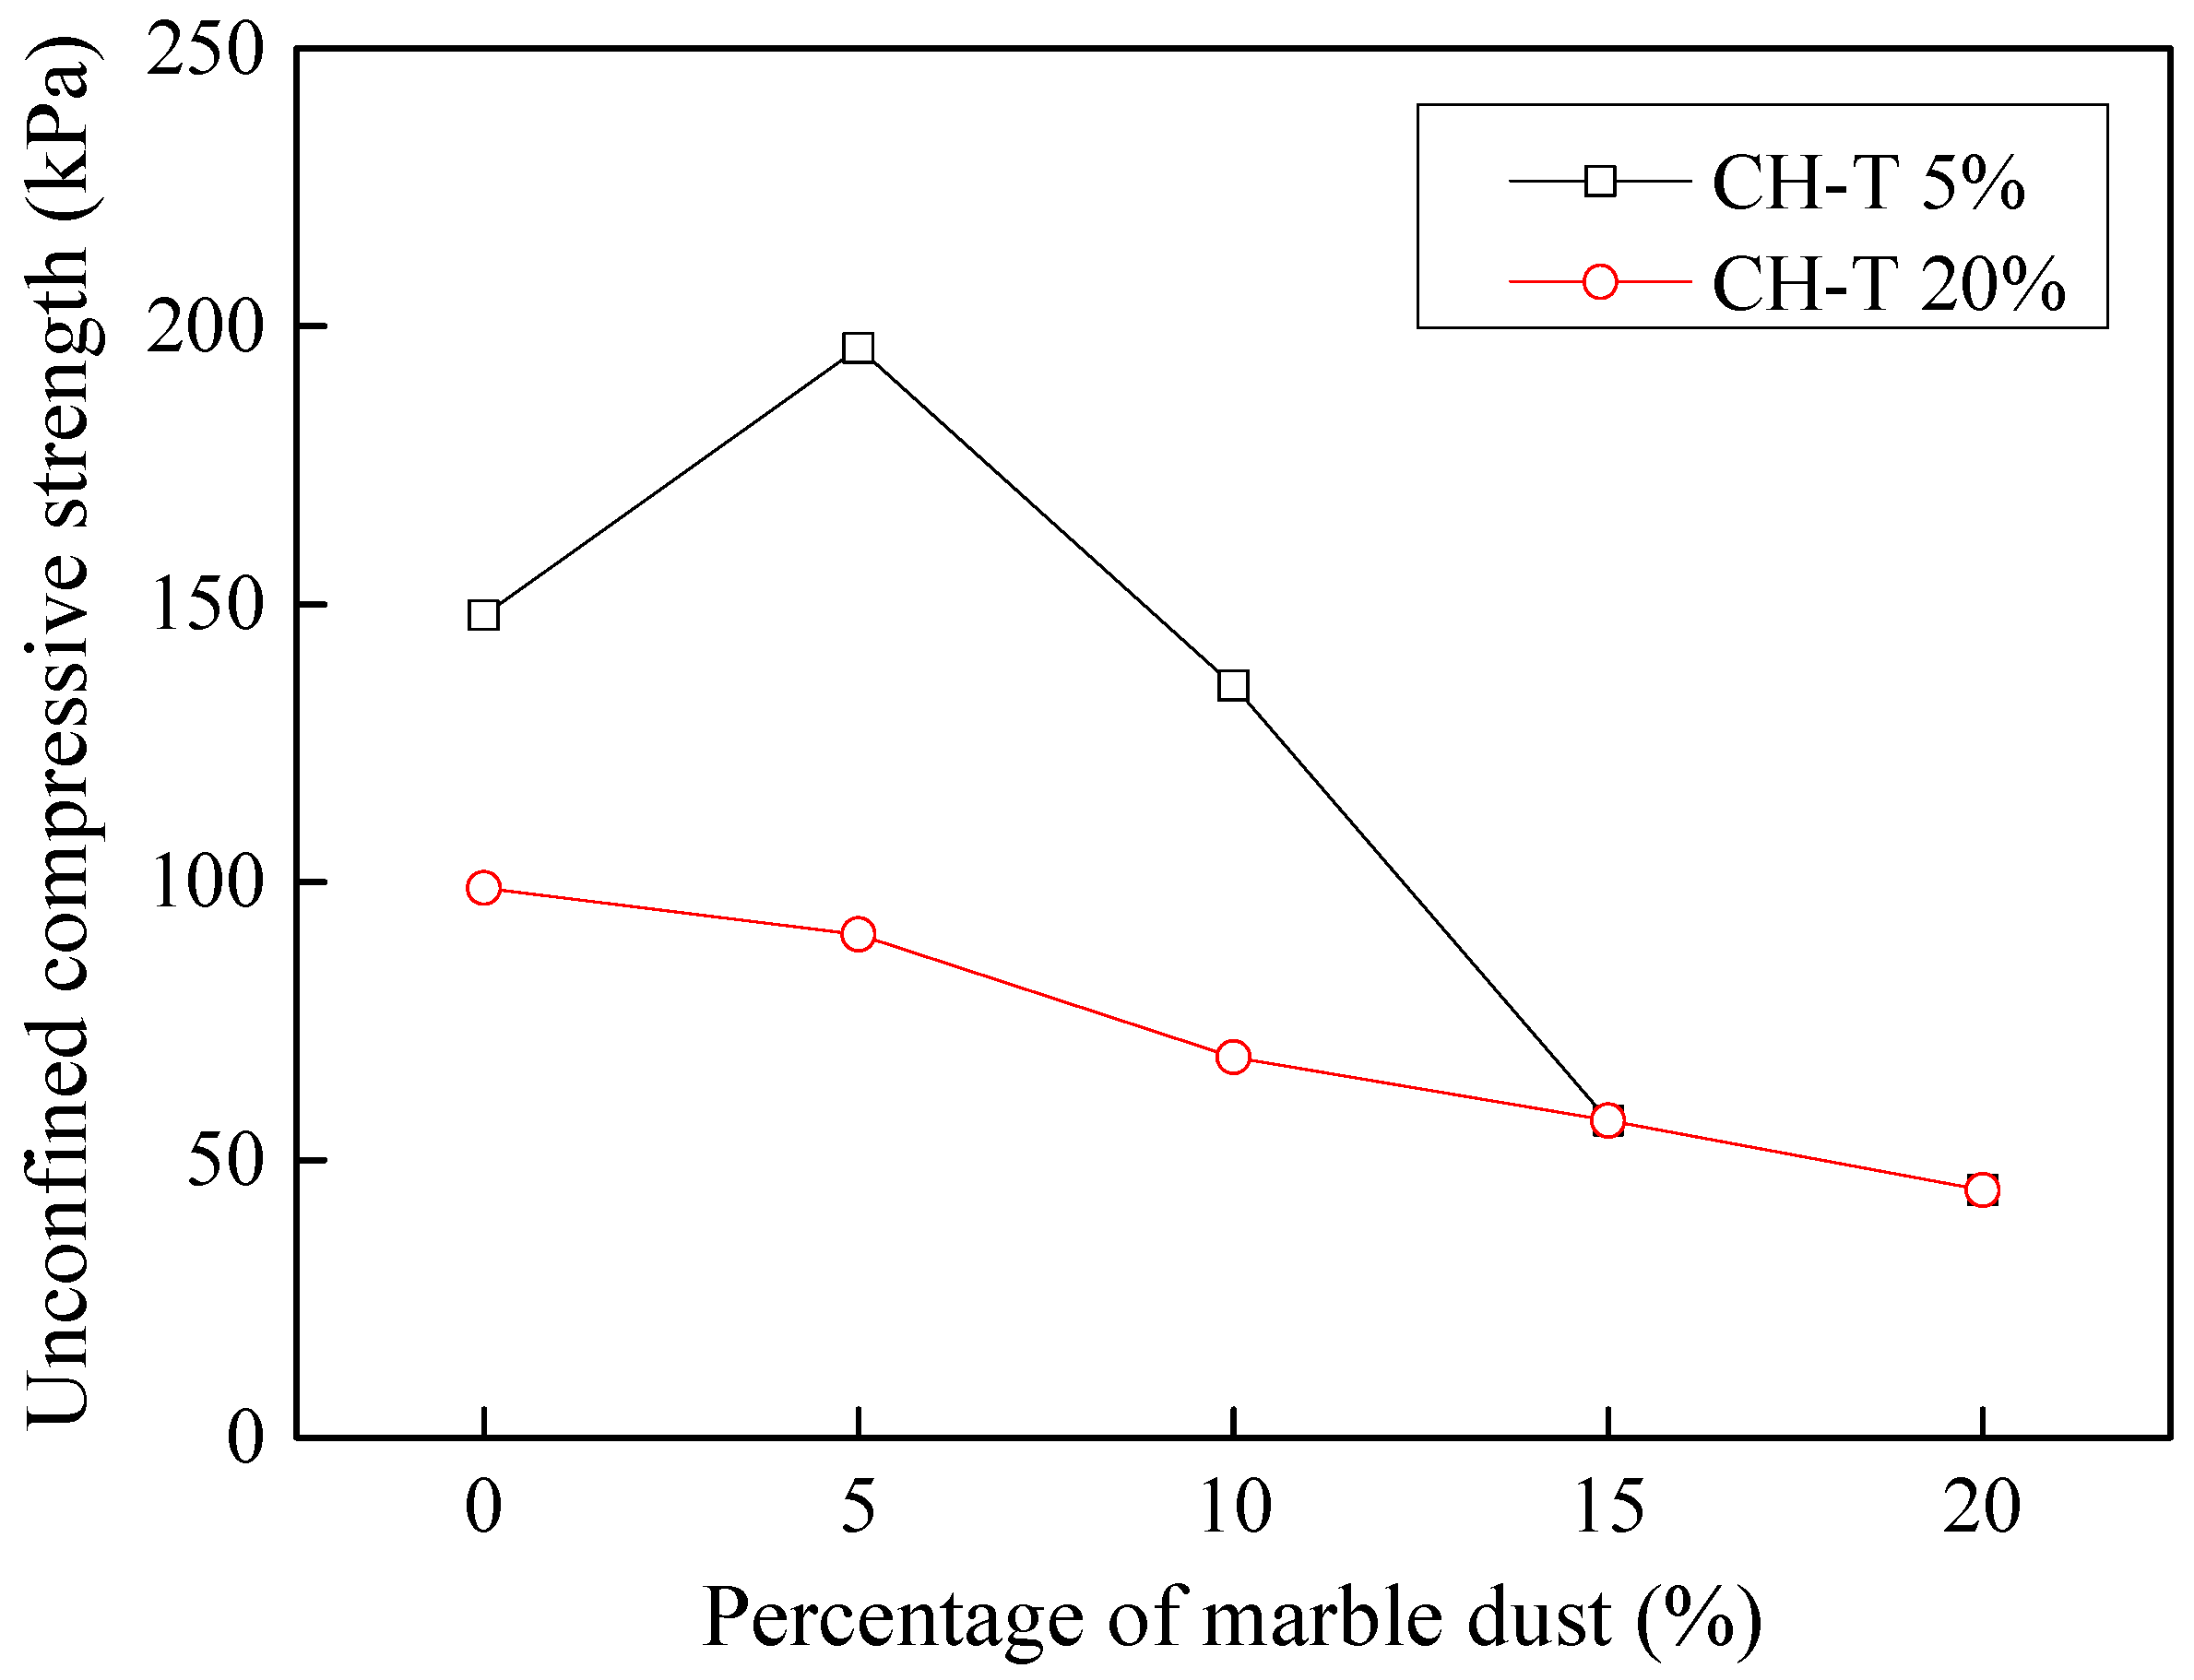
3.9.4. Stabilization of Tannery-Affected CH Soil

Figure 24 shows the trends observed when different percentages of GGBFS were added to base-affected CH soil. With an increase in GGBFS, unconfined compressive strength decreased rapidly from 148.04 kPa to 141.83 kPa at 5% acid contamination with an optimum value of 220.78 kPa at 10% slag concentration. At 20% acid contamination, unconfined compressive strength decreased from 98.81 kPa to 73.57% kPa when slag concentration reached 20%.
Figure 25 depicts the trends observed when 5% and 20% base-affected CH soil was treated with marble dust. With an increase in marble dust concentration, unconfined compressive strength decreased rapidly from 148.04 kPa to 44.54 kPa at 5% basic contamination. At 20% basic contamination, it decreased from 98.81 kPa to 44.5% kPa when slag concentration reached 20%. Further additions continued to decrease the unconfined compressive strength of soils.

4. Conclusions

The study focussed on evaluating the effects of acidic and basic industrial effluents on geotechnical characterisitcs of cohesive soils. In general, the geotechnical characterisitics of cohesive soils were observed to deteriorate upon effluent contamination thereby causing potential risks to future, as well as existing, construction at such sites. A summary of these effects on individual soil characteristics is presented in the following points.
  • Effluents drastically reduce mechanical properties of soil, specifically cohesion. The unconfined compressive strength of effluent contaminate soils was observed to decrease by as much as 60% with 20% addition of industrial effluents. Possible disintegration of mineral particles such as Fe2O3, causing a decrease in soil density, can be attributed as the primary reason leading to such a reduction in soil strength.
  • Both the liquid limit and the plasticity index of contaminated soils showed an increasing trend with contamination. This effect was however more pronounced for CH soils whose liquid limit and plasticity index increased by about 30% compared to around 8% increase for CL soils.
  • Owing to the lower specific gravity of industrial effluents, the specific gravity of effluent contaminated soils decreaesed by 12% to 15% with 20% effluent contamination. The contaminated soils were thus found to have lower specific gravity, contained more fine particles, had a lower maximum dry density, and had a lower cohesion and friction angle.
  • The behavior of basic effluent (tannery) is unique; it exhibits two distinct behaviors before and after optimum concentration. Prior to optimum concentration, changes in maximum dry density of soil may hypothetically occur because a reaction of the basic effluent’s constituents forms oxides of Fe present in the soil. This reaction forms FeO, which is lighter in weight and takes greater volume, thus leading to decreased density. Further increase in the basic effluent concentration post optimum concentration, trigger the remaining constituents to react to certain active masses of soils (likely not FeO), which fill the particle interspaces and increase the soil density.
  • Contamination with industrial effluents was observed to cause around 30%–40% increase in compression index Cc of soil. An increase in Cc value suggests that the tendency of the soil to shrink or expand upon the intrusion of moisture is enhanced, which can lead to distress in structures constructed on such soils.
  • The time dependent affect of effluents on cohesive soils was studied. The unconfined compressive strength of both the soils when contaminated with basic (tannery) effluent, kept on decreasing further with time. Both the soils when contaminated with acidic (dyeing) effluent however, show an initial decrease, followed by a gradual increase in compressive strength. Although both the soils start regaining strength with time, yet, in general, they fail to achieve unconfined compressive strength of virgin soil.
  • Considering the deterioration in soil characeristics upon effluent contamination, second phase of this study focused on possible stabilization of effluent contaminated soils through addition of marble dust and ground granulated blast furnace slag (GGBFS). The main focus of this phase of research remained enhancement in the mechanical strength of soil, which remains among the most important characteristics for engineering use. Marble dust and GGBFS, which are typically considered as good stabilization agents for cohesive soils were found to possess negligible to low positive effect on the mechanical characteristics of effluent contaminated soils. This key finding of present research can hold significant practical value such that highlighting the need to devise special remediation materials for effluent contaminated soils.
The present investigation examined the effects of textile and dyeing effluents on soil’s geotechnical properties. Future studies can be conducted on the influence of these effluents on the California Bearing Ratio values of cohesive soils. The work can also be extended to other contaminants, pollutants, effluents, and/or industrial wastes, namely workshop waste, sugar mill waste, pharmaceutical plant waste, dairy waste, paper and pulp mill waste, fertilizer plant waste, steel mill waste, oil refinery waste, petro-chemical complex waste, soap industry waste, etc.

Author Contributions

M.I. supervised and designed the experiments; Y.C. wrote the paper; M.A. (Muhammad Ali), M.A. (Muhammad Abrar), A.Q. and O.B. performed the experiments.

Funding

This study has been partially funded by China Postdoctoral Science Foundation (Grant Nos. 2017M620048 and 2018T110103).

Conflicts of Interest

The authors declare no conflicts of interest.

References

  1. Mitchell, J. Fundamentals of Soil Behavior; Wiley: New York, NY, USA, 1993. [Google Scholar]
  2. Gratchev, I.B.; Sassa, K. Cyclic behavior of fine-grained soils at different pH values. J. Geotech. Geoenviron. Eng. 2009, 135, 271–279. [Google Scholar] [CrossRef]
  3. Anson, R.W.W.; Hawkins, A.B. The effect of calcium ions in pore water on the residual shear strength of kaolinite and sodium montmorillonite. Geotechnique 1998, 48, 787–800. [Google Scholar] [CrossRef]
  4. Moore, R.; Brunsden, D. Physicochemical effects on the behavior of a coastal mudslide. Geotechnique 1998, 46, 259–278. [Google Scholar] [CrossRef]
  5. Tiwari, B.; Tuladhar, G.; Marui, H. Variation in residual shear strength of the soil with the salinity of pore fluid. J. Geotech. Geoenviron. Eng. 2005, 131, 1445–1456. [Google Scholar] [CrossRef]
  6. Ratnaweera, P.; Meegoda, J. Shear strength and stress–strain behavior of contaminated soils. Geotech. Test. J. 2006, 29, 133–140. [Google Scholar] [CrossRef]
  7. Gratchev, I.; Sassa, K.; Fukuoka, H. How reliable is the plasticity index for estimating the liquefaction potential of clayey sands? J. Geotech. Geoenviron. Eng. 2006, 132, 124–127. [Google Scholar] [CrossRef]
  8. Gratchev, I.; Sassa, K.; Osipov, V.; Fukuoka, H.; Wang, G. Undrained cyclic behavior of bentonite-sand mixtures and factors affecting it. Geotech. Geol. Eng. 2007, 25, 349–367. [Google Scholar] [CrossRef]
  9. Gratchev, I.; Towhata, I. Compressibility of soils containing kaolinite in acidic environments. KSCE J. Civ. Eng. 2016, 20, 623–630. [Google Scholar] [CrossRef]
  10. Sunil, B.; Nayak, S.; Shrihari, S. Effect of pH on the geotechnical properties of laterite. Eng. Geol. 2006, 85, 197–203. [Google Scholar] [CrossRef]
  11. Sunil, B.; Shrihari, S.; Nayak, S. Shear strength characteristics and chemical characteristics of leachate-contaminated lateritic soil. Eng. Geol. 2009, 106, 20–25. [Google Scholar] [CrossRef]
  12. Khan, M.I.; Irfan, M.; Aziz, M.; Khan, A.H. Geotechnical characteristics of effluent contaminated cohesive soils. J. Environ. Eng. Landsc. 2017, 25, 75–82. [Google Scholar] [CrossRef]
  13. Terzaghi, K.; Peck, R.; Mesri, G. Soil Mechanics in Engineering Practice; John Wiley & Sons: New York, NY, USA, 1948. [Google Scholar]
  14. Gibbs, H.J.; Bara, J.P. Stability problems of collapsing soil. J. Soil Mech. Found. 1967, 93, 577–594. [Google Scholar]
  15. Pandian, N.; Nagaraj, T.; Manoj, M. Re-examination of compaction characteristics of fie-grained soils. Geotechnique 1997, 47, 363–366. [Google Scholar] [CrossRef]
  16. Sridharan, A.; Nagaraj, H. Plastic limit and compaction characteristics of fine grained soils. Proc. Inst. Civ. Eng. Ground Improv. 2005, 9, 17–22. [Google Scholar] [CrossRef]
  17. Umesha, T.S.; Dinesh, S.V.; Sivapullaiah, P.V. Effects of acids on geotechnical properties of black cotton soil. Inter. J. Geol. 2012, 6, 69–76. [Google Scholar]
  18. Stalin, V.K.; Muthukumaran, K.; Kartikeyan, A. Effect of Liquid waste on the index and engineering behaviour of soils. In Proceedings of the Indian Geotechnical Conference: IGC-2000: The millennium conference, Mumbai, Indian, 13–15 December 2010; pp. 229–230. [Google Scholar]
  19. Anandarajah, A.; Zhao, D. Triaxial behavior of kaolinite in different pore fluids. J. Geotech. Geoenviron. Eng. 2000, 126, 148–156. [Google Scholar] [CrossRef]
  20. Van Olphen, H. An Introduction to Clay Colloid Chemistry, 2nd ed.; John Wiley & Sons: New York, NY, USA, 1977. [Google Scholar]
  21. Sridharan, A.; Rao, S.M.; Murthy, N.S. Liquid limit of kaolinitic soils. Geotechnique 1988, 38, 191–198. [Google Scholar] [CrossRef]
  22. Ural, N.; Karakurt, C.; Cömert, A.T. Influence of marble wastes on soil improvement and concrete production. J. Mater. Cycles Waste Manag. 2014, 16, 500–508. [Google Scholar] [CrossRef]
  23. Tozsin, G.; Arol, A.I.; Oztas, T.; Kalkan, E. Using marble wastes as a soil amendment for acidic soil neutralization. J. Environ. Manag. 2014, 133, 374–377. [Google Scholar] [CrossRef] [PubMed]
  24. Phummiphan, I.; Horpibulsuk, S.; Rachan, R.; Arulrajah, A.; Shen, S.L.; Chindaprasirt, P. High calcium fly ash geopolymer stabilized lateritic soil and granulated blast furnace slag blends as a pavement base material. J. Hazard. Mater. 2017, 341, 257. [Google Scholar] [CrossRef] [PubMed]
  25. Hasan, U.; Chegenizadeh, A.; Budihardjo, M.A.; Nikraz, H. Experimental evaluation of construction waste and ground granulated blast furnace slag as alternative soil stabilisers. Geotech. Geol. Eng. 2016, 34, 1707–1722. [Google Scholar] [CrossRef]
  26. Jaiswal, M.; Lai, B. Stabilization of clayey soil with garlic skin and rice husk ash for flexible pavement construction. Geotech. Test. J. 2017, 40, 20160227. [Google Scholar] [CrossRef]
  27. Mohanty, S.K.; Pradhan, P.K.; Mohanty, C.R. Consolidation and drainage characteristics of expansive soil stabilized with fly ash and dolochar. Geotech. Geol. Eng. 2016, 34, 1435–1451. [Google Scholar] [CrossRef]
  28. Phanikumar, B.R.; Shankar, M.U. Heave studies on fly ash-stabilised expansive clay liners. Geotech. Geol. Eng. 2017, 35, 111–120. [Google Scholar] [CrossRef]
  29. Chiou, J.S.; You, T.R.; Tsai, C.C.; Hwang, J.H. Performance of laterally loaded piles in improved coal ash deposit. Soils Found. 2017, 57, 872–881. [Google Scholar] [CrossRef]
  30. Rashid, A.S.A.; Latifi, N.; Meehan, C.L.; Manahiloh, K.N. Sustainable improvement of tropical residual soil using an environmentally friendly additive. Geotech. Geol. Eng. 2017, 35, 2613–2623. [Google Scholar] [CrossRef]
Figure 1. Grain size distribution of Nandipur (CH) and DHA (CL) soil samples.
Processes 06 00203 g001
Figure 2. XRD analysis of soil samples.
Processes 06 00203 g002
Figure 3. Effluent from dyeing industry (Acidic).
Processes 06 00203 g003
Figure 4. Effluent from tannery industry (Basic).
Processes 06 00203 g004
Figure 5. Flow-chart presenting specimen preparation procedure.
Processes 06 00203 g005
Figure 6. Effects of industrial effluents on (a) liquid limit and (b) plasticity index of cohesive soils.
Processes 06 00203 g006
Figure 7. Effects of industrial effluents on specific gravity of cohesive soils.
Processes 06 00203 g007
Figure 8. Effects of industrial effluents on pH of cohesive soils.
Processes 06 00203 g008
Figure 9. Effects of industrial effluents on the compaction characteristics of the cohesive soils; (a) Optimum moisture content, (b) Maximum dry density.
Processes 06 00203 g009
Figure 10. Effects of industrial effluents on unconfined compressive strength of cohesive soils.
Processes 06 00203 g010
Figure 11. Effects of industrial effluents on swell potential of cohesive soils.
Processes 06 00203 g011
Figure 12. Effects of industrial effluents on swell pressure of cohesive soils.
Processes 06 00203 g012
Figure 13. Effects of industrial effluents on compression index of cohesive soils.
Processes 06 00203 g013
Figure 14. Effects of dyeing effluent on the cohesion of CL soil samples.
Processes 06 00203 g014
Figure 15. Effects of dyeing effluent on the cohesion of CH soil samples.
Processes 06 00203 g015
Figure 16. Effects of tannery effluent on the cohesion of CL soil samples.
Processes 06 00203 g016
Figure 17. Effects of tannery effluent on the cohesion of CH soil samples.
Processes 06 00203 g017
Figure 18. Improvement of dyeing effluent contaminated CL soil using marble dust.
Processes 06 00203 g018
Figure 19. Improvement of dyeing effluent contaminated CL soil using GGBFS.
Processes 06 00203 g019
Figure 20. Improvement of tannery effluent contaminated CL soil using GGBFS.
Processes 06 00203 g020
Figure 21. Improvement of tannery effluent contaminated CL soil using marble dust.
Processes 06 00203 g021
Figure 22. Improvement in dyeing effluent contaminated CH soil using marble dust.
Processes 06 00203 g022
Figure 23. Improvement in dyeing effluent contaminated CH soil using GGBFS.
Processes 06 00203 g023
Figure 24. Improvement in tannery effluent contaminated CH soil using GGBFS.
Processes 06 00203 g024
Figure 25. Improvement in tannery effluent contaminated CH soil using marble dust.
Processes 06 00203 g025
Table 1. Physical and chemical properties of soil samples.
PropertiesCHCL
ClassificationHigh plastic clayLow plastic clay
pH7.67.3
Liquid limit54.6%31.18%
Plastic limit26.61%17.35%
Specific gravity2.712.78
Max. dry density18.12 kN/m319.57 kN/m3
Optimum moisture content15.7%9.5%
Swell potential5.4%2.2%
Swell pressure307.92 kPa132.58 kPa
Table 2. Properties of industrial effluents.
Tests PerformedTannery EffluentDyeing Effluent
ColorDark greenishDark reddish
pH11.55.1
Total solids (g/L)25.431.673
Total dissolved solids (mg/L)19.78910
Total suspended solids (mg/L)603330
Suspended solids (g/L)61
BOD (mg/L)44451980
COD (mg/L)50002100
Chlorides (mg/L)230175
Specific gravity1.0121.007
Sulphates (mg/L)281198
Nitrates (mg/L)3428
Table 3. Properties of industrial by-products.
MaterialConstituentsPercentage (%)
Marble dustSiO26.2
Fe2O30.8
CaO30.1
Al2O34.8
Ground granulated blast furnace slagCaO30–50
SiO228–38
Al2O38–24
MgO1–18

