Abstract
This paper proposes an efficiency-optimized multi-parameter collaborative non-dimensional selection method for industrial fans. Based on fan similarity theory, selection parameters are transformed into non-dimensional forms. The fan’s best working area (BWA) is defined according to stall margin, flow range, total pressure rise deviation, and minimum efficiency. The initial model selection uses the boundary equations of the defined BWA as screening criteria. Decision parameters comprise Euclidean distance, design point distance, pressure deviation, and current efficiency. These collectively form a multi-objective evaluation function. The NSGA-II algorithm determines the optimal weight distribution of decision parameters, generating a Pareto-optimal solution set. The initially selected models are subsequently subjected to secondary optimization through a comprehensive evaluation function. Selection case studies demonstrate that this method preliminarily screens 7 models that meet the target parameters from 400 candidate models. Secondary screening determines the model with the optimal efficiency and best comprehensive evaluation performance. The method effectively resolves the mismatch between fan model design points and target operational parameters in selection processes. This method integrates directly into selection software platforms and validation with 100 sets of fan selection parameters demonstrates that selected models achieve 99% accuracy. Achieving the secondary optimization function for fan model selection.
1. Introduction
As the core power equipment in the fields of energy, chemical industry, aerospace, and so on [1,2,3], the accuracy of fan selection directly affects the system’s operation efficiency and energy consumption level. With the continuous improvement of equipment energy efficiency standards in the industrial field, the selection and optimization of fans become a key link for achieving efficient operation and reducing energy consumption [4,5]. However, due to working condition complexity and parameter diversity, existing selection methods often fail to achieve precise matching, resulting in low operating efficiency and serious energy waste of the selected model [6]. Related studies have shown that in the industrial fan field, more than 60% of fans operate at less than 70% efficiency, with annual energy consumption increasing by 15% to 20%. This is mainly due to improper fan selection methods [7,8]. Therefore, it is necessary to research new methods and theories on fan selection, focusing on optimizing efficiency.
In the industry, fan selection methods fall into traditional and intelligent selection algorithms. Traditional selection methods include dimensional selection and dimensionless selection [9]. The dimensional selection is realized by searching the model database for the model corresponding to the working condition parameters close to the selection parameters. However, it is not easy to find specific working conditions with this method. Dimensionless selection enables cross-scale analysis of fan operating characteristics without being affected by environmental factors such as density, speed, and temperature, making the sizing process more efficient and the results more accurate [10]. However, the models selected by these two methods are prone to appear in low-efficiency work areas. On this basis, Zhang et al. [11] proposed a fan selection method based on the specific speed curve. The models that meet the selection conditions are selected by calculating the specific speed curve’s intersection characteristic parameters and each model’s characteristic curves. Han et al. [12] proposed to find the fan whose design point specific speed is close to the specific speed of the user’s demand and deform it. Although a similar specific speed ensures the similarity of the internal flow state of the fan in theory, it also complicates the selection process.
Intelligent algorithms have been widely used in fan applications, but there are few studies on the decision-making problem of fan selection [13,14]. The existing research mainly applies multi-criteria decision-making [15], fuzzy decision-making [16], and hybrid decision-making methods [17,18] to fan selection, aiming to address the collaborative multi-objective optimization problem of aerodynamic performance, economy, and reliability. However, these methods are based on the general decision-making framework and fail to incorporate key physical mechanisms such as similarity theory, surge boundary constraints, and high-efficiency zone matching characteristics into the selection decision-making process, resulting in a disconnection between the decision-making process and the actual operation law of the wind turbine, and insufficient interpretability of engineering applications. This process limits the applicability of related methods in industrial scenarios with high reliability and high matching accuracy requirements [19,20]. Therefore, it is necessary to study a fan selection method that combines the advantages of physical mechanisms and intelligent algorithms. Figure 1 illustrates the research progress and development trajectory of fan selection methods.
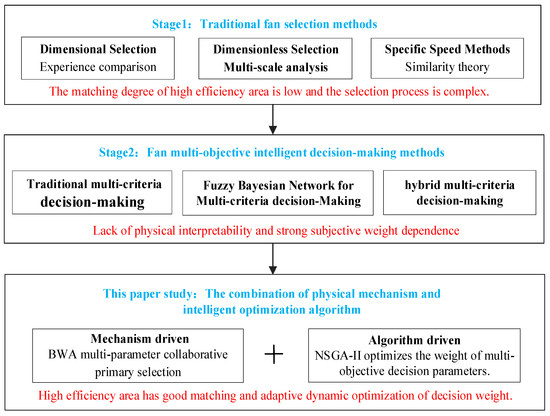
Figure 1.
Research progress diagram of fan selection methods.
The NSGA-II algorithm demonstrates remarkable applicability to multi-objective decision-making problems, owing to its robustness, stability, and interpretability in handling medium-dimensional, nonlinear optimization problems. It has been widely used across several fields, including renewable energy generation [21], hybrid transportation system optimization [22], and solar-powered multi-generation system optimization [23]. However, current fan selection methods have limitations in theoretical innovation, parameter matching for working conditions, and software function extension [24,25]. Therefore, this paper proposes a multi-parameter collaborative dimensionless fan selection method based on efficiency optimization. The novelty of this selection method is as follows:
- It innovatively defines the fan’s best working area and delineates its boundary equations, enabling multi-parameter collaborative initial selection.
- A multi-objective evaluation function is constructed using decision parameters such as Euclidean distance, design point distance, pressure deviation, and current efficiency. Through NSGA-II algorithm solves the optimal weight distribution problem, enabling a secondary selection of the initially selected models.
- Through visual analysis of the selection cases, the operational condition matching degree of the selected models significantly improved, with operational efficiency meeting over 75% of the target parameters and pressure rise deviation controlled within 25%. After testing 100 sets of fan selection parameters, the accuracy rate of the optimized models reached 99%.
2. The Fan Selection Method Proposed in This Paper
2.1. Theoretical Foundation: Fan Similarity and Dimensionless Parameters
2.1.1. Determination of Dimensionless Selection Parameters
In the fan selection process, dimensionless processing of selection parameters enables cross-scale selection and eliminates the impact of variations in size, speed, and fluid properties [26].
Environmental parameters, including pressure rise , inlet pressure , gas temperature , and gas constant , are used to calculate the gas density and the compression coefficient [27]. For the air medium, the calculation method for the Chinese standard compressibility coefficient uses K = 1.4 for the adiabatic exponent. The gas density and compression coefficient are calculated according to the following formulas:
The basic parameters of fan selection include volume flow rate , pressure rise , and speed . The flow coefficient , pressure rise coefficient , and power coefficient are calculated according to the following formulas [27].
where represents the diameter of a commonly used No. 10 industrial fan, D = 1 m; represents the circumferential speed of the fan; and represents the total pressure efficiency of the fan.
Specific rotational speed is the key basis for the classification, standardization, and similar design of fans. Thus, it is a critical parameter in the fan selection process [27], which is expressed by .
where g is usually taken as 9.81 m2/s.
2.1.2. Dimensionless Characteristic Curve Parameters
The fan database contains 400 discrete aerodynamic performance data points for different models. Each model includes: 10 flow-pressure rise data points , 10 flow-power data points , and 10 flow-efficiency data points . Using the dimensionless conversion formulas for fan selection parameters, all the above data points are converted into corresponding dimensionless parameter points: flow coefficient-pressure rise coefficient , flow coefficient-power coefficient , and flow coefficient-efficiency . Each model maintains 10 data points for each combination of dimensionless parameters. The dimensionless characteristic parameter curves for 400 models are fitted using these converted dimensionless aerodynamic performance discrete data points. Subsequently, Newton’s method solves all models’ design point operating parameters [28], including , , , and the fan stall point flow coefficients .
where is the Hessian matrix of the objective function at point, is a functional relationship.
2.2. Definition of the Fan’s Best Working Area (BWA)
The current fan selection methods typically rely on the characteristic curve for screening, using the design point (best efficiency point, BEP) as the optimal operating point. However, in actual operation, factors such as load fluctuations and system resistance deviations cause the fan’s operating conditions to deviate from the design point [5]. Relevant research shows that approximately 67% of fans operate in inefficient ranges 15–25% below design efficiency due to improper parameter matching [6]. Existing studies employ a single definition of the best working area, typically based solely on efficiency or pressure rise ranges while ignoring the collaborative constraints of multiple parameters such as specific speed, stall boundary, and error range [7]. This leads to an ambiguous boundary of the best working area, causing flow fluctuations after selection that trigger stalling, a sudden drop in efficiency, vibration, and excessive deviation from the design point, resulting in energy waste.
In order to break through the limitations of the traditional single-point matching, this paper proposes a new definition of the best working area (BWA) of the fan, which refers to the range of working conditions near the design point that satisfy high efficiency and stable operation. Its efficiency exceeds general operating conditions by 15–30%. Ensuring selected models operate within the BWA is the key to realizing the efficient and energy-saving operation of the fan.
The BWA uses dimensionless parameterization for boundary definition. To maintain the stable operation of the fan, the BWA should avoid proximity to the stall boundary [28]. Therefore, the left boundary of the BWA is defined by the stall margin , and the flow error defines the right boundary of the BWA. Also, the pressure rise error controls the range of BWA pressure rise for the fan, and the lowest efficiency defines the lower efficiency limit for BWA.
2.2.1. Key Parameters for Defining the Best Working Area
The Best Working Area (BWA) is defined by key parameters, including stall margin, flow error, pressure rise error, and lowest efficiency. and represent the flow coefficient of the left and right boundaries of the best working area, respectively; is the flow coefficient of the critical point of the fan stall zone, and represents the flow coefficient at the design point of the fan; is the pressure rise coefficient in the selection conditions; and defines the upper limit value of the BWA pressure rise coefficient of the fan.
The flow margin is an essential indicator of a stable working area for the fan.
The flow error defines the right boundary size of the BWA of the fan and represents its deviation from the design point.
The pressure rise error is the key parameter controlling the upper limit of the fan’s BWA pressure rise. It is the deviation value of the upper limit of the BWA pressure rise from the target pressure.
The lowest efficiency sets the lowest value of the efficiency that limits the operation of the fan. The purpose of this criterion is to screen out fan models that are still not up to standard in operating efficiency, even though they are in BWA Typically, the fan operating efficiency satisfies:
where typically ranges between 70% and 75%.
Through the above dimensionless parameterization definition, the boundary equations of the best working area of the fan are defined as follows:
where represents the power coefficient is after dimensionless selection parameters.
2.2.2. Best Working Area near the Design Point
Due to the unique variations in the dimensionless characteristic curves of the fan, specifically in its flow coefficient–pressure rise coefficient curve, the corresponding flow coefficient–efficiency curve exhibits two distinct patterns. Consequently, while the left boundary of the Best Working Area (BWA), defined by the stall margin , remains unchanged, the right boundary—determined by the allowable error range of the flow coefficient —must be considered under two separate cases. Therefore, the definition of the fan BWA requires subdivision into these two scenarios. As illustrated, the design point may reside precisely at the left boundary of the BWA, as shown in Figure 2a, or within the interior of the BWA, as shown in Figure 2b.
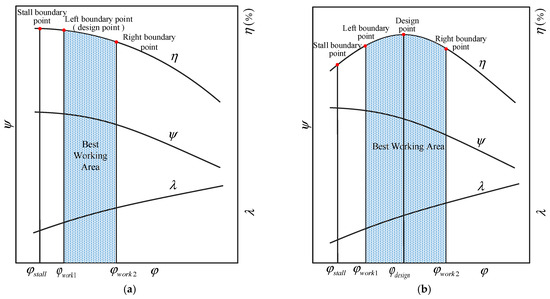
Figure 2.
(a) The schematic diagram of the design point is located at the left boundary of the best working area. (b) The schematic diagram of the design point is located in the best working area.
The Design Point Located at the BWA Left Boundary
As illustrated in Figure 2a, when the fan design point occupies the BWA left boundary, the left boundary flow coefficient equals the design point value, that is . The BWA for each fan model is solvable through selecting the parameters of stall margin , flow error , pressure rise error , and lowest efficiency .
The Design Point Located in the Best Working Area
As illustrated in Figure 2b, when the design point lies within the BWA, Newton’s method determines the corresponding flow coefficient at the design point of the fan. In this case, the value of the flow coefficient at the design point does not equal the flow coefficient at the left boundary of the BWA, that is . In this case, the left boundary flow coefficient of BWA and the upper limit of pressure rise are solved in the same way as in Equations (13) and (15). However, the right boundary flow coefficient of BWA is solved differently, as in Equation (14).
2.3. Pareto-Based Multi-Dimensional Evaluation Method
2.3.1. Multi-Dimensional Evaluation Decision Parameters
Assume that the dimensionless parameter at the operating condition point of the preliminary model is , the dimensionless parameter at the design point of the preliminary model is , and the dimensionless parameter of the target operating condition corresponding to the selection condition is .
Euclidean distance : the geometric distance between the candidate model and the target parameters is represented in the multidimensional space. The Euclidean distance quantifies the degree of similarity between dimensionless operating conditions points, with smaller distances indicating that the candidate models are closer to the target operating conditions flow characteristics and thus satisfy the dynamic similarity criterion.
Design point distance : This metric characterizes the multidimensional space distance between current operating conditions and the candidate model’s design point. Smaller values indicate closer alignment with the design point and consequently yield higher operational efficiency.
Pressure rise deviation : the deviation value between the pressure rise coefficient of the current working condition and the pressure rise coefficient of the target working condition.
Current efficiency : represents the working efficiency of the candidate model when the actual flow coefficient is running, that is .
2.3.2. NSGA-II Algorithm for Weight Distribution
NSGA-II (Non-dominated Sorting Genetic Algorithm II) effectively resolves multi-parameter conflicts, including , , , and in fan selection. The algorithm’s core determines optimal weight coefficients for the comprehensive evaluation function (Score).
According to the multi-objective decision-making method of minimizing error, maximizing efficiency, and minimizing design point distance, the objective functions are defined as:
The fan selection database comprises 400 standard industrial fan models. After extracting and non-dimensionalizing the characteristic parameters of representative models from each series, these parameters are used to plot dimensionless characteristic curves. This process enables the depiction of flow coefficient–efficiency characteristic curves for all fan series, as shown in Figure 3. In a similar manner, the flow coefficient–pressure rise coefficient characteristic curves can be derived. Based on these curves, the best working area for each fan series is determined, which then allows the establishment of the multi-objective decision parameter and objective function ranges as follows:
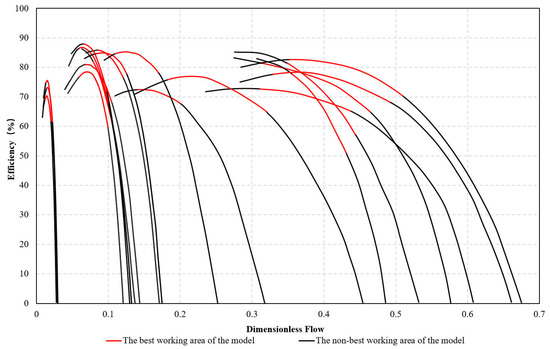
Figure 3.
The flow coefficient-efficiency characteristic curve of each series of fan models in the selection database.
The workflow of the NSGA-II algorithm is illustrated in Figure 4 [29]. Since the selection database involves 400 fan models, the initial population size of the decision variables (, , , ) is set to 400, and each population satisfies . Following the initialization, the NSGA-II algorithm employs a fast non-dominated sorting procedure to classify the candidate weight vectors (, , , ) into successive Pareto frontiers (). A solution is defined to dominate another solution (denoted as ) if it is superior in at least one objective without being worse in any other, mathematically expressed as:
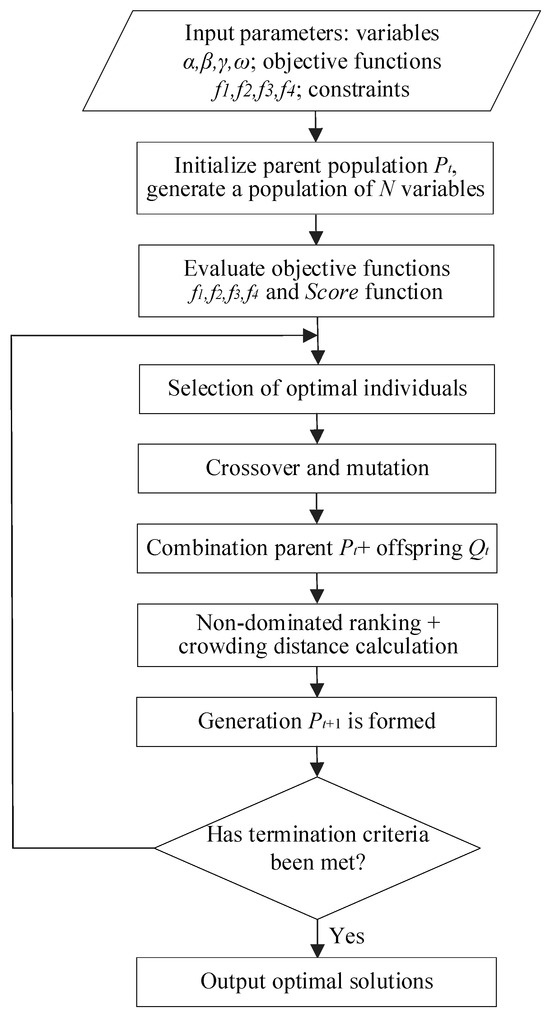
Figure 4.
Flow chart of the NSGA-II algorithm.
To ensure a well-distributed spread of solutions across the Pareto front and avoid crowding, the crowding distance for each solution within its frontier is calculated [30]. For a solution indexed , its crowding distance is the normalized sum of side lengths of the cuboid formed by its immediate neighbors in the objective space:
Genetic operations are performed using simulated binary crossover and polynomial mutation, and the optimal individual is retained as a new population generation. The multi-objective evaluation method defines four decision parameters to control the depth of the algorithm search, enabling it to perform full selection, crossover, and mutation. Consequently, the initial population iteration count is set to 400.
Figure 5a presents the Pareto front distribution, comprising 175 non-dominated solutions obtained through algorithmic iteration. To visualize this four-dimensional objective space, a 4 × 4 scatter plot matrix (SPLOM) is employed. The six off-diagonal subplots illustrate the pairwise trade-off relationships between objective functions, while the four diagonal subplots display the value distribution, density, and engineering bounds of each individual objective. Each point in the SPLOM corresponds to a unique set of weight coefficients, representing a Pareto-optimal solution. To select a single, best-compromise solution from this high-dimensional front, a comprehensive evaluation function formula (23) is defined. This function synthesizes the objectives of minimizing Euclidean distance and pressure deviation while maximizing efficiency and proximity to the design point. The weight coefficients are placed in the denominator to prevent any single decision parameter from exerting disproportionate influence on the final score. The solution with the highest score is thereby identified as the optimal balance across all considered criteria.
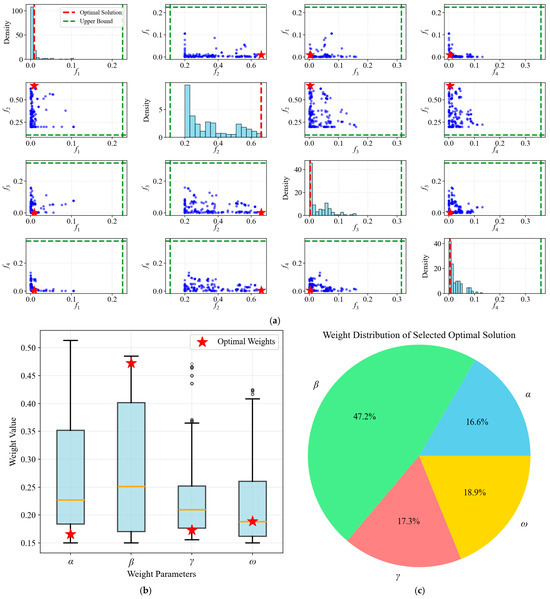
Figure 5.
Pareto Optimal Solution Analysis and Decision Space Visualization. (a) Scatter Plot Matrix (SPLOM) of Pareto Optimal Solutions in Objective Space; (b) Distribution of Weight Parameters in Decision Space; (c) Weight Distribution of Selected Optimal Solution.
The Score equation solves for the optimal weight combinations, and the optimal weight of each decision parameter is determined to be , , , . Inputting candidate model parameters into this equation identifies the lowest-scoring model as optimal. The physical interpretations of these weights are: represents the matching degree of working conditions, represents the economic energy efficiency index, represents the pressure rise deviation, and represents the design point deviation. These weight coefficients establish interpretable evaluation indicators for the comprehensive performance evaluation of the fan industry.
To better reflect the distribution characteristics of the weight parameters in the decision space and the robustness of the selected optimal solution set, two additional graphs—“Distribution of the Weight Parameters in the Decision Space” and “Weight Distribution of the Selected Optimal Solution”—are included. As illustrated in Figure 5b,c, these supplements provide further insight into the quality and robustness of the solution set. Since the value of is significantly larger than those of , and , the sparse distribution of solutions near the optimum in the objective space is understandable.
2.4. Proposed Fan Selection Procedure
Unlike existing selection methods, the efficiency-optimized dimensionless fan selection method proposed in this work combines multi-parameter collaborative screening and Pareto weight assessment to determine optimal fan models. The operating conditions of the model selected through this method directly satisfy the target requirements, eliminating the need for modular design and deformation adjustments, thereby simplifying the selection process. The method comprises the following steps, and its workflow is shown in Figure 6.
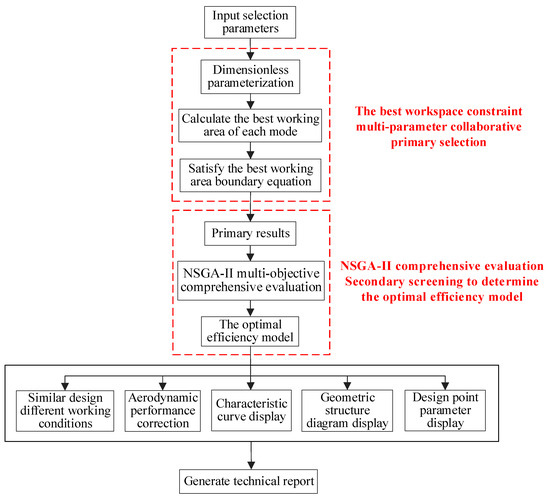
Figure 6.
Step flow chart of the efficiency optimal dimensionless selection method.
- Parameter dimensionless conversion: using the principle of similarity, the selection parameters (, , and ) are converted to dimensionless coefficients (, , and ), while computing specific speed .
- Multi-parameter collaborative screening employs collaborative constraints of parameters such as , , , , , , etc., the initial selection of the fan models, operating within the BWA, to ensure that the initially selected models operate stably and efficiently.
- Pareto weight comprehensive evaluation: the NSGA-II algorithm assigns the optimal weights of decision parameters, and the optimal model is selected via the Pareto weight multi-dimensional evaluation method.
- Performance calculation and parameter correction: similar design [30,31], performance correction, display characteristic curve and geometric structure, query design point parameters, and transform similarity factor for the optimal model.
- Technical report generation: the selection parameters, performance parameters, correction factors, geometric data, characteristic curves, and other information are integrated and output as technical reports for reference.
3. Results and Discussion
Based on this method, fan selection software is developed for industrial applications. It uses C++ for front-end and back-end programming with MySQL 8.0 as the database backend, featuring a modularized architecture. The system comprises five modules: intelligent selection, model query, database expansion, aerodynamic structure design, and technical report generation [32].
Fan selection is performed using actual industrial cases, with visualization methods analyzing compatibility between the preferred model and the target parameters. This verifies the accuracy of the efficiency-optimised multi-parameter collaborative dimensionless selection method proposed in this paper and validates the reliability of the developed software.
The selection parameters include: local atmospheric pressure 101,325 Pa, inlet pressure 0 Pa, gas constant 288, inlet temperature 20 °C, volume flow rate 25,500 m3/h, pressure rise 5500 Pa, rotation speed 1910 r/min, gas density 1.2 kg/m3, stall margin 20%, flow error 20%, pressure rise error 25%, lowest efficiency 70%.
In the developed selection software, the aforementioned target parameters are input, and seven models (model A–G) are initially screened from a model library of 400 models. The multi-parameter collaborative preliminary selection results are shown in Figure 7. The red area represents the best working area of the preliminarily selected models (model A–G), and the black line indicates the flow coefficient of the fan selection target operating conditions. Figure 7 shows that all prescreened models’ operating points at the target flow rate fall within their respective BWAs, validating the software’s prescreening accuracy. Table 1 illustrates the best working area boundary and operating condition point characteristics of primary selection models in detail. Table 2 lists the dimensional aerodynamic performance parameters of primary selection models under the target operating condition.
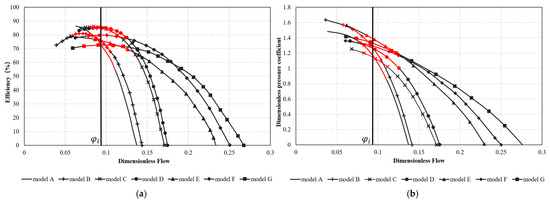
Figure 7.
The schematic diagram of the initial selection results of the best working area. (a) The curve diagram of 7 primary models; (b) The dimensionless curve diagram of 7 primary models.

Table 1.
The best working area boundary and operating condition point characteristics of the primary model are selected.
Table 2.
The dimensional aerodynamic parameters of the primary model are selected for the target working condition.
Figure 8 shows the ranking results of the Pareto weight comprehensive evaluation, which is also an enlarged view of the optimal operating zone of the initial selected model. The green points denote design points of candidate models, with adjacent numbers indicating comprehensive ranking (lower numbers signify better performance). The black line maintains target flow coefficient reference. In Figure 8a, the yellow line represents minimum efficiency threshold; in Figure 8b, it indicates target pressure rise coefficient.
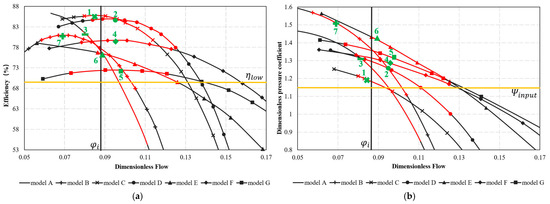
Figure 8.
Enlarged diagram of the second optimization ranking result of multi-objective evaluation (a) The enlarged diagram of the second optimization ranking result; (b) The enlarged diagram of the second optimization ranking result.
The initial selected models are comprehensively ranked from multi-dimensional quantitative and qualitative perspectives based on the Pareto weight comprehensive evaluation of the secondary optimization results, combined with Figure 8 and the specific parameters provided in Table 3. A lower comprehensive performance score indicates better overall performance of the model.
Table 3.
Pareto weight comprehensive ranking table for refined model selection.
The results indicate that Model C ranks first in comprehensive performance. It demonstrates the highest current operating efficiency, reaching 85.58%, a minimal design point deviation of 0.0143, a low pressure rise error of 0.1954, and operating conditions located near the design point and away from the stall boundary. Model D ranks second. Although it exhibits high operating efficiency, at 85.10%, and a small deviation from the design point of 0.0093, its overall performance is slightly inferior due to a larger pressure rise error of 0.2427 and its proximity to the stall boundary. Compared to Model F, Model A has lower operating efficiency, measuring 75.88%, and a greater design point distance of 0.1492. However, its Euclidean distance and pressure rise error are significantly smaller than those of Model F. Therefore, Model A demonstrates better comprehensive performance, ranking third, while Model F ranks fourth. Although Model E has a higher operating efficiency of 76.22% than Model G, which is 71.80%, Model E operates near the stall boundary, which may induce stall and vibration. Moreover, the pressure rise deviation of Model E is 0.2717, which is considerably larger than that of Model G, at 0.1227. Consequently, Model G ranks fifth, and Model E ranks sixth. Model B ranks seventh in comprehensive performance. Although it has high design point efficiency, it exhibits the farthest distance from the design point, measuring 0.2836, and a large total pressure rise deviation, resulting in the lowest comprehensive evaluation score.
The comparison shows that the selection method proposed in this paper has significant advantages in multi-objective decision making. The method can screen out the fan model directly with the best overall efficiency, meeting the requirements of low deviation and high energy efficiency, and being close to the design point. The selected model by this method has significantly improved operating conditions, with operating efficiency meeting more than 75% of user-defined requirements and pressure rise meeting within 25% of the pressure rise deviation. Furthermore, this method achieves an accuracy rate of 99% in selecting the optimal model by verifying 100 sets of fan selection parameters and analysing software visualisation output results.
4. Conclusions
In order to solve the problem of energy waste caused by poor matching of working conditions of selected models in the fan selection process, this paper proposes a multi-parameter collaborative dimensionless selection method based on optimal efficiency. Compared with the existing fan selection schemes, the main contributions of this paper are as follows:
- The dimensionless selection parameter system is constructed using the similarity theory. The fan’s best working area (BWA) and its boundary equation are defined. The BWA boundary is changed by parametric adjustment of , , , and , which in turn optimizes the primary selection results.
- The NSGA-II algorithm is used to assign the optimal weights to the decision parameters , , , and , and the Pareto weight comprehensive evaluation method is used to secondarily screen out the optimal efficiency model. This ensures that the final selected model has a multi-objective balance between aerodynamic performance, operational stability, and economy.
- The software developed based on this method can select the most suitable model from 400 models that best match the target parameters, effectively solving the energy waste problem caused by poor matching operating conditions in fan selection. Furthermore, after extensive verification of fan selection parameters, this method has an accuracy rate of 99% in selecting the optimal model.
This study is limited by its focus on 3–4 key objectives and by the use of the well-established NSGA-II algorithm, which is suitable for this scope. For additional practical factors, such as noise, durability, and total cost, the problem complexity would increase, necessitating more advanced optimization algorithms in future work.
Author Contributions
Writing—original draft preparation, methodology, software, and validation: J.L.; conceptualization, methodology, writing—review and editing: S.L.; investigation, fan model database, resources, validation, and formal analysis: J.S. All authors have read and agreed to the published version of the manuscript.
Funding
This research received no external funding.
Data Availability Statement
The original contributions presented in the study are included in the article; further inquiries can be directed to the corresponding author.
Conflicts of Interest
Author Jiao Sun was employed by Xinxiang Simo Blower Co., Ltd. The remaining authors declare that the research was conducted in the absence of any commercial or financial relationships that could be construed as a potential conflict of interest.
Nomenclature
| BWA | Best Working Area of the fan model |
| Volume flow rate of target parameters for fan selection (m3/s) | |
| Total pressure rise of the target parameters for fan selection (Pa) | |
| Inlet pressure of the target working condition for fan selection (Pa) | |
| Rotation speed of the target parameters for fan selection (rpm) | |
| Inlet temperature of the target working condition for fan selection (K) | |
| Gas constants of the target working condition for fan selection | |
| Gas density of the target working condition for fan selection(kg/m3) | |
| Compressibility factor of the target working condition for fan selection | |
| Flow coefficient of the target parameters for fan selection | |
| total pressure rise coefficient of the target parameters for fan selection | |
| Power coefficient of the target parameters for fan selection | |
| Total pressure efficiency of fan selection | |
| Specific rotational speed calculated from the selected parameters | |
| Power consumption of at a specific flow condition of the fan model | |
| Flow coefficient at the design point of the fan model | |
| Pressure rise coefficient at the design point of the fan model | |
| Power coefficient at the design point of the fan model | |
| Flow coefficient at the stall point of the fan model | |
| Flow coefficient at the left boundary of the BWA for the fan model | |
| Flow coefficient at the right boundary of the BWA for the fan model | |
| Pressure rise coefficient input during fan selection | |
| Upper limit of the pressure rise coefficient of the BWA for the fan model | |
| Stall margin set during fan selection | |
| Flow error range set during fan selection | |
| Pressure rise error set during fan selection | |
| The lowest efficiency set during fan selection | |
| Euclidean distance of the candidate fan model | |
| Design point distance of the candidate fan model | |
| Pressure rise deviation of the candidate fan model | |
| Current efficiency of the candidate fan model |
References
- International Renewable Energy Agency. Renewable Capacity Highlights; International Renewable Energy Agency: Masdar City, United Arab Emirates, 2020; Available online: https://www.irena.org/Publications/2020/Mar/Renewable-Capacity-Statistics-2020 (accessed on 30 November 2025).
- Zhao, J.; Pei, J.; Wang, W.; Gan, X. Blade redesign based on inverse design method for energy performance improvement and hydro-induced vibration suppression of a multi-stage centrifugal pump. Energy 2024, 308, 132862. [Google Scholar] [CrossRef]
- Xu, W.; Chen, G.; Shi, H.; Zhang, P.; Chen, X. Research on operational characteristics of coal power centrifugal fans at off-design working conditions based on flap-angle adjustment. Energy 2023, 284, 129363. [Google Scholar] [CrossRef]
- Piwowarski, M.; Jakowski, D. Areas of Fan Research—A Review of the Literature in Terms of Improving Operating Efficiency and Reducing Noise Emissions. Energies 2023, 16, 1042. [Google Scholar] [CrossRef]
- Biedermann, T.M.; Scholz, M.; Chong, T.P. Aeroacoustic assessment of porous blade treatment applied to centrifugal fans. Int. J. Aeroacoust. 2024, 23, 610–633. [Google Scholar] [CrossRef]
- Li, D. Analysis and Research on Energy Consumption Status and Energy Saving Measures of Fans in Major Domestic Industries. Chin. J. Turbomach. 2019, 61, 1–6. [Google Scholar]
- Zhang, J.; Liu, X.; Yu, J. Numerical simulation study on the influence of fan selection and furnace structure on the combustion condition of plateau gas boiler. Energy Conserv. Technol. 2022, 40, 497–501. [Google Scholar]
- Wei, R.; Bai, T. Analysis of large CFB unit primary fan selection and operation optimization. Power Syst. Eng. 2015, 31, 28–30. (In Chinese) [Google Scholar]
- Liu, J. Current energy consumption of China’s coal power unit fan and energy saving direction. Chin. J. Turbomach. 2015, 57, 8–11. (In Chinese) [Google Scholar]
- Zhang, Y. Fan Design and Selection; Chemical Industry Press: Beijing, China, 2011; pp. 98–101. [Google Scholar]
- Zhang, Z.; Yan, W.; Xing, D. Centrifugal fan specific speed curve selection research and software development. Electr. Power Sci. Eng. 2019, 35, 67–72. [Google Scholar]
- Han, H. Research on Selection and Variant Design of Centrifugal Fan. Ph.D. Thesis, Huazhong University of Science and Technology, Wuhan, China, 2004. Available online: https://kns.cnki.net/kns8s/ (accessed on 30 November 2025). (In Chinese)
- Assareh, E.; Hoseinzadeh, S.; Agarwal, S. Assessment of a wind energy installation for powering a residential building in Rome, Italy: Incorporating wind turbines, compressed air energy storage, and a compression chiller based on a machine learning model. Energy 2025, 320, 135083. [Google Scholar] [CrossRef]
- Stergaard, P.A.; Duic, N.; Kalogirou, S. Sustainable development using integrated energy systems and solar, biomass, wind, and wave technology. Renew. Energy 2024, 235, 121359. [Google Scholar] [CrossRef]
- Urošević, K.; Gligorić, Z.; Janković, I.; Gluščević, B.; Beljić, Č. Simulation of MCDM Process—Stope and Fan Pattern Selection in an Underground Mine with Uncertainty. Mathematics 2025, 13, 786. [Google Scholar] [CrossRef]
- Xue, J.; Yip, T.; Wu, B.; Wu, C.; van Gelder, P.H.A.J.M. A novel fuzzy Bayesian network-based MADM model for offshore wind turbine selection in busy waterways: An application to a case in China. Renew. Energy 2021, 172, 897–917. [Google Scholar] [CrossRef]
- Yu, Y.; Wu, S.; Yu, J.; Xu, Y.; Song, L.; Xu, W. A hybrid multi-criteria decision-making framework for offshore wind turbine selection: A case study in China. Appl. Energy 2022, 328, 120173. [Google Scholar] [CrossRef]
- Xue, J.; Yang, H.; Song, Y.; Zhang, C.; Hu, H. A fuzzy decision-making network model for offshore wind turbine selection based on simulated annealing algorithm. Ocean Eng. 2025, 315, 119816. [Google Scholar] [CrossRef]
- Kursunoglu, N.; Onder, M. Selection of an appropriate fan for an underground coal mine using the Analytic Hierarchy Process. Tunn. Undergr. Space Technol. 2015, 48, 101–109. [Google Scholar] [CrossRef]
- Gualtieri, G. A novel method for wind farm layout optimization based on wind turbine selection. Energy Convers. Manag. 2019, 193, 106–123. [Google Scholar] [CrossRef]
- Zhao, J.; Liu, Y.; Tu, Z. A novel flexible load regulation and 4E-F multi-objective optimization for distributed renewable energy power generation system. Appl. Energy 2025, 383, 125410. [Google Scholar] [CrossRef]
- Zhou, J.; Zhao, M.; Zhu, Y. Collaborative optimization of vehicle and charging scheduling for mixed bus systems considering charging load balance. Appl. Energy 2025, 384, 125457. [Google Scholar] [CrossRef]
- Bakırcıoğlu, V.; Jond, B.H.; Yilmaz, F. Multi-Objective optimization and thermodynamic analysis of a supercritical CO2 Brayton cycle in a solar-powered multigeneration plant for net-zero emission goals. Energy Convers. Manag. 2025, 328, 119628. [Google Scholar] [CrossRef]
- Zhen, J.; Li, W.; Zhu, N. Primary fan test and energy saving retrofit. Therm. Power Gener. 2014, 43, 149–152. (In Chinese) [Google Scholar]
- Shu, C.; Wei, Y.; Liao, Y. Influence of parameters of oilseed rape pneumatic seed discharge system on its negative pressure characteristics and fan selection. Trans. Chin. Soc. Agric. Eng. 2016, 32, 26–33. [Google Scholar]
- Carolus, T. Fans Aerodynamic Design-Noise Reduction-Optimization; Springer: Berlin, Germany, 2022; pp. 48–50. [Google Scholar] [CrossRef]
- Wu, Y.; Chen, Q.; Liu, S. Fans and Compressors; Tsinghua University Press: Beijing, China, 2011; pp. 55–58. Available online: https://www.tup.tsinghua.edu.cn/booksCenter/book_04491901.html (accessed on 30 November 2025). (In Chinese)
- Cerek, K.; Hadjiloo, E.; Grabe, J. Optimization of Drag Embedment Anchors Applying Multi-Objective Evolutionary Algorithm NSGA-II. J. Ocean Eng. Sci. 2025, 10, 1019–1030. [Google Scholar] [CrossRef]
- Zhang, L.; Wang, J.; Jiao, H. Economical sizing and configuration optimization of floating offshore photovoltaic system using NSGA-II. Ocean Eng. 2025, 328, 120836. [Google Scholar] [CrossRef]
- Shang, T.; Wang, L.; Hu, Y.; Wu, H.; Huang, K.; Liu, H.; Yue, T. Research on Similarity Design Criteria for Flight Control Law Parameters of Supersonic Aircraft Scaled Models. Acta Aeronaut. Astronaut. Sin. 2025, 46, 531885. [Google Scholar]
- Zuo, X.; Wang, L.; Liu, J.; Hu, Y.; Chai, X.; He, Q. Prediction of longitudinal Category I PIO of full-size aircraft based on a scaled model. J. Beijing Univ. Aeronaut. Astronaut. 2021, 47, 2297–2310. [Google Scholar]
- Beijing University of Aeronautics and Astronautics. Optimal Efficiency Multi-Parameter Collaborative Dimensionless Fan Selection Software; (Version 1.0) [Computer software]; Registration No. 2025SR1382766; Beijing University of Aeronautics and Astronautics: Beijing, China, 2025. [Google Scholar]


Disclaimer/Publisher’s Note: The statements, opinions and data contained in all publications are solely those of the individual author(s) and contributor(s) and not of MDPI and/or the editor(s). MDPI and/or the editor(s) disclaim responsibility for any injury to people or property resulting from any ideas, methods, instructions or products referred to in the content. |
© 2026 by the authors. Licensee MDPI, Basel, Switzerland. This article is an open access article distributed under the terms and conditions of the Creative Commons Attribution (CC BY) license.