1. Introduction
Injection molding is a widely adopted manufacturing process for producing complex plastic components with high precision and efficiency [
1]. Various process parameters significantly influence the quality of injection-molded parts, among which cavity pressure plays a pivotal role [
2].
According to Chen et al. [
3], the quality of a molded part varies depending on the barrel and mold temperature, injection pressure, injection speed, V/P switchover point, holding pressure, holding time, cooling rate, and plasticization parameters (back pressure and screw speed). Ideally, molding conditions should be monitored to evaluate the relationship between process and quality and define an optimization strategy [
4].
Studies have demonstrated the practical applications of cavity pressure monitoring in diagnosing process failures and optimizing molding conditions. Gim and Rhee developed a machine learning methodology to analyze cavity pressure profiles, providing insights into the relationship between pressure variations and part quality [
4]. Similarly, Araújo et al. [
5] investigated using in-cavity pressure measurements to identify defects such as burn marks and short shots, establishing a correlation between pressure profiles and specific molding issues.
The real-time monitoring and control of cavity pressure are critical factors in optimizing the injection molding process, enhancing product quality and operational efficiency [
5]. Integrating in-mold sensors, particularly cavity pressure sensors, has become vital for precise process control. These sensors provide real-time data on the pressure conditions within the mold cavity, enabling the detection of anomalies and facilitating immediate corrective actions. For instance, a comprehensive review by Ageyeva et al. highlights the advancements in in-mold sensor technologies and their significance in aligning injection molding practices with Industry 4.0 standards [
6].
Implementing multiple in-mold sensors has also been explored to enhance quality control in injection molding. Research by Párizs et al. [
7] demonstrated that optimizing clamping force, switchover points, and holding time based on pressure data from multi-cavity molds can significantly improve product consistency. Meanwhile, Lee et al. [
8] show how different process conditions, such as melting temperature, injection velocity, and switchover point, can directly affect the viscosity index of the material and, as a result, the injected part weight.
Advancements in sensor technologies have facilitated more sophisticated monitoring approaches [
9,
10]. For example, integrating sensors in various locations such as the injection barrel, nozzle, and mold cavity allows for comprehensive data collection on melt pressure, allowing a more detailed analysis of the injection process [
11]. Developing self-optimizing injection molding systems based on iterative learning cavity pressure control has also demonstrated potential in improving process flexibility and performance [
12].
Iterative Learning Control (ILC) is a control method specifically developed for systems that perform the same task repeatedly within a defined time frame [
13]. Originally proposed to enhance performance in robotic trajectory tracking, ILC has since found successful applications in various cyclic industrial processes, such as injection molding, semiconductor manufacturing, and batch chemical processing.
Injection molding involves highly repeatable cycles, making it an ideal application for Iterative Learning Control (ILC). This advanced algorithm uses data from previous cycles to improve performance in the next one. Specifically, key process parameters like injection velocity, holding pressure, and switchover timing can be fine-tuned cycle-by-cycle. This precise control is used to minimize part dimensional deviations and inconsistencies in the cavity pressure profile. By incorporating sensor cavity pressure data into the learning loop, the process becomes increasingly robust to material and machine variations, eliminating the need for an explicit system model. Recent advances in ILC theory have introduced norm-optimal and model-based variants, allowing integration with system constraints, state-space representations, and predictive control frameworks. These developments significantly enhance the convergence properties and robustness of the algorithm, especially in nonlinear or time-varying systems, which are common in polymer processing [
14,
15,
16,
17,
18,
19].
Recent research highlights the effectiveness of iterative and adaptive approaches in injection molding optimization. Kriesi et al. validated fast, iterative prototyping cycles in mold development, allowing successive refinement of design and processing conditions to shorten lead time and enhance manufacturability [
13]. For instance, Kariminejad et al. demonstrated that iterative, real-time parameter tuning using Bayesian Adaptive Design of Experiments (ADoE) significantly reduces the number of required trials while improving part quality and stability, effectively integrating data from sensor feedback into the optimization loop [
20]. Similarly, Villarreal-Marroquín et al. proposed a multicriteria simulation-based approach where iterative simulations converge on optimal process windows by balancing several quality indicators, thus emphasizing the value of learning through successive data-driven iterations [
21].
Moreover, Yuan applied an iterative evolutionary algorithm (genetic algorithm) for multiobjective optimization, showcasing how a looped feedback mechanism can navigate complex trade-offs between part shrinkage, warpage, and cycle time [
22]. Complementarily, Ghadoui et al. proposed a hybrid optimization strategy combining neural networks with genetic algorithms, employing iterative learning to model nonlinear relationships and refine parameters progressively [
23]. These approaches collectively illustrate that embedding iterative learning into sensor-driven process control enhances responsiveness and precision in parameter adjustment and aligns with intelligent manufacturing strategies emphasizing adaptability and continuous improvement.
In conclusion, although prior research has demonstrated the advantages of incorporating cavity pressure sensors in injection molding—ranging from improved quality prediction and adaptive control to AI- and IoT-driven optimization within Industry 4.0 frameworks [
24,
25,
26]—the present study introduces a novel dual contribution by combining real-time pressure monitoring with an Iterative Learning Control (ILC) methodology. Unlike existing approaches that often depend on multi-sensor networks, static optimization strategies, or complex external architectures [
27,
28,
29,
30], this work demonstrates that a single, strategically positioned cavity pressure sensor, when coupled with real-time pressure feedback and gradual holding pressure adaptation, can yield high-dimensional accuracy, efficient shrinkage compensation, and reduced cycle time [
31,
32]. The ILC framework significantly enhances process performance by enabling dynamic, cycle-to-cycle learning, allowing the system to refine key process variables based on previous outcomes iteratively. This iterative adjustment mechanism offers a structured and cost-effective alternative to more data-intensive AI-based systems, enhancing process consistency and robustness without requiring high computational overhead. By integrating sensor-based monitoring with learning-based control, this study extends the scope of scientific molding [
31,
32,
33,
34]. It reaffirms the importance of using real-time PVT control methods presented by Chang et al. [
35] within a new paradigm of self-correcting, precision-oriented manufacturing.
2. Methodology and Experimental Procedure
2.1. Cavity Pressure Profiles
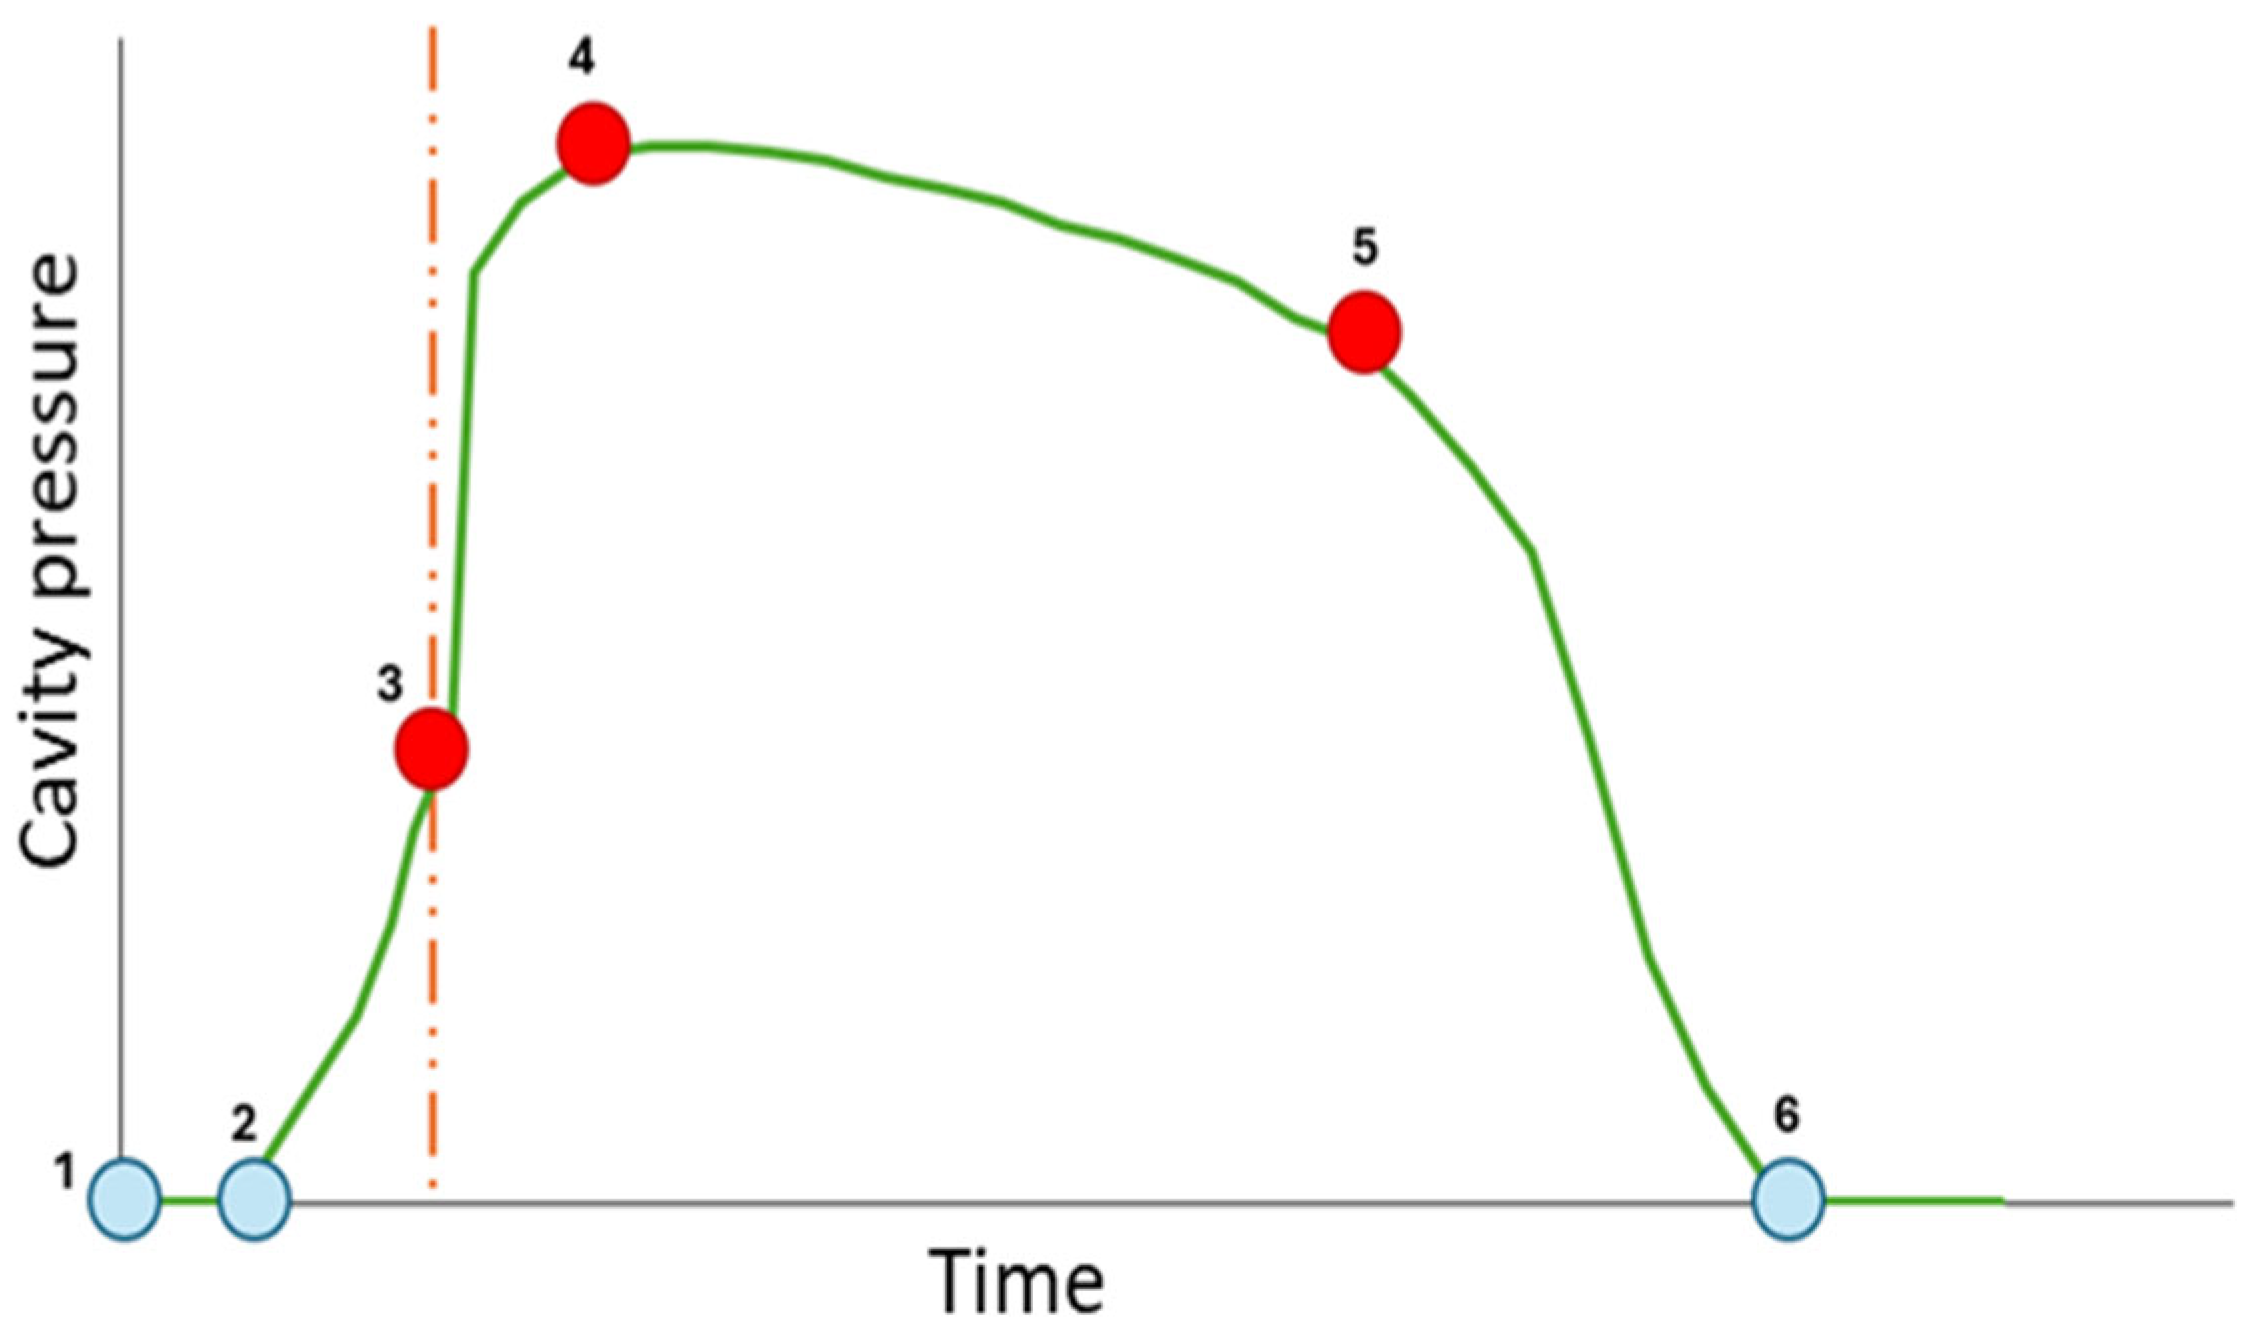
The typical pressure behavior observed by reading inside the cavity during the injection process is generally divided into different phases.
Figure 1 shows the progression of the pressure reading over time.
Points 1 to 3 correspond to the filling phase, where the molten plastic is injected to fill the cavity with the corresponding shape. At point 1, the injection has begun, but the plastic has not yet reached the sensor area. From points 2 to 3, the filling of the cavity is illustrated, explaining the gradual increase in pressure until the cavity is filled. Point 3 is considered the ideal point for the V/P transition; the dashed line indicates the critical moment at which the control mode transitions from velocity to pressure. This point marks the end of the filling phase and the beginning of the packing phase, and its precise adjustment is essential for ensuring product quality. At point 4, the maximum pressure value in the cavity is reached, indicating that material compression occurs at this point. From point 4 to point 5, the holding phase takes place. The cooling phase, during which the part solidifies, happens from 5 to 6. At point 5, the material solidifies at the gate, and pressure application ceases. At point 6, the pressure is reduced to a minimum, reaching zero, indicating that the part is no longer in contact with the mold walls and is therefore ejected.
2.2. Iterative Learning Control Methodology
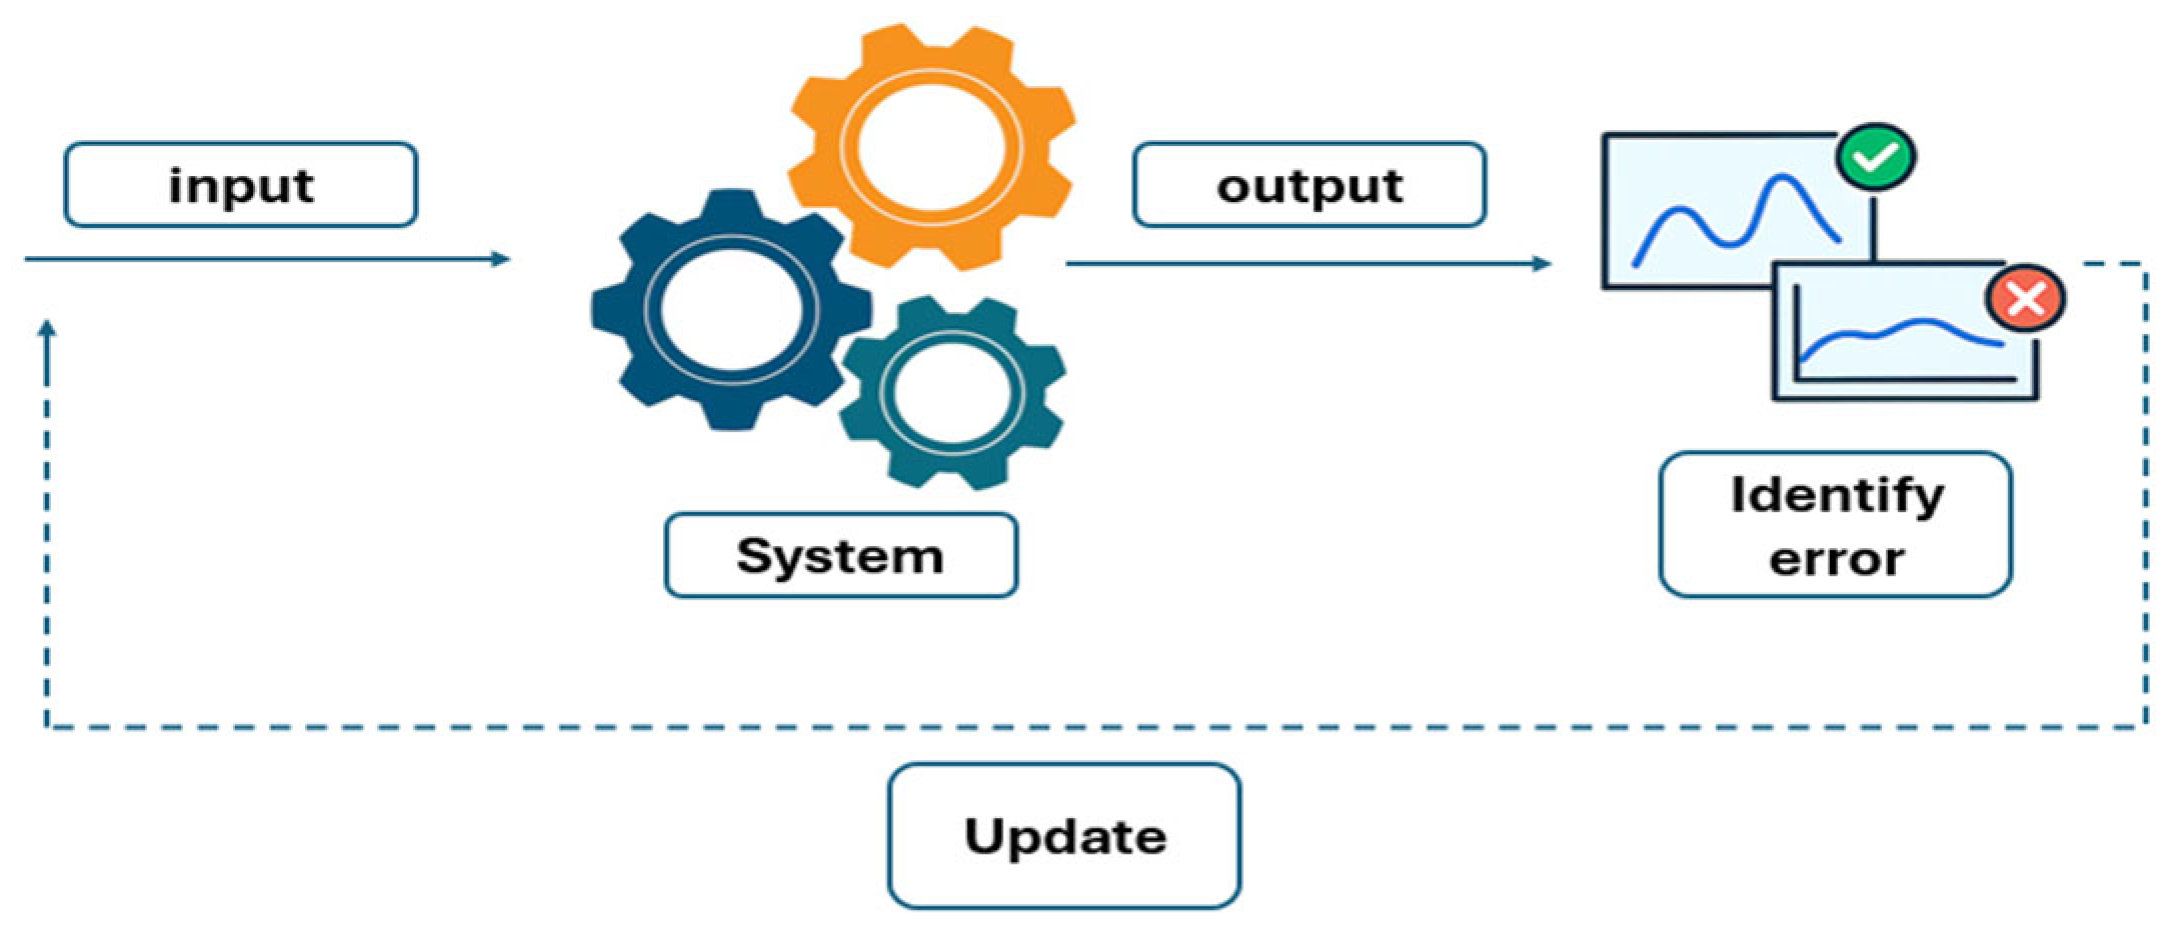
Unlike traditional feedback control methods that respond to real-time disturbances, ILC operates by leveraging information from previous executions (trials) to improve the control input in future iterations. This learning mechanism is particularly effective in deterministic and repetitive systems where the primary disturbances are consistent across cycles. The standard ILC update law can be formulated as
where
(
t) is the control input at cycle
k, including parameters such as injection speed, holding pressure, and switchover timing;
is the tracking error between the reference trajectory
r(
t) and the actual output
, such as the measured cavity pressure; and
L is the learning gain matrix [
36].
In the industry, the ILC methodology is performed daily by operators when adjustments are made through trial and error on the process or systems, as they observe the output and change the input accordingly [
14].
Figure 2 illustrates the structure of the ILC methodology concept.
Therefore, this study adopted the ILC methodology, which involves making adjustments during production cycles using real-time sensing of in-cavity pressure throughout the injection molding process. Initial process conditions were used as a baseline to record uncontrolled pressure profiles and identify quality-related deviations. These served as input for successive adjustments to process parameters, such as melting temperature, holding pressure, and filling and cooling times, guided by comparison to idealized pressure profiles reported in the literature. With each iteration, improvements were applied, progressively refining the process until convergence was achieved toward a controlled, repeatable pressure profile. This iterative methodology enabled agile optimization, reduced experimental overhead, and ensured strong correlation between pressure data and part quality. The approach aligns with the principles of smart manufacturing, where adaptive control and continuous feedback replace the rigidity of static experimental matrices [
5,
17,
18,
19].
2.3. Equipment Setup and Material
Experimental trials were conducted using an ENGEL DUO 1700 (ENGEL AUSTRIA GmbH, Schwertberg, Austria). Ton injection molding machine to enable real-time sensing and obtain pressure curves during injection, as shown in
Figure 3. The injection mold selected for the tests was a two-cavity mold with a hot runner system, designed specifically for direct injection by HRS Oerlikon. Each cavity was equipped with a Kistler direct-contact pressure sensor (model 6157C, 4 mm diameter) positioned near the central injection point. Mold temperature was precisely regulated using a thermoregulator brand CONAIR to ensure consistent thermal conditions. Pressure data acquisition and monitoring were carried out using the Kistler ComoNEO system, enabling high-resolution capture of in-cavity pressure profiles during each molding cycle.
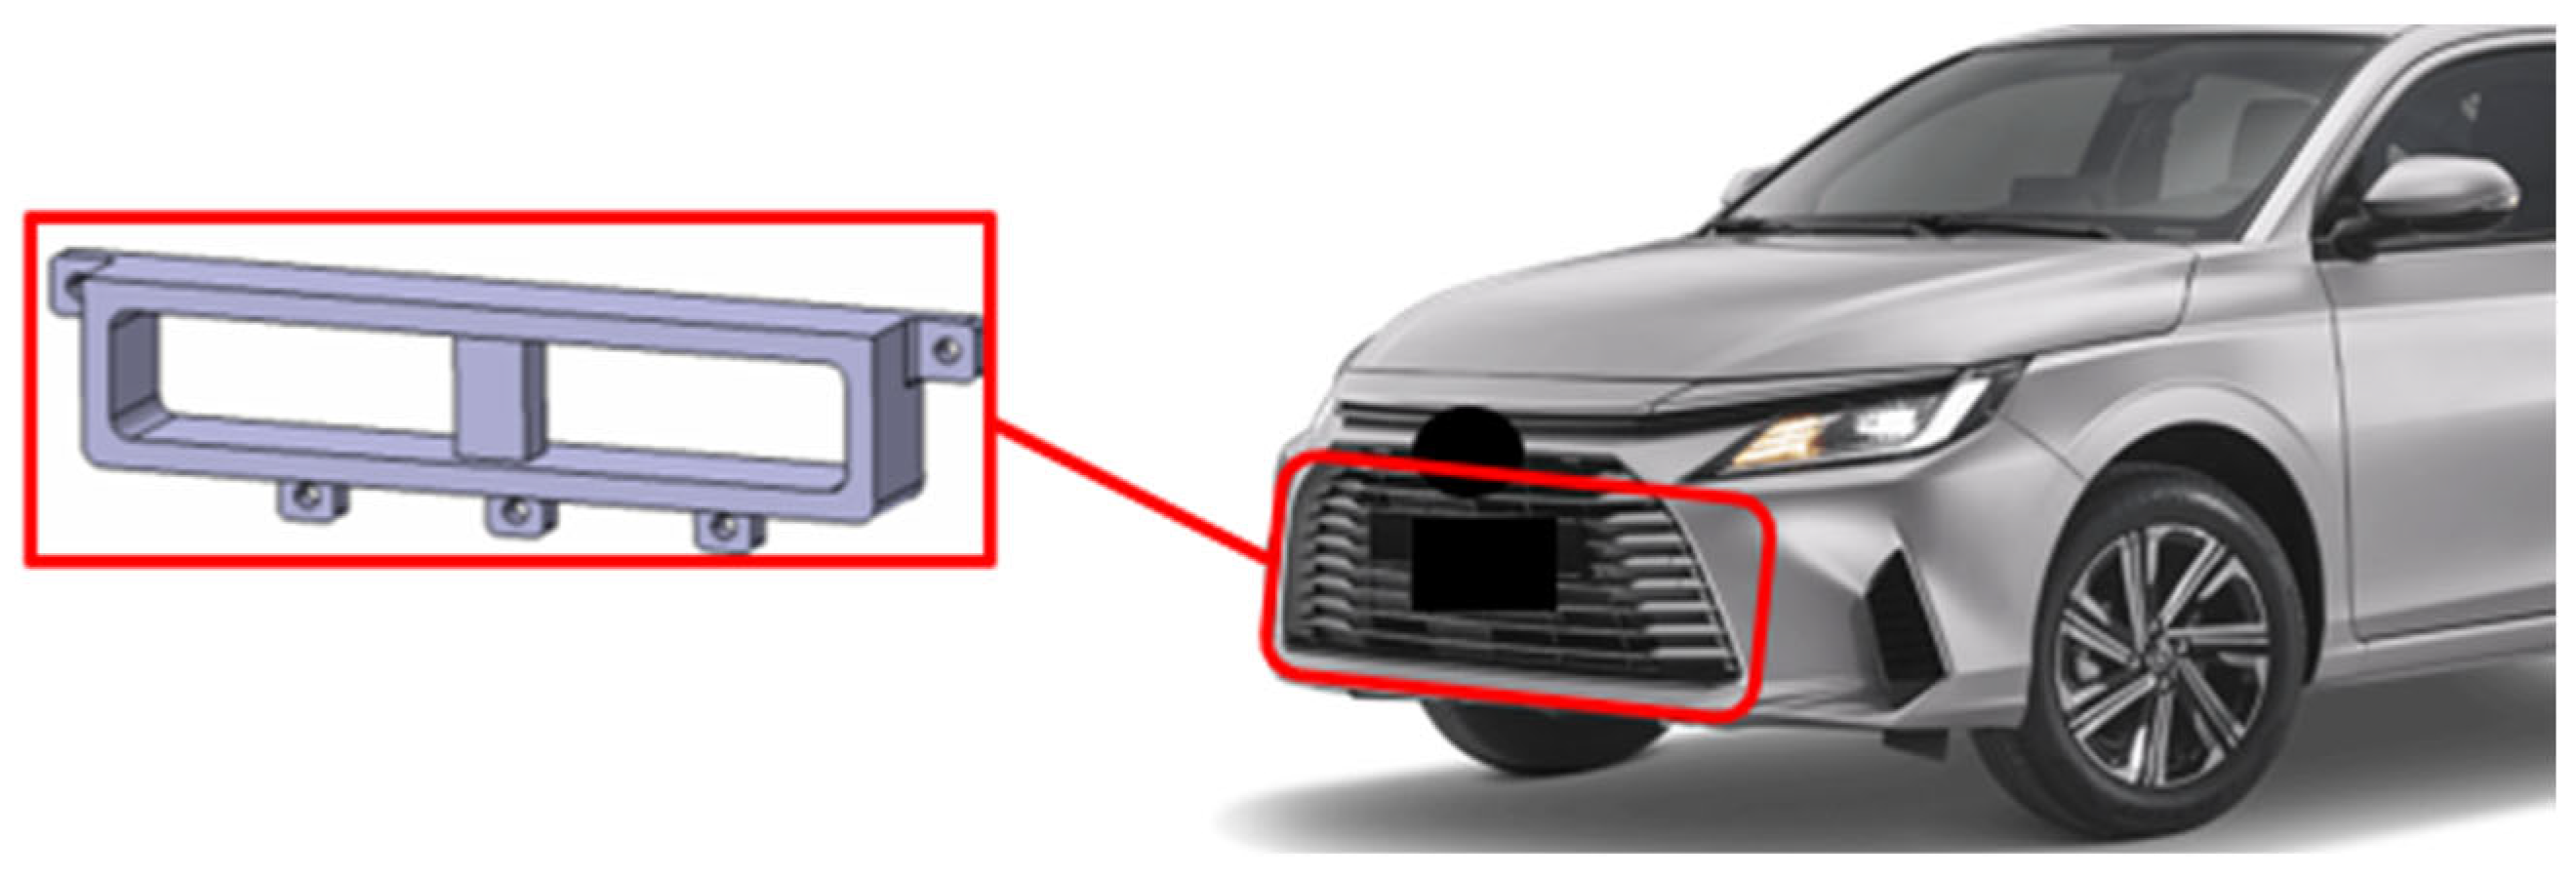
The component produced during the experimental phase is an automotive part functionally equivalent to the one illustrated in
Figure 4. It is an integral element within a vehicle’s engine cooling system assembly, where it is subjected to thermal and mechanical loads during vehicle operation. It measures 957 mm in length, 300 mm in width, and 2.5 mm in thickness. It is primarily fabricated from a composite material of polypropylene (PP) reinforced with 30% of short glass fibers (PPGF30), resulting in a material with an average density of 1.14 g/cm
3.
Polypropylene is a semi-crystalline thermoplastic polymer widely used in the automotive industry due to its low cost, excellent chemical resistance, and ease of processing.
Table 1 presents the mechanical properties of the material, specifically polypropylene reinforced with 30% glass fiber (PP-GF30), providing key parameters relevant to its structural performance.
Cavity pressure sensors were embedded in the mold cavities at key locations to capture high-resolution, in-cycle pressure profiles. These profiles represent the actual process response , which is compared to a predefined optimal reference trajectory r(t), typically obtained from historical cycles with high-quality parts and from simulation-based predictions. As stated before (see Equation (1)), the cycle-to-cycle tracking error is calculated, quantifying the deviation from ideal process behavior and guiding the adjustment of the control input vector. The vector typically includes the injection velocity profile, holding pressure level, holding time duration, switchover point (velocity-to-pressure transition), and mold close and open timings. These parameters are updated at the end of each molding cycle using the computed error, which improves the quality of the molded part in subsequent cycles.
The learning loop continues until the error norm falls below a defined threshold, control inputs stabilize across cycles (), or a maximum number of iterations is reached.
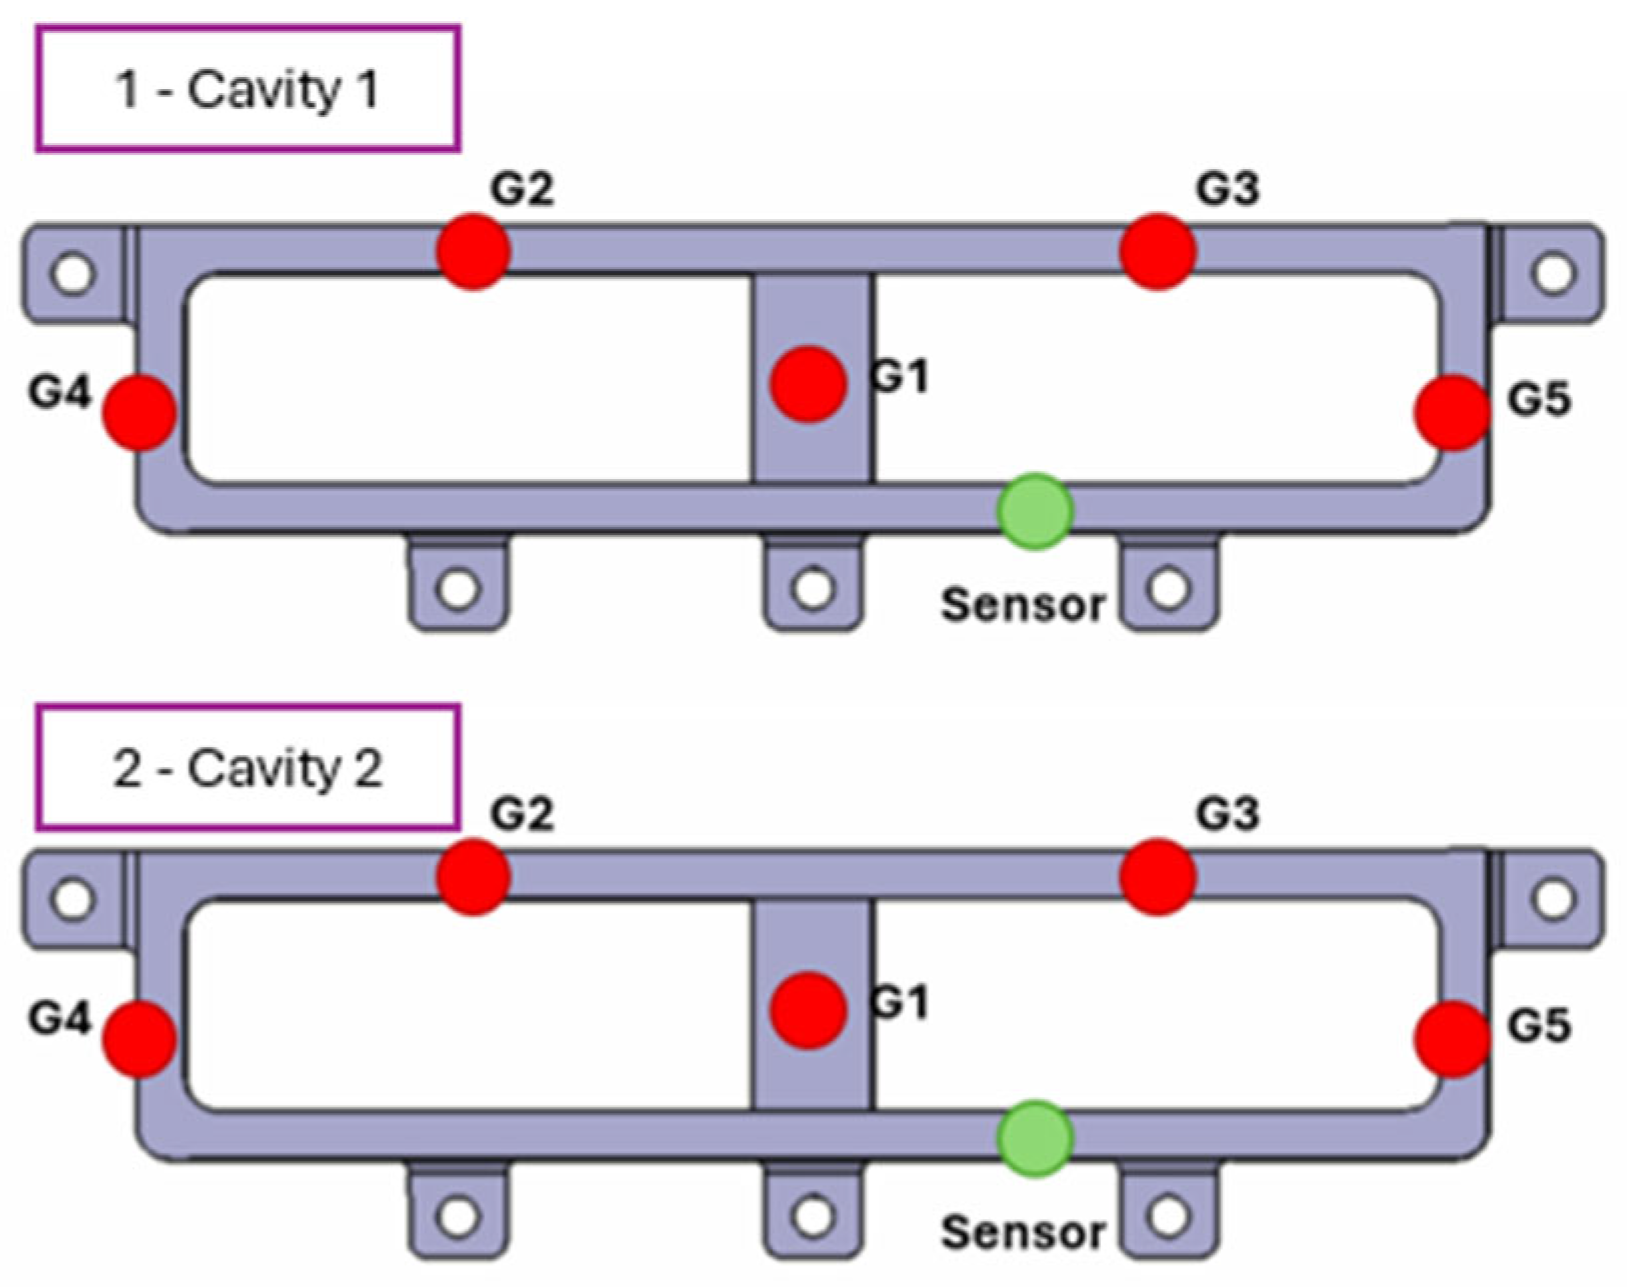
One sensor was strategically integrated into the mold cavity between the central injection gate number 1 (G1) and the last injection gate (G5) to facilitate process monitoring, enabling real-time data acquisition during the injection cycle (see
Figure 5). The decision to use a single cavity pressure sensor is supported by recent studies demonstrating that one sensor can provide sufficient data to effectively monitor, diagnose, and control key aspects of the injection molding process; for example, Gim et al. employed a machine learning model using data from a single sensor to predict part weight and detect potential defects, confirming that limited sensing can still yield high predictive accuracy [
4]. Additionally, Kariminejad et al. demonstrated that data from a single pressure sensor integrated into a Bayesian optimization framework was sufficient to guide real-time adjustments of process parameters [
20]. Collectively, these studies show that one sensor, when strategically located, offers a practical and effective solution for experimental process monitoring, while minimizing complexity and ensuring industrial applicability.
2.4. Numerical Simulation Process
The injection process simulation was conducted during the mold design development phase by using Moldflow. This simulation provides comprehensive insights into the polymer flow behavior within the mold cavity, enabling estimation of mold filling and identification of potential defects such as short shots, weld lines, and sink marks. Furthermore, the analysis evaluates the cooling system’s performance by predicting cooling efficiency, cycle time, thermal gradients, and possible part deformation, such as warpage or deflection, after ejection.
A 3D tetrahedral mesh was employed. The total element count was approximately 140,846, with 12 elements through the thickness. The mesh size was selected following the solver’s recommended criteria, ensuring an average element edge length close to the nominal part thickness.
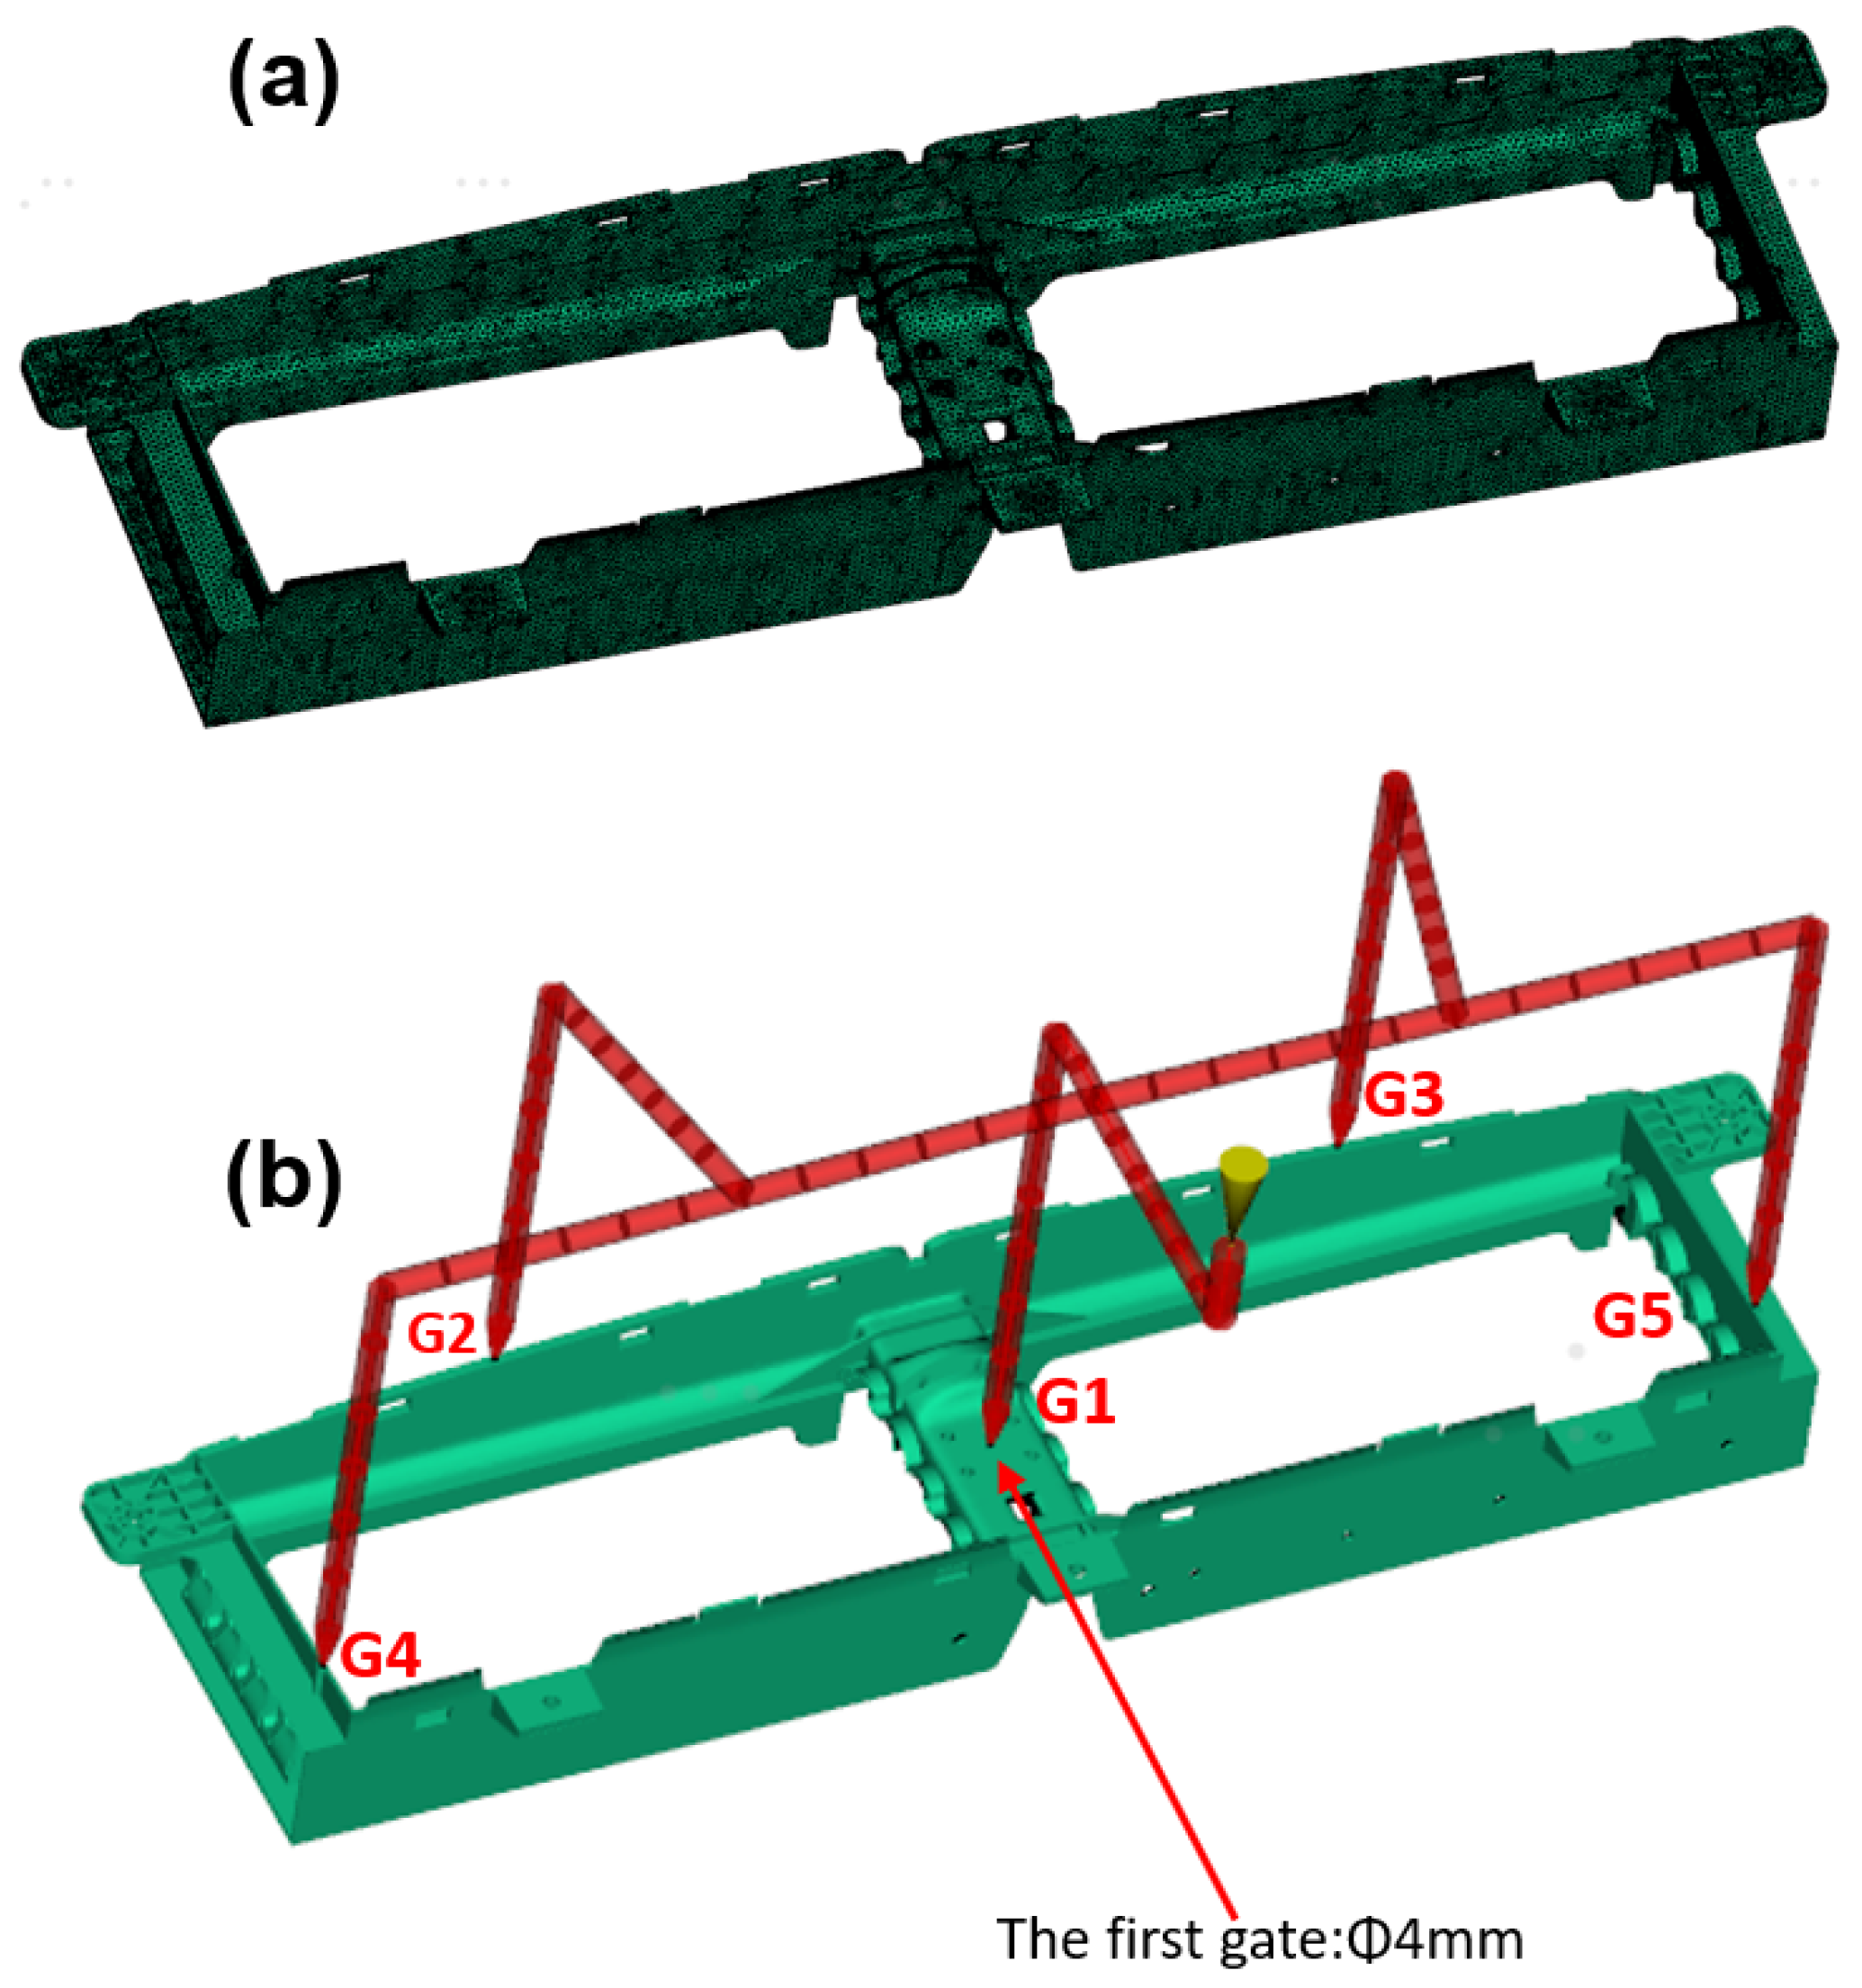
For the hot runner system, a full-round runner with a diameter of 15 mm and a hot sprue of 6 mm, was applied, while secondary gates of 3 mm and a first gate of 4 mm were used. Local mesh refinement was applied in the gate and runner regions to capture pressure drop and flow front dynamics more accurately.
Regarding the mesh independence analysis, in injection molding filling simulations, a systematic mesh refinement study is not always explicitly reported because the numerical discretization error is generally secondary compared to the uncertainties arising from rheological characterization, PVT data, and thermal or machine boundary conditions. Most commercial solvers employ 2.5D formulations based on the Hele–Shaw approximation or stabilized 3D meshing strategies, which significantly reduce the sensitivity of global results to mesh variations, provided that the recommended meshing guidelines are followed [
37,
38].
Nevertheless, to confirm the robustness of the results, a comparative check was performed using a refined mesh. Key performance indicators (filling time, maximum injection pressure, and weld line prediction) showed less than 5% variation between the coarse and refined meshes, indicating that the solution is mesh-independent within the studied range.
Figure 6 shows the complete meshing of the part as a whole (6a), along with the layout of the cavity and runner system (6b), clearly indicating the injection point.
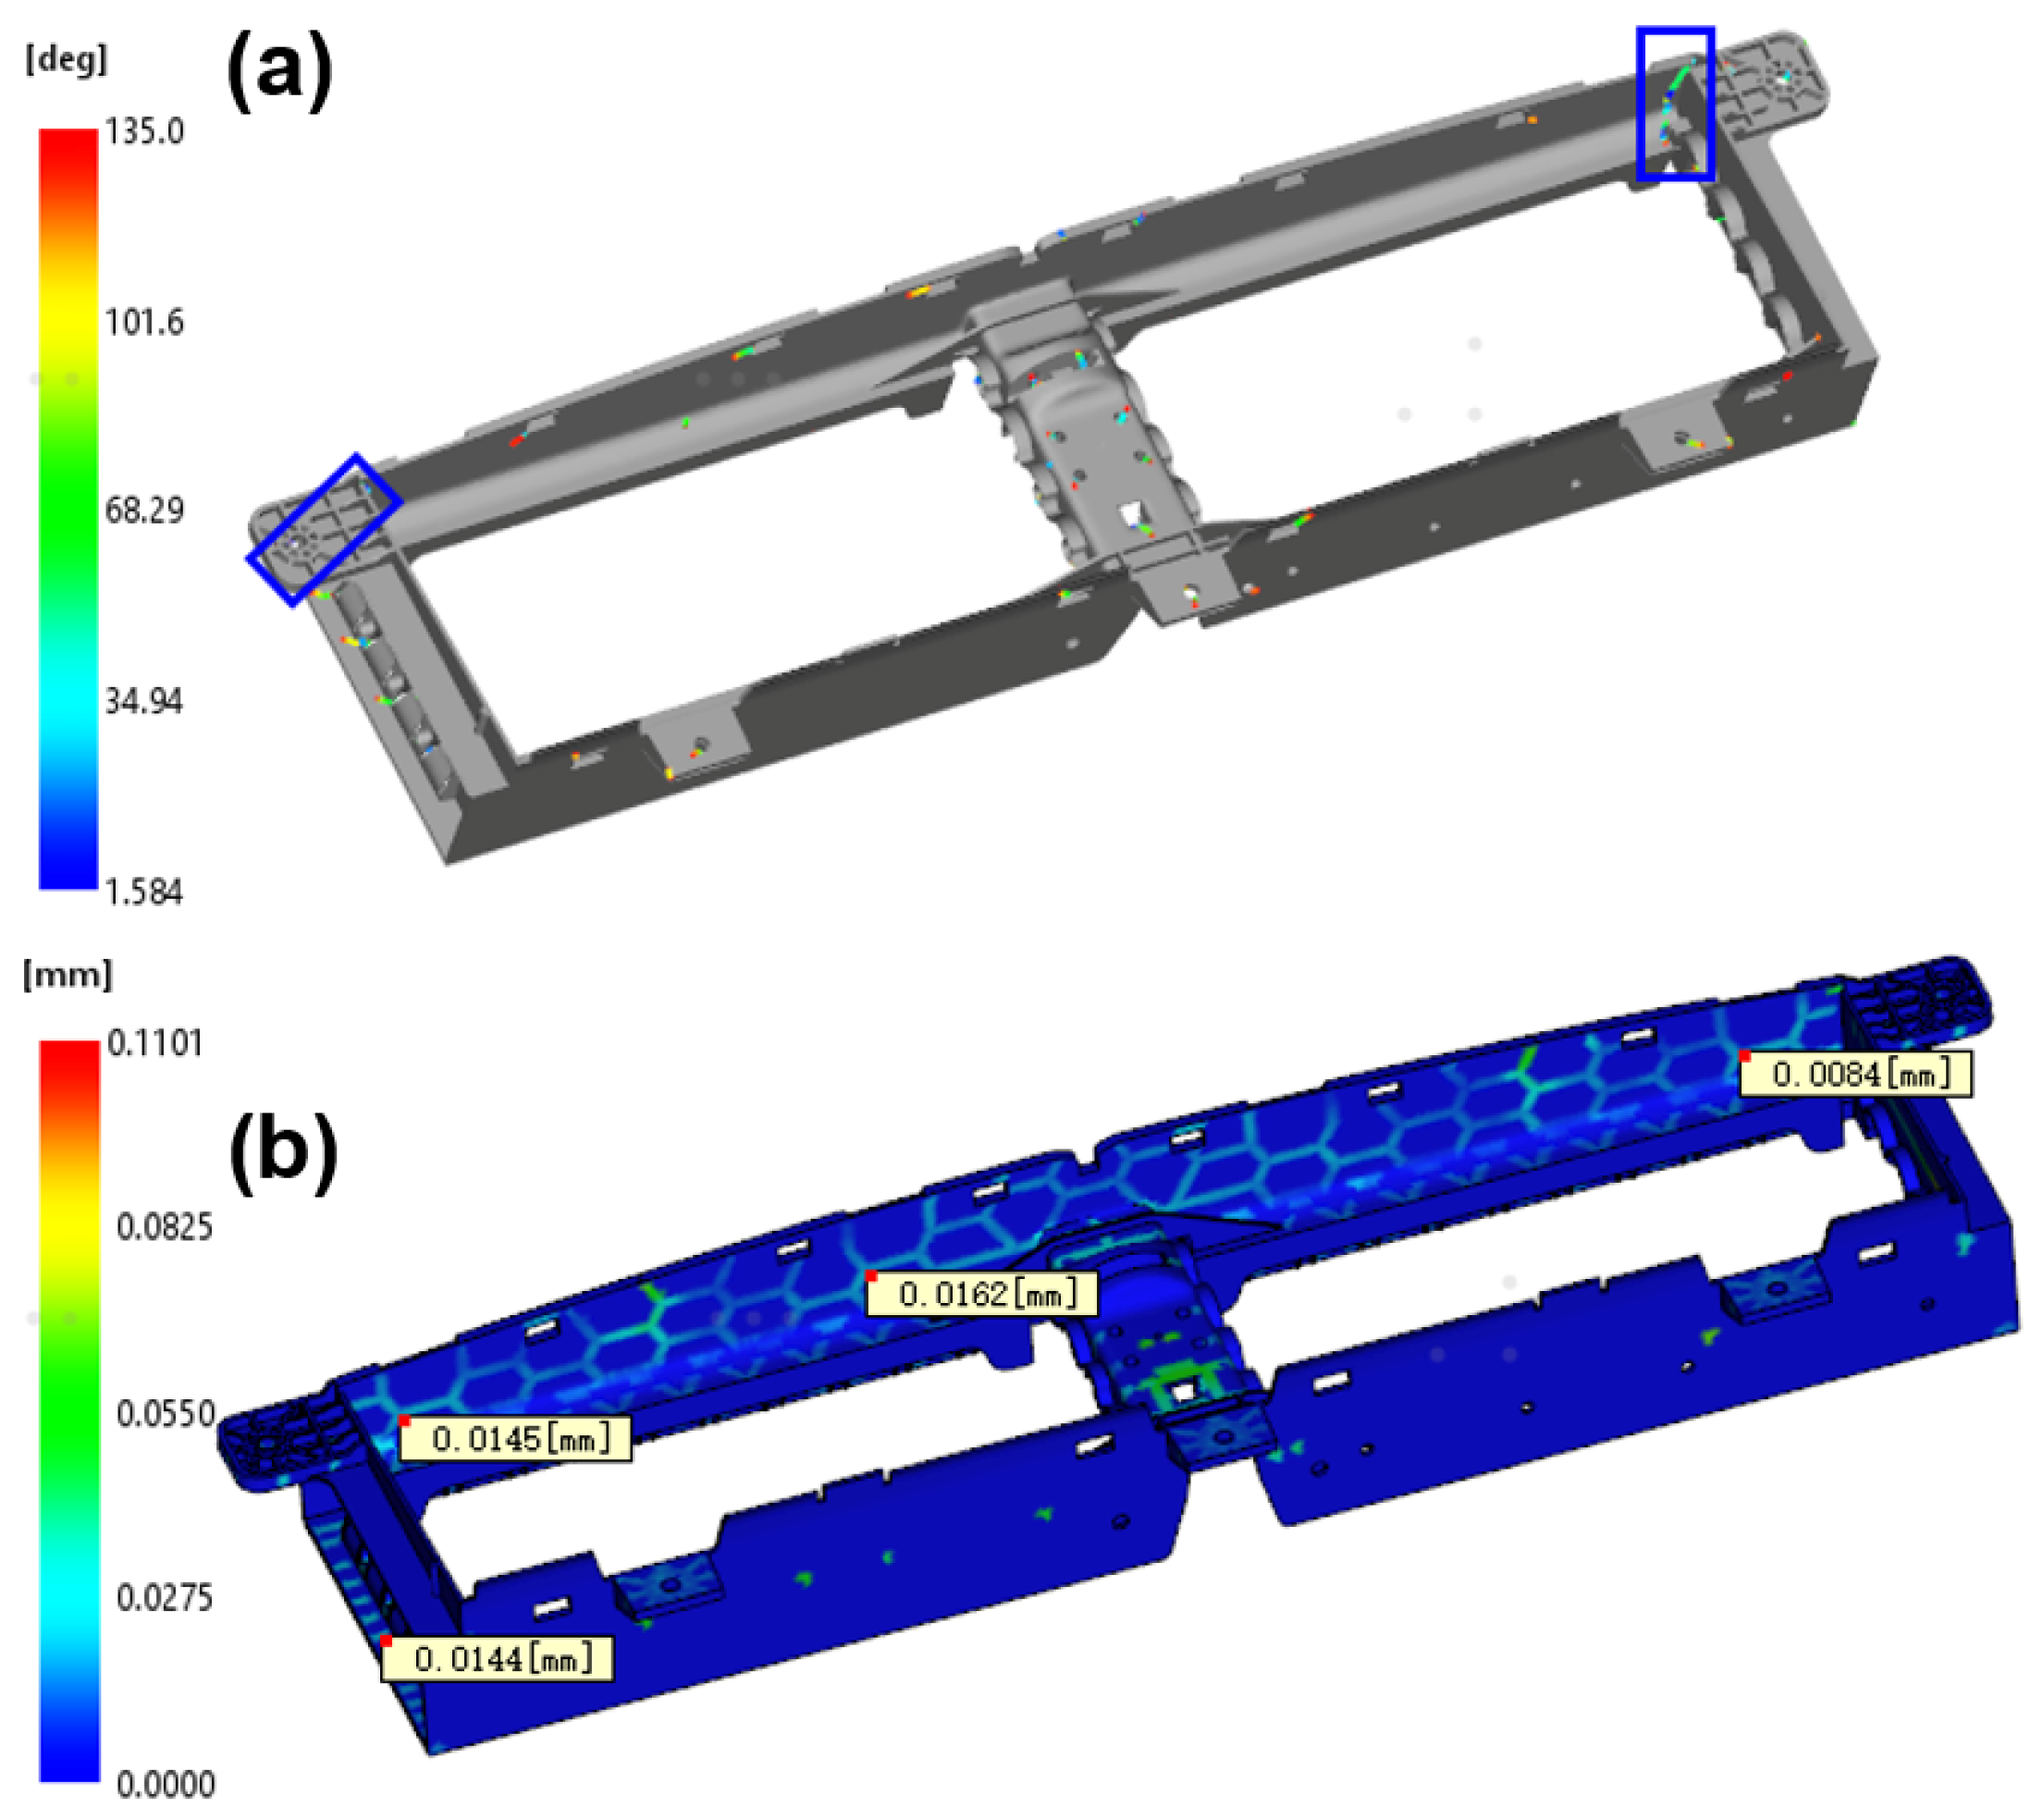
Figure 7 illustrates the predicted weld lines (7a) and sink marks (7b), which offer essential insights into potential quality issues of the part.
The process simulation results include avoiding the defects shown in
Figure 8 and meeting the dimensional requirements of critical measurements. These parameters serve as a reference for the initial experimental setup and process calibration. The simulated process conditions used as a baseline for experimentation are summarized in
Table 2.
2.5. Experimental Procedure
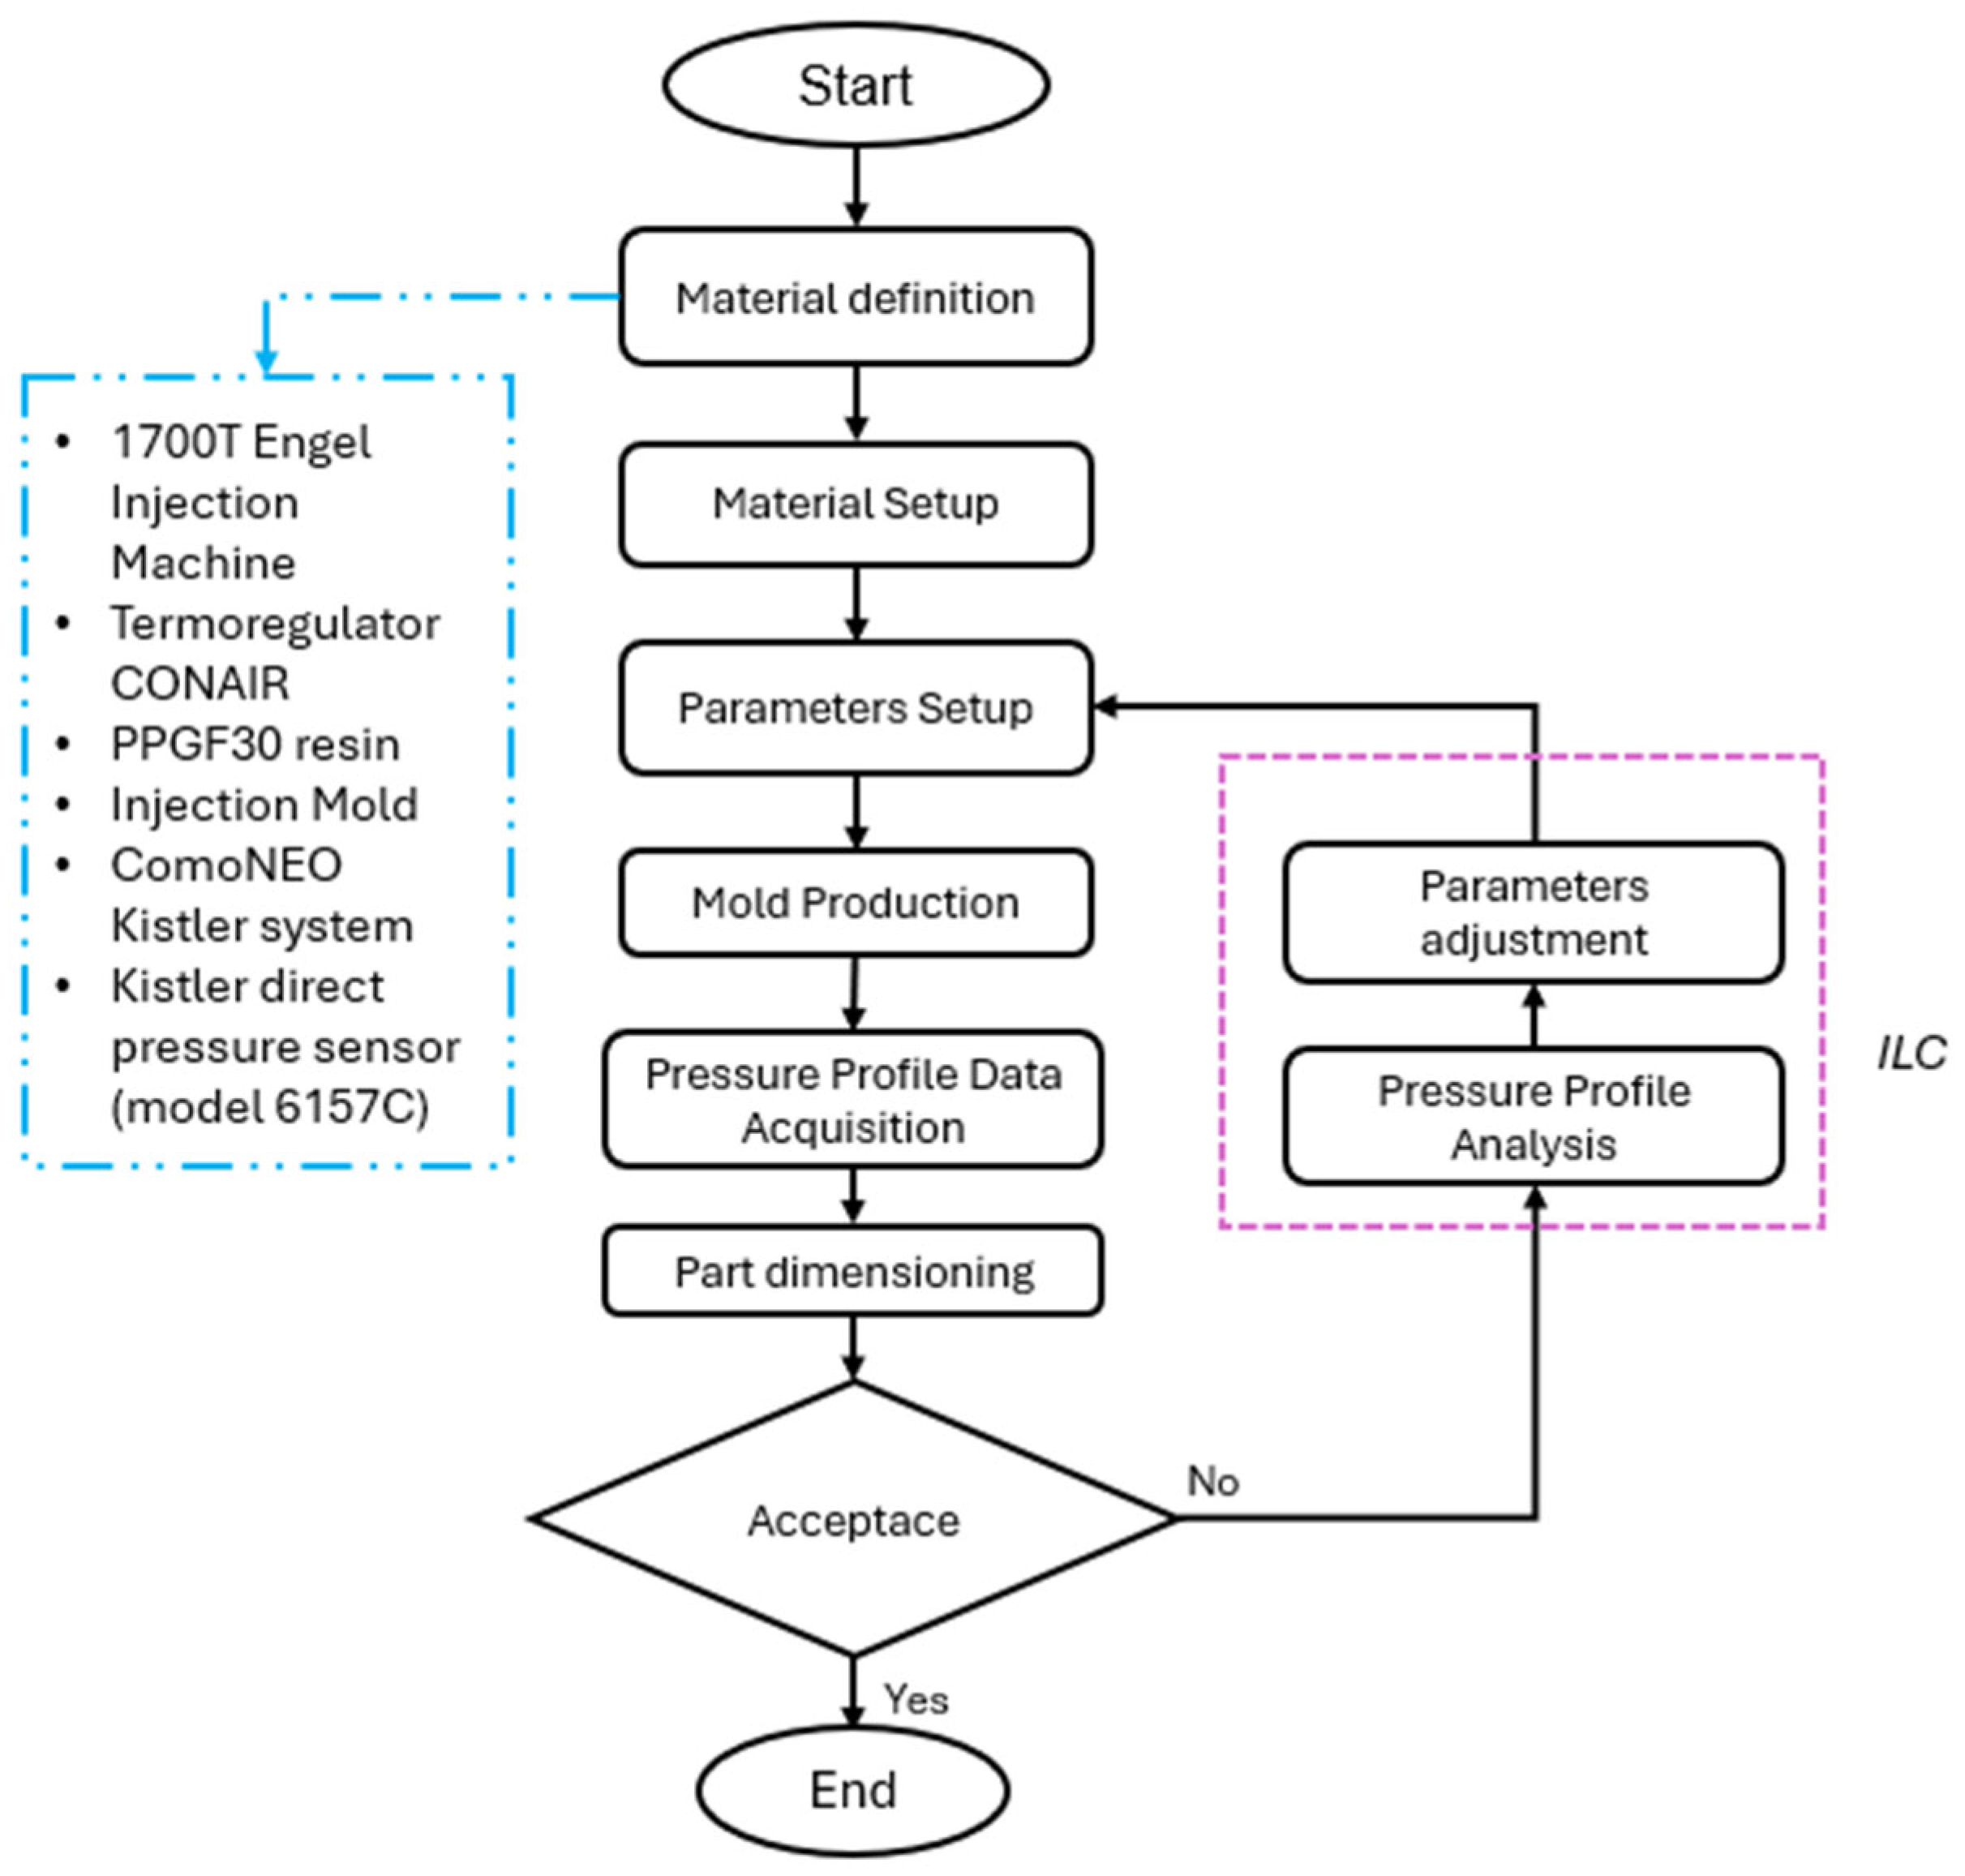
Derived from the use of ILC methodology, this study was conducted in three experimental phases, each aimed at identifying and correcting critical dimensions to improve the quality of the plastic part. The first experiment was conducted using the parameters obtained from the process simulation as initial conditions. This injection was monitored with pressure sensors to obtain the initial pressure curve profile. According to the pressure curve obtained and following the ideal pressure profile reported in the literature (see
Figure 1), injection process conditions were modified to approximate the cavity pressure to the perfect curve. The process flow diagram used in the present research work is shown in
Figure 9.
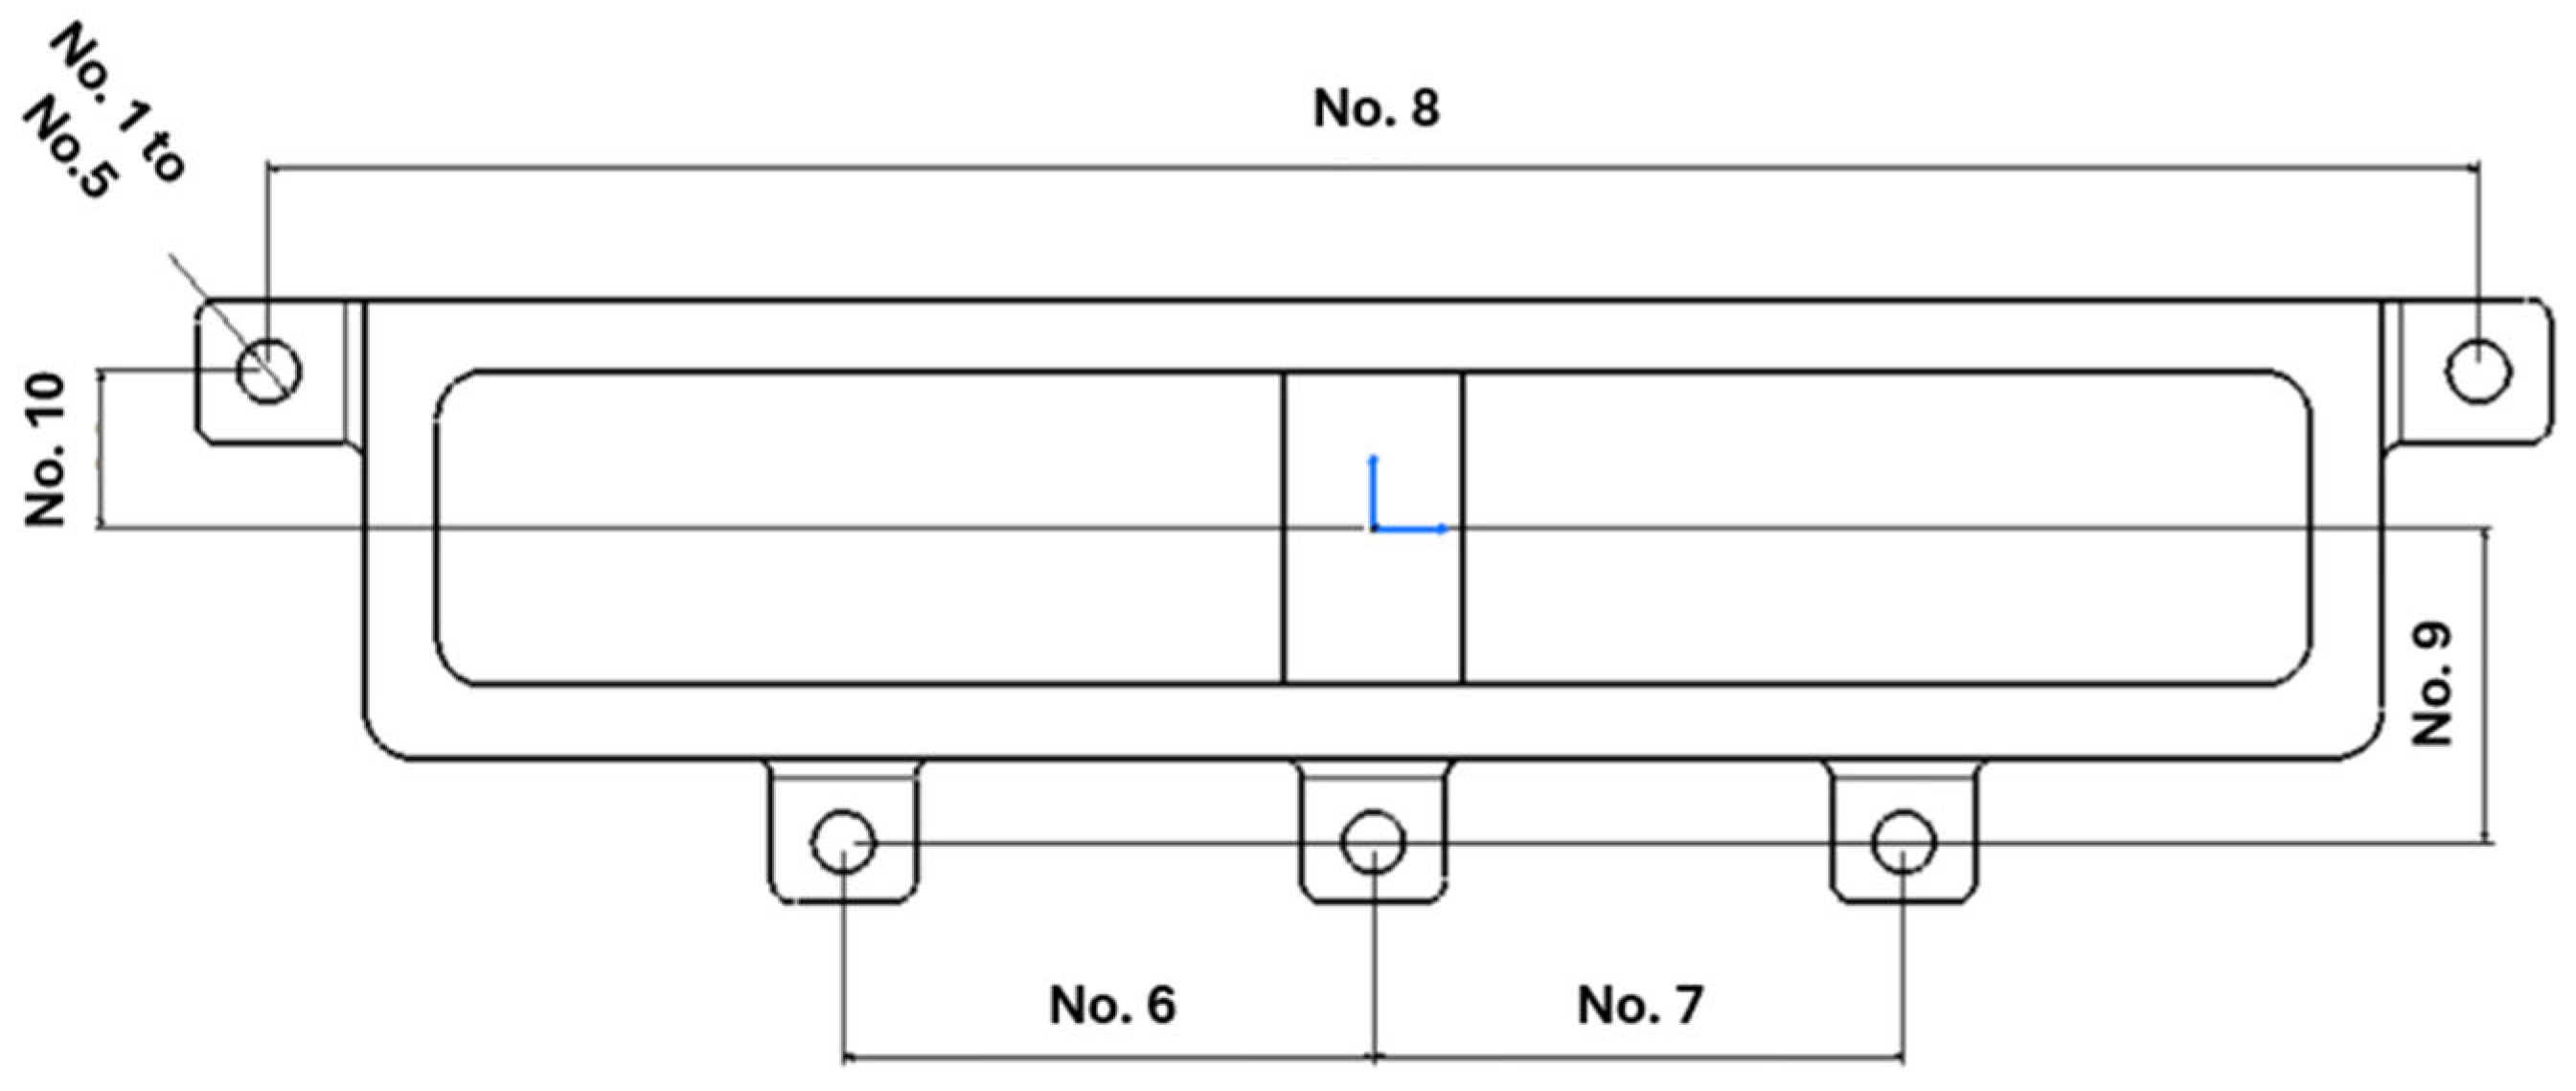
Ten critical measurements on the part were selected according to their importance in functionality. After injecting the first part and obtaining the measurement results, an analysis was conducted to determine the number of dimensions from the ten that met the specified values and the number that were rejected. This procedure was replicated as the process was adjusted in each experiment. A representation of the critical measurements can be seen in
Figure 10, and their values are presented in
Table 3.
The process condition of the second experiment was defined after analyzing the pressure curve from the first experiment and the dimensional report. Since the results of the curve from the first experiment and the part measuring results did not meet expectations, the process parameters were redefined. This action was replicated for the second experiment until the outcome of the third experiment was similar to the ideal injection pressure curve, and the results of the part measurement improved compared to the previous ones. The experimental procedure followed an iterative optimization methodology (ILC), structured around sequential learning cycles. This approach involves conducting an initial experiment based on estimated process parameters, obtained from simulation tools and machine presets, followed by a detailed analysis of the process response using real-time cavity pressure data and dimensional measurements of the molded parts. After each experiment, the process outputs were critically evaluated to identify deviations such as premature switchover, pressure instability, or dimensional non-conformities. These insights were then used to refine the input parameter, thus informing the configuration of the next experimental cycle.
Each iteration functioned as a feedback loop, with the pressure curve profile as a diagnostic and control tool. The latest enabled dynamic learning from previous trials and supported data-driven decision-making for parameter adjustments. The process was repeated until optimal results were achieved regarding pressure stability, cycle time reduction, and dimensional quality.
3. Results and Discussion
Figure 11 presents the cavity pressure profiles recorded during the injection cycle for both cavities of the mold. The curves show a rapid increase in pressure at the start of the cycle, corresponding to the filling phase, followed by a transient peak at approximately 6.5 s. This peak occurs at the switching point, likely caused by the abrupt change from velocity-controlled to pressure-controlled filling when the cavity was nearly complete, resulting in a sudden compression of the melt. After this point, the pressure remains constant between 7 and 14 s; this can result in parts with dimensional defects, presumably due to excessive shrinkage. The holding pressure remained constant throughout the phase, which did not adequately compensate for the plastic contraction that occurred during solidification.
Toward the end of the holding phase, a slight difference between the cavities became evident, with one cavity maintaining a higher residual pressure for a more extended period. This discrepancy may be attributed to asymmetries in flow resistance, thermal imbalances, or premature solidification at the gate in one of the cavities, which can result in unequal packing and density distribution. These findings align with similar observations reported by Araújo et al. [
5], who noted discrepancies between simulated and experimental cavity pressure profiles, particularly during the holding and cooling phases, due to mold wear and material behaviors that are not fully captured in simulations. These issues led to adjustments in holding pressure and, consequently, time, reducing the cycle time from 55 to 52.6 s. Additionally, the results from the measurement showed that six out of ten measures were accepted by meeting the required values, while four were not.
Following the results of the previous experiment, modifications were made to the injection time, speed, and switchover point, resulting in a more stable pressure curve and an additional reduction in cycle time.
In the second experiment, the cavity pressure profiles for both cavities exhibited a more balanced and controlled behavior compared to the first experiment, as shown in
Figure 12. The pressure increased rapidly during the filling phase, without a significant abrupt peak at the switching point, indicating that the transition from velocity- to pressure-controlled filling was smoother and better synchronized, allowing the cavity to be filled. During the packing phase, between approximately 3.5 and 11.5 s, the pressure remained constant at around 250–270 bar in both cavities, suggesting a better compensation for material shrinkage and good dimensional stability. Toward the end of the holding phase, starting at around 11.5 s, the pressure began to decrease as the gates solidified, marking the end of the packing stage. At this point, a slight difference between cavities became evident, with Cavity 1 exhibiting a faster pressure decay than Cavity 2, likely due to earlier gate freeze-off, lower flow resistance, or minor thermal imbalances. Nonetheless, the final pressure decay in both cavities occurred smoothly and synchronously, indicating proper solidification and consistent cooling behavior.
After conducting the dimensional analysis of the produced parts, an improvement was observed in four additional dimensions, resulting in eight items accepted and two items rejected, as shown in
Table 4. However, the holding pressure continued to show constant, non-optimal behavior, indicating the need for further adjustments to approximate the theoretical ideal curve described in the literature. According to Huang et al. [
2], a strong correlation exists between maximum cavity pressure and part consistency, emphasizing the necessity for dynamic control of this variable to achieve dimensional stability. These results demonstrate an improved process stability and cavity balance relative to the first experiment, which should lead to enhanced part quality and less dimensional variation.
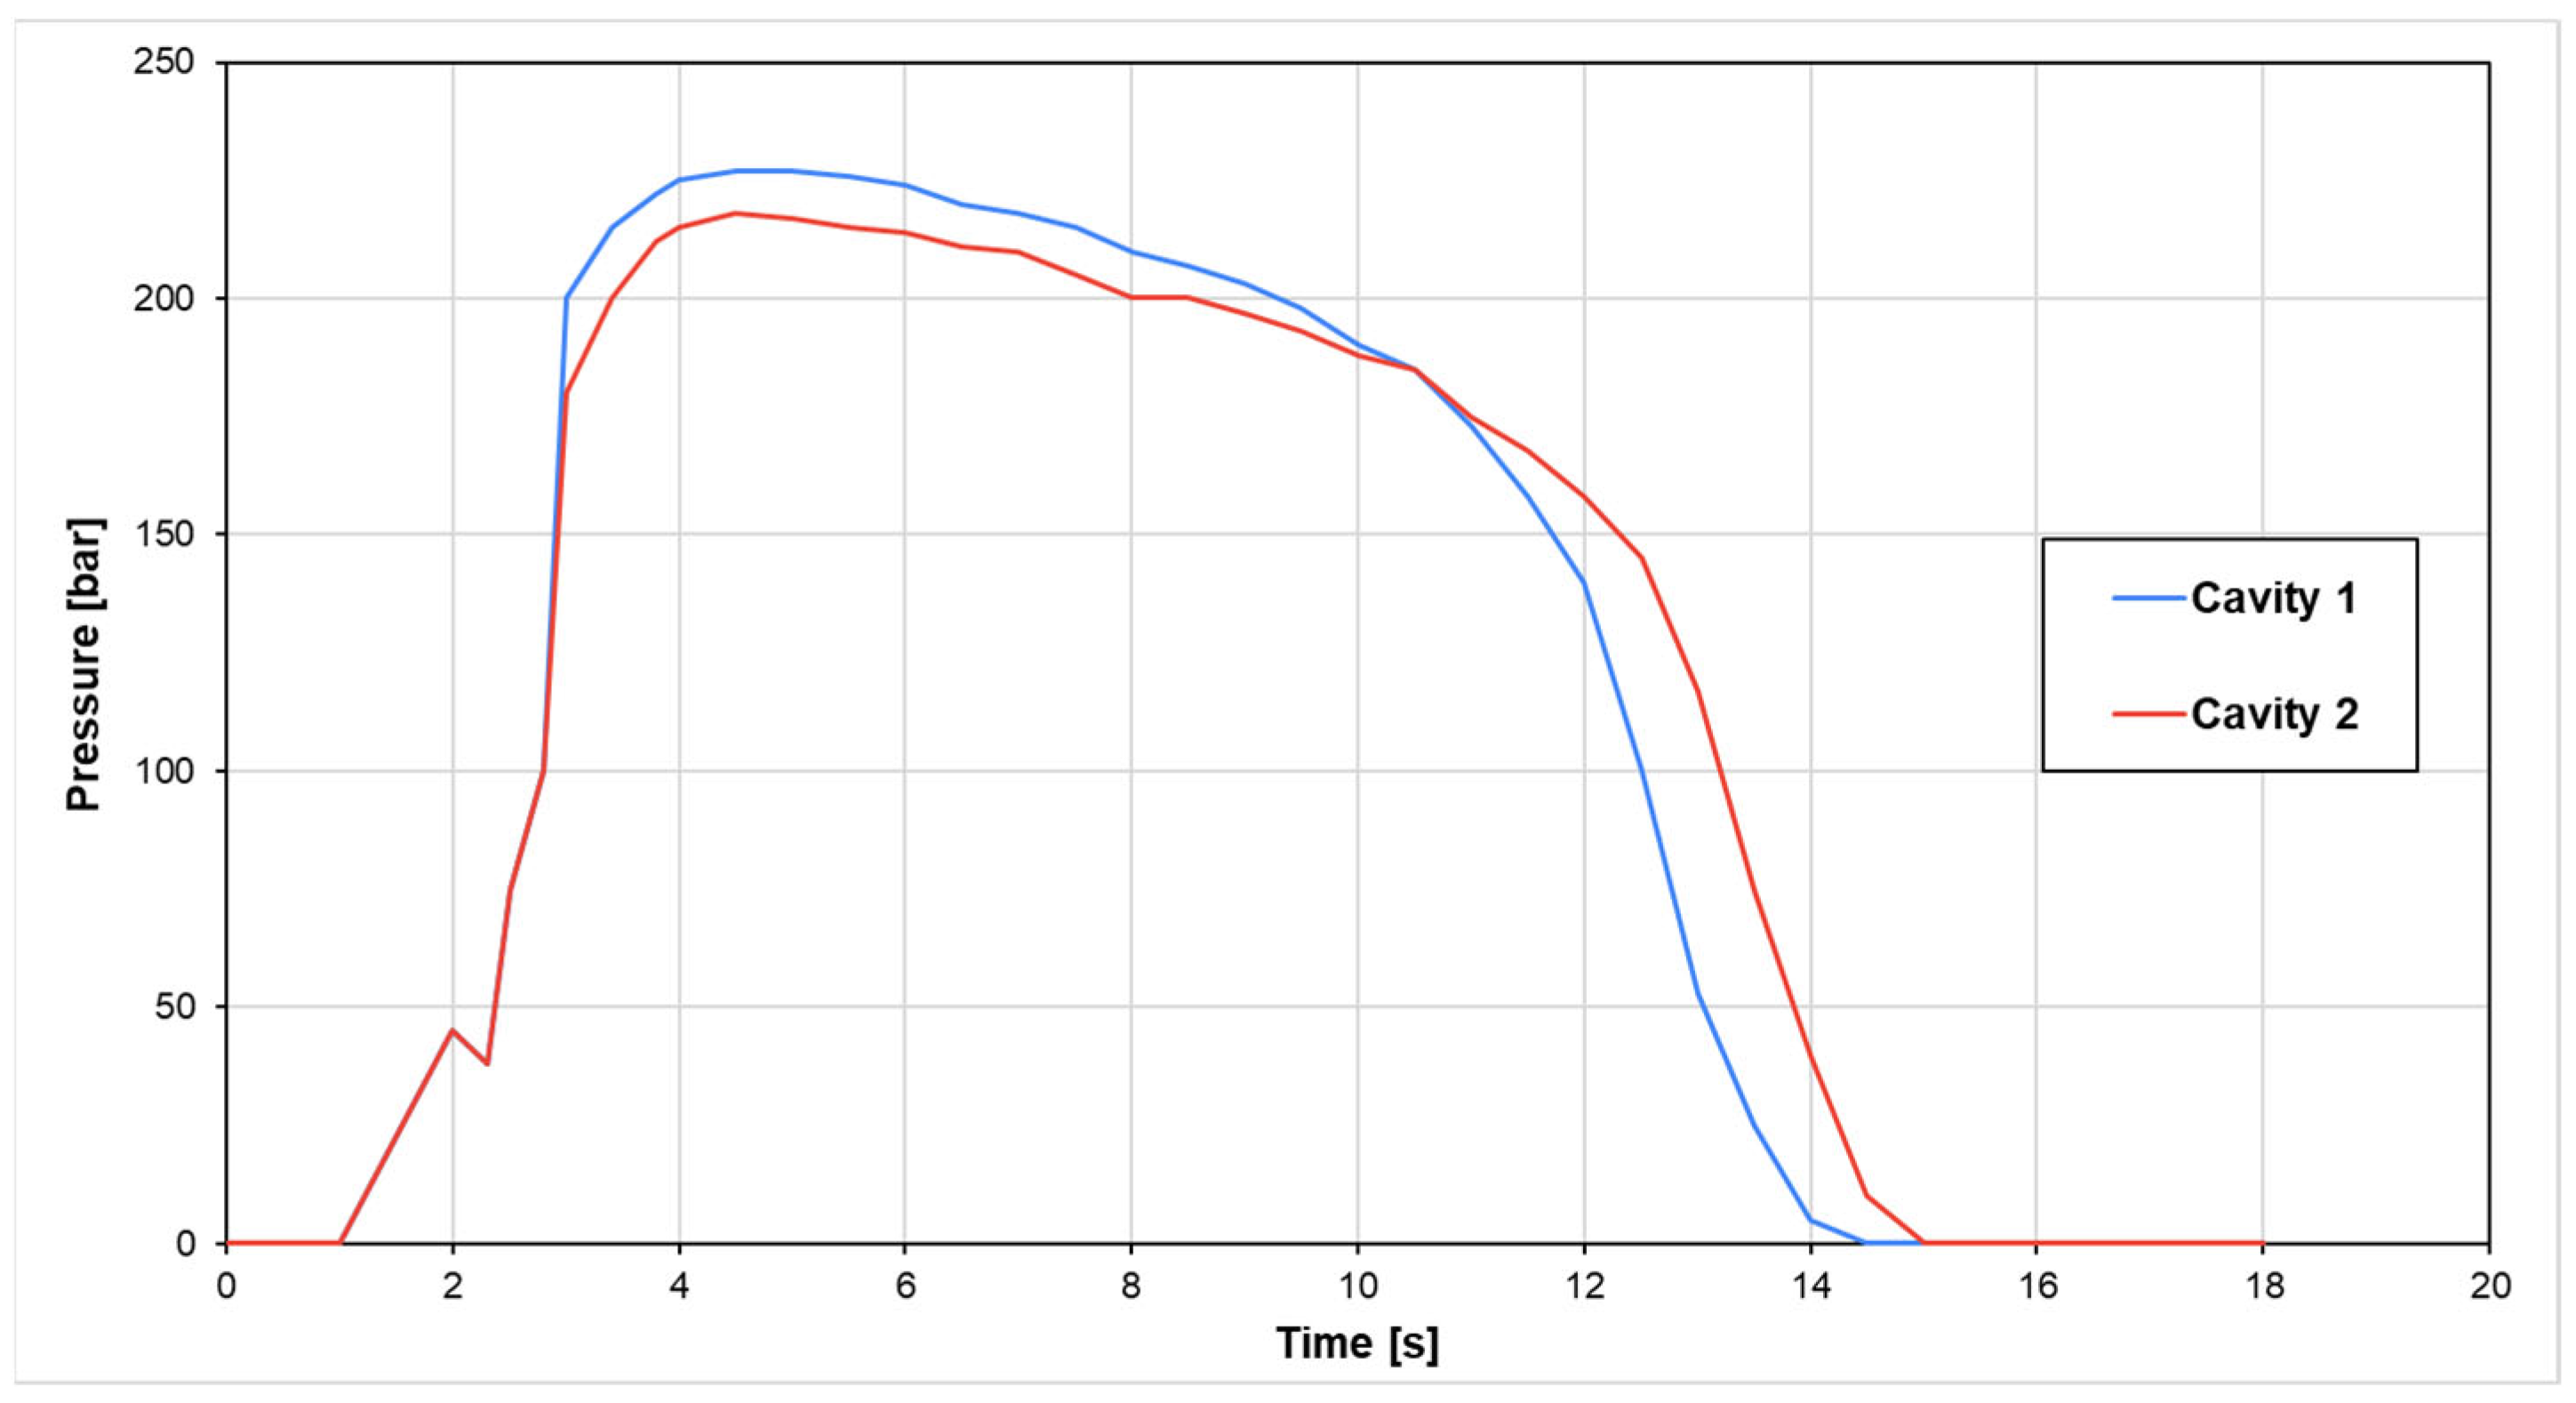
In the third experiment, the cavity pressure profiles for both cavities exhibited stable and well-balanced behavior, as shown in
Figure 13. The pressure increases rapidly during the filling phase, reaching its peak for around 3 s without exhibiting abrupt spikes at the switching point, indicating that the transition from velocity to pressure control was adjusted correctly and coincided with the completion of cavity filling. During the packing phase, which lasted approximately 3 to 12 s, the pressure in both cavities remained stable at around 230–250 bar, with a progression of holding pressure corresponding to the shrinkage behavior of the plastic material. Starting at approximately 12 s, the pressure began to decrease as the gate solidified and the material cooled. At this stage, a minor difference between cavities was observed, with Cavity 1 showing a slightly earlier and steeper pressure drop compared to Cavity 2, which may reflect subtle differences in local temperature, flow resistance, or gate freeze-off timing. Despite these differences, the overall pressure profiles were highly similar, suggesting a well-balanced process and favorable conditions for producing parts with uniform quality and minimal dimensional variation.
Table 4.
Comparison between nominal and experimental dimensions.
Table 4.
Comparison between nominal and experimental dimensions.
| Dimension | Measurement [mm] | Tolerance
[mm] | Exp1 | Exp2 | Exp3 |
|---|
| No. 1 | 25 | ±0.13 | 24.59 * | 24.95 | 25.06 |
| No. 2 | 25 | ±0.13 | 25.05 | 25.05 | 25.04 |
| No. 3 | 25 | ±0.13 | 24.2 * | 24.89 | 25.05 |
| No. 4 | 25 | ±0.13 | 24.91 | 24.91 | 24.97 |
| No. 5 | 25 | ±0.13 | 25.04 | 25.04 | 25.04 |
| No. 6 | 220 | +0.6 | 219.87 * | 219.94 * | 220.01 |
| No. 7 | 220 | +0.6 | 219.78 * | 219.97 * | 220.10 |
| No. 8 | 917 | +0.6 | 917.01 | 917.01 | 917.01 |
| No. 9 | 130 | +0.6 | 130.05 | 130.05 | 130.05 |
| No. 10 | 65 | +0.6 | 65.08 | 65.08 | 65.03 |
The data obtained during this experiment confirmed that the system was well-calibrated, as no significant fluctuations or instabilities were identified in the pressure curve. Additionally, the improvements in process parameters resulted in a reduced cycle time to 50.6 s and a pressure curve behavior closer to the ideal. This result reflected an improvement in the quality of the molded parts, as well as greater reliability and control in the injection process, achieving a balance between cycle time efficiency, part dimensional quality, and process sustainability.
Table 4 shows the comparison between all experiments and nominal conditions.
As shown in
Table 4, the results from the first experiment indicate that dimensions No. 1, No. 3, No. 6, and No. 7 (*) fell outside the required specifications, suggesting variations in the process. These deviations are consistent with the filling-to-packing transition, where even slight differences in switchover or holding conditions can significantly affect part shrinkage and dimensional accuracy [
2,
3]. In experiment two, dimensions No. 1 and No. 3 present improved results, likely due to fine adjustments in the injection conditions, particularly the increase in holding pressure and optimization of the switchover point. This finding aligns with the work of Liou et al. [
1], who demonstrated that adaptive adjustments of holding parameters enhance dimensional stability. The same situation applies to Experiment 3, where all dimensions are within the required values and closer to the nominal, significantly demonstrating better process stability.
In contrast, dimensions No. 2, No. 4, No. 5, No. 8, No. 9, and No. 10 demonstrated excellent repeatability and stability, highlighting the system’s ability to maintain dimensional accuracy. Such stability supports the findings of Chen et al. [
3] and Gim and Rhee [
4], who highlighted that cavity pressure monitoring not only detects anomalies but also ensures uniformity of part quality.
Furthermore, after measuring the produced parts, it was determined that all 10 measures had less deviation from the nominal value and were within tolerance. This demonstrates an acceptable condition and confirms the effectiveness of the process control strategy. These results reinforce the conclusion that optimization based on in-cavity pressure significantly contributes to achieving consistent dimensional quality in molded parts, aligning with the trends reported in previous research [
1,
2,
3,
4,
5,
6].
In contrast,
Table 5 presents the process conditions for each experiment, highlighting the main differences in holding time, holding pressure, switchover point, and cycle time.
While mold temperature (25 °C) and melt temperature (230 °C) were kept constant to provide a stable thermal condition, other parameters, such as holding time, holding pressure, switchover point, and cycle time, were modified to evaluate their impact on cavity pressure and part quality.
The switchover point itself was progressively delayed from 41 mm in Experiment 1 to 72 mm in Experiment 3, illustrating an intentional shift to optimize the timing of the holding phase. Similar strategies have been reported in the literature, where cavity pressure monitoring was used to determine the ideal switchover window to prevent defects such as flash or short shots [
3,
5].
Holding time and holding pressure also underwent significant modifications. The holding time was gradually reduced from 18 s to 12 s. The holding pressure was increased from 250 bar in Experiment 1 to 275 bar in Experiment 2, and then reduced to 230 bar in Experiment 3. This trade-off aimed to shorten cycle time (reduced from 55 s to 50.6 s) while maintaining sufficient pressure compensation for material shrinkage. Similar optimization approaches have been proposed by Liou et al. [
1], who demonstrated that adaptive control strategies based on pressure and clamping force can reduce cycle time without compromising dimensional accuracy. In line with this, Chen et al. [
3] reported that precisely adjusting holding parameters, guided by cavity pressure feedback, enhances part uniformity and reduces variability.
4. Conclusions
This study demonstrated the successful optimization of a plastic injection molding process by integrating in-cavity pressure sensors with an Iterative Learning Control (ILC) methodology. The cavity pressure profile acted as a crucial diagnostic tool and control variable for guiding real-time adjustments.
Over three experimental iterations, progressive adjustments were made to key process parameters—specifically holding pressure, holding time, and the switchover point. This approach resulted in a significant 8% reduction in cycle time, decreasing from 55.0 s to 50.6 s. Additionally, all ten critical dimensional tolerances were successfully met, achieving a 100% success rate in quality improvement.
The research underscores that an ILC framework, whether automated or implemented as a structured manual protocol, enables a process to converge rapidly toward an optimal state. This approach directly enhances reproducibility, stability, and final part quality.
This work addresses the common industry challenge of cycle-to-cycle variability by validating the use of in-cavity data for intelligent manufacturing. The findings confirm that the synergy of real-time pressure monitoring and iterative optimization provides a robust framework for significantly improving dimensional accuracy, process efficiency, and overall operational robustness. This integration ensures tighter adherence to nominal specifications and strengthens the ability to compensate for variations in real time.
Looking ahead, the methodology presented here could be further developed by integrating self-learning optimization strategies such as the Iterative Gradient-Approximation Optimization (IGAO) approach, as proposed by Dong et al. [
39], which would allow the system to autonomously adapt parameters across batches without explicit modeling autonomously, thereby moving toward a fully self-optimizing injection molding process or incorporating IA-driven learner systems capable of identifying deviations from stable operating zones and providing real-time corrective suggestions like those presented by Arslan et al. [
31].
