Article

Research on Geological–Engineering “Double-Sweet Spots” Grading Evaluation Method for Low-Permeability Reservoirs with Multi-Parameter Integration

1
School of Earth Sciences, Northeast Petroleum University, Daqing 163318, China
2
Sanya Offshore Oil & Gas Research Institute, Northeast Petroleum University, Sanya 572000, China
3
EnerTech-Drilling & Production Co., CNOOC Energy Technology & Services Limited, Tianjin 300452, China
4
Research Institute of Exploration and Development in Dagang Oilfield, PetroChina, Tianjin 300280, China
5
Heilongjiang Key Laboratory of Gas Hydrate Efficient Development, Daqing 163318, China
*
Author to whom correspondence should be addressed.
Processes 2025, 13(9), 2967; https://doi.org/10.3390/pr13092967
Submission received: 4 August 2025 / Revised: 13 September 2025 / Accepted: 16 September 2025 / Published: 17 September 2025
(This article belongs to the Section Sustainable Processes)

Abstract

The development of low-permeability reservoirs offshore entails substantial investment and demands high production capacity for oil and gas. Consequently, the analysis and evaluation of key elements for integrated geological–engineering sweet spots have become essential. This study systematically establishes a coupled analysis methodology for geological and engineering parameters of low-permeability reservoirs, based on Offshore Oilfield A. A comprehensive evaluation framework for geological–engineering sweet spots is proposed, which applies grey relational analysis and the analytic hierarchy process. Twelve geological–engineering sweet spots were analysed, with corresponding parameter weightings determined. Geological sweet spots encompassed factors such as porosity, permeability, and oil saturation, and engineering sweet spots considered Young’s modulus, Poisson’s ratio, fracture factor, and brittleness index. Low-permeability reservoirs were categorised into Classes I, II, III, and IV by establishing indicator factors. Integrating seismic inversion and reservoir numerical simulation methods, we constructed an analysis model. This methodology resolves challenges in evaluating offshore low-permeability reservoirs, enabling rapid and precise sweet spot identification. It provides critical technological support for enhancing oil and gas production efficiency.

1. Introduction

The scale of low-permeability oil and gas resources at sea is large. Compared with onshore low-permeability reservoirs, offshore oil and gas development requires greater investment and higher risks. The experience of onshore low-permeability reservoirs is not suitable for offshore low-permeability reservoirs. Low-permeability reservoir sweet spots are usually evaluated using logging and rock data. However, this method is too simple and not suitable for offshore oil fields with complex reservoirs and few wells [1]. Earthquake data can effectively solve this problem. They can establish connections between reservoir elastic parameters for areas with few or no wells [2,3]. Establishing seismic response of rock media through AVO inversion analysis can achieve geological sweet spot prediction [4]. Sensitivity analysis results of parameters related to lithology, physical properties, and saturation for different geological sweet spots establish an analysis template for geological sweet spots. By combining rock analysis techniques with seismic inversion techniques, sweet spot prediction of tight sandstone reservoirs can be achieved, proving that seismic inversion technology can achieve quantitative interpretation of sweet spots [5].
However, the accuracy of earthquake prediction is low, and a single evaluation result is difficult to match the production capacity requirements of offshore oil and gas extraction. There is a need to improve oil and gas extraction capacity through reservoir stimulation [6]. Fracturing is an effective measure for enhancing production from low-permeability reservoirs. The rock mechanics parameters of the engineering sweet spots influence the complexity of the fracture network formed during fracturing. The core parameters include Poisson’s ratio, Young’s modulus, stress and brittleness. Considering these parameters that control the trajectory and morphology of crack propagation during the fracturing process, a method for evaluating the brittleness of different rock types is proposed [7]. An engineering sweet spot evaluation method under the influence of multiple factors such as brittleness index and fracture toughness was established [8]. The concept of rock fracturability was proposed by introducing fracture toughness into brittleness evaluation. It is widely used because it considers the mechanism of crack propagation from the perspective of fracture energy [9]. In order to achieve higher oil and gas production, a complex fracture system analysis method based on probability analysis is proposed [10]. A three-dimensional comprehensive evaluation model for geological and engineering sweet spots was proposed to improve the development efficiency of low-permeability sandstone reservoirs [11]. It can also be widely applied to multiple fields of offshore oil [12,13,14].
The above geological–engineering sweet spot evaluation methods mainly focus on shale reservoirs, and there are fewer studies on low-permeability sandstone reservoirs, or they use a single evaluation method. With the deep development of offshore oil fields, data such as rock cuttings, core samples, logging, seismic data, and fracture mechanics behavior are constantly enriched. A “double-sweet spots” evaluation methodology combining geological and engineering approaches has been developed for low-permeability reservoirs. A three-dimensional sweet spot prediction model was established by combining the parameters of total hydrocarbon content, porosity, brittleness index, and shear expansion angle [15]. The three-dimensional structural model can achieve quantitative description of reservoirs and clarify the distribution and spatial changes of reservoirs, complete the optimization of geological and engineering parameters [16]. The parameters of double-sweet spots are complex, making it difficult to determine the extent to which each factor influences reservoir development potential. The application of methods such as data analysis and machine learning has gradually clarified the relationship between these parameters and reservoir characteristics [17,18]. Implementation of data collection, preprocessing, data feature analysis, model selection, training, validation, optimization, and evaluation provides valuable results for researchers [19].
In this study, we have established a methodology for analysing geological and engineering sweet spot parameters in low-permeability offshore reservoirs. Parameters include permeability, porosity, oil saturation, median particle size, cement content, shale content, brittleness index, modulus of elasticity, Poisson’s ratio, horizontal stress difference, fracture coefficient, and fracture toughness. Combined with grey relational analysis and analytic hierarchy process methods, we carried out the multi-factor analysis and hierarchical evaluation of geological–engineering “double-sweet spots”. Using seismic inversion and reservoir numerical simulation methods, we achieved “double-sweet spots” spatial division of low-permeability reservoirs and rapid evaluation of sweet spots in offshore low-permeability reservoirs. It is of great significance for the efficient development of low-permeability offshore oil and gas resources.

2. Methods

2.1. Geological and Engineering Sweet Spot Identification Method

2.1.1. Geological Sweet Spots Parameter Analysis

Oilfield A is located in the Bohai Bay Basin, Bozhong Central Depression. The Bohai Bay Basin is a Cenozoic rift basin where intense faulting has caused differential subsidence, forming an alternating pattern of uplifts and depressions. The tectonic evolution of the Bohai Bay Basin is a multi-stage process of extension and rifting, which mainly occurred in the late Mesozoic and Cenozoic, especially in the Cenozoic. During the Paleogene Fault Depression Period, in the early stage, the climate was dry, and gypsum salt rocks and red clastic rocks were widely developed for sedimentation. This is an important regional cover layer. Afterwards, the lake basin expanded and the water depth reached its maximum. Deep lake semi-deep lake facies dark mudstone was formed throughout various depressions. This is the most important hydrocarbon source rock series in the basin. In the late stage, the lake basin began to shrink and fill, and the water became shallower. Large-scale sand bodies of delta, fan delta, and fluvial facies developed.
The Bozhong Central Depression is the largest hydrocarbon-rich depression in the Bohai Bay Basin. The Bohai Bay Basin was predominantly controlled by back-arc extensional stress generated by the subduction of the West Pacific Plate. Since the Quaternary period, the Ek Formation has undergone two major episodes of rifting and thermal subsidence. This has formed a unified basin centred on the Bohai Central Depression as its depositional core. The anticlinal uplift belt exhibits well-developed morphology and occupies an exceptionally favourable tectonic position.
The low-permeability reservoir, the Ek Formation, is a lake-bottom fan deposit with lithologies of sandstone and conglomerate. The Ek Formation is generally buried at depths exceeding 3500 m. The Es3 Member, Es1, and Ed3 formation mudstones are the primary hydrocarbon source rocks in this oilfield. The mudstone cap rock overlying the Ek Formation conglomerate has a continuous thickness of over 400 m, forming an excellent reservoir–cap rock combination.
The low-permeability Oilfield A has poor reservoir properties. The porosity is 4.1–9.3%, the average porosity is 6.79%, the permeability is 0.20–1.3 mD, the average permeability is 0.74 mD, and the average hydrocarbon saturation is 46%. There are 13 wells in Oilfield A, with low-permeability reservoirs in the Ek Formation. We completed 34 rock thin slices based on samples taken from the 13 wells (depth range 3850–4120 m). The thin slices were identified using a polarising microscope.
The spatial analysis and prediction of geological sweet spots are based on the pre-stack seismic inversion method. This method takes multi-scale information such as earthquakes, well logging, and geological data as constraints. Parameters such as longitudinal wave impedance, transverse wave impedance, and density of the reservoir are obtained. The advantage of this method is that it minimizes the impact of natural conditions such as seawater depth, waves, and ocean currents, which can lead to low continuity and accuracy in data collection.

2.1.2. Engineering Sweet Spot Parameter Analysis

The parameters of engineering sweet spots are calculated based on well logging data. A rock mechanics parameter interpretation model is constructed to predict one-dimensional rock mechanics parameters. These mainly include Young’s modulus, Poisson’s ratio, fracture coefficient, brittleness index, ground stress, and fracture toughness.
Based on the Navier–Kersey acoustic wave propagation fluctuation equation, it is assumed that the rock is an isotropic infinite elastomer. A single well rock elastic parameter calculation model is established, and the interpretation of one-dimensional elastic modulus and Poisson’s ratio for a single well is completed.
μ d = ( V p V s ) 2 2 2 [ ( V p V s ) 2 1 ]
E d = ρ V s 2 3 ( V p V s ) 2 4 ( V p V s ) 2 2
E d is the dynamic elastic modulus (dynamic Young’s modulus), GPa; μ d is the dynamic Poisson’s ratio, dimensionless; ρ is the rock density, g/cm3; V p and V S are the longitudinal and transverse wave velocities, m/s.
Based on the vertical cumulative effect and the law of linear elastic deformation, the vertical, horizontal maximum and horizontal minimum three-way stress models are established to complete the one-dimensional three-way stress interpretation.
σ H = 1 2 [ ξ 1 E d 1 μ d + 2 μ d ( σ v α P p ) 1 μ d + ξ 1 E d 1 + μ d ] + α P p σ h = 1 2 [ ξ 1 E d 1 μ d + 2 μ d ( σ v α P p ) 1 μ d ξ 2 E d 1 + μ d ] + α P p σ v = ρ g d z
σ H , σ h and σ v are the horizontal maximum, minimum and vertical stress, MPa; α is the effective stress coefficient of Biotek, which is taken as 1; P p is the stratum pore pressure, MPa; ξ 1 and ξ 2 are the geostructural coefficients of the stress.
Combined with the interpretation results of rock mechanical parameters, the key engineering parameters of the reservoir were normalised based on the min–max normalisation method, and a single-well brittleness index model was established to quantitatively characterise the difficulty of fracture initiation.
E n = E E m i n E m a x E m i n
μ n = μ m a x μ μ m a x μ m i n
B = E n + μ n 2
B n = B B m i n B m a x B m i n
B n is the normalized rock brittleness index; E m a x and E m i n are the maximum and minimum Young’s modulus, MPa; μ m a x and μ m i n are the maximum and minimum Poisson’s ratio; B is the brittleness index; B m a x and B m i n are the minimum and maximum values of brittleness index.
Horizontal stress difference coefficient can be calculated using horizontal maximum ( σ H ) stress and horizontal minimum stress ( σ h ). A fracture coefficient model is established that can analyze the complexity and difficulty of artificial fractures.
β = σ H σ h σ h
β n = β m a x β β m a x β m i n
F n = w 1 B n + w 2 β n
β is the horizontal stress difference coefficient; β n is the normalised horizontal stress variance coefficient; β m a x and β m i n are the maximum and minimum horizontal stress variance coefficients; F n is the fracture coefficient; w 1 and w 2 are the weights of fracture coefficients.
Fracture toughness is a material parameter that inhibits the ability of cracks to propagate. A rock fracture toughness logging interpretation model is established based on the influence of rock confining pressure and tensile strength on fracture toughness. The evaluation and interpretation of a single well are complete.
K I C = 0.2176 P c + 0.0059 σ t 3 + 0.0923 σ t 2 + 0.517 σ t 0.3322 R = 0.95
P c = μ 1 μ P v α P p + α P p
P v = 0 H   ρ g   d   h
μ = 0.250 μ d + 0.1268
K I C is the fracture toughness, MPa·m1/2; P c is the rock confining pressure; P v is the overlying formation pressure; h is the formation depth; σ t is the tensile strength; μ is the Poisson’s ratio.

2.2. Geological and Engineering Sweet Spot Analysis Methods

There are significant differences in the range and magnitude of geological and engineering parameters. To ensure comparability between parameters, the grey relational analysis method is used for correlation analysis of parameter data. Geological or engineering indicators are often inherently related, and the relationship between different indicators needs to be considered in analysis. The Analytic Hierarchy Process is selected to evaluate the weight of parameters, where the weight represents the importance of the parameters to oil and gas production.

2.2.1. Grey Relational Analysis

The grey relational analysis method is used to analyze the different influencing factors of sweet spots, which requires the construction of reference sequences and comparison sequences, as well as data normalization. Then, the calculation of correlation degree is completed. The main calculation steps are as follows.
(1)
Construct comparison and reference sequence
The comparison sequence is as follows:
X 1 X 2 X n = x 1 ( 1 ) x n ( 1 ) x 1 ( m ) x n ( m )
The reference sequence is:
X 0 = ( x 0 ( 1 ) , x 0 ( 2 ) , , x 0 ( m ) ) T
X 0 represents the key variable of the system; X n represents the different factors affecting the variable; n represents the number of influencing factors and m represents the sample size.
(2)
Data normalization
Normalization eliminates the impact of significant differences in the magnitude of various parameters. This study used the mean method for analysis.
Mean method:
x i ( k ) = x i ( k ) A v e ( x i )
A v e x i = 1 n 1 n   x i k
A v e x i is the mean value of the data, x i k indicates the data value of the ith comparison series in the kth sample; x i ( k ) is the data processed by the mean method.
(3)
Calculation of correlation degree
r x 0 ( k ) , x i ( k ) = Δ m i n + ρ Δ m a x Δ i k + ρ Δ m a x Δ min = m i n i   m i n k | x 0 ( k ) x i ( k ) | Δ max = m a x i   m a x k | x 0 ( k ) x i ( k ) | Δ i k = | x 0 k x i k |
In the formula, m i n i   m i n k | x 0 ( k ) x i ( k ) | and m a x i   m a x k | x 0 ( k ) x i ( k ) | denote the minimum and maximum absolute difference between all the sequences; | x 0 k x i k | denotes the absolute difference between the reference sequence and the comparison sequence at the kth data point; ρ is the resolution coefficient, with a value range is (0, 1). The smaller the resolution coefficient, the greater the difference between the correlation coefficients, and the stronger the discrimination ability. The value of ρ is usually 0.5 when using the mean analysis method.
Calculate the grey correlation degree by averaging the correlation coefficients:
r x 0 , x i = 1 m k = 1 m   r x 0 ( k ) , x i ( k )
where r x 0 , x i is the grey relational degree and m is the total number of samples. x 0 , x i are the reference sequence and comparison sequence before transformation.

2.2.2. Analytic Hierarchy Process

The analytic hierarchy process classifies all elements under study into different levels by analyzing the various factors involved in complex problems and their interrelationships. A multilevel structure is formed by establishing links between the elements. A judgement matrix is constructed by judging the relative importance of the elements at each level according to a certain criterion. By solving the matrix eigenvalue problem, the ranking weights of elements and their combined weights for the overall objective are determined, thus obtaining a quantitative description of relative importance.
(1)
Establishment of hierarchical structure model
Based on the hierarchical relationship of the comprehensive identification and judgement parameters, the hierarchical structure model is established as in Figure 1.
(2)
Construct judgement matrix
Using 1 to 9 and its reciprocal as the scale, the judgement matrix A = a i j ,   i = 1,2 , , n ,   j = 1,2 , , n is obtained through two-by-two comparison, and C i , C n is set to be the n scenarios. According to the mutual influence relationship of each criterion on the target, the constructed matrix A = a i j should be a positive mutual inverse matrix, and the judgement of a i j is as follows (Table 1).
a i j 2, 4, 6, 8 can be taken to indicate that the importance of the programme lies between the two adjacent levels mentioned above. Also, a i j should fulfil the condition: a i j = 1 / a i j , for all i , j = 1,2 , , n , a i j > 0 .
A = a 11 a 12 a 1 n a 21 a 22 a 2 n a n 1 a n 2 a n n
This matrix is a positive inverse matrix.
(3)
Single level ranking and consistency test
Find the maximum eigenvalue λ m a x of matrix A. and then according to the largest eigenvalue of the corresponding eigenvector ω A ω = λ m a x ( ) , and will be standardised to ω , get ω = a 1 , a 2 , a n that is the same layer relative to the previous layer of a factor of the weight. According to the size of this weight, we can determine the layer of the factor of the sort.
Perform consistency checks. If the consistency condition is met, it ends. Otherwise, adjust the judgment matrix and proceed to the second step. Take the consistency indicator C I = λ m a x n 1 , ( n is the order of A ) and take the randomness indicator R I as follows (Table 2).
Let C R = C I R I , if   C R < 0.1 , then A is considered to have consistency. According to the Analytic Hierarchy Process of the objective of comprehensive judgement, the weights of individual indicators are obtained.

3. Results

There are many types of pores, mainly intergranular pores, with some feldspar dissolution pores. The pores produced by dissolution can improve permeability and increase the space of oil and gas reservoirs. Among them, feldspar dissolution pores are high-quality storage spaces. This pore combination feature is closely related to the widespread strong lake basin faulting and rapid burial background in the Paleogene of the Bohai Bay Basin. The acidic fluid generated by the thermal evolution of deep organic matter migrates along the fracture system and carries out extensive dissolution of soluble components such as feldspar particles.
The pores are cemented by carbonate, siliceous and clay minerals. The volume proportion of carbonate cement is 0.5~24.5%. It is dominated by iron dolomite (Figure 2), followed by calcite and rhodochrosite, and a small amount of iron calcite cementation is seen. Cementation can reduce the porosity and permeability of the reservoir. The Ek Formation reservoir in Oilfield A has undergone a complex diagenetic process. Its current low-permeability characteristics are essentially the result of a combination of constructive and destructive diagenesis.
The sandstone identified by wave impedance attributes in pre-stack seismic inversion is consistent with the lithological interpretation results of logging and core. The matching degree reached 91.3%, demonstrating the high-precision recognition capability of sand bodies (Figure 3).
Constrained by the inverted data volume, and combining well logging interpretation data of porosity, permeability, and oil saturation, we completed 3D modeling of geological sweet spot parameters (Figure 4).
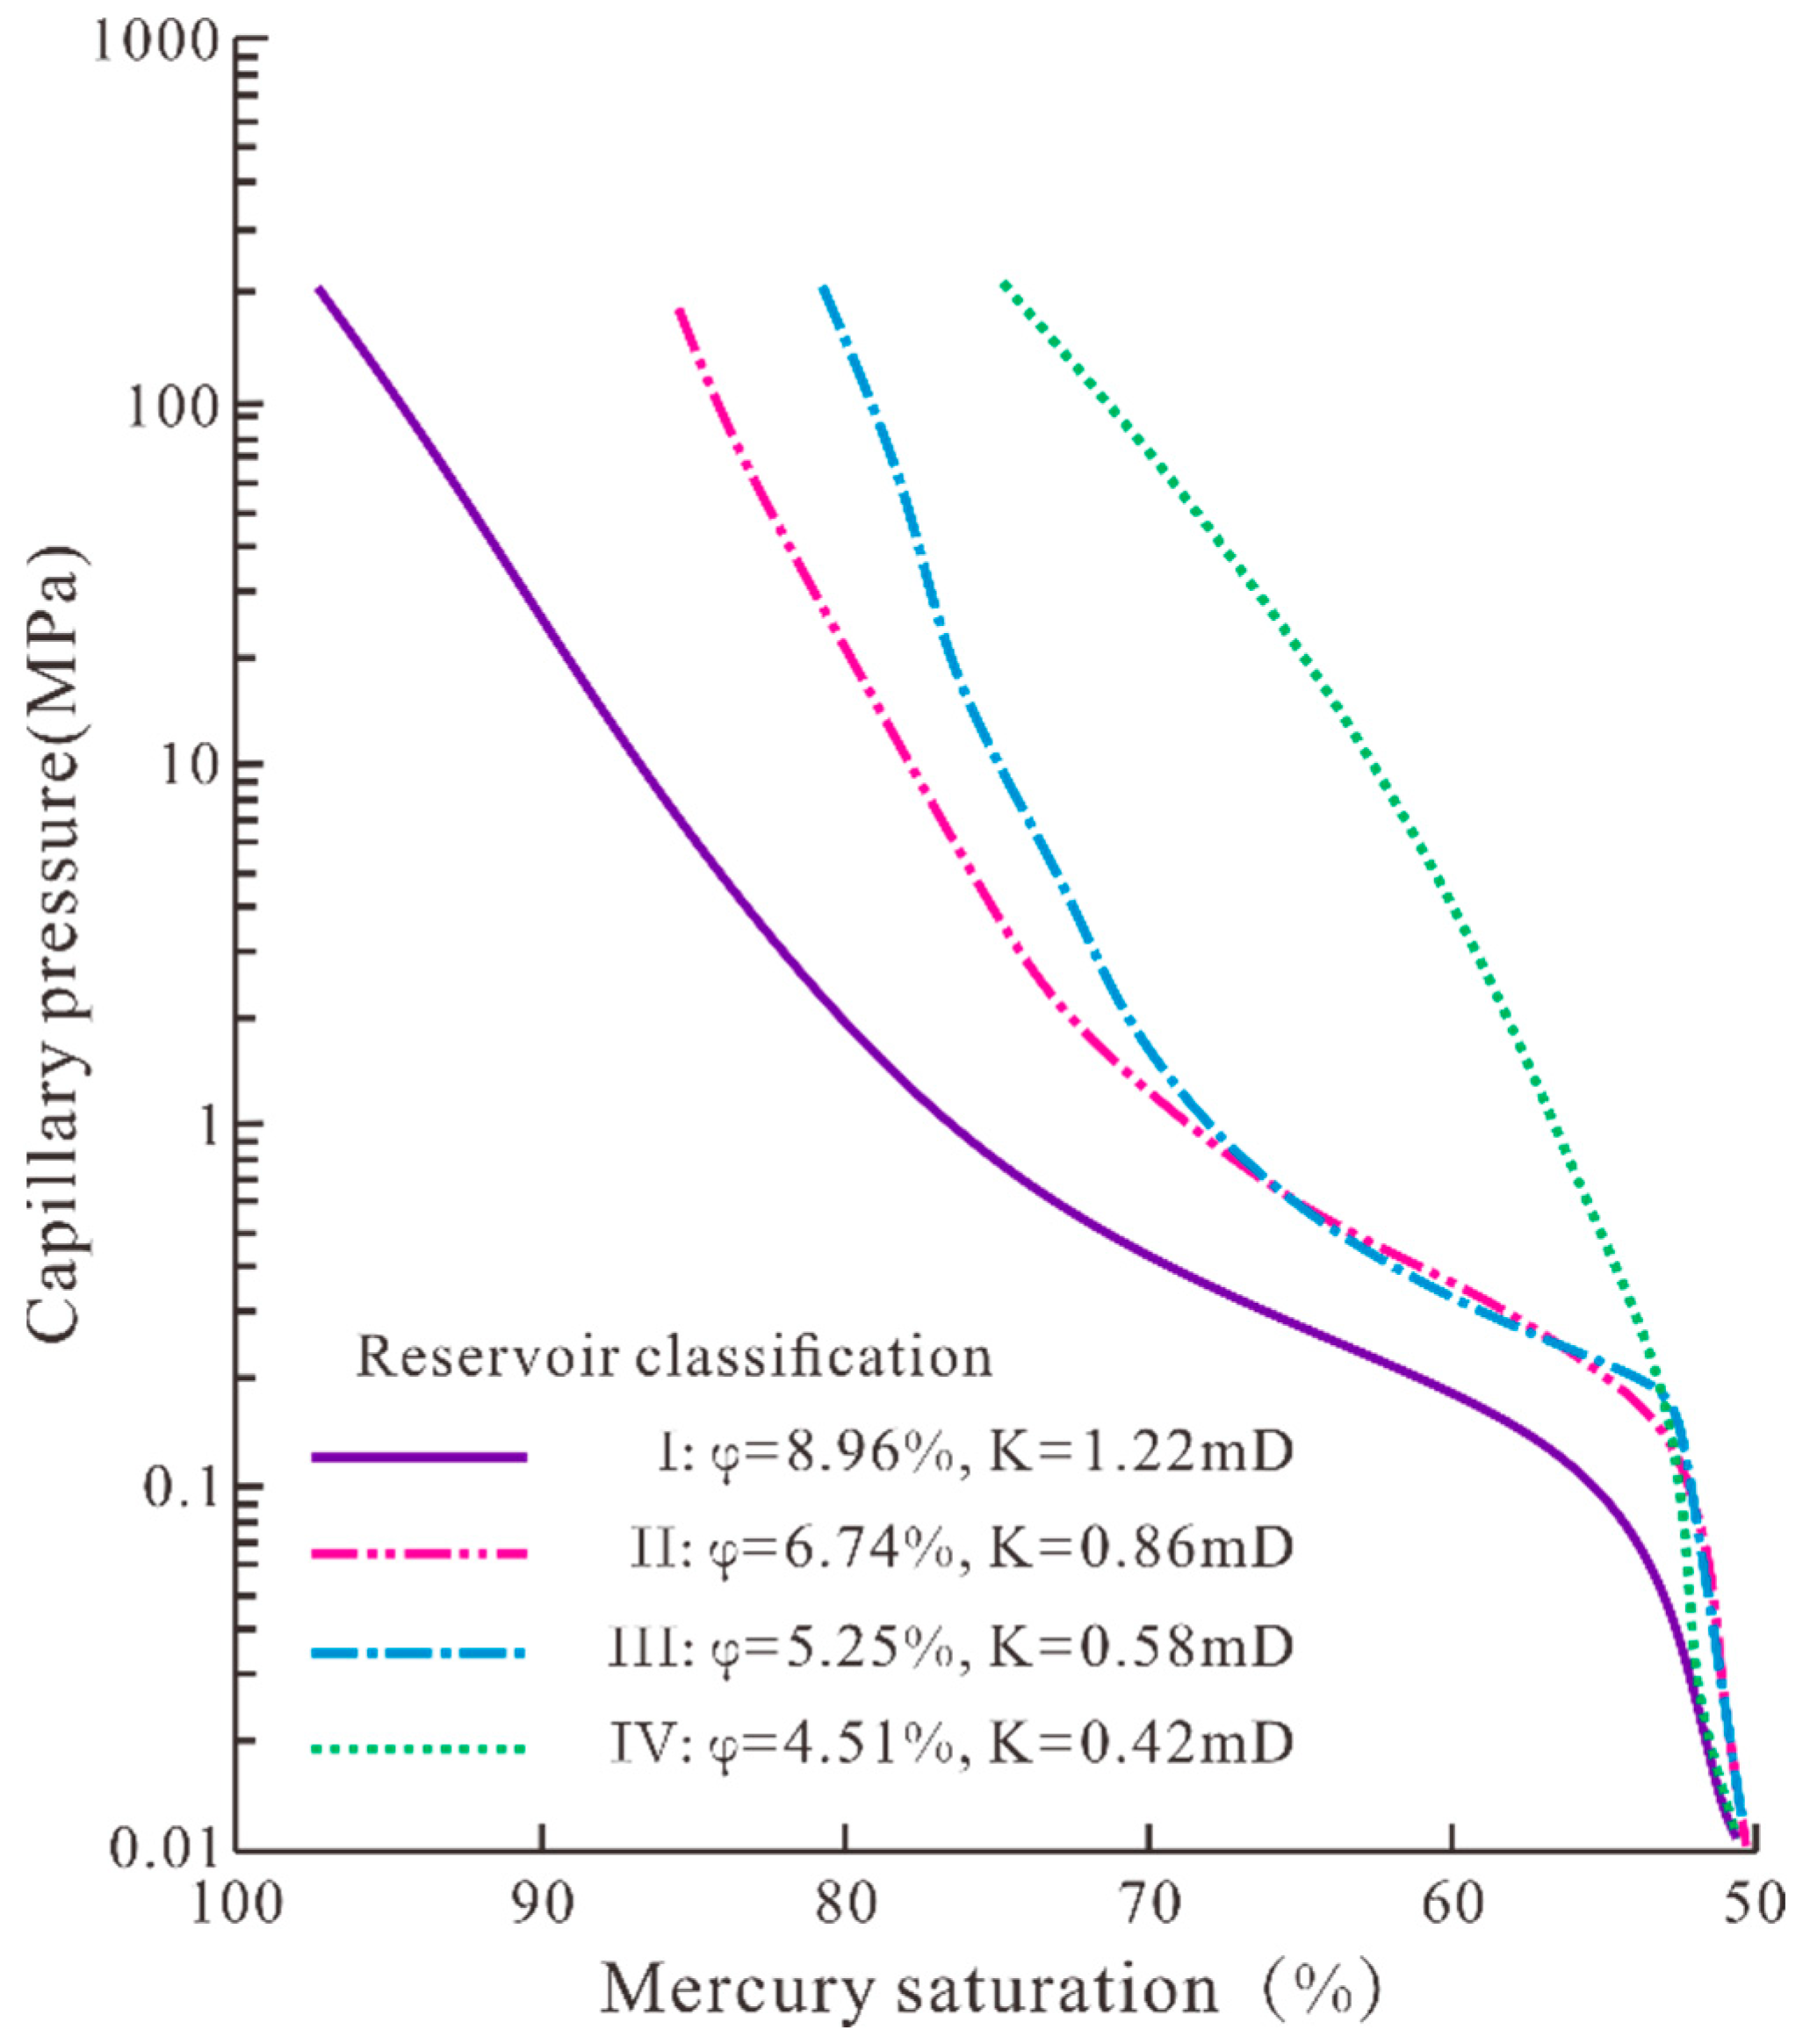
There is no clear classification boundary for low-permeability reservoirs in offshore oil fields. This study is based on core samples from oilfield A and conducts mercury injection experiments to complete the division of geological parameter boundaries. Mercury injection experiment is a key technique for evaluating the pore structure of reservoir rocks, especially the distribution of pore throat sizes. By analyzing the mercury intrusion curve and related pore structure parameters, the reservoir performance and permeability can be determined. We selected the experimental results of four core samples from oilfield A. These samples have different porosity and permeability ranges. Through the characteristics of mercury saturation and capillary pressure curve, clear zoning features are demonstrated (Figure 5). Based on experimental results, we completed the division of low-permeability reservoirs, divided into four types (I, II, III, IV). Combining the three-dimensional distribution model of sweet spots, we completed the reservoir classification evaluation of oilfield A.
According to the calculation methods of engineering sweet spots parameters, complete the interpretation of rock mechanics for all wells. Combining the 3D modeling method, establish 3D models of all engineering sweet spots parameters (Figure 6).
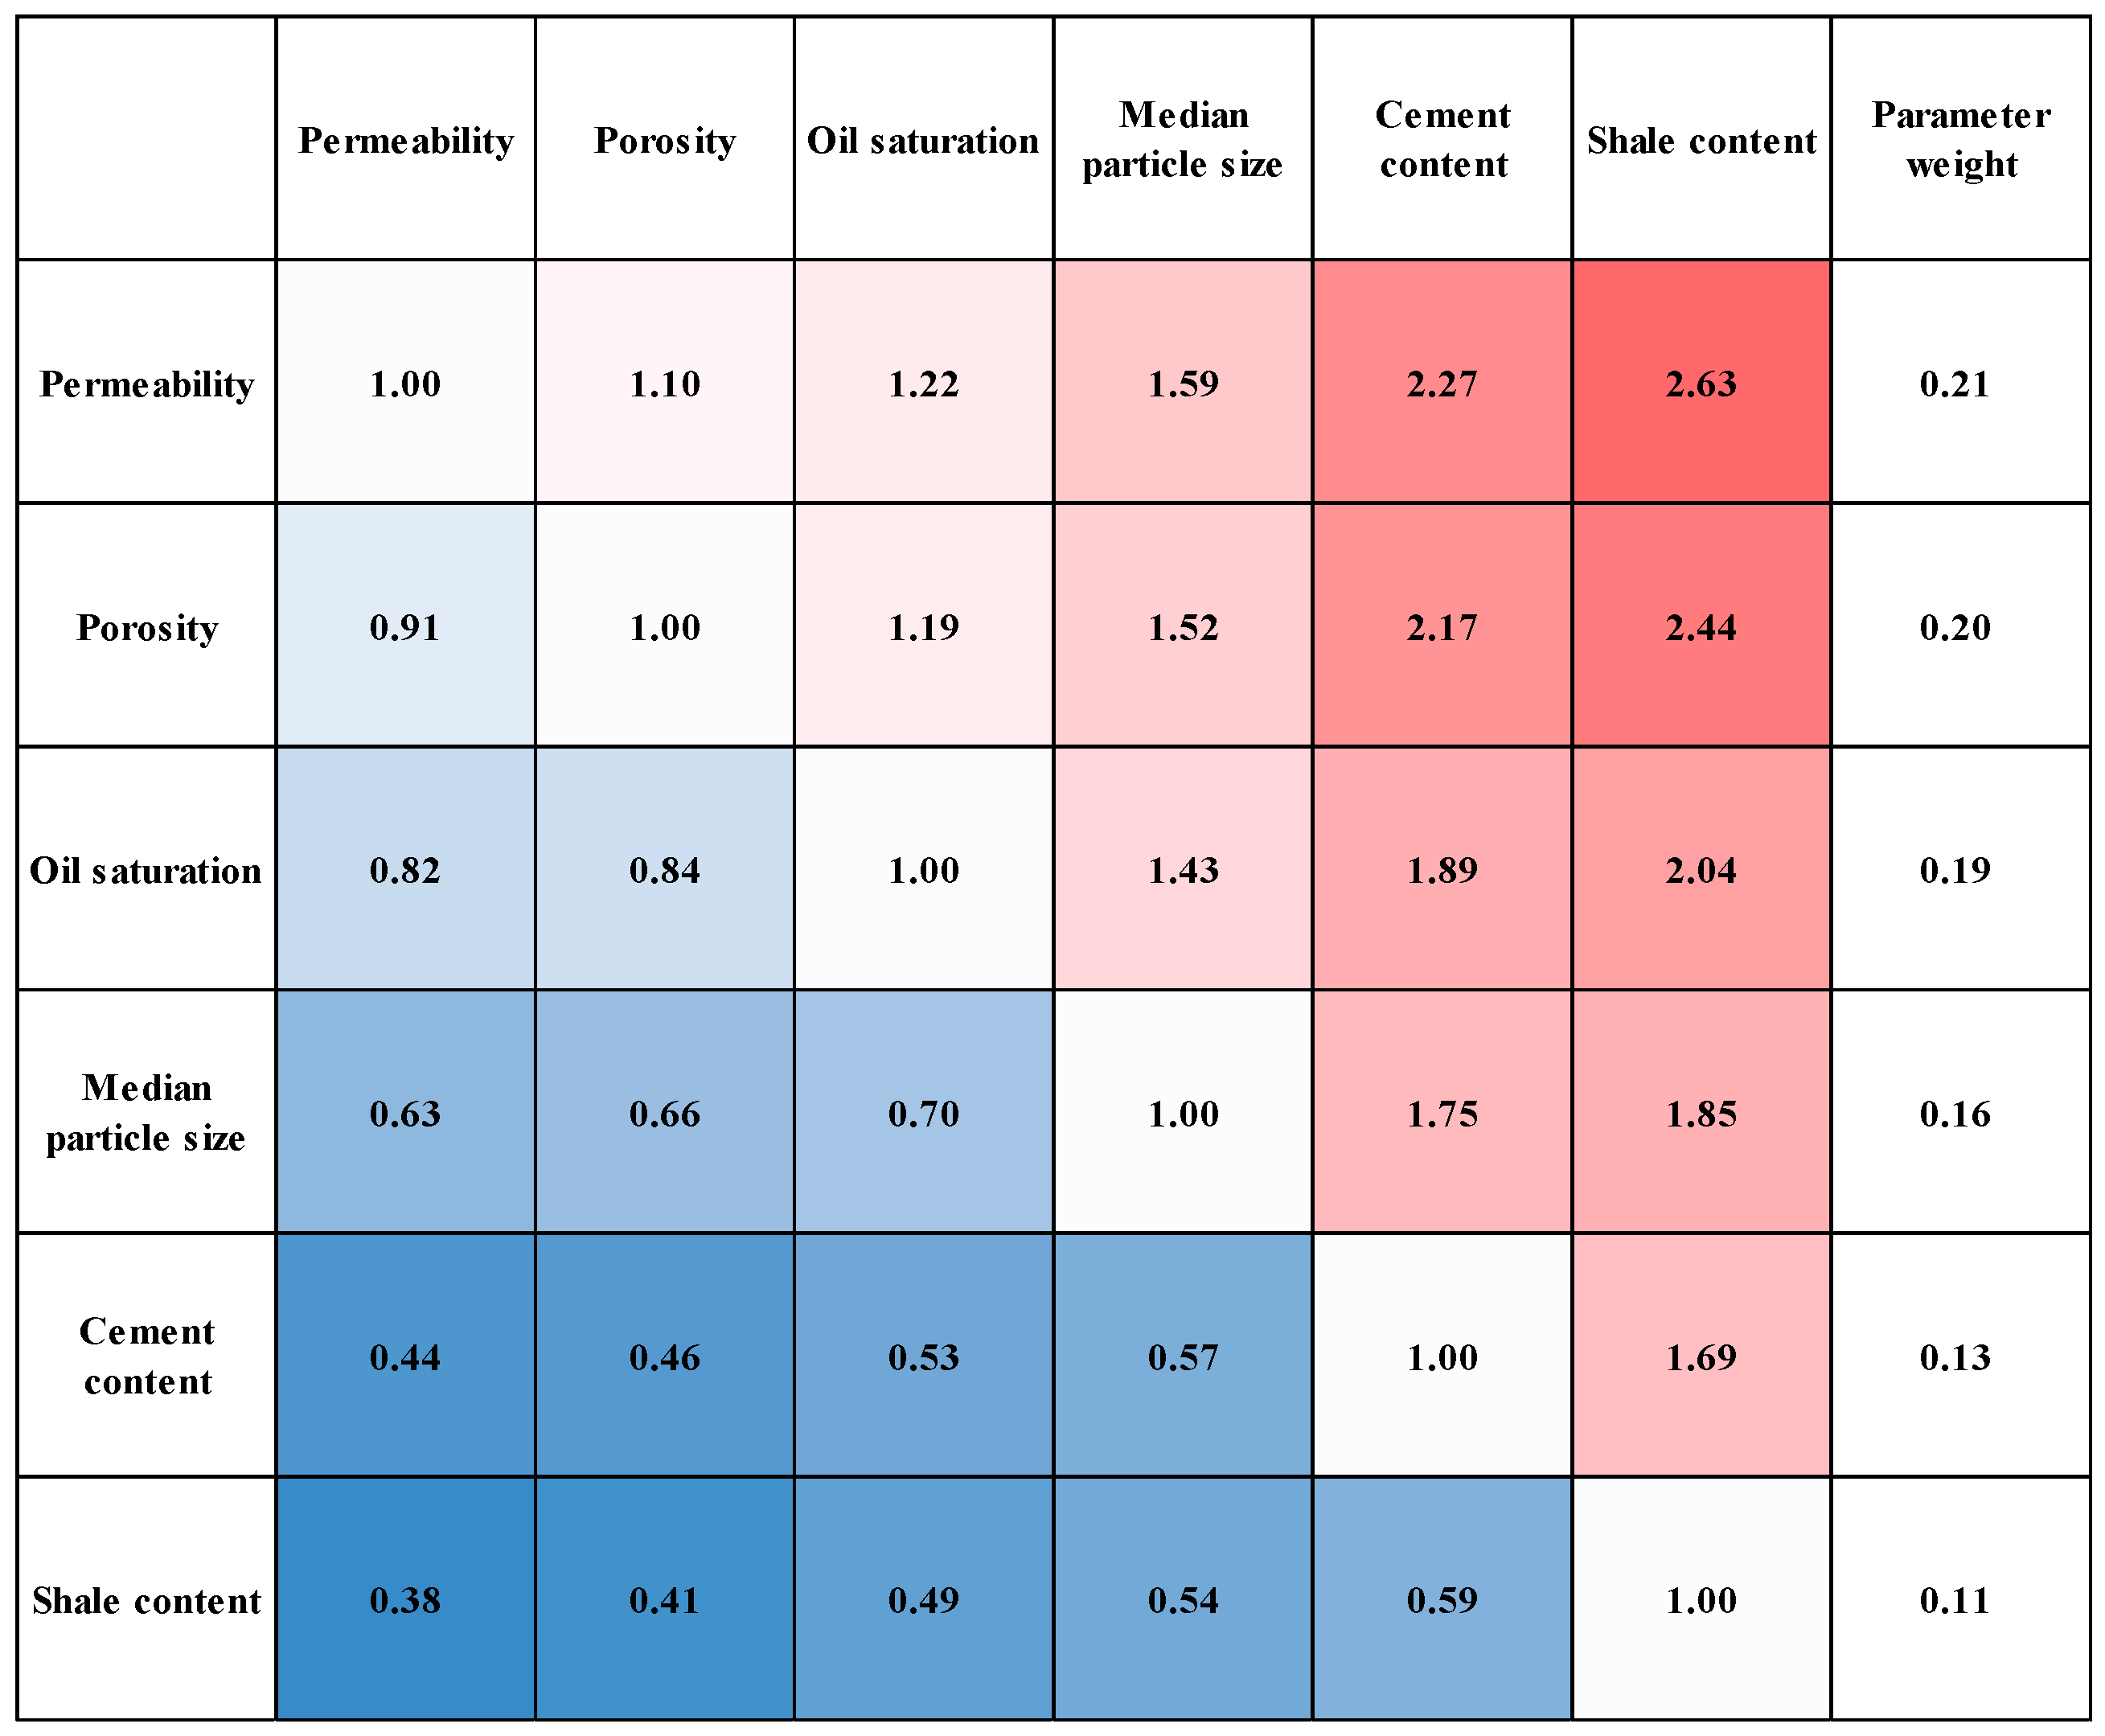
Based on test data from 13 wells in oilfield A, establish a heat map of geological sweet spot parameters on oil production capacity. Obtain the influence weights of each parameter and sort the geological parameters that affect the production of low-permeability reservoirs. Among them, permeability, porosity, and oil saturation are the most important parameters (Figure 7).
Based on the weight coefficient method, the dimensionless transformation of various parameters was completed, and the geological sweet spots indicator factor I was obtained. The weight coefficient method emphasizes the importance of different parameters by assigning different weights. The magnitude of its weight coefficient is the influence weight of each factor.
I = 0.21 K K m i n K m a x K m i n + 0.20 φ φ m i n φ m a x φ m i n + 0.19 S o S o m i n S o m a x S o m i n + 0.16 V V m i n V m a x V m i n + 0.13 P P m i n P m a x P m i n + 0.11 S S m i n S m a x S m i n
I is geological sweet spots indicator factor; K is permeability; φ is porosity; S o is oil saturation; V is median particle size; P is cement content; S is shale content.
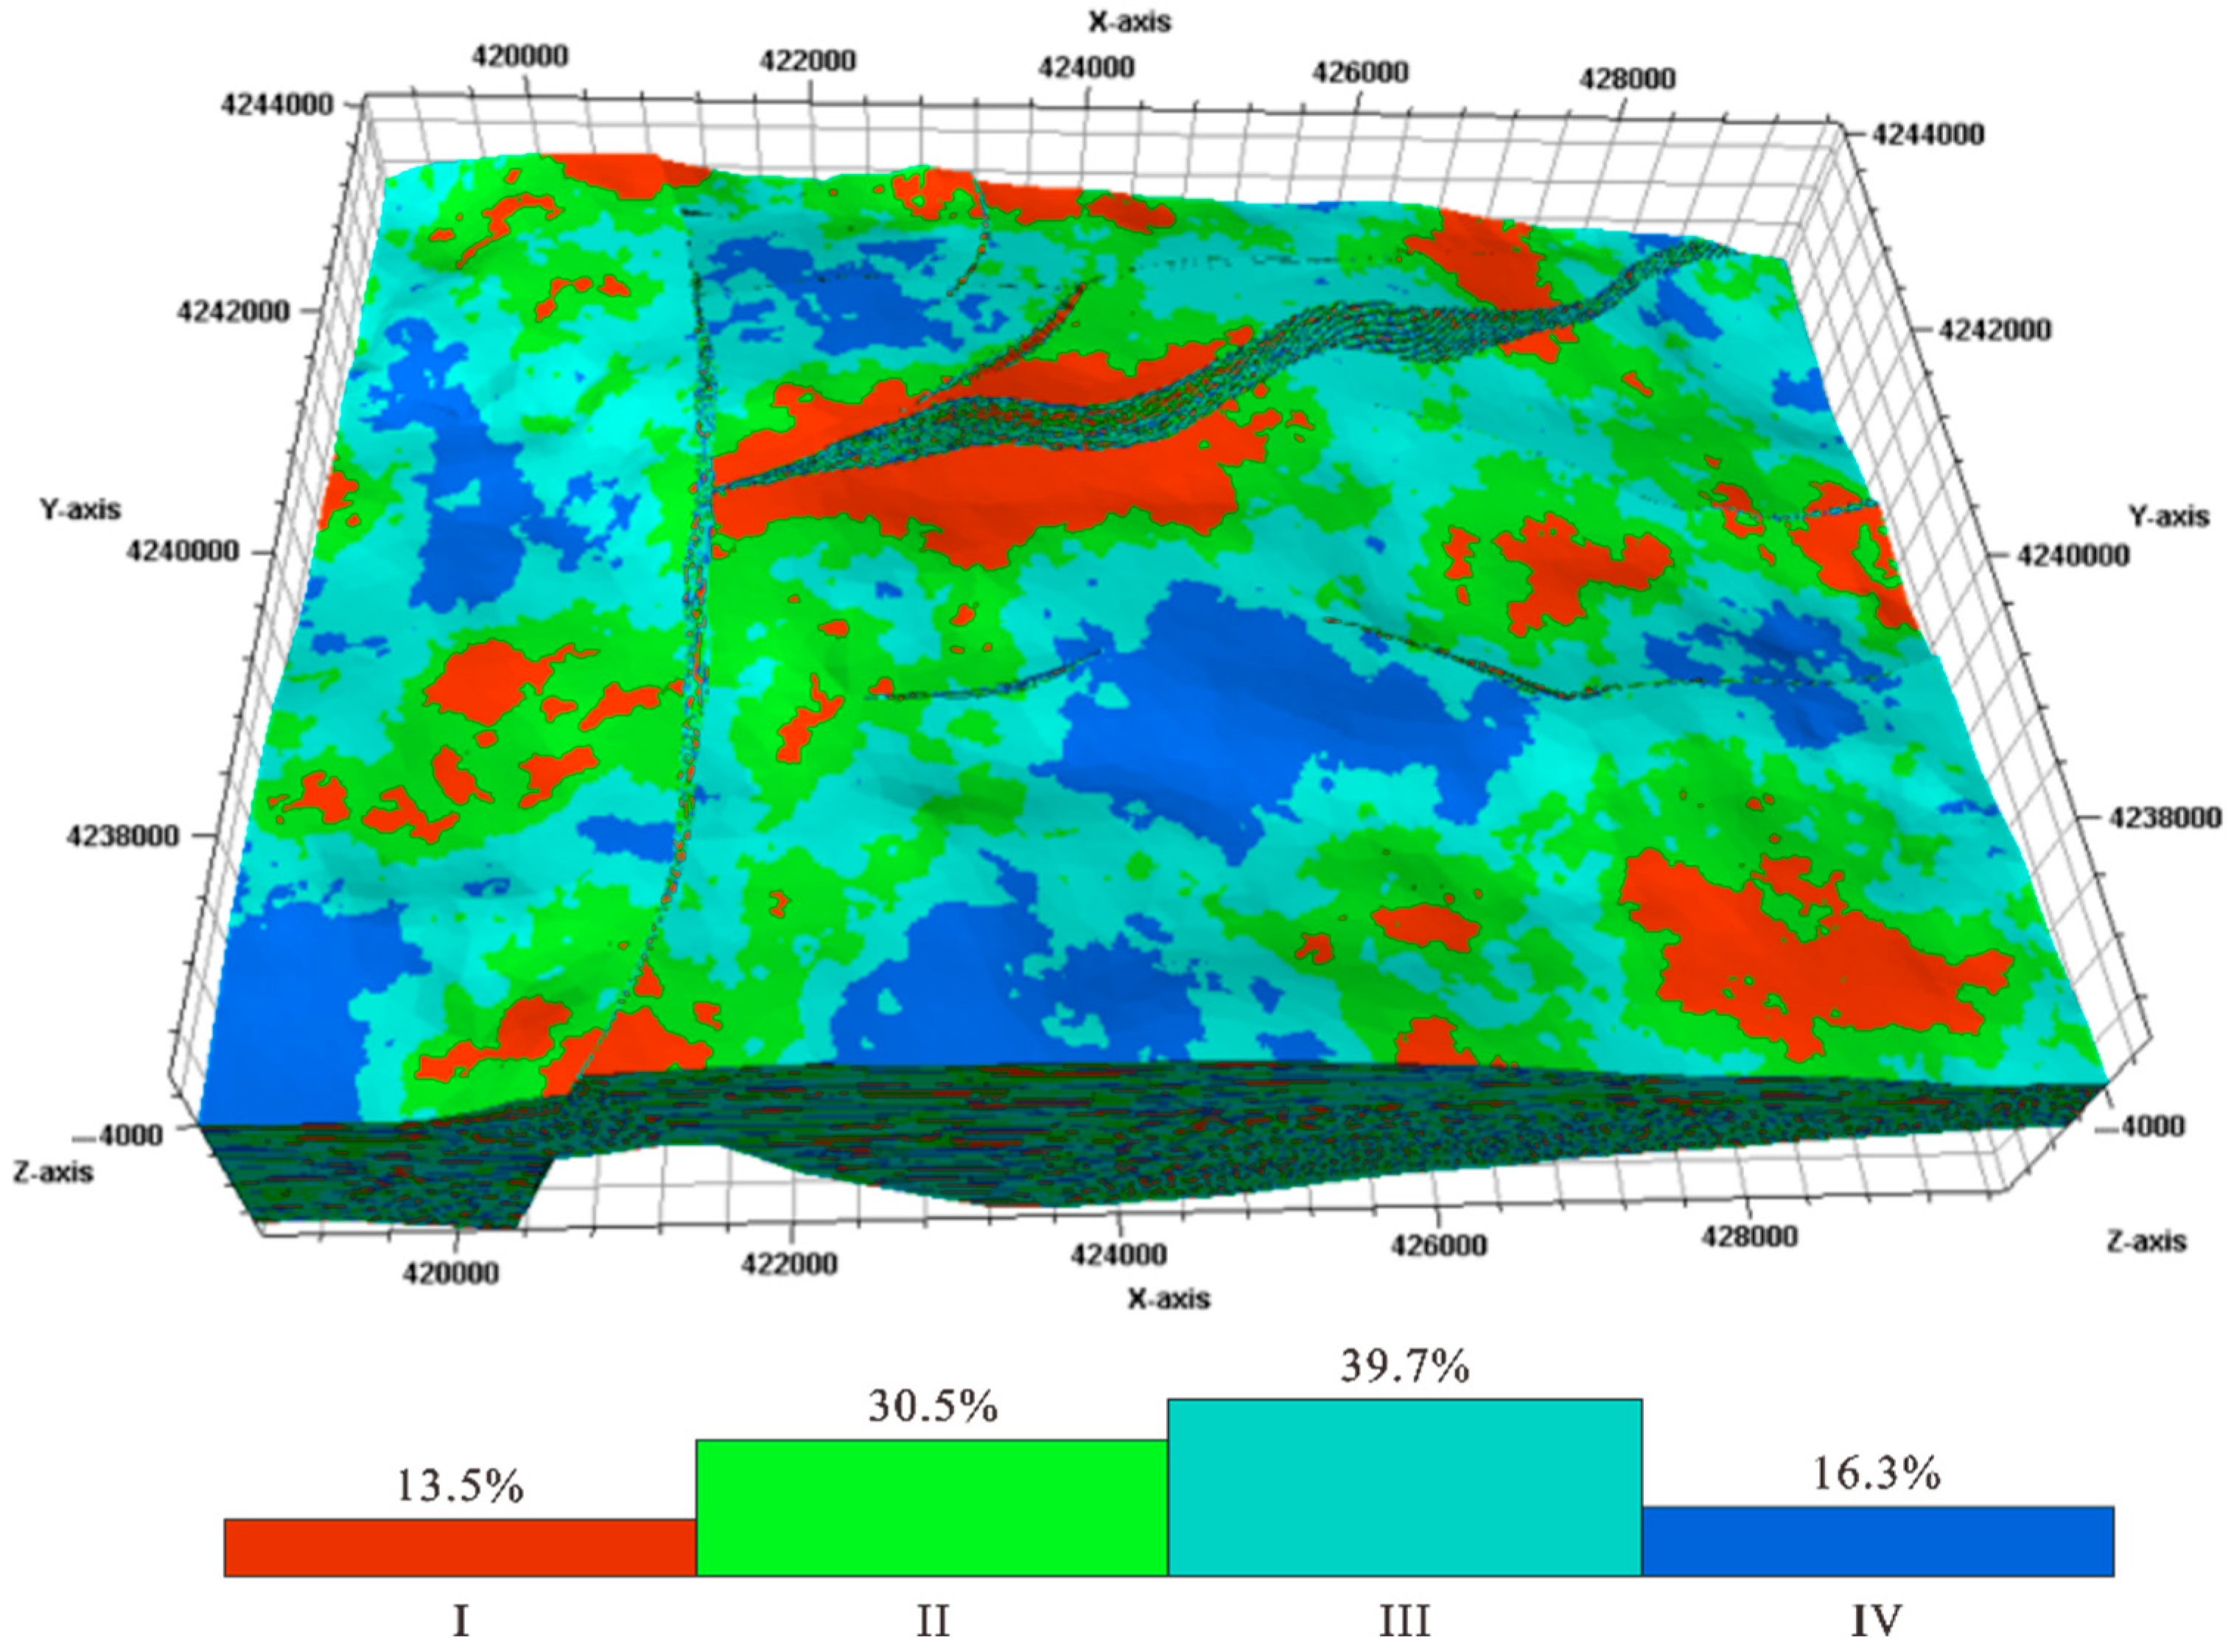
Combined with the completion of the experimental classification of for low-permeability reservoirs in Oilfield A, the classification standard of I for the geological sweet spot indicator factor was established. The range of the geological sweet spots indicator factor is 0~1, and the mercury pressure experiment shows that the low-permeability reservoirs in the entire oilfield can be classified into four categories. Therefore, the classification interval of the geological sweet spots indicator factor in Oilfield A is 0.25 (Table 3). Complete the classification evaluation of the entire block reservoir through a three-dimensional spatial distribution model (Figure 8). In the four categories of low-permeability reservoirs in the entire oilfield, the proportion of category I is the lowest at 13.5%; the proportion of category III is the highest at 39.7%.
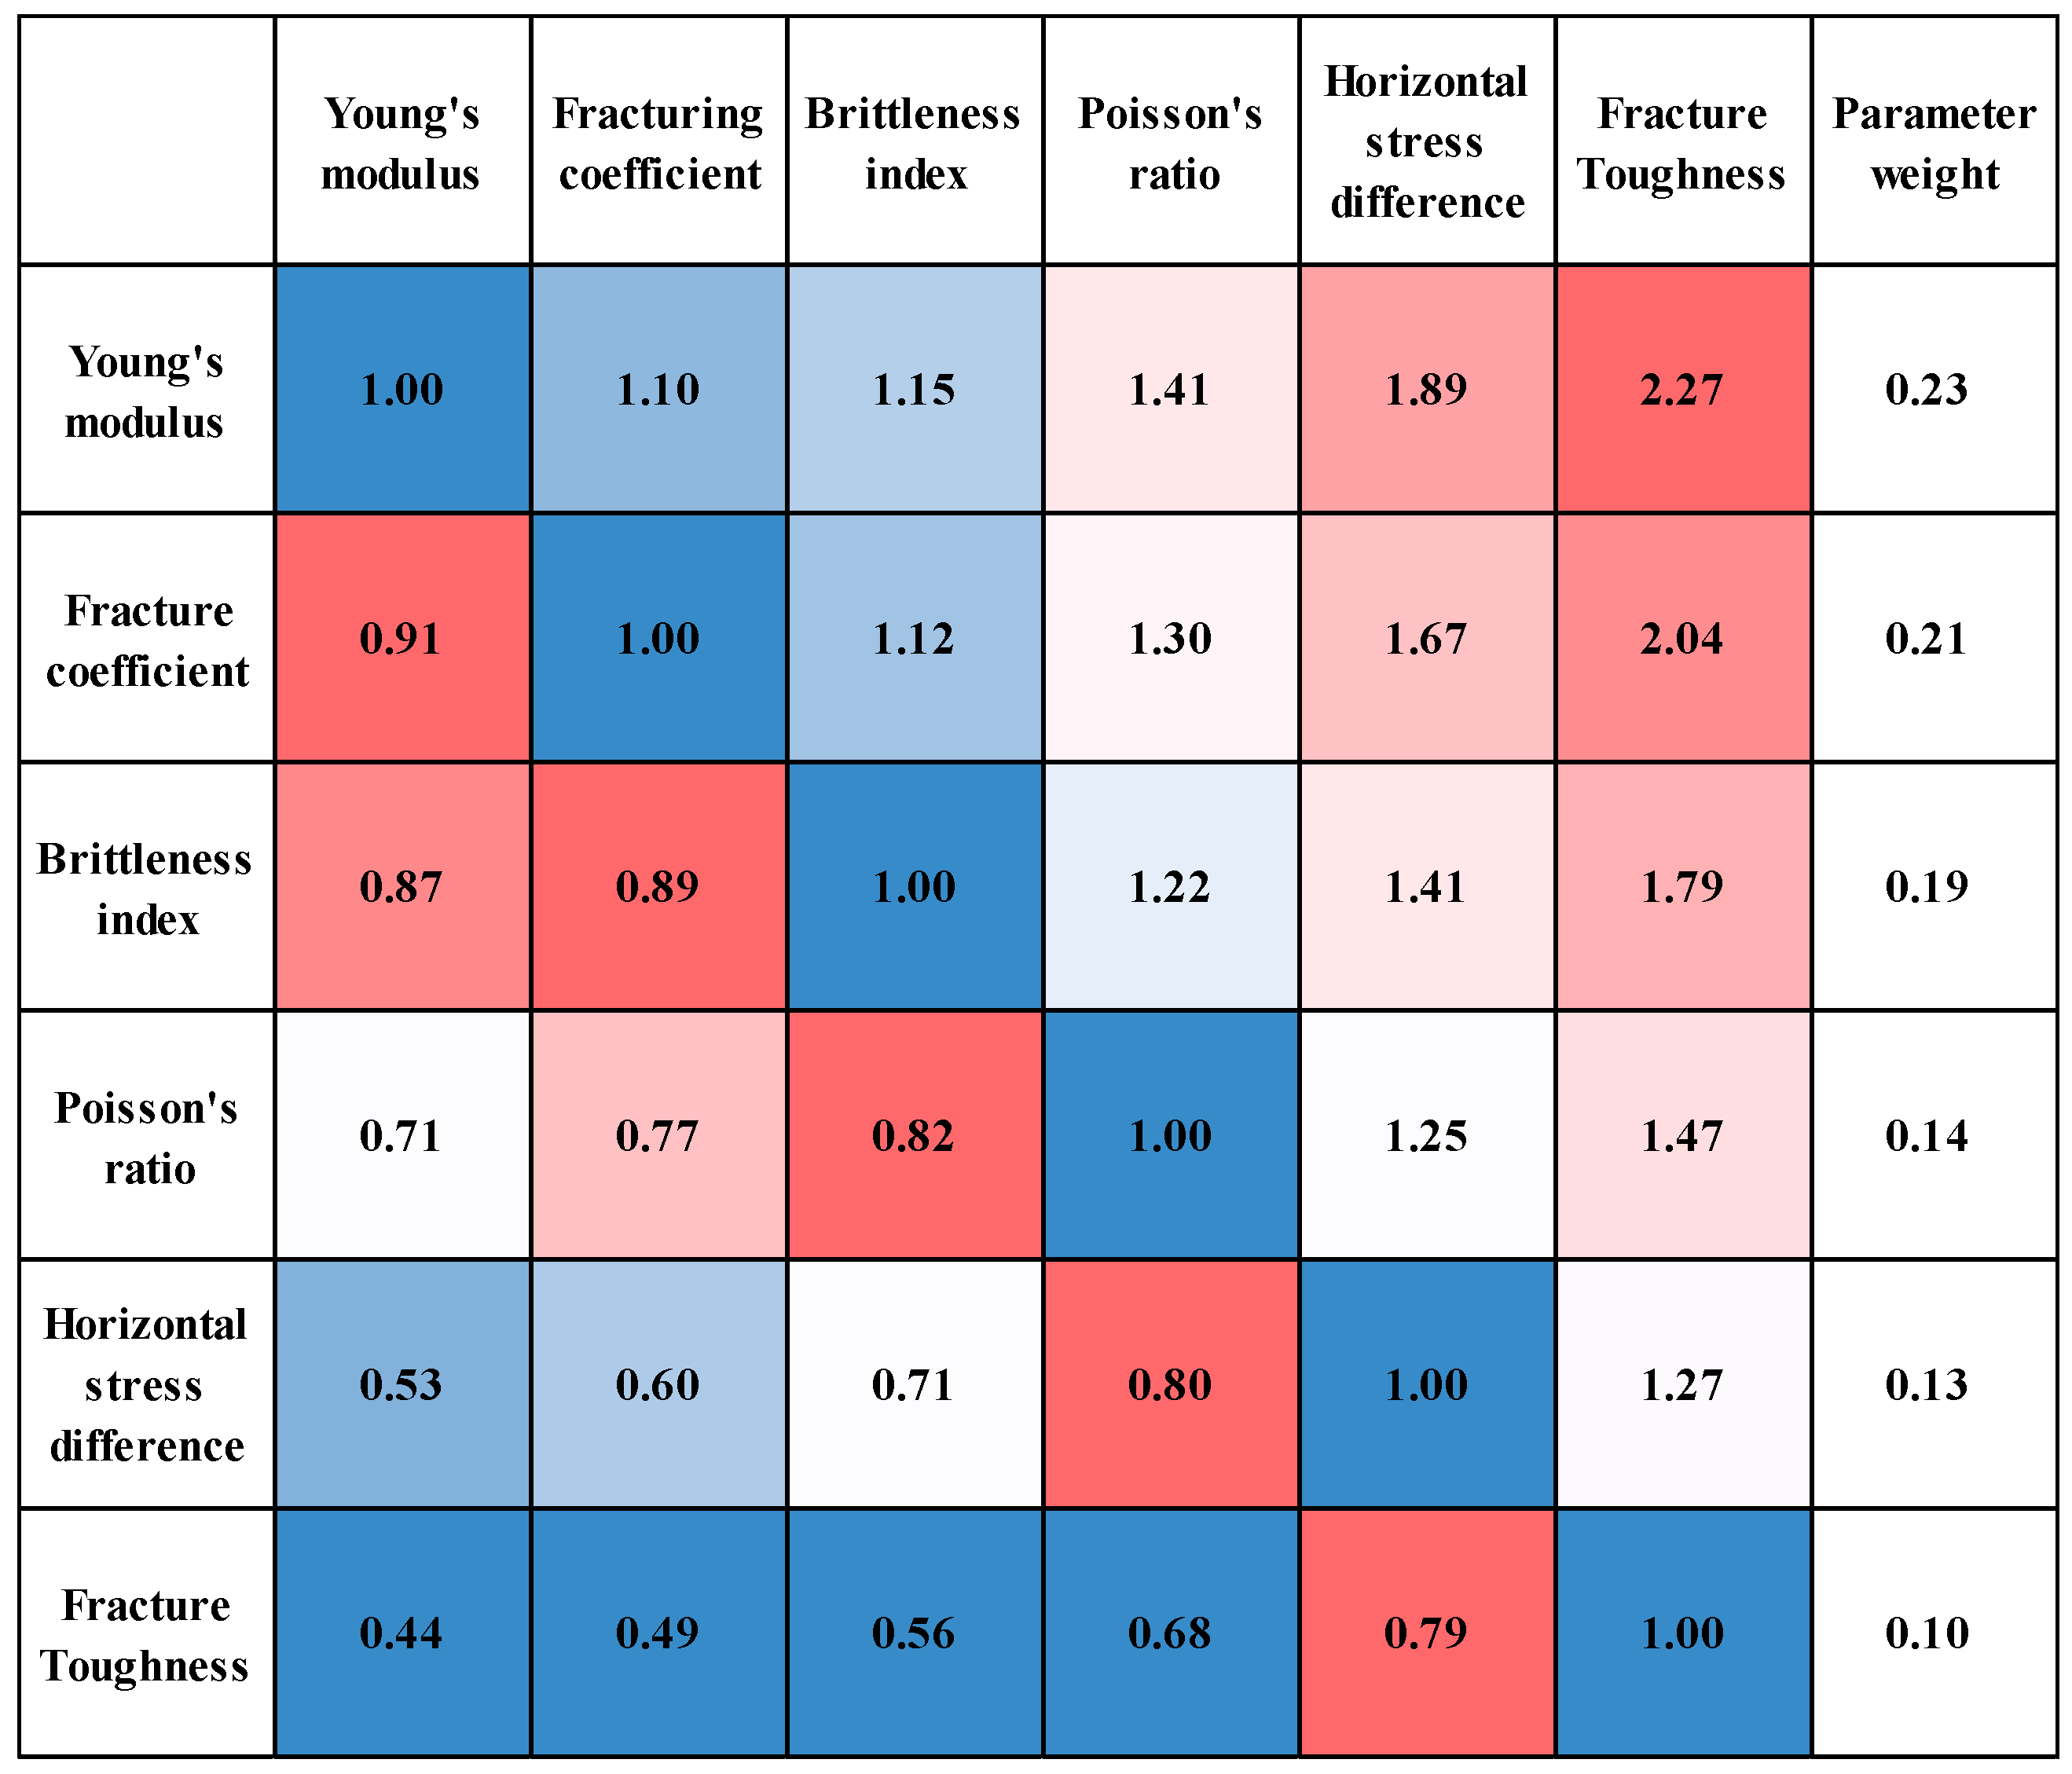
Adopting the same research method, the evaluation of engineering sweet spots influencing factors was completed and the heat map was established (Figure 9). The engineering factors are mainly Young’s modulus, fracture coefficient and brittleness index. Based on the weight coefficient method, complete the dimensionless transformation of each parameter according to Equation (23). The engineering sweet spots indicator factor S was obtained.
S = 0.23 E E m i n E m a x E m i n + 0.21 F     F m i n F m a x F m i n + 0.19 B B m i n B m a x B m i n + 0.14 μ μ m i n μ m a x μ m i n + 0.13 β β m i n β m a x β m i n + 0.10 K I C K I C m i n K I C m a x K I C m i n
S is the engineering sweetness indicator factor. E is Young’s modulus; F is fracture coefficient; B is brittleness index; μ is Poisson’s ratio; β is horizontal stress difference; K I C is fracture toughness.
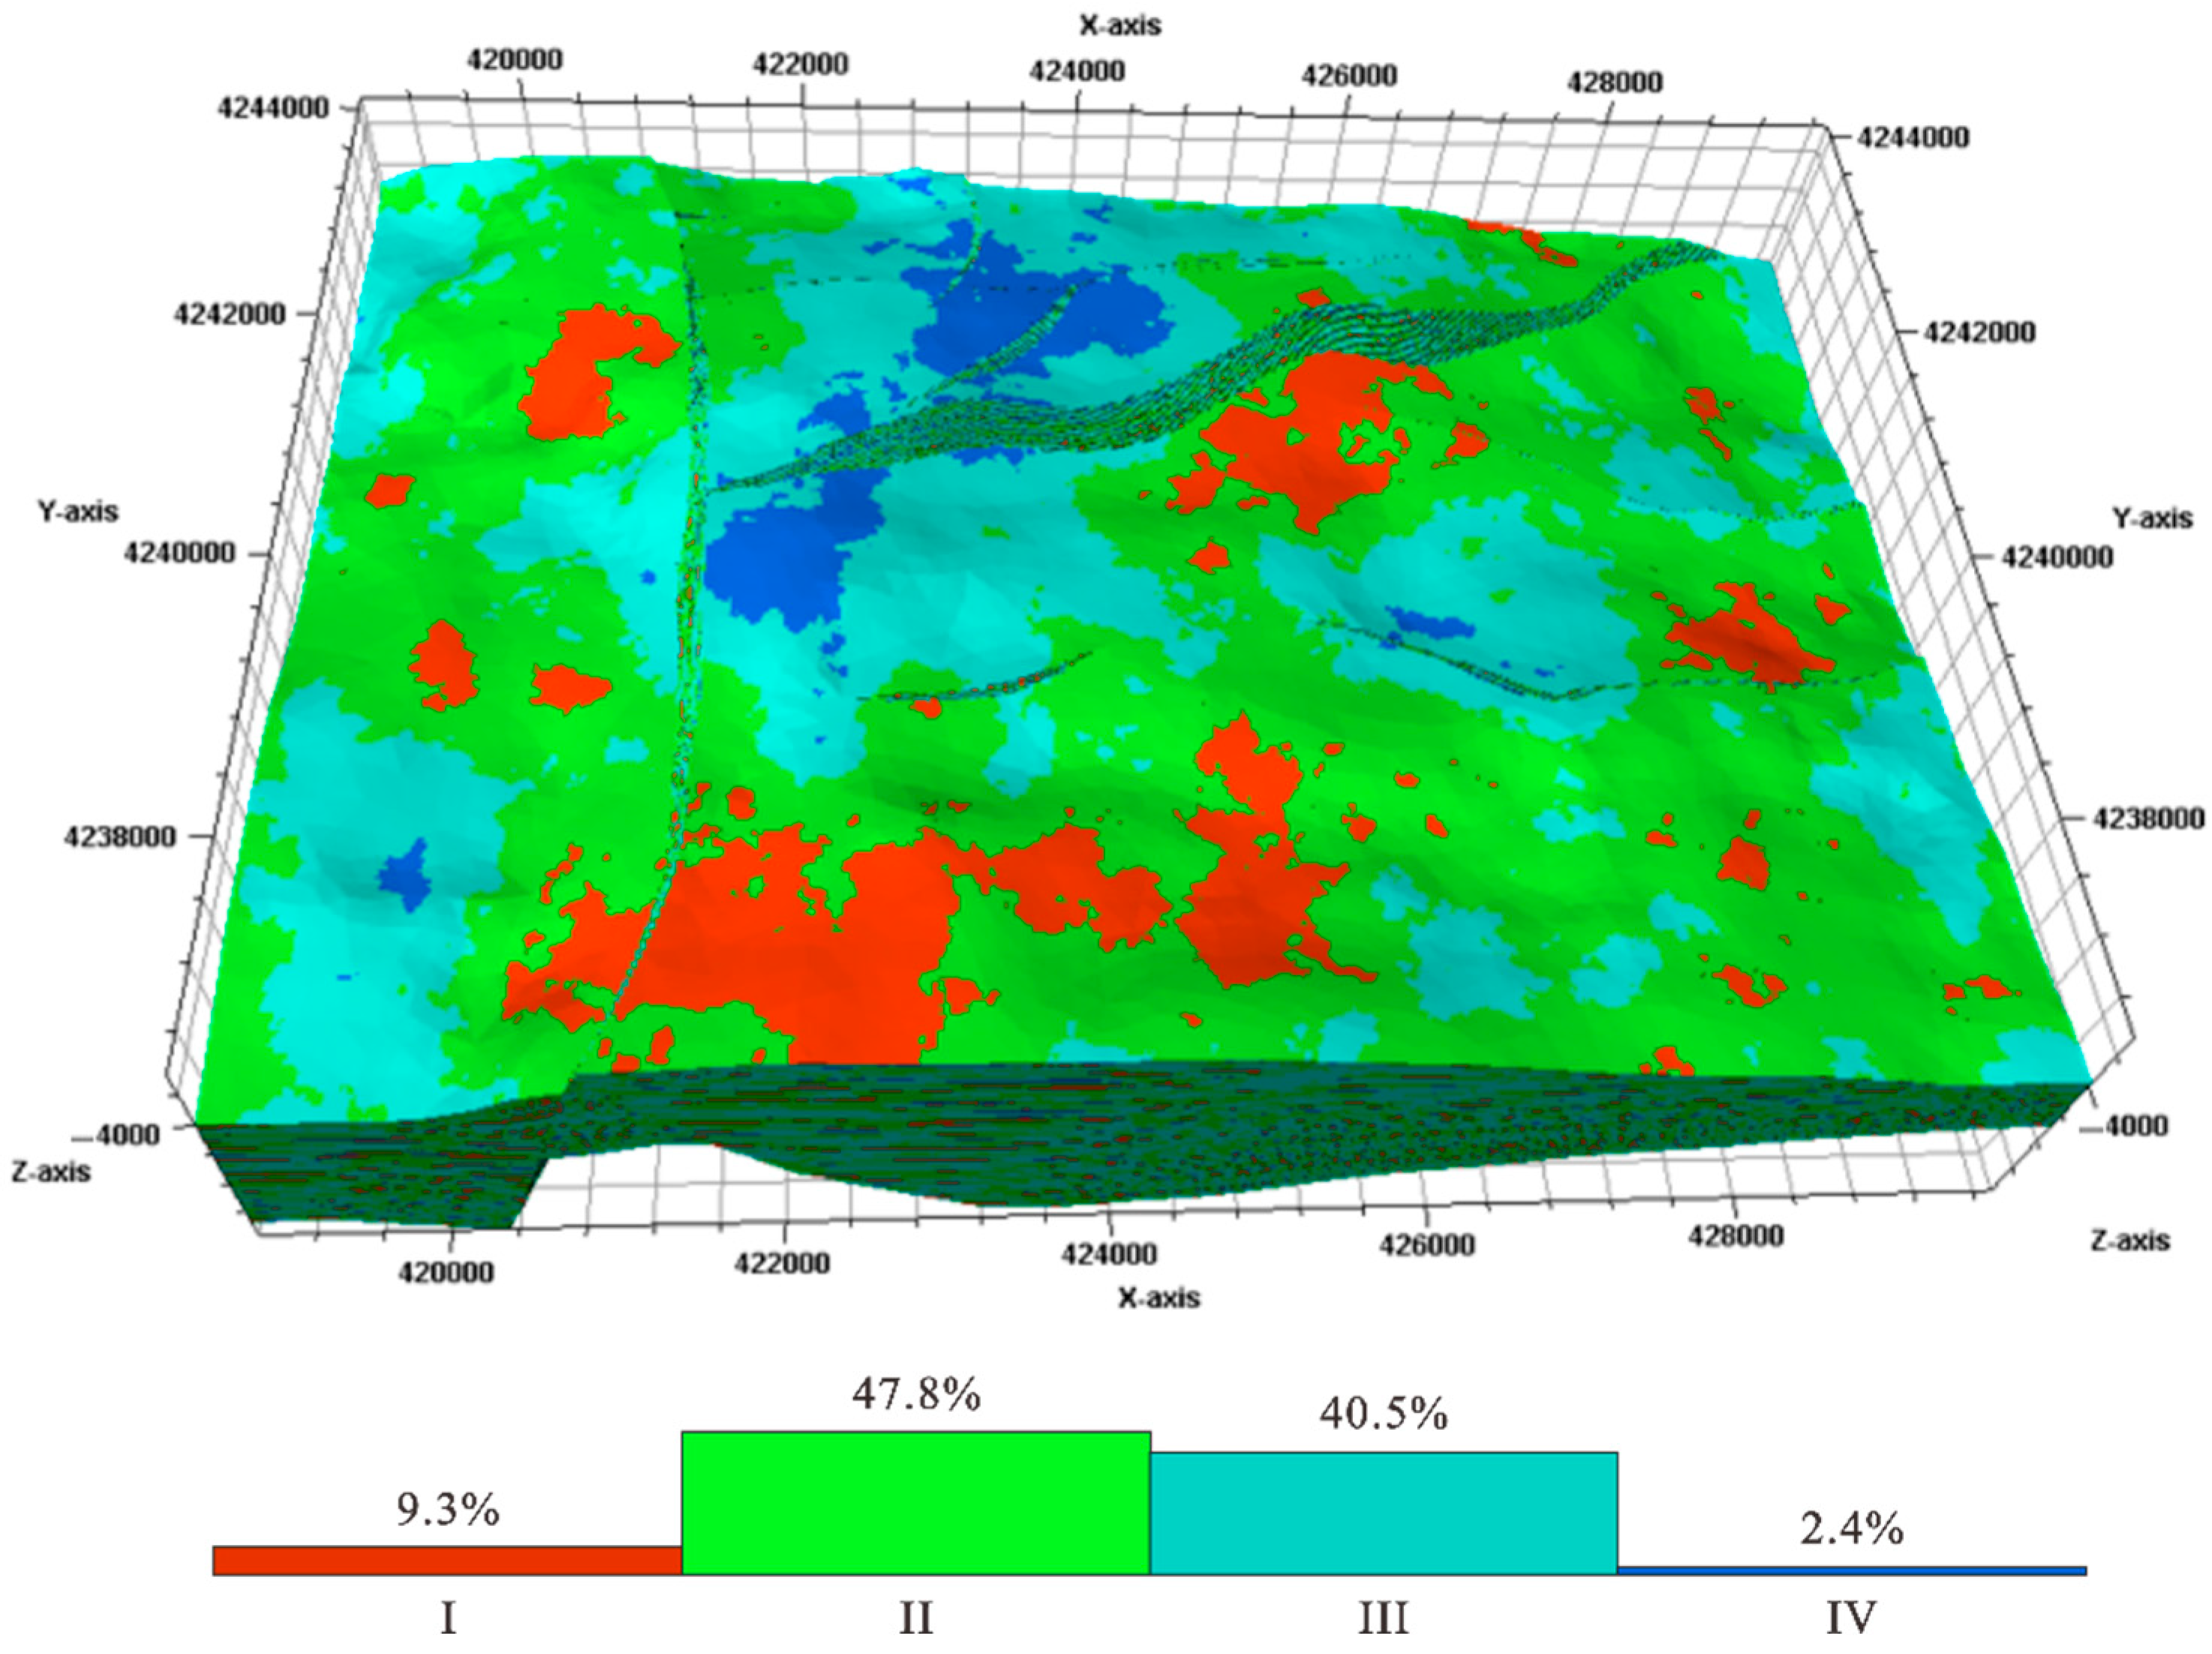
The engineering sweet spots indicator factors S in Oilfield A are divided into four categories (Table 4). Category I, with indicator factors ranging from 0.75 to 1, accounts for 9.3%; Category II, with indicator factors ranging from 0.5 to 0.75, accounts for 47.8%; Category III, with indicator factors ranging from 0.25 to 0.5, accounts for 40.5%; and Category IV, with indicator factors ranging from 0 to 0.25, accounts for 2.4%.
Through the combination of grey relational and analytic hierarchy process methods, we completed the evaluation of geological and engineering sweet spots indicator factors. It is possible to achieve rapid evaluation of geological and engineering sweet spots on the basis of seismic data, a small amount of logging data, and core data. The reservoir classification conducted in this study divides sweet spots indicators into four categories (Figure 10). Correspondingly, the boundary division of geological and engineering parameters is completed. Through the results of model prediction, carry out the selection of wells and layers for offshore low-permeability reservoir development. Provide technical support for low-permeability reservoirs to obtain maximum production.
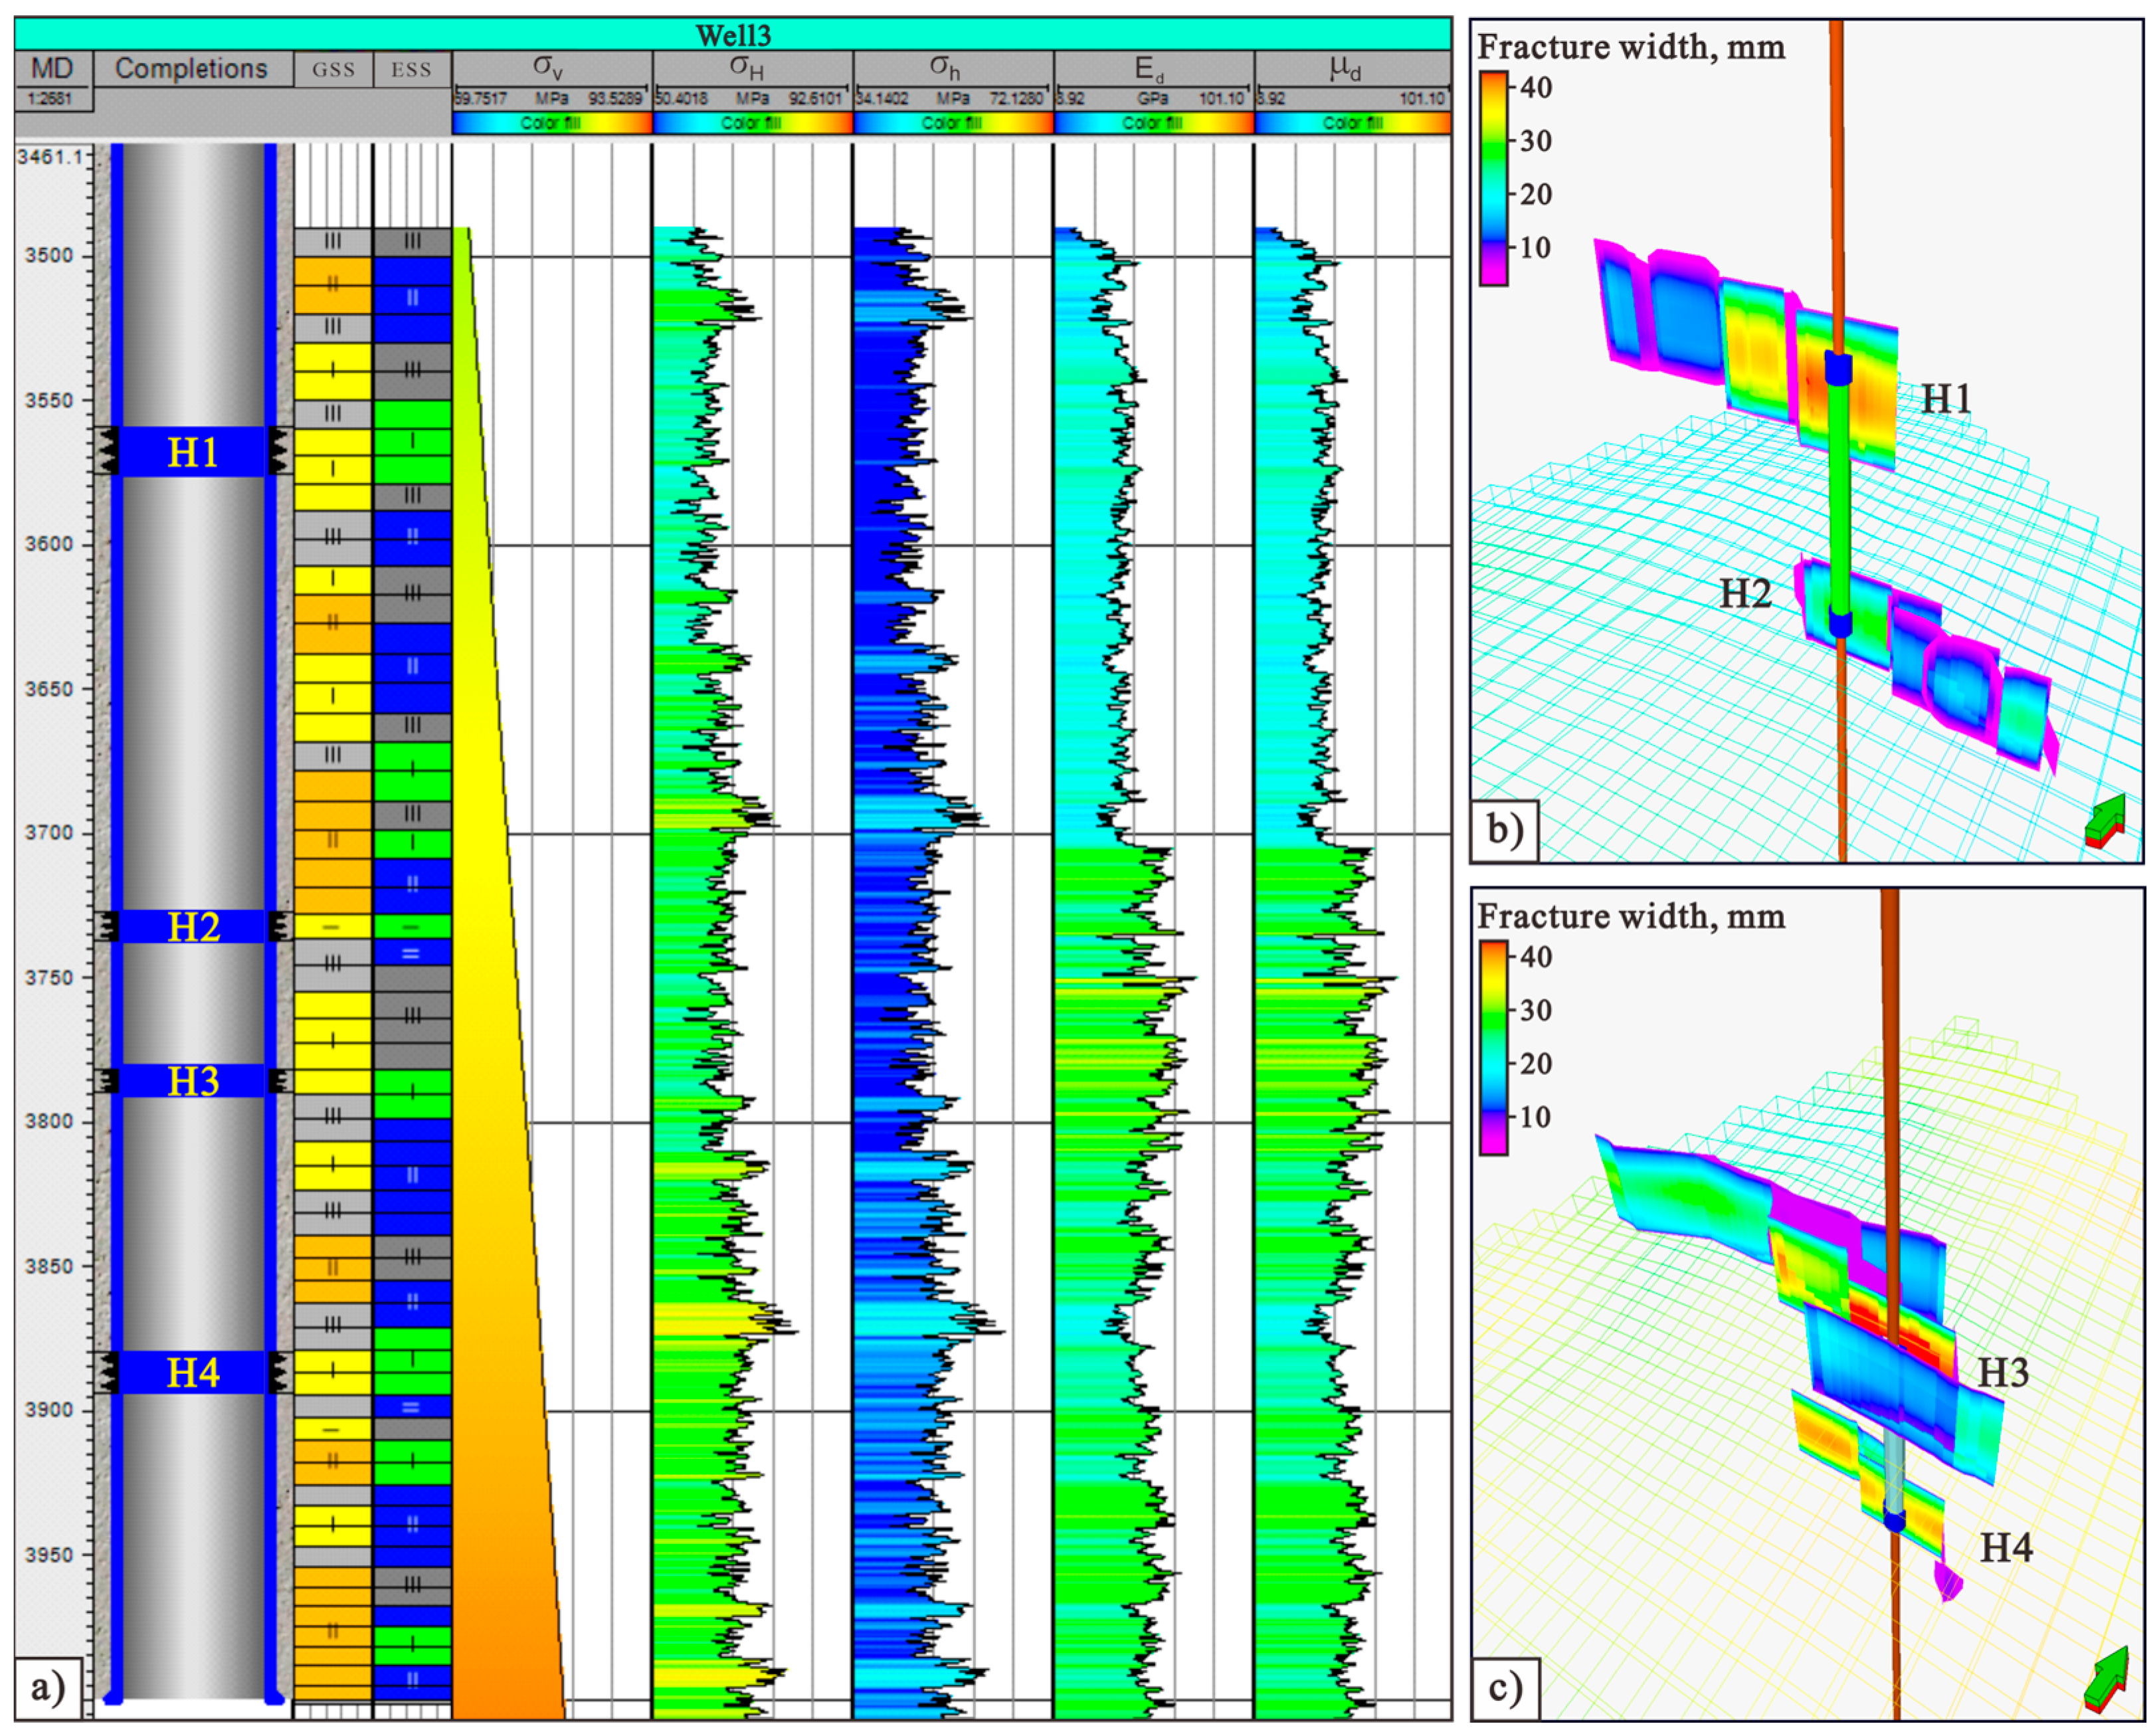
Taking well A3 as an example, we carry out advantageous layer selection and capacity evaluation. The numerical model parameters of Oilfield A are shown in Table 5. Based on our “double-sweet spots” evaluation method, we complete the “double-sweet spots” identification of low-permeability reservoir in well A3. Well A3 mainly includes geological sweet spots of categories I, II, and III, as well as engineering sweet spots of categories I, II, and III (Figure 11a). We selected four layers for fracturing capacity evaluation. All of them belong to category I geological sweet spots and category I engineering sweet spots; i.e., H1, H2, H3, and H4 are category I “double-sweet spots”, with thicknesses of 13.3 m, 8.68 m, 8.1 m, and 14.46 m. The fracturing parameters used were designed according to the fracturing construction parameters of well A3 (Table 6). The spatial spreading characteristics of the fracture after fracturing in each section are shown in Figure 11b,c. The fracture length ranges from 81.52 to 147.29 m.
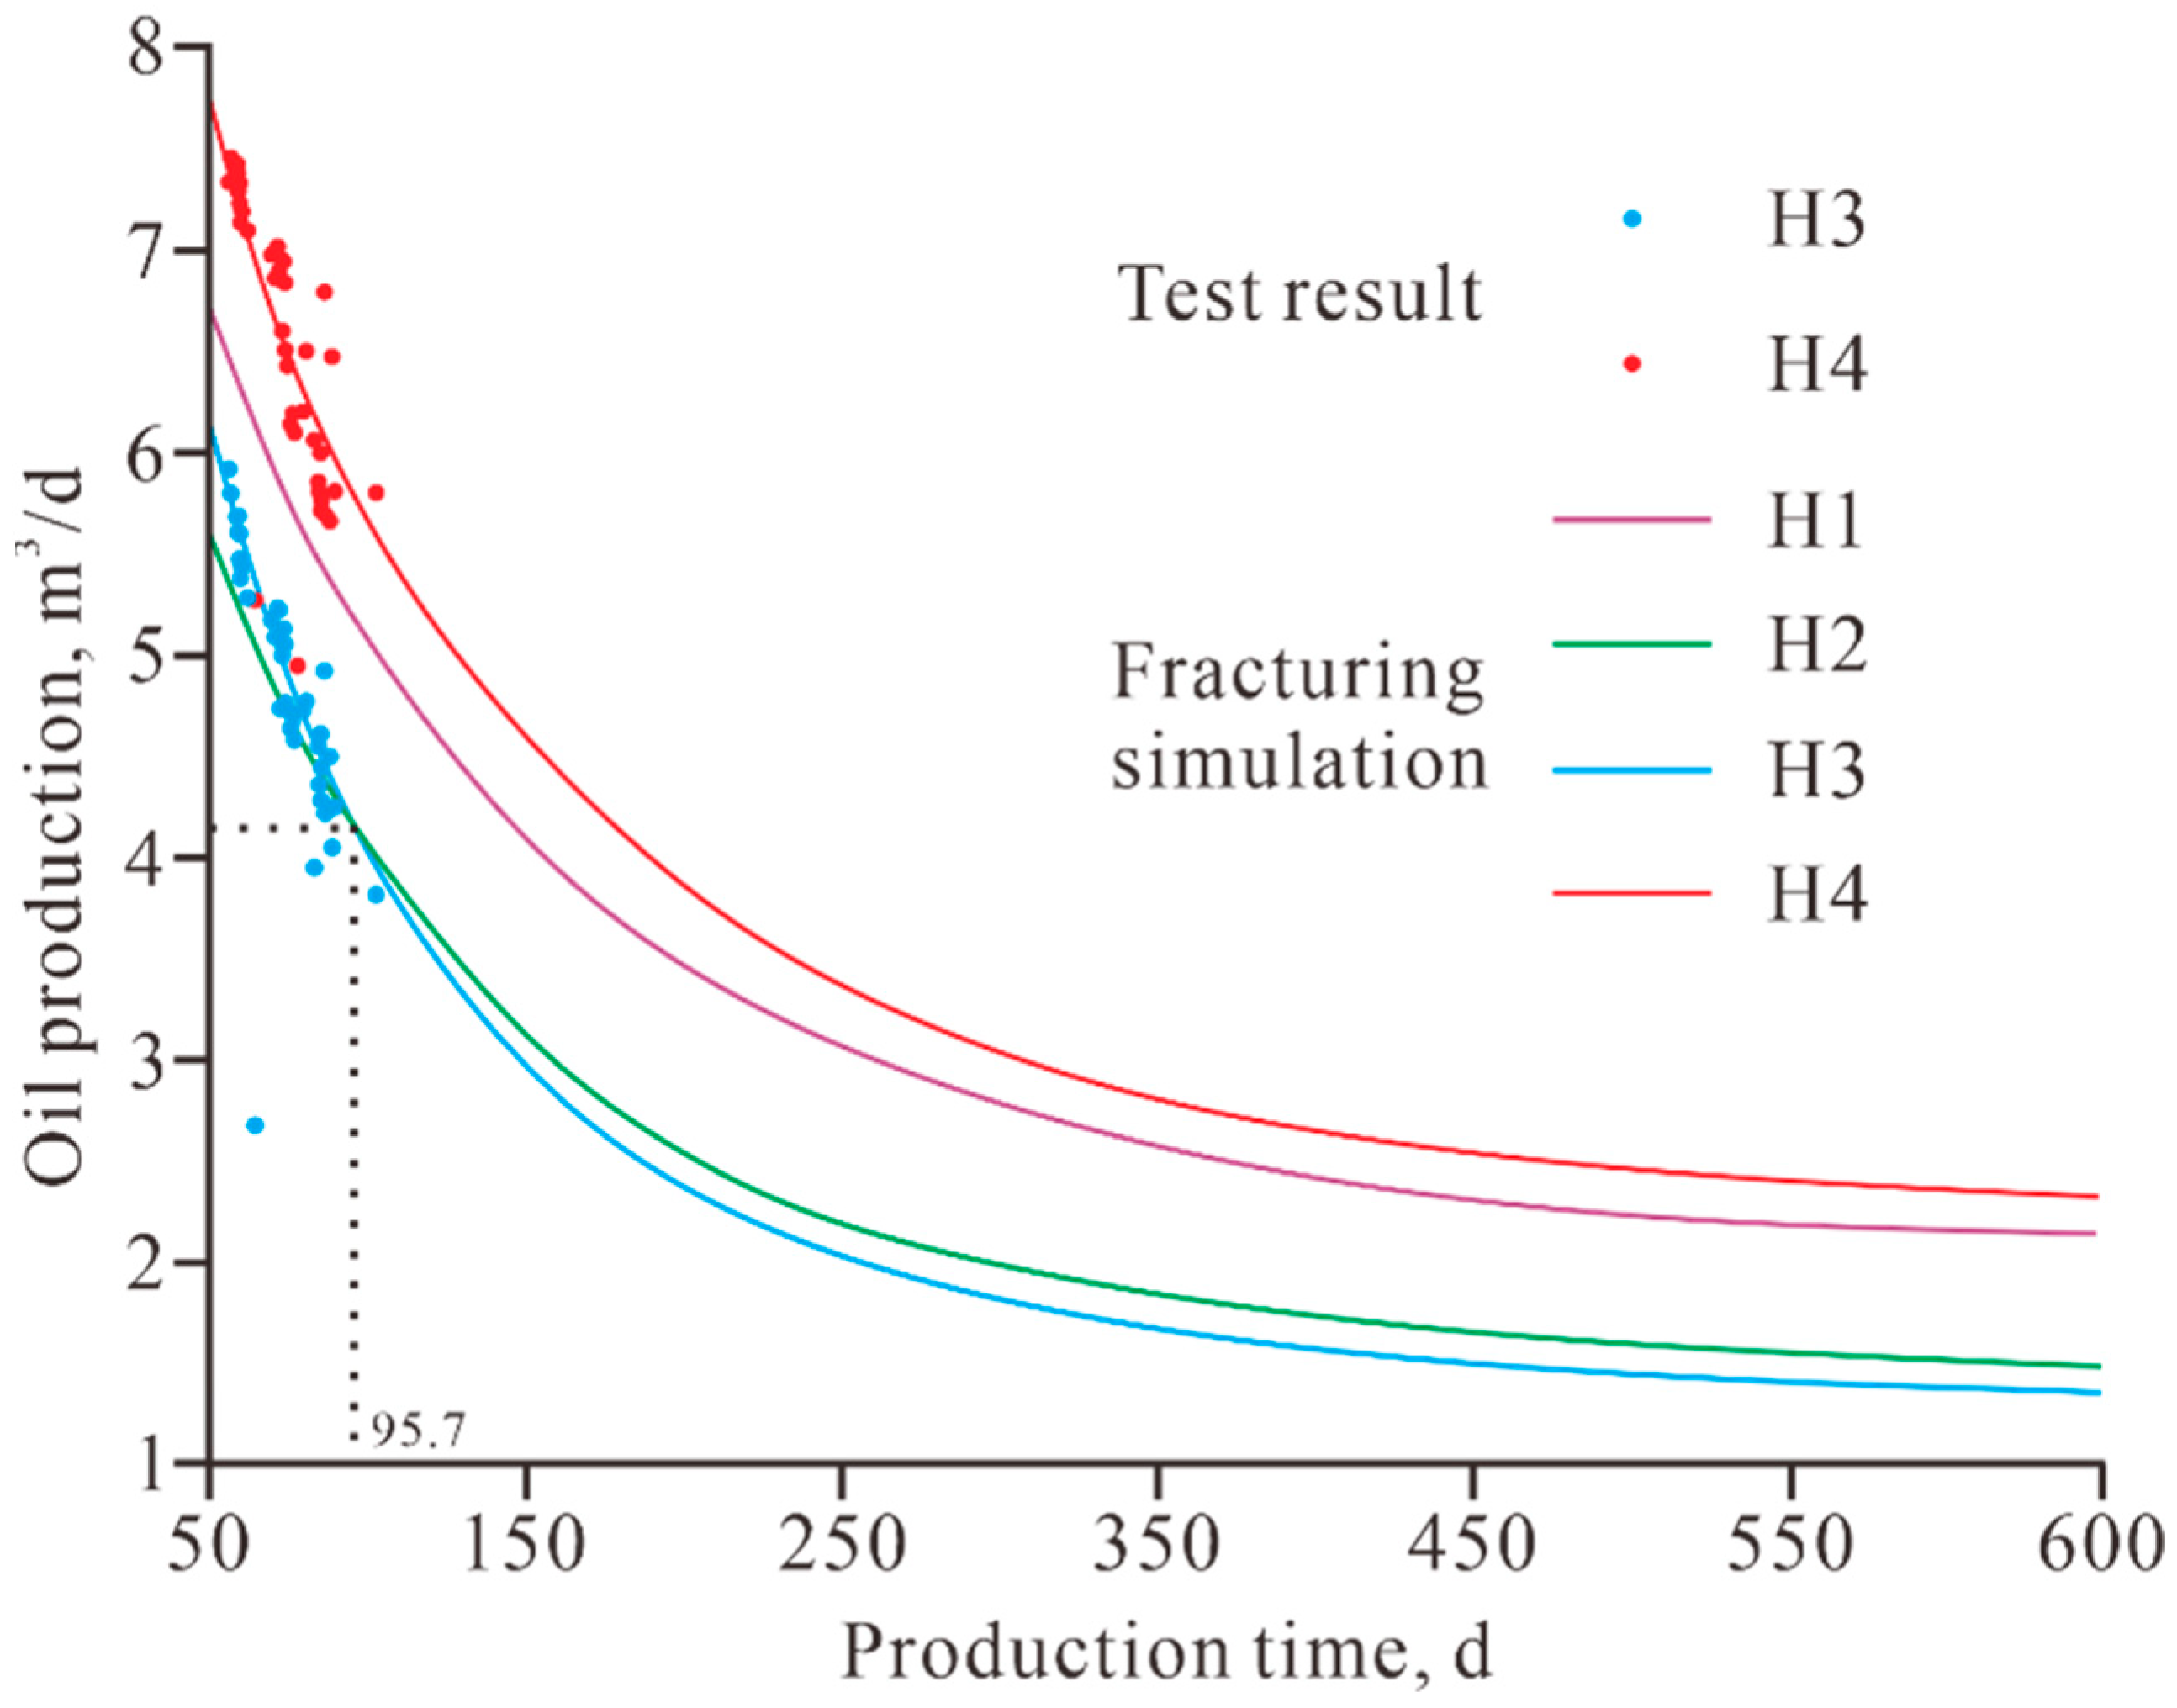
After fracturing the four reservoirs of Well A3, significant results were achieved, with each layer regaining its production capacity. The H3 and H4 layers were tested for capacity 50 days after completion of the fracturing process. It was highly matched with the predicted results of the capacity of the fracturing simulation (Figure 12). This shows the accuracy of our “double-sweet spots” evaluation results.

4. Discussion

The method established in this study can effectively and quickly evaluate the distribution characteristics of geological and engineering “double-sweet spots” in low-permeability reservoirs. Based on the characteristics of double-sweet spots at different levels, the production capacity after fracturing can be quickly evaluated. The evaluation method proposed in this study can be applied to other offshore low-permeability oilfields with similar geological characteristics.
This study integrates seismic inversion with reservoir numerical simulation to achieve spatial distribution prediction of geological–engineering dual sweet spots. It addresses the limitations of previous studies, which relied solely on single methods for sweet spots prediction, resulting in the inability to establish a unified three-dimensional evaluation model and low accuracy in sweet spots identification and prediction [20,21]. In terms of evaluation methods, traditional studies have primarily focused on independent analyses of geological sweet spots or engineering sweet spots, lacking systematic coupling.
This study combines grey relational analysis with the analytic hierarchy process, considering 12 reservoir parameters that influence the production capacity of offshore low-permeability oilfields. It proposes objective, generalisable geological–engineering sweet spots indicator factors. This enables the classification of reservoir types, directly defining whether a reservoir has development potential. Compared to directly defining the lower limit of development permeability for reservoirs [22], we consider the contribution of both geological and engineering aspects to production capacity. This provides guidance for reservoir fracturing design. Fracturing results show that the geological–engineering “double-sweet spots” production capacity of A3 well category I are more than 5 m3/d, and the highest reaches 7.78 m3/d. Compared with the H4 layer, the thickness of the two sandstone layers in the H1 layer is similar. The engineering sweet spots indicator factor of the H1 layer is larger than that of the H4 layer, but the geological sweet spots indicator factor of the H1 layer is smaller than that of the H4 layer. After fracturing, the H1 layer has a more obvious effect in increasing the capacity, but the capacity decay rate is also faster. The H2 layer and H3 layer production show the same characteristics. The H3 layer has a high engineering sweet spots indicator factor, and the capacity release ability after fracturing is stronger. The initial production capacity is higher than that of the H2 layer. However, due to the low geological sweet spots indicator factor of the H3 layer, the production capacity is lower than that of the H2 layer after 95.7 days of fracturing and production. It can be seen that geological sweet spots of low-permeability reservoirs provide support for long-term production capacity after reservoir modification. The engineering sweet spots mainly affect the production increase effect at the initial stage of reservoir modification.

5. Conclusions

1. This study introduces a rapid geological–engineering “double-sweet spots” evaluation method for offshore low-permeability reservoirs. It is based on drilling, logging, seismic and dynamic data. Based on grey relational and analytic hierarchy process method, it achieves the classification of geological and engineering sweet spots. Combined with seismic inversion, 3D geological modelling and reservoir numerical simulation technology, the method can complete the 3D portrayal of different categories of sweet spots and the evaluation of “double-sweet spots” combination.
2. Geological sweet spots provide support for the long-term production capacity of low-permeability reservoirs after transformation. And the engineering dessert affects the initial production increase effect of reservoir transformation. The evaluation of “double desserts” should be based on the production capacity limit and production time of the production well.

Author Contributions

Conceptualization, Y.L.; Methodology, H.Z.; Validation, Y.G.; Formal Analysis, L.L.; Resources, Y.G.; Data Curation, Y.L. and H.Z.; Writing—Original Draft, Y.L.; Writing—Review and Editing, H.Z.; Visualisation, S.G.; Project Administration, Z.L.; Funding Acquisition, Y.L. and Z.L. All authors have read and agreed to the published version of the manuscript.

Funding

This research was funded by the Guiding Innovation Fund of Northeast Petroleum University (2023YDL-02), the Hainan Province major science and technology project (ZDKJ2021025), the Natural Science Foundation of Hainan Province (521MS0793) and the Daqing Guiding Science and Technology Plan Project (zd-2024-16).

Data Availability Statement

The original contributions presented in this study are included in the article. Further inquiries can be directed to the corresponding author.

Acknowledgments

The authors gratefully acknowledge the anonymous reviewers for their insightful feedback, which significantly improved the quality of this work.

Conflicts of Interest

Authors Yan Ge and Lingtong Liu were employed by the CNOOC Energy Technology & Services Limited. Author Shuwen Guo was employed by the PetroChina. The authors declare that the research was conducted in the absence of any commercial or financial relationships that could be construed as a potential conflict of interest.

References

  1. Chen, S.; Wang, S.; Zhang, Y.; Ji, M. Reservoir prediction using pre-stack inverted elastic parameters. Appl. Geophys. 2009, 6, 349–358. [Google Scholar] [CrossRef]
  2. Ahmed, N.; Khalid, P.; Anwar, A.W. Rock physics modelling to assess the impact of spatial distribution pattern of pore fluid and clay contents on acoustic signatures of partially-saturated reservoirs. Acta Geod. Geophys. 2016, 51, 1–13. [Google Scholar] [CrossRef]
  3. Ehsan, M.; Ahmed, N.; Khalid, P.; Wei, L.X.; Naeem, M. An application of rock physics modeling to quantify the seismic response of gas hydrate-bearing sediments in Makran accretionary prism, offshore, Pakistan. Geosci. J. 2016, 20, 321–330. [Google Scholar] [CrossRef]
  4. Liu, J.; He, Z.L.; Liu, X.W.; Huo, Z.Z.; Guo, P. Using frequency-dependent AVO inversion to predict the “sweet spots” of shale gas reservoirs. Mar. Pet. Geol. 2019, 102, 283–291. [Google Scholar] [CrossRef]
  5. Zhou, H.T.; Li, D.Y.; Liu, X.T.; Du, Y.S.; Gong, W. Sweet spot prediction in tight sandstone reservoir based on well-bore rock physical simulation. Pet. Sci. 2019, 16, 1285–1300. [Google Scholar] [CrossRef]
  6. Yagiz, S. Assessment of brittleness using rock strength and density with punch penetration test. Tunn. Undergr. Space Technol. 2009, 24, 66–74. [Google Scholar] [CrossRef]
  7. Jarvie, D.M.; Hill, R.J.; Ruble, T.E.; Pollastro, R.M. Unconventional shale-gas systems: The Mississippian Barnett Shale of north-central Texas as one model for thermogenic shale-gas assessment. AAPG Bull. 2007, 91, 475–499. [Google Scholar] [CrossRef]
  8. Chong, K.K.; Grieser, W.V.; Passman, A.; Tamayo, C.H.; Modeland, N.; Burke, B. A Completions Guide Book to Shale-Play Development: A Review of Successful Approaches Towards Shale-Play Stimulation in the Last Two Decades. In Proceedings of the Canadian Unconventional Resources and International Petroleum Conference, Calgary, AB, Canada, 19–21 October 2010. [Google Scholar] [CrossRef]
  9. Jin, X.; Shah, S.N.; Roegiers, J.C.; Zhang, B. An Integrated Petrophysics and Geomechanics Approach for Fracability Evaluation in Shale Reservoirs. SPE J. 2015, 20, 518–526. [Google Scholar] [CrossRef]
  10. Bai, X.; Li, Z.; Lai, F.; Wang, L.; Wu, D. Method for evaluation of engineering sweet spots tight sandstone reservoir production wells. Arab. J. Geosci. 2021, 14, 2826. [Google Scholar] [CrossRef]
  11. Xiao, H.; Zhang, L.; Wang, S.; Xiang, J. Three-Dimensional Geological Engineering Double Desert Evaluation of Low-Permeability Sandstone Reservoirs. J. Energy Eng. 2025, 151, 04025012. [Google Scholar] [CrossRef]
  12. Gan, B.C.; Li, Z.D.; Zhang, H.X.; Zhang, Y.Z.; Huo, W.X.; Li, Z.; Xu, Y.Q.; Li, Y.H. Optimizing hydrate extraction: Balancing stability and production efficiency. Fuel 2025, 384, 134088. [Google Scholar] [CrossRef]
  13. Gan, B.C.; Li, Z.D.; Huo, W.X.; Zhang, Y.Z.; Li, Z.; Fan, R.B.; Zhang, H.X.; Xu, Y.Q.; He, Y.F. Phase transitions of CH4 hydrates in mud-bearing sediments with oceanic laminar distribution: Mechanical response and stabilization-type evolution. Fuel 2025, 380, 133185. [Google Scholar] [CrossRef]
  14. Wang, D.; Gan, B.; Li, Y.; Li, Z.; Zhang, H.; Yu, F. The Control Effect of Equipment Operation on the Formation of Wellbore Hydrates Under the Production Conditions of Deepwater Gas Wells. Processes 2025, 13, 1028. [Google Scholar] [CrossRef]
  15. Zhu, H.; Gong, D.; Zhang, B. A multi-scale geological–engineering sweet spot evaluation method for tight sandstone gas reservoirs. Nat. Gas Ind. B 2023, 10, 522–532. [Google Scholar] [CrossRef]
  16. Tureyen, O.I.; Caers, J. A parallel, multiscale approach to reservoir modeling. Comput. Geosci. 2005, 9, 75–98. [Google Scholar] [CrossRef]
  17. Tahmasebi, P.; Javadpour, F.; Sahimi, M. Data mining and machine learning for identifying sweet spots in shale reservoirs. Expert Syst. Appl. 2017, 88, 435–447. [Google Scholar] [CrossRef]
  18. Sahoo, A.K.; Basu, S.; Vishal, V.; Srivastava, M. Hierarchical clustering of Pristane and Phytane data to identify the sweet spots in the shale reservoirs. Energy Clim. Change 2020, 1, 100011. [Google Scholar] [CrossRef]
  19. Hassan, A.; Chan, S.; Mahmoud, M.; Aljawad, M.S.; Humphrey, J.; Abdulraheem, A. Artificial Intelligence-Based Model of Mineralogical Brittleness Index Based on Rock Elemental Compositions. Arab. J. Sci. Eng. 2022, 47, 11745–11761. [Google Scholar] [CrossRef]
  20. Lai, J.; Wang, G.W.; Fan, Z.Y.; Chen, J.; Wang, S.; Zhou, Z.; Fan, X. Research progress in brittleness index evaluation methods with logging data in unconventional oil and gas reservoirs. Pet. Sci. Bull. 2016, 1, 330–341. [Google Scholar] [CrossRef]
  21. Le, J.; Jing, Y.Q.; Liang, X.; Fan, H.J.; Cai, W.T. Using seismic response characteristics to predict “sweet spot” locations in a low permeability reservoir in the Bohai Sea. Geophys. Prospect. Pet. 2022, 61, 876–887. [Google Scholar] [CrossRef]
  22. Jiang, P.; Zhang, H.; Wang, L.; Wang, X.; Xiang, Y. An evaluation method of reservoir “sweet spots” in low permeability oilfields of Beibuwan Basin. Acta Pet. Sin. 2021, 42, 751–764. [Google Scholar] [CrossRef]
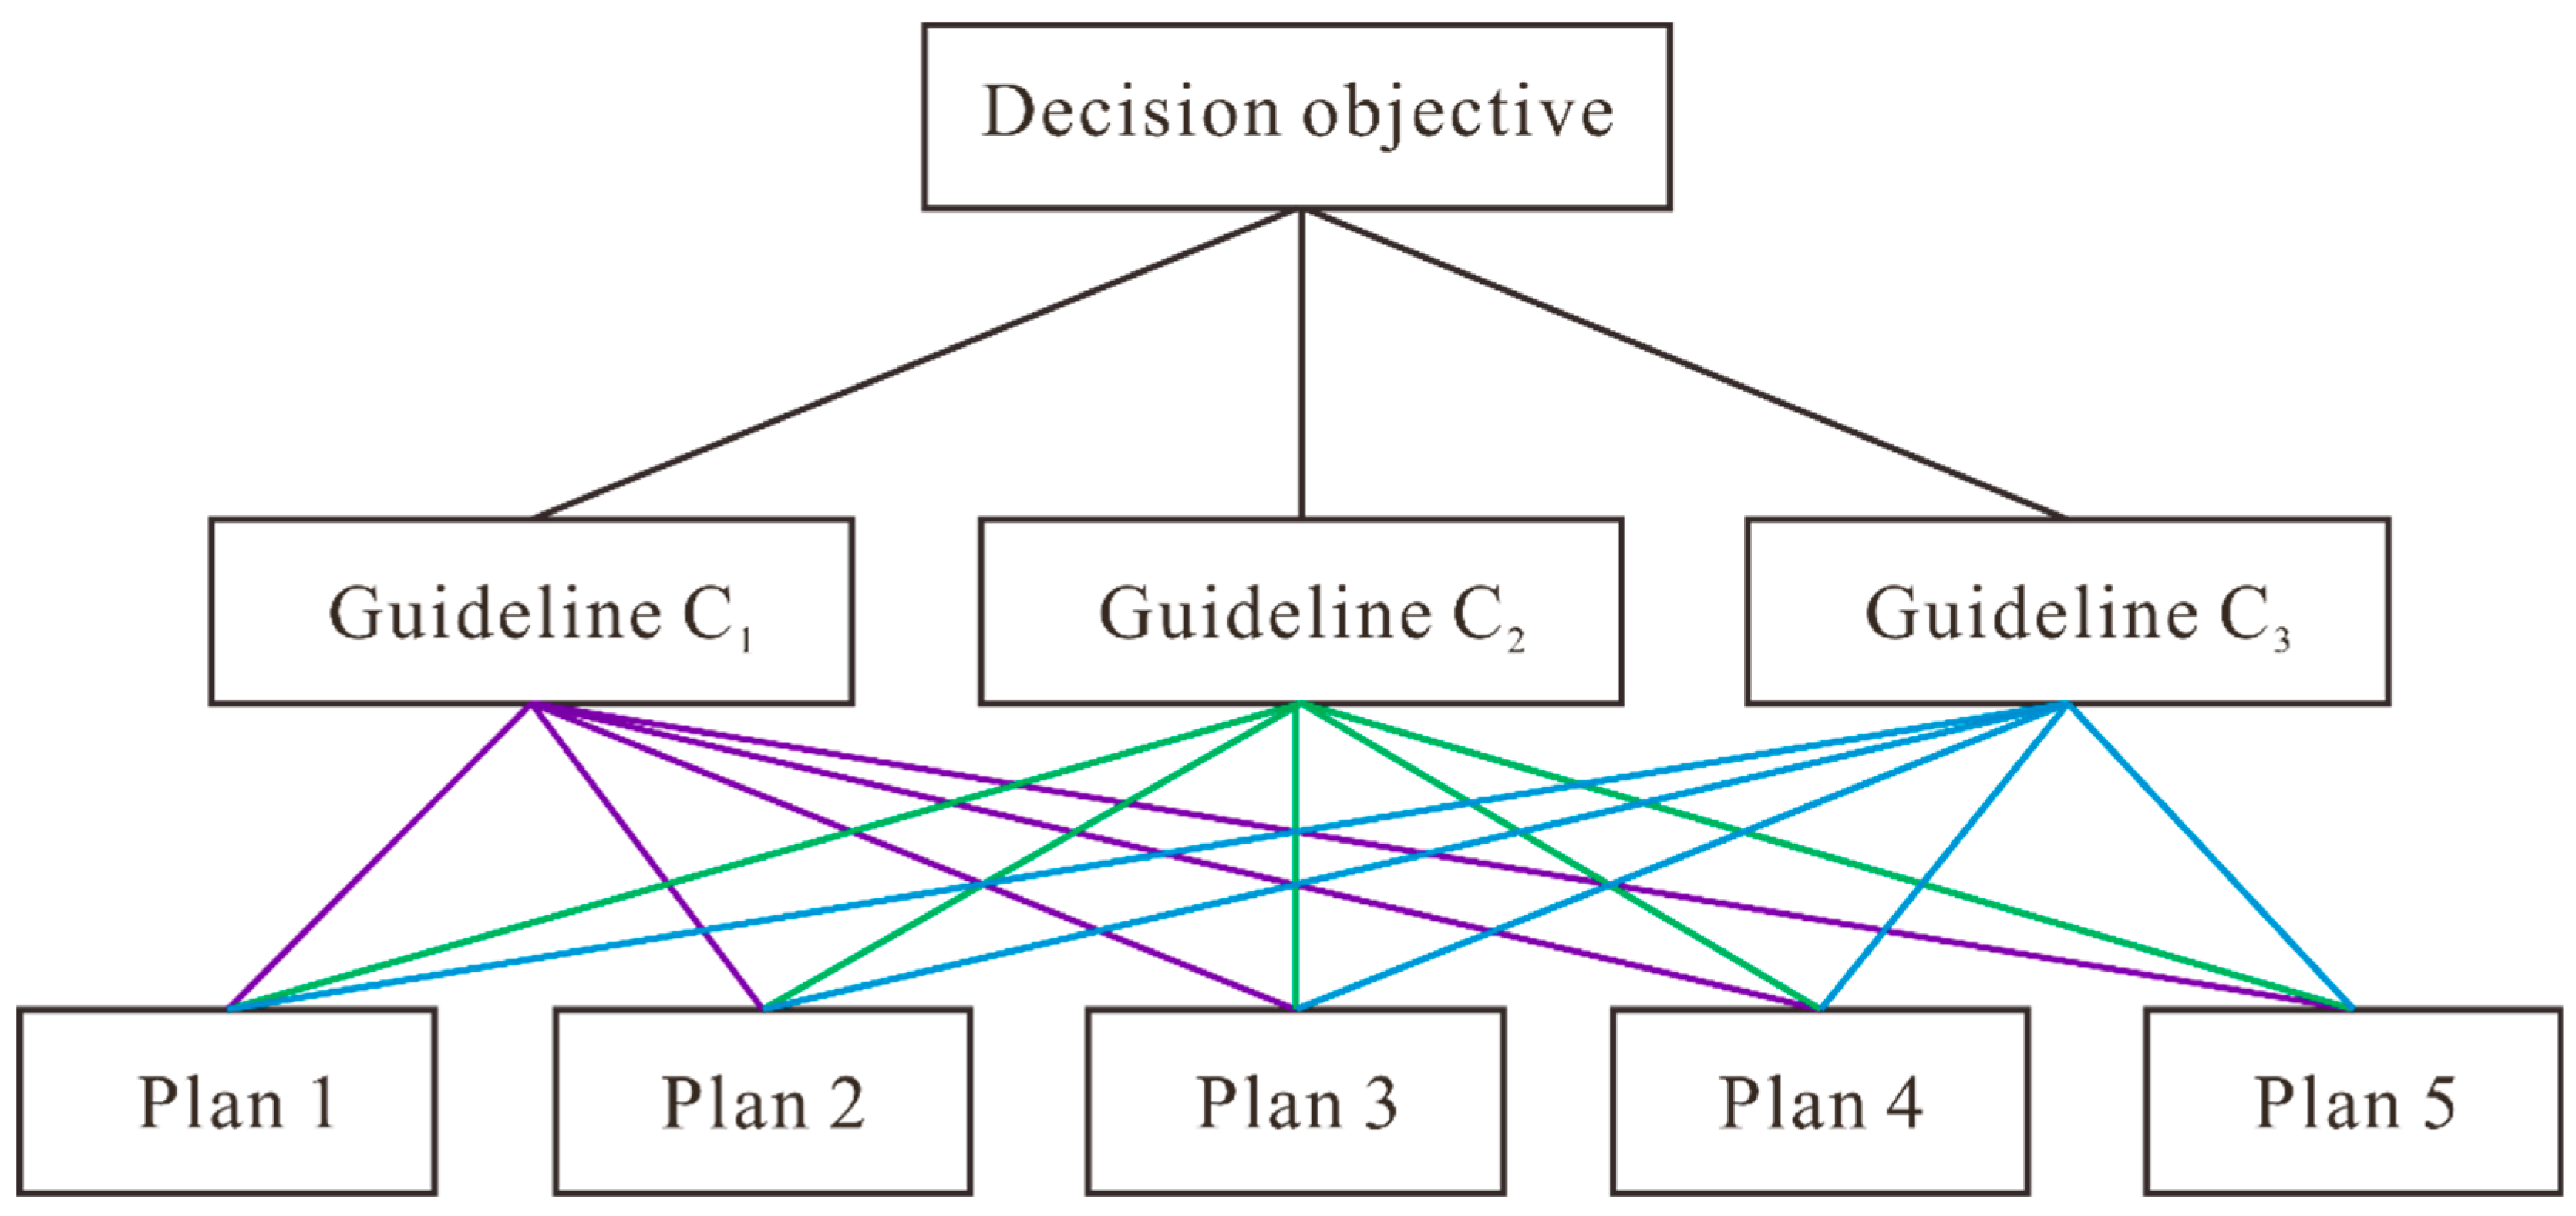
Figure 1. Hierarchical structure model.
Processes 13 02967 g001
Figure 2. Main types of pores and cementation of low-permeability reservoir in Oilfield A. (a) Intergranular pore, dissolution pore, microfracture, BZ21-2-a, 3961 m; (b) Cement dissolution pore, microfracture, BZ25-3-b, 3855 m; (c) Intergranular pore, BZ25-1-c, 4115 m; (d) Intergranular pore, BZ28-3-d, 4006 m; (e) Feldspar dissolution pore, BZ25-1-e, 3964 m; (f) Kaolinite and cement dissolution pore, BZ21-1-f, 3871 m; (g) Iron dolomite filling dissolution pore, BZ28-1-g, 3894 m; (h) Iron dolomite metasomatism, BZ25-2-h, 4120 m; (i) Iron dolomite metasomatism, BZ21-2-i, 4086 m.
Processes 13 02967 g002
Figure 3. Wave impedance results of pre-stack seismic inversion in Oilfield A.
Processes 13 02967 g003
Figure 4. Three-dimensional modelling of geological sweet spot parameters. (a) Porosity model, range from 4.04% to 9.31%; (b) Permeability model, range from 0.21 mD to 1.5 mD; (c) Oil saturation model, range from 22.38% to 69%.
Processes 13 02967 g004
Figure 5. Experiment on classification of physical parameters of low-permeability reservoir in Oilfield A by mercury injection (based on the analysis results of different rock porosity and permeability, the reservoir is classified into four categories).
Processes 13 02967 g005
Figure 6. Key parameters of rock mechanics model. (a) Young’s modulus model, range from 21.26 GPa to 72.46 GPa; (b). Poisson’s ratio model, range from 0.18 to 0.34; (c) fracture toughness model, range from 1.82 GPa·m1/2 to 3.4 GPa·m1/2; (d) vertical stress model, range from 72.46 MPa to 110 MPa; (e) minimum horizontal stress model, range from 43.46 MPa to 70.74 MPa; (f) maximum horizontal stress model, range from 60 MPa to 97.33 MPa.
Processes 13 02967 g006
Figure 7. Heat map of geological sweet spots influencing factors.
Processes 13 02967 g007
Figure 8. Graduated spatial inscription of geological sweet spots indicator factors in low-permeability reservoir in Oilfield A.
Processes 13 02967 g008
Figure 9. Heat map of engineering sweet spots influencing factors.
Processes 13 02967 g009
Figure 10. Hierarchical spatial inscription of geological sweet spots indicator factors for low-permeability reservoirs in Oilfield A.
Processes 13 02967 g010
Figure 11. Grading of geological–engineering sweet spots indicator factors and fracture spreading characteristics of well A3. (a) Calculation results of engineering sweet spots parameters for Well A3, and classification of geological and engineering sweet spots indicators. GSS stands for geological sweet spots, with I–III standing for geological sweet spots categories in this row. ESS stands for engineering sweet spots, with I–III standing for engineering sweet spots categories in this row. H1–H4 belong to category I geological sweet spots and category I engineering sweet spots; (b) fracture distribution and morphological characteristics after fracturing of the H1 and H2 layers; (c) fracture morphological characteristics after fracturing of the H3 and H4 layers.
Processes 13 02967 g011
Figure 12. “Double-sweet spots” fracturing capacity test and prediction results for well A3.
Processes 13 02967 g012
Table 1. Scale evaluation table.
C i   Compared   with   C j EqualStrongStrongerVery StrongAbsolutely Strong
a i j 13579
Table 2. Corresponding range of randomness indicator R I .
n123456789……
R I 000.580.91.121.241.321.411.45……
Table 3. Classification of geological sweet spots of low-permeability reservoirs in Oilfield A.
Reservoir CategoryGeological Sweet Spots Indicator
Factor
Permeability
(mD)
Porosity
(%)
Oil
Saturation
(%)
Median Particle Size
(mm)
Cement Content
(%)
Shale Content
(%)
I0.75–1>1>7>57.5>0.7<68–15
II0.5–0.750.7–16–745–57.50.5–0.76–1015–20
III0.25–0.50.5–0.75–632.5–450.3–0.510–1420–25
IV0–0.25<0.5<5<32.5<0.3>14>25
Table 4. Classification of engineering sweet spots of low-permeability reservoirs in Oilfield A.
Reservoir CategoryEngineering Sweet Spots Indicator FactorYoung’s Modulus (GPa)Fracture CoefficientBrittleness IndexPoisson’s RatioHorizontal Stress DifferenceFracture Toughness
(MPa-m1/2)
I0.75–1>65>0.57>0.45>0.30>0.4>3
II0.5–0.7545–650.48–0.570.35–0.450.26–0.300.35–0.42.5–3
III0.25–0.530–450.4–0.480.25–0.350.23–0.260.3–0.352–2.5
IV0–0.25<30<0.4<0.25<0.23<0.3<2
Table 5. Temperature, pressure and fluid parameters of Oilfield A.
Parameter TermValue
Original ground pressure (MPa)52.41
Saturation pressure (MP)24.43
Crude oil volume factor1.4135
Gas–oil ratio136
Crude oil viscosity (mPa-s)1.41
Temperature (°C)123.2
Oil density (g/cm3)0.7264
Table 6. Parameters of engineered “double-sweet spots” fracturing in permeable reservoirs.
HorizonDepth RangeGeological Sweet Spots Indicator FactorEngineering Sweet Spots Indicator FactorFracturing Sand Volume (m3)Fracturing Fluid Volume (m3)Simulated Crack Length (m)
70/140 Mesh
Ceramsite
40/70 Mesh
Ceramsite
Total Amount of Proppant
H13562.47~3575.770.930.76102232631.4881.52
H23727.91~3736.590.820.81306494596.15100.28
H33781.71~3789.810.770.923672108847.36147.29
H43880.05~3894.510.830.85112738548.63123.48
Disclaimer/Publisher’s Note: The statements, opinions and data contained in all publications are solely those of the individual author(s) and contributor(s) and not of MDPI and/or the editor(s). MDPI and/or the editor(s) disclaim responsibility for any injury to people or property resulting from any ideas, methods, instructions or products referred to in the content.