Article

Quantitative 3D Depositional Element Modeling of the Mishrif Carbonate Platform: Enhancing Reservoir Performance Prediction

1
Research Institute of Petroleum Exploration & Development, CNPC, Beijing 100083, China
2
State Key Laboratory of Petroleum Resources and Engineering, China University of Petroleum (Beijing), Beijing 102249, China
3
College of Petroleum Engineering, China University of Petroleum (Beijing), Beijing 102249, China
*
Authors to whom correspondence should be addressed.
Processes 2025, 13(9), 2941; https://doi.org/10.3390/pr13092941
Submission received: 12 August 2025 / Revised: 5 September 2025 / Accepted: 11 September 2025 / Published: 15 September 2025

Abstract

Qualitative schematic models of the Mishrif Formation, which have previously dominated the research, are inadequate for predicting reservoir production performance due to their inability to quantify spatial heterogeneity. In contrast to these earlier approaches, this study integrates core analysis, wireline logs, and 3D seismic data to not only describe but also quantitatively characterize the depositional elements and their spatial distribution. A novel methodology was developed to define nine distinct depositional elements from cored wells and then continuously identify them in uncored wells using unique pseudo-wireline log responses, a step not achieved in prior work. Furthermore, moving beyond previous qualitative models, 3D quantitative versions were constructed using Sequential Indicator Simulation (SIS) explicitly constrained by depositional geometries derived from 3D seismic inversion volumes. For the first time, these models reveal the quantitative spatial extent and evolution of these elements. Updating the 3D petrophysical property model using this new depositional framework resulted in a 15% increase in successful production history matches, demonstrating the direct and superior predictive power of this integrated quantitative approach for forecasting oil reservoir production performance.

1. Introduction

The HY oilfield (the name has been modified for confidentiality reasons) was discovered in 1975 and was estimated to contain 700 million stock tank barrels (STB) of oil reserves. The oil reservoir in the Upper Cretaceous Mishrif Formation was deposited on a rimmed carbonate platform, and it contains the largest amount of original oil in place (OOIP) in the HY oilfield [1,2].
The Mishrif Formation, which contains up to 30% of the total oil reserves in Iraq, is the most important oil reservoir in the Mesopotamian Basin, and as such, it has been subjected to intensive study. Many previous studies related to the Mishrif Formation have involved petroleum system analysis, sequence stratigraphy analysis [3], sedimentological descriptions [4], analysis of the diagenetic processes and their controls on the reservoir properties [5,6,7], and quality reviews of the rudist-bearing carbonate reservoir [8,9]. Schematic block diagrams of the depositional models of the reef-rimmed carbonate platform have also been constructed for the Mishrif Formation based on cores, cuttings, routine core analysis (RCA), and wireline logs of cored wells to qualitatively exhibit the depositional environments [10,11,12].
Despite numerous prior studies, little scholarly research has been conducted on the classification of the depositional elements in cored wells and continuous identification in uncored wells [13,14]. Therefore, three-dimensional (3D) geologic models of the depositional elements of the Mishrif Formation could not be established to quantitatively reveal the spatial extension of the depositional elements and the details of the reservoir’s heterogeneity. The possible reasons for this are that most previous studies did not concentrate on the coupling relationships between the sequence stratigraphy, the depositional environments, the influence of diagenetic processes on the reservoir’s properties, and the wireline log responses of each depositional element. Therefore, the specific research question driving this study is as follows: Can 3D geological models of the depositional elements be constructed by integrating well-based element logs and 3D seismic inversion data to quantitatively reveal reservoir heterogeneity?
This study attempts to analyze the high-resolution sequence stratigraphy architecture of the Mishrif Formation; to classify the depositional elements in the cored wells in terms of their lithofacies associations and depositional environments; to investigate the diagenetic processes and their impacts on the reservoir’s quality using thin-section observations and routine core analysis; to establish criteria for the pseudo-wireline log responses of each depositional element in order to continuously identify the depositional element in each uncored well; and to construct 3D geological models of the depositional elements using the depositional element logs of all the wells and the 3D seismic inversion cubes in order to upgrade the 3D petrophysical property models and thus, to enable better predictions of the production performance throughout the HY oilfield. The integrated approach developed in this study for quantitatively characterizing depositional elements and modeling their 3D heterogeneity has significant potential for application in emerging energy fields, particularly natural hydrogen exploration and in situ hydrogen generation [15,16].
The novelty of this study lies in the inclusion of elements which previous works negelcted, as shown below:
(1) Previous works did not establish a method for continuous identification in uncored wells and largely relied on core data from specific wells. This study, however, introduces a novel method using pseudo-wireline logs to bridge the gap between cored and uncored wells, allowing for the continuous identification of depositional elements across the entire field.
(2) While qualitative models and block diagrams existed, prior studies failed to build quantitative 3D models to reveal the precise spatial distribution and volume of different depositional elements. The current study achieves this by integrating the new depositional element logs with 3D seismic inversion data.
(3) Previous works did not fully integrate all controlling factors into a single workflow. The key novelty of this work is the integrated approach that couples the sequence stratigraphy, depositional environments, and diagenetic processes, evaluating their collective impact on wireline log responses. Consequently, this research connects these elements to solve the specific problem of reservoir heterogeneity.

2. Field Background

The HY oilfield is located in the Mesopotamian Foredeep Basin, approximately 150 km northwest of Basra City in southeastern Iraq. It contains seven oil reservoirs ranging from Miocene to Early Cretaceous, including the Kirkuk to Jeribe–Euphrates (J/K), Sadi, Tanuma, Khasib, Mishrif, Nahr Umr, and Yamama reservoirs (Figure 1). The principal oil reservoir is accumulated within the Mishrif Formation, deposited in high-energy rudist shoals and dominated by 400 m thick bioclastic limestone.
The Natih Formation consists of an assemblage of the Mauddud, Wara, Ahmadi, Rumaila, and Mishrif Formations in the southern Mesopotamian Basin [17,18]. The time-equivalent units of the Mishrif Formation are members A and D of the Natih Formation in Oman, which were deposited within a second-order depositional sequence during the latest Albian, Cenomanian, and the Early Turonian eras [19,20], and belong to the upper Sarvak Formation in the High Zagros of southwestern Iran [21].
The Mishrif Formation gradationally enters the underlying Rumaila Formation. In contrast, its upper boundary is separated from the overlying Khasib Formation by an extensive regional unconformity [22]. The negative δ13C VPDB (Vienna Peedee Belemnite) trends indicate that the Mishrif Formation experienced subaerial exposure and is capped by an exposure horizon (Figure 2) [23]. The sediment supply to the Mesopotamian Basin mostly originated from the western elevations to the north and northeast.
The structural trap in the Mishrif Formation is an unfaulted anticline trending northwest to southeast, covering an area of about 230 km2 (Figure 1). The source rock of the Sargelu Formation deposited in the middle Jurassic period charged the Mishrif oil reservoirs along vertical faults during the Miocene era [24,25,26]. Medium gravity oil (22–30° API) has been produced from the Mishrif oil reservoirs, whose oil–water contact occurs at −3092 m SSTVD (Subsea True Vertical Depth) (3100 m MD (Measured Depth) in well M3 in Figure 2).

3. Materials and Methods

One hundred and ninety-six wells, including seven cored wells, have penetrated the Mishrif oil reservoir. Slabbed cores 781.9 m in length were examined by the core lab, focusing on their lithology, depositional textures, fossil contents, bioturbations, and lithologic contacts. Routine core analysis (RCAL) of the helium porosity, air permeability, grain density, and X-ray diffraction (XRD), as well as special core analysis (SCAL) of the mercury injection capillary pressure (MICP) were performed by commercial laboratories using industry-standard methods. The helium porosity and grain density analyses were carried out using the Boyle’s law method. The air permeability was measured and corrected using the Klinkenberg method. Each core plug was prepared for polarizing microscopy (Axio Imager 2 POL, Carl Zeiss AG Co., Germany) and scanning electron microscopy (SEM) observations.
Five hundred and eighty-eight thin sections prepared from core samples were impregnated with blue epoxy resin (STYCAST 2850KT CAT 9, LOCTITE Co., China) to facilitate the identification of pore spaces under polarized microscopes. In addition, over half of their surfaces were stained with potassium ferricyanide and Alizarin Red to differentiate iron-rich from iron-poor carbonates and calcium carbonate from dolomite. The diagenetic processes were identified based on the mineral constituents and cross-cutting relationships of the cements observed in the thin sections. The bulk carbonate oxygen and carbon isotopes were analyzed by the China National Petroleum Corporation (CNPC) laboratory and were reported using standard δ-notation relative to VPDB in parts per thousand (‰).
A total of 597.42 m cores, 588 thin sections, 769 RCALs, 68 XRDs, 920 MICPs, and wireline logs from seven cored wells have been investigated to describe the depositional environment and to analyze the karstification and rudist reservoir quality of the Mishrif Formation [27].
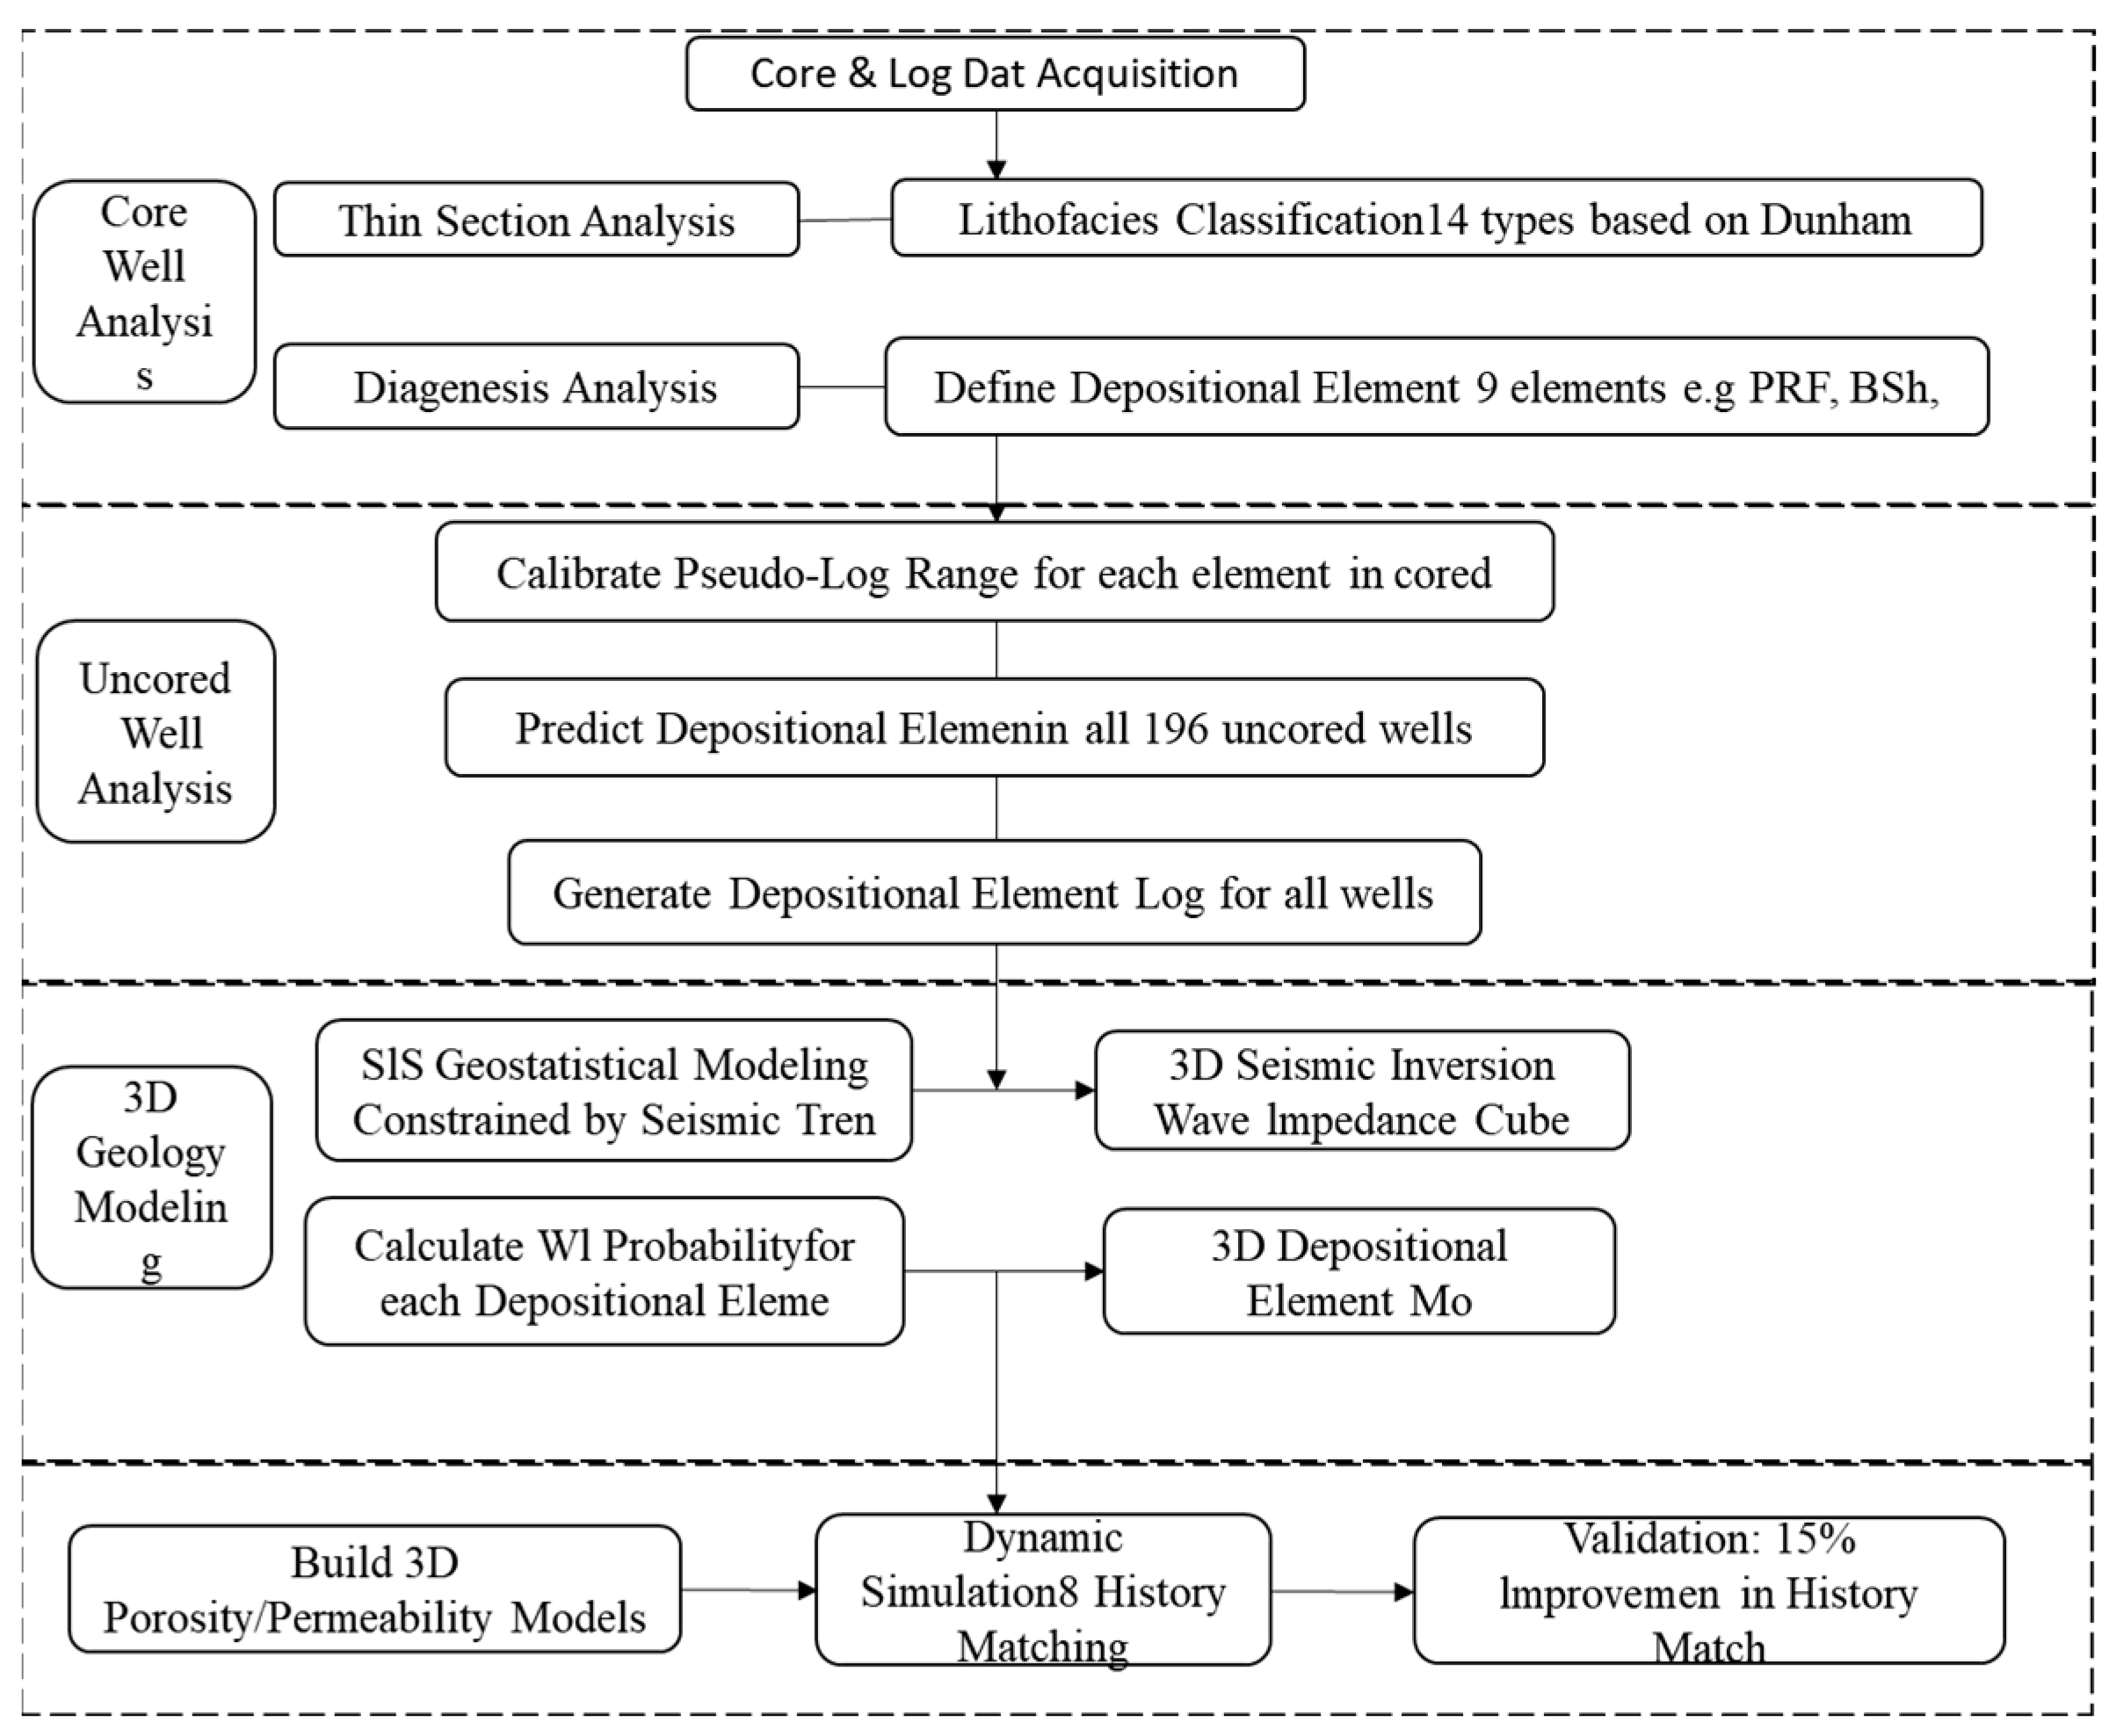
The wireline logs of 196 wells were acquired at every decimeter, including those for gamma rays (GRs), spontaneous potential (SP), lateral log deep resistivity (RLLD), acoustics (AC), bulk density (RHOB), and neutron logs (NPHI), which were used to correlate the stratigraphic units and to calculate the pseudo-wireline logs in the study area. Each depositional element within the depositional environments of the inner shelf or platform margin exhibits its own distinct scope in the two pseudo-wireline logs of RLLD*RHOB and GR*AC in the cored wells. Based on the values of the two pseudo-wireline logs, the depositional elements in the uncored wells can be identified. In addition, seismic inversion cubes from the 3D seismic cubic data of 496 km2 covering the entire HY oilfield were utilized to delineate the areal extension of depositional elements. The dominant frequency is 100 Hz, and the vertical resolution can reach 2~5 m in the seismic inversion process. The flowchart of this work is shown in Figure 3.

4. Results and Discussion

4.1. Results of High-Resolution Sequence Stratigraphy

4.1.1. Marker Layer

Early diagenesis is strongly affected by regressive sequence stratigraphic cycles [15], during which high-permeability streaks can develop. These streaks have important impacts on reservoir heterogeneity and well productivity [28].
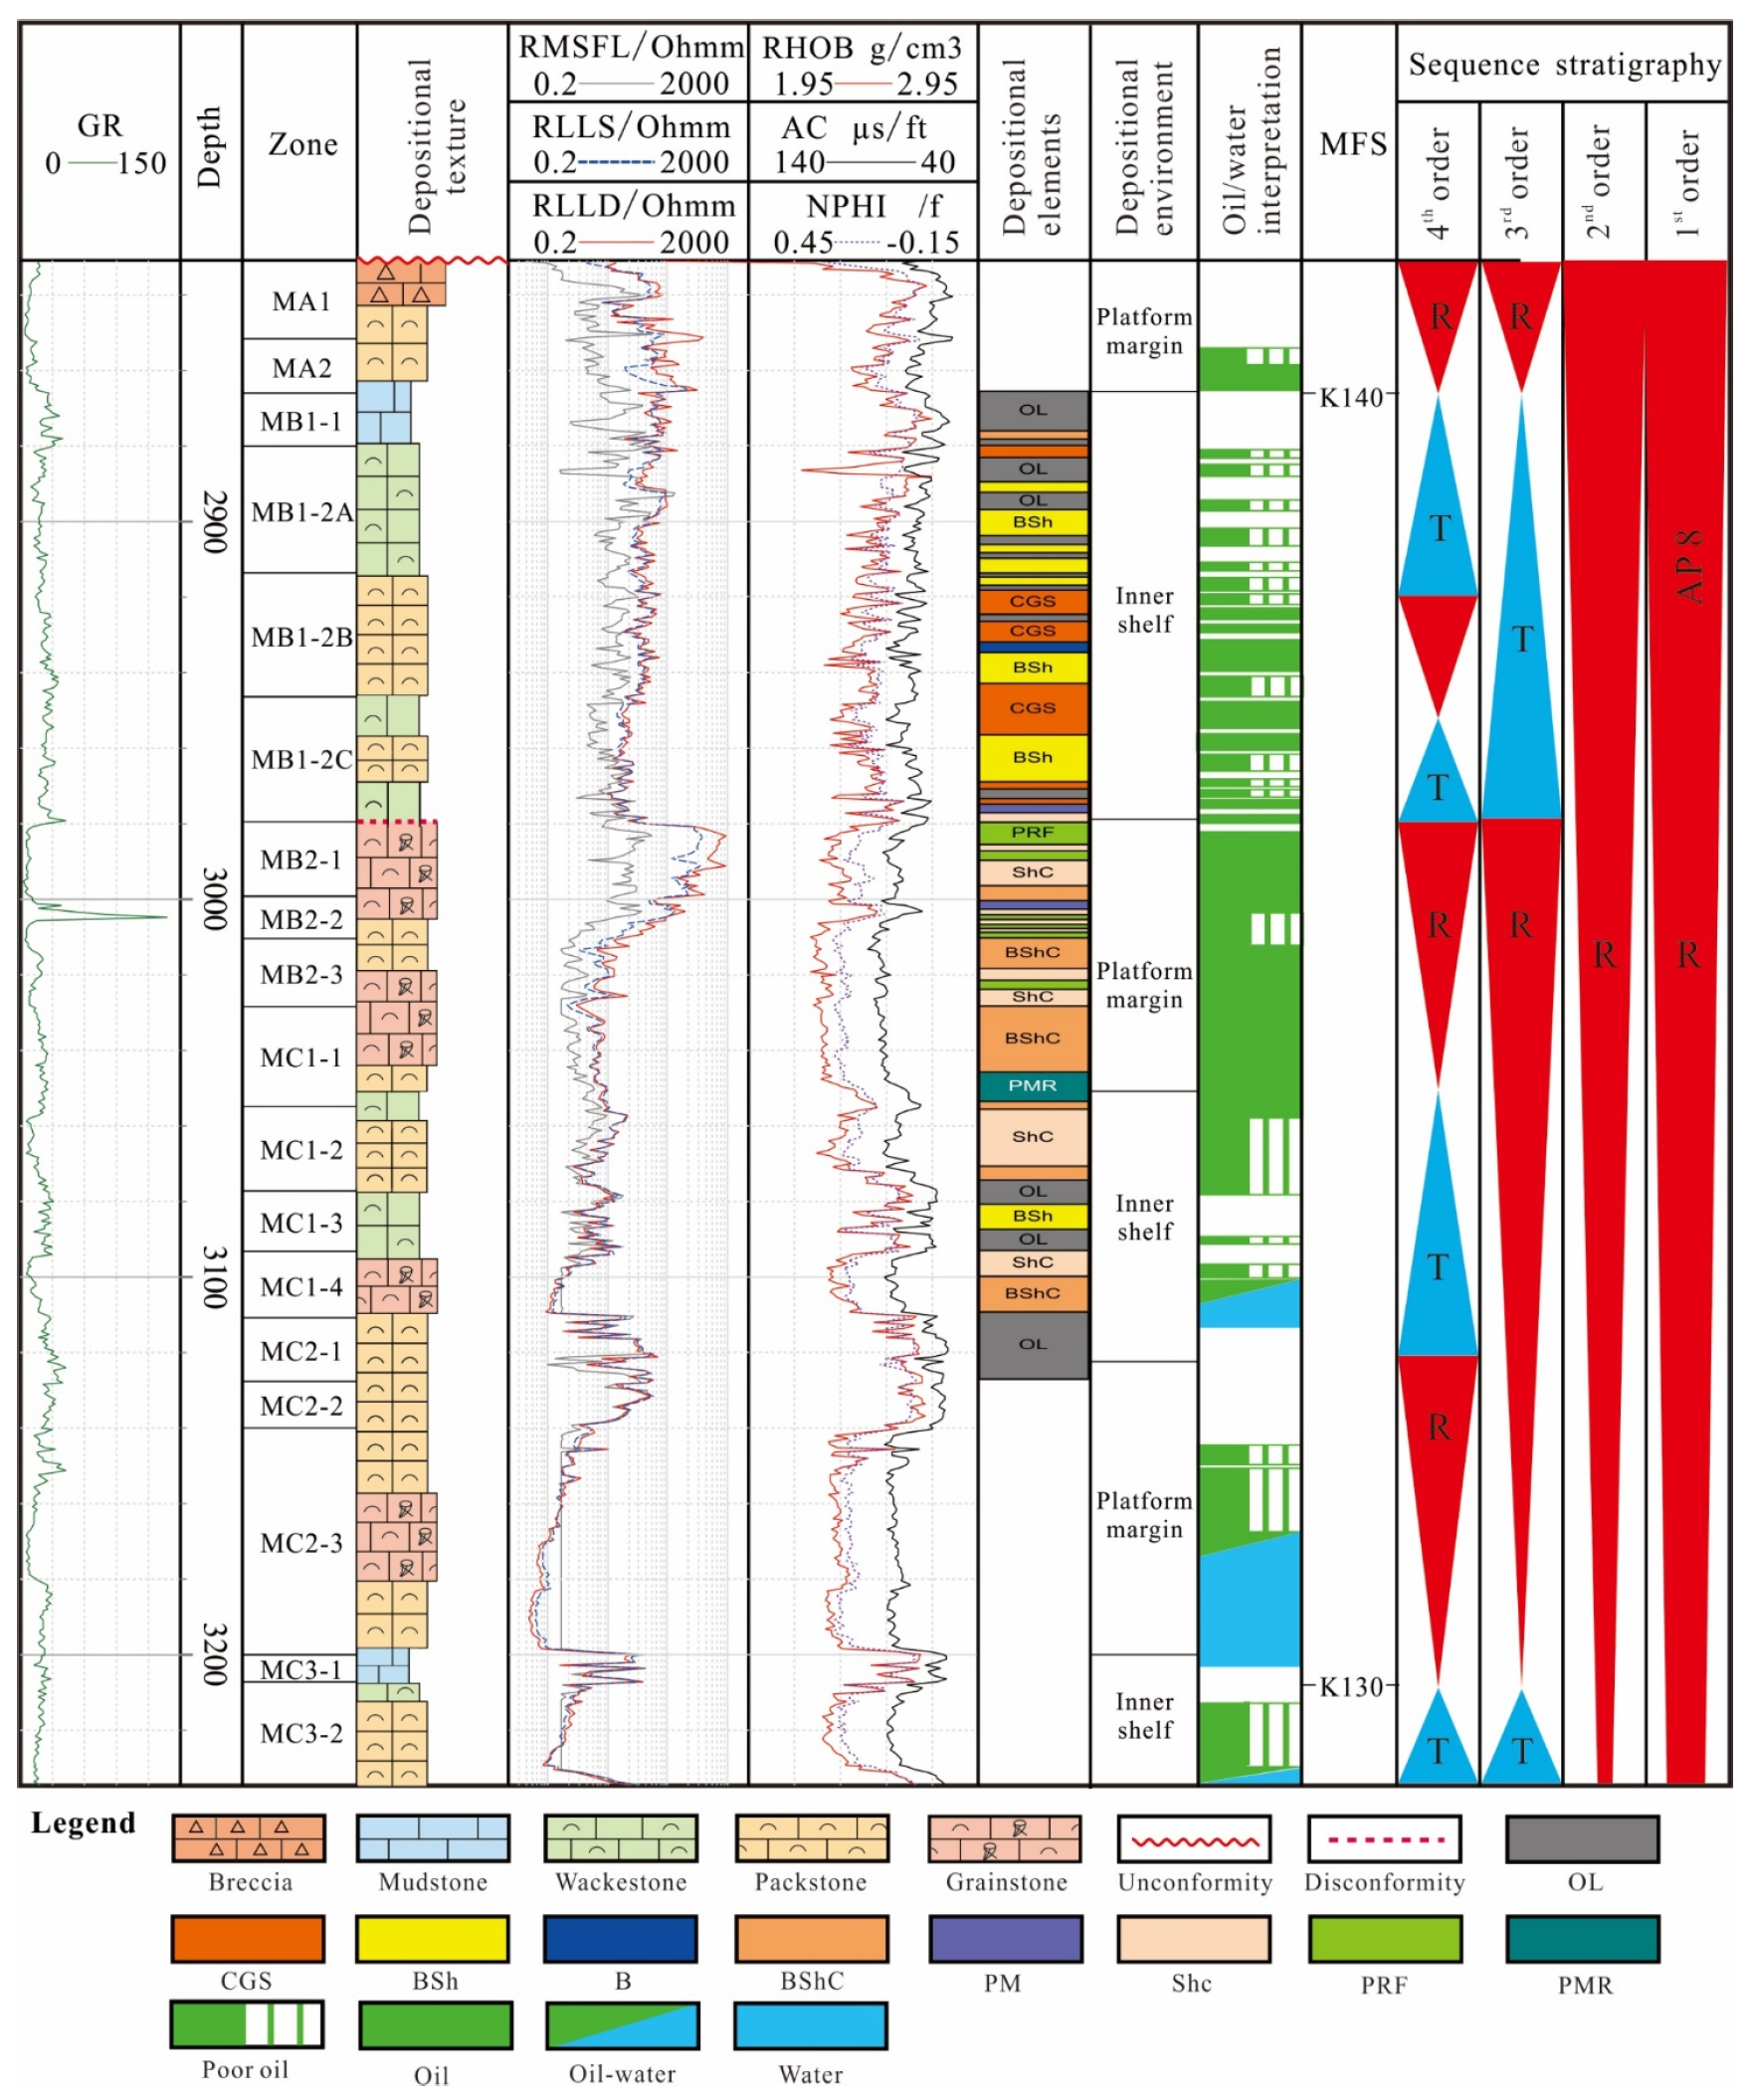
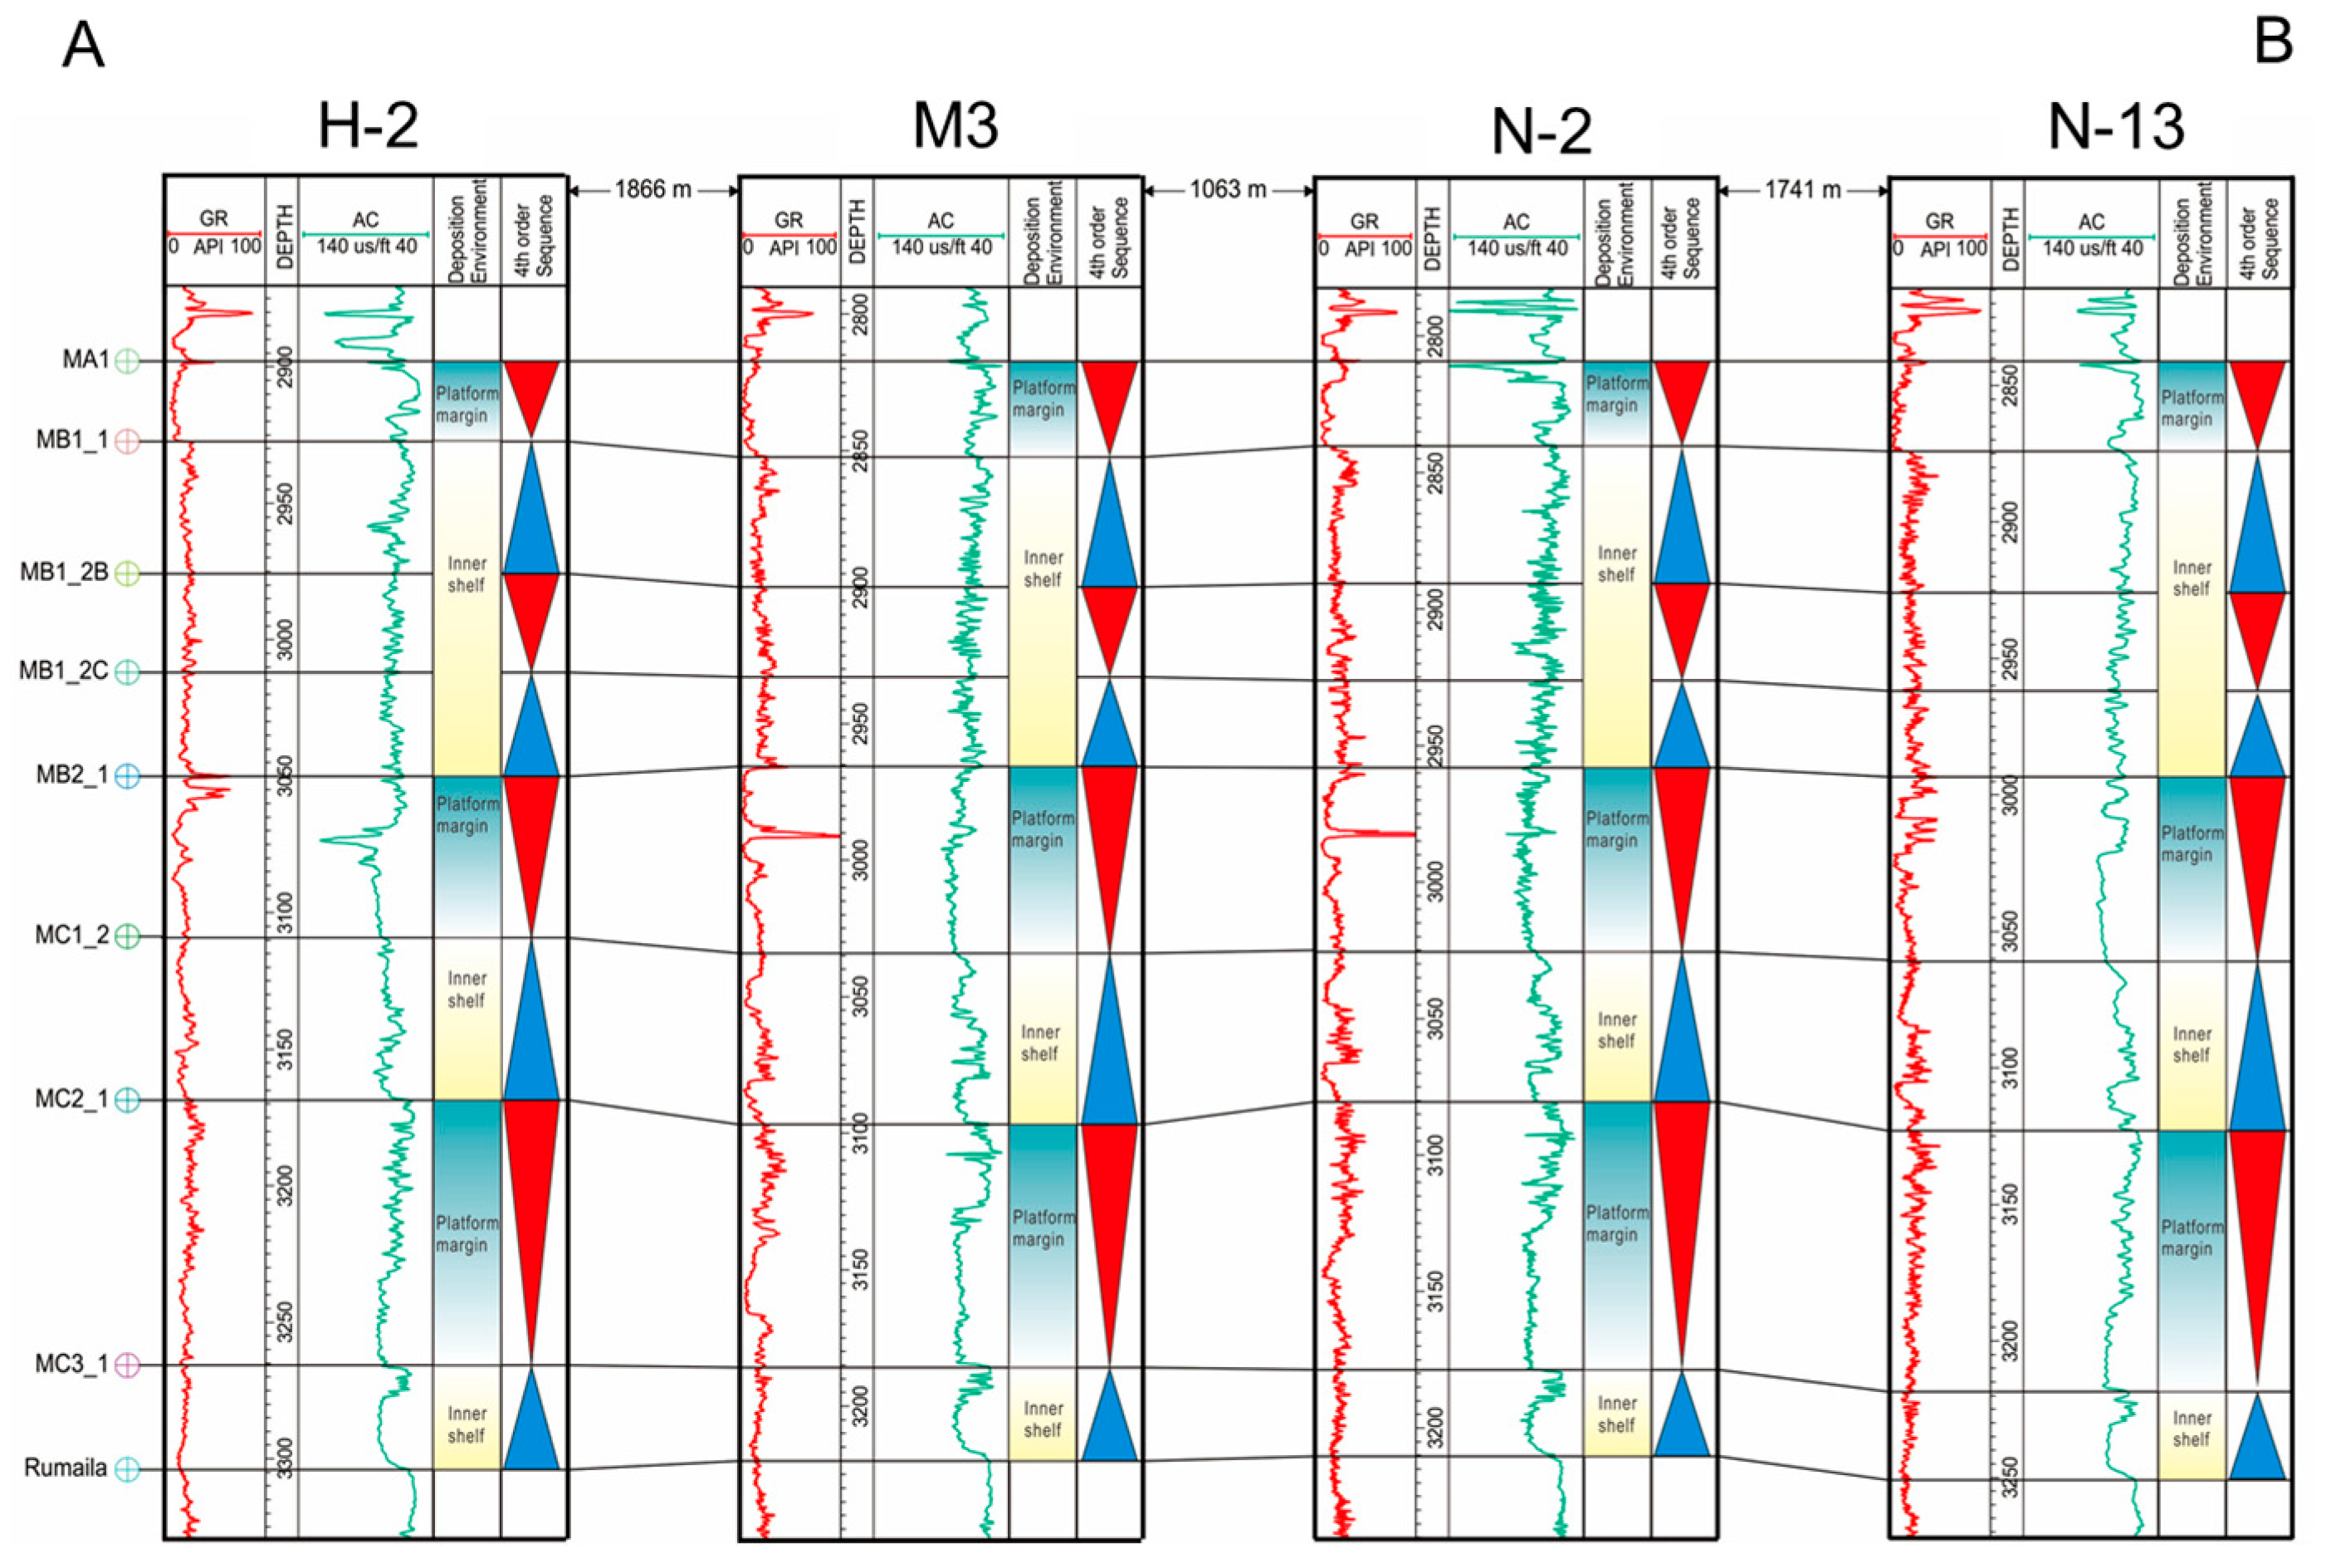
The Mishrif Formation, divided into four members (MC, MB2, MB1, and MA) and 18 zones from its base upward, was deposited during a base-level fall semi-cycle in the second-order sequence stratigraphy [29]. The Mishrif Formation consists of two third-order cycles, based on its depositional environment evolution; a disconformity surface at the top of zone MB2-1; and an unconformity surface at its top boundary. The maximum flooding surfaces (MFSs) represent turning points between the regressive (R) and transgressive (T) cycles. The third-order MFSs of K140 and K130 within the Mishrif Formation are 93 Ma and 95 Ma of age, respectively, and are located within zones MB1-1 and MC 3-1. The depositional textures around the third-order and fourth-order MFSs are dominated by mudstones and wackestones, respectively (Figure 4).
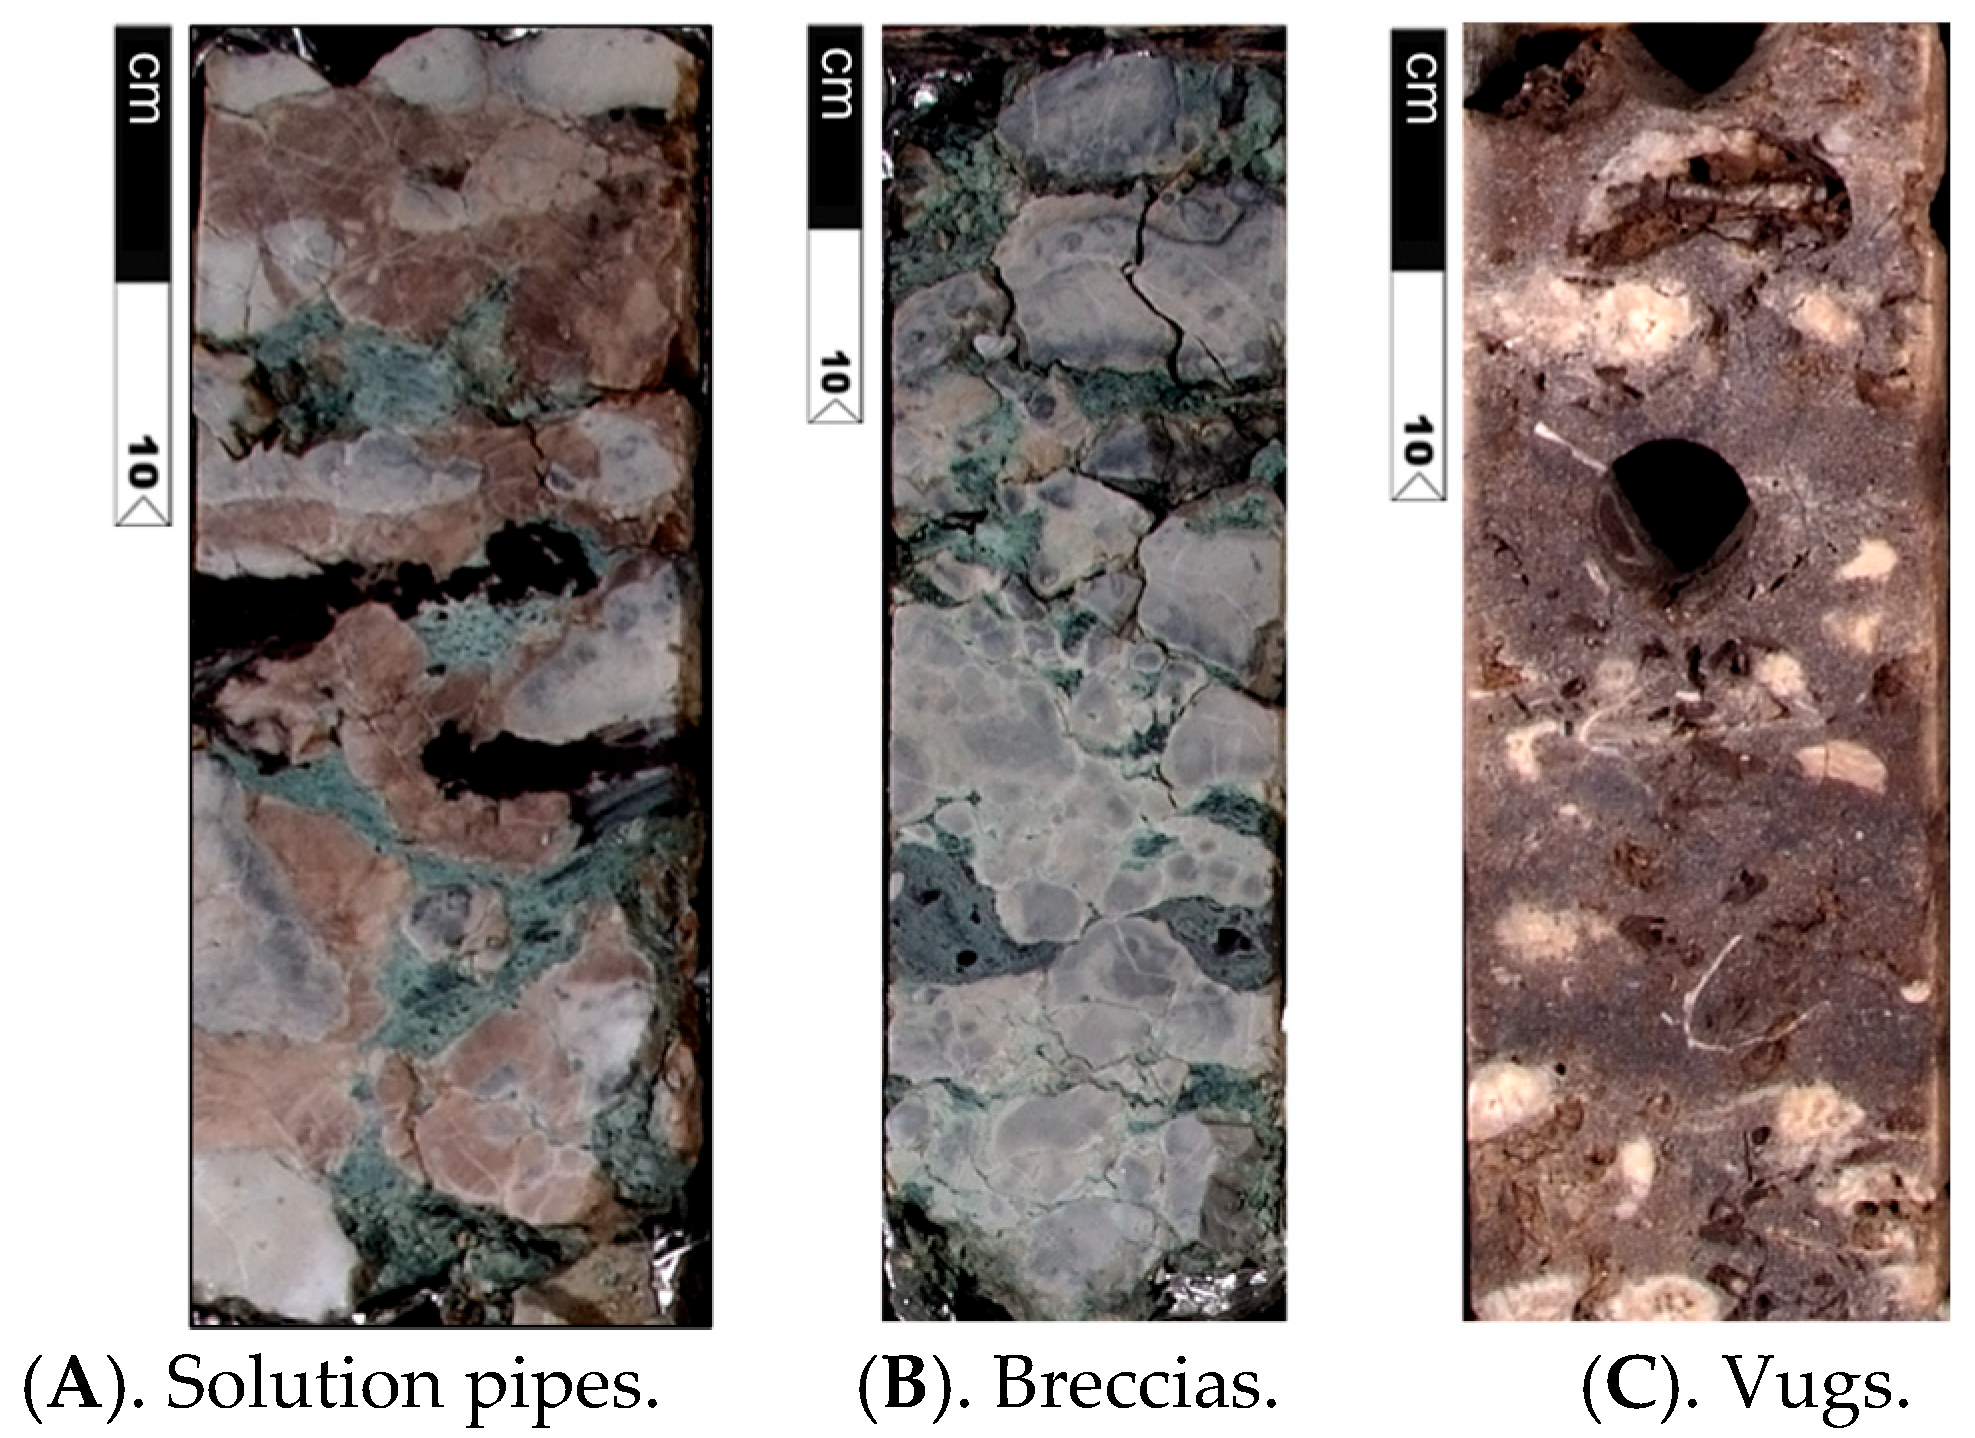
The regressive cycles (R) of the third-order sequence, which are characterized by an increasing abundance of benthic fossils and increasing volumes of grain-dominated lithofacies, exhibit increasing resistivity and acoustic values and decreasing gamma ray values. Due to the subaerial exposures caused by the regressive cycle of the third-order sequence, zone MA, which has experienced extensive dissolution, is characterized by ~20 m long solution pipes, karstic breccias, vugs, geopetal fabrics containing green silty shale, and blocky meteoric cements. The fourth-order sequence architectures undergo a slight lateral change (Figure 5).

4.1.2. Lithofacies

The Mishrif Formation contains bioclastic-rich lithofacies, the bioclastic fragments of which comprise foraminifera, benthic sessile organisms, molluscan shells, algal fragments, and echinoderms. Rudists, which dominated reef frameworks and developed within shelf margins and lagoons, are the predominant large bivalves [30,31,32].
Based on the slabbed cores, thin sections, and fossil assemblages, 14 core-scale lithofacies were identified using the textural classification (Table A1). The skeletal grains contain foraminifera (including Miliolids, Alveolinids, Orbitolinids, Textulariids, and Lituolitids), molluscan shell fragments (including brachiopods, rudist bivalves, ostracods, and gastropods), echinoderms, benthic sessile organisms (including sponges, bryozoans, and corals), and algae (including dasyclad green algae and red algae).
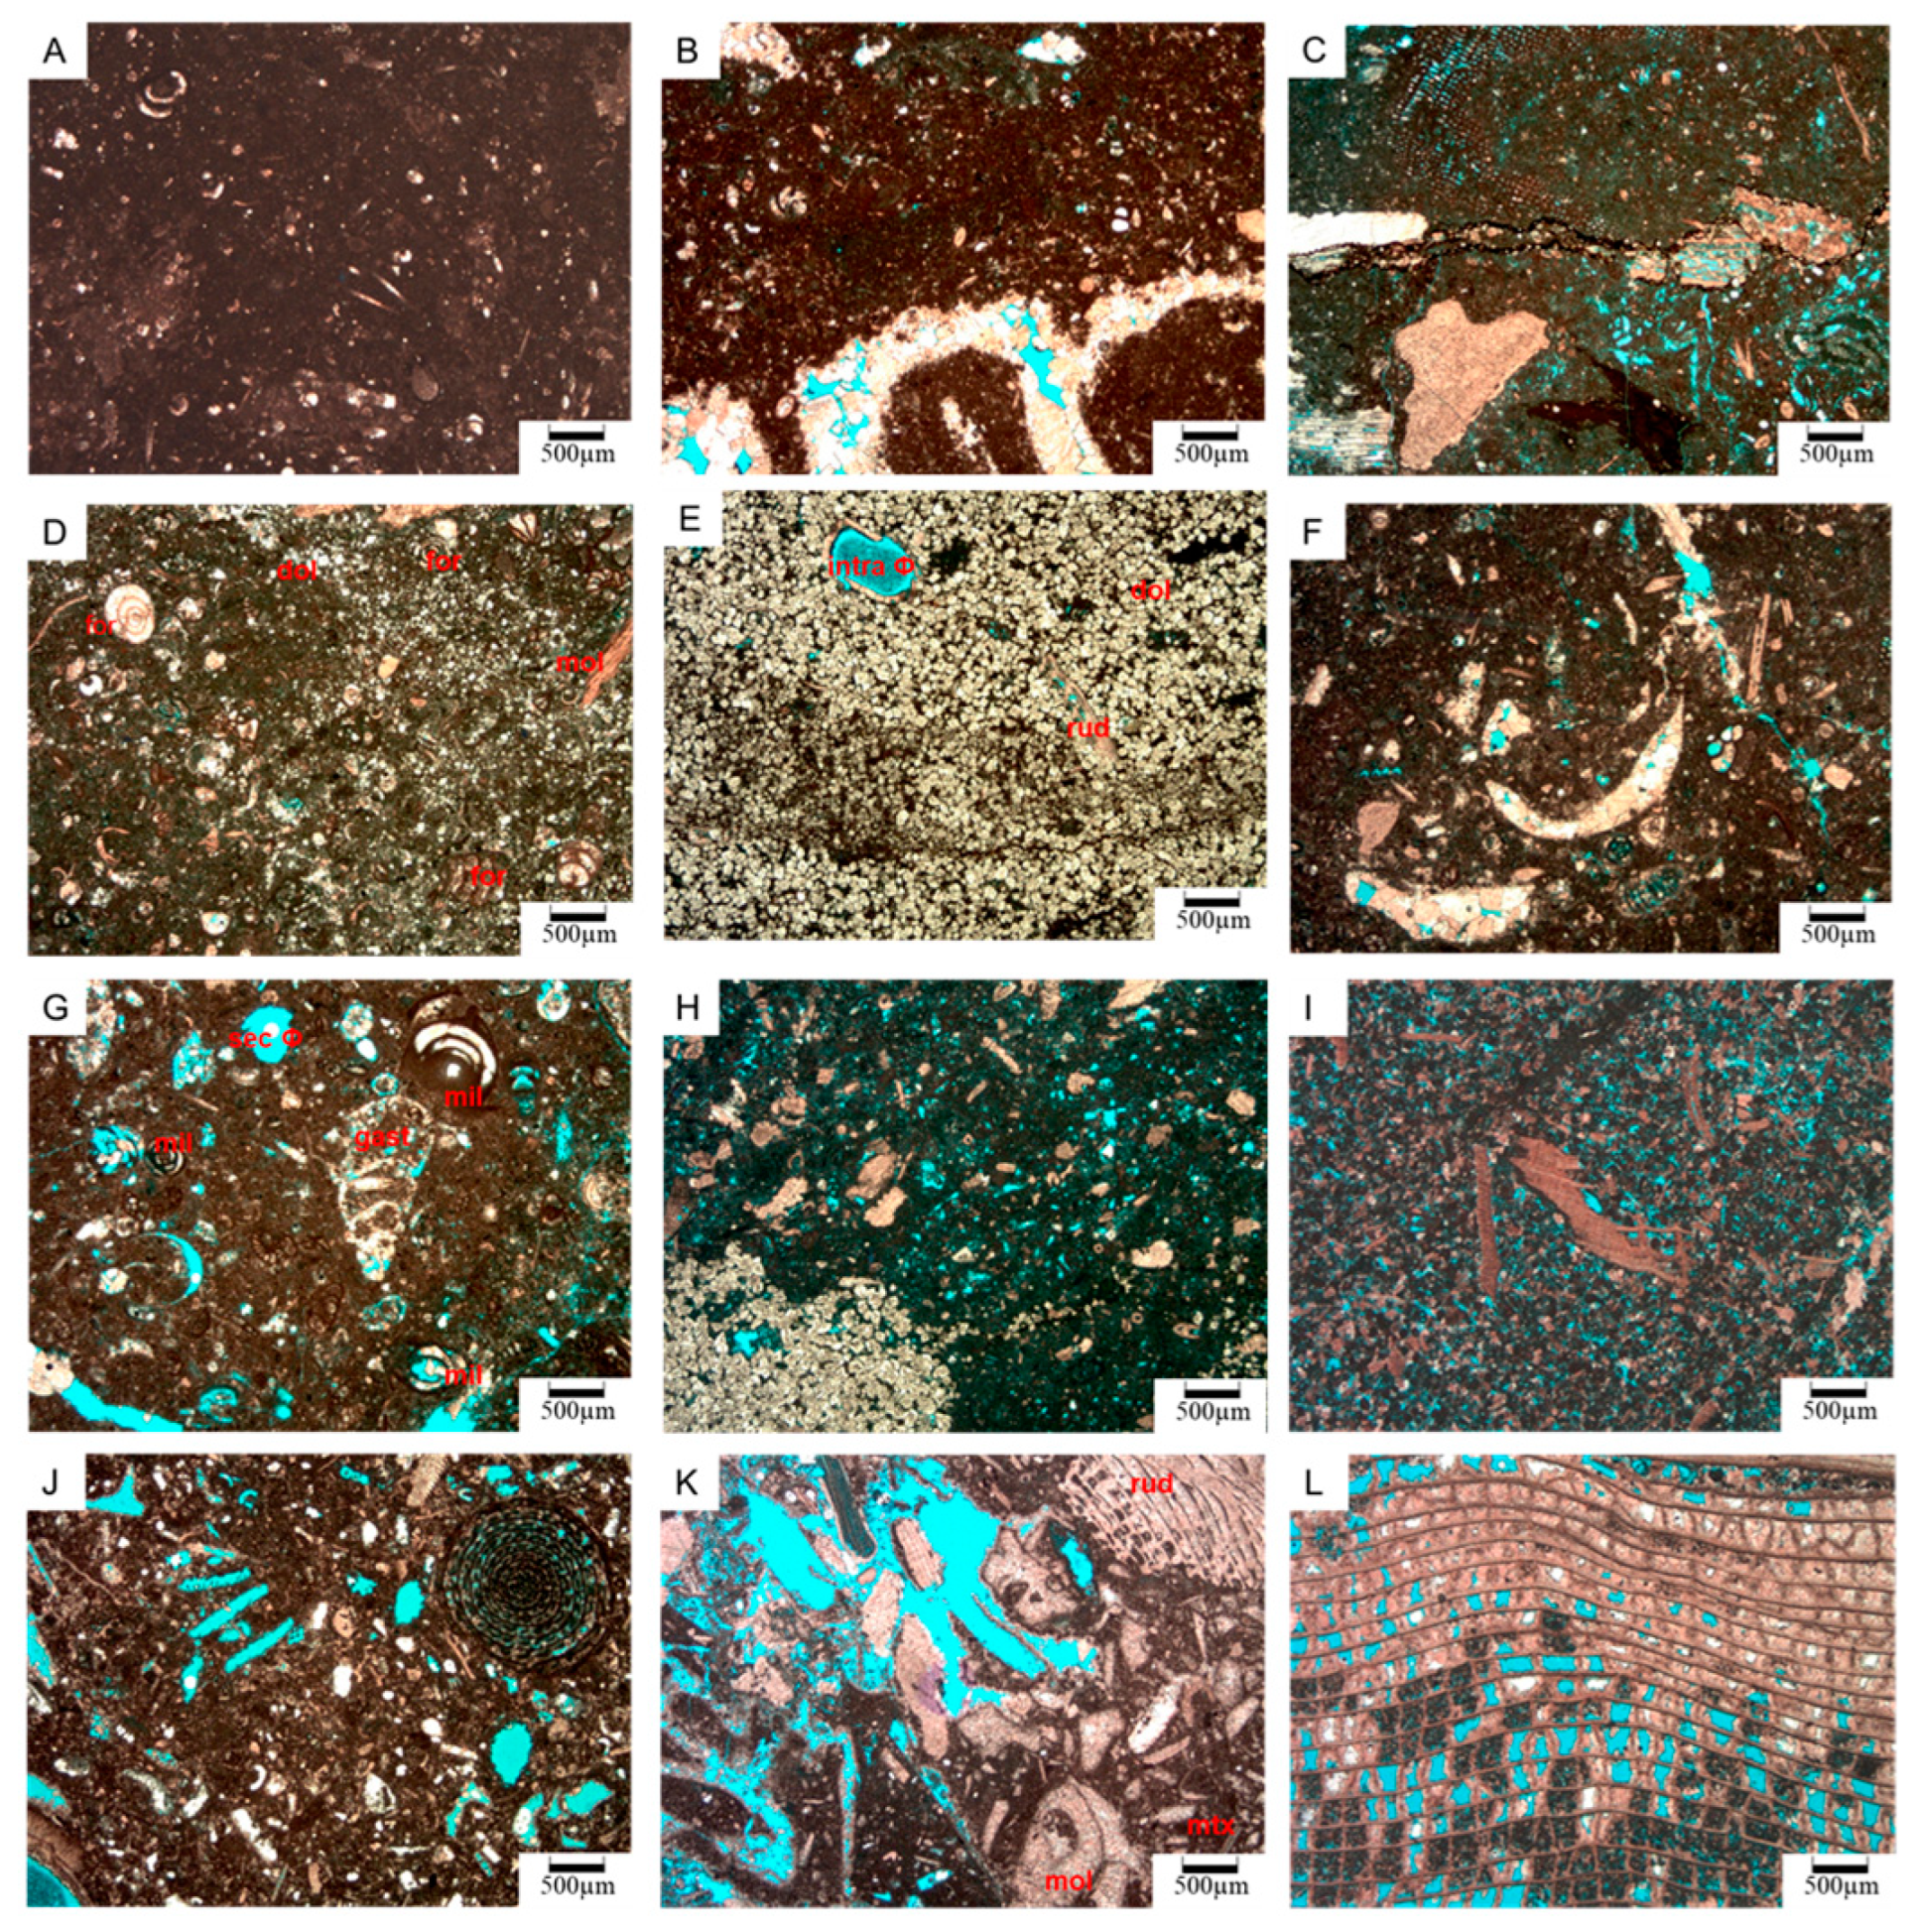
The mudstones (M) consist of interbedded dark grey or black shale/claystone, without bioclastic material. The foraminiferal mudstones (LMf) and bioturbated mudstones (LMb) are composed of limestone and contain less than 10% bioclastic fragments. The bioturbated mudstones (LMb), which display the second lowest average porosity and permeability and a higher average grain density (Table A1, Figure 6A), commonly occur in lagoon settings.
The wackestones include bioclastic peloidal wackestones (LWpd), bioclastic wackestones (LWb), dolomitic bioclastic wackestones (LWdb), and dolomitic wackestones (DW). The former three lithofacies are matrix-supported limestones, with bioclasts predominantly consisting of benthic foraminifera (for), molluscan fragments (mol), gastropods (Figure 6B), rudist bivalves, echinoderm plates (Figure 6C), and sponge spines. Only the plates and spines of the echinoderms represent open sea life [33]. Minor-to-moderate benthic organisms, including bryozoans, corals, red and green algal fragments, stromatoporoids, ostracods, brachiopod spines, pelletal material, and patchy replacive dolomites (dol) (Figure 6D) are also present. The average porosity and grain density of LWdb lithofacies are higher than those of the LWpd and LWb lithofacies (Table A1). In addition, the dolomitic wackestones (DW) contain pervasive dolomite cementation (dol) with minor scattered bioclasts, including rudistid bivalve fragments (rud). The non-ferroan dolomites exist as a very finely crystalline mosaic (Table A1, Figure 6E). The average porosity and permeability of the DW lithofacies are lower than those of the LWbp, LWb, and LWdb lithofacies. The possible reason for this is that DW lithofacies exhibit a higher dolomite cement content than do the other three lithofacies [34].
The packstones, including bioclastic peloidal packstone (LPbp), bioclastic packstone (LPb), and dolomitic bioclastic packstone (LPdb), are limestones with grains supported by rounded to angular allochems. The bioclasts include abundant molluscan fragments (Figure 6F,G), benthic forams, echinoderm plates and sponge spicules, minor-to-moderate bryozoans, algal fragments, brachiopod spines, ostracods, coralline fragments (Figure 6H), and planktonic forams like Globigerinids. The foraminifera provide time markers for the biozonations in the shallow and deep marine carbonates. The presence of echinoid debris, miliolids, textulariids, sp. algae, brachiopods, and Lituolinid foraminifera indicates shallow water settings [35]. The cement of the dolomitic bioclastic packstone (LPdb) is dominated by abundant non-ferroan rhombic dolomites concentrated in irregular patches (Figure 6H). Owing to its higher dolomite content, the LPdb lithofacies exhibit lower permeability and higher grain density than do the other lithofacies (Table A1).
Bioclastic peloidal grainstones (LGbp) and bioclastic grainstones (LGb) are the two types of limestones with grain-supported textures. The former occurs in widespread peloidal material (Figure 6I). The moderate to abundant bioclasts consist of molluscan fragments, bryozoan fragments, echinoderm fragments, benthic forams (Figure 6J), and algal fragments. Subordinate bioclast fragments, consisting of echinoderms, algal fragments, peloidal material, minor stromatoporoids, calcareous sponges, and bryozoans, were also observed. The two lithofacies display good reservoir qualities with relatively high average porosities and permeabilities (Table A1).
The rudistid floatstones (LFr) contain numerous large bioclastic fragments that are predominantly rudistid in origin. Most of the rudist bivalve gravel fragments are set in a micritic matrix (Figure 6K). The reservoir quality of this lithofacies, which exhibits the highest average porosity and permeability, is the best in the Mishrif Formation (Table A1). The rudistid rudstones (LRr) are clast-supported limestone, with bioclasts predominantly consisting of large rudistid shells or fragments. The rudists are the most important molluscan fragments in the rudstone. The gravelly rudist bivalve fragments are composed of non-ferroan calcite and are typically leached (Table A1, Figure 6L).

4.1.3. Depositional Cycles

The δ13C VPDB of the Mishrif Formation bulk rock samples range from 1.87‰ to 3.97‰, indicating its shallow marine settings [23]. MB1, MB2, and MC1 of the Mishrif Formation, deposited within a restricted carbonate platform setting [3], include inner shelves, platform margins, and ramps. As per lithofacies associations, the skeletal grain contents and the fossil assemblages, as well as nine depositional elements, including open lagoon (OL), back-shoals (BShs), coated grain sheets (CGSs), biostromes (Bs) within the inner-shelf, peritidal marshes (PM), back-shoal complexes (BShCs), shoal complexes (ShC), patch rudist reefs (PRF), and proximal mid-ramps (PMR) around the platform margin, were identified in the Mishrif Formation.
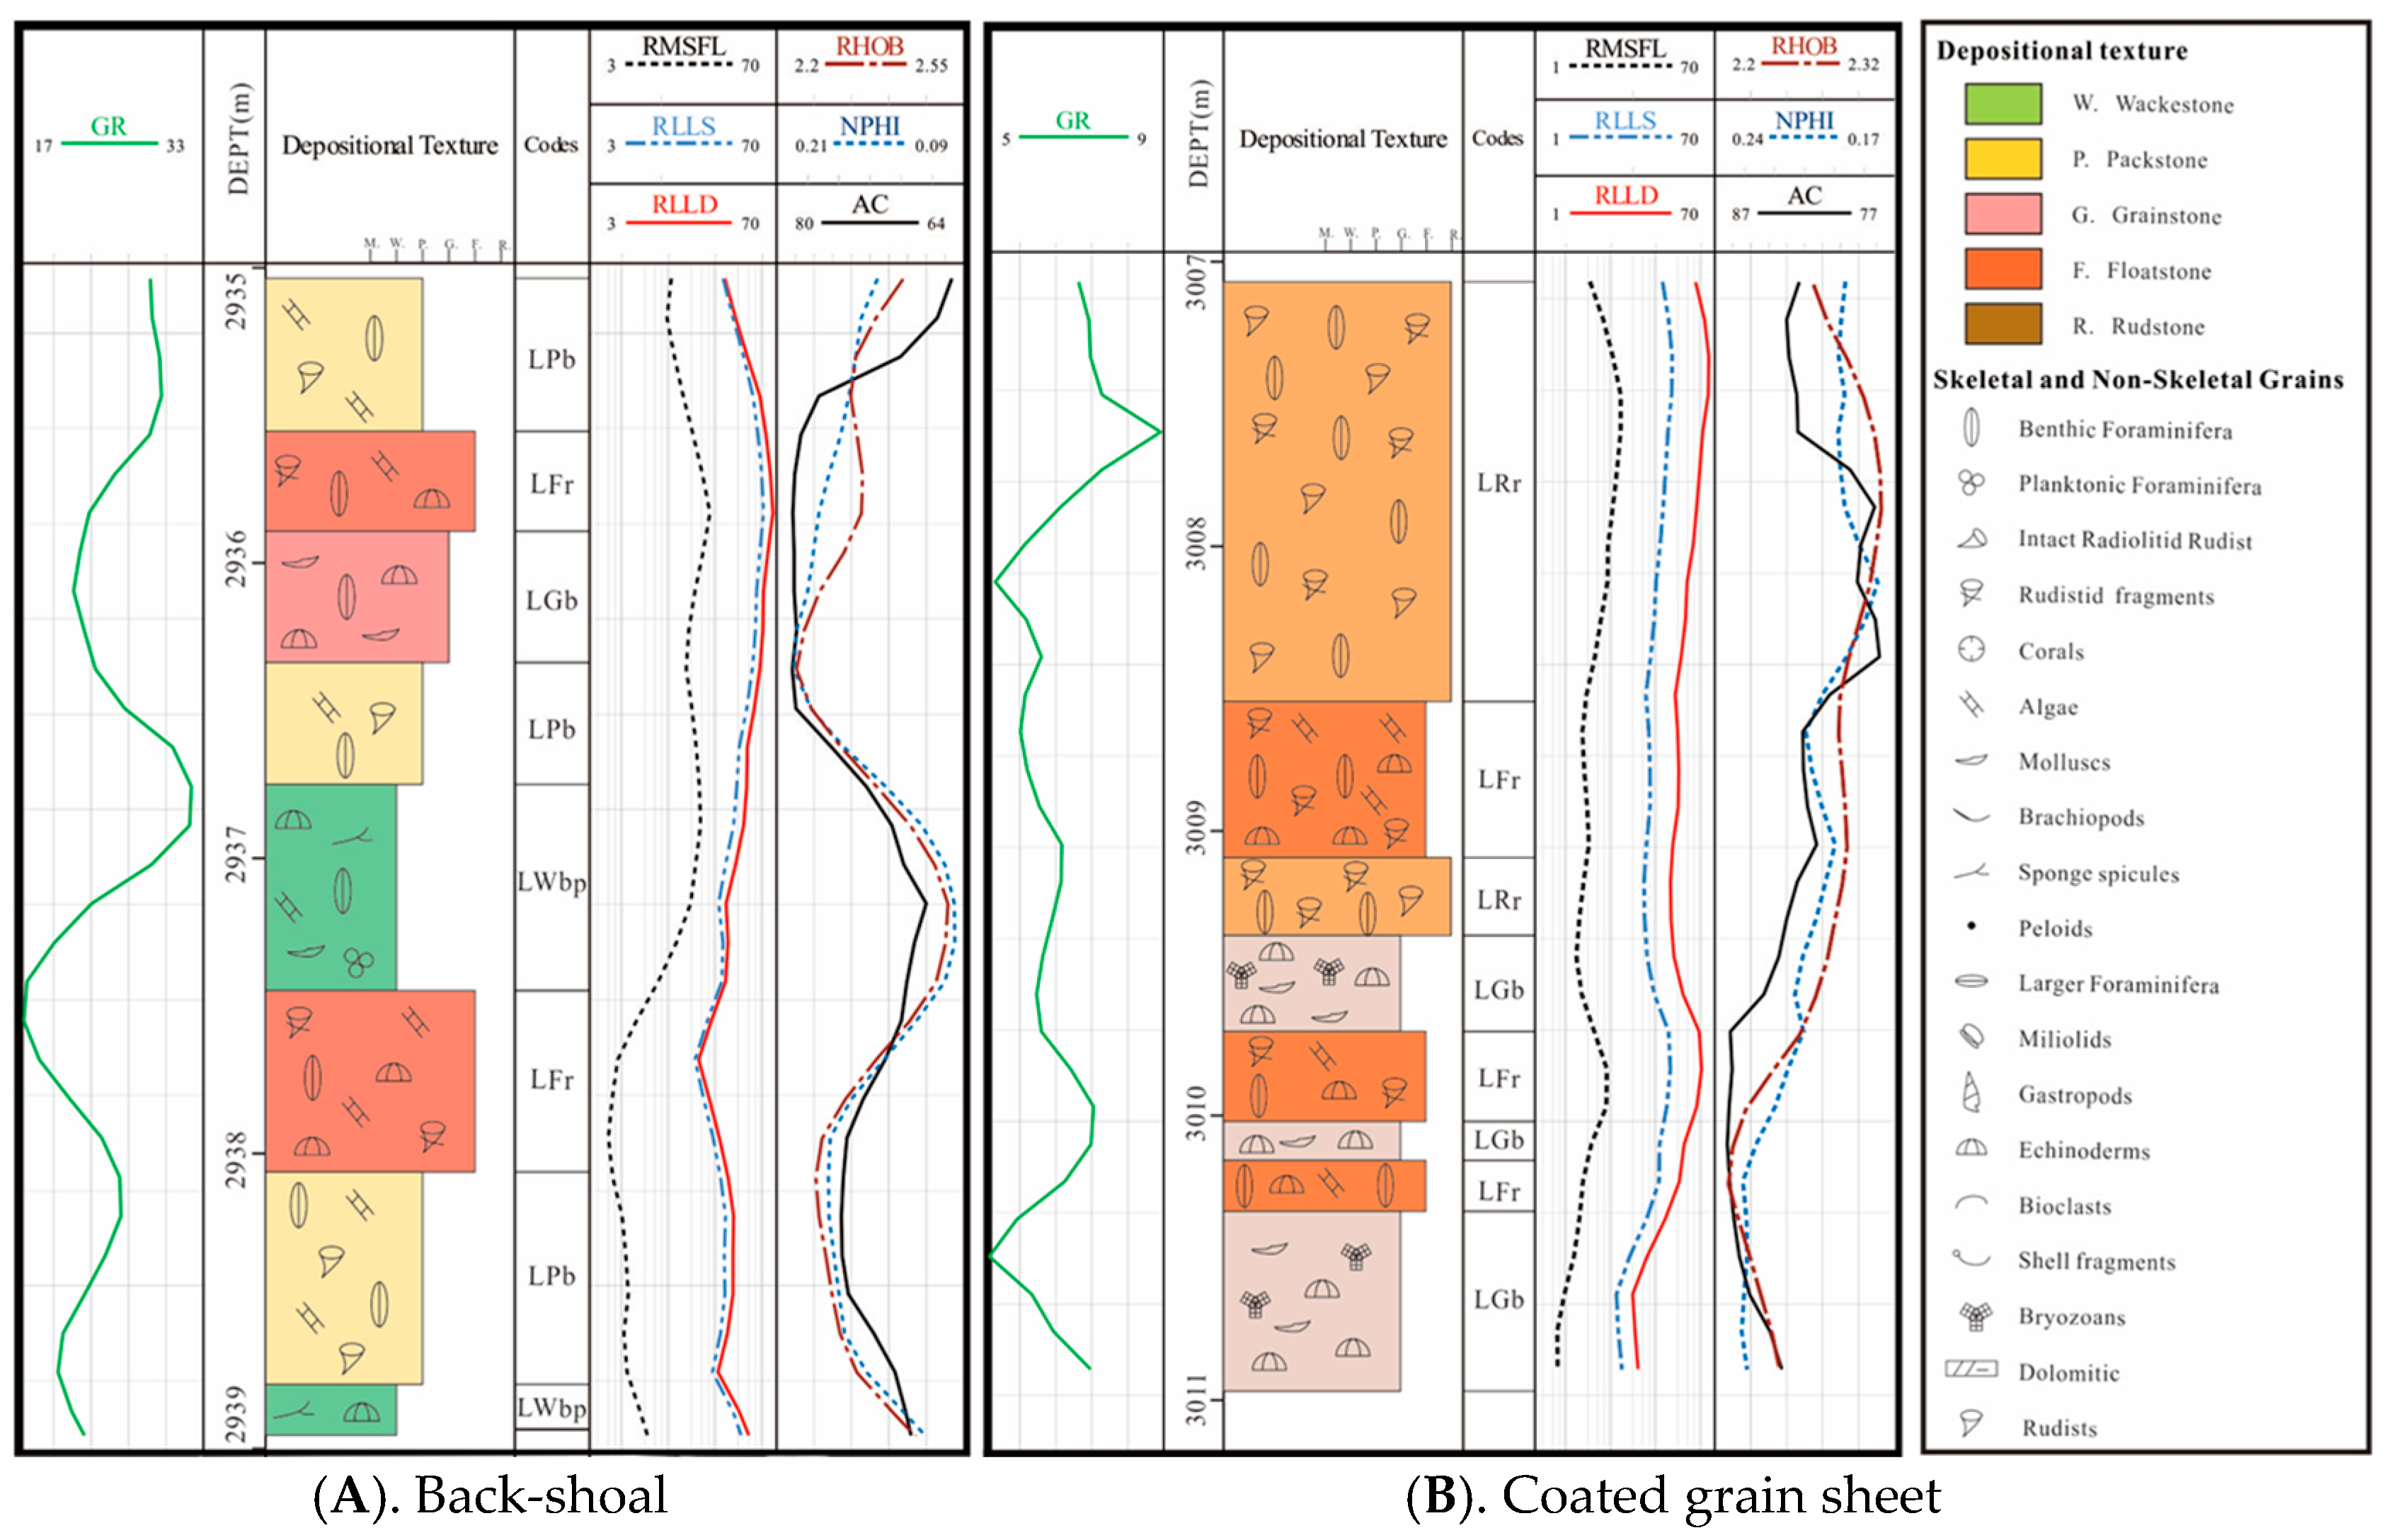
The back-shoal elements were deposited on the lee side of the biostromes under relatively static shallow water conditions [34]. They contain bioclasts, including bivalves and rudist fragments, as well as less abundant benthonic foraminifera, gastropods, echinoderms, algae, and peloids. The back-shoal elements involve eight lithofacies, of which the bioclastic wackestones (LWb), bioclastic packstones (LPb), and bioclastic peloidal wackestones (LWbp) account for 43.1%, 20%, and 15.4% of the total thickness of this element, respectively, and are the main lithofacies with subordinate dolomitic bioclastic wackestones and bioclastic grainstones. The common lithofacies associations are LWbp–LWb–LWbp–LWb–LWbp, LWdb–LPb–LFr–LPb–LWb, LWb–LPb–LWdb–LWb–LPb–LWdb, LWb–LPb–LWb–LPb–LWb–LPb–LWdb, and LGb–LPb–LGb–LPb–LWb–LWbp–LFr–LPb (Figure 7A). Their thicknesses range from 0.54 m to 6.57 m, with an average of 2.14 m.
The bioclastic packstone (LPb), bioclastic wackestone (LWb), and bioclastic peloidal wackestone (LWbp) account for 47.1%, 28.2%, and 16.2% of the total thickness of the coated grain sheets, respectively, and are the main lithofacies of this depositional element. The lithofacies associations include LGb–LPb–LWb, LPb–LWbp–LFr–LPb, LPb–LWb, LPb–LWbp, and LPb–LWbp–LPb–LWb–LPb–LWbp (Figure 7B). Their thicknesses range from 1.31 m to 3.55 m, with an average of 2.15 m.f.
The biostromes contain eight lithofacies, of which bioclastic packstone (LPb) and rudistid floatstone (LFr) account for 38.9% and 27.5% of the total thickness of the biostromes, respectively, and are predominantly followed by bioclastic peloidal wackestone, bioclastic wackestone, and dolomitic bioclastic wackestone. The lithofacies associations include LFr–LWbp, LPb–LFr–LGb–LPb–LWbp–LFr–LPb–LWbp, LFr–LPbp–LGb–LPb–LWdb-LPb–LWb–LFr–LPb–LWb–LGb–LWpb, and LWdb–LWb–LPb–LFr–LWdb–LWb–LPb-LFr–LPdb–LFr–LPdb–LPb, exhibiting roughly reverse cycles (Figure 8A). Their thicknesses range from 1.0 m to 7.53 m, with an average of 4.47 m.
Patch rudist reefs (PRFs), which are located at the platform’s margin and possibly laterally pass into the shoal complexes, are commonly formed on the crestal parts of growing structures and represent the local high-energy environment [32]. They are also referred to as lithosomes. The PRFs include five lithofacies, of which the bioclastic grainstone (LGb), rudistid rudstone (LRr), and rudistid floatstone (LFr) account for 40.2%, 26.9%, and 25.5% of the total thickness, respectively, and are the dominant lithofacies. LRr–LGb–LRr–LFr–LGb–LFr–LGb–LRr–LFr–LGb, LRr–LFr–LGb, LRr–LFr–LRr–LGb-LFr–LGb–LFr–LGb, and LGb–LRr–LFr–LRr–LPbp–LFr–LPb are common lithofacies associations that exhibit reverse cycles (Figure 8B). Their thicknesses range from 2.61 m to 5.7 m, with an average of 3.85 m.
Shoal complexes, which are deposited in the relatively high-energy setting above the fair-weather wave base where little clay remains, are characterized by floatstones and grainstones with scattered rudist fragments, echinoderm fragments, variable proportions of peloids, and gastropod fragments [35]. This depositional element includes six lithofacies, of which bioclastic grainstone (LGb), bioclastic peloidal packstone (LPbp), rudistid floatstone (LFr), and bioclastic peloidal grainstone (LGbp) account for 33.1%, 27.5%, 16.6%, and 11.5% of the total thickness, respectively. The lithofacies associations, showing reverse cycles, include LGb–LFr–LGb–LWbp–LGb, LFr–LGb–LFr–LGb–LFr–LGb–LFr–LGb–LGbp–LGb, LGb–LFr–LGb, LPbp–LWbp–LPbp, LPb–LPbp, LPbp–LWbp–LPbp, LPbp–LGbp–LPbp–LGbp, and LGb–LFr–LGb–LFr–LGb–LFr–LGb–LFr–LGb–LFr–LGb–LPb (Figure 9A). Their thicknesses range from 1.5 m to 7.04 m, with an average of 3.69 m.
Back-shoal complexes, which are deposited on the lee side of shoal complexes, contain numerous bioclastic fragments consisting of rudists, corals, echinoderms, algae, and large benthic foraminifers [36]. The back-shoal complexes include nine lithofacies, of which bioclastic peloidal packstone (LPbp), bioclastic grainstone (LGb), bioclastic packstone (LPb), and bioclastic peloidal wackestone (LWbp) account for 35%, 17.4%, 16%, and 15.4% of the total thickness of this element, respectively. LGb–LGdb–LGb, LWbp–LPbp–LWbp–LPbp–LWbp–LPbp–LWb, LPb, LGb–LPbp–LWdb–LWbp–LPbp–LWbp–LPbp, and LWdb–LPb are the lithofacies associations that exhibit typical reverse cycles (Figure 9B). Their thicknesses range from 1.79 m to 7.53 m, with an average of 3.96 m.

4.2. Analysis of Diagensis and Reservoir Petrophysical Properties

4.2.1. Diagenesis

The major diagenetic processes, including cementation, dissolution, neomorphism, compaction, pressure solution, and dolomitization, which significantly influence the reservoir quality and hydrocarbon reservoir production performance, occurred during the development of the Mishrif Formation [37].
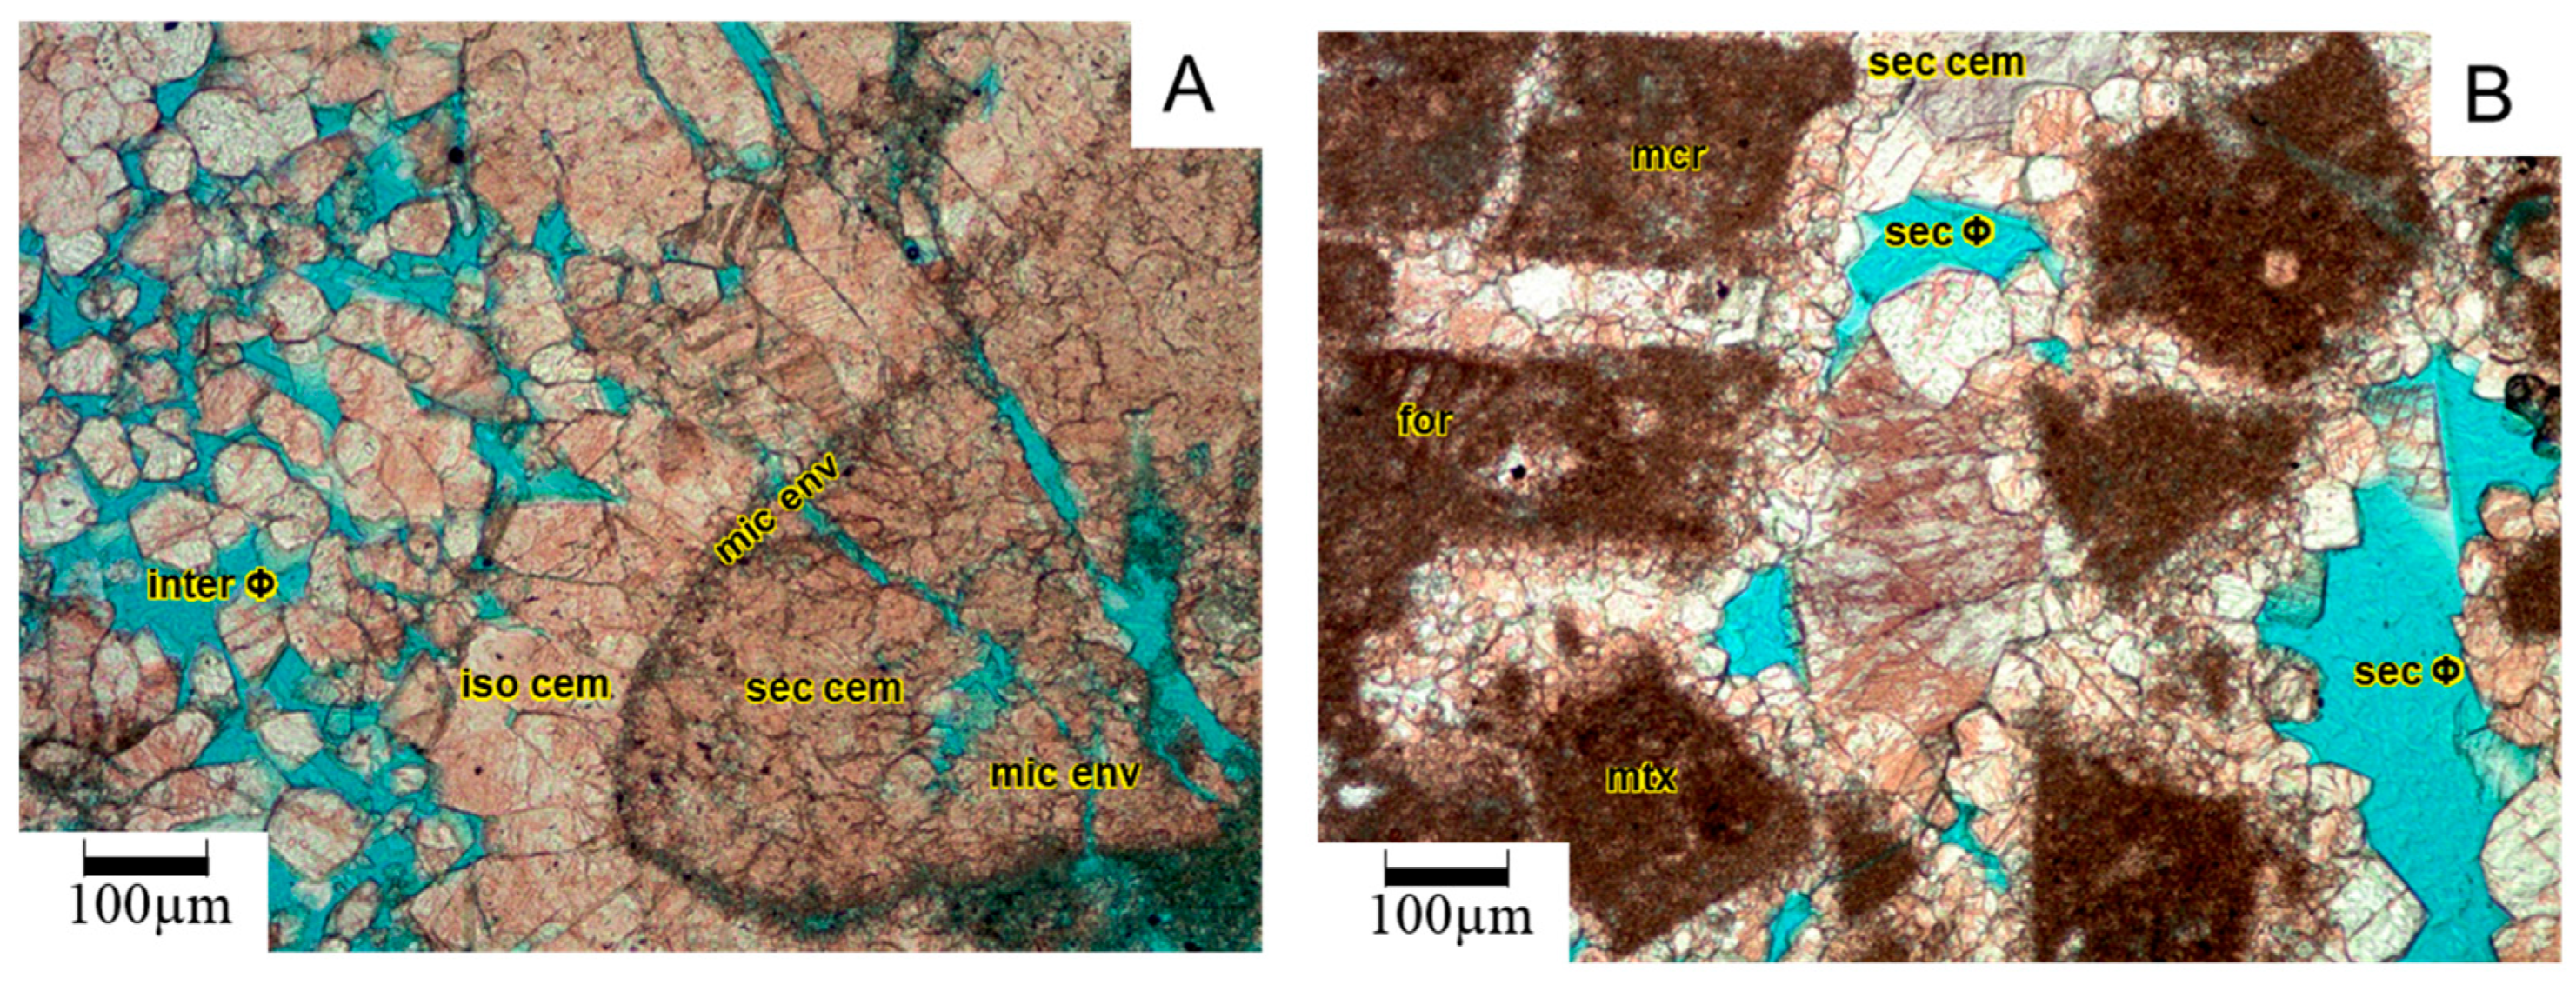
The earlier marine cement is a non-ferroan low-magnesium calcite or aragonite that produces micritic envelopes and thin isopachous rim cements around the bioclastic fragments [38]. The meteoric phreatic water generally precipitates bladed or equant calcite cements around the skeletal grains and within the interparticle pores (Figure 10A). The cements formed during the burial stages are typically Fe-rich calcites and dolomites. The weakly ferroan calcites display drusy to equant fabrics, and coarse calcite spars formed in the deeper burial environment, which significantly reduced the macroporosity of the lithofacies (Figure 10B). Due to the preferential cementation of limestone, blocky cement was precipitated preferentially within the larger pore spaces.
The rudist-bearing lithofacies are particularly affected by dissolution due to the early leaching of the aragonitic components of the rudist shells. The original intrafossil pores have been cemented, and some display geopetal fabrics in which micritic material partially filled the pores prior to cementation (Figure 11A). The secondary pores of the allochems, caused by dissolution, have been lined with very fine non-ferroan calcite spars (Figure 11B). Dissolution related to periodic exposure was the major process noted, due to the decrease in sea level [39]. Dissolutions by short-term meteoric leaching at the top of the fourth-order and third-order sequences are about 3 m and about 17 m thick, respectively (Figure 4A,B).
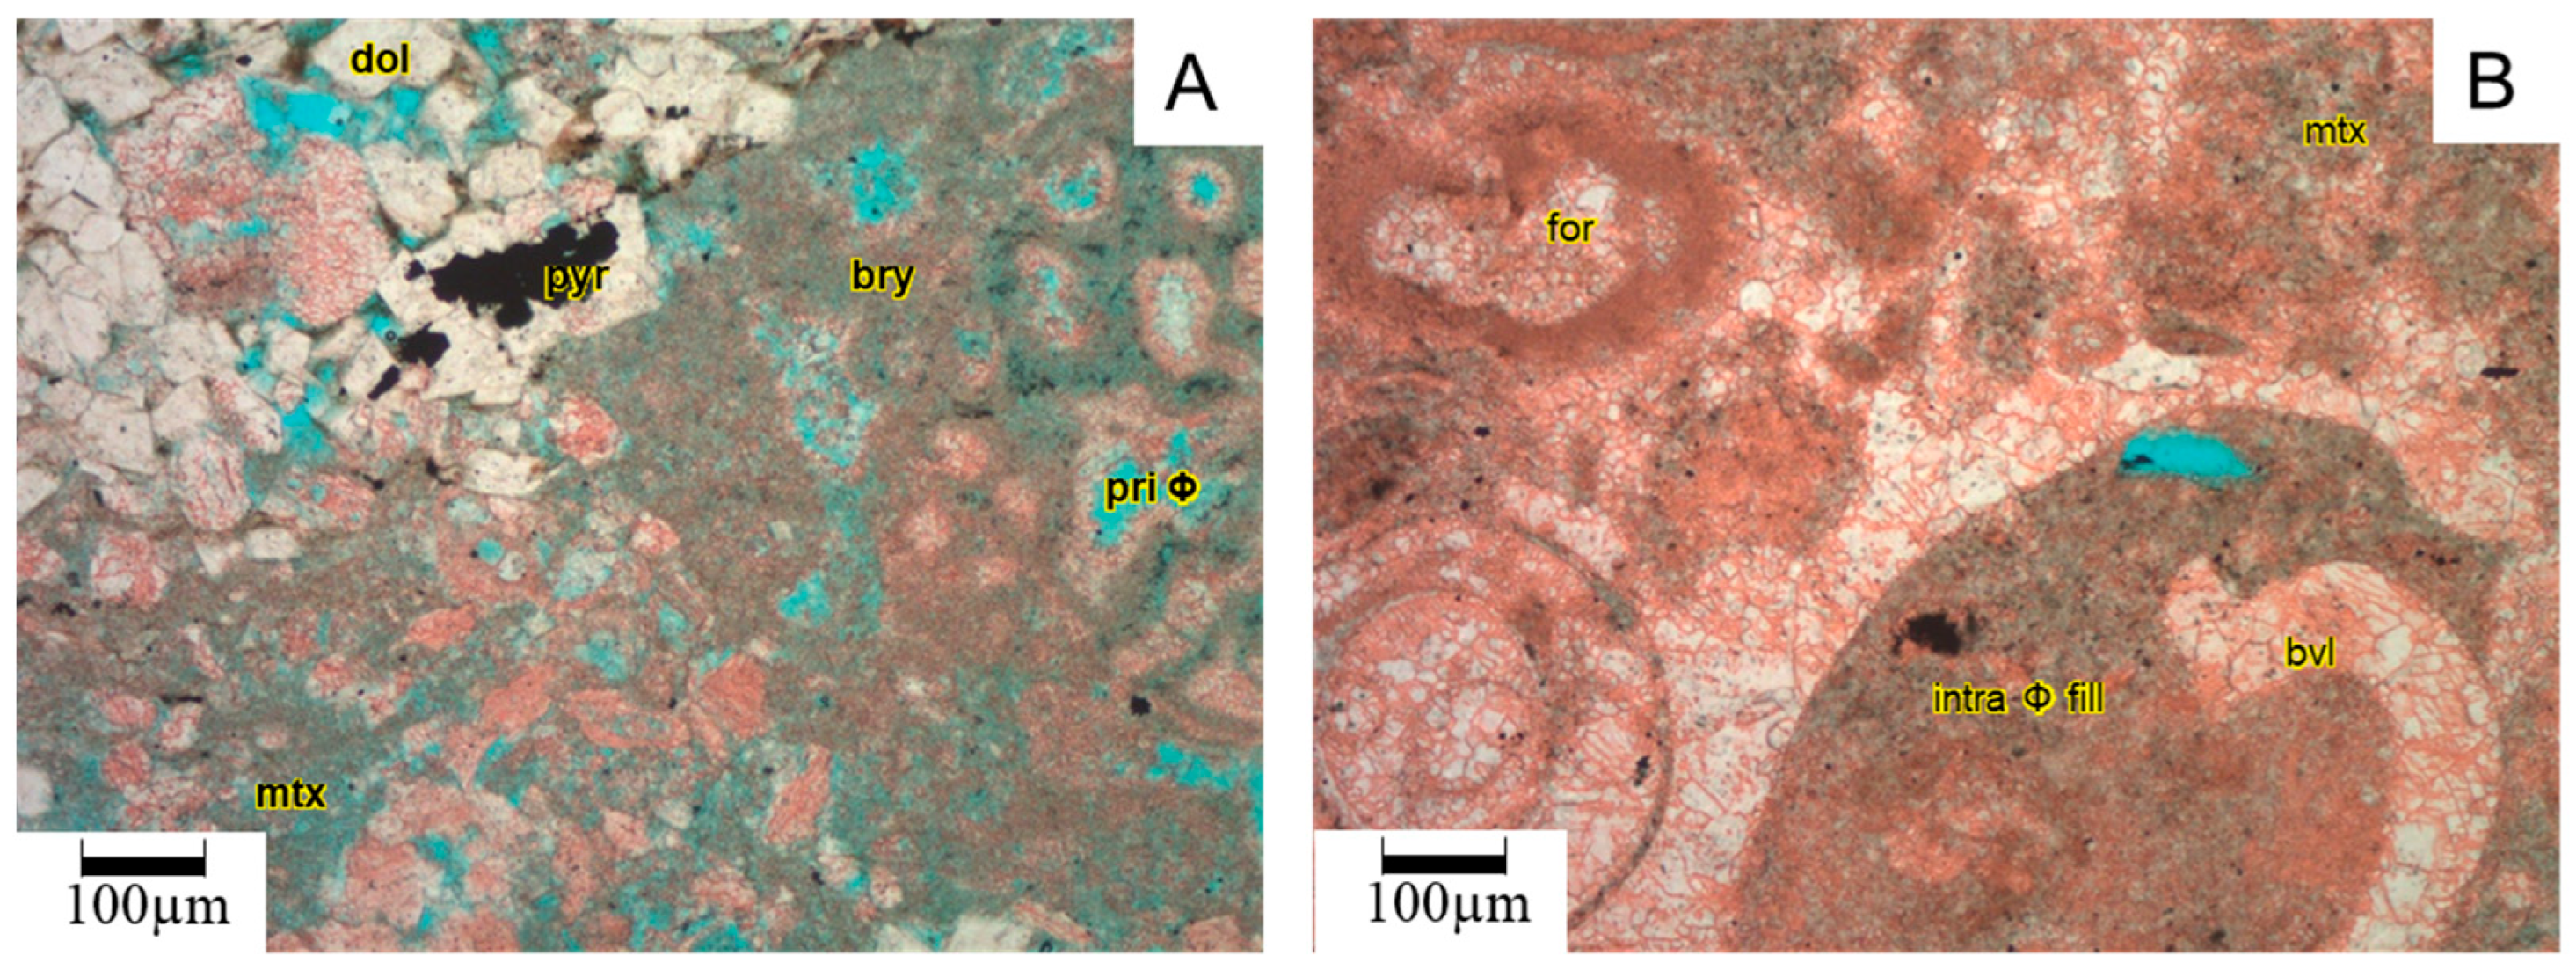
The neomorphism involved neomorphic replacement, mineral inversion, and recrystallization of the fine micrite grains [40]. The non-ferroan calcites and dolomites in the Mishrif Formation are the result of the neomorphic replacement of the micritic matrix. Most of the replacive dolomites are euhedral to subhedral in shape. Rare pyrite and chert replaced the matrix and grains (Figure 12A). A bivalve has been altered from its originally aragonite composition to a coarse non-ferroan calcite spar, which suggests a widespread replacive/pore-filling phase (Figure 12B). The δ18 O VPDB of the bulk rock samples from the Mishrif Formation range from −5.43‰ to −3.63‰, indicating limited recrystallization or relatively low temperatures during recrystallization [18].
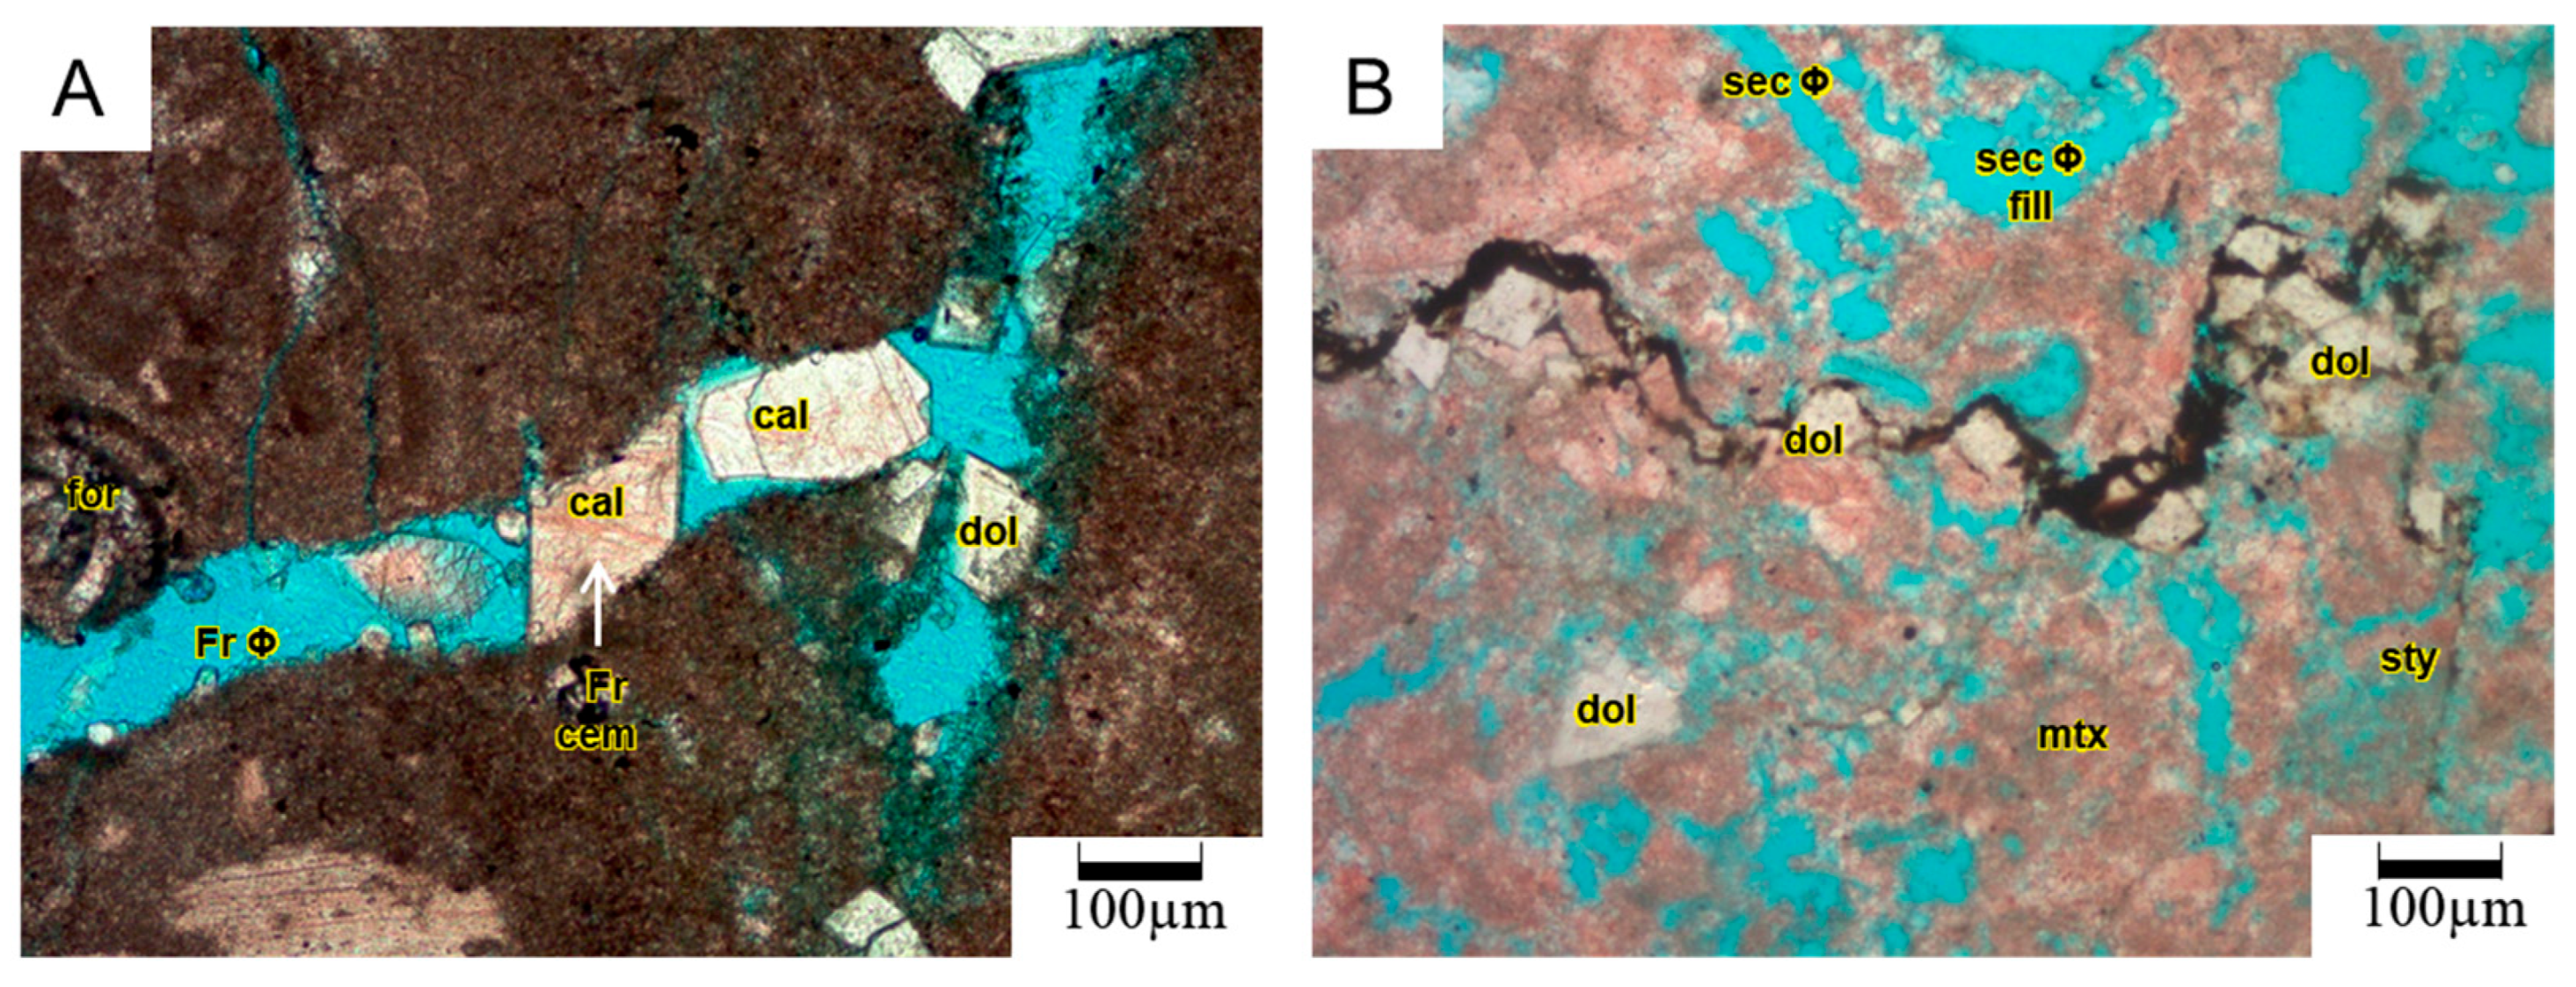
Burial-related mechanical compaction features include plastic or brittle grain deformation and earlier-stage fractures [41]. The fractures are partially cemented by non-ferroan calcite, with minor non-ferroan dolomite, which is present as an isolated rhomb (Figure 13A).
Stylolitization occurs after 600 m of burial at temperatures of approximately 65.6 °C [40]. Stylolites contain dark materials, such as clay, iron oxides, or organic materials, or combinations of the three, with high-amplitude jagged or low-amplitude horse-tail shapes [42]. A stylolite in the Mishrif Formation is associated with dolomite development bounded by molluscan fragments (Figure 13B).
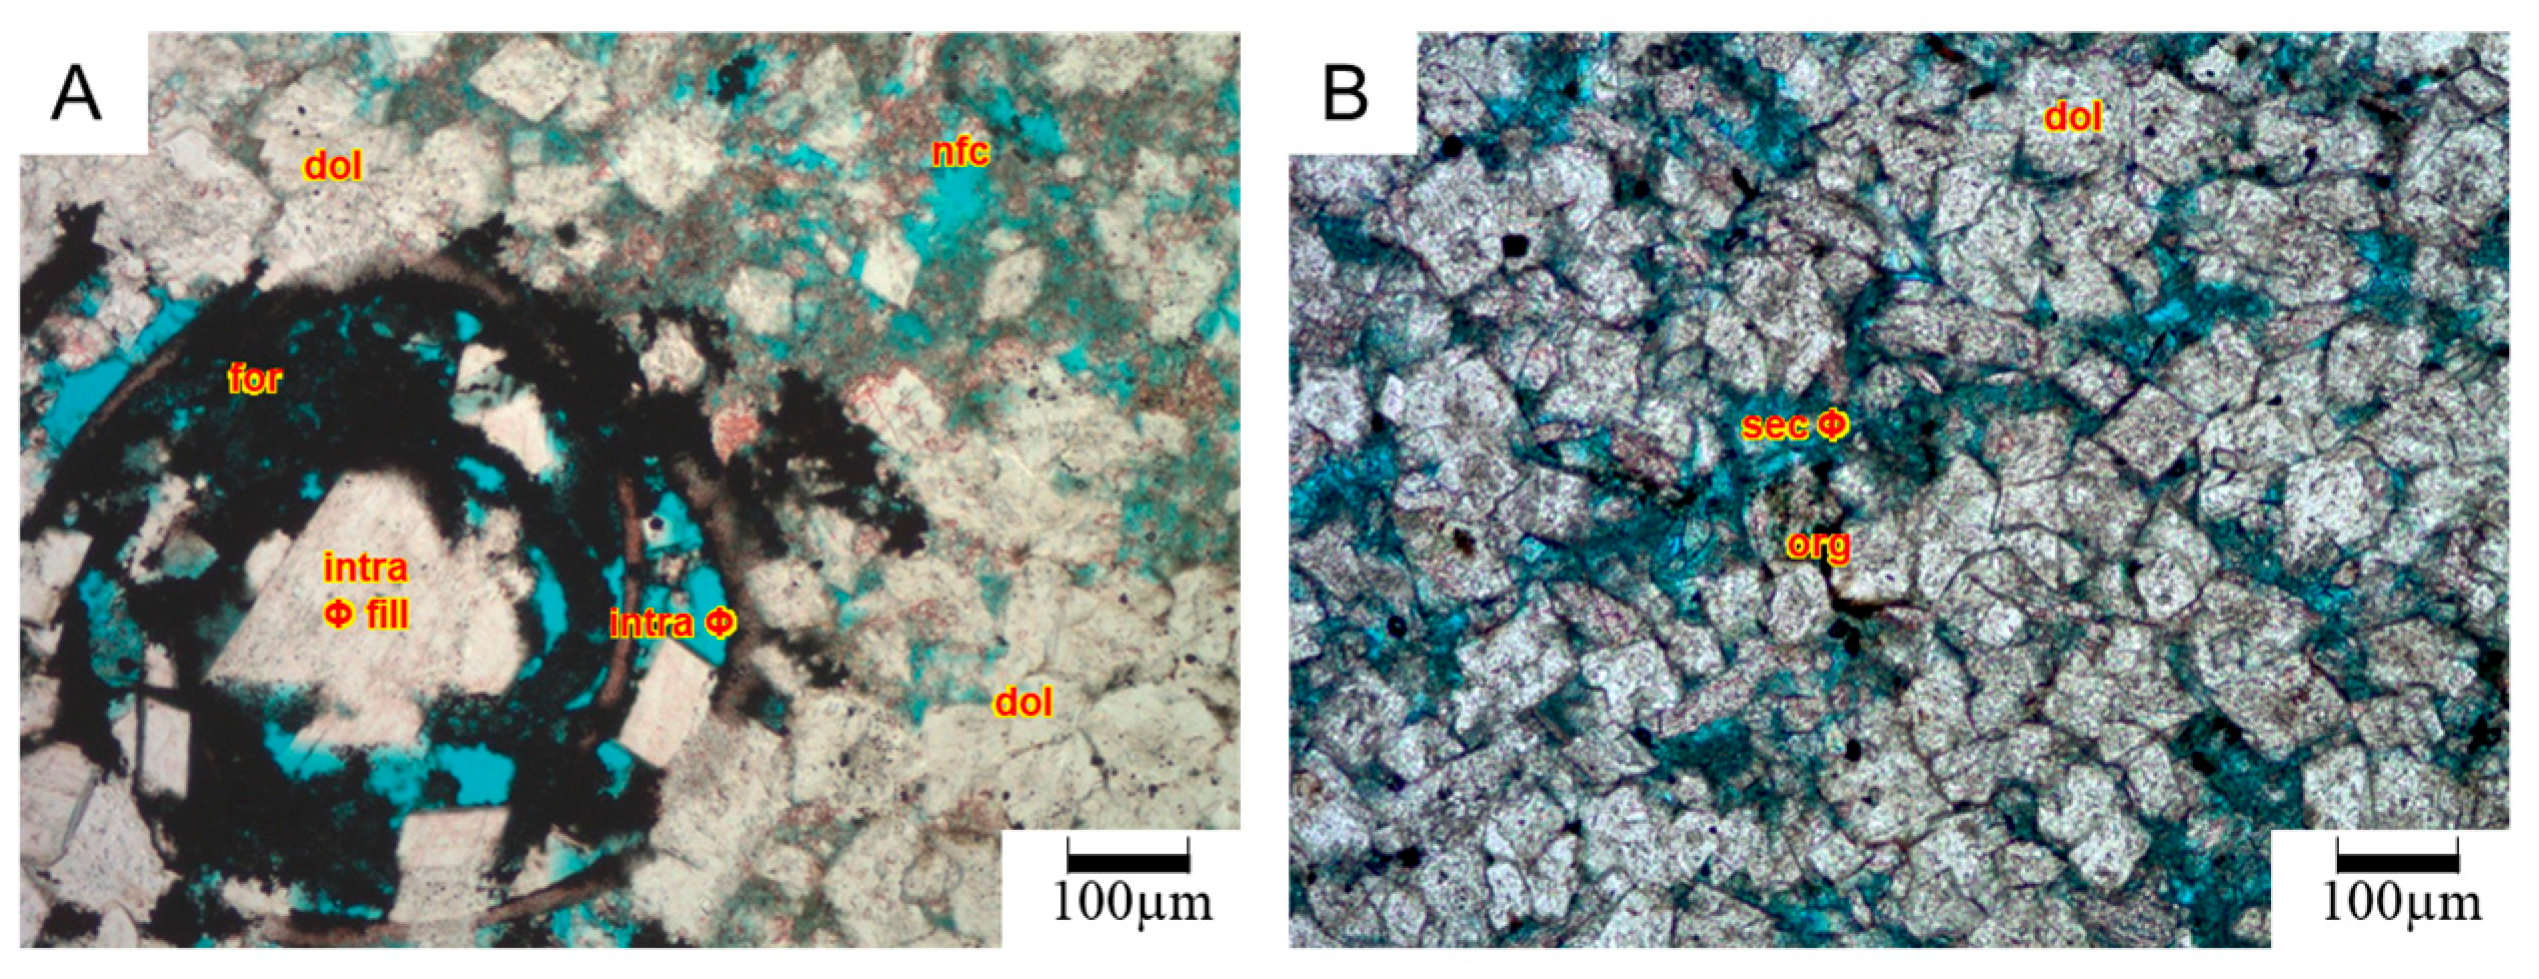
The limestones and their precursor sediments have been partly converted to dolomite by the replacement of the original CaCO3 during the dolomitization process [43]. Replacive euhedral and anhedral non-ferroan dolomites have filled the moldic pores (Figure 14A). In the lagoonal environment, the replacive dolomites with patchy distributions are attributed to dolomitization in the marine–meteoric mixing zone [44,45,46,47]. The pervasive cementation of the dolomitic wackestones is comprised of very finely crystalline non-ferroan dolomites, which exhibit cloudy centers and clear exteriors and are euhedral to subhedral in shape (Figure 14B). These finely crystalline dolomites formed at low temperatures (<50 °C). Dolomitization is uncommon in the Mishrif Formation in the HY oilfield, and it has had a limited effect on the reservoir’s quality.

4.2.2. Reservoir Petrophysical Properties

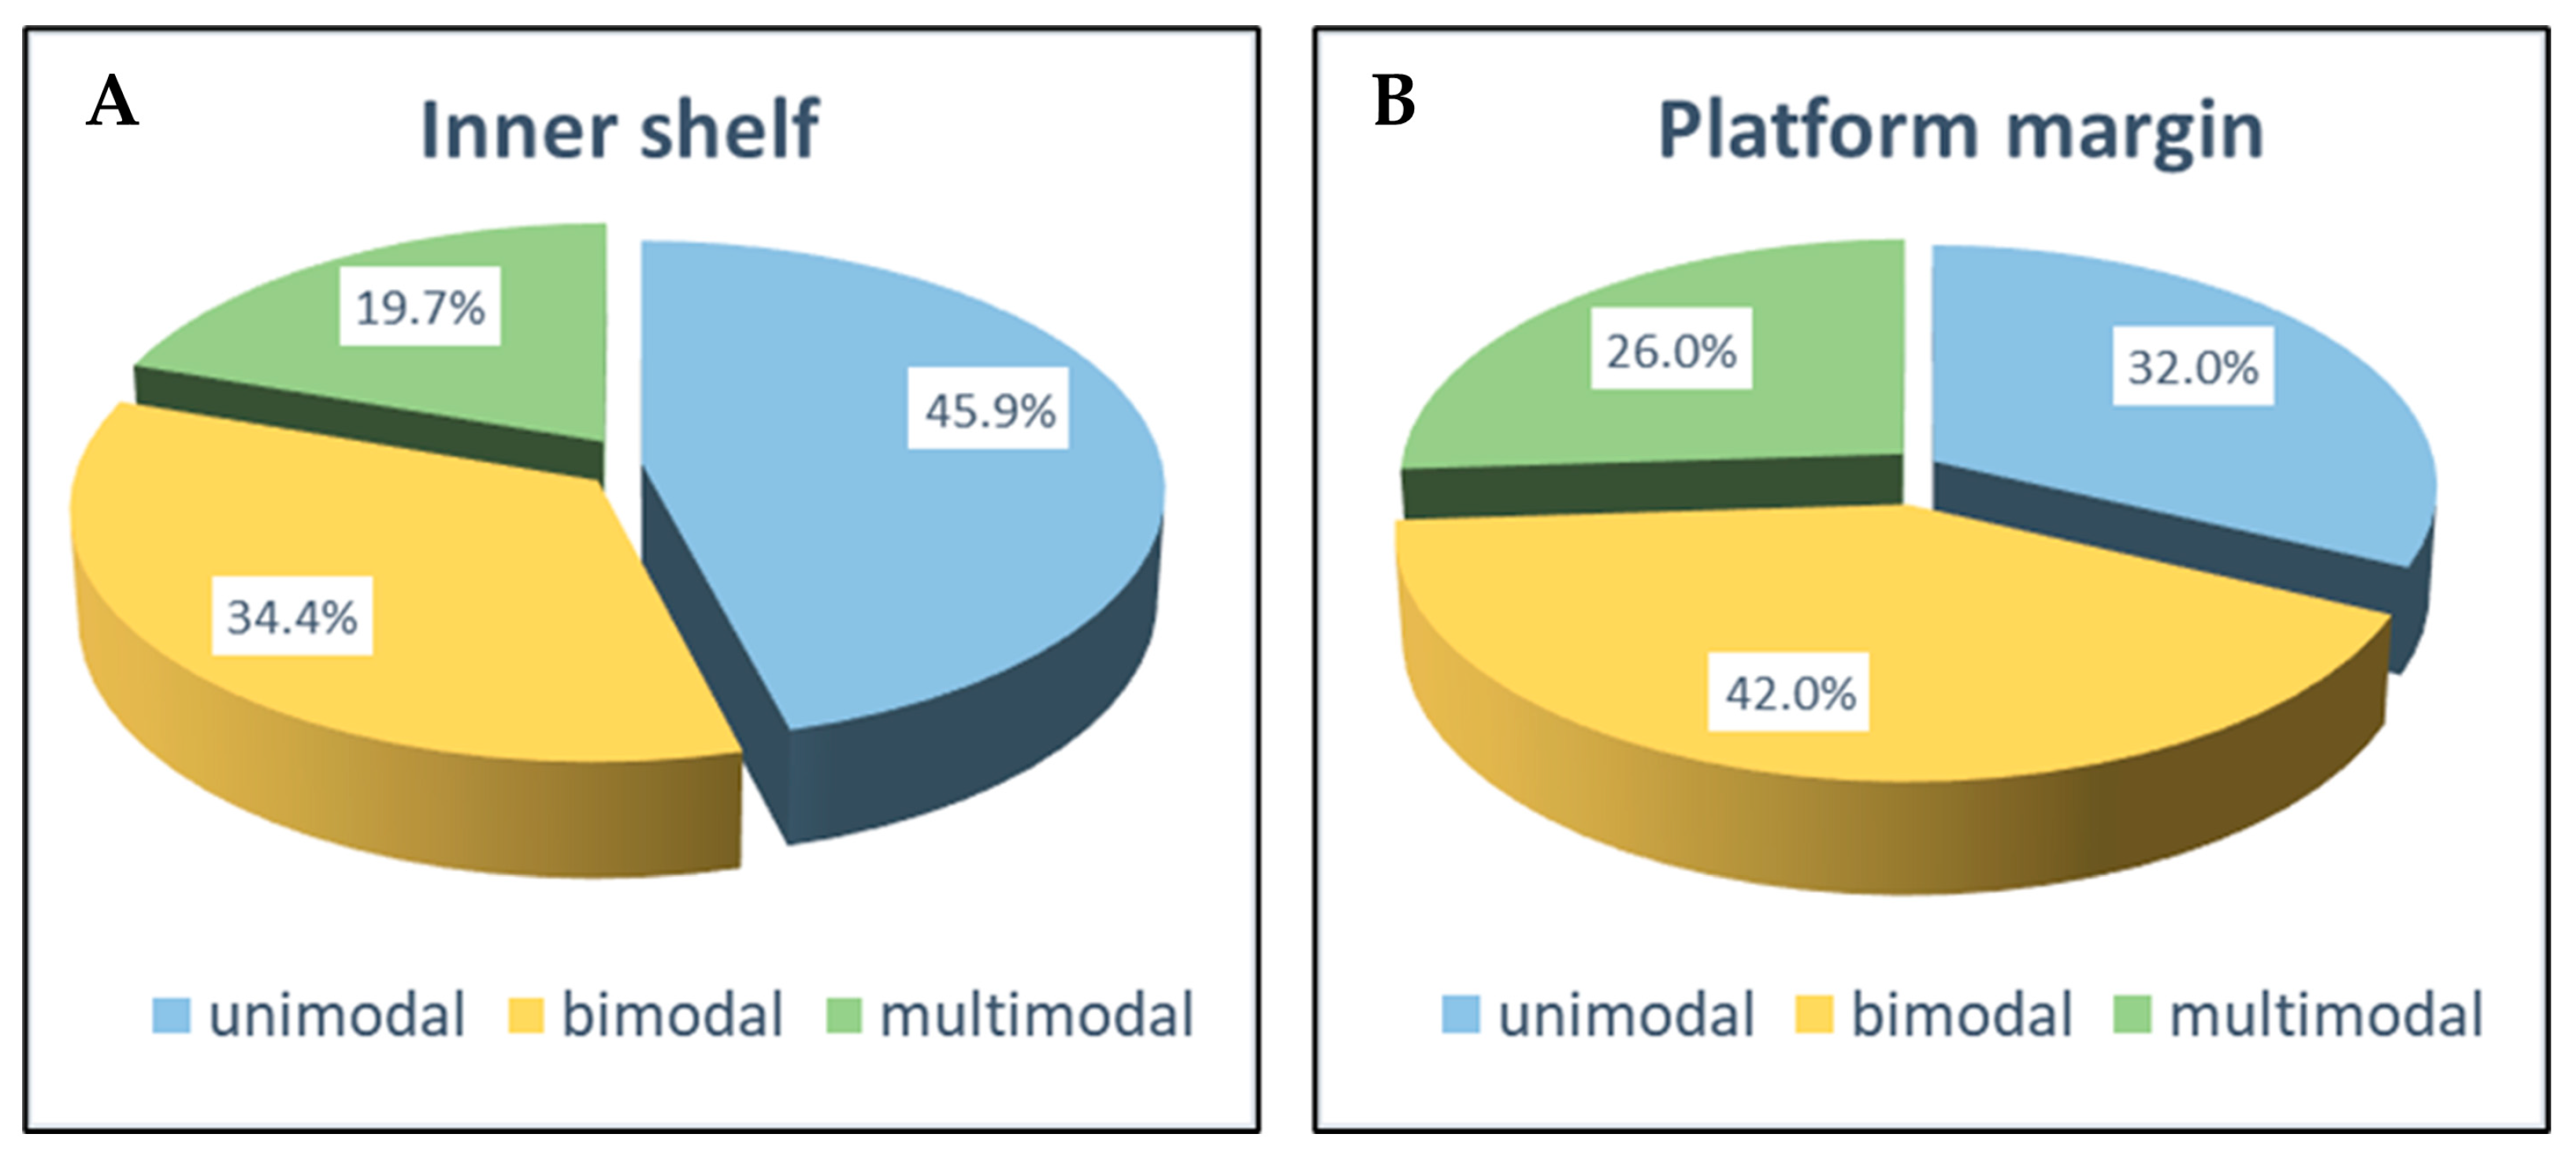
Sequence stratigraphy, depositional environments, and diagenetic events are the three principal controls of reservoir quality [48]. According to the mercury injection capillary pressure (MICP), the pore system of the Mishrif Formation, comprising unimodality, bimodality, and multimodality [7], is predominantly unimodal within the inner shelf, accounting for 45.9% of the system. However, the pore system is mainly bimodal within the platform margin, accounting for 42%. The multimodality pore system accounts for 19.7% and 26% within the inner shelf and platform margin, respectively (Figure 15).
R35, the pore-throat radius at a mercury saturation of 35% during the high-pressure mercury injection tests, illustrates the reservoir’s flow potential [49]. The pore-throat sorting (PTS) and R35 obtained from the MICP were used to compare the reservoir quality of each depositional element (Table 1) [50,51]. The high permeability contrast of the shoal complexes, corresponding to the largest R35 differences and PTS differences (Table 1), indicates the existence of high permeability streaks, which can lead to water and/or gas breakthroughs during waterflooding and gas flooding development. The high permeability streaks, whose thickness accounts for 13.8% of the perforated intervals and whose water intake volume accounts for 47% of the injector, were verified by the injection logging tool (ILT) results in the HY field. However, many of these high permeability streaks can scarcely be identified directly from the conventional wireline log [37].
The biostromes exhibit good porosity (averaging 21.5%), poor permeability (averaging 21.8 mD), and a relatively small degree of pore-throat sorting, with the best results regarding coated grain sheets and back-shoals within the inner shelf of the restricted platform (Figure 16A, Table 1).
Since high-energy currents and waves removed most of the lime mud and left most of the grains behind in the shoal complexes, their reservoir qualities are much better than those of the muddier biostromes. The permeabilities of the shoal complexes vary dramatically from 0.1 mD to 1605 mD due to dissolutions, but their maximum porosity is only 31% (Figure 16B, Table 1).

4.3. Sedimentary Facies Modeling and Evolution

4.3.1. Characteristic Logging Responses

Based on the principal wireline logs of cored wells, it is difficult to effectively differentiate between the depositional elements [6,17,50]. The pseudo-wireline logs, created with two or more different wireline logs, are a practicable pathway to identify the depositional elements [52].
Two pseudo-wireline logs of RLLD*RHOB and GR*AC were composed to demonstrate the variations for each depositional element (Table 2). The depositional elements of the biostromes, coated grain sheets, and back-shoals within the inner shelf exhibit big differences on the cross plot of the pseudo-wireline logs (Figure 16A). The pseudo-wireline logs of shoal complexes, patch rudist reefs and back-shoal complexes are scattered on the cross plot (Figure 16B). According to the differences between these pseudo-wireline logs, each element can be identified for all uncored wells (Table 2).

4.3.2. Sedimentary Facies Modeling

The high-resolution 3D seismic cubes, wireline logs, and core data were integrated to create delicate static 3D subsurface models of the reservoir properties and depositional elements [9]. As was mentioned above, the depositional elements of the Mishrif Formation have been identified continuously in each well according to the links between the depositional elements and the pseudo-wireline log responses of the cored wells (Table 2). Based on this, a depositional element log was generated for each well. The depositional elements are discrete variables suitable for the Sequential Indicator Simulation (SIS) algorithm to establish the 3D static models [53], which were created after the depositional element logs of all the wells were analyzed to determine the ranges and nuggets of the variograms (e.g., a spherical variogram with vertical, major, and minor ranges of 7.1 m, 1022 m, and 861 m, respectively, as well as a sill of 0.8885 for the biostromes).
There are three steps to calculate the value of each cell of the 3D static models during the SIS procedure. First, it searches for nearby data and previously simulated values. Second, indicator kriging is performed to build a distribution of uncertainty. Finally, a simulated value is determined from the uncertainty distribution. With different seed numbers, multiple realizations could be generated by repeating the procedure for all the cells in the model.
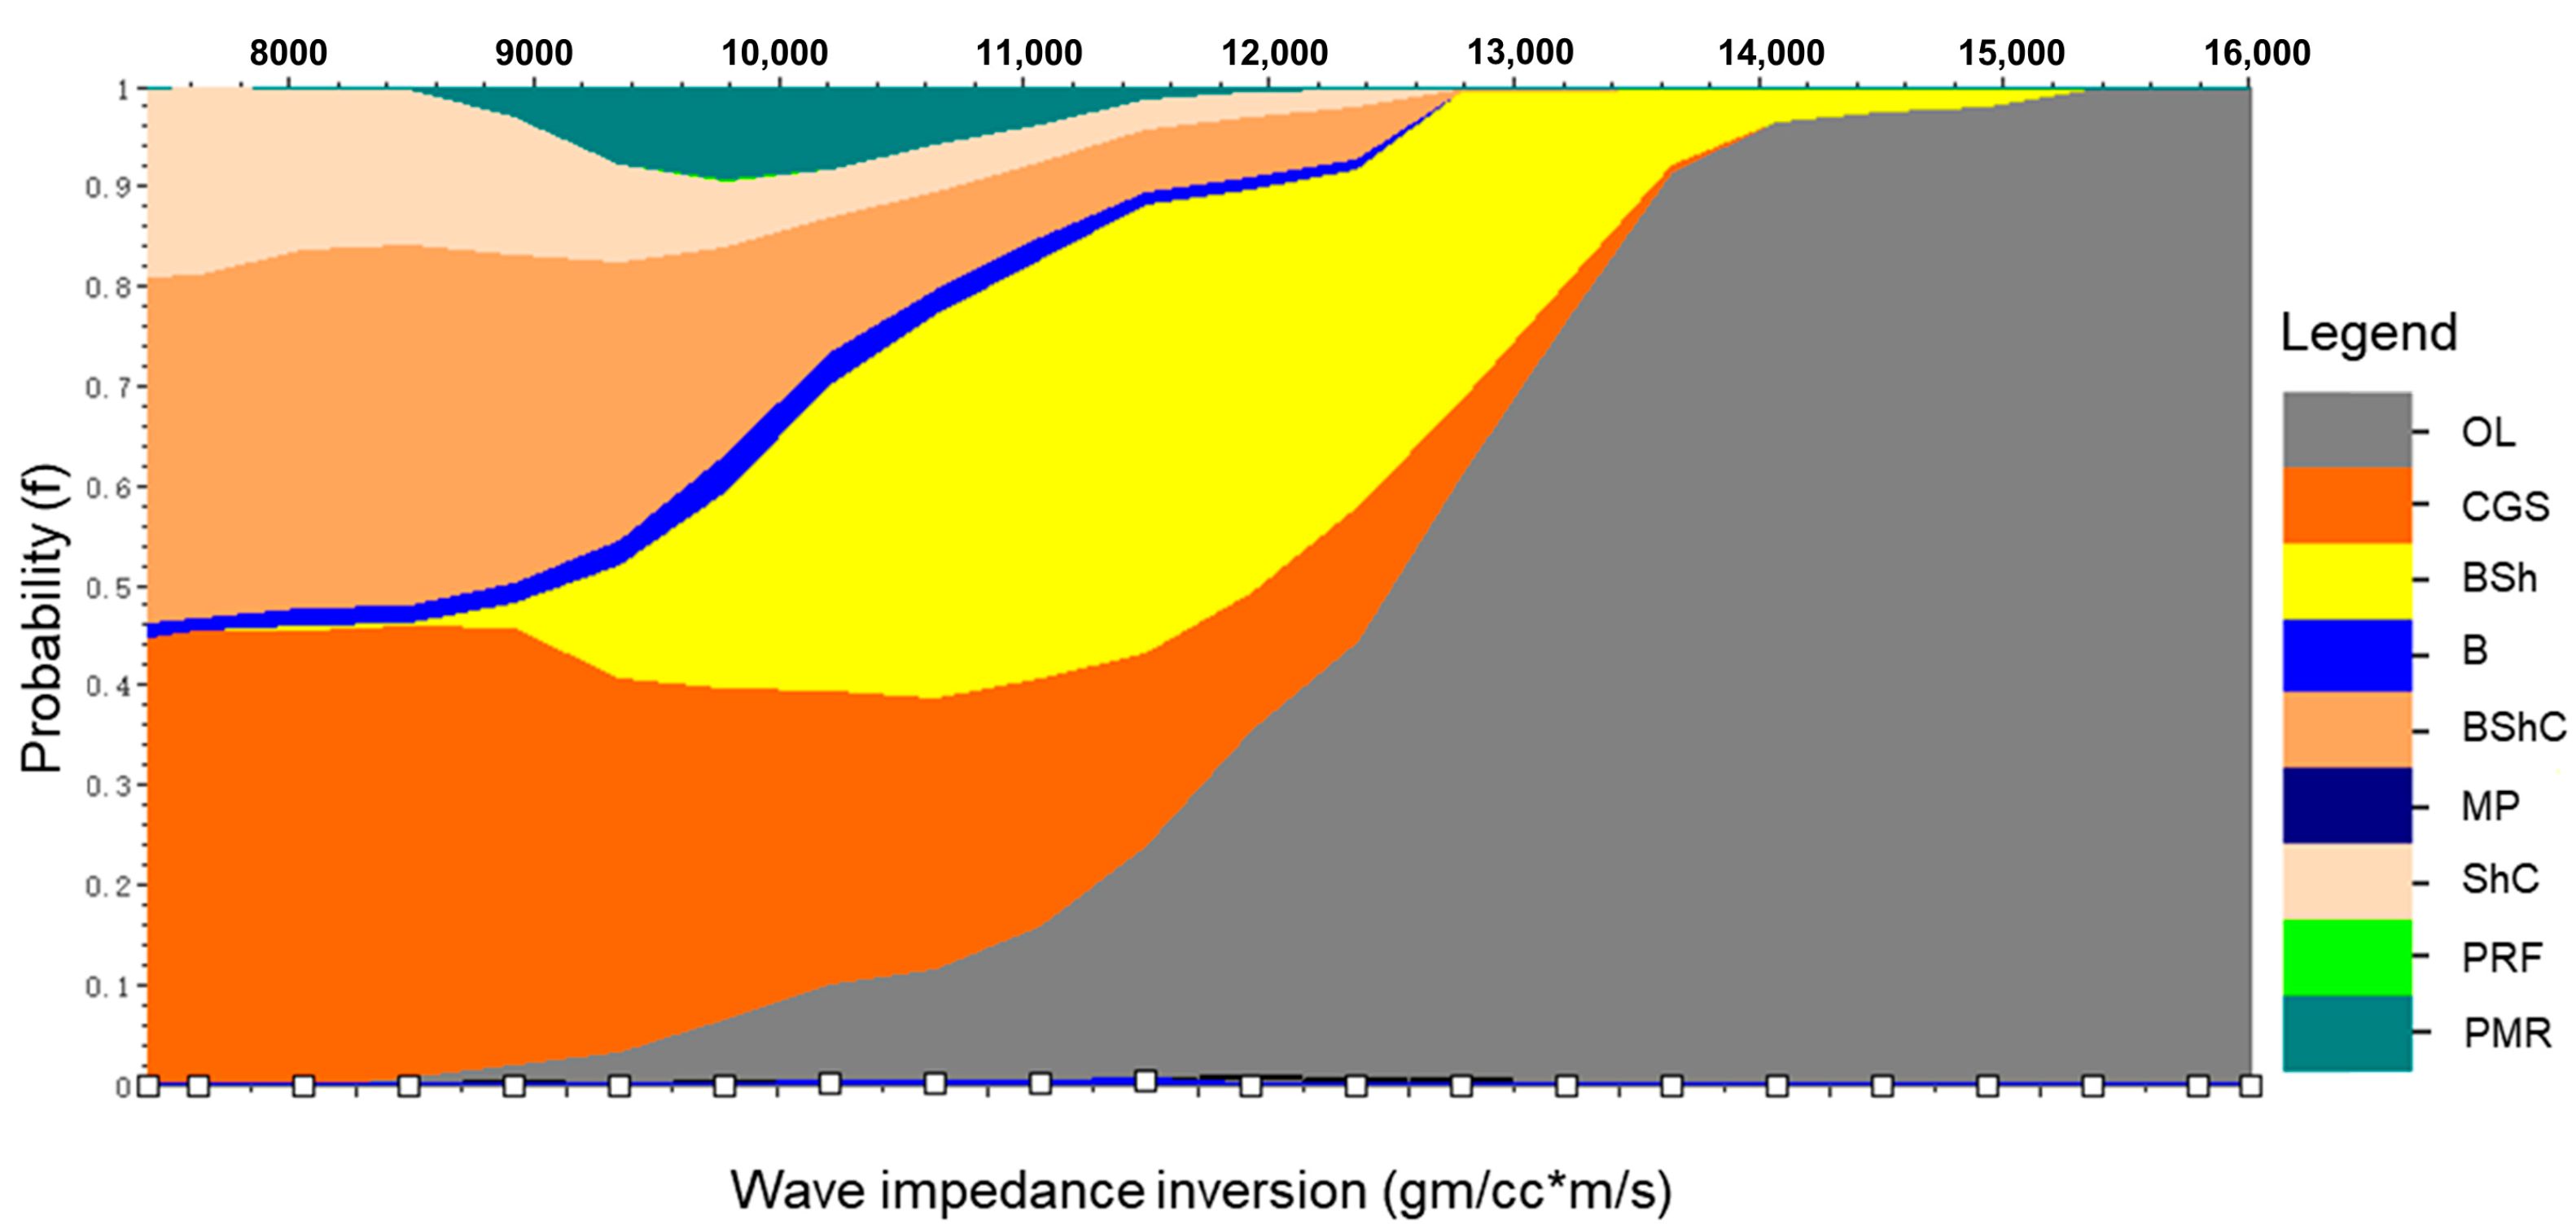
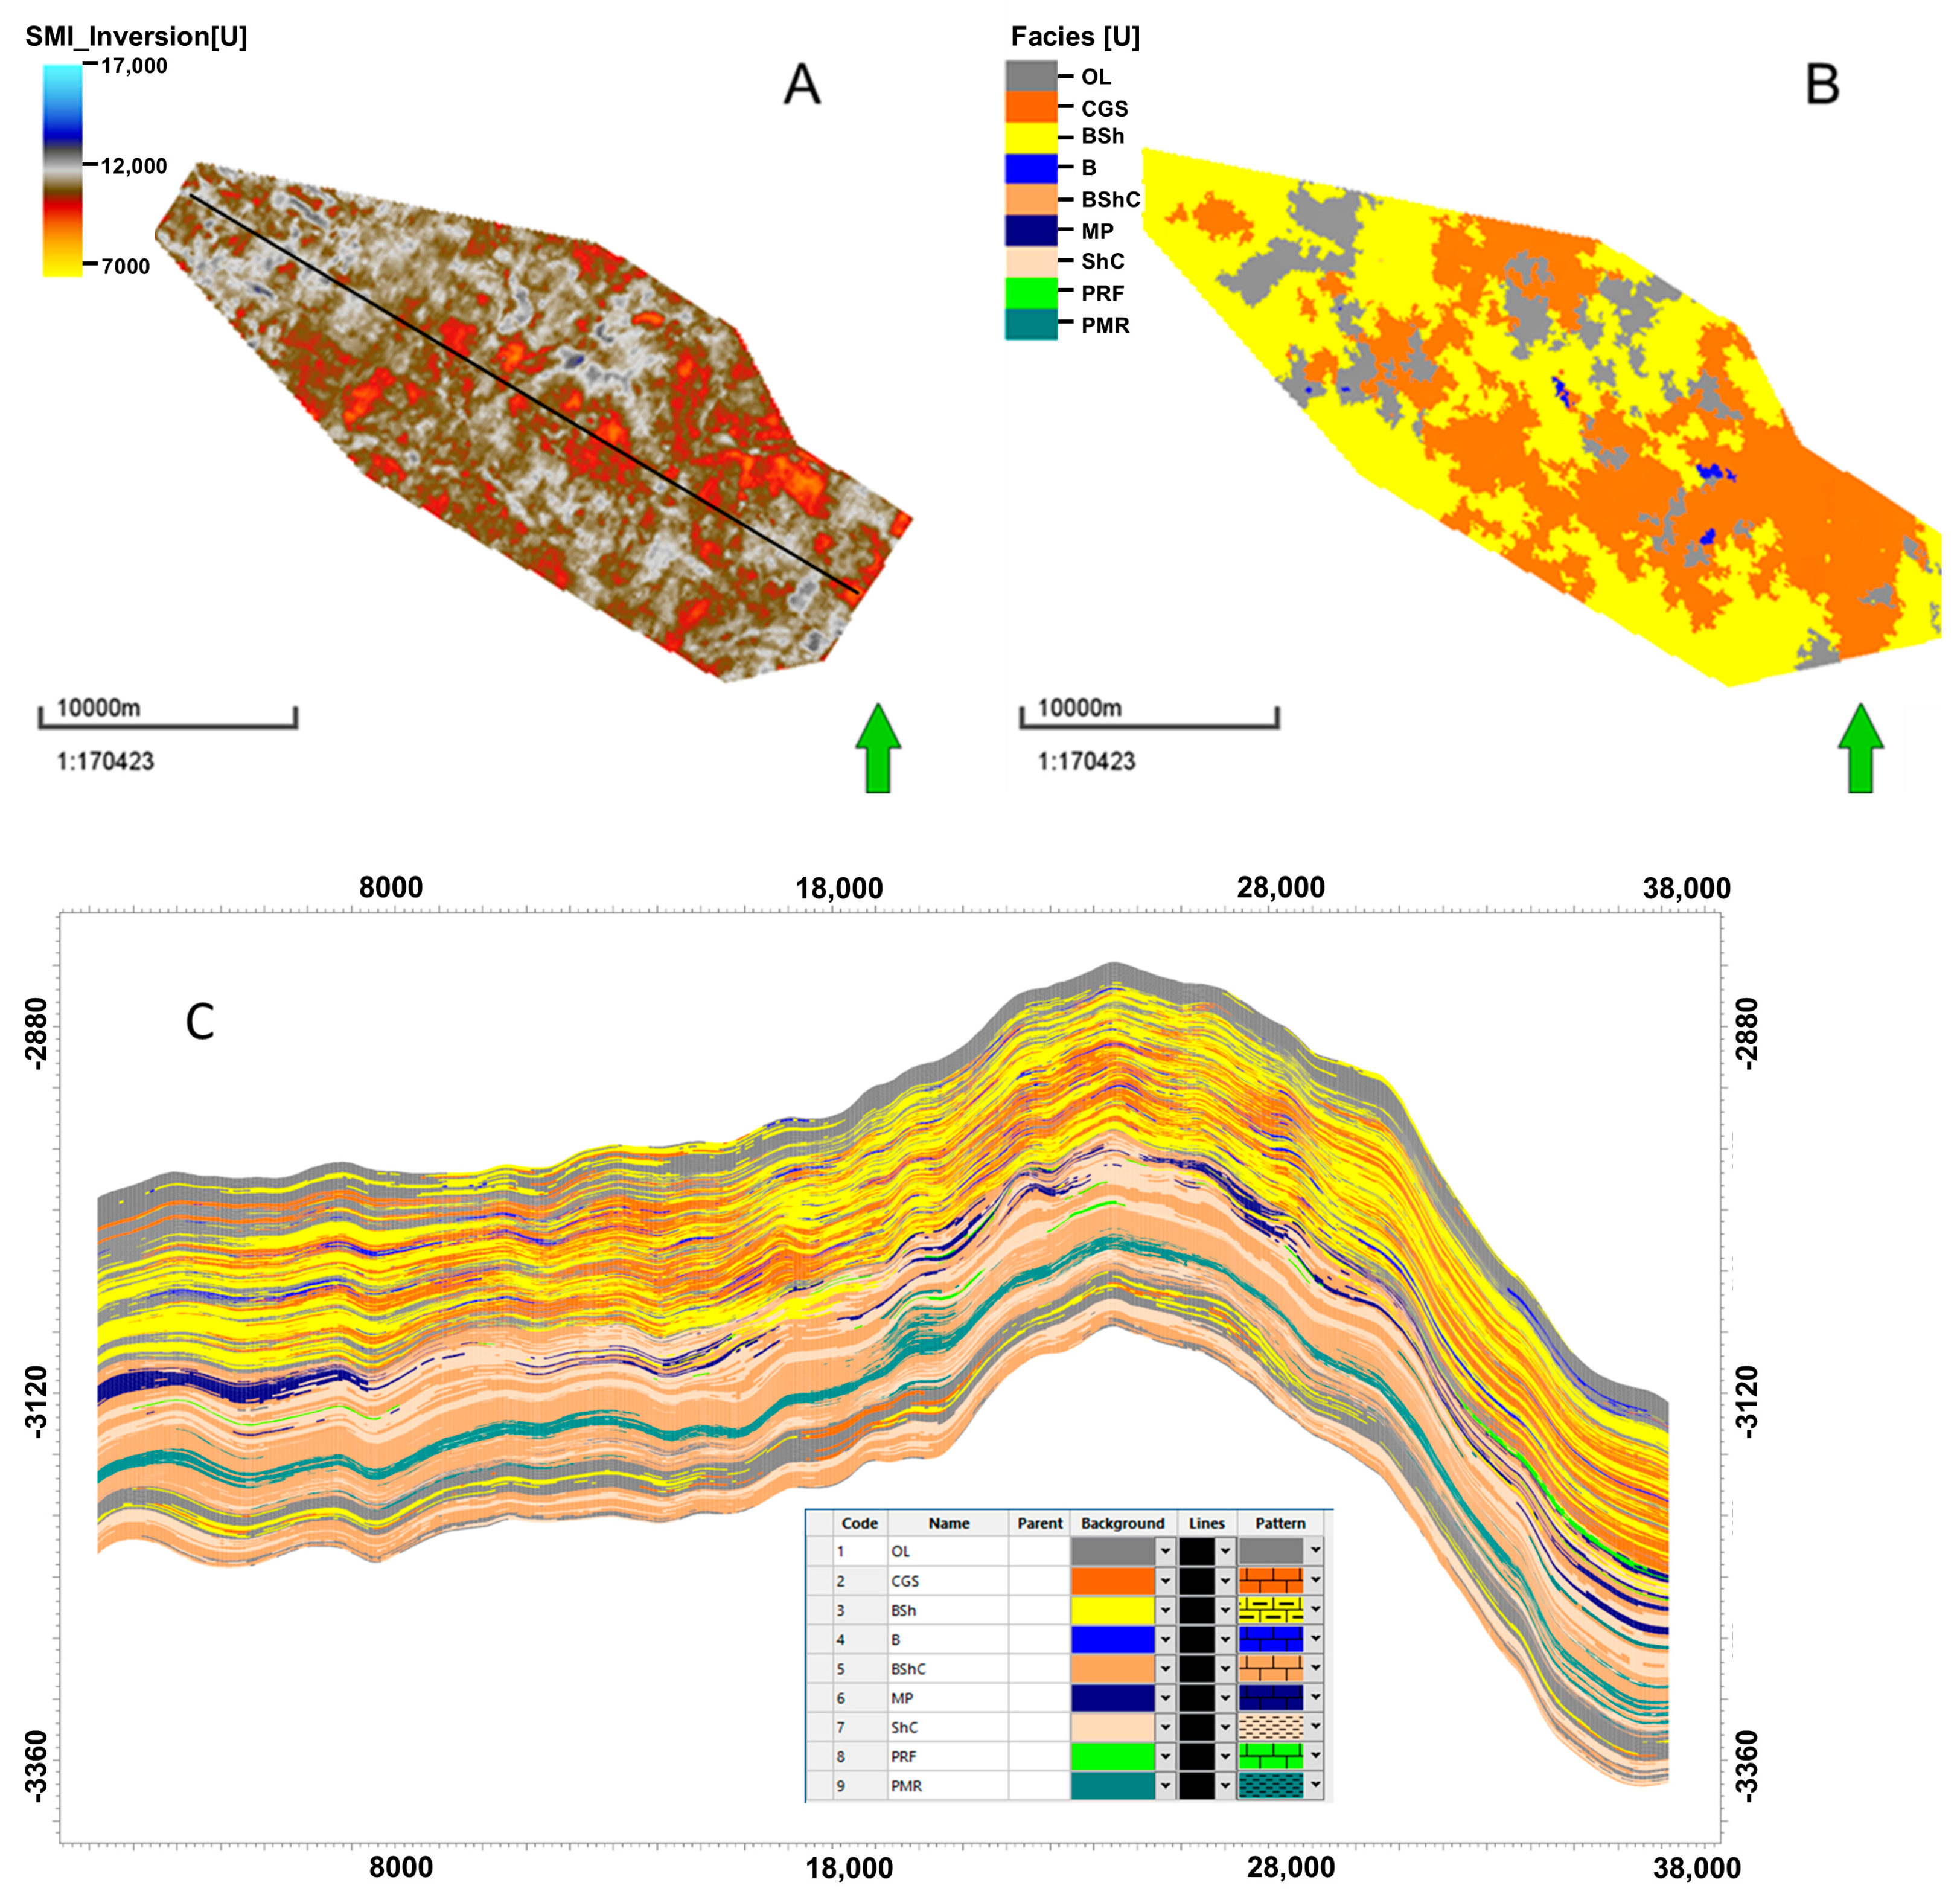
We derived the distribution of acoustic impedance for each element from well logs (Figure 17), then carved the 3D inversion cube accordingly (e.g., high impedance = reefs) (Figure 18A). Well control and calibrations are performed in the inversion process. The key link between the well-based elements and the seismic data was established by analyzing the distribution probability of the wave impedance (WI) value for each depositional element (Figure 17). The depositional element models were built after considering the well production performances, the similar depositional outcrop descriptions, the geometry of the different scopes of the acoustic impedance inversion, and the vertical stacking patterns of the sequence architecture, and they were modified using the human–computer interactive method (Figure 18B,C) [54]. It is worth noting that the manual adjustments were not arbitrary but were based on explicit geological rules, including conformance to sequence stratigraphy, alignment with established conceptual models of a rimmed carbonate platform, and integrating outcrop analogue knowledge.
The 3D reservoir porosity and permeability models were constructed under the constraints of depositional element models, and the Mishrif dynamic models were also upgraded. Regarding the production performance history matching of 156 oil producers within the dynamic model, the well count ratio of very good history matching (errors less than 5%) was 64.8% in the previous dynamic model and up to 79.6% in the updated version. According to the new 3D petrophysical property model updated with the new depositional element model, the well count ratio of the production history matching increased by 15%, and thus, the proposed model provides a better basis for oil reservoir production performance prediction.
Although we use the primary constraint from wells and employ seismic data as a lateral constraint, it is noted that the seismic vertical resolution is likely lower than the thickness of some depositional elements (e.g., avg. thickness of 2–4 m for elements like back-shoals, with seismic resolution often >10–20 m in carbonates). Additionally, the use of the Sequential Indicator Simulation (SIS) algorithm may also bring some uncertainty propagation into the results. However, the seismic constraints have been giving significant but not absolute weight. They are used as a powerful guide for inter-well geometry but are continually calibrated and corrected by the higher-resolution well data and expert geological interpretation.
It is also noted that, to fully realize the practical relevance of this classification, the pore system modalities are integrated into the dynamic reservoir model in terms of upscaling for simulation and history matching validation. First, the MICP-derived flow units (unimodal, bimodal, multimodal) are used to guide the population of relative permeability curves and capillary pressure curves within the existing 3D geological model. Second, the updated dynamic model, incorporating these nuanced flow properties based on pore system modality, are employed to simulate historical production and injection data.

4.3.3. Sedimentary Facies Evolution

Not only do the static 3D depositional element models quantitatively characterize the extension, scale, and volume of each depositional element, they also reveal the influence of the base-level cycles on the categories and their associated relationships within the depositional elements.
Sub-member B1-2, subdivided into zones MB1-2C, MB1-2B, and MB1-2A from the base upward, was deposited during the transgressive hemicycle of the third-order sequence (Figure 2). The main depositional elements of zone MB1-2C are coated grain sheets (CGSs) and back-shoals (BShs), which were deposited in relatively shallow water in an inner shelf setting. The depositional elements of zone MB1-2A are dominated by open lagoons (OLs) with subordinate back-shoals (BShs), which indicates that this zone was deposited in relatively deep water in an inner shelf setting (Figure 19A).
Member B2, subdivided into zones MB2-3, MB2-2, and MB2-1 from the base upward, was deposited during the regressive hemicycle of the fourth-order sequence (Figure 2). The principal depositional elements developed within the base of zone MB2-3 consist of shoal complexes (ShCs) and back-shoal complexes (BShCs), which indicates a platform margin setting in the shallow water around the fair-weather wave base (FWWB). However, the dominant depositional elements within the top of zone MB2-1 are peritidal marshes (PMs) and back-shoal complexes (BShCs), which were deposited near or above the sea level (Figure 19B).
Furthermore, quantifying pore volume evolution is a crucial next step for future works. Integrating the proposed quantitative methods would significantly strengthen the model by moving from a descriptive account of dissolution to a predictive, quantitative version. This would allow for a more accurate assessment of how specific sequence stratigraphic surfaces control the spatial distribution of the reservoir’s best flow units.

5. Conclusions

In this study, a total of 597.42 m of cores, 588 thin sections, 769 RCALs, 68 XRDs, 920 MICPs, wireline logs from seven cored wells, and 3D seismic cubic data of 496 km2 have been investigated to describe the sequence stratigraphy, sedimentary facies, and reservoir petrophysical properties. The conclusions we have drawn are as follows.
The major diagenetic processes comprise six types, including cementation, dissolution, neomorphism, compaction, pressure solution, and dolomitization. This reflects that the pore system of the Mishrif Formation is mainly characterized by a unimodality (34.4–42%) in the mercury injection tests, whether in the inner shelf or platform margin. The reservoir properties of the six sedimentary facies vary greatly, with porosities of 4.6% to 35.4% and permeabilities of 0.01~1605.5 mD.
The Mishrif Formation, divided into four members (MC, MB2, MB1, and MA) and 18 zones from its base upward, was deposited during a base-level fall semi-cycle in the second-order sequence stratigraphy. A total of 14 lithofacies were identified within the Mishrif Formation based on their depositional textures, fossil assemblages, skeletal grain sizes, and mineral contents.
The pseudo-wireline logs of RLLD*RHOB and GR*AC were used to effectively recognize the depositional elements in the uncored wells. The 3D static models of the sedimentary facies were established using the depositional element logs of all the penetrated wells and the seismic inversion cubes to characterize the spatial extension. This practical application demonstrates that depositional element models enhance the reservoir property precision to obtain a better history matching performance. This study’s strength lies in its detailed workflow for addressing a common challenge: predicting heterogeneity in uncored areas. While the specific log transforms are unique to the Mishrif Formation, the methodology provides a valuable template for other reservoirs.

Author Contributions

Conceptualization, S.L.; methodology, S.L. and R.H.; formal analysis, S.L. and G.H.; investigation, S.L., H.H. and R.H.; data curation, Z.P. and G.H.; writing—original draft preparation, S.L.; writing—review and editing, G.H.; supervision, G.H. and R.H. All authors have read and agreed to the published version of the manuscript.

Funding

This research was funded by the National Science and Technology Major Project (2025ZD1402602).

Data Availability Statement

The data presented in this study are available on request from the corresponding author. (The data are not publicly available due to the privacy.)

Acknowledgments

We thank the three anonymous reviewers and the editor for their instructive comments that considerably improved the manuscript’s quality.

Conflicts of Interest

Authors Shunming Li, Rubing Han, and Hui He were employed by the Research Institute of Petroleum Exploration and Development. The remaining authors declare that the research was conducted in the absence of any commercial or financial relationships that could be construed as a potential conflicts of interest.

Appendix A

Table A1. Lithofacies of the Mishrif Formation in the HY oilfield.
LithofaciesCodesØ (He) (%)K air (mD)Grain Density
(gm/cc)
Descriptions
Mudstones:
Foraminiferal mudstoneLMf///Moderate foraminiferal and bioclast fragments set within a micritic matrix; common bioclasts with non-ferroan calcite, predominantly comprised of the foraminiferal allochems of Miliolids and sponge spicules; minor possible ostracods, benthic forams, and echinoderms.
MudstoneM///Interbedded dark grey or black shale without bioclastic material.
Bioturbated mudstoneLMb10.50.62.723Locally abundant burrows with less than 10% bioclastic fragments within a micritic matrix.
Wackestones:
Bioclastic peloidal wackestoneLWbp12.96.82.703Matrix supported and locally micritic pelletal material; bioclasts predominantly comprised of echinoderm plates and spines, benthic foraminifera (Orbitoids, Alveolinids, Miliolids, Textularids, Nautiloculina, Alveolinids, Discocyclina, Marginopora, biserial and uniserial forams), and indeterminate algal fragments; sponge spicules in longitudinal sections, chambered sponge tests, molluscan fragments (including bivalves and gastropod), and minor amounts of planktonic forams (Globigerinids, stromatoporoids, and indeterminate debris).
Bioclastic wackestoneLWb13.72.32.703Various types of bioclasts set in a micritic matrix; abundant bioclasts of planktonic and benthic forams (e.g., Miliolids, Alveolinids, Peneroplids, and uniserial types), and molluscan fragments (rudist bivalves), echinoderm plates, corals, and red algal fragments; moderately large fragments of rudist bivalves and bryozoans, sponge spicules, echinoderm plates, and fine grade forams; minor to moderate ostracods, brachiopod spines, and solitary coral.
Dolomitic bioclastic wackestoneLWdb14.56.02.725Matrix supported with patches of replacive dolomite; abundant bioclasts of rudist bivalve fragments and benthic forams (commonly Miliolids), moderate amounts of echinoderm, red algal, and bryozoan material; common dolomite rhombs with minor echinoderm plates, dasyclad green algal fragments, molluscan bioclast fragments of bivalves, and gastropods.
Dolomitic wackestoneDW9.40.62.729Wackestones showing pervasive dolomite cementation, with minor scattered bioclasts consisting of rudistid bivalve fragments, benthic forams (e.g., Miliolids), echinoderms, and molluscan fragments; a very finely crystalline mosaic of non-ferroan dolomite.
Packstones:
Bioclastic peloidal packstoneLPbp17.825.52.704Grains supported by rounded to angular allochems and peloids; common bioclasts, including molluscan fragments (e.g., rudists, bivalves and gastropods), algal material, forams (e.g., Orbitoids, Peneroplids, Lituolinids, Miliolids, Lenticulinids, Nautiloculina, and Cuneolina), echinoderm plates, spines, and coralline fragments; moderate quantities of bryozoans and planktonic forams like Globigerinids.
Bioclastic packstoneLPb24.720.12.695Abundant bioclasts dominated by benthic forams (Miliolids, Textularids, Nautiloculina, Cuneolinids, Orbitolinids, Lituolinids, Peneroplids, Valvulinids, Alveolinids, Nautiloculina, and Discocyclina), large rudist bivalve fragments, red algal fragments, echinoderm plates, and abraded molluscan debris; moderate to common algal fragments, sponge spicules, planktonic forams, and ostracods; minor to moderate molluscan debris consisting of brachiopod spines, gastropod, bivalve, echinoderm plates, lituolinid foraminifera (shallow water), planispiral forams, and bryozoans.
Dolomitic bioclastic packstoneLPdb21.42.22.740Bioclasts, including benthic forams and planktonic forams such as Globigerinids; moderate molluscan (locally bored or moldic), algal, and bryozoan fragments, brachiopod spines, and minor echinoderm plates; cementation is dominated by abundant non-ferroan rhombic dolomites concentrated in irregular patches
Grainstones:
Bioclastic peloidal grainstoneLGbp20.542.52.714Grain-supported texture with widespread peloidal material; moderate bioclasts consisting of molluscan (including rudistid bivalves), bryozoan fragments, and echinoderm fragments, benthic forams (Fussulinids, Textularids, Miliolids, Alveolinids, and Lepidorbitoides), and algal fragments; subordinate bioclastic fragments (likely foram debris) and widespread peloidal material; minor stromatoporoids; occasional micritized grains that sometimes resemble peloids.
Bioclastic grainstoneLGb21.9189.42.704Grains supported by abundant bioclasts dominated by molluscan (e.g., rudistid bivalve fragments), benthic forams (e.g., Fussulinids, Textularids, and Miliolids), moderate echinoderms and local algal fragments; minor to moderately abundant stromatoporoids, calcareous sponges, bryozoans, algal, and echinoderm plates
Floatstones:
Rudistid floatstoneLFr23.8216.42.704Gravel fragments primarily consisting of rudist bivalves set in a micritic matrix; bioclasts, including molluscan fragments of rudist bivalves and indeterminate uniserial bioclasts with large open test chambers up to 2 × 2 mm; minor to moderate micritic allochems that appear to be bioclastic in origin, including benthic forams (e.g., Textularids, Miliolids, and Lituolinids), algal material, echinoderms plates, and granule to pebble grade coralline fragments.
Rudstones:
Rudistid rudstoneLRr18.835.22.709Gravel bioclasts primarily consisting of rudist bivalve fragments composed of non-ferroan calcite; common benthic forams and microfossils that are typically leached and cemented by micrites in test chambers.

References

  1. Lazim, A.A.; Ismail, M.J.; Mahdi, M.M. High Resolution Sequence Stratigraphy of the Mishrif Formation (Cenomanian-Early Turonian) at Zubair Oilfield (al-Rafdhiah Dome), Southern Iraq. Pet. Res. 2024, 9, 61–71. [Google Scholar] [CrossRef]
  2. Huan, W.; Lirong, D.; Xingyang, Z.; Jiquan, Y.; Beiwei, L.; Haigang, D.; Peiguang, Y.; Yifan, S. Quantitative Microfacies Analyses of a Carbonate Ramp in the Upper Cretaceous Mishrif Formation, A Oilfield in Iraq, and Paleogeography Reconstruction of the North-Eastern Arabian Plate. J. Asian Earth Sci. 2024, 259, 105896. [Google Scholar] [CrossRef]
  3. Zhang, L.; Zhang, W.; Li, Y.; Song, B.; Liu, D.; Deng, Y.; Xu, J.; Wang, Y. Sequence Stratigraphy, Sedimentology, and Reservoir Characteristics of the Middle Cretaceous Mishrif Formation, South Iraq. J. Mar. Sci. Eng. 2023, 11, 1255. [Google Scholar] [CrossRef]
  4. Wang, H.; Shi, K.; Ma, Y.; Liu, B.; Song, X.; Ge, Y.; Liu, H.; Hoffmann, R.; Immenhauser, A. Control of Depositional and Diagenetic Processes on the Reservoir Properties of the Mishrif Formation in the AD Oilfield, Central Mesopotamian Basin, Iraq. Mar. Pet. Geol. 2021, 132, 105202. [Google Scholar] [CrossRef]
  5. Alboshamel, R.B.A.A.; Handhal, A.M. Integrating Well Logs and Microfacies Analysis for Reservoir Facies Characterization of the Mishrif Formation, Southern Iraq. Carbonates Evaporites 2025, 40, 23. [Google Scholar] [CrossRef]
  6. Liu, W.; Borjigin, T.; Wang, X.; Li, M.; Hu, G.; Wang, J.; Lu, L.; Zhao, H.; Chen, Q.; Luo, H. New Knowledge of Hydrocarbon Generating Theory of Organic Matter in Chinese Marine Carbonates. Pet. Explor. Dev. 2017, 44, 159–169. [Google Scholar] [CrossRef]
  7. Mehrabi, H.; Yahyaei, E.; Navidtalab, A.; Rahimpour-Bonab, H.; Abbasi, R.; Omidvar, M.; Assadi, A.; Honarmand, J. Depositional and Diagenetic Controls on Reservoir Properties Along the Shallow-Marine Carbonates of the Sarvak Formation, Zagros Basin: Petrographic, Petrophysical, and Geochemical Evidence. Sediment. Geol. 2023, 454, 106457. [Google Scholar] [CrossRef]
  8. Liu, H.; Tian, Z.; Liu, B.; Guo, R.; Yang, D.; Deng, Y.; Yu, Y.; Shi, K. Pore Types, Origins and Control on Reservoir Heterogeneity of Carbonate Rocks in Middle Cretaceous Mishrif Formation of the West Qurna Oilfield, Iraq. J. Pet. Sci. Eng. 2018, 171, 1338–1349. [Google Scholar] [CrossRef]
  9. Ismail, M.J.; Ettensohn, F.R.; Handhal, A.M.; Al-Abadi, A. Facies Analysis of the Middle Cretaceous Mishrif Formation in Southern Iraq Borehole Image Logs and Core Thin-Sections as a Tool. Mar. Pet. Geol. 2021, 133, 105324. [Google Scholar] [CrossRef]
  10. Qiao, Z.-F.; Zhu, G.-Y.; Li, S.-L.; Shao, G.-M.; Kang, W.-J.; Sun, X.-W.; Yao, Q.-Y.; Zhang, Y. Architectural Characterization of Carbonate Tidal Channels in the Mishrif Formation, Southeastern Iraq. Pet. Sci. 2024, 21, 3790–3803. [Google Scholar] [CrossRef]
  11. He, Q.; Shi, K.; Ma, Y.; Liu, B.; Han, J.; Li, J.; Bai, X.; Wu, C.; McArthur, A.D.; Mountney, N.P. Evolution of Rimmed Carbonate Platform Architecture Controlled by Sea-Level Change: Insights from the Lower-Middle Cambrian of the Northern Tarim Basin, China. Mar. Pet. Geol. 2025, 171, 107215. [Google Scholar] [CrossRef]
  12. Wang, H.; Dou, L.; Zhang, X.; Yin, J.; Luo, B.; Shen, A.; Ji, Y.; Song, Y. Geochemistry Characterization of Diagenesis from Mishrif Reservoir Rocks in the Central Mesopotamian Basin, Iraq: Implication for the Differential Diagenesis and Petroleum Significance. Sediment. Geol. 2024, 470, 106710. [Google Scholar] [CrossRef]
  13. Zhong, Y.; Zhou, L.; Tan, X.; Guo, R.; Zhao, L.; Li, F.; Jin, Z.; Chen, Y. Characteristics of Depositional Environment and Evolution of Upper Cretaceous Mishrif Formation, Halfaya Oil Field, Iraq Based on Sedimentary Microfacies Analysis. J. Afr. Earth Sci. 2018, 140, 151–168. [Google Scholar] [CrossRef]
  14. Yu, P. Hydraulic Unit Classification of Un-Cored Intervals/Wells and Its Influence on the Productivity Performance. J. Pet. Sci. Eng. 2021, 197, 107980. [Google Scholar] [CrossRef]
  15. Hassanpouryouzband, A.; Armitage, T.; Cowen, T.; Thaysen, E.M.; McMahon, S.; Hajibeygi, H.; Stevenson, D.S.; Stahl, M.; Haszeldine, R.S. The Search for Natural Hydrogen: A Hidden Energy Giant or an Elusive Dream? ACS Energy Lett. 2025, 10, 3887–3891. [Google Scholar] [CrossRef]
  16. Hassanpouryouzband, A.; Veshareh, M.J.; Wilkinson, M.; Nick, H.M.; Ngwenya, B.T.; Haszeldine, R.S. In Situ Hydrogen Generation from Underground Fossil Hydrocarbons. Joule 2025, 9, 101809. [Google Scholar] [CrossRef]
  17. Sadooni, F.N. The Nature and Origin of Upper Cretaceous Basin-Margin Rudist Buildups of the Mesopotamian Basin, Southern Iraq, with Consideration of Possible Hydrocarbon Stratigraphic Entrapment. Cretac. Res. 2005, 26, 213–224. [Google Scholar] [CrossRef]
  18. Liu, H.; Shi, K.; Liu, B.; Song, X.; Guo, R.; Wang, G.; Wang, H. Microfacies and Reservoir Quality of the Middle Cretaceous Rumaila Formation in the AD Oilfield, Central Mesopotamian Basin, Southern Iraq. J. Asian Earth Sci. 2021, 213, 104726. [Google Scholar] [CrossRef]
  19. Al-Dujaili, A.N. Reservoir Rock Typing and Storage Capacity of Mishrif Carbonate Formation in West Qurna/1 Oil Field, Iraq. Carbonates Evaporites 2023, 38, 83. [Google Scholar] [CrossRef]
  20. Deville De Periere, M.; Durlet, C.; Vennin, E.; Caline, B.; Boichard, R.; Meyer, A. Influence of a Major Exposure Surface on the Development of Microporous Micritic Limestones—Example of the Upper Mishrif Formation (Cenomanian) of the Middle East. Sediment. Geol. 2017, 353, 96–113. [Google Scholar] [CrossRef]
  21. Taghavi, A.A.; Mørk, A.; Emadi, M.A. Sequence Stratigraphically Controlled Diagenesis Governs Reservoir Quality in the Carbonate Dehluran Field, Southwest Iran. Pet. Geosci. 2006, 12, 115–126. [Google Scholar] [CrossRef]
  22. Haq, B.U.; Al-Qahtani, A.M. Phanerozoic Cycles of Sea-Level Change on the Arabian Platform. GeoArabia 2005, 10, 127–160. [Google Scholar] [CrossRef]
  23. Navidtalab, A.; Heimhofer, U.; Huck, S.; Omidvar, M.; Rahimpour-Bonab, H.; Aharipour, R.; Shakeri, A. Biochemostratigraphy of an Upper Albian–Turonian Succession from the Southeastern Neo-Tethys Margin, SW Iran. Palaeogeogr. Palaeoclimatol. Palaeoecol. 2019, 533, 109255. [Google Scholar] [CrossRef]
  24. Al-Ameri, T.K.; Al-Marsoumi, S.W.; Al-Musawi, F.A. Crude Oil Characterization, Molecular Affinity, and Migration Pathways of Halfaya Oil Field in Mesan Governorate, South Iraq. Arab. J. Geosci. 2015, 8, 7041–7058. [Google Scholar] [CrossRef]
  25. Aqrawi, A.A.M.; Badics, B. Geochemical Characterisation, Volumetric Assessment and Shale-Oil/Gas Potential of the Middle Jurassic–Lower Cretaceous Source Rocks of NE Arabian Plate. GeoArabia 2015, 20, 99–140. [Google Scholar] [CrossRef]
  26. English, J.M.; Lunn, G.A.; Ferreira, L.; Yacu, G. Geologic Evolution of the Iraqi Zagros, and Its Influence on the Distribution of Hydrocarbons in the Kurdistan Region. AAPG Bull. 2015, 99, 231–272. [Google Scholar] [CrossRef]
  27. Yu, Y.; Sun, L.; Song, X.; Guo, R.; Gao, X.; Lin, M.; Yi, L.; Han, H.; Li, F.; Liu, H. Sedimentary Diagenesis of Rudist Shoal and Its Control on Reservoirs: A Case Study of Cretaceous Mishrif Formation, H Oilfield, Iraq. Pet. Explor. Dev. 2018, 45, 1075–1087. [Google Scholar] [CrossRef]
  28. Grötsch, J.; Suwaina, O.; Ajlani, G.; Taher, A.; El-Khassawneh, R.; Lokier, S.; Coy, G.; Weerd, E.V.D.; Weerd, D.; Masalmeh, S.; et al. The Arab Formation in Central Abu Dhabi: 3-D Reservoir Architecture and Static and Dynamic Modeling. GeoArabia 2003, 8, 47–86. [Google Scholar] [CrossRef]
  29. Al-Qayim, B. Stratigraphic Differentiation of the Zagros Foreland Basin Sequence, Kurdistan Region, (Northern Iraq): Impacts on Oil Accumulations. In Paleobiodiversity and Tectono-Sedimentary Records in the Mediterranean Tethys and Related Eastern Areas; Boughdiri, M., Bádenas, B., Selden, P., Jaillard, E., Bengtson, P., Granier, B.R.C., Eds.; Advances in Science, Technology & Innovation; Springer International Publishing: Cham, Switzerland, 2019; pp. 267–269. [Google Scholar] [CrossRef]
  30. Boix, C.; Vicens, E.; Riera, V.; Oms, O. Rudist Reef Structure: Insights from Orientation of Hippuritids at l’Espà (Campanian, Southern Pyrenees). Cretac. Res. 2023, 147, 105507. [Google Scholar] [CrossRef]
  31. Scholle, P.A.; Bebout, D.G.; Moore, C.H. Carbonate Depositional Environments; American Association of Petroleum Geologists: Tulsa, OK, USA, 1983. [Google Scholar] [CrossRef]
  32. Moore, C.H.; Wade, W.J. Summary of Early Diagenesis and Porosity Modification of Carbonate Reservoirs in a Sequence Stratigraphic and Climatic Framework. In Developments in Sedimentology; Elsevier: Amsterdam, The Netherlands, 2013; Volume 67, pp. 207–238. [Google Scholar] [CrossRef]
  33. Hui, G.; Chen, S.; Gu, F. Strike–Slip Fault Reactivation Triggered by Hydraulic-Natural Fracture Propagation during Fracturing Stimulations near Clark Lake, Alberta. Energy Fuels 2024, 38, 18547–18555. [Google Scholar] [CrossRef]
  34. Al Habsi, N.; Al Shukaili, M.; Al Tooqi, S.; Ehrenberg, S.N.; Bernecker, M. Lithofacies, Diagenesis and Reservoir Quality of Upper Shu’aiba Reservoirs in Northwestern Oman. GeoArabia 2014, 19, 145–182. [Google Scholar] [CrossRef]
  35. Flügel, E. Microfacies of Carbonate Rocks: Analysis, Interpretation and Application; Springer: Berlin/Heidelberg, Germany, 2010. [Google Scholar] [CrossRef]
  36. Deville De Periere, M.; Durlet, C.; Vennin, E.; Lambert, L.; Bourillot, R.; Caline, B.; Poli, E. Morphometry of Micrite Particles in Cretaceous Microporous Limestones of the Middle East: Influence on Reservoir Properties. Mar. Pet. Geol. 2011, 28, 1727–1750. [Google Scholar] [CrossRef]
  37. Hollis, C.; Vahrenkamp, V.; Tull, S.; Mookerjee, A.; Taberner, C.; Huang, Y. Pore System Characterisation in Heterogeneous Carbonates: An Alternative Approach to Widely-Used Rock-Typing Methodologies. Mar. Pet. Geol. 2010, 27, 772–793. [Google Scholar] [CrossRef]
  38. Brigaud, B.; Vincent, B.; Durlet, C.; Deconinck, J.-F.; Blanc, P.; Trouiller, A. Acoustic Properties of Ancient Shallow-Marine Carbonates: Effects of Depositional Environments and Diagenetic Processes (Middle Jurassic, Paris Basin, France). J. Sediment. Res. 2010, 80, 791–807. [Google Scholar] [CrossRef]
  39. Hui, G.; Chen, Z.; Schultz, R.; Chen, S.; Song, Z.; Zhang, Z.; Song, Y.; Wang, H.; Wang, M.; Gu, F. Intricate Unconventional Fracture Networks Provide Fluid Diffusion Pathways to Reactivate Pre-Existing Faults in Unconventional Reservoirs. Energy 2023, 282, 128803. [Google Scholar] [CrossRef]
  40. Kaczmarek, S.E.; Fullmer, S.M.; Hasiuk, F.J. A Universal Classification Scheme For the Microcrystals That Host Limestone Microporosity. J. Sediment. Res. 2015, 85, 1197–1212. [Google Scholar] [CrossRef]
  41. Scholle, P.A.; Ulmer-Scholle, D.S. A Color Guide to the Petrography of Carbonate Rocks: Grains, Textures, Porosity, Diagenesis; American Association of Petroleum Geologists: Tulsa, OK, USA, 2003; ISBN 978-0-89181-358-3. [Google Scholar] [CrossRef]
  42. Cox, P.A.; Wood, R.A.; Dickson, J.A.D.; Al Rougha, H.B.; Shebl, H.; Corbett, P.W.M. Dynamics of Cementation in Response to Oil Charge: Evidence from a Cretaceous Carbonate Field, U.A.E. Sediment. Geol. 2010, 228, 246–254. [Google Scholar] [CrossRef]
  43. Heasley, E.C.; Worden, R.H.; Hendry, J.P. Cement Distribution in a Carbonate Reservoir: Recognition of a Palaeo Oil–Water Contact and Its Relationship to Reservoir Quality in the Humbly Grove Field, Onshore, UK. Mar. Pet. Geol. 2000, 17, 639–654. [Google Scholar] [CrossRef]
  44. Swart, P.K.; Cantrell, D.L.; Westphal, H.; Handford, C.R.; Kendall, C.G. Origin of Dolomite in the Arab-D Reservoir from the Ghawar Field, Saudi Arabia: Evidence from Petrographic and Geochemical Constraints. J. Sediment. Res. 2005, 75, 476–491. [Google Scholar] [CrossRef]
  45. Azmy, K.; Knight, I.; Lavoie, D.; Chi, G. Origin of Dolomites in the Boat Harbour Formation, St. George Group, in Western Newfoundland, Canada: Implications for Porosity Development. Bull. Can. Pet. Geol. 2009, 57, 81–104. [Google Scholar] [CrossRef]
  46. Aqrawi, A.A.M.; Keramati, M.; Ehrenberg, S.N.; Pickard, N.; Moallemi, A.; Svånå, T.; Darke, G.; Dickson, J.A.D.; Oxtoby, N.H. The origin of dolomite in the Asmari formation (Oligocene-lower Miocene), Dezful embayment, SW Iran. J. Pet. Geol. 2006, 29, 381–402. [Google Scholar] [CrossRef]
  47. Hui, G.; Chen, Z.; Wang, Y.; Zhang, D.; Gu, F. An Integrated Machine Learning-Based Approach to Identifying Controlling Factors of Unconventional Shale Productivity. Energy 2023, 266, 126512. [Google Scholar] [CrossRef]
  48. Hui, G.; Chen, S.; He, Y.; Wang, H.; Gu, F. Machine Learning-Based Production Forecast for Shale Gas in Unconventional Reservoirs via Integration of Geological and Operational Factors. J. Nat. Gas Sci. Eng. 2021, 94, 104045. [Google Scholar] [CrossRef]
  49. Pranter, M.J.; Hurley, N.F.; Davis, T.L. Sequence-Stratigraphic, Petrophysical, and Multicomponent Seismic Analysis of a Shelf-Margin Reservoir: San Andres Formation (Permian), Vacuum Field, New Mexico, United States. In Seismic Imaging of Carbonate Reservoirs and Systems; Eberli, G.P., Masaferro, J.L., Sarg, J.F., Eds.; American Association of Petroleum Geologists: Tulsa, OK, USA; Shell International Exploration & Production B.V.: Hague, The Netherlands, 2004; pp. 59–89. [Google Scholar] [CrossRef]
  50. Dandekar, A.Y. Petroleum Reservoir Rock and Fluid Properties, 2nd ed.; CRC Press: Boca Raton, FL, USA, 2013. [Google Scholar] [CrossRef]
  51. Smith, L.B.; Eberli, G.P.; Masaferro, J.L.; Al-Dhahab, S. Discrimination of Effective from Ineffective Porosity in Heterogeneous Cretaceous Carbonates, Al Ghubar Field, Oman. AAPG Bull. 2003, 87, 1509–1529. [Google Scholar] [CrossRef]
  52. Quadir, A.; Lewis, C.; Rau, R.-J. The Spontaneous Ray Log: A New Aid for Constructing Pseudo-Synthetic Seismograms. Pure Appl. Geophys. 2018, 175, 2093–2120. [Google Scholar] [CrossRef]
  53. Farzaneh, S.A.; Dehghan, A.A.; Lakzaie, A. Using Diagenetic Processes in Facies Modeling of a Carbonate Reservoir. Energy Sources Part A Recovery Util. Environ. Eff. 2013, 35, 516–528. [Google Scholar] [CrossRef]
  54. Zeng, H.; Xu, Z.; Liu, W.; Janson, X.; Fu, Q. Seismic-Informed Carbonate Shelf-to-Basin Transition in Deeply Buried Cambrian Strata, Tarim Basin, China. Mar. Pet. Geol. 2022, 136, 105448. [Google Scholar] [CrossRef]
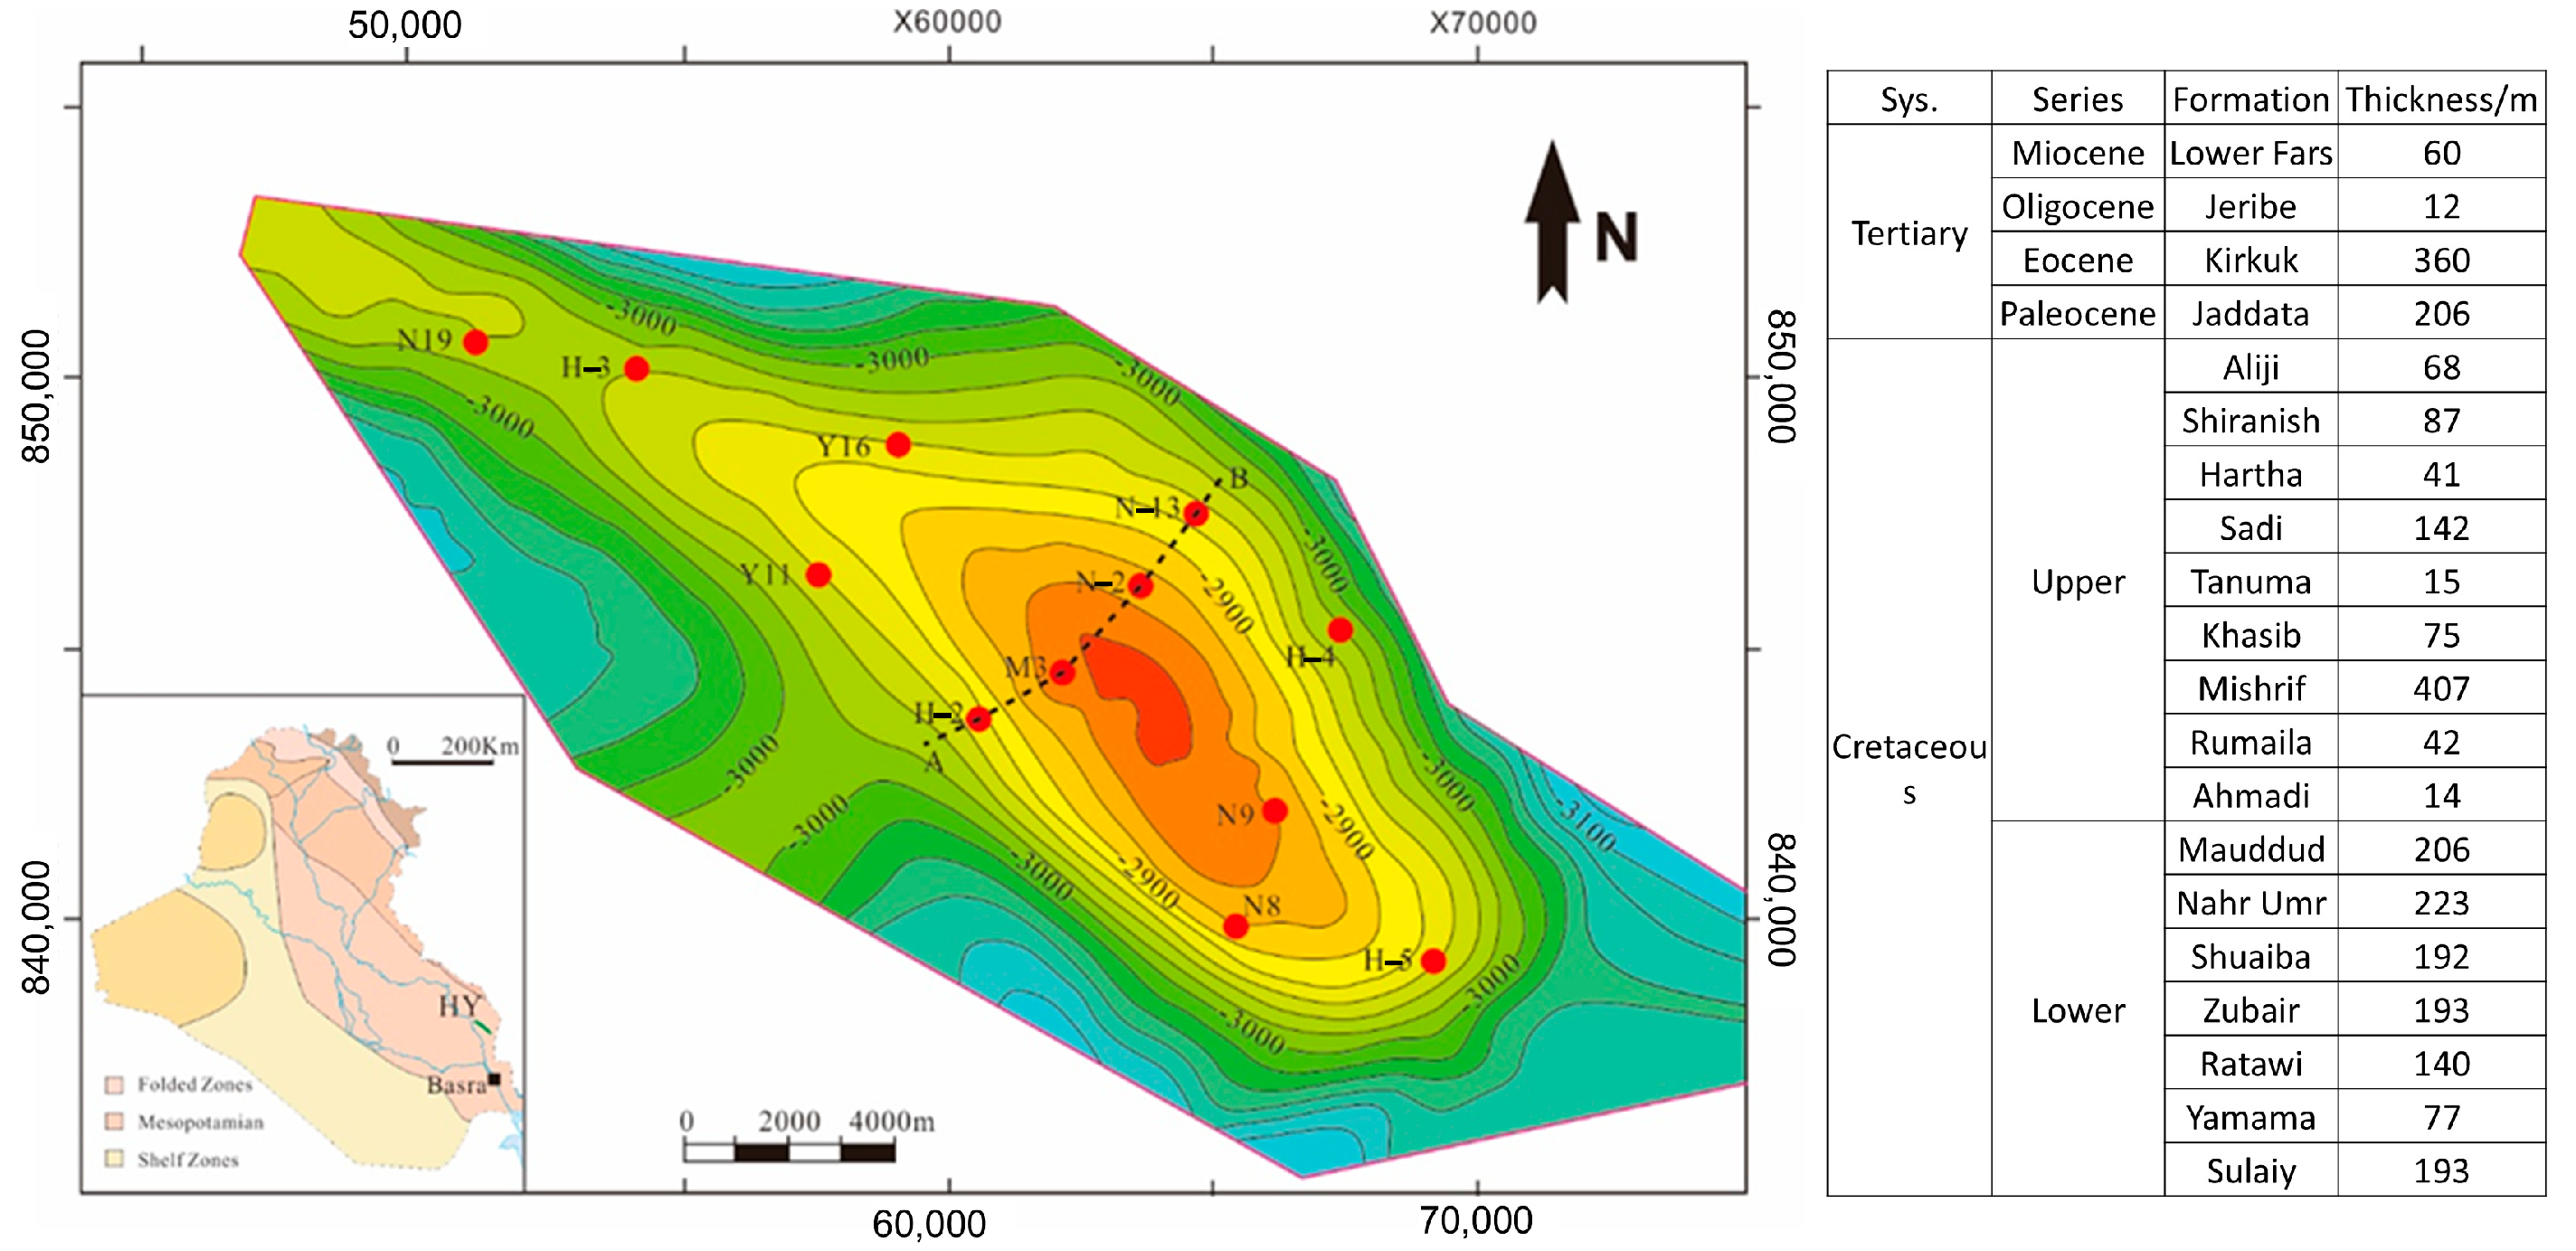
Figure 1. Structural map of the top of the Mishrif Formation and the strata in the HY oilfield.
Processes 13 02941 g001
Figure 2. High-resolution stratigraphic column of the Mishrif Formation in well M3 in the HY oilfield. The abbreviations are as follows: open lagoon (OL), back-shoals (BShs), coated grain sheets (CGSs), biostromes (B), back-shoal complexes (BShCs), shoal complexes (ShCs), patch rudist reefs (PRFs), and proximal mid-ramps (PMRs).
Processes 13 02941 g002
Figure 3. The flowchart of this work.
Processes 13 02941 g003
Figure 4. Core photos of the Mishrif Formation in Well M3 showing solution pipes, solution breccia, and vugs. (A) Depth of 2827.10–2827.36 m, solution pipes filled with green silt. (B) Depth of 2828.00–2828.32 m, breccias and infiltration fabrics. (C) Depth of 2985.72–2986.0 m, dissolution vugs near the rudists.
Processes 13 02941 g004
Figure 5. Fourth-order sequence stratigraphic cross section of the Mishrif Formation in the HY oil-field showing the sequence architecture and the evolution of the depositional environment (the orientation of the cross section is shown in Figure 1).
Processes 13 02941 g005
Figure 6. The typical thin sections of the lithofacies: (A) foraminiferal mudstone; (B) bioclastic peloidal wackestone; (C) bioclastic wackestone; (D) dolomitic bioclastic wackestone; (E) dolomitic wackestone; (F) bioclastic peloidal packstone; (G) bioclastic packstone; (H) dolomitic bioclastic packstone; (I) bioclastic peloidal grainstone; (J) bioclastic grainstone containing minor benthic forams; (K) rudistid floatstone containing bioclastic fragments of rudist bivalves (rud); (L) rudistid rudstone containing a rudist bivalve fragment.
Processes 13 02941 g006
Figure 7. Depositional succession and wireline log responses: (A) back-shoal depositional elements; (B) coated grain sheet depositional elements.
Processes 13 02941 g007
Figure 8. Depositional succession and wireline log responses: (A) biostrome depositional elements; (B) patch rudist reef depositional elements.
Processes 13 02941 g008
Figure 9. Depositional succession and wireline log responses: (A) shoal complex depositional elements; (B) back-shoal complex depositional elements.
Processes 13 02941 g009
Figure 10. Cementation of the Mishrif Formation in Well N13. (A) Depth of 2988.14 m, isopachous cement rim (iso cem) on replaced allochem (cemented biomold (sec cem)); a thin micritic envelope (mic env) between replacive calcite and isopachous rim cements; interparticle pore (inter Φ) partially infilled with cement. (B) Depth of 2936.13 m, fragments of micritic matrix (mcr), including foraminifera (for) suspended in moldic pore-filling calcite cement (sec cem) with some relict secondary porosity (sec Φ). The slight purplish staining of rare, coarser calcite suggests a weakly ferroan com-position.
Processes 13 02941 g010
Figure 11. Dissolution of the Mishrif Formation in Well N13. (A) Depth of 3092.15 m, open interparticle porosity (IP Φ) lined with blocky calcite spars (IP cem). Micritic envelopes (m e) highlight the original intrafossil pores, with some pre-cementation (IF cem) and micritic filling (geo). (B) Depth of 3020.13 m, echinoderm fragments (ech) that have been locally enveloped by micrite (mic) and have been widely replaced. The allochems appear to have undergone dissolution, leaving remnant micrite envelopes and secondary pores (sec Φ) that have been lined by non-ferroan calcite spars (spar). The porosity is dominated by moldic pores (sec Φ) within micritic envelopes and is bounded by very fine non-ferroan calcite spars.
Processes 13 02941 g011
Figure 12. Neomorphism of the Mishrif Formation in Well M3. (A) Depth of 3066.14 m, bryozoan fragments (bry) with intraskeletal pore-filling non-ferroan calcite development. Pores showing some open regions (pri Φ). Fragments have undergone alteration and dissolution. Matrix (mtx) is thought to be highly corroded bioclastic material. Rare pyrites (pyr), dolomites (dol), and clays are also present; (B) depth of 2891.11 m, foraminifera (for) with a primary pore-filling non-ferroan calcite spar. A bivalve (bvl) that has been altered to a coarse non-ferroan calcite spar. Intraskeletal pore-filling micrite/matrix (intra Φ fill) and matrix (mtx), which are combinations of non-ferroan calcite and micrite. Coarse non-ferroan calcite spars are present as widespread replacive/pore-filling phases.
Processes 13 02941 g012
Figure 13. Compaction and pressure solution of the Mishrif Formation in Well M3. (A) Depth of 2962.15 m, open porosity (Fr Φ) and cement (Fr cem) within fractures. The cement phases are dominated by non-ferroan calcite (cal), with minor non-ferroan dolomite (dol), mottled micritic matrix, and bioclasts, including benthic forams (for). (B) Depth of 3065.13 m, a stylolite (sty) with associated dolomite (dol) bounded by molluscan fragments; widespread dissolution leading to secondary pore development (sec Φ) and some local pore-filling non-ferroan calcite spar development (sec Φ fill). The widespread alteration of the matrix material (mtx) is partially composed of highly corroded bioclastic material.
Processes 13 02941 g013
Figure 14. Dolomitization of the Mishrif Formation in Well N9. (A) Depth of 3068.13 m, widespread dolomite rhombs (dol) replacing matrix material and filling moldic pores. Non-ferroan calcite (nfc) phases are also present. Foraminiferal material (for) altered/replaced by micrite with primary intraskeletal pores locally preserved (intra Φ), but are generally filled by non-ferroan dolomite (intra Φ fill). (B) Depth of 3103.07 m, abundant small moldic pores (sec Φ) and traces of organic material (org) in a dolomitic mosaic; euhedral/subhedral, non-ferroan dolomite (dol) cements.
Processes 13 02941 g014
Figure 15. Pie charts showing the pore-throat modality percentages of the inner shelf and platform margin of the Mishrif Formation: (A) inner shelf; (B) platform margin.
Processes 13 02941 g015
Figure 16. Cross plots of the RCA porosity–permeability of the Mishrif Formation. (A) Depositional elements within the inner shelf; (B) depositional elements within the platform margin.
Processes 13 02941 g016
Figure 17. The distribution probability of the wave impedance inversion of each depositional element of the Mishrif Formation.
Processes 13 02941 g017
Figure 18. (A) Wave impedance inversion and (B) depositional element models of the top zone MB1-2 of the Mishrif Formation showing the depositional element distribution constrained by the wave impedance inversion. (C) Profile of the depositional element model, with direction shown in (A).
Processes 13 02941 g018
Figure 19. Three-dimensional depositional element models of the Mishrif Formation showing the spatial variation in the depositional elements. (A) Sub-member B1-2 deposited during base-level rise; (B) member B2 deposited during base-level fall.
Processes 13 02941 g019
Table 1. Core properties of the different depositional elements of the Mishrif Formation.
PropertiesBiostromeCoated Grain SheetBack-ShoalShoal ComplexPatch Rudistid ReefBack-Shoal
Complex
Min.Max.Ave.Min.Max.Ave.Min.Max.Ave.Min.Max.Ave.Min.Max.Ave.Min.Max.Ave.
Porosity (%)6.435.421.55.529.519.04.629.115.74.031.022.815.133.923.54.630.921.2
Permeability (mD)0.177.221.80.249.610.00.1185.46.50.11605.5125.04.5573.3125.90.2225.923.6
Gain Density (gm/cc)2.6902.7262.7042.6502.7542.7042.6722.7972.7032.6792.7302.7042.6962.7312.7062.6872.7762.709
R35 (μm)0.161.980.80.17.981.30.054.60.660.1613.523.350.636.624.150.164.921.68
Pore-Throat Sorting (f)1.592.021.831.45.042.111.473.961.921.427.113.151.526.23.121.43.912.14
Table 2. Averaging wireline log responses of the depositional elements.
Depositional
Elements
GR (API)RLLD (Ohmm)RHOB (gm/cc)AC (μs/ft)RLLD*RHOB (Ohmm*gm/cc)GR*AC (API*μs/ft)
Biostromes24.740.22.36272.695.21796
Coated grain sheets22.250.22.39671.3120.41581
Back-shoals19.475.92.51666.6191.31291
Shoal complexes5.7289.22.35675.2682.6427
Patchy rudist reefs6.634.62.26982.678.5548
Back-shoal complexes17.610.12.26682.122.91442
Disclaimer/Publisher’s Note: The statements, opinions and data contained in all publications are solely those of the individual author(s) and contributor(s) and not of MDPI and/or the editor(s). MDPI and/or the editor(s) disclaim responsibility for any injury to people or property resulting from any ideas, methods, instructions or products referred to in the content.