Article

Internal Flow and Pressure Pulsation Characteristics of a High-Head Francis Turbine Under Wide Load Conditions

1
Key Laboratory of Fluid and Power Machinery, Ministry of Education, Xihua University, Chengdu 610039, China
2
Power China Hydropower Development Group Co., Ltd., Chengdu 610095, China
3
College of Water Resources and Civil Engineering, China Agricultural University, Beijing 100083, China
*
Author to whom correspondence should be addressed.
Processes 2025, 13(9), 2939; https://doi.org/10.3390/pr13092939
Submission received: 20 August 2025 / Revised: 9 September 2025 / Accepted: 11 September 2025 / Published: 15 September 2025
(This article belongs to the Special Issue Turbulence Models for Turbomachinery)

Abstract

To accommodate the integration of emerging energy sources such as wind and solar power, hydroelectric units are increasingly required to operate across a broader range of conditions. This operational expansion often leads to elevated pressure pulsations within turbines under non-design conditions, resulting in intensified hydraulic vibrations and, in some cases, structural damage and overall stability concerns. In this study, the Shear Stress Transport (SST) k-ω turbulence model is employed to perform unsteady numerical simulation calculation of a Francis-99 mixed-flow model turbine operating at a head of 400 m. Simulations are conducted for three operating regimes: low-flow and low-load conditions, optimal conditions, and high-flow and high-load conditions. Internal flow in the full flow channel of the turbine and pressure pulsation in the full flow channel components is systematically analyzed. The findings indicate that under low-flow and low-load conditions, the ability of the runner blades to constrain the water flow is significantly decreased. Across all three operational scenarios, the dominant pressure pulsation frequencies observed in both the stationary and guide vane are 30fn, primarily influenced by dynamic and static disturbance caused by the rotation of the runner’s long and short blades. In low-flow and low-load conditions, a low-frequency component at 0.2fn, due to the existence of vortices in the draft tube, exhibits the highest amplitude—up to 0.6%—in the straight cone section. Within the runner, pressure pulsation frequencies are predominantly associated with the rotation of the guide vane. Conversely, the draft tube region is characterized by frequency components related to both the runner’s dynamic-static interaction at 30fn and vortex-induced pulsations at 0.2fn.

1. Introduction

In this work, the Francis-99 turbine is a long-blade Francis model turbine that scales the 400 m head section of the Tokke hydropower station in Norway via a similar principle, which was jointly designed by several research institutes, such as the Norwegian University of Science and Technology (NTNU) and the Lula University of Technology (LTU), and completed the hydraulic model test in the NTNU hydraulic laboratory. The designer provides a public platform for experts and scholars in all industries to study the various properties of high-head Francis turbines, promote academic exchanges between countries. It provides a theoretical basis for the practical engineering application of high-head Francis turbines.
As the core component of a hydropower system, the stable operation of hydropower units is essential to ensuring the reliability of the entire power grid. The development of modern power systems necessitates that hydropower units accommodate variable energy sources such as wind and solar power. This often requires operation across a wide load range, which, in turn, leads to increased pressure pulsations in hydraulic turbines—particularly in high-head mixed-flow turbines—under certain off-design operating conditions. These conditions can result in critical stability issues, including intensified hydraulic vibrations and even structural damage to the unit. Consequently, the analysis of pressure pulsation mechanisms induced by partial load conditions has become a central focus in current hydropower unit stability research, yielding a growing body of significant findings.
Jhankal et al. [1] experimentally investigated the steady-state flow characteristics of a low-head mixed water turbine at 70%, 100%, and 110% loads. For the processing of pressure pulsation signals, Li et al. [2] used the Fourier transform (FFT) to realize time-frequency conversion and analyzed the data from the perspectives of the time domain and frequency domain.
Many experimental studies have also provided reference basis for research on the pressure pulsation characteristics of water turbines. Jamali et al. [3] measured the pressure pulsation of a certain power station and observed that the pressure pulsation was particularly obvious at a lower power level. Favrel et al. [4] carried out pressure pulsation and strain measurements on the fixed and rotating elements of a Francis turbine prototype. Iliev et al. [5] evaluated the performance efficiency and pressure fluctuation intensity of two low-specific speed turbines. By integrating numerical simulation and experimental investigations, Wang et al. [6] investigated the hydraulic properties within the runner and draft tube in three working conditions: Part Load (PL, 50% load), Best Efficiency Point (BEP, 70% load), and High Load (HL, 90% load). Pang et al. [7] employed the SST turbulence model and CFD techniques to simulate all flow channels of a Francis turbine under three different water head conditions. Guo et al. [8] studied pressure pulsations in a pump-turbine, extending from the spiral casing inlet through to the draft tube outlet, and examined the flow characteristics within the bladeless region and around the deflector. Yang et al. [9] conducted unsteady numerical simulations of the Francis turbine at Yangjiawan Power Station under different guide vane openings and applied Fast Fourier Transform (FFT) to analyze its pressure pulsation characteristics. Based on relevant research both at home and abroad, for steady-state calculations, the k-ε model, which has the widest application range and can better adapt to the flow of free shear layers, is generally chosen. Song et al. [10] used the SST k-ω model to study the relationship between the internal flow behavior and pressure pulsation in the bladeless zone, guide vane and draft tube. Zheng et al. [11] used CFD technology to study the evolution of the vortex structure in a partially loaded mixed-flow turbine and its influence on the internal flow conditions and pressure pulsation characteristics. Gohil et al. [12] researched the dynamic pressure oscillation of low-head Francis turbines and focused on the operating parameters under severe cavitation conditions. Sannes et al. [13] analyzed pressure pulsations across the complete operational scope of the turbine. Sonin et al. [14] studied the changes in flow velocity at the runner outlet on turbine pressure pulsations. Shi et al. [15] performed an unsteady three-dimensional numerical simulation of a turbine utilizing the RANS equations with the incorporation of the RNG k-ε turbulence model. Chen et al. [16] used the RNG k-ε model, the study analyzed flow field distributions and pressure pulsations in a deflector-blade turbine operating under no-load conditions. Minakov et al. [17] carried out numerical modeling of unsteady turbulent flow in a high-head power plant turbine passage using the Detached Eddy Simulation (DES) approach with frozen rotor treatment. Pang et al. [18] found that small opening conditions exacerbated cavitation and generated local blade vortices. The vortex pressure pulsation reaches its peak at a medium opening, while at a large opening, it manifests as a low-frequency pressure pulsation with a smaller amplitude. Ye et al. [19] studied that the pressure pulsation of 1.35 times the rotational frequency caused by the vortex band in the draft tube of a certain type of mixed-flow turbine is the main source of vibration and noise. Li et al. [20] applied the SST k-ω turbulence model to investigate both the internal flow field dynamics and pressure pulsation phenomena in a mixed-flow turbine under diverse operational settings, and it was found that the draft tube is the main part for energy dissipation in the turbine.
In conclusion, the internal flow of the whole flow channel and the pressure pulsation mechanism of the whole flow channel of the long and short blade type of Francis turbine are relatively vague. This study investigates the internal flow characteristics and stability of the Francis-99 mixed-flow model turbine, featuring both long and short blade designs, which was scaled from the 400-m head section of Norway’s Tokke hydropower station, under diverse operating condition, providing a technical basis for the stability of this type of high-head mixed-flow turbine when operating under the wide-load working conditions of a real hydropower station. It also provides a reference basis for its research on measures to improve pressure pulsation and for solving problems such as vibration and fatigue failure of the unit.

2. Calculation Model

2.1. Basic Parameters of the Model Turbine

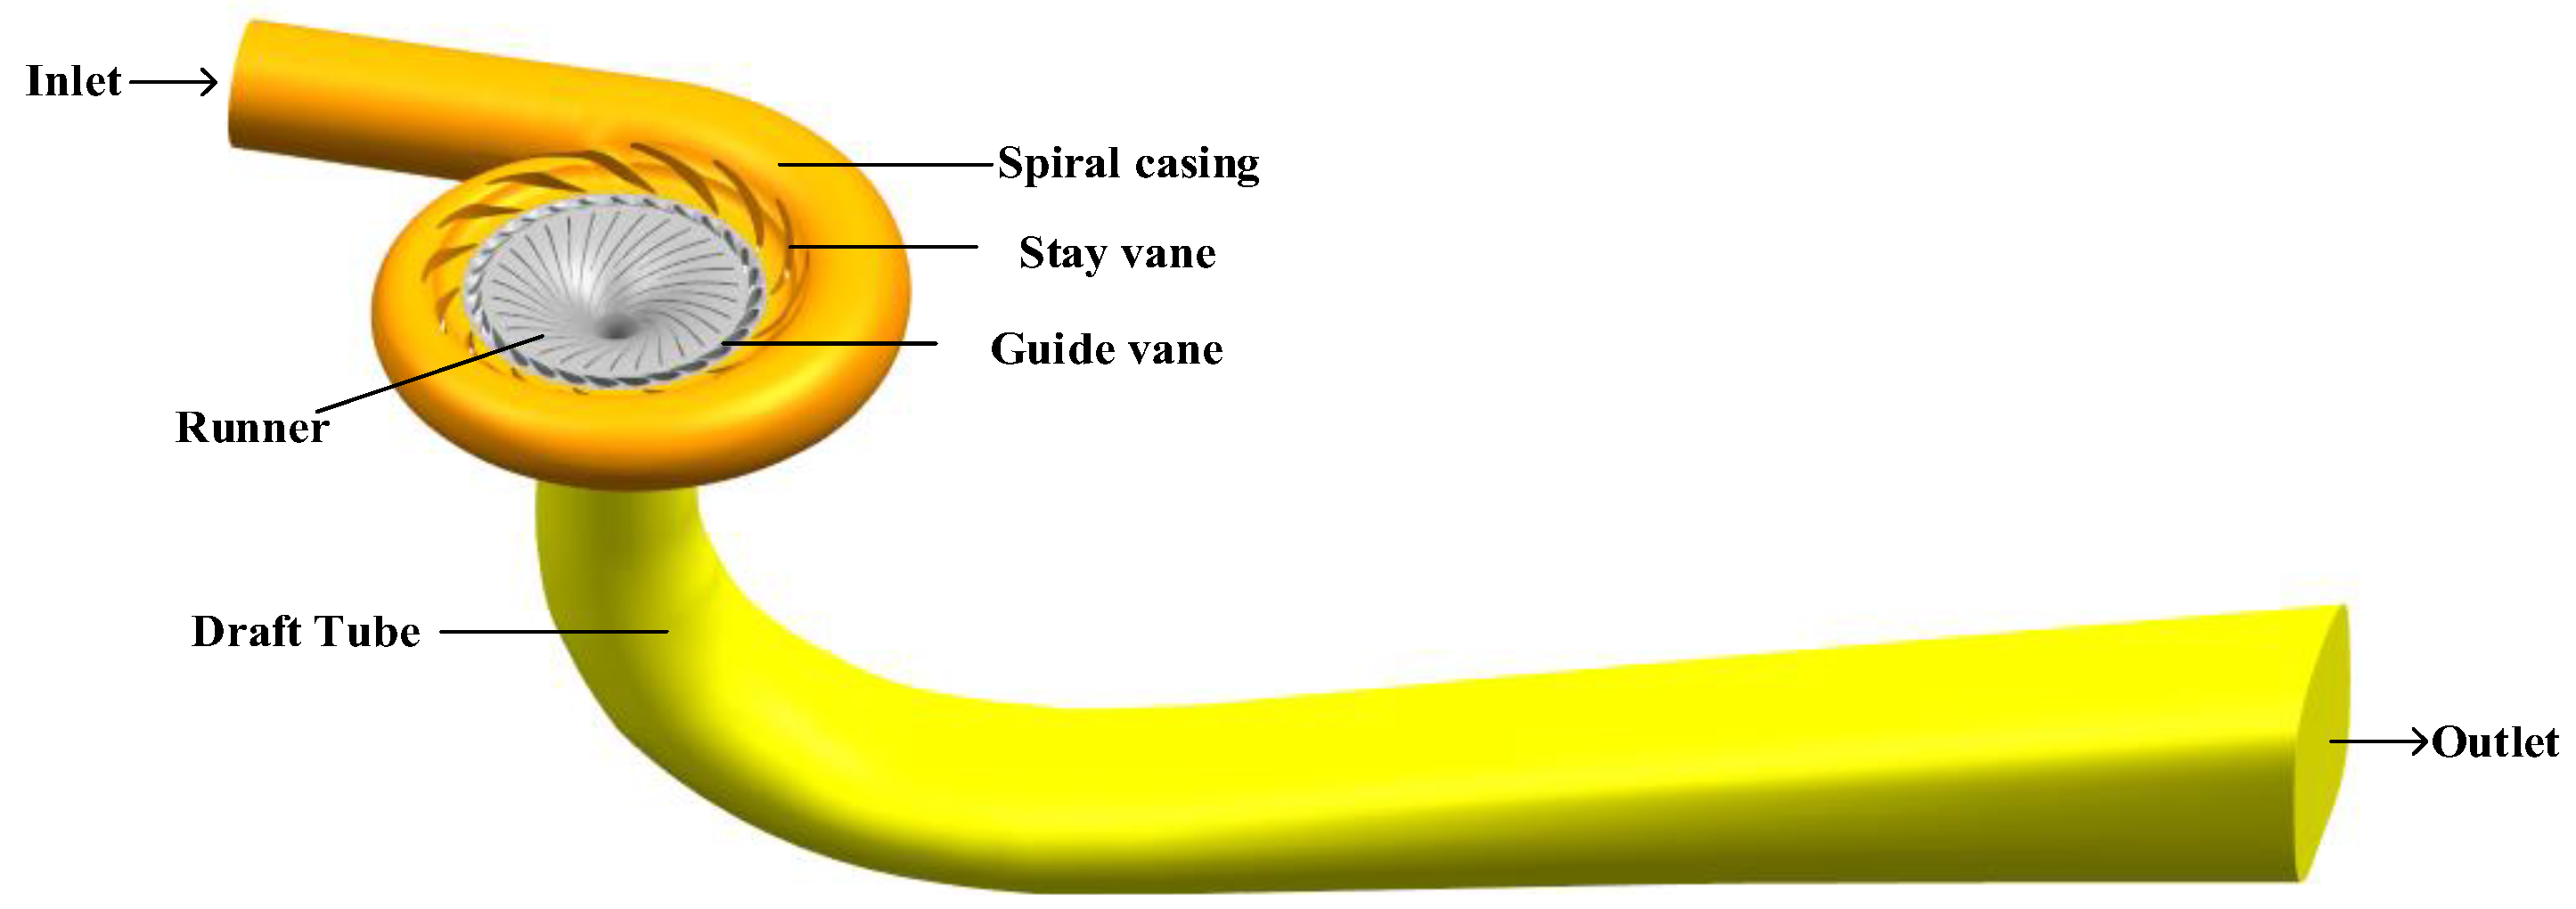
In this study, numerical simulation was conducted using Ansys CFX software (https://www.ansys.com/products/fluids/ansys-cfx, accessed on 20 August 2025) (ANSYS Corp., Canonsburg, PA, USA). This research explored the dynamics of internal fluid dynamics and pressure pulsation phenomena in the turbine unit under multiple working conditions, following the Francis-99 model’s design specifications. Complete flow channel’s geometric model contains five fundamental parts: the spiral casing, stay vane, guide vane, runner, and draft tube, with the turbine’s basic parameters shown in Table 1.

2.2. Detail Characteristics Curve of the Model Turbine

The research was conducted under the conditions of low flow and low load, optimal conditions, and high flow and high load. According to ref. [21], the parameters of the operating points are marked on the Francis-99 type turbine’s complete characteristic curve in Figure 1.
(1)
PL working condition, that is, the small flow and low load working condition, nED = 0.215 and QED = 0.07;
(2)
BEP condition, that is, the optimal condition, with nED = 0.18 and QED = 0.2;
(3)
HL operation, that is, the high-flow and high-load operation, has nED = 0.195 and QED = 0.19.

2.3. Establishment of a Three-Dimensional Geometric Model

The three-dimensional water body model of the flow-through components of the Francis-99 model turbine was constructed through the three-dimensional modeling software UG NX 12.0.
Figure 2 illustrates the three-dimensional geometric model of all flow channels.

2.4. Grid Division and Independence Verification

This study focuses on the core demand for the operational efficiency of turbines. An unstructured hexahedral grid system is adopted to implement regional grid optimization and local densification for key flow-through, the components include the spiral casing, stay vane, guide vane, runner, and draft tube, as shown in Figure 3.
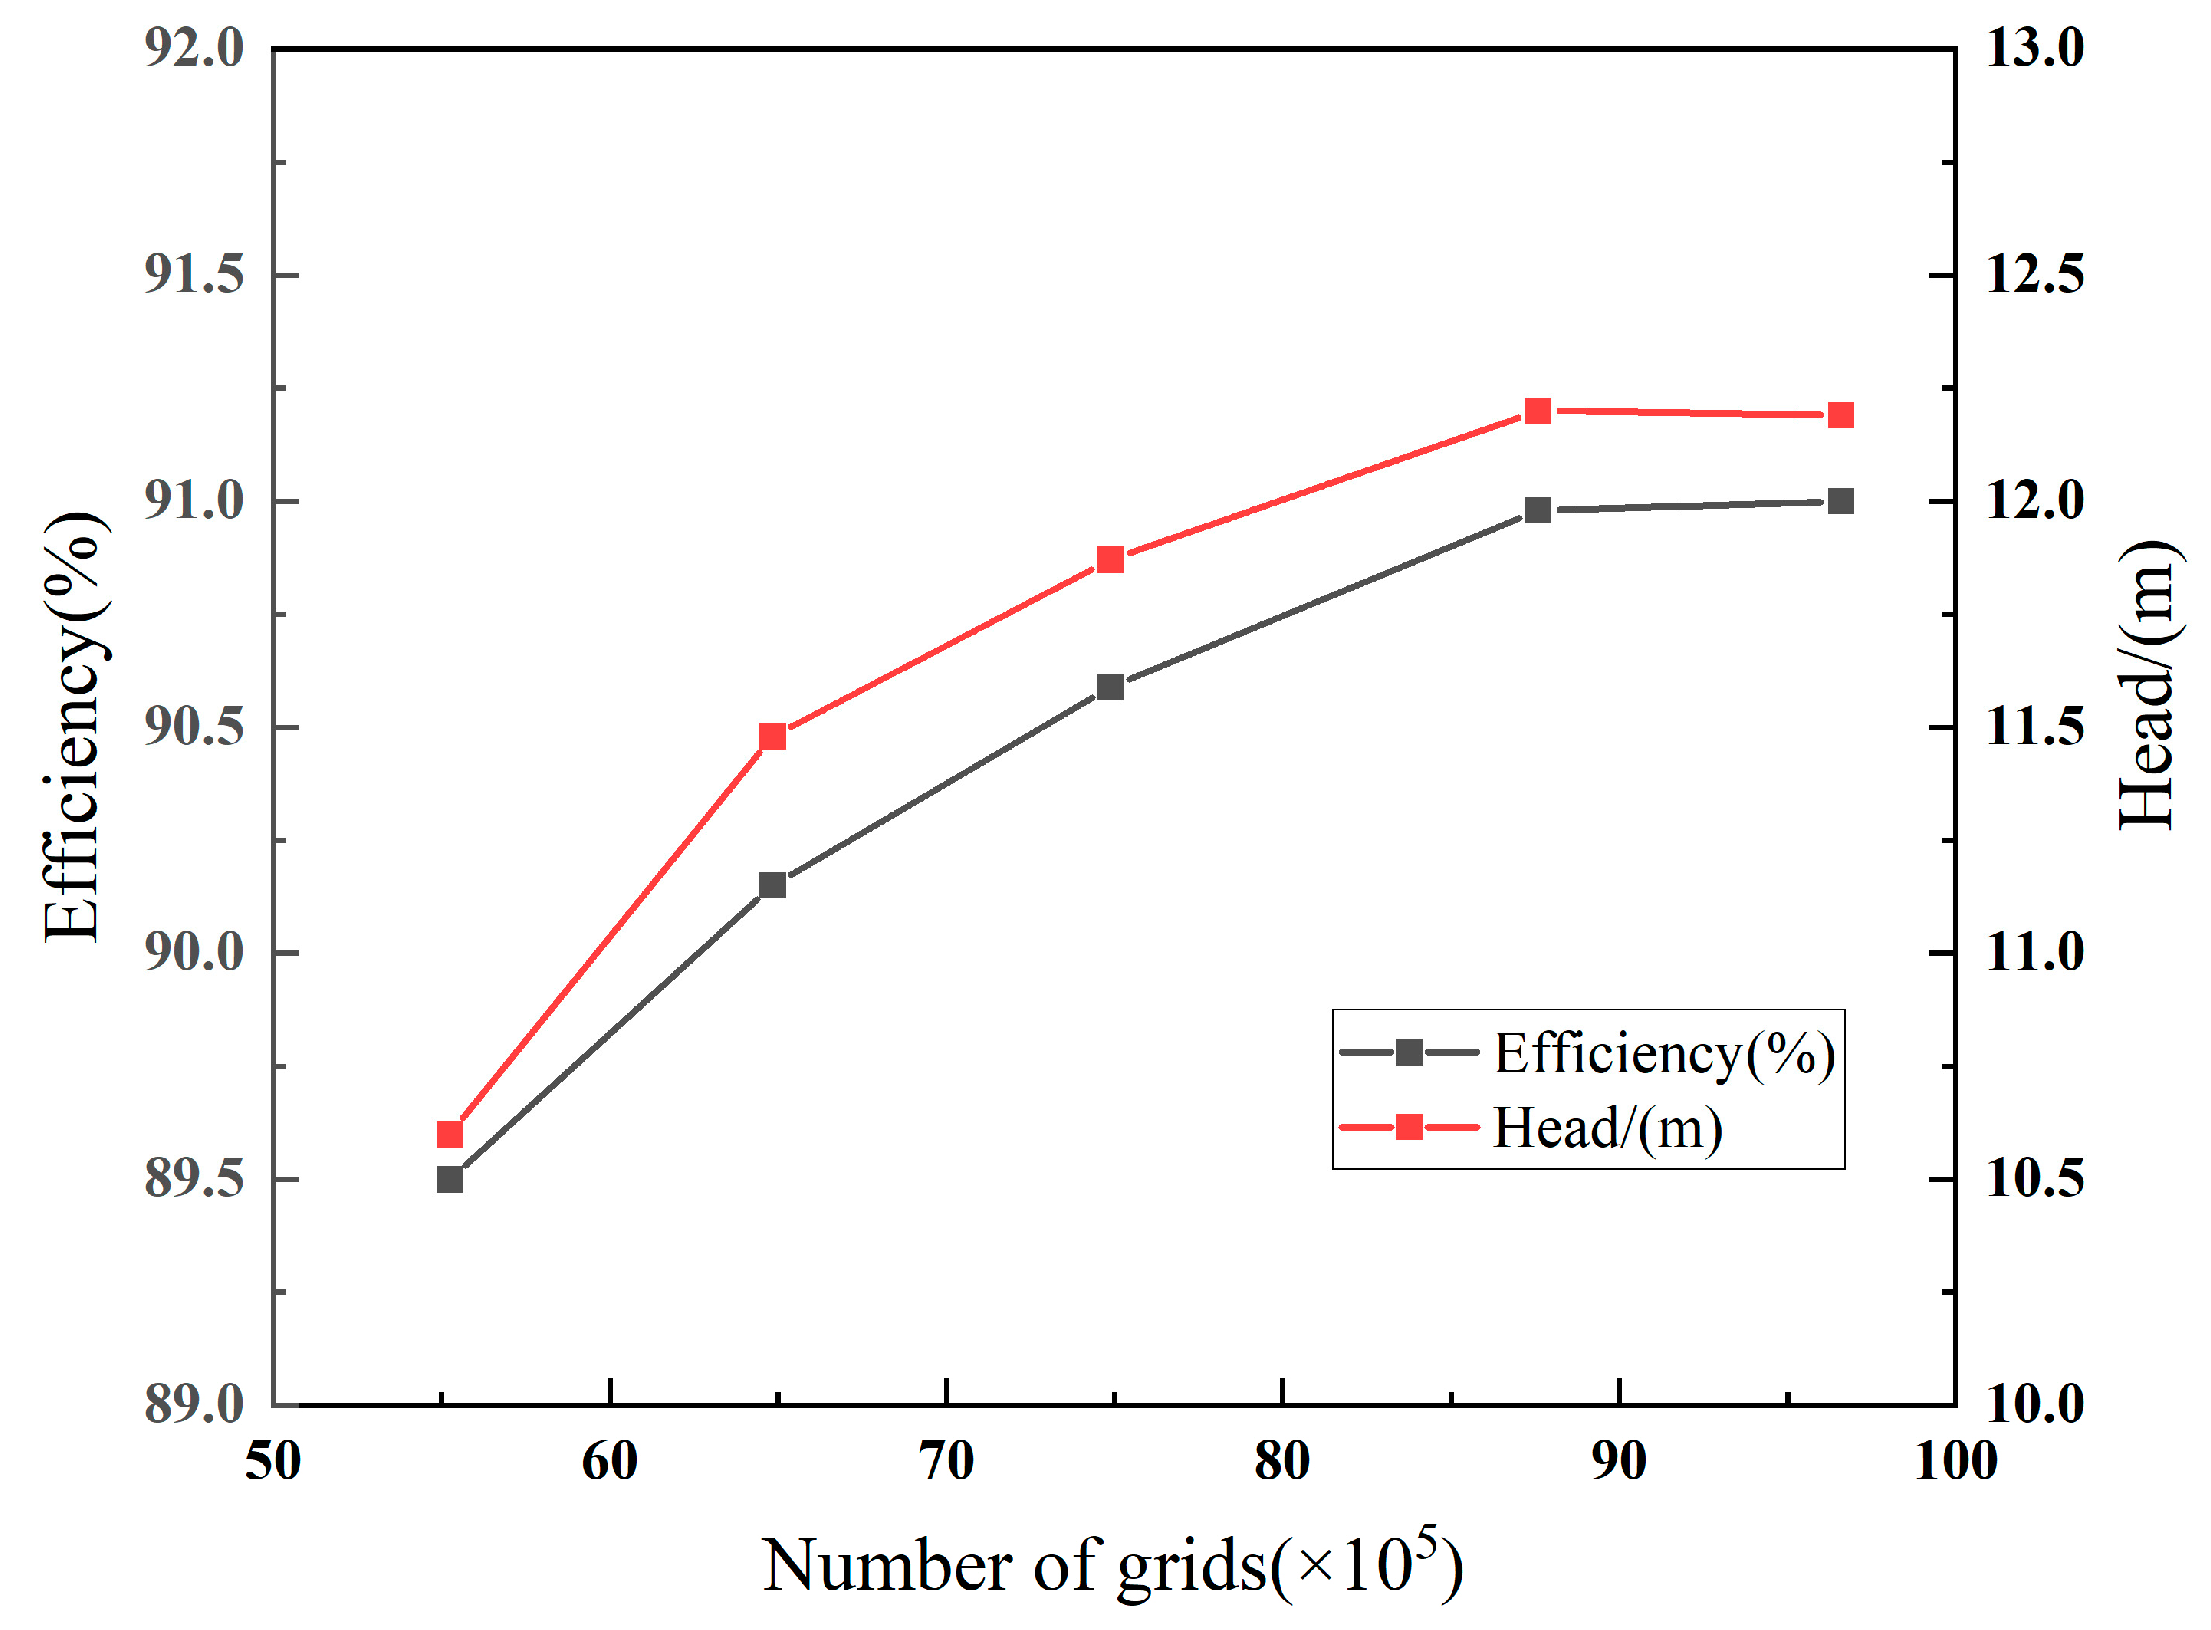
As the number of grids increases, the calculation accuracy will improve accordingly, but at the same time, it will also lead to an extension of the calculation time. To strike a balance between calculation accuracy and efficiency, this study selects the rated water head and rated working condition as the calculation condition and compares and verifies the water head and efficiency results obtained through numerical calculation with the corresponding data in the real machine operation characteristic curve. A total of 5 groups of grids of different numbers were selected for verification in this study, The total number of grids was 5.52 million, 6.48 million, 7.48 million, 8.75 million and 9.65 million, respectively.
Grid independence verification was conducted using five sets of grid models with varying mesh densities to perform numerical calculations of unit efficiency and waterhead under design operating conditions. When the number of grid cells increases to 8.75 million, both the head efficiency and the relative error are within 0.05%, and the influence of the increase in the number of grids on the head and efficiency tends to stabilize. At this point, it can be considered that the further increase in the number of grids has little impact on the improvement of calculation accuracy. Therefore, when the total number of grids is 8.75 million, it meets the accuracy requirements of this calculation and engineering calculation. The detailed parameters of each component grid are shown in Table 2. The conclusion of the grid independence verification is illustrated in Figure 4.

3. Numerical Computation Method

3.1. Turbulence Flow Simulation Model

When the SST k-ω model simulates turbulent flow, it automatically applies to the standard k-ω model in the near-wall region and automatically switches to the standard k-ε model in the far field. This model only requires initial boundary conditions and is applicable to flows where the Reynolds shear stress plays a major role. Its equation reflects the transport term of the turbulent shear stress and is widely used in unsteady flow simulations of rotating hydraulic machinery such as water turbines. Its expression is as follows:
The k equation:
k t + ( k u i ) x i = x i ν + ν t σ k k x i + P k β * k ω
The ω equation:
ω t + ( ω u i ) x i = x i ν + ν t σ ω ω x i + 2 ( 1 F 1 ) σ ω 2 ω k x i ω x i + P ω β ω 2
where Pk is the turbulent kinetic energy generation term; Pω is the turbulent dissipation term; F1 is the mixing function; νt is the vortex viscosity coefficient of turbulence; and β, β*, σk, σω and σω2 are constants of the turbulence model.

3.2. Pressure Pulsation Equation

To analyze the Pressure pulsation at monitoring points placed at different positions within the flow channel and with different amplitudes, the pulsation Cp is introduced as the reference value for quantifying the pressure pulsation intensity of mixed-flow turbines.
C p = p i p ¯ ρ g H × 100 %
where pi is the pressure at point i; p ¯ is the average pressure; and H is the head.

3.3. Boundary Condition Setting

This study is divided into three working conditions: Working condition 1: PL; Working condition 2: BEP; working condition 3: HL. At the outlet, the pressure outlet boundary condition is adopted, and the velocity inlet boundary condition is applied. The inlet boundary is set as the speed inlet, and the working conditions of small flow rate, design flow rate and large flow rate are 0.814 m/s, 2.328 m/s and 2.534 m/s, respectively. The outlets are pressure outlets, which are 99.540 kPa, 101.560 kPa and 95.980 kPa, respectively. The rotating domain and the stationary domain are connected by an interface, with rotational speeds of 406.2 r/min, 335.4 r/min and 369.6 r/min, respectively. The fixed wall surface adopts the non-slip condition, and the enhanced wall surface function is used to simulate the flow in the near-wall area. Table 3 displays the boundary condition settings.
According to the surfaces of each flow-through component and the fixed walls of the runner blades, etc., To satisfy the condition of a no-slip wall surface, the standard wall function is applied in the near-wall region. In terms of calculation Settings, when performing steady-state calculations, “None” is adopted for the static interface, and “Frozen Rotor” is adopted for the dynamic and static interface. When performing unsteady calculations, the static interface also adopts “None”, while the dynamic and static interface adopts “Transient Rotor Stator”. And for the SST model used in numerical simulation, the y+ value is maintained at less than “1”. The convergence criterion is set to 10−5. For the steady-state simulation, the solver type is configured as steady. The results from the steady-state calculation are then used as the initial conditions for the unsteady simulation, which is performed under a transient setting. Each time step corresponds to a 3° rotation of the runner, with a full revolution taking 0.1478 s. Once the unsteady simulation reaches a stable state, the computation is continued for more than 10 cycles, after which the pressure pulsation data from the final 2 cycles are extracted for analysis.

4. Calculations and Analysis of Results

Numerical simulation of the turbine’s internal fluid flow and pulsating pressure characteristics under three operating conditions was performed employing the SST k-ω turbulence model. To investigate pressure pulsation characteristics in mixed-flow turbines, strategically placed monitoring points were installed along the flow path components to measure transient pressure fluctuations under different operating conditions.
Specifically, monitoring points were positioned on the guide vane, stay vane, and runner at 10%, 50%, and 90% of the blade height, adjacent to the wall surface. More monitoring points were placed in both the straight conical section and the bend section of the draft tube. The detailed locations of these monitoring points are illustrated in Figure 5.

4.1. Verification in the Accuracy of Numerical Calculation Results

Steady-state measurements were conducted on the Francis turbine model at a symposium held at the Norwegian University of Science and Technology. Three operating points were studied, Part Load (PL), Best Efficiency Point (BEP), and High Load (HL). The hydraulic laboratory conducted efficiency, pressure and velocity measurements on the Frans-99 test chamber. Table 4 shows the comparison between the experimental results of hydraulic efficiency at the three working points and the values in this paper.
According to the literature “Experimental and Numerical Studies of a High-Head Francis Turbine: A Review of the Francis-99 Test Case” [21] was compared with the efficiency of the test results. As shown in Figure 6, under different numerical model conditions, at the PL operating point, the difference between the experimental efficiency and numerical efficiency is the greatest. The minimum difference between the experimental results under BEP. Therefore, it can be considered that the numerical simulation results of this paper are within the allowable error range.

4.2. Speed Characteristics

(1)
Water-conveying component
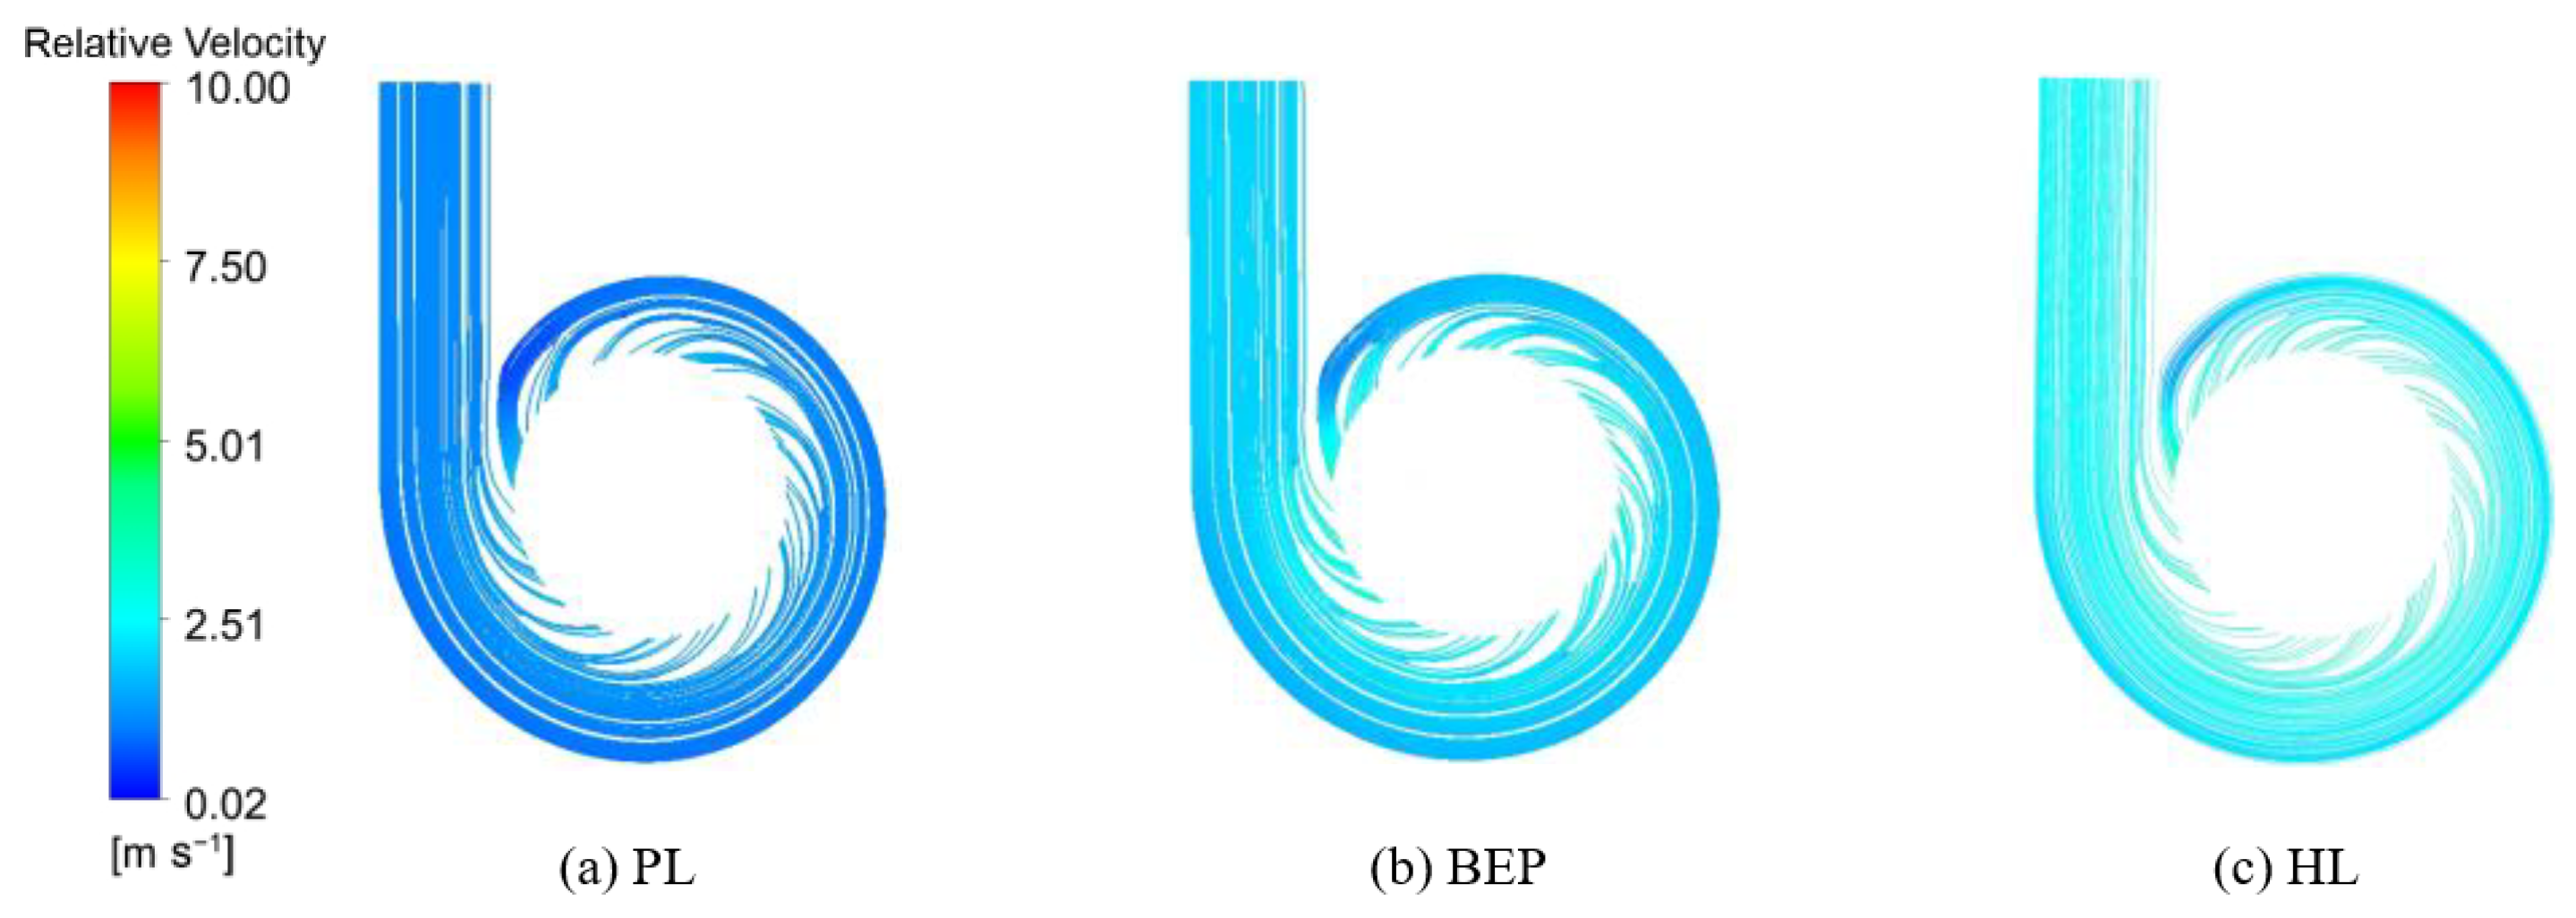
Figure 7 displays the internal relative velocities and flow lines within both the spiral casing and guide vane across all three operating conditions. The flow line distribution of the water-conveying components is uniform and symmetrical, and there is no obvious flow separation or vortex phenomenon. According to the continuity equation, the water flow velocity steadily rises as the cross-sectional area from the spiral casing’s inlet to the fixed guiding vane’s outlet gradually falls, and the water flow velocity gradually increases. As the guide vane opening progressively enlarges, the flow velocity incrementally rises, with the maximum flow velocity within the water-conveying mechanism increasing from 4.5 m/s to 10 m/s.
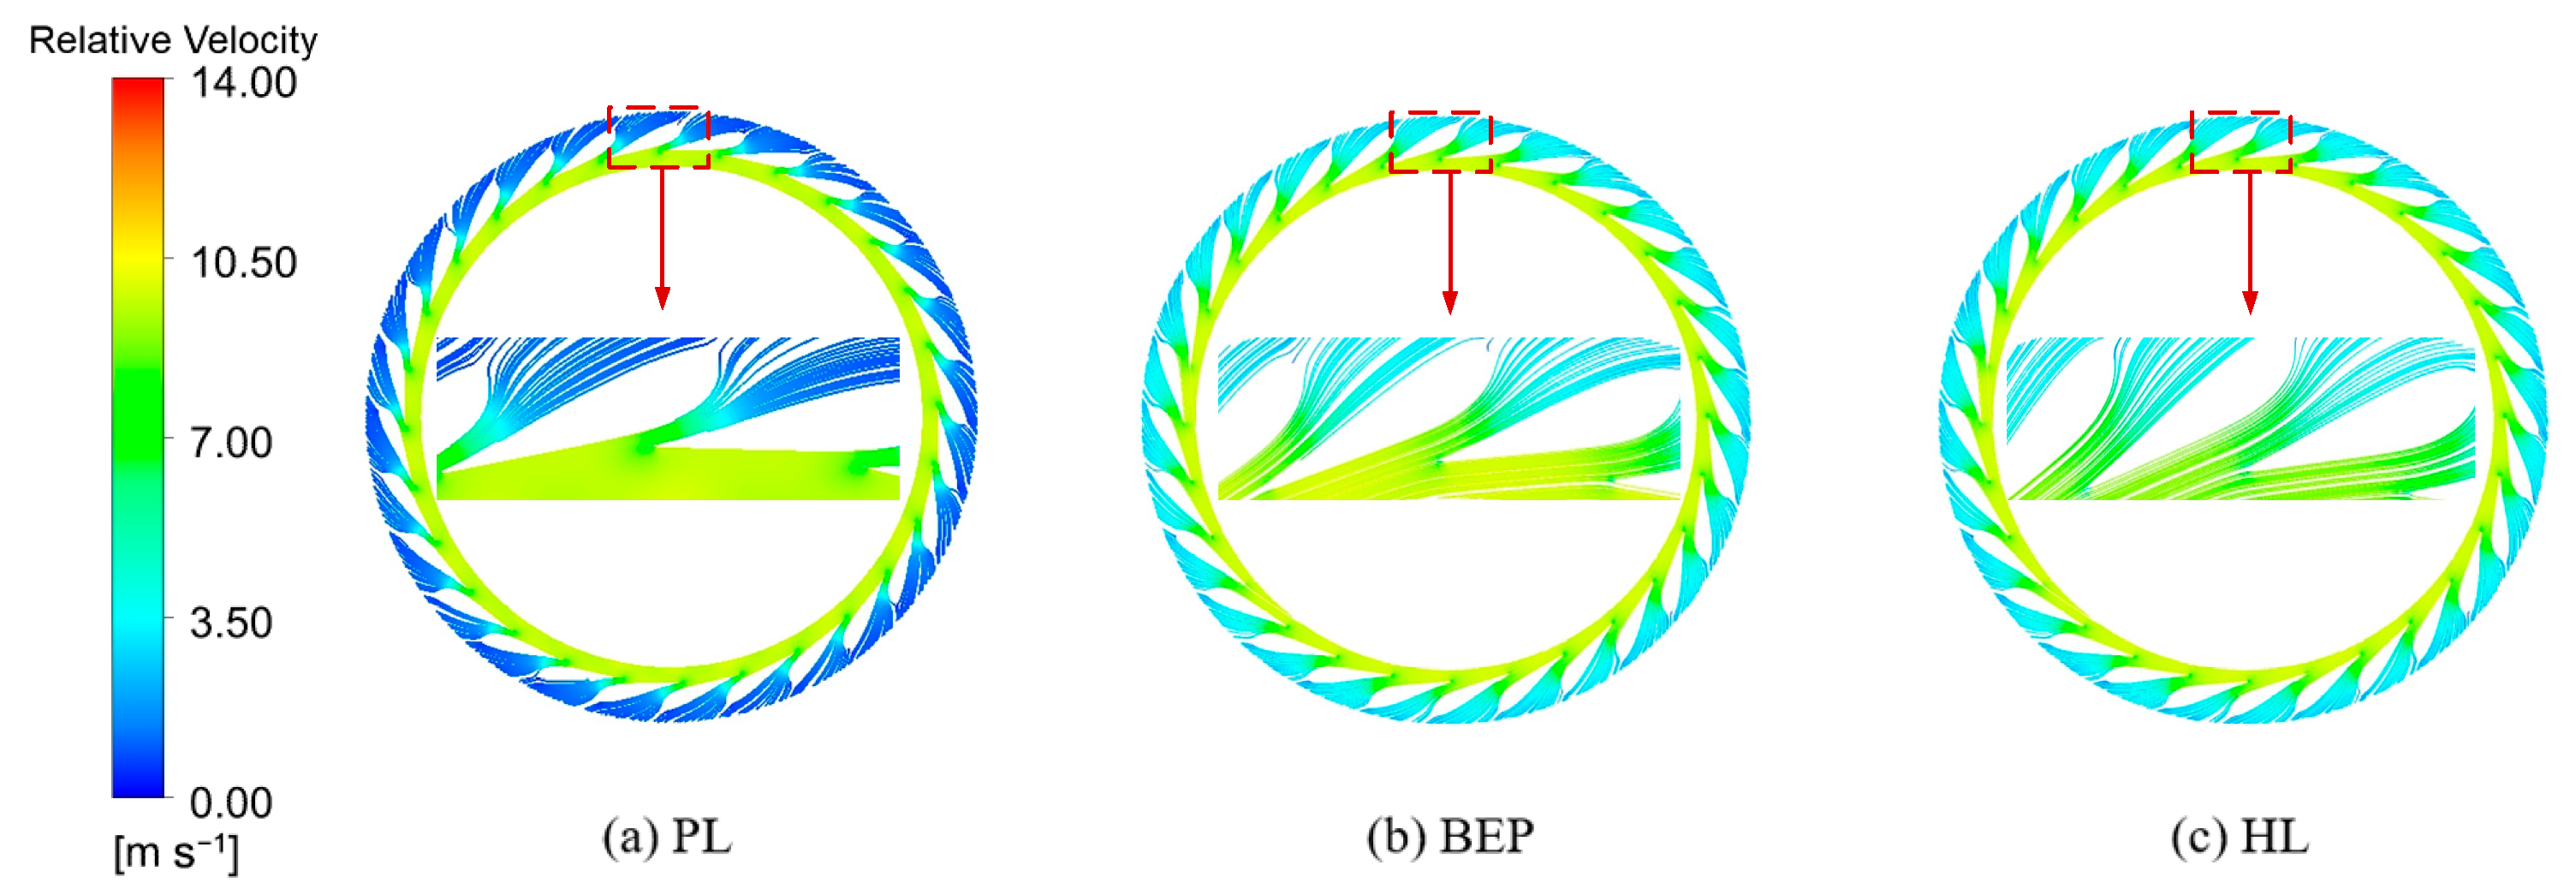
The velocity field distribution of the guide vane is seen in Figure 8. Across the three operating conditions, the streamline distribution patterns remain generally consistent. Velocity increases radially from the inlet to the outlet of the guide vane, with the flow velocity on the pressure side being greater than that on the suction side. As the unit load increases, the flow relative velocity at the entrance of the guide vane increases from 3.25 m/s to 4.4 m/s, while the maximum flow velocity at the outlet rises from 7 m/s to 14 m/s. This rise in flow rate leads to a rise in the kinetic energy of the water and makes a more stabilized internal flow state within the guide vane and enabling a more efficient conversion of hydraulic energy into electrical energy.
(2)
Runner
The streamline distribution of the runner on the Z = 0 plane under three load conditions is presented in Figure 9. The water flow relative velocity progressively decreases from the inlet to the outlet of the runner, reflecting the transformation of water’s kinetic energy into rotational mechanical energy. At the PL operating point, flow separation occurs close to the leading edge of the blades, indicating a weakened ability of the runner blades to constrain the flow. As a result, prominent vortices form on the suction surface of the runner blades. The internal flow within the runner becomes disordered, with noticeable vortex formation and backflow phenomena in the flow channels. A portion of the flow’s kinetic energy is transformed into turbulent vortex energy, leading to reduced efficiency in kinetic energy conversion. As the load increases, the ability of the runner blades to guide and constrain the flow improves, resulting in a more stable internal flow pattern and an increase in flow velocity within the runner. At the HL operating point, the maximum flow velocity is observed near the leading edge of the blades, reaching a peak value of 6.1 m/s.
(3)
Draft tube
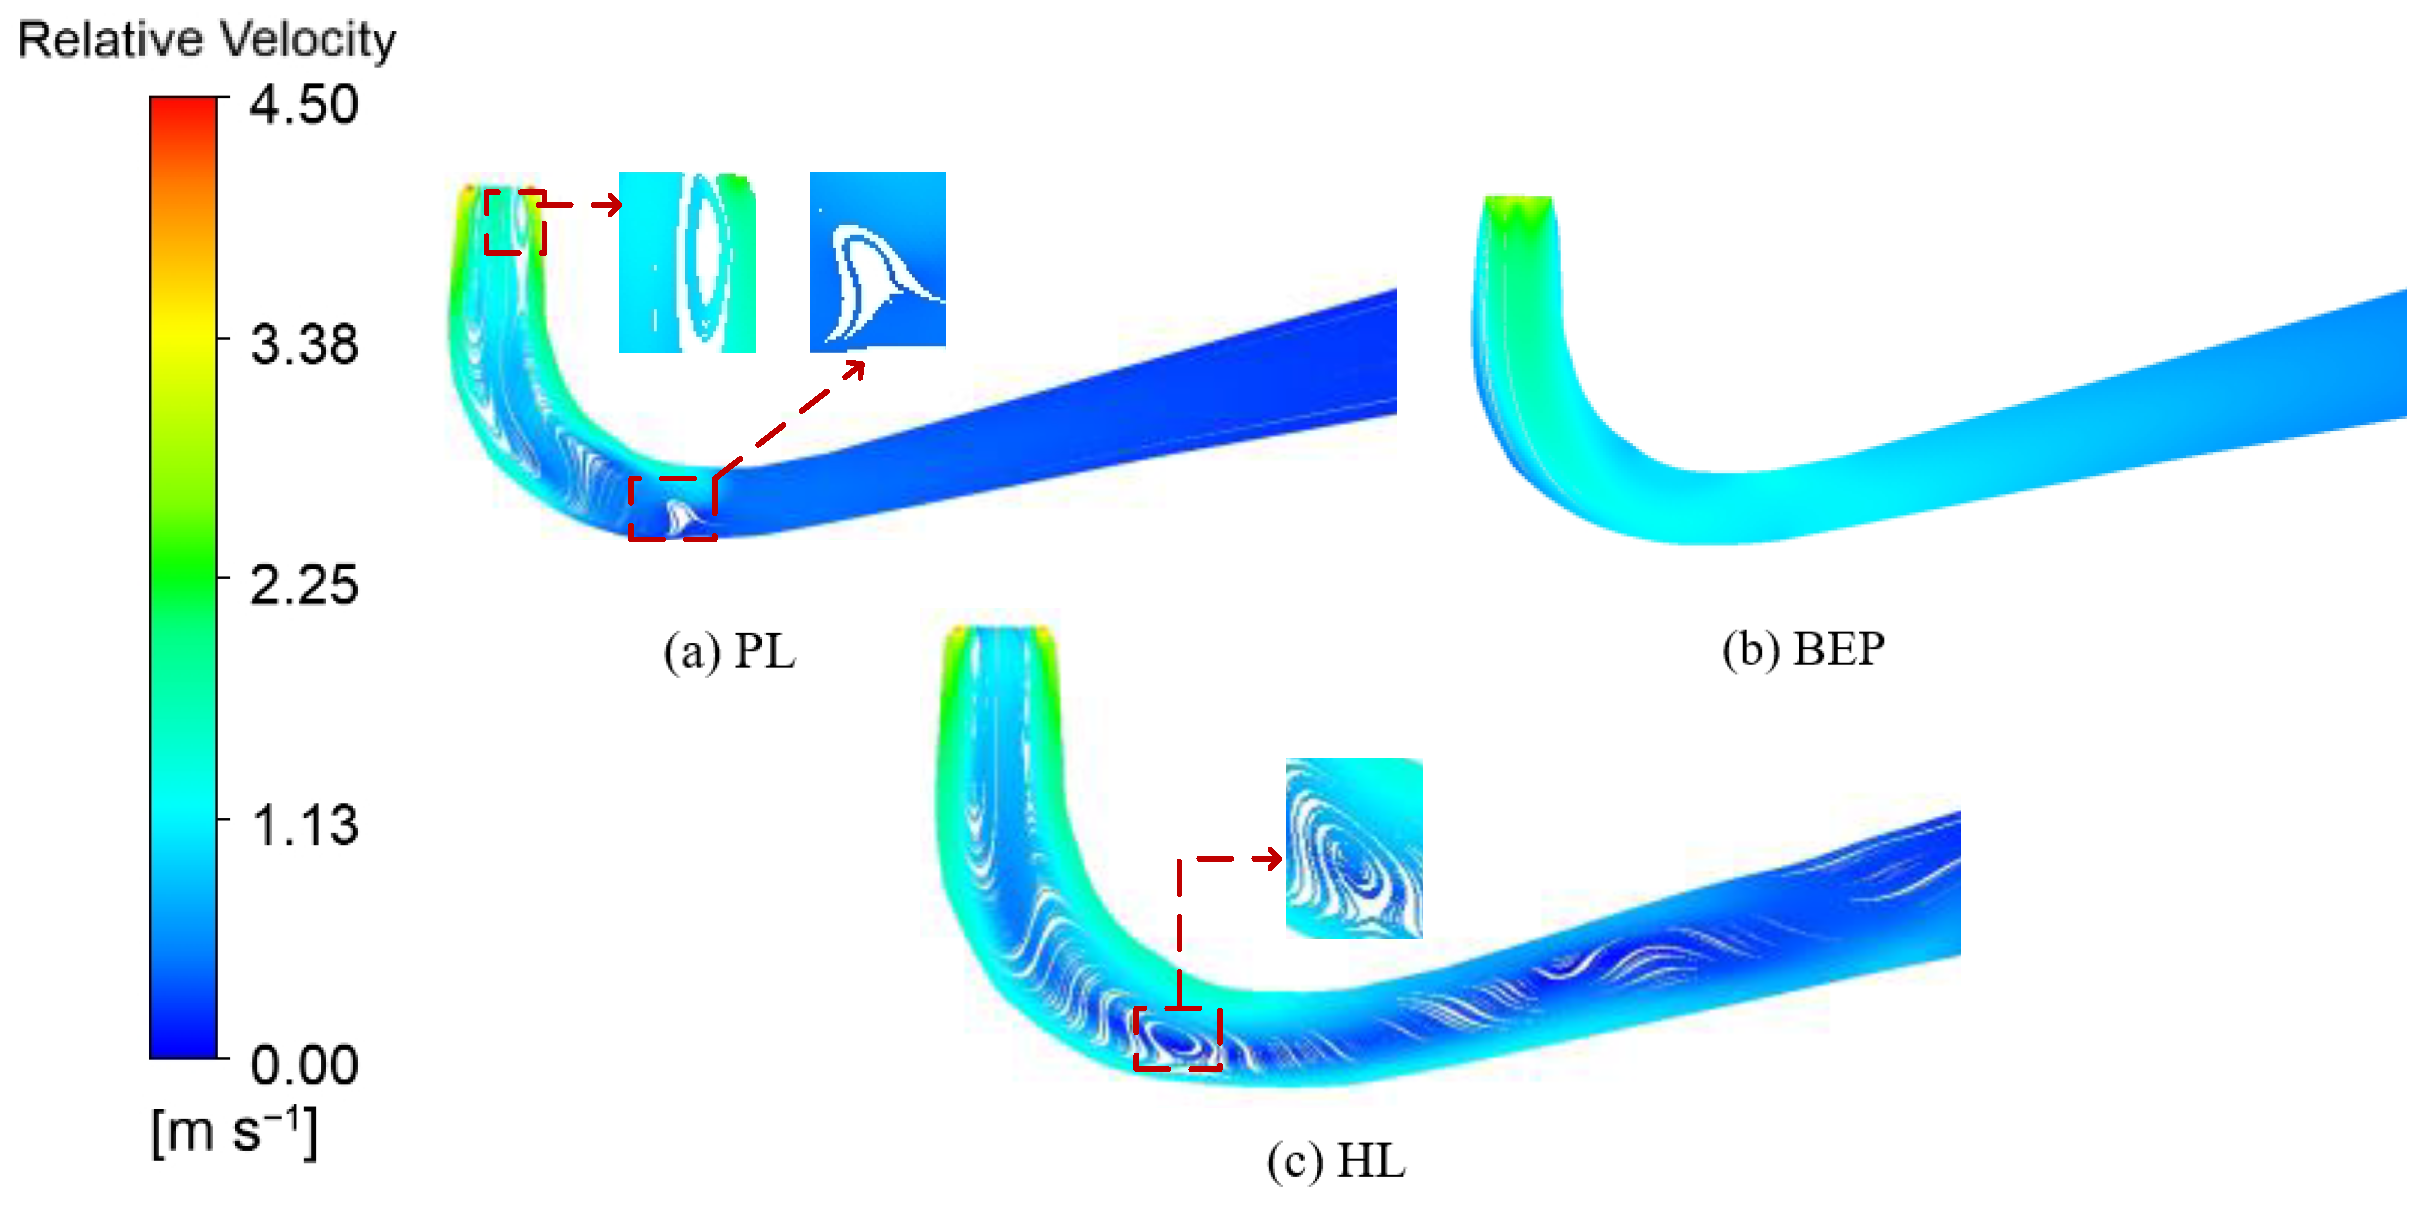
Figure 10 illustrates the velocity field distribution within the draft tube under the three operational circumstances. In all cases, the flow relative velocity decreases from the entrance to the output of the draft tube. Under the PL operating condition, the water velocity in the draft tube declines from 5 m/s to 0.5 m/s, with distinct vortex bands observed in both the straight cone and elbow sections. In the BEP condition, the velocity contour distribution is relatively uniform, and the internal flow is stable, with no evident regions of backflow or swirling. Under the HL operating condition, vortex bands primarily develop in the elbow section. These vortex structures occupy a significant portion of the main flow area, forcing the primary flow toward the wall surface. As a result, the velocity between the wall and the vortex becomes relatively high. The water flow velocity decreases from 6 m/s to 0.5 m/s along the length of the draft tube.

4.3. Pressure Characteristics

(1)
Water-conveying component
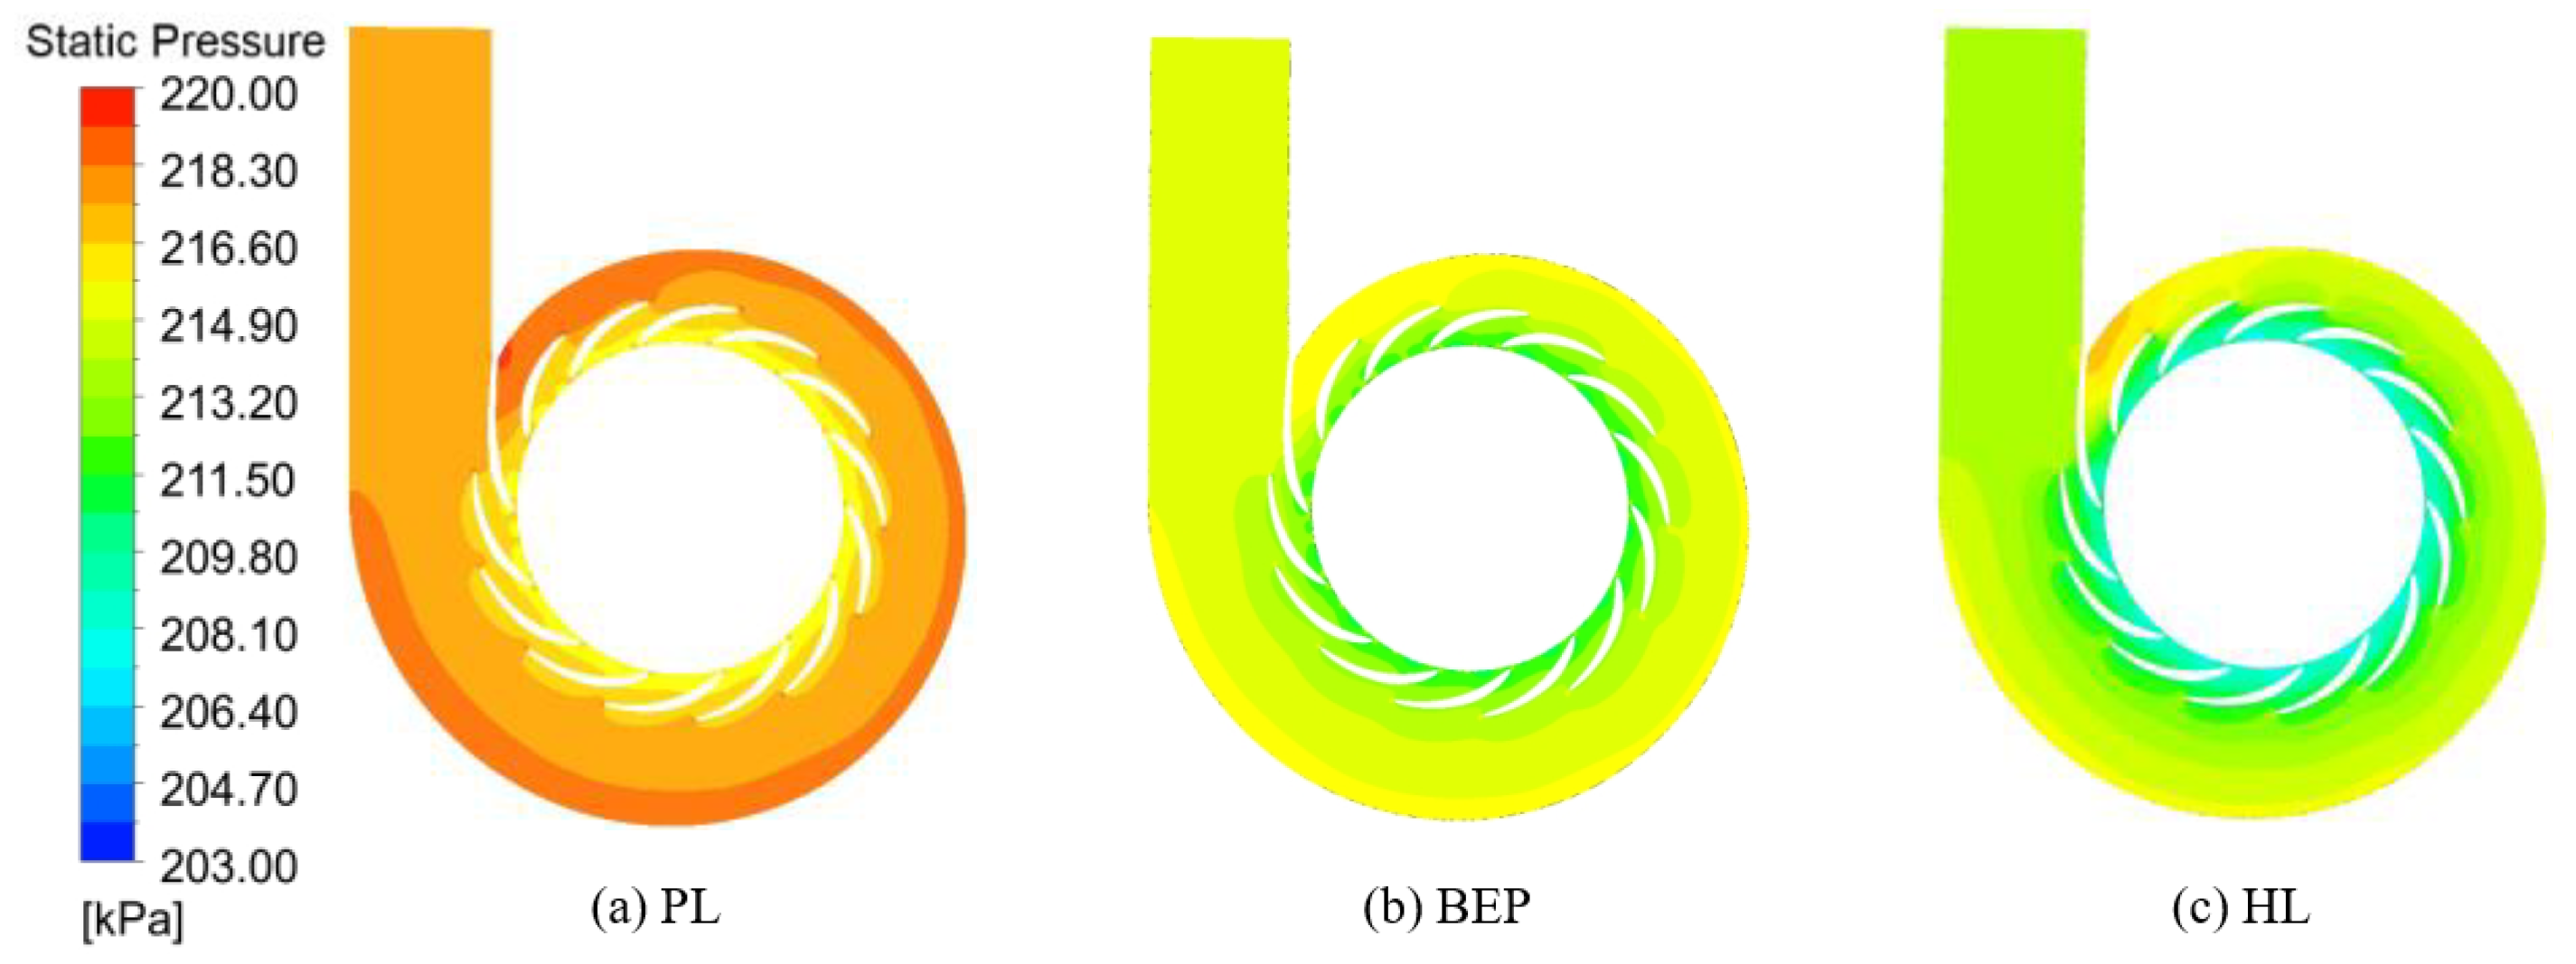
The static pressure distribution within the water-conveying components under the three operating conditions is illustrated in Figure 11. The pressure is relatively high along the outer periphery of the spiral casing. According to the continuity equation, as the cross-sectional area decreases, the static pressure energy of water gradually converts into kinetic energy, thereby resulting in a significant reduction in pressure. In the outlet region of the stay vane, the pressure exhibits a radial decline from the vane inlet to the outlet. Near the guide vane, the pressure further decreases due to the increase in flow velocity and associated changes in kinetic energy. At the inlet of the spiral casing, the pressure drops from 220 kPa under the PL operating condition to 214 kPa under the HL condition. The minimum pressure recorded in the region leading into the stay vane is 208 kPa, while the minimum pressure at the outlet is 206 kPa.
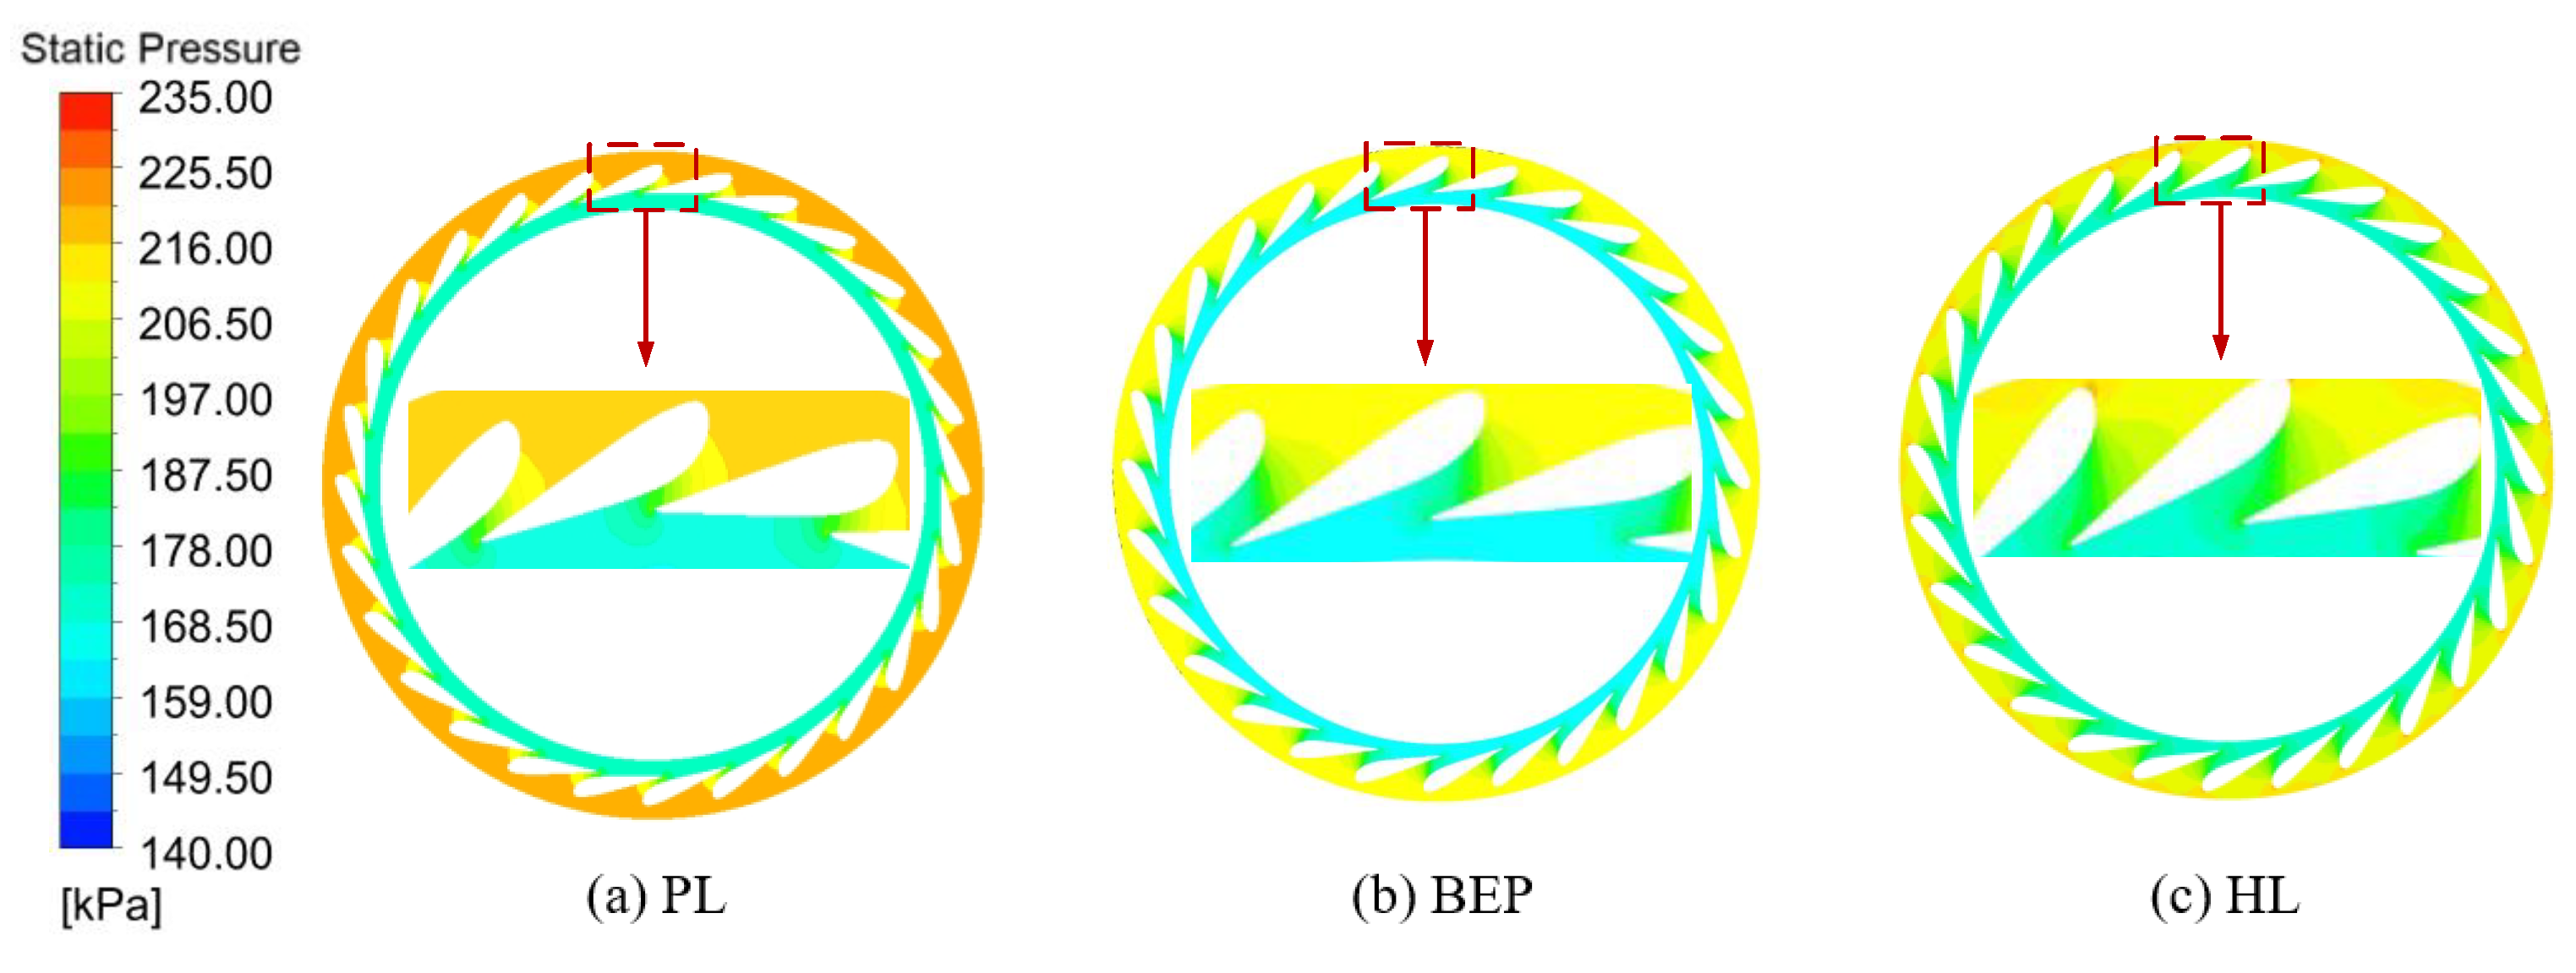
The static pressure field characteristics of the guide vane under the three operating conditions are illustrated in Figure 12. In all cases, the pressure on the pressure side (back side) of the guide vane is higher than that on the suction side (front side). As the water flow enters the runner at an appropriate angle, its velocity increases while passing through the guide vane, leading to a gradual radial decrease in pressure from the inlet to the outlet. At the inlet of the guide vane, the pressure decreases from 235 kPa under the PL operating condition to 216 kPa under the HL condition. At the PL operating point, the maximum pressure in the leading-edge region of the guide vane reaches 235 kPa. As the water exits the guide vane, the pressure drops to 165 kPa, resulting in a maximum pressure differential of 67 kPa.
(2)
Runner
The static pressure distributions of the runner (Z = 0 plane) under three different load conditions of the unit are shown in Figure 13. As the pressure energy and a portion of the kinetic energy of the water flow are converted into rotational mechanical energy to drive the runner, the pressure gradually decreases from the inlet to the outlet of the runner. The highest pressure is observed in the leading-edge region of the pressure surface. Under the PL operating condition, the pressure drops from 190 kPa at the runner inlet to 110 kPa at the outlet, resulting in a pressure difference of 80 kPa. The pressure difference between the BEP and PL operating points is about 50 kPa, indicating that the energy conversion efficiency at the PL condition is relatively low and the energy loss is highest. In contrast, the internal flow state at the BEP operating point is more stable, leading to higher energy conversion efficiency and reduced energy losses.
(3)
Draft tube
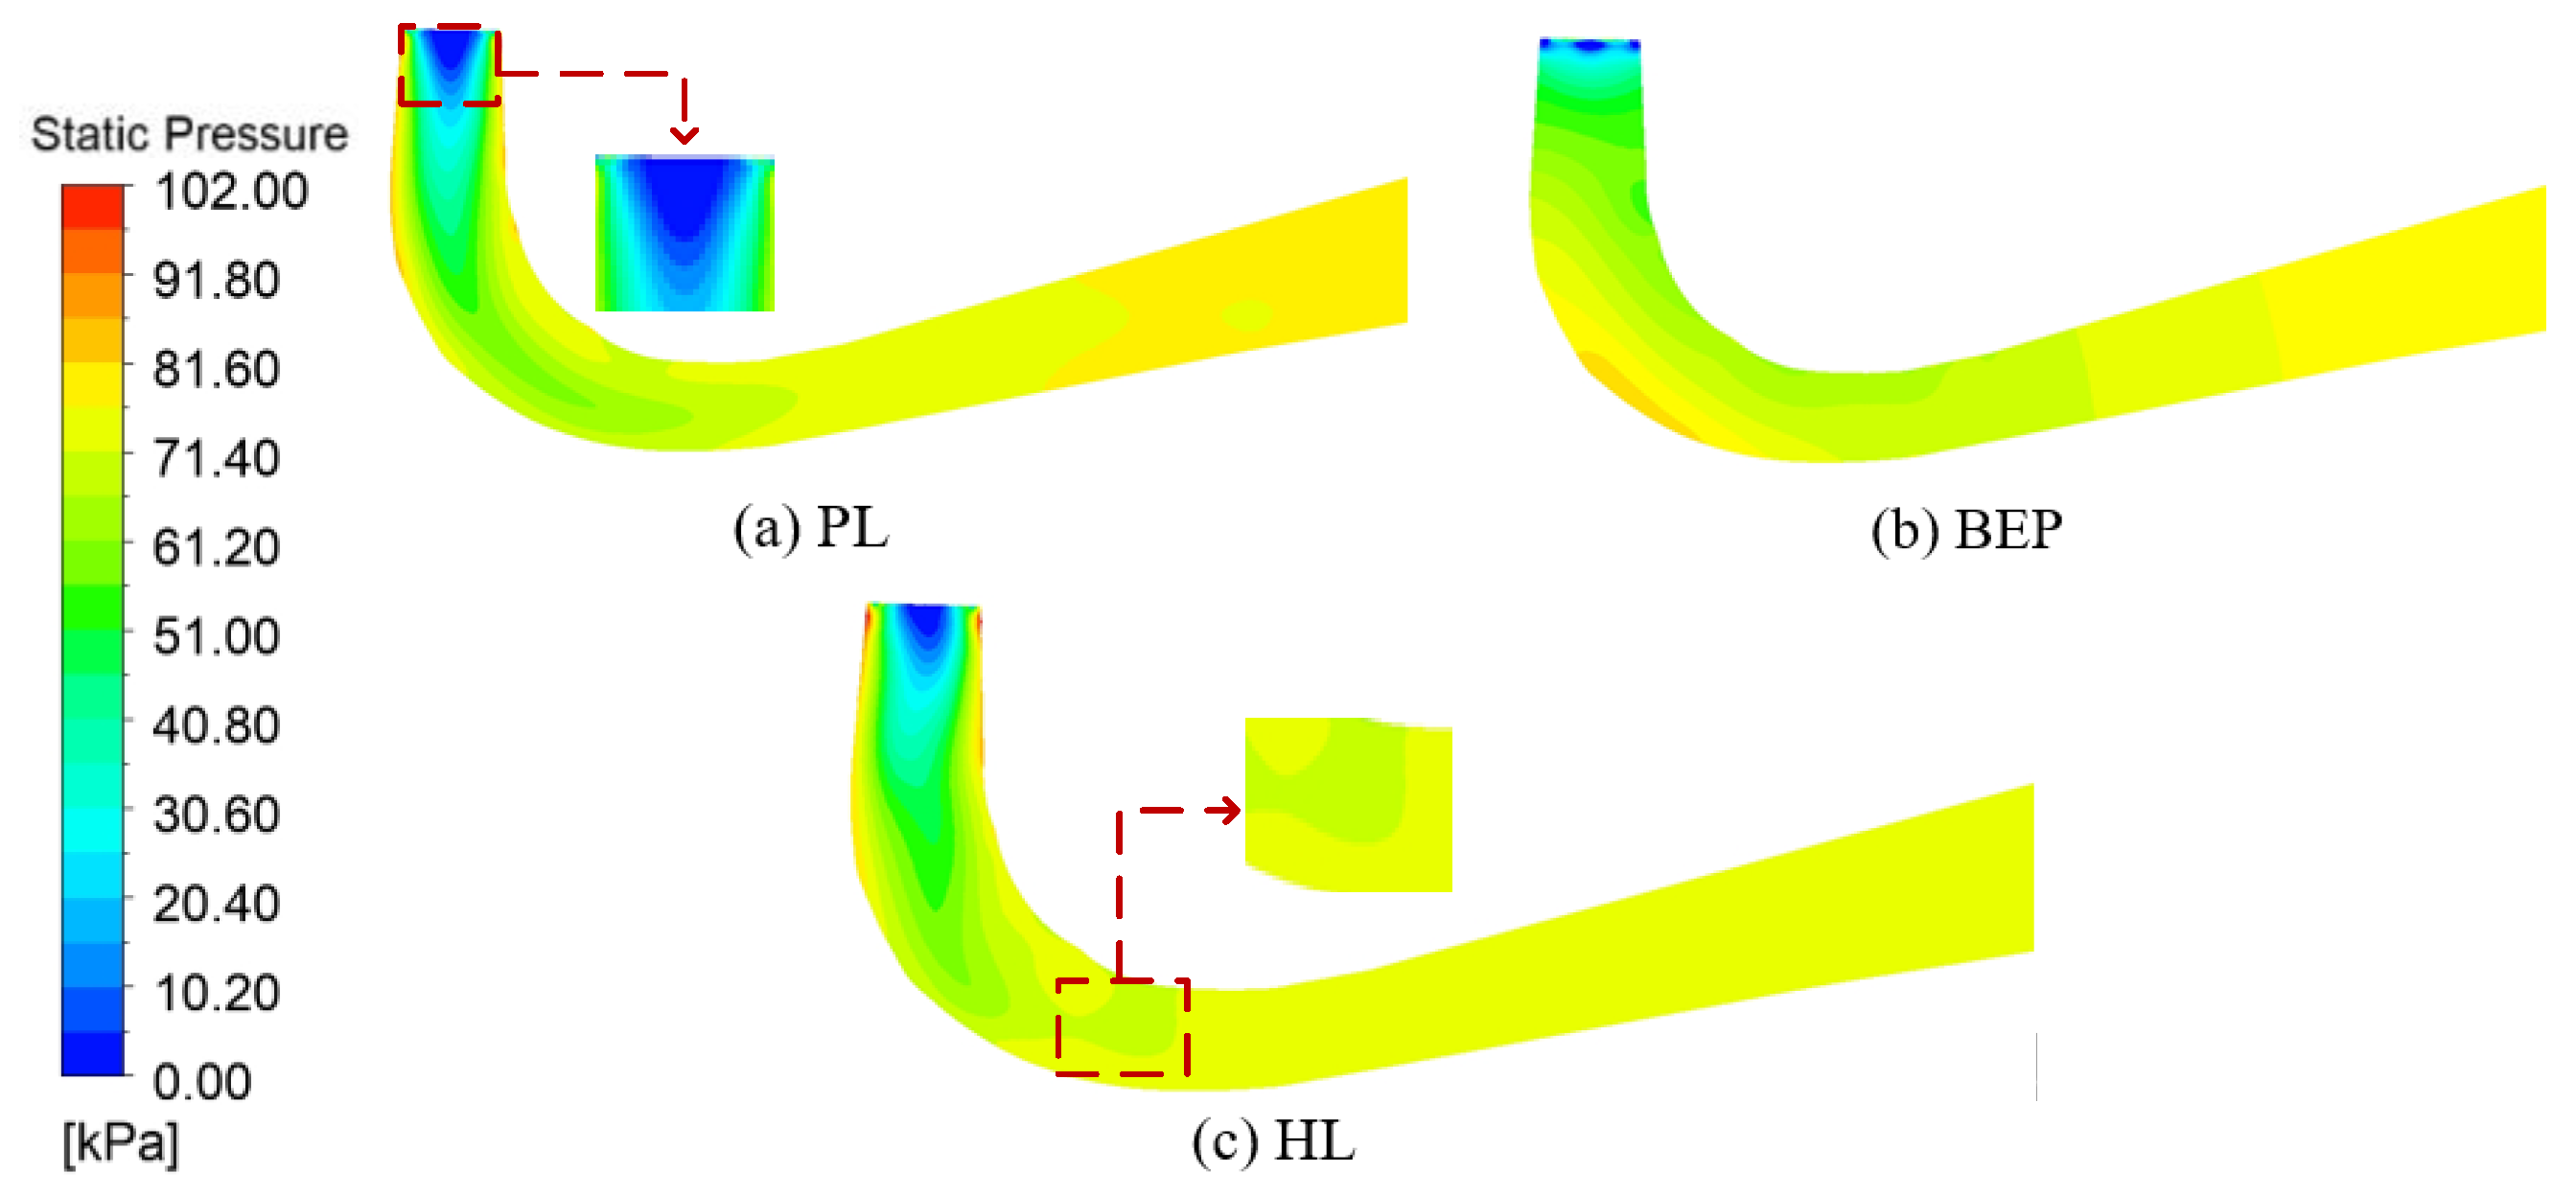
The static pressure field characteristics of the draft tube are displayed in Figure 14. Under the three working conditions, A low-pressure zone is present in the center of the draft tube inlet. Under PL working conditions, the area of the low-pressure zone at the inlet is relatively large, and the pressure tends to increase from the center to the wall surface, with the maximum pressure difference reaching 102 kPa. Under BEP working conditions, the high-pressure area is located mainly in the elbow section area, and the inlet-outlet pressure difference in the draft tube is 90 kPa. There is an obvious pressure gradient at the vortex band in the elbow section of the HL working condition.

4.4. Pressure Pulsation Characteristics

(1)
Stay vane
The frequency domain distributions of the stay vane under the three working conditions are shown in Figure 15. The dominant frequency observed at each monitoring point corresponds to the rotor vane passing frequency at 30fn (fn is the rotation frequency of the rotor). The outlet measurement point is positioned very near the interface between the guide vane and the rotor, rendering it particularly vulnerable to both dynamic and static interference.
Therefore, the amplitude of pulsation gradually increases from the inlet of the stay vane toward the outlet region. During PL operation, the amplitude of the fundamental frequency grows from 0.05% to 0.25%. The secondary frequency observed is 15fn, corresponding to the rotational frequency of the runner’s long blades, with a maximum amplitude of 0.1%. In the HL operating point, the main frequency increases from 0.01% to 0.035%, and the amplitude of the 15fn secondary frequency reaches up to 0.01%. Both the PL and HL operating conditions also exhibit a low-frequency component at 0.2fn, attributed to vortex bands inside the draft tube. When operating at BEP conditions, the primary frequency amplitude increases from 0.01% to 0.035%. Unlike the PL and HL conditions, the BEP condition is primarily affected by the blade passing frequency of the runner, with minimal influence from other sources.
(2)
Active guide vane
The pressure frequency domain distribution in the guide vane region is shown in Figure 16. A comparison with the frequency domain distribution in the fixed guide vane region reveals that the pulsation frequency components under all three operating conditions are consistent between the two regions. However, the pulsation amplitudes at corresponding frequencies differ. Owing to the closer proximity of the to the runner, the pulsation amplitudes in this region are higher than those observed in the fixed guide vane region. In all three operating conditions, the dominant frequency at 30fn is attributed to the dynamic and static interaction amid the runner’s long and short blades. The pulsation amplitudes at 15fn and 30fn exhibit an increasing trend between the inlet and outlet of the guide vane area. Under the PL operating condition, the main frequency amplitude rises from 0.15% to 0.7%, while the secondary frequency amplitude increases from 0.1% to 0.6%. Additionally, low-frequency components resulting from vortex bands in the draft tube are also present. At the BEP operating condition, the main frequency amplitude increases from 0.01% to 0.25%, with the maximum amplitude of the secondary frequency reaching 0.05%. Under the HL condition, the secondary frequency is primarily 0.2fn, caused by vortex bands in the draft tube, and reaches a maximum amplitude of 0.075%.
(3)
Runner
Figure 17 presents the frequency domain diagrams of pressure pulsation within the runner flow channel under three operating conditions. Pressure pulsation in the runner region is primarily induced by the dynamic and static interaction with the guide vane, with the maximum amplitudes occurring near the runner inlet. Under all three conditions, the dominant frequency is 28fn, and as the distance from the guide vane increases, the amplitude of the 28fn component gradually attenuates downstream. At the PL and HL operating points, the secondary frequency is predominantly the low-order frequency of 0.2fn, attributed to vortex bands in the draft tube. Under the PL condition, the amplitude of the main frequency decreases from 0.6% to 0.05%, while the maximum amplitude of the secondary frequency reaches 0.5%. At the PL operating point, the water velocity distribution at the outlet of the runner is uneven, resulting in flow separation. The vortex zone is a spiral cavitation vortex structure formed by the interaction of rotating water flow with axial water flow, the vortex belt periodically swings or rotates within the runner and the draft tube, causing intense pressure pulsations. Therefore, the pressure pulsation amplitude at this working point is higher than that of the other two conditions, it is because there are vortex bands inside the rotor, which are greatly disturbed by the dynamic and static forces of the moving guide vane. At the BEP operating point, the main frequency amplitude decreases from 0.25% to 0.001%, and other frequency interferences are negligible. The trend in main frequency variation under the HL condition is like that of the BEP condition. The secondary frequency under the HL condition mainly originates from the influence of the draft tube, with a maximum amplitude of 0.15%.
(4)
Draft tube
Figure 18 illustrates the frequency domain diagrams of the draft tube region under three operating conditions. Prominent peaks are observed at low-frequency pulsation components of 30fn and 0.2fn across all operating points, indicating that the draft tube is primarily influenced by the single-frequency pulsation generated by rotor rotation and the low-frequency pressure pulsation induced by vortex bands. Compared to other flow-through components, the draft tube exhibits a higher degree of spectral clutter, reflecting greater interference and flow complexity in this region.
At the PL operating point, the maximum low-frequency component at 0.2fn caused by vortex structures in the draft tube reaches an amplitude of 0.6%, occurring near the straight cone section. The secondary frequency is 30fn, resulting from dynamic and static interference between the long and short blades of the runner. The amplitude of this frequency component decreases with increasing distance from the runner. Under the HL operating condition, the highest amplitude of the main frequency is observed in the elbow section of the draft tube, reaching 0.25%, while the secondary frequency remains at 30fn. The amplitude of this secondary component attenuates downstream from an initial value of 0.2%. As the distance from the runner increases—particularly near the elbow section—the secondary frequency component caused by the runner’s dynamic and static interaction becomes nearly undetectable. The frequency domain diagram for the BEP operating point indicates that the maximum amplitude of dynamic and static interference at 30fn reaches 0.1%. Overall, the pressure pulsation amplitudes at the PL operating point are higher than those at both the BEP and HL operating points. This is primarily due to the more chaotic flow within the draft tube and the greater intensity of vortex structures generated under partial load conditions.
The low-frequency pressure pulsation induced by the vortex band may have a coupling effect with the natural frequency of the unit, thereby triggering a resonance phenomenon and intensifying the vibration of the unit. This pressure pulsation will be further transmitted to the rotor area, causing uneven energy transmission of the water flow and ultimately leading to periodic fluctuations in the output power. In addition, the formation of vortex bands will significantly interfere with the stability of the flow field in the draft tube, not only increasing hydraulic losses but also reducing the energy conversion efficiency of the turbine. This phenomenon is particularly prominent when the unit is under partial load conditions.

5. Conclusions

This study utilizes the Francis-99 model turbine, a three-dimensional full-flow channel simulation model, which was established by a refined mesh division. The unsteady flow characteristics under various operating conditions were studied using numerical simulations. The pressure pulsation behavior was analyzed to provide essential stability data for the turbine’s operation under wide-load conditions in real power stations. The main findings and the conclusion are summarized as follows:
(1)
Under all working conditions, the streamline distributions in the spiral casing and stay vane are uniform and symmetrical, with no evidence of flow separation or vortex formation. There is a progressive rise in flow velocity between the spiral casing inlet and the fixed guide vane outlet. Inside the runner, the water flow’s kinetic energy is efficiently transformed into rotational mechanical energy. However, in the areas of the runner and the draft tube, vortex bands are generated at some operating points, resulting in an increase in energy loss. The above research data provides a reference for the in-depth future study of the internal flow and vortex belts in water turbines. Furthermore, these data also serve as a valuable resource for improving the units’ stability, efficiency, and reliability.
(2)
Due to the dynamic and static interference induced by the rotation of the runner, the dominant pressure pulsation frequency within the water guide mechanism is 30fn. The maximum amplitude of this frequency occurs near the bladeless region. The peak amplitudes of the main frequency under the PL, BEP, and HL operating conditions are 0.25%, 0.03%, and 0.035%, respectively. In the runner, the main frequency of 28fn originates from the influence of the guide vane, with the highest amplitude appearing in the inlet region. As the water progresses downstream, the amplitude of this frequency gradually decreases. The runner’s movement causes pressure pulsation. This pulsation is transmitted to components like the draft tube, guide vane, and spiral casing, which leads to unit vibration. However, this phenomenon cannot be eliminated. Therefore, it is necessary to control it within a safe range through design optimization and operation management.
(3)
According to the pressure pulsation data obtained in this paper, the pressure pulsation of the mixed-flow turbine is mainly caused by the dynamic and static interference of the rotor rotation and the vortex band in the draft tube. To effectively control pressure pulsation, the following two technical measures are mainly adopted: one is to suppress the formation process of vortex nuclei, and the other is to restrict the further development of vortex belts. To improve the pressure pulsation inside the turbine, several solutions are available. These are supplementing air to the draft tube, setting up a pressure stabilizing device, or installing a high-frequency pressure sensor. Furthermore, the air replenishment system or load adjustment should be triggered during the initial stage of the turbine belt’s operation. Avoid extended operation in load ranges where vortex belts are likely to occur. Alternatively, prevent vortex belt formation by adjusting parameters like guide vane opening and rotational speed. Both measures are necessary to ensure stable operation.

Author Contributions

Y.X.: formal analysis, visualization, writing—review and editing; Z.L.: formal analysis, visualization; X.L.: validation, formal analysis, visualization, software, data curation; X.D.: validation, formal analysis, visualization, supervision; J.P.: resources, supervision, supervision, data curation, and funding acquisition. All authors have read and agreed to the published version of the manuscript.

Funding

This project was funded by China Yangtze Power Co., Ltd. (Contract 478 No. Z152302056).

Data Availability Statement

The original contributions presented in this study are included in the article. Further inquiries can be directed to the corresponding author.

Conflicts of Interest

This study is a collaborative effort between Xihua University and China Yangtze Power Co., Ltd. Author Zhenming Lai was employed by Power China Hydropower Development Group Co., Ltd. The authors declare that the research was conducted in the absence of any commercial or financial relationships. The China Yangtze Power Co., Ltd. had no role in the design of the study; in the collection, analyses, or interpretation of data; in the writing of the manuscript, or in the decision to publish the results.

References

  1. Jhankal, N.K.; Kumar, A. Experimental investigations of pressure fluctuations in low-head francis turbine model. Proc. Inst. Mech. Eng. Part A J. Power Energy 2024, 238, 1321–1337. [Google Scholar] [CrossRef]
  2. Li, J.; Liu, Q.; Wang, W.; Song, X.; Wang, Z.; Zhu, D.; Tao, R. Pressure pulsation test of Wanjiazhai Francis turbine at different loads. J. Phys. Conf. Ser. 2024, 2707, 012059. [Google Scholar] [CrossRef]
  3. Jamali, R.; Sohani, A.; Hemmatpour, K.; Behrang, M.; Ghobeity, A. Experimental study of pressure pulsation in a large-scale hydropower plant with Francis turbine units and a common penstock. Energy Convers. Manag. X 2022, 16, 100308. [Google Scholar] [CrossRef]
  4. Favrel, A.; Nicolle, J.; Morissette, J.F.; Giroux, A.M. On the correlation between runner blade dynamic stresses and pressure fluctuations in a prototype Francis turbine. IOP Conf. Ser. Earth Environ. Sci. 2022, 1079, 012115. [Google Scholar] [CrossRef]
  5. Iliev, I.; Trivedi, C.; Agnalt, E.; Dahlhaug, O.G. Variable-speed operation and pressure pulsations in a Francis turbine and a pump-turbine. IOP Conf. Ser. Earth Environ. Sci. 2019, 240, 072034. [Google Scholar] [CrossRef]
  6. Wang, D.; Li, Z.; Zhao, Q.; Li, D.; Deng, W.; Ji, L.; Peng, S. Pressure pulsation analysis of runner and draft tube of pump turbine under different working conditions. IOP Conf. Ser. Earth Environ. Sci. 2022, 1037, 012036. [Google Scholar] [CrossRef]
  7. Pang, J.; Yao, B.; Liu, X.; Li, J.; Xiao, M.; Jiang, D.; Tang, W.; Zhou, L.; Lai, Z. Influence of guide vane opening on channel vortex and pressure pulsation in Francis turbine runners. Phys. Fluids 2024, 36, 043325. [Google Scholar] [CrossRef]
  8. Guo, B.; Yu, R.; Ye, Y.; Li, X.; Xiao, Y. Experimental analysis of the pressure fluctuations for a prototype pump-turbine at different operating conditions. J. Phys. Conf. Ser. 2024, 2752, 012039. [Google Scholar] [CrossRef]
  9. Yang, J.; Liu, X.; Pang, J.; Song, H.; Peng, Y.; Xu, L. Numerical study on the Pressure Pulsation Characteristics of the Turbine in Yangjiawan Hydropower Station in the Multi-energy Complementary Power Generation System. Hydropower Pumped Storage 2021, 7, 59–63. [Google Scholar]
  10. Song, H.; Pang, J.; Wang, H. The influence of guide vane opening on the pressure pulsation characteristics of mixed-flow turbines. Gansu Water Resour. Hydropower Technol. 2021, 57, 44–48. [Google Scholar] [CrossRef]
  11. Zheng, X.B.; Sun, S.H.; Wang, Z.R.; Ren, P.; Qin, Z.L.; Yu, Y.; Zhou, H. Study on partial load vortex and pressure pulsation characteristics of Francis turbine. J. Phys. Conf. Ser. 2024, 2752, 012018. [Google Scholar] [CrossRef]
  12. Gohil, P.P.; Saini, R.P. Investigation into cavitation damage potentiality using pressure pulsation phenomena in a low head Francis turbine for small hydropower schemes. Ocean Eng. 2022, 263, 112230. [Google Scholar] [CrossRef]
  13. Sannes, D.B.; Iliev, I.; Agnalt, E.; Dahlhaug, O.G. Pressure pulsation in a high head Francis turbine operating at variable speed. J. Phys. Conf. Ser. 2018, 1042, 012005. [Google Scholar] [CrossRef]
  14. Sonin, V.; Ustimenko, A.; Kuibin, P.; Litvinov, I.; Shtork, S. Study of the velocity distribution influence upon the pressure pulsations in draft tube model of hydro-turbine. IOP Conf. Ser. Earth Environ. Sci. 2016, 49, 082020. [Google Scholar] [CrossRef]
  15. Shi, F.; Yang, J.; Wang, X. Analysis on characteristic of pressure fluctuation in hydraulic turbine with guide vane. Int. J. Fluid Mach. Syst. 2016, 9, 237–244. [Google Scholar] [CrossRef]
  16. Chen, T.J.; Wu, X.J.; Liu, J.T.; Wu, Y.L. Prediction of pressure fluctuation of a hydraulic turbine at no-load condition. IOP Conf. Ser. Mater. Sci. Eng. 2015, 72, 042049. [Google Scholar] [CrossRef]
  17. Minakov, A.V.; Platonov, D.V.; Dekterev, A.A.; Sentyabov, A.V.; Zakharov, A.V. The analysis of unsteady flow structure and low frequency pressure pulsations in the high-head Francis turbines. Int. J. Heat Fluid Flow 2015, 53, 183–194. [Google Scholar] [CrossRef]
  18. Pang, J.; Liu, X.; Song, H.; Deng, H.; Yang, H.; Peng, Y.; Yang, J. Research on the Working Condition stability of the mixed-flow Turbine Based on the Water-light-storage complementary Combined power generation System in the Ultra-low output Zone. Hydropower Pumped Storage 2021, 7, 39–46. [Google Scholar]
  19. Ye, C.; Yuan, L.; Tan, J.; Gong, L.; Liu, R.; Deng, X. Research on Pressure Pulsation in the Vortex Zone of Medium and Low Head Mixed-Flow Turbines. Yangtze River 2025, 56, 158–166+182. [Google Scholar] [CrossRef]
  20. Li, S.; Pang, J.; Dan, C.; Xiang, W.; Yi, X.; Liu, X. Influence of Load Variation on the Flow Field and Stability of the Francis Turbine. J. Mar. Sci. Eng. 2025, 13, 316. [Google Scholar] [CrossRef]
  21. Trivedi, C.; Cervantes, M.J.; Dahlhaug, O.G. Experimental and numerical studies of a high-head Francis turbine: A review of the Francis-99 test case. Energies 2016, 9, 74. [Google Scholar] [CrossRef]
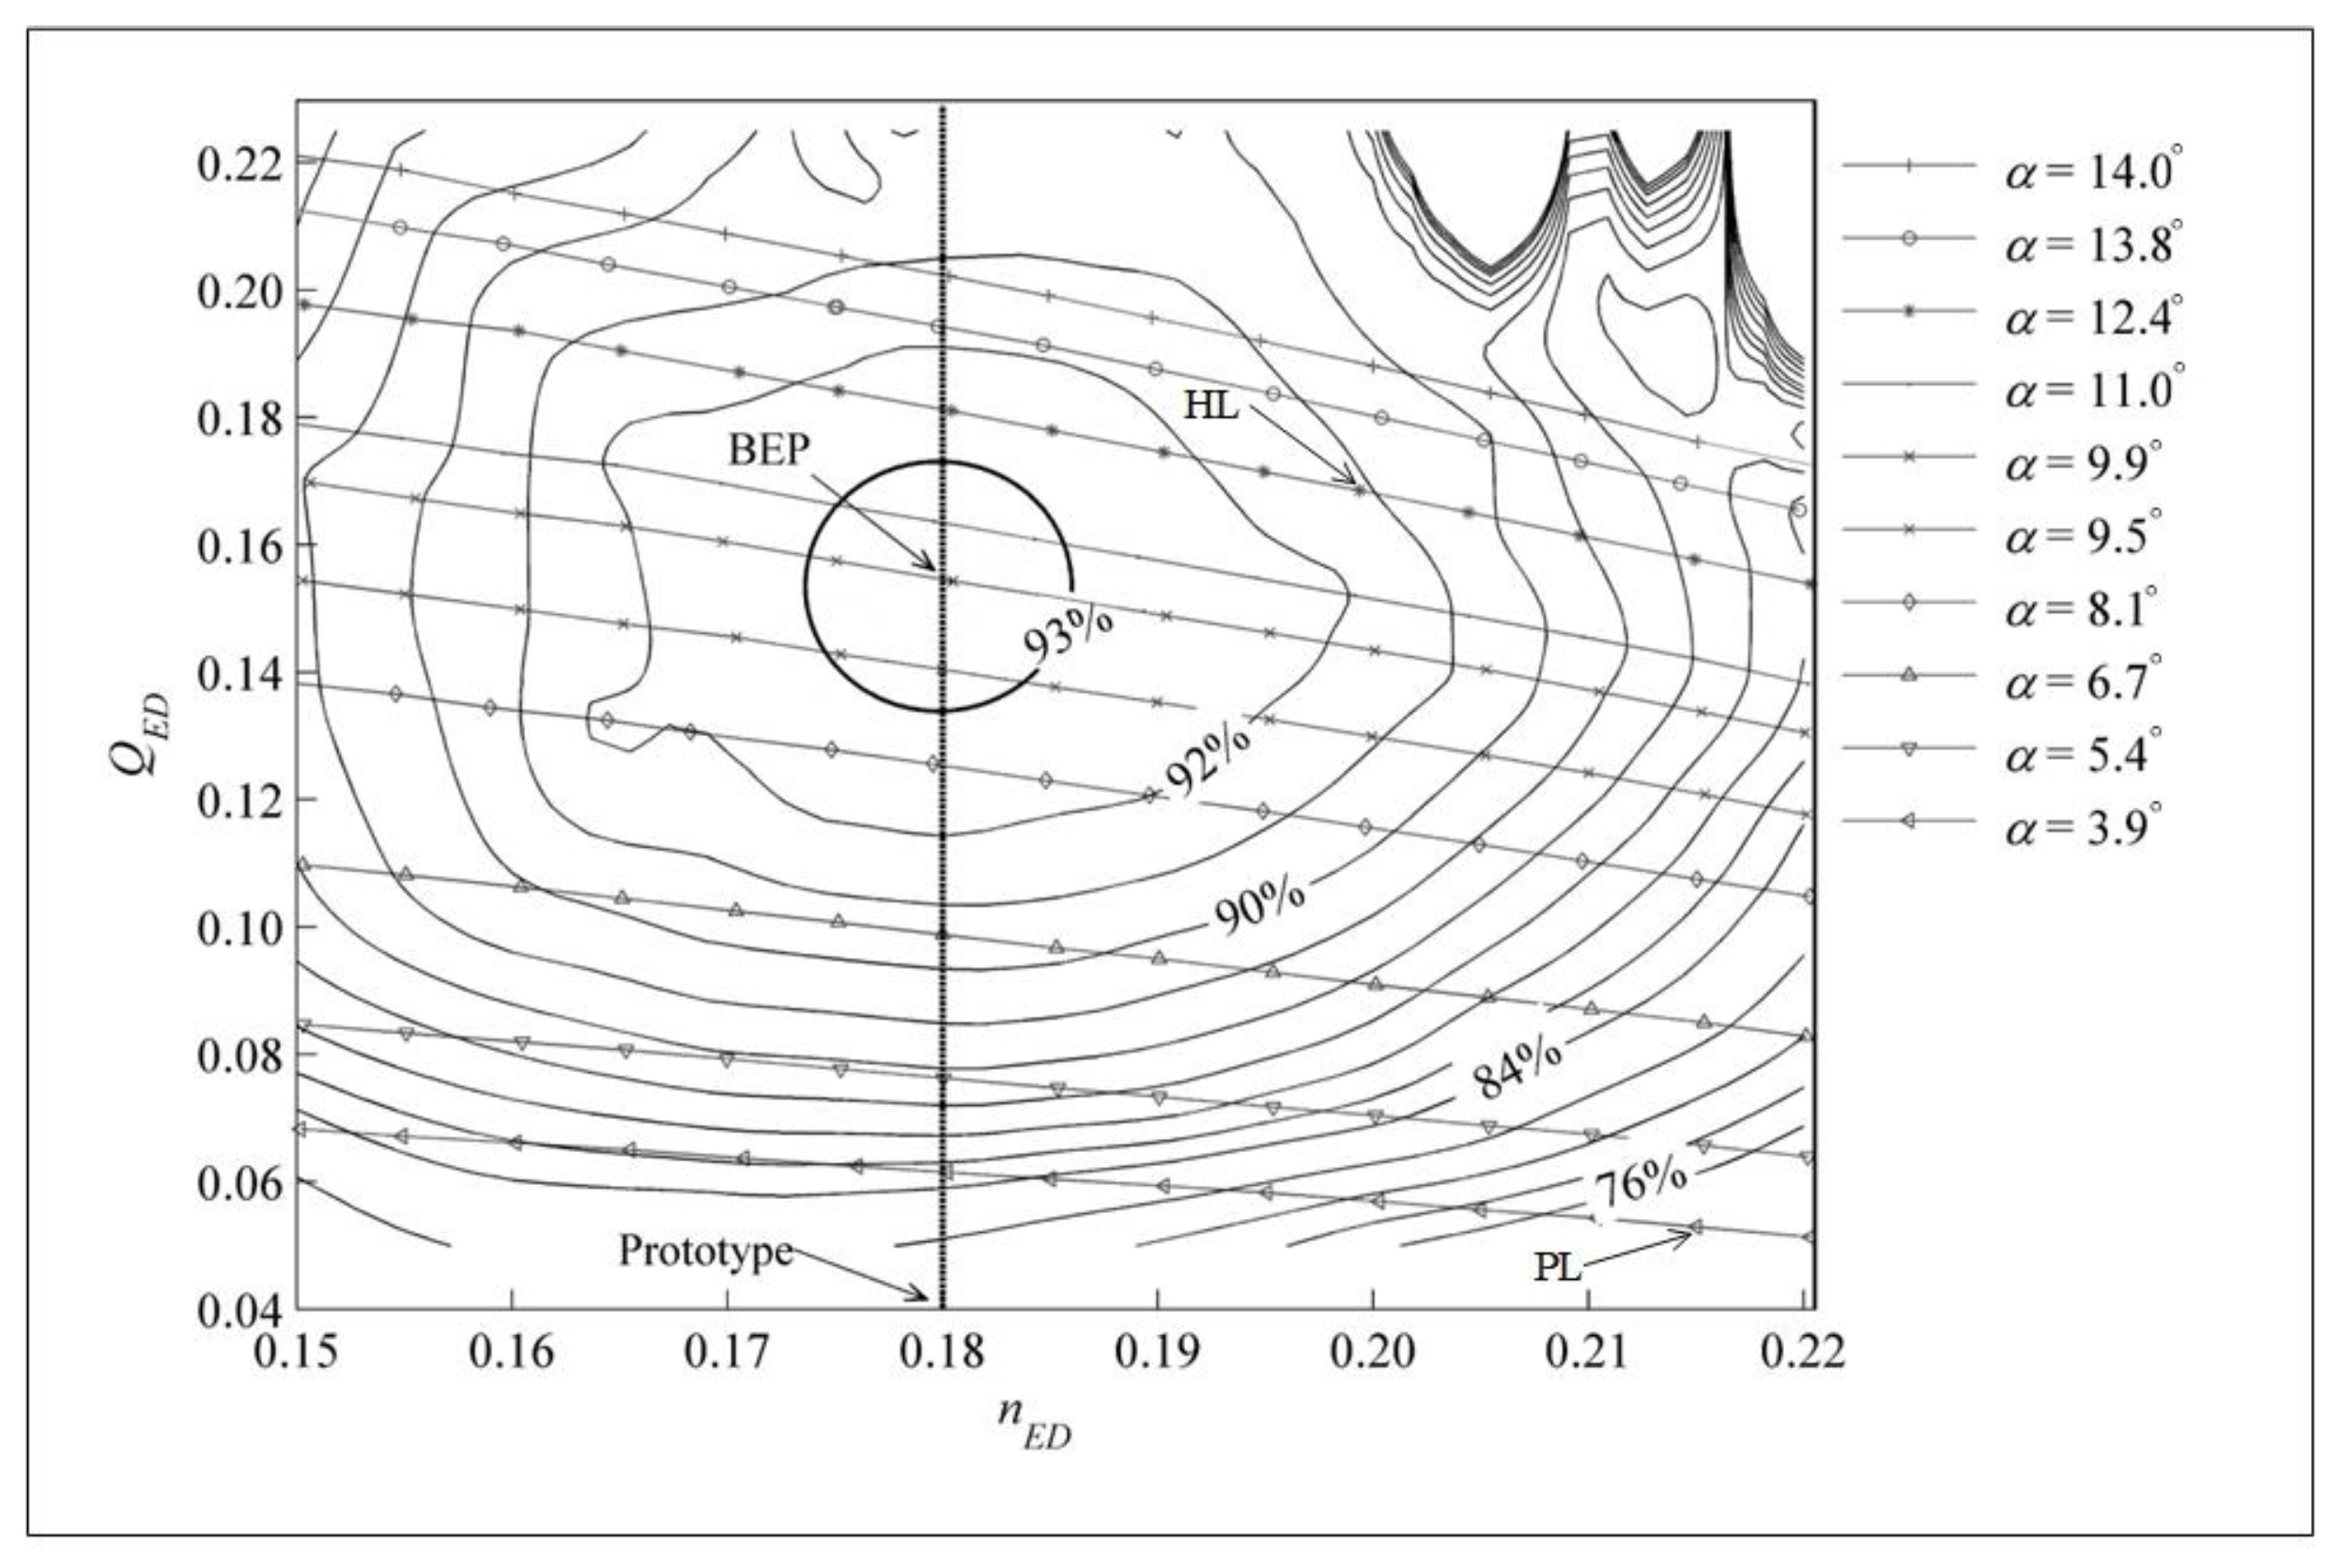
Figure 1. Hill chart of the high-head Francis-99 turbine model.
Processes 13 02939 g001
Figure 2. Calculation domain of three-dimensional water body model of turbine.
Processes 13 02939 g002
Figure 3. Three-dimensional mesh grid for the hydraulic turbine simulation domain. (a) Runner basin grid. (b) Spiral casing and stay vane basin grid. (c) Guide vane basin grid. (d) Draft tube basin grid.
Processes 13 02939 g003aProcesses 13 02939 g003b
Figure 4. Grid independence test.
Processes 13 02939 g004
Figure 5. Pressure fluctuation monitoring points of turbine flow components. (a) Stay vane monitoring points. (b) Guide vane monitoring point. (c) Runner blades monitoring points. (d) Draft tube monitoring point.
Processes 13 02939 g005aProcesses 13 02939 g005b
Figure 6. Comparison of experimental and numerical values of hydraulic efficiency under part-load, BEP, and high-load operating conditions [21].
Processes 13 02939 g006
Figure 7. Relative velocity distributions of the spiral casing and stay vane.
Processes 13 02939 g007
Figure 8. Relative velocity distribution diagram of the guide vane.
Processes 13 02939 g008
Figure 9. Relative velocity distribution diagram of the runner.
Processes 13 02939 g009
Figure 10. Relative velocity distribution diagram of the draft tube vane.
Processes 13 02939 g010
Figure 11. Static pressure distributions of the spiral casing and stay vane.
Processes 13 02939 g011
Figure 12. Static pressure distribution diagram of the guide vane.
Processes 13 02939 g012
Figure 13. Static pressure distribution diagram of the runner.
Processes 13 02939 g013
Figure 14. Static pressure distribution diagram of the draft tube vane.
Processes 13 02939 g014
Figure 15. Frequency domain diagram of fixed guide vane region pressure fluctuations.
Processes 13 02939 g015
Figure 16. Frequency domain diagram of the fluctuation of the active guide vane region pressure fluctuation.
Processes 13 02939 g016
Figure 17. Frequency domain diagram of runner region pressure fluctuations.
Processes 13 02939 g017
Figure 18. Frequency domain representation of pressure changes in the draft tube region.
Processes 13 02939 g018
Table 1. Fundamental parameters of the Francis 99 model turbine.
ParameterValue
Runner diameter (m)0.349
Guide vane count28
Stay vane count14
Short blades count15
Long blades count15
Table 2. Number of computational domain mesh.
ParameterNumber of Grids
Spiral casing and stay vane2,346,342
Guide vane2,033,191
Runner2,627,719
Draft tube1,751,812
Table 3. Model turbine boundary condition parameter table for each case.
ParameterWorking Condition 1 (PL)Working Condition 2
(BEP)
Working Condition 3
(HL)
Hydrostatic head (m)12.2911.9111.24
Flow rate (m3/s)0.0710.2030.221
Guide blade angle (°)3.919.8412.44
Inlet velocity boundary (m/s)0.8142.3282.534
Pressure outlet (kPa)99.54101.5695.98
Runner speed (rpm)406.2335.4369.6
Table 4. Experimental and numerical comparison of hydraulic efficiency at three operating points.
ParameterExperiment Hydraulic
Efficiencies (%)
Numerical Simulation
Hydraulic Efficiencies
Pressure Inlet (kPa)
PL71.6976.224.53
BEP92.6192.630.02
HL90.6694.23.54
Disclaimer/Publisher’s Note: The statements, opinions and data contained in all publications are solely those of the individual author(s) and contributor(s) and not of MDPI and/or the editor(s). MDPI and/or the editor(s) disclaim responsibility for any injury to people or property resulting from any ideas, methods, instructions or products referred to in the content.