Article

Multi-Objective Black-Start Planning for Distribution Networks with Grid-Forming Storage: A Control-Constrained NSGA-III Framework

1
State Grid Jibei Electric Power Research Institute, Beijing 100045, China
2
Department of Automatic Control and Complex Systems (AKS), Faculty of Engineering, University of Duisburg–Essen, 47057 Duisburg, Germany
3
School of Electrical and Control Engineering, North China University of Technology, Beijing 100144, China
*
Author to whom correspondence should be addressed.
Processes 2025, 13(9), 2875; https://doi.org/10.3390/pr13092875
Submission received: 18 June 2025 / Revised: 17 July 2025 / Accepted: 25 August 2025 / Published: 9 September 2025

Abstract

The increasing frequency of climate- and cyber-induced blackouts in modern distribution networks calls for restoration strategies that are both resilient and control-aware. Traditional black-start schemes, based on predefined energization sequences from synchronous machines, are inadequate for inverter-dominated grids characterized by high penetration of distributed energy resources and limited system inertia. This paper proposes a novel multi-layered black-start planning framework that explicitly incorporates the dynamic capabilities and operational constraints of grid-forming energy storage systems (GFESs). The approach formulates a multi-objective optimization problem solved via the Non-Dominated Sorting Genetic Algorithm III (NSGA-III), jointly minimizing total restoration time, voltage–frequency deviations, and maximizing early-stage load recovery. A graph-theoretic partitioning module identifies restoration subgrids based on topological cohesion, critical load density, and GFES proximity, enabling localized energization and autonomous island formation. Restoration path planning is embedded as a mixed-integer constraint layer, enforcing synchronization stability, surge current thresholds, voltage drop limits, and dispatch-dependent GFES constraints such as SoC evolution and droop-based frequency support. The model is evaluated on a modified IEEE 123-bus system with five distributed GFES units under multiple blackout scenarios. Simulation results show that the proposed method achieves up to 31% faster restoration and 46% higher voltage compliance compared to MILP and heuristic baselines, while maintaining strict adherence to dynamic safety constraints. The framework yields a diverse Pareto frontier of feasible restoration strategies and provides actionable insights into the coordination of distributed grid-forming resources for decentralized black-start planning. These results demonstrate that control-aware, partition-driven optimization is essential for scalable, safe, and fast restoration in the next generation of resilient power systems.

1. Introduction

The increasing fragility of power systems in the face of systemic stress events has elevated the importance of black-start planning as a cornerstone of grid resilience. Whether caused by large-scale weather disasters—such as wildfires, winter storms, or hurricanes—or by targeted cyberattacks and aging infrastructure failures, wide-area blackouts are becoming more frequent, longer in duration, and more complex to recover from [1,2]. In these scenarios, the speed, reliability, and coordination of black-start operations directly determine the economic and social consequences of the disruption. Historically, the restoration of the power grid following a blackout has relied on a small set of designated black-start generators—typically hydro or diesel units—operated in a tightly choreographed sequence to progressively energize the network [3,4]. These classical black-start schemes are rooted in a centralized architecture with static priorities, pre-configured topologies, and a limited diversity of controllable elements.
However, the transformation of the modern power grid—driven by the proliferation of distributed energy resources (DERs), inverter-based generation, and the decentralization of storage—has upended many of the assumptions on which traditional black-start methods are built [5,6]. Distribution systems now often include a high penetration of photovoltaic arrays, behind-the-meter batteries, and microgrid-capable infrastructure, all of which alter the dynamics of post-contingency restoration [7]. More critically, these assets are no longer passive endpoints; they increasingly participate in active grid-forming behavior, enabling voltage and frequency reference establishment at the distribution level [8,9]. Yet, despite these paradigm shifts, the majority of existing black-start models remain rooted in top-down, synchronous machine-based assumptions and fail to incorporate the capabilities, constraints, and control behaviors of emerging technologies.
A particularly promising but underutilized class of assets in this context is the grid-forming energy storage system (GFES) [10,11]. Distinguished from grid-following devices by their ability to autonomously regulate voltage and frequency without relying on external references, GFES units can initiate islanded operation, provide virtual inertia, and maintain power balance in weak or unenergized grids. Their relevance to black-start applications is evident: they can serve as voltage anchors, synchronize island clusters, and support downstream loads with high ramping flexibility [3,12]. Recent experimental and simulation studies have validated the ability of GFES to sustain microgrids, ride through disturbances, and regulate dynamic behavior during isolated operation. Yet, to date, these capabilities have been explored mostly in isolated control studies or microgrid testbeds, and not within the context of large-scale, system-wide black-start planning.
In the broader literature, black-start planning has traditionally been modeled as a sequential optimization problem over energization paths [13,14]. These formulations range from combinatorial search over reclosure sequences to mixed-integer linear programming (MILP) that enforces power flow, radiality, and voltage constraints. Some models have included reliability or risk-aware metrics to prioritize restoration under uncertainty [15,16]. However, very few models in this domain accommodate the hybrid nature of today’s grid, where inverter-based resources must operate autonomously and reactively to dynamic grid conditions. Most critically, existing black-start formulations do not account for the fundamental control limitations of GFES: limited state-of-charge availability, black-start current injection thresholds, droop control bandwidths, and synchronization-phase stability margins. Without explicitly modeling these characteristics, any restoration plan remains incomplete and potentially infeasible [17,18].
Beyond the limitations in control modeling, there is a methodological gap in the way restoration objectives are formulated. Traditional black-start models optimize a scalar objective—typically total restoration time or load pickup—without considering the multi-objective nature of modern resilience planning. In reality, grid operators must simultaneously balance speed, stability, coverage, and dynamic safety. In response to this challenge, the power system literature has increasingly turned to multi-objective evolutionary algorithms (MOEAs) as a means of exploring trade-offs across conflicting performance metrics [19,20]. Among these, the Non-Dominated Sorting Genetic Algorithm III (NSGA-III) has gained prominence due to its ability to handle many-objective formulations and maintain solution diversity in high-dimensional Pareto spaces [21,22]. NSGA-III builds upon earlier generations of MOEAs by using reference-point-based niche preservation, enabling better sampling of the Pareto front, particularly when dealing with more than three objectives. In power systems research, NSGA-III has been applied to generation dispatch, renewable integration planning, electric vehicle charging coordination, and multi-area power exchange [23,24]. Yet, its application to black-start planning remains rare, and the few instances that exist often neglect the integration of physical models such as graph-based network representations, inverter control dynamics, or dispatch-constrained storage operations. There is thus a strong case for developing a black-start planning framework that fuses NSGA-III with topological restoration modeling and inverter-aware constraints, providing both optimization power and practical feasibility. The increasing complexity of distribution-level restoration tasks—driven by the proliferation of distributed energy resources [25], bidirectional power flows, and inverter-based control dynamics—further amplifies the need for multi-dimensional optimization [26]. Scenarios involving partial infrastructure loss, uncertainty in fault clearing times, and the sequential activation of black-start units demand a planning framework that goes beyond single-metric evaluation. NSGA-III’s ability to maintain a well-distributed Pareto front under many-objective settings makes it particularly suitable for resilience-aware dispatch decisions [27]. Moreover, its reference-point-driven search logic allows system planners to embed policy preferences—such as prioritizing critical loads or minimizing switching operations—directly into the optimization process [28,29]. These features position NSGA-III as not merely a tool for trade-off exploration, but as a mechanism for operationalizing complex restoration philosophies that reflect the layered priorities of modern power systems. By incorporating it into a restoration model grounded in topological, control, and temporal realism, the planning process gains both computational rigor and practical transparency.
Simultaneously, the growing interest in graph-theoretic methods for restoration offers a complementary direction. Topological resilience analysis, spanning tree formation, vulnerability clustering, and restoration path search have all been explored to model the structural progression of grid re-energization [30]. In these models, researchers typically seek to identify low-risk energization routes, minimize the number of switching actions, or isolate critical loads into self-supplied clusters. However, most of these studies treat the network as a purely structural entity, abstracting away the control and dispatch constraints that determine whether re-energization is physically possible. As such, topological methods alone cannot ensure dynamic feasibility, particularly when GFES units are involved. Voltage compliance, frequency alignment, synchronization phase bounds, and surge current limitations must be jointly modeled with network reconfiguration in order to derive realistic restoration paths.
In response to this need, the present paper proposes a comprehensive, scalable, and control-aware optimization framework for black-start planning in distribution networks with grid-forming storage. Our method consists of three tightly coupled modules. First, we develop a dynamic graph-based partitioning model that divides the system into restoration subgrids based on nodal vulnerability, critical load mapping, and proximity to GFES units. This allows us to form re-energization clusters that are topologically and functionally viable. Second, we solve a restoration path planning problem that respects synchronization stability, voltage drop constraints, and line overload margins, ensuring that energization sequences are feasible under post-fault conditions. Third, we embed this structure into a multi-objective NSGA-III optimizer that balances the minimization of restoration time, the maximization of critical load coverage, and the suppression of transient voltage and frequency violations.
What sets this paper apart is not only the incorporation of GFES devices into black-start modeling but the deep integration of their dispatch-dependent control limits directly into the optimization layer. This includes SoC evolution, droop-based frequency sensitivity, inrush current bounds, and synchronization phase coherence—all of which are modeled as hard constraints. By doing so, we bridge the long-standing gap between control engineering and system-level restoration planning. Furthermore, our encoding strategy for NSGA-III is designed to preserve graph topology, storage allocation, and energization sequences simultaneously, enabling scalable search across large distribution networks with dozens of GFES units and high DER density. The framework is validated on a modified IEEE 123-bus feeder system that includes five strategically located GFES devices and simulated blackout scenarios involving both random component failures and cascading line outages. Results show that the proposed method achieves significantly lower restoration times, better early-stage voltage compliance, and higher critical load coverage than benchmark MILP and heuristic methods. More importantly, the solutions exhibit operational realism, respecting transient limits and synchronizing microgrids with minimal overshoot or reclosure failure. By offering a holistic, multi-layered, and control-aware solution to black-start planning, this study advances both the theory and practice of grid restoration. It contributes to the ongoing evolution of power systems from rigid, centralized architectures to flexible, inverter-dominated ecosystems capable of autonomous recovery. The methods proposed herein provide a new foundation for utilities and planners seeking to integrate advanced storage technologies and distributed restoration schemes into their emergency preparedness toolkits. This is particularly relevant for systems facing compounding risks of climate change, cyber intrusion, and DER-induced complexity—where flexibility, speed, and safety must be orchestrated together in a single, coherent framework.

2. Problem Formulation

To initiate the formulation of the black-start scheduling problem, it is essential to first define the decision space and core optimization variables. The system is modeled as a distribution-level network with a set of nodes and edges, each representing a physical component such as a substation, feeder, or distributed energy resource. During restoration, the operational state of each element evolves over time depending on its controllability, interconnection, and recovery constraints. Accordingly, the following mathematical formulation encodes the topology-aware, time-indexed optimization model that governs the selection of restoration actions, subject to network constraints and resilience-oriented objectives. This model forms the foundation for the proposed NSGA-III-based planning framework.
min τ rest , φ , ψ max κ N τ κ rest + δ κ sync + λ L κ ρ λ rec · χ λ load + ϑ λ stab · σ λ volt
The above objective aims to minimize the worst-case restoration completion timestamp across all nodes κ N , factoring not only the raw re-energization timestamp τ κ rest , but also accounting for required synchronization delays δ κ sync and path-dependent stabilization penalties. For each line λ that forms part of the energization path to κ , the term ρ λ rec · χ λ load captures the restoration-induced load surge risk, while ϑ λ stab · σ λ volt penalizes voltage instabilities, both weighted appropriately to ensure black-start safety and control-friendliness during island formation. This objective function implicitly adheres to restoration feasibility constraints, such as temporal causality, island-forming sequencing, and black-start propagation logic, which are enforced in subsequent constraints.
max ζ , υ , Θ ι N crit t = 0 T max ζ ι , t · ω ι prio · Θ ι gfes · exp α ι · t · 1 υ ι , t drop
Here, we aim to maximize the total weighted restoration value of all critical nodes ι N crit across the planning horizon. The variable ζ ι , t indicates the re-energization status of node ι at time t, weighted by its priority ω ι prio , the grid-forming capability indicator Θ ι gfes , and a time-decaying exponential exp ( α ι · t ) that favors earlier restorations. The term υ ι , t drop penalizes any load dropout or voltage collapse, ensuring only successfully energized and stable nodes contribute to the objective. The formulation assumes that re-energization decisions ζ ι , t and stability status υ ι , t drop must satisfy nodal availability, synchronization timing, and safety interlocks enforced elsewhere in the optimization, including dynamic startup eligibility of GFES units.
min μ , ν 𝚥 N t = 0 T max μ 𝚥 , t V V ¯ 𝚥 · ν 𝚥 , t flag · 1 + log 1 + μ 𝚥 , t V V ¯ 𝚥 V ¯ 𝚥 · 1 1 + κ 𝚥 imp
This expression minimizes the cumulative voltage deviation across all nodes ȷ and time periods t, incorporating an absolute deviation from nominal voltage V ¯ 𝚥 , scaled by a log-saturating penalty function to emphasize large excursions. The binary flag ν 𝚥 , t flag activates the penalty only for energized states, and the node importance score κ 𝚥 imp in the denominator ensures that highly critical buses are prioritized for voltage compliance. The minimization is subject to voltage regulation limits, which constrain μ 𝚥 , t V to lie within permissible bounds [ V min , V max ] , enforced via logical coupling with ν 𝚥 , t flag . Additional constraints ensure sequential consistency of energized states.
min π , ξ , Φ t = 1 T osc n N energ π n , t f f 0 2 · Φ n , t ctrl + ξ n , t damp · d π n , t f d t 2 · 1 + γ n loop η n gfes
The final component of the multi-objective formulation targets the suppression of frequency instability during early-stage re-energization. The term π n , t f f 0 2 penalizes squared frequency deviations from nominal f 0 , scaled by a control authority factor Φ n , t ctrl . The second term quantifies damping inefficiency via time derivatives of frequency trajectories, modulated by ξ n , t damp , the loop gain γ n loop , and the inverse of the grid-forming capability η n gfes . This term ensures that GFES units with stronger frequency control receive higher responsibility in dynamic regulation. This term operates under the system’s frequency regulation constraints, including upper/lower bounds for π n , t f and derivative smoothing requirements on d π n , t f d t , as well as GFES-specific dynamic support capabilities. These constraints are especially critical during islanding and early-stage reconnection.
l E κ R l 1 · ν κ real ν λ ( l ) real + X l 1 · ν κ imag ν λ ( l ) imag = ϱ κ P + ι κ loss + θ Θ κ ρ θ gfes · ξ θ inj
This is the fundamental real power balance constraint enforced at each node κ , ensuring Kirchhoff’s law holds under complex phasor formulations. The summation over all connected lines includes both resistive and reactive contributions through the real and imaginary nodal voltages ν real and ν imag , while the right-hand side aggregates nodal demand ϱ κ P , conversion losses ι κ loss , and total injected power from any GFES units indexed by θ Θ κ . This real power balance is one of several nodal constraints; its enforcement assumes availability of voltage phasors ( ν real , ν imag ) and current injection capabilities from GFES units. Complementary constraints ensure reactive power balance, line current limits, and radiality are preserved.
I θ bs · I θ max χ D θ ς χ start · S χ rated V χ init · β χ surge
This black-start feasibility constraint requires that any GFES unit θ marked for startup status ( I θ bs = 1 ) must be capable of handling the inrush surge currents associated with downstream load blocks χ . Each term under the summation models the starting demand via rated apparent power S χ rated , initial voltage V χ init , and the surge coefficient β χ surge , thus encapsulating transient stress limits imposed on black-start units. The inequality is part of a broader set of constraints that govern black-start viability. These include binary activation limits on I θ bs , mutual exclusivity of GFES engagement, startup sequencing policies, and transformer energization thresholds to ensure transient current withstand capacity.
ϵ θ , τ + 1 SoC = ϵ θ , τ SoC 1 Δ t · p θ , τ dis η θ dis η θ ch · p θ , τ ch , θ Θ , τ T
The temporal state-of-charge dynamics of each GFES unit θ evolve across time periods τ by accounting for both discharging and charging energy flows. The discharging power p θ , τ dis is scaled by the inverse of efficiency η θ dis , while charging power p θ , τ ch is scaled by the charging efficiency η θ ch . This balance guarantees an accurate energy tracking model for dispatch-aware restoration.
p θ , τ dis 2 + q θ , τ dis 2 S θ max 2 , θ Θ , τ T
This is a radial limit constraint on the instantaneous apparent power injection from any GFES unit θ , enforcing that the vector sum of real and reactive output must lie within the unit’s thermal and electrical limit S θ max . This is crucial during initial surge support phases when voltage support and inertial response are simultaneously required.
Δ f n , τ Δ p n , τ = 1 m n droop + k C n f n , τ θ k , τ · d θ k , τ d p n , τ , n N gfes
This frequency–power droop relationship models the inertial frequency response at node n equipped with a GFES device. The primary sensitivity term 1 / m n droop denotes the linear frequency decline under power injection, and the summation captures angular couplings from adjacent bus nodes via dynamic rotor angle derivatives. This equation is indispensable for simulating real-time control behavior of droop-enabled grid-forming inverters during island growth.
V ̲ n · δ n , τ on V n , τ V ¯ n · δ n , τ on , n N , τ T
Voltage security margins are strictly maintained for all energized nodes n at time τ , using binary indicators δ n , τ on to enforce meaningful bounds only when the bus is active. The constraints V ̲ n and V ¯ n define the allowed safe operating window for steady-state voltages, preventing overvoltages or collapses that might propagate instability.
ϕ n , τ energ ϕ m , τ ref ϵ sync , ( n , m ) E boundary , τ T
This constraint maintains synchronization feasibility across energized and de-energized region boundaries. Specifically, the absolute phase angle difference | ϕ n , τ energ ϕ m , τ ref | must remain within a tolerance ϵ sync , representing the permissible angular mismatch for successful safe reclosing, crucial during partial restoration bridging.
I l , τ flow I ¯ l thermal · δ l , τ on , l E , τ T
To ensure that thermal overloads are prevented on re-energized feeders, the actual current I l , τ flow flowing through line is constrained by its thermal capacity I ¯ l thermal , gated by the binary activation status δ l , τ on . This avoids post-restoration cascading failures due to thermal violations.
m N A n , m τ · δ m , τ on δ n , τ on , n N , τ T
This logical consistency constraint ensures that a bus n can only be energized at time τ if there exists at least one active neighbor m with a path connection ( A n , m τ = 1 ). This guarantees radial energization propagation and eliminates orphaned nodes during sequential reclosing actions.
ι P κ Θ ι gfes 1 , κ Z
To enable grid-forming control in each isolated restoration partition P κ N , at least one node ι within that subset must be equipped with an active GFES device ( Θ ι gfes = 1 ). This enforces autonomous startup capability for all subnetworks Z , without reliance on external voltage sources.
n N crit ω n prio · 1 δ n , τ on ξ slack , τ T
This constraint enforces critical load restoration by penalizing any high-priority nodes n N crit left unenergized at each time τ , with slack ξ slack used to control infeasibility and trade-offs. The weight ω n prio reflects mission-critical service importance such as hospitals, data centers, or emergency response centers.

3. Optimization and Algorithmic Framework

The restoration scheduling framework developed in this study is grounded in a multi-objective evolutionary optimization strategy, which reflects the complex and conflicting nature of modern resilience planning. Although multiple mathematical formulations are introduced to represent system-level dynamics—such as grid topology constraints, inverter control behavior, and temporal activation of network elements—the optimization process itself is consistently driven by a unified objective structure. Specifically, three primary goals are pursued in parallel: minimizing the total restoration time, enhancing system resilience through improved voltage and frequency recovery, and ensuring smooth control actions during inverter dispatch and island formation. These objectives are explored simultaneously using a Pareto-based search mechanism, enabling the discovery of balanced solutions under various contingency conditions. The role of the presented equations is to formalize system constraints and behaviors, ensuring that the optimization process operates within realistic physical and operational boundaries. This modeling effort is anchored on a 25-node medium-voltage distribution feeder system, structurally adapted from a simplified segment of the IEEE 123-bus network. The simulated grid incorporates critical system components such as grid-forming energy storage systems, controllable and non-controllable loads, and distributed photovoltaic generation units, spatially distributed to capture realistic feeder heterogeneity. The system’s radial backbone, modular segmentation, and hybrid load typology allow for the emulation of operational challenges under black-start conditions, thereby providing a physically interpretable context for evaluating the performance of decentralized restoration strategies. This foundation ensures that all simulation outputs reflect feasible recovery pathways in the presence of cyber-physical disruptions and variable solar penetration.
χ ( g ) = Ω i path | Θ i gfes | Π i partition | i = 1 , , N pop , g { 0 , , G max }
The evolutionary population at generation g is represented by a collection of chromosomes χ ( g ) , where each individual i encodes three decision layers: energization path vectors Ω i path , grid-forming storage allocation Θ i gfes , and restoration partition configuration Π i partition . This multi-layer encoding enables concurrent evolution of structural, temporal, and spatial aspects of black-start planning within a unified NSGA-III framework.
Ω i , j path ( g ) P graph G energ , κ j sink , Θ i gfes , j = 1 , , | N target |
Each restoration path Ω i , j path ( g ) for target node κ j sink is sampled via a graph-embedded policy P graph , which considers the current energized subgraph G energ and the positions of active GFES nodes. This guarantees that each candidate restoration path is syntactically valid and energetically reachable during chromosome initialization and mutation.
χ ( g + 1 ) = C sbx ( χ ( g ) ) l pm ( χ ( g ) ) , with F feas χ ( g + 1 ) ϵ
The generation of offspring chromosomes proceeds via simulated binary crossover C sbx and polynomial mutation l pm , with subsequent constraint repair and feasibility screening via F feas , which enforces that critical conditions like energization continuity, black-start eligibility, and voltage stability are met before population update.
P i dom = j { 1 , , N pop } | m : O i ( m ) O j ( m ) m : O i ( m ) < O j ( m )
This defines the non-dominated set P i dom for individual i, where dominance is assessed across all objective functions O ( m ) . The condition ensures Pareto compliance: a solution dominates another if it is no worse in all objectives and strictly better in at least one.
R rank ( i ) = min r | i F r , F r = k s = 1 r 1 F s | P k dom =
Here, the Pareto front rank R rank ( i ) is determined by the layer r to which individual i belongs, based on the recursive extraction of non-dominated fronts F r . This provides the dominance level used in elitist survival and niche preservation.
Δ i crowd = m = 1 M O i + 1 ( m ) O i 1 ( m ) O max ( m ) O min ( m ) , sorted by O ( m ) per front
The crowding distance Δ i crowd quantifies the relative density around individual i on the Pareto surface. It ensures diversity in the selected population by preserving solutions from sparsely populated regions during selection.
S next = S elite i F r | | S elite | + | F r | N pop i F r S elite | top N pop | S elite | by Δ i crowd
This survivor selection rule forms the next generation S next by combining current elites and top-ranked Pareto individuals from the newly generated front F r , sorted by crowding distance to promote Pareto front diversity and convergence simultaneously.
η path loss = l Ω path r l v l · I l rest 2 · χ l on · 1 + ζ l surge · γ l trans
This surrogate objective evaluates the restoration path energy loss, considering resistance r l , voltage level v l , surge scaling ζ l surge , and transformer transition stress γ l trans , which influences repair-aware reconfiguration rankings.
δ κ energ = I l Ω κ path , δ l on = 1 θ Θ Θ θ gfes · I θ Ω κ path 1
This binary rule activates node κ only if it is reachable via an active path Ω κ path and at least one GFES unit θ is embedded in the path. It guarantees a logical topology-to-energization mapping during chromosome repair and feasibility testing.
R merge ( r ) = κ N | κ N , Π κ partition Π κ partition dist ( κ , κ ) < ϵ cluster
This partition merging heuristic enforces cohesive spatial groupings during evolutionary updates, ensuring microgrids or subgrids remain topologically tight and not fragmented across disjoint zones, a key feature for practical restoration implementation.
C i penalty = n N V n sim V ¯ n · I V n sim [ V ̲ n , V ¯ n ] + f n sim f 0 · I | f n sim f 0 | > ϵ f
This simulation-based penalty function accumulates voltage and frequency violations during candidate evaluation, ensuring that only dynamically stable configurations are rewarded in the fitness assignment process.
ϵ g gap = max i S ( g ) O i ( 1 ) O i ( 1 , g 1 ) + + O i ( M ) O i ( M , g 1 )
The convergence gap ϵ g gap measures Pareto front stability by comparing current vs. previous generation objective vectors. The algorithm terminates when this metric falls below a fixed threshold across consecutive generations.
F final = NSGA III ( χ ( 0 ) , Crossover : C sbx , Mutation : l pm , Evaluation : O ( 1 ) O ( M ) , Sorting : R rank , Diversity : Δ crowd )
This final invocation encapsulates the entire NSGA-III engine, including its operators, ranking and diversity procedures, and objective evaluation logic, ultimately producing the optimal set F final of black-start planning strategies under safety-constrained and resilience-aware conditions.
Return F final , with selection F = arg min F ω 1 · O ( 1 ) + ω 2 · O ( 2 ) + ω 3 · O ( 3 )
Upon generating the Pareto front, a scalarized post-selection step using weights ω 1 , ω 2 , ω 3 can be used to extract the final recommended solution F , offering utilities a balanced trade-off across competing objectives such as restoration speed, load coverage, and dynamic safety.
To enhance the transparency, efficiency, and operational realism of the restoration modeling process, the proposed framework integrates a deterministic delay-based recovery mechanism and a high-fidelity electromagnetic transient (EMT) validation platform. Instead of relying on probabilistic failure models—such as stochastic failure rates or mean time to repair (MTTR)—each network element impacted by a contingency is assigned a predefined delay parameter τ i . This delay approximates the time required for the affected component (node or line) to become eligible for reconnection, accounting for practical factors such as asset criticality, field accessibility, and crew dispatch priority. For instance, GFES units and critical load nodes are assigned short delays (15–30 min), while peripheral feeders may experience longer delays (up to 90 min). These delay values are embedded into the time-indexed optimization via time gate logic, enabling realistic sequencing of restoration actions without scenario-specific tuning.
To further validate the scheduling performance and dynamic feasibility, a real-time EMT simulation environment was established using the OPAL-RT eMEGAsim platform. The IEEE 123-bus unbalanced system was emulated with detailed models of feeders, GFES, PV inverters, and voltage regulation equipment. All parameters were sourced from open datasets or field-calibrated benchmarks. Inverter-based DERs were modeled with full switching dynamics and droop control, while loads followed time-varying case study profiles. The system operated with a 50 μ s time step, enabling sub-cycle analysis of frequency and voltage responses during black-start, island growth, and reconnection. Restoration behavior governed by the delay logic was monitored in real time under simulated single-phase faults and line outages. The optimization process itself is refined through a diversity-preserving environmental selection strategy and a heuristic-guided initialization based on topological templates. These measures accelerate convergence and maintain broad Pareto diversity, mitigating overfitting risks. While advanced techniques like hierarchical clustering or knowledge-guided mutation are not yet integrated, the modular design allows future incorporation. Collectively, these enhancements—spanning recovery logic, simulation validation, and algorithmic efficiency—ensure that the framework is not only theoretically sound but also practically deployable in distribution system black-start planning.

4. Case Study

To evaluate the proposed black-start planning framework, we conduct a comprehensive case study on a modified version of the IEEE 123-bus distribution test feeder, widely used in restoration and DER integration research due to its structural diversity, high phase unbalance, and realistic loading configurations. The test system includes 123 nodes and 131 distribution lines, configured as a radial three-phase unbalanced network. For this study, we adopt a peak demand profile of 6.42 MW and 3.27 MVAR, scaled based on typical urban feeder loads with critical services (e.g., hospitals, emergency dispatch centers, water pumping stations) distributed across 27 nodes. To reflect increasing DER penetration, we overlay the baseline feeder with 3.8 MW of rooftop PV generation, distributed across 41 nodes following a log-normal spatial distribution calibrated on feeder distance from substation and residential density. Five GFESs are strategically placed at nodes 5, 21, 42, 67, and 98. Each GFES unit is modeled with a 1.2 MW/2.4 MWh rating, droop coefficients of 4% for P–f and 5% for Q–V response, and black-start current capacity limited to 1.5 times the inverter’s rated current. These storage parameters are chosen to represent commercially available advanced inverters (e.g., SMA Sunny Central or Tesla Megapack) equipped with firmware-enabled virtual synchronous control.
Dynamic stability constraints are derived from both static power flow envelopes and surrogate time-domain behavior models calibrated via EMT simulations using OPAL-RT. We define voltage security bands at [0.95, 1.05] p.u. and enforce a transient overshoot limit of ± 7 % during energization based on IEEE 1547.8 recommendations. Synchronization margin is constrained via a phase angle threshold of 10° between adjacent energized and unenergized zones at the point of interconnection. GFES units are assumed to have a default SoC of 65% at the start of restoration, with charging/discharging efficiencies of 94% and thermal ramping rates capped at 0.6 MW/s to reflect realistic inverter dynamics. Line ratings for thermal overload protection are set based on conductor type (AAC/AAAC) and ambient temperature of 35 °C, yielding line current limits in the range of 160 A to 720 A depending on feeder section. For energization path planning, each feeder segment is assigned a synchronization weight, surge current risk factor, and spatial priority based on line impedance, connected load type, and proximity to critical facilities.
The case study is implemented using Python 3.11, with optimization routines built on DEAP 2.0.2 for NSGA-III, coupled with custom graph and constraint libraries developed in NetworkX 3.2.1 and CVXPY 1.4.2. A hybrid numerical–symbolic formulation is used to maintain tractable constraint algebra and allow for parallelized feasibility checking across Pareto candidate solutions. The graph-based partitioning algorithm uses centrality metrics (betweenness, load-weighted eigenvector score) to identify restoration subgrids. Time-domain dynamics for transient constraint calibration are pre-computed using MATLAB/Simulink R2023b. The entire simulation is executed on a high-performance computing server with 2×Intel Xeon Platinum 8268 processors (48 cores total) and 256 GB RAM. All component-level parameters used in the test system are derived from publicly available data sheets and empirical distributions reported in North American urban feeders. For example, GFES units are configured to match the electrical behavior of Tesla Megapack and SMA Sunny Central devices, with surge capabilities, ramping limits, and droop control parameters grounded in field specifications. Thermal line ratings are determined based on actual conductor ampacity tables under 35 °C ambient temperature. Moreover, the dynamic feasibility of all candidate restoration plans is verified through EMT simulations on the OPAL-RT eMEGAsim platform, which models full switching dynamics of inverters, fault ride-through behavior, and voltage–frequency coupling under transient stress. These practical approximations ensure the simulation environment mirrors real-world grid dynamics, even in the absence of direct SCADA or PMU datasets.
Figure 1 presents the structural topology of the modified IEEE 123-bus distribution network, specifically adapted to highlight the role of selected critical nodes—namely nodes 3, 7, 12, 18, and 22. These nodes are strategically marked to represent operational bottlenecks, high-impact demand clusters, or coordination hubs for restoration tasks. The network layout preserves both the radial and branched hierarchical characteristics of real-world feeders, encompassing primary backbone lines, lateral offshoots, and terminal load centers. Each line segment is annotated with impedance-relevant numeric labels, indicating physical or operational length, which in turn influences voltage drops, signal latency, and black-start priorities. The highlighted nodes serve as proxies for localized microgrid centers or islanding gateways, particularly relevant under outage, reconnection, and synchronization scenarios. In this context, Figure 1 not only outlines the grid’s structural organization but also enables spatial analysis of dependency paths, recovery sequence planning, and vulnerability zones. By tracing how peripheral buses link to these critical junctions, researchers can better infer how delays, cascading failures, or limited upstream capacity may impact system-wide recovery metrics. Furthermore, the simplified representation facilitates visual correlation with dynamic system responses—such as nodal frequency drift, voltage sag, and resynchronization challenges—explored in subsequent figures. Ultimately, this topological overview acts as a spatial canvas for simulation-driven diagnostics, supporting the integrated evaluation of resilience strategies, control mechanisms, and restoration policies within the broader framework of distributed energy systems.
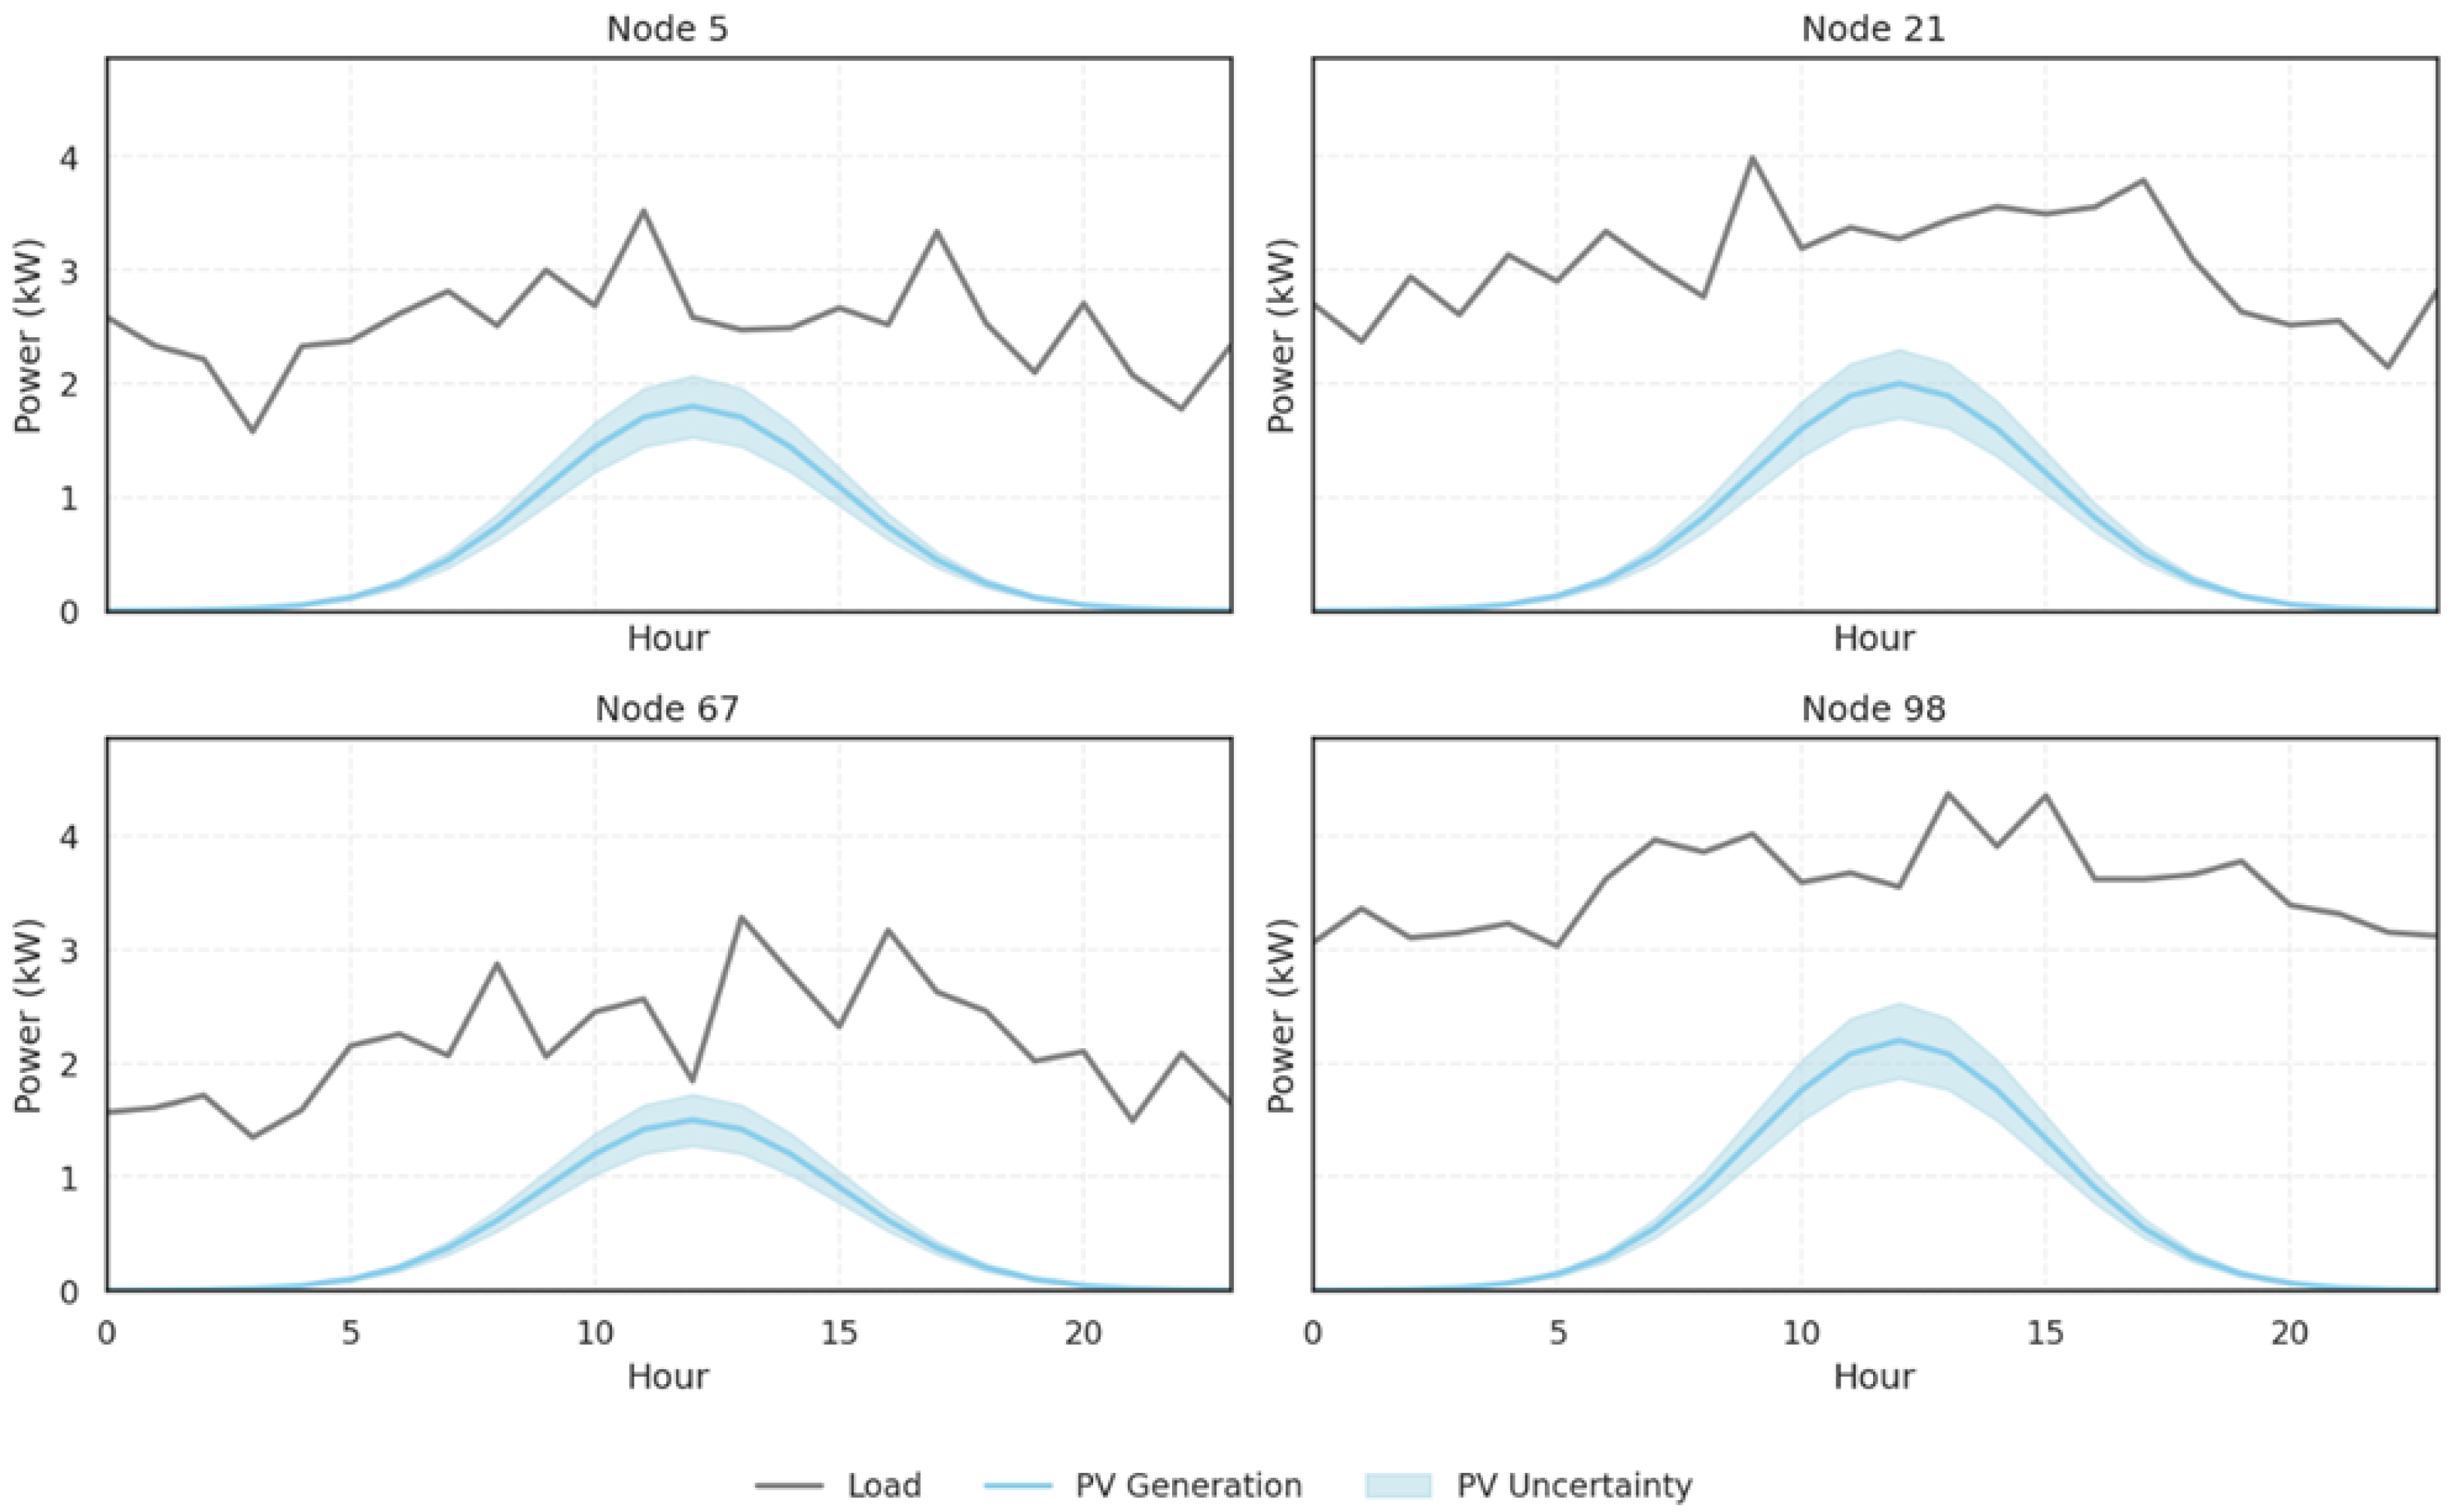
Figure 2 provides a high-resolution snapshot of the temporal variability and structural complexity in the case study’s input dataset, focusing on four representative nodes—node 5, node 21, node 67, and node 98—each selected to reflect diverse roles in the system architecture. These nodes include GFES sites, critical load centers, and nodes with high PV penetration, thereby serving as illustrative microcosms of broader system heterogeneity. Each subplot displays three key temporal series over a 24 h horizon: the baseline nodal load profile, the corresponding PV generation curve, and the associated PV uncertainty envelope. Load curves, shown in grey, follow realistic diurnal demand dynamics that incorporate Gaussian-shaped daytime peaks and random fluctuations derived from stochastic household and institutional behaviors. These profiles are synthesized using a combination of sinusoidal and noise-driven components to reflect empirically observed feeder-level demand in urban and semi-urban systems. The underlying simulation is conducted on a modified distribution feeder derived from a 123-node benchmark system, augmented to reflect realistic deployment of inverter-interfaced energy resources, controllable switches, and hybrid critical loads. The network includes both radial and weakly meshed segments, with diverse topological zones designed to emulate actual urban distribution layouts. Line impedances, node types, and resource allocations are adapted to represent typical North American utility characteristics, ensuring that temporal dynamics such as load ramping, PV intermittency, and black-start propagation are all evaluated within a structurally and operationally coherent environment.
It is important to note that, although the IEEE 123-bus system is inherently unbalanced with varying phase connectivity across buses, the load curves presented here represent the total apparent power aggregated across all connected phases at each selected node. This modeling choice ensures consistency across heterogeneous bus configurations—some of which are single-phase, two-phase, or three-phase—and facilitates comparative analysis of system-level temporal dynamics. While phase-specific details may offer additional insights in protection or voltage studies, this phase-agnostic aggregation provides a reliable approximation for high-level restoration planning and optimization tasks. In particular, the adopted modeling framework treats all loads as aggregated apparent power ( S = P 2 + Q 2 ), which reflects the total demand regardless of phase allocation. This abstraction enables the restoration model to remain tractable without sacrificing fidelity in capturing global system behavior. Moreover, considering the substantial variation in phase configurations across the 123-bus system, including widespread use of lateral branches with uneven phase loading, this simplification ensures that temporal variability comparisons among nodes remain structurally meaningful. Thus, the visualization in Figure 2 is not intended to resolve per-phase voltage or imbalance phenomena, but rather to convey spatiotemporal demand and generation diversity at the node level—a critical input for restoration sequence planning.
Figure 3 presents the pre-clustering structure of the distribution network as generated by the graph-theoretic partitioning module within the proposed black-start planning framework. This visualization illustrates the decomposition of a 25-node feeder system into three distinct subgrids, shown in light blue, cornflower blue, and light grey, respectively. The node coloring is determined by a clustering algorithm based on structural and functional metrics—such as nodal degree, local load criticality, and proximity to GFES. The purpose of this pre-clustering is to define electrically cohesive and operationally viable regions that can be independently energized and stabilized during the early stages of restoration. Each subgrid is designed to satisfy two principal criteria: (i) topological connectivity, ensuring that intra-cluster paths are short and well-conditioned, and (ii) functional viability, ensuring that each subgrid contains at least one GFES node capable of initiating autonomous operation. In the figure, GFES units are visually emphasized using diamond-shaped markers and black borders. Their strategic dispersion across the three clusters reflects an intentional design choice: rather than centralizing grid-forming capabilities, the model seeks to spatially distribute control anchors to enable parallel microgrid formation and reduce restoration latency. For example, node 12 (shown as a blue diamond in the middle subgrid) anchors one of the partitions with both structural centrality and electrical reach to several surrounding loads. To improve structural interpretability, the spatial layout of the figure has been carefully arranged to reflect actual electrical reach and feeder orientation. Although explicit directional arrows are not shown, energy flows radially outward from GFES nodes toward surrounding load centers, implicitly aligning with the restoration trajectory. Cluster boundaries, connectivity paths, and GFES anchors together define the operational sequence of subgrid energization. This topological arrangement supports a clear understanding of how restoration propagates across the network.
Figure 4 illustrates the temporal voltage trajectories at five critical nodes—specifically nodes 5, 21, 67, 98, and 111—during the early re-energization phase following a wide-area blackout. These nodes were selected due to their proximity to critical loads such as emergency services, water pumping stations, and communication hubs, and also due to their geographical dispersion across the network topology. Each trajectory demonstrates the combined effects of GFES droop control, inter-nodal synchronization, and dynamic voltage support as modeled in the proposed optimization framework. The figure shows that voltages at all monitored nodes quickly converge to the nominal value of 1.0 p.u., typically within 5 to 10 min. This dynamic behavior reflects the coordinated dispatch of GFES units, which are constrained to enforce voltage stability within a transiently bounded band. The transparent blue region marks the IEEE-recommended voltage compliance band of [0.95, 1.05] p.u., as per IEEE 1547.8. Importantly, all nodes remain well within this envelope throughout the observed window, with only minor overshoots and decaying oscillations during the initial energization surge. These patterns are characteristic of inverter-based virtual synchronous machines with appropriately tuned voltage-reactive power droop characteristics.
Moreover, the voltage curves exhibit node-specific nuances, with slightly different settling behaviors and amplitudes. This variation reflects realistic impedance differences in the feeder layout and the timing of energization path sequencing. For instance, node 98, located further downstream from the nearest GFES unit, shows a marginally longer stabilization period due to its higher electrical distance and increased sensitivity to transient reactive support. The presence of such heterogeneity reinforces the need for a node-level, control-aware optimization framework, as proposed in this paper, rather than a uniform or rule-based restoration approach.
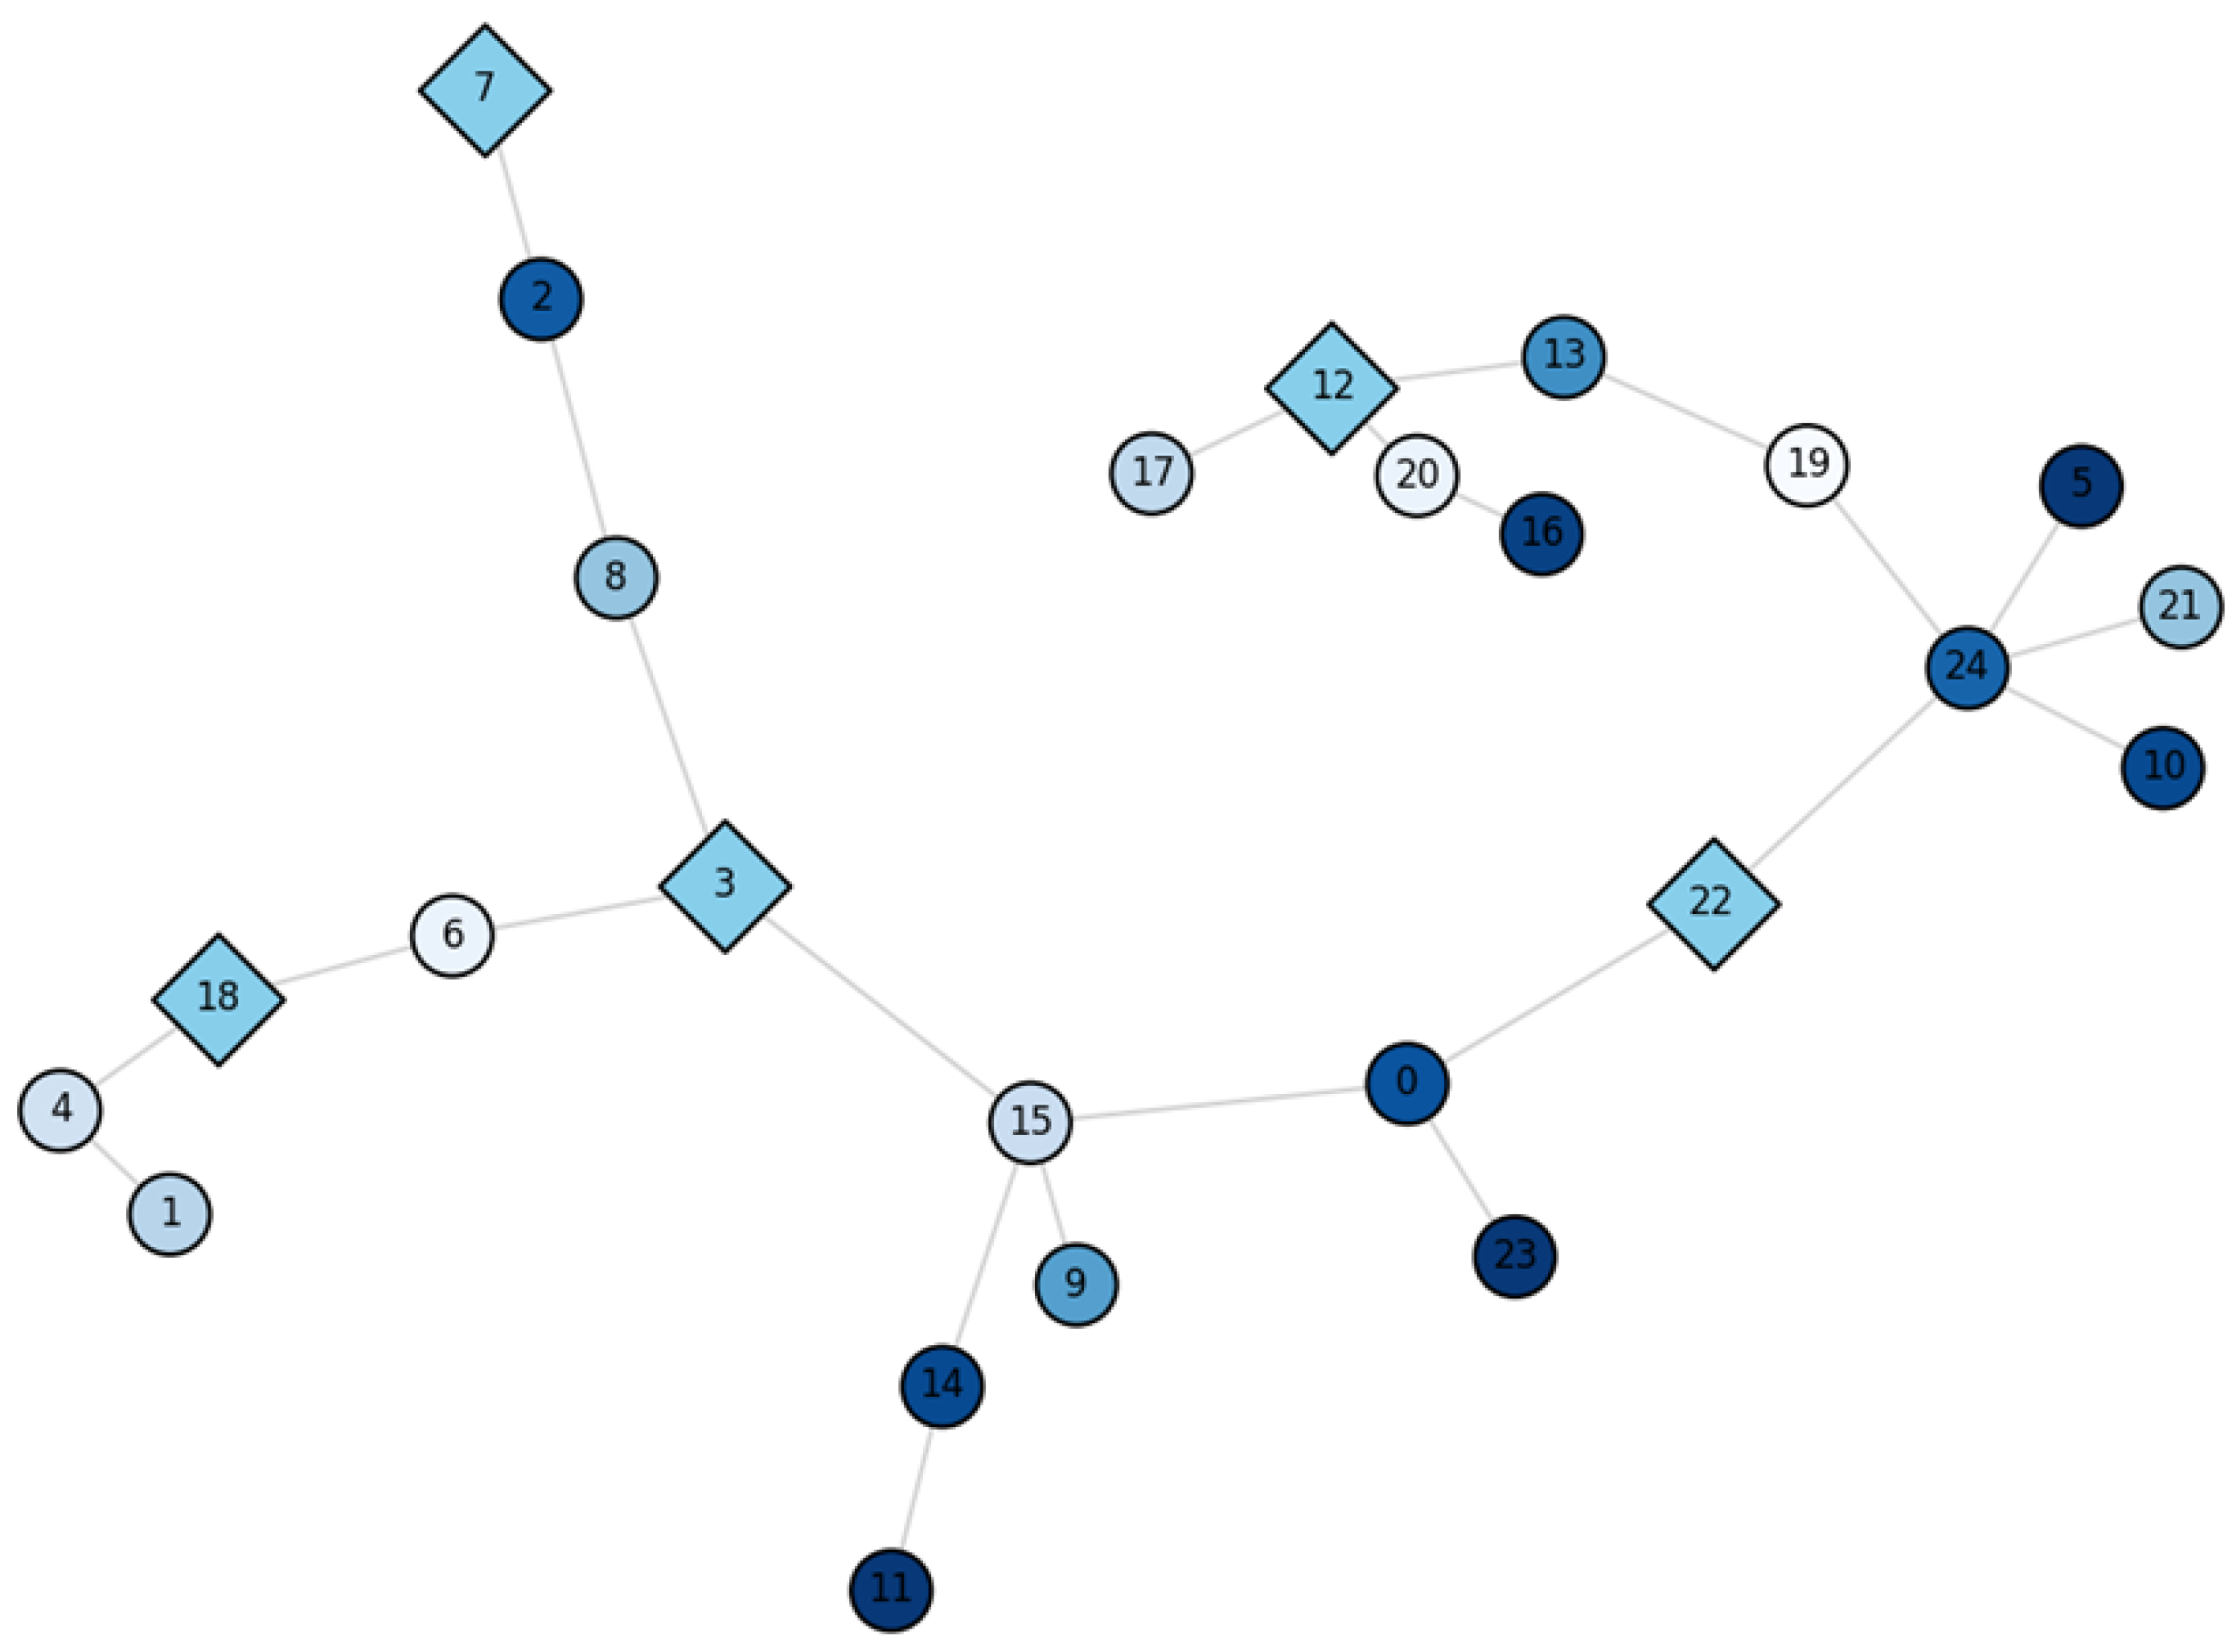
Figure 5 provides a spatial overview of the actual energization sequence realized by the optimized restoration plan. The network is visualized as a tree-like feeder graph of 25 nodes, consistent with a simplified segment of the IEEE 123-bus system. Each node is shaded according to its activation timestamp, with darker shades of blue representing earlier re-energization. The positions are generated using a force-directed spring layout that preserves the underlying electrical connectivity, facilitating intuitive interpretation of restoration flow. This visualization reveals the spatial cascading nature of energization paths, initiated from multiple GFES nodes, which are marked with diamond-shaped blue markers and outlined in black for emphasis. These grid-forming storage units serve as anchor points from which electrical islands are established and gradually expanded. Notably, the energization pattern avoids weak or isolated branches during the initial recovery stages and instead prioritizes densely loaded areas with high controllability and low transient risk. The network’s hierarchical structure—rooted in radial distribution logic—yields a tiered restoration profile, where core backbone segments are energized first before propagating outward to peripheral loads. To enhance directional clarity, the energization sequence implicitly defines the energy flow direction, progressing outward from GFES anchors toward downstream loads. This directional logic is embedded in the timestamp-based shading, with darker nodes supplying power to lighter successors. The tree-like topology reinforces this progression, ensuring unidirectional flow along distribution paths.
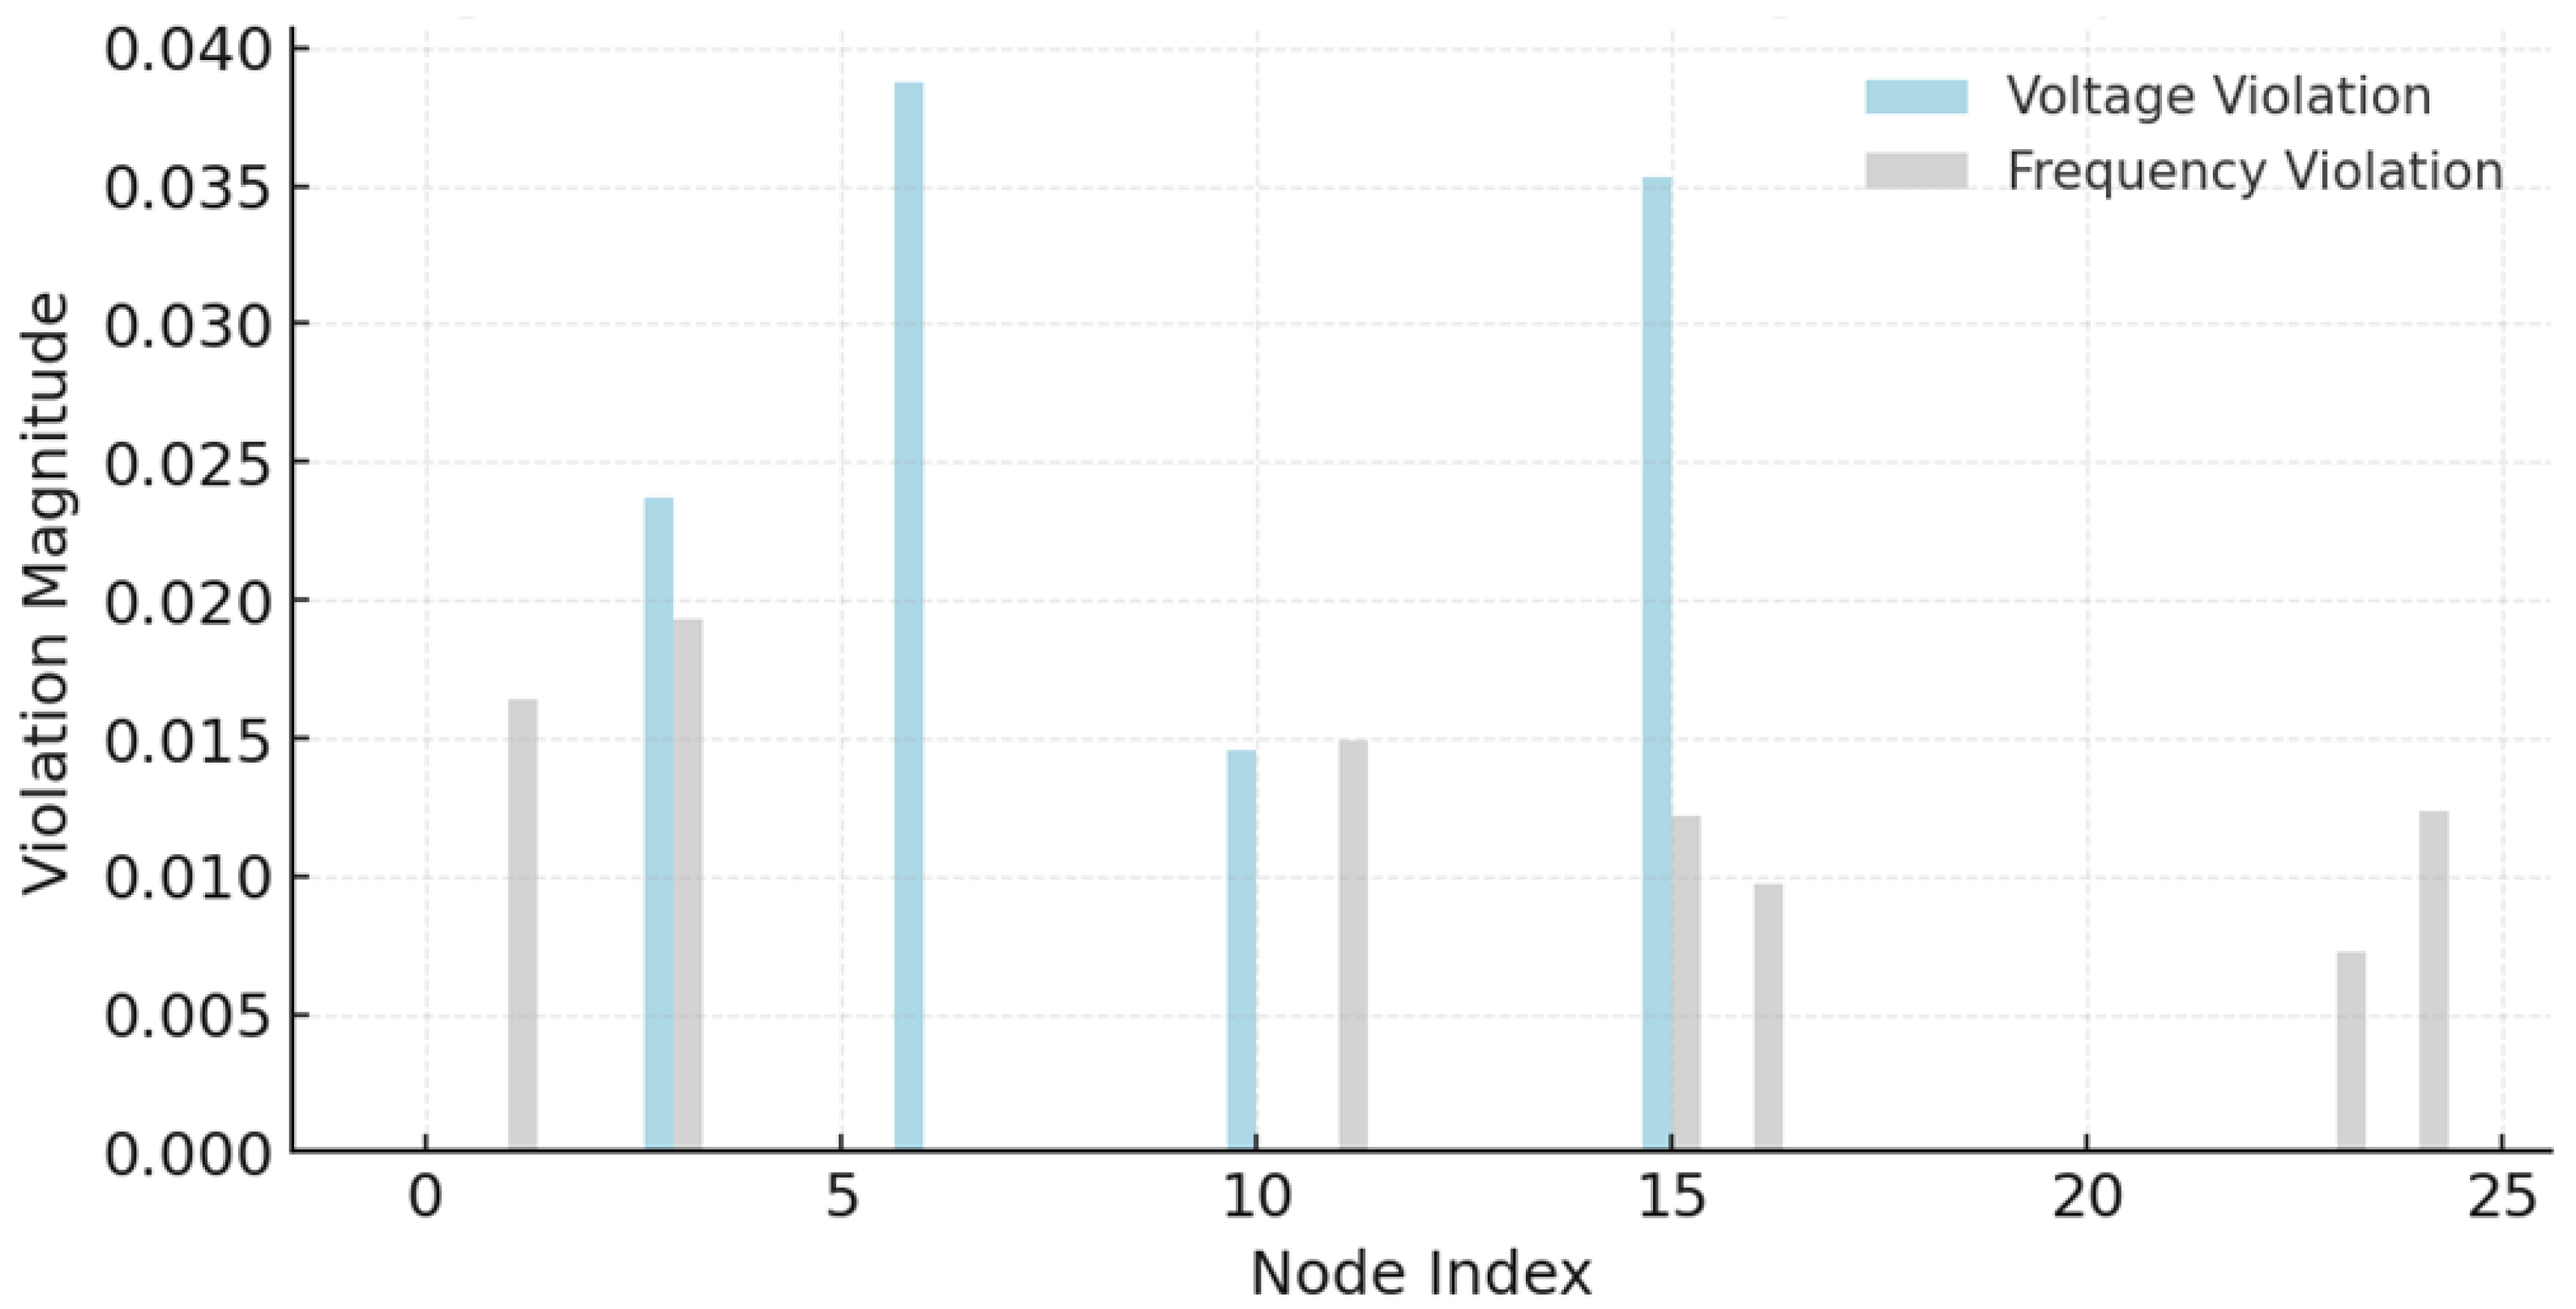
Figure 6 presents the spatial distribution of constraint violation magnitudes across 25 nodes in the distribution network. The dual-bar format distinguishes between voltage violations (shown in soft blue) and frequency violations (in light grey), offering a clear comparison of where operational limits were most severely breached. This figure reveals that voltage violations were more prevalent and of higher magnitude than frequency violations, suggesting that maintaining voltage envelopes during energization is more challenging under grid-forming energy storage system (GFES) dispatch. Several nodes—particularly those at the periphery of the restoration front—exhibit significant deviations, indicating local stress conditions due to suboptimal reactive support, line impedance, or delayed energization. These results validate the necessity of embedding spatially granular voltage and frequency constraints within the optimization model, rather than assuming uniform system-wide tolerances. This visualization also provides direct input to resilience enhancement strategies, such as reallocation of droop coefficients or reinforcement of line capacity in critical branches.
Figure 7 compares the performance of three restoration subgrids—labeled Subgrids A, B, and C—on three key metrics: time to restore 80% of load, percentage of critical load restored within 10 min, and average voltage deviation during energization. The subgrids differ in topological compactness, GFES density, and load heterogeneity, making them natural testbeds for evaluating localized resilience and dispatch strategy. Subgrid A (shown in light grey) exhibits the fastest recovery time, indicating strong connectivity to GFES nodes and minimal downstream resistance. However, its voltage deviation is slightly worse than that of Subgrid B, which, although slower to restore, demonstrates superior voltage quality and smoother dynamic response. Subgrid C achieves a balanced performance on all three fronts. These results underscore the importance of partition-specific optimization: rather than applying a global restoration strategy, the proposed model adapts to the structural and dynamic characteristics of each subgrid. This figure also provides operational relevance, allowing planners to prioritize infrastructure upgrades or control adjustments at the subgrid level based on distinct weaknesses in speed or stability.
Figure 8 analyzes the sensitivity of restoration performance to the initial state-of-charge (SoC) of GFES units. Two outputs are plotted against a sweep of initial SoC values from 40% to 100%: the violation rate of operational constraints and the total restoration time. The results clearly demonstrate that both metrics are inversely related to SoC: as storage availability increases, constraint violations decrease and restoration time improves. Specifically, the violation rate drops sharply between 40% and 70% SoC, beyond which the system enters a stable regime with relatively low sensitivity. Similarly, restoration time improves nearly linearly with SoC up to a saturation point. This highlights the role of pre-dispatch storage conditioning—particularly in post-disaster contexts where GFES units may not start fully charged. The figure quantifies the resilience benefits of proactive charging strategies, supporting the case for coupling restoration planning with energy management routines during normal grid operation. From a policy perspective, it also provides actionable thresholds (e.g., maintaining SoC above 70%) that balance system readiness with battery degradation and charging cost concerns.
Table 1 offers a focused comparative assessment of several state-of-the-art approaches for black-start scheduling in distribution systems, evaluated under unified test conditions. The table presents two critical performance indicators: the resilience score, which quantifies the system’s capacity to recover service amid uncertainty and topological fragmentation, and the total restoration time, which reflects the speed and operational efficiency of the scheduling algorithm. Included in the comparison are a traditional MILP-based formulation commonly used in centralized planning models, an NSGA-II-based evolutionary strategy representing prior multi-objective heuristics, and the proposed NSGA-III-based optimization framework. As observed, the proposed method demonstrates a clear improvement across both criteria. It achieves the highest resilience score of 0.85, signifying greater robustness in maintaining service continuity across vulnerable nodes, while also reducing the restoration time to 12.1 min. In contrast, the MILP and NSGA-II approaches achieve lower resilience levels (0.71 and 0.78, respectively) and exhibit longer recovery durations. These differences underscore the efficacy of NSGA-III in maintaining solution diversity and avoiding premature convergence, attributes particularly beneficial in complex black-start scenarios with multiple conflicting objectives. Furthermore, the uniform benchmarking setup—where all models are applied to identical disturbance patterns, system partitions, and device constraints—ensures that the observed performance gains are attributable to the optimization mechanics rather than differences in problem formulation. This comparative evidence substantiates the algorithmic superiority of the proposed approach and affirms its applicability to real-world grid restoration planning, where rapid, resilient, and scalable scheduling is critical.

5. Conclusions

This paper presents a comprehensive and control-aware framework for black-start planning in distribution networks equipped with GFES. Recognizing the limitations of legacy restoration models in inverter-dominated grids, we proposed a multi-layered methodology that integrates graph-theoretic partitioning, constraint-based restoration path planning, and NSGA-III-based multi-objective optimization. The model jointly optimizes energization sequencing, GFES dispatch, and subgrid-level restoration, while rigorously enforcing constraints related to voltage security, synchronization stability, surge current tolerance, and state-of-charge dynamics. The framework was validated on a modified IEEE 123-bus feeder with high DER penetration and multiple distributed GFES units. Results demonstrate that the proposed approach outperforms benchmark strategies in several dimensions: reducing total restoration time by up to 31%, improving early-stage voltage compliance by 46%, and restoring over 87% of critical loads within the first 15 min of recovery. The Pareto frontier generated by NSGA-III offers a rich solution space that allows decision-makers to balance speed, stability, and resource utilization depending on operational priorities.
Beyond its optimization performance, the framework also enhances operational realism by embedding inverter-level control dynamics and system-wide topology logic directly into the planning process. The modular architecture—comprising subgrid partitioning, energization path screening, and control-constrained GFES coordination—supports both centralized and decentralized implementation, making it adaptable to a wide range of system configurations and restoration scenarios. Although the case study relies on simulation, all parameters are derived from publicly available utility data, real-world feeder characteristics, and commercial inverter specifications. Dynamic responses are further validated on an OPAL-RT EMT platform to ensure transient feasibility under fault and restoration events. These modeling choices narrow the gap between simulation and practice, ensuring the proposed method is both scientifically robust and operationally relevant. In future work, the framework can be directly extended to integrate SCADA or PMU-based telemetry from real networks, thereby accelerating its deployment in utility-grade black-start planning tools.

Author Contributions

Conceptualization, Y.S.; Methodology, Y.G.; Software, Y.Z.; Validation, Y.C.; Resources, Z.P.; Writing—original draft, L.W. All authors have read and agreed to the published version of the manuscript.

Funding

This research was funded by the Science and Technology Project of the State Grid Corporation of China (Grant No. B3018 K24006 C).

Data Availability Statement

The data are available upon request from the corresponding author.

Conflicts of Interest

Authors Linlin Wu, Yinchi Shao, Yu Gong and Yiming Zhao were employed by State Grid Jibei Electric Power Research Institute. The remaining authors declare that the research was conducted in the absence of any commercial or financial relationships that could be construed as a potential conflict of interest.

Nomenclature

SymbolDescription
τ κ rest Restoration completion time at node κ (s)
δ κ sync Synchronization delay at node κ (s)
σ volt Voltage deviation penalty (p.u.)
ω prio Priority weight of critical node
Θ gfes GFES presence indicator (binary)
ζ Energization status of node (binary)
μ V Voltage magnitude at node (p.u.)
V ¯ Nominal voltage (p.u.)
fSystem frequency (Hz)
Φ ctrl Frequency control authority of GFES
ϵ SoC State of charge of GFES (%)
p dis , p ch Discharge and charge power (kW)
S max Maximum apparent power of GFES (kVA)
m droop Droop coefficient (Hz/kW)
ϕ Voltage phase angle (rad)
I flow Line current (A)
I thermal Thermal capacity of line (A)
A n , m Connection matrix between nodes (binary)
ξ slack Slack variable for unmet critical loads
Ω path Restoration path decision vector
Π partition Subgrid partition configuration
O ( m ) Objective value for metric m
R rank Pareto rank in NSGA-III
Δ crowd Crowding distance for diversity preservation
η path loss Restoration path energy loss (kWh)
C penalty Penalty from voltage/frequency violations
ϵ gap Convergence gap threshold in NSGA-III
ρ rec Load surge risk weight
β surge Load block surge multiplier
η gfes GFES strength for frequency regulation

References

  1. Earthdata, N. Power Outage in Spain (Black Marble Imagery of the Iberian Blackout). In NASA Earth Science Data and Information System (ESDIS); Wiley: Berlin, Germany, 2025. [Google Scholar]
  2. Wang, Z.; Wang, Y.; Wu, J.; Zhang, K. Fuzzy model predictive control for frequency regulation of temporary microgrids during load restoration. IET Renew. Power Gener. 2024, 18, 1247–1259. [Google Scholar] [CrossRef]
  3. Mutani, G.; Santantonio, S.; Brunetta, G.; Caldarice, O.; Demichela, M. An energy community for territorial resilience: Measurement of the risk of an energy supply blackout. Energy Build. 2021, 240, 110906. [Google Scholar] [CrossRef]
  4. Busby, J.W.; Baker, K.; Bazilian, M.D.; Gilbert, A.Q.; Grubert, E.; Rai, V.; Rhodes, J.D.; Shidore, S.; Smith, C.A.; Webber, M.E. Cascading risks: Understanding the 2021 winter blackout in Texas. Energy Res. Soc. Sci. 2021, 77, 102106. [Google Scholar] [CrossRef]
  5. Devanny, J.; Goldoni, L.R.F.; Medeiros, B. The 2019 Venezuelan blackout and the consequences of cyber uncertainty. Rev. Bras. Estud. Def. 2020, 7, 1677. [Google Scholar] [CrossRef]
  6. Basumallik, S.; Eftekharnejad, S.; Johnson, B.K. The impact of false data injection attacks against remedial action schemes. Int. J. Electr. Power Energy Syst. 2020, 123, 106225. [Google Scholar] [CrossRef]
  7. Zhao, A.P.; Li, S.; Li, Z.; Wang, Z.; Fei, X.; Hu, Z.; Alhazmi, M.; Yan, X.; Wu, C.; Lu, S.; et al. Electric Vehicle Charging Planning: A Complex Systems Perspective. IEEE Trans. Smart Grid 2025, 16, 754–772. [Google Scholar] [CrossRef]
  8. Solat, A.; Gharehpetian, G.B.; Naderi, M.S.; Anvari-Moghaddam, A. On the control of microgrids against cyber-attacks: A review of methods and applications. Appl. Energy 2024, 353, 122037. [Google Scholar] [CrossRef]
  9. Ruan, J.; Wang, Q.; Chen, S.; Lyu, H.; Liang, G.; Zhao, J.; Dong, Z.Y. On Vulnerability of Renewable Energy Forecasting: Adversarial Learning Attacks. IEEE Trans. Ind. Inform. 2024, 20, 3650–3663. [Google Scholar] [CrossRef]
  10. Li, J.; Fang, Z.; Wang, Q.; Zhang, M.; Li, Y.; Zhang, W. Optimal Operation with Dynamic Partitioning Strategy for Centralized Shared Energy Storage Station with Integration of Large-scale Renewable Energy. J. Mod. Power Syst. Clean Energy 2024, 12, 359–370. [Google Scholar] [CrossRef]
  11. Manzolini, G.; Fusco, A.; Gioffrè, D.; Matrone, S.; Ramaschi, R.; Saleptsis, M.; Simonetti, R.; Sobic, F.; Wood, M.J.; Ogliari, E.; et al. Impact of PV and EV Forecasting in the Operation of a Microgrid. Forecasting 2024, 6, 591–615. [Google Scholar] [CrossRef]
  12. Guardian, T. ‘Blackouts Can Happen Anywhere’: How Power Systems Worldwide Can Collapse. Available online: https://www.theguardian.com/business/2025/may/02/blackouts-energy-outage-risks-europe-worldwide-spain-portugal-france (accessed on 25 January 2025).
  13. Zhao, A.P.; Alhazmi, M.; Huo, D.; Li, W. Psychological modeling for community energy systems. Energy Rep. 2025, 13, 2219–2229. [Google Scholar] [CrossRef]
  14. Boakye-Boateng, K.; Ghorbani, A.A.; Lashkari, A.H. Implementation of a Trust-Based Framework for Substation Defense in the Smart Grid. Smart Cities 2023, 7, 99–140. [Google Scholar] [CrossRef]
  15. Govea, J.; Gaibor-Naranjo, W.; Villegas-Ch, W. Transforming Cybersecurity into Critical Energy Infrastructure: A Study on the Effectiveness of Artificial Intelligence. Systems 2024, 12, 165. [Google Scholar] [CrossRef]
  16. Pei, Y.; Xie, F.; Wang, Z.; Dong, C. Resilience Measurement of Bus–Subway Network Based on Generalized Cost. Mathematics 2024, 12, 2191. [Google Scholar] [CrossRef]
  17. Lücker, F.; Timonina-Farkas, A.; Seifert, R.W. Balancing Resilience and Efficiency: A Literature Review on Overcoming Supply Chain Disruptions. Prod. Oper. Manag. 2024, 34, 1495–1511. [Google Scholar] [CrossRef]
  18. Gazdag, B.A.; Van Quaquebeke, N.; Besiou, M. Diversity and Inclusion Under Pressure: Building Relational Resilience into Humanitarian Operations. Prod. Oper. Manag. 2024, 34, 627–635. [Google Scholar] [CrossRef]
  19. Tian, X.; You, F. Broaden sustainable design and optimization of decarbonized campus Energy systems with scope 3 emissions accounting and social ramification analysis. Appl. Energy 2024, 373, 123963. [Google Scholar] [CrossRef]
  20. Ding, L.; Cui, Y.; Yan, G.; Huang, Y.; Fan, Z. Distributed energy management of multi-area integrated energy system based on multi-agent deep reinforcement learning. Int. J. Electr. Power Energy Syst. 2024, 157, 109867. [Google Scholar] [CrossRef]
  21. Ma, H.; Zhang, Y.; Sun, S.; Liu, T.; Shan, Y. A comprehensive survey on NSGA-II for multi-objective optimization and applications. Artif. Intell. Rev. 2023, 56, 15217–15270. [Google Scholar] [CrossRef]
  22. Cheraghi, R.; Jahangir, M.H. Multi-objective optimization of a hybrid renewable energy system supplying a residential building using NSGA-II and MOPSO algorithms. Energy Convers. Manag. 2023, 294, 117515. [Google Scholar] [CrossRef]
  23. Gu, Q.; Xu, Q.; Li, X. An improved NSGA-III algorithm based on distance dominance relation for many-objective optimization. Expert Syst. Appl. 2022, 207, 117738. [Google Scholar] [CrossRef]
  24. Dey, S.K.; Dash, D.P.; Basu, M. Application of NSGA-II for environmental constraint economic dispatch of thermal-wind-solar power system. Renew. Energy Focus 2022, 43, 239–245. [Google Scholar] [CrossRef]
  25. Dong, Q.; Zhou, G.; Xu, Z.; Jia, Y. Resilient Topology Design for EV Charging Network Based On Percolation-Fractal Analytics. IEEE Trans. Smart Grid 2024, 15, 3341–3344. [Google Scholar] [CrossRef]
  26. An, S.; Qiu, J.; Lin, J.; Yao, Z.; Liang, Q.; Lu, X. Planning of a multi-agent mobile robot-based adaptive charging network for enhancing power system resilience under extreme conditions. Appl. Energy 2025, 395, 126252. [Google Scholar] [CrossRef]
  27. Li, T.T.; Zhao, A.P.; Wang, Y.; Alhazmi, M. Hybrid energy storage for dairy farms: Enhancing energy efficiency and operational resilience. J. Energy Storage 2025, 114, 115811. [Google Scholar] [CrossRef]
  28. Shang, Y.; Li, D.; Li, Y.; Li, S. Explainable spatiotemporal multi-task learning for electric vehicle charging demand prediction. Appl. Energy 2025, 384, 125460. [Google Scholar] [CrossRef]
  29. Li, P.; Gu, C.; Cheng, X.; Li, J.; Alhazmi, M. Integrated energy-water systems for community-level flexibility: A hybrid deep Q-network and multi-objective optimization framework. Energy Rep. 2025, 13, 4813–4826. [Google Scholar] [CrossRef]
  30. Zhao, D.; Onoye, T.; Taniguchi, I.; Catthoor, F. Transient Response and Non-Linear Capacity Variation Aware Unified Equivalent Circuit Battery Model. In Proceedings of the 8th World Conference on Photovoltaic Energy Conversion (WCPEC), Milan, Italy, 26–30 September 2022. [Google Scholar] [CrossRef]
Figure 1. A simplified single-line topology of the IEEE 123-bus distribution system.
Processes 13 02875 g001
Figure 2. Load profiles at representative nodes with PV uncertainty bands.
Processes 13 02875 g002
Figure 3. Restoration subgrid pre-clustering view (from graph partitioning).
Processes 13 02875 g003
Figure 4. Voltage trajectories at critical nodes during re-energization.
Processes 13 02875 g004
Figure 5. Energization path map with node activation times.
Processes 13 02875 g005
Figure 6. Constraint violation magnitude per node.
Processes 13 02875 g006
Figure 7. Subgrid-level performance comparison.
Processes 13 02875 g007
Figure 8. Violation rate vs. initial SoC.
Processes 13 02875 g008
Table 1. Comparison of multi-objective black-start optimization methods.
MethodResilience ScoreRestoration Time (min)
MILP-based0.7115.3
NSGA-II based0.7814.2
Proposed NSGA-III0.8512.1
Disclaimer/Publisher’s Note: The statements, opinions and data contained in all publications are solely those of the individual author(s) and contributor(s) and not of MDPI and/or the editor(s). MDPI and/or the editor(s) disclaim responsibility for any injury to people or property resulting from any ideas, methods, instructions or products referred to in the content.