Abstract
Blockages in a transfer system are a crucial problem for the wet coals conveying process in thermal power plants. Improving the viscous material flow is a fundamental solution to prevent blockages. A discrete element simulation was employed to investigate the flow characteristics of viscous materials in transfer systems with different structures under vibration-assisted conditions. The results indicate that, near the structure wall, the adhesive force increased, which was the root cause of material blockages. Introducing vibration motions into the chute could break the adhesive forces between the wet particles and the structure wall. Compared with a linear chute, a curved chute was more sensitive to vibration movement and had less leftover viscous materials and a lower output velocity. Compared with a deflector hood, an impact plate had less residual material and a higher particle velocity because of its longer ejection distance and lower adhesive force. Based on the above simulation results, a transfer system with an impact plate and curved chute is proposed. By introducing the critical vibration intensity for the transfer system, the vibration parameters and transfer system structures are optimized. The aforementioned research findings provide guidance for intervention measures aimed at preventing material blockages in industrial bulk material conveying processes.
1. Introduction
A transfer system blockage is a typical engineering issue during the conveyance of sticky bulk materials, which often leads to downtime for repairs and large economic losses in industrial output [1]. Wet materials are more likely to stick to machinery during the conveying process, which can cause agglomeration, due to their strong adhesiveness and poor flowability. The materials’ adhesive force grows over time, and the agglomerated layer’s thickening eventually reduces the flow passage size, making it harder for viscous materials to travel smoothly through the transfer chute and pipe [2].
The moisture content of bulk materials has a significant impact on their adhesion and flowability [3]. Hann et al. [4] discovered that even minute changes in moisture content have a major impact on a bulk material’s adhesiveness and flowability. Grima et al. [5] and Aldrich and Zhang [6] discovered that suitably increasing the moisture content significantly enhanced a material’s adhesiveness, making its flowability worse.
Improving the flowability of viscous materials is a key point for solving transfer system blockages. Currently, one of the more appropriate methods is to design transfer system structures (such as chutes and hoppers) and optimize the process parameters (such as belt speed) to increase the materials’ flowability. Kukreja et al. [7] examined the reasons behind chute blockages and improved a chute’s cross-sectional area, breadth, inclination angle, and outlet opening. Tan et al. [8] optimized the structural parameters of deflect hoppers and transfer chutes, greatly reducing the amount of materials’ adhesion and effectively alleviating blockage difficulties.
In addition, there are alternative techniques to enhance sticky bulk materials’ flowability. Mikio et al. [9], Duyet al. [10], and Komori et al. [11] discovered that the flowability of sticky bulk materials can be greatly enhanced by introducing tiny particles into the primary particle phase to produce a lubricating effect. Adding lubricants and using biomimetic anti-slip structures on the equipment surfaces can reduce the adhesion between the particles and the walls, thereby improving a material’s flowability [12,13]. However, in the bulk material conveying process, the particle size distribution is wide-ranging. Therefore, it is evidently impractical to improve the flowability of wet materials by adding fine particle lubricants. Modifying the equipment’s surface properties incurs significant costs for engineering applications. Thus, the current best choice is to optimize the transportation system’s structure and process to increase a material’s flowability.
Vibration can improve the flowability of adhesive bulk materials by lowering the friction coefficient and adhesion forces between the particles and the wall [14,15]. Zhao et al. [16] studied the mechanism of horizontal rotational vibration on an adhesive bulk material’s flowability and found that vibration promotes the particles’ rearrangement to achieve an optimal segregation state. Fartashvand et al. [17] investigated the effect of ultrasonic vibration on the cold compaction of titanium alloy and found that the internal friction coefficients decreased under vibration, leading to a significant increase in the sample’s compaction density. Zhu et al. [18] found that under the action of vacuum vibration, the movement of adhesive particles intensified, the porosity decreased, and the sample’s density significantly improved. Tan et al. [19] investigated the impact of drum vibration on the quality of powder spreading in additive manufacturing, and found that axial vibration of a drum can enhance the powder flowability, thereby improving the compactness and uniformity of the powder bed. These studies all indicate that vibration can enhance a viscous material’s flowability.
Studying the flow characteristics of viscous materials by experimental methods is challenging. For instance, it is difficult to record the minute details of particle interactions, and the equipment is too big to handle bulk materials. The flow patterns of viscous materials with specific moisture contents show clear signs of agglomeration and intermittency [20,21,22,23]. Currently, the discrete element method (DEM) is widely applied to precisely mimic the characteristics of bulk materials. In the DEM, the agglomeration and cohesion characteristics are described by applying adhesive forces between the particles and the wall [24]. Tan [25], Zhao [16,26], Bahramian [27], Louati [28], Zakhvatayeva [29], and Jiang [30] studied the flow characteristics of wet particles, such as coals, rocks, concrete mixtures, and TiO2 based on the DEM. They found that wet and sticky materials easily adhere to equipment surfaces, adversely affecting the flowability and passability of viscous materials.
Wet granular material clogging in transfer systems poses industrial challenges. The current DEM studies focus on dry granular flow, analyzing the collisions and friction. Wet particles exhibit heightened resistance due to capillary forces and viscosity, causing frequent clogging. The gap lies in the insufficient systematic research on curved chutes and the vibration parameters for materials like wet coals, for which quantified critical clogging thresholds and flow mechanisms are lacking. Using DEM simulations, we compare linear/curved chutes and vary the vibration parameters, identifying wet charcoal’s critical clogging thresholds. This reveals mechanisms, such as particle bridging/slippage, which guide the subsequent experiments and industrial design chute curvature selection to mitigate the clogging risks.
From the above literature review, there are few studies on blockages of transfer systems caused by viscous materials. Therefore, the flow characteristics and adhesion mechanisms of viscous materials during conveying were researched in depth. Based on the DEM, the dynamic flow characteristics of wet coal materials were examined. The particle velocity and residual mass of viscous materials were used as the evaluation parameters. First, the influence of systematic structures on the adhesion mechanism was analyzed. Second, the influence of vibration parameters on the adhesion mechanism of materials inside the chute was analyzed in depth. Finally, the vibration parameters and systematic structures were matched and optimized based on the relationships between the vibration intensity and evaluations. These can be used to guide the selection of vibration parameters in industry.
2. Numerical Modeling
2.1. Adhesion Force of Viscous Materials
The DEM was employed to model the motion of solid particles. In DEM simulations, the contact forces between particles are introduced and the Newtonian motion equations are solved to obtain physical information about the particles’ behavior over time [31]. The related theories of the DEM are not elaborated upon here.
To describe the viscous material flow, the Johnson–Kendall–Roberts (JKR) model was employed using normal adhesive forces () [32]. The formula for calculating the adhesive force is as follows:
where and are the surface energy and contact radius between the particles or between a particle and a wall, respectively. The JKR model is generally used with the Hertz–Mindlin model [33]. The introduction of surface energy results in the contact area between particles being slightly larger than the contact area predicted by the Hertz theory. Therefore, the contact radius is adjusted as follows:
where and are the equivalent radius and equivalent Young’s modulus, respectively. For the related calculations, please refer to discrete element theory.
Due to the change in the contact radius, the Hertzian normal force also undergoes a modification. The formula for calculating the modified normal force () is as follows:
The geometric dimensions of the transfer system are much larger than the actual particle sizes, resulting in an excessively large particle system. During bulk material conveying, the estimated number of particles can reach into the billions, making simulation computations too extensive. Therefore, this study adopted a coarse-graining DEM for particle scaling. The coarse-graining DEM approach involves replacing many of the particles with the same properties (such as density and mass) with a single large particle, which are termed as coarse-grained particles after replacement [34]. In conjunction with the fine particle sizes and equipment geometric dimensions, this study selected a scale-up factor of 10 for the coarse-grained particle model, denoted as k = 10. The details regarding the scaling criteria for the particles’ material properties can be found in Chen’s research on the scaling criteria for the JKR contact model [35]. During this study, the authors used Rocky DEM 4.3 version for the purposes of simulating.
2.2. Material Properties and DEM Parameters
Wet coals (Fujian Longking Environmental Protection Co., Ltd., Longyan, China) with a moisture content of 9.8% were used in this research. The particle size range for wet coal materials typically falls between 0 and 5 mm. Considering the use of a coarse-grained DEM model in this study, we chose a particle size of 1 mm for the wet coal particles, assuming they were spherical in shape by introducing rolling resistance. In the coarse-grained model, the scaled particle size after coarse-graining was 10 mm.
Some DEM parameters can be directly measured through experiments or obtained from the relevant literature or experience. The density of wet coal materials was measured using the Archimedean drainage method. The relevant experimental values provided the Young’s modulus, Poisson’s ratio, and wall density [7]. The friction coefficients and surface energy between the particles and wall were determined through inclined plane tests (Figure 1a). Furthermore, the restitution coefficients were confirmed using vertical drop tests (Figure 1d), where the value was obtained by calculating the ratio of the rebound height after impact to the original drop height. The coefficient of restitution was primarily used to specify the degree of momentum and energy recovery before and after particle collisions. Table 1 presents the DEM input parameters determined from experiments.
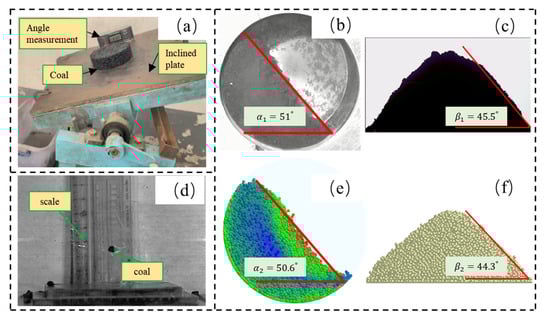
Figure 1.
The calibration of the DEM parameters: the (a) inclined plate test, (b) dynamic repose angle test, and (c) static repose angle test via experimentation, and the (d) drop test, (e) dynamic repose angle test, and (f) static repose angle test from the DEM simulation.

Table 1.
Physical parameters of wet coals.
For the other DEM input parameters that could not be directly obtained, the parameter calibration method created by Michae [36] and Mohajeri [37] was referenced to determine the properties of wet coal materials. The coefficient of friction primarily restricts the relative sliding between particles, while the surface energy generates attractive forces between them, which make wet particles exhibit adhesion and agglomeration behaviors. These two parameters play a dominant role in influencing the macroscopic flow properties of granular materials, such as the angle of repose. The static repose angle test was conducted to determine the inter-particle friction coefficient and the contact surface energy between particles (Figure 1c,f). The accuracy of the above calibrated parameters was verified through avalanche angle tests (Figure 1b,e). The detailed parameters are shown in Table 1.
2.3. Transfer System Structures
Figure 2 shows the transfer system structure setup (Fujian Longking Environmental Protection Co., Ltd., Longyan, China), which mainly included two conveying belts, a deflect hood or impact plate, and a linear or curved chute. Either the deflect hood or the impact plate could be chosen for a given setup. The curved and linear chutes were the same. Therefore, the four transfer system structures were as follows: “Deflect hood & Linear chute” in Figure 2a, called “case 1”; “Deflect hood & curved chute” in Figure 2b, called “case 2”; “Impact plate & Linear chute” in Figure 2c, called “case 3”; and “Impact plate & curved chute” in Figure 2d, called “case 4”. The heights of the transfer system and chute were 3.2 and 1.5 m, respectively. The linear chute’s inclined angle was 60°. The curved chute’s sector and radius were 60° and 1.2 m, respectively.
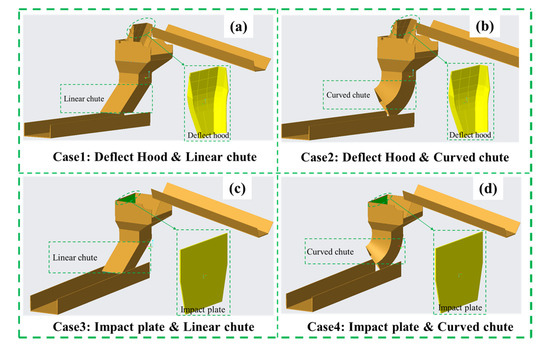
Figure 2.
Structures of the transfer system: (a) the deflect hood and linear chute, (b) the deflect hood and curved chute, (c) the impact plate and linear chute, and (d) the impact plate and curved chute.
Vibration can obviously improve a viscous material’s flow, which has been demonstrated by some researchers [38,39]. In this study, vibrational motion was introduced to the chutes. In addition to the linear reciprocating vibration form, the frequency of vibration was from 50 to 60 Hz, with a range amplitude from 2 to 8 mm [16,40]. The details of the vibration parameters are listed in Table 2. Each structure of the transfer system traversed all the vibration parameters. The number of DEM simulations was 96 sets.
Table 2.
Structures and vibration parameters.
2.4. Evaluation
Standardizing the vibration parameters can simplify the study of vibration effects. The vibration intensity was introduced by Zhao et al. [16,26] and is a key factor that affects the vibration performance, which is a dimensionless parameter of a vibration system that characterizes the vibration motion under gravitational acceleration. The formula is as follows:
where , , and represent the vibration frequency, amplitude, and gravitational acceleration, respectively. is the sharp angle between the vibration direction and the gravitational acceleration; in our research. From Equation (4), the vibration intensity was calculated to range from 20 to 120.
The average particle velocity in the transfer system and the residual mass adhered to the wall were applied as the evaluation criteria to quantitatively reveal the laws. The formulas are shown in Equations (5) and (6).
where and are the average velocity of the particles and the numbers of particles currently inside the cube. is the velocity of the particle in this cube. and are the total mass of particles and the particle’s mass currently in the cube.
3. Results and Discussion
3.1. Influences of Various Structures
Figure 3a divides the transfer system into three parts, which are “Upper”, “Middle”, and “Bottom”, respectively. Taking the conditions of a 60 Hz vibration frequency and 2 mm amplitude as examples, Figure 3b,c, show the average particle velocity and residual mass in the different structures, respectively. Figure 3b shows that the average particle velocity of the bottom structure in cases 2 and 4 was lower than that in cases 1 and 3. Figure 3c shows that the residual mass of the bottom structure in case 2 was less than that in case 1. The above results indicate that the transfer systems with a curved chute, such as in cases 1 and 3, is a superior design to those with a linear chute.
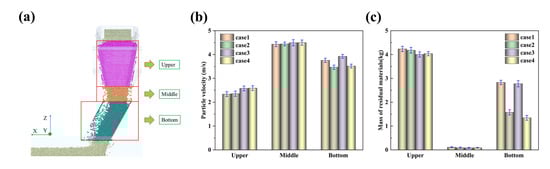
Figure 3.
(a) The transfer system divided into three parts, “Upper, Middle and Bottom”; (b) the average particle velocities in the three parts; and (c) the residual masses of the viscous materials.
Similarly, the average particle velocity of the upper structure in cases 1 and 2 was lower than that in cases 3 and 4, and the residual mass of the upper structure in case 1 and case 2 was slightly higher than that in case 3 and 4. This means that the transfer system with an impact plate was the optimal design. The materials flowing in the middle had almost no difference between the various designs. Next, a detailed discussion is presented on the upper and bottom areas.
Figure 4 shows the particle flow patterns of the different structures. The particle displacement in the falling direction in Figure 4a is larger than that in Figure 4b. Figure 5 shows the trajectory of particles in the transfer system, with the deflect hood in Figure 5a (cases 1 and 2) and the impact plate in Figure 5b (cases 3 and 4). The particle trajectories in the transfer system with the impact plate were longer, which caused a stronger scrubbing effect. Therefore, there is a larger triangular blank area in the final state in Figure 4.
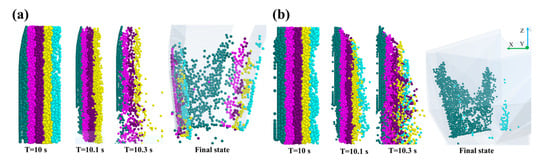
Figure 4.
The particle flow patterns in the upper structure; the particle flow patterns in (a) cases 1 and 2 and (b) cases 3 and 4.
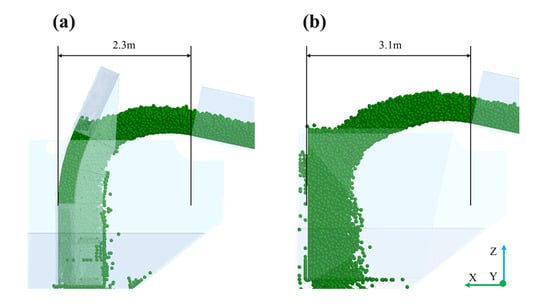
Figure 5.
The particle trajectories in the deflect hood (a) and impact plate (b).
Figure 6a divides the particles within the deflect hood and impact plate into five layers: A, B, C, D, and E. Figure 6b shows the average adhesive forces in the five layers and Figure 6c shows the average displacements of particles in the Z-direction. The average adhesive forces in cases 1 and 2 were slightly higher than those in cases 3 and 4, which meant the average particle displacements were lower in cases 1 and 2, shown in Figure 6c. The above results indicate that the transfer system with the impact plate was better than that with the deflect hood.
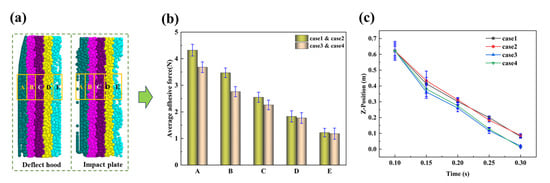
Figure 6.
(a) The particles within the deflect hood and impact plate divided into five layers: A, B, C, D, E; (b) the average adhesive forces in the five layers; and (c) the average coordination in the Z-direction (the falling direction).
Figure 7 shows the particle flow patterns in the transfer chute. The particles that accumulated in the chute were divided into five layers from top to bottom, each designated by a unique color, with the red layer designated as the topmost stratum. Figure 7a (cases 1 and 3) shows the particles flowed in an approximately parabolic manner, with higher velocities in the middle and lower velocities on both sides. Figure 7b shows the particles flowing along the direction away from the wall flowed faster. In the final state, the residual particles adhered to the whole wall in the linear chute but not in the curved chute. Figure 8 shows the average adhesive forces in the transfer system chute and the particles are divided into five layers: F, G, H, I, and J, where F represents the outermost stratum and J signifies the innermost stratum—specifically. The adhesive forces on the particles in the linear chute (cases 1 and 3) exhibited a trend of being smaller in the middle and larger on the sides, while the adhesive forces on the particles in the curved chute (cases 2 and 4) gradually decreased along the direction away from the wall, which explain the above particle flow characteristics.
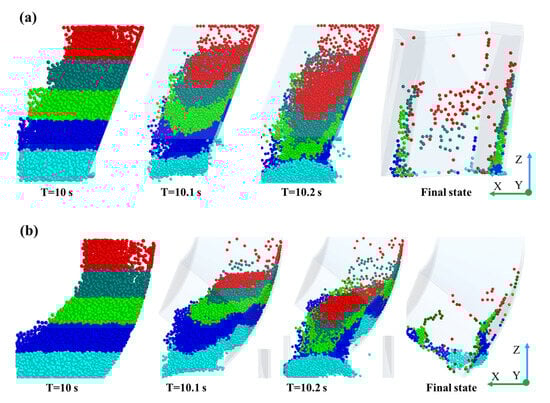
Figure 7.
The particle flow patterns in the transfer chute: (a) the particle flow patterns in (a) cases 1 and 3 and (b) cases 2 and 4, where the particle flow is stratified into five distinct layers from top to bottom, each designated by a unique color, with the red layer designated as the topmost stratum.
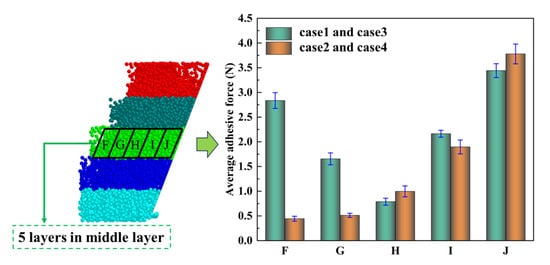
Figure 8.
The average adhesive forces in the 5 layers within the chute, where F, E, G, H, and J denote five concentric particle strata progressing inward, where F represents the outermost stratum and J signifies the innermost stratum—specifically, particles adjacent to the wall surface.
3.2. Influence of Vibration Parameters
3.2.1. Influence of Vibration Amplitude
In this research, vibration was added to the transfer chute. Figure 9 illustrates the distribution of force chains inside the chute under different vibration amplitudes with a 60 Hz frequency. Cases 1 and 3 adopted a linear chute and cases 2 and 4 employed a curved chute; we selected one group (such as cases 1 and 3 or cases 2 and 4) as the research object. Figure 9a,b, show that as the vibration amplitude increased, the overall strength of the force chains gradually decreased. There were some breakages of strong force chains near the wall, while the number of weak force chains increased. These phenomena indicate that vibration can disrupt the adhesive bonds between particles and walls, thereby reducing adhesion and enhancing particle flow.
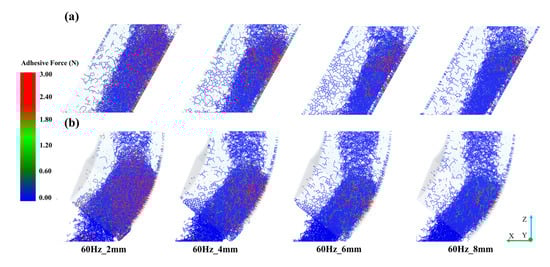
Figure 9.
The force chains in different vibration amplitudes within the chute. The force chains are displayed for cases 1 and 3 (a) and cases 2 and 4 (b).
Figure 10a shows the average adhesive force near the chute wall and it can be observed that the adhesive force decreases with increasing vibration amplitude (Figure 10b), which is consistent with the above force chains analysis. Additionally, the curved chute was more sensitive to vibration, as it exhibited a greater reduction in the adhesive force (Figure 10b).
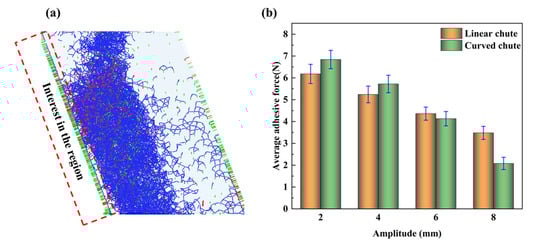
Figure 10.
The average adhesive forces near the wall in the transfer chute: (a) the adhesive force chain in the chute and (b) the average adhesive forces in the linear (cases 1 and 3) and curved chutes (case 2 and 4).
To visually demonstrate the phenomenon, the linear chute in case 1 was taken as an example and its particle flow patterns were displayed. Figure 11 divides the particles in the chute into five layers where each was designated by a unique color, with the red layer designated as the topmost stratum and shows the different flow patterns. Figure 11a,d show that the amplitude varies from 2 to 8 mm. It can be observed that a larger vibration amplitude results in the particles traveling a greater distance, indicating that higher amplitudes lead to stronger material flows. By extracting the displacement in the Z-coordinate of particle trajectories, shown in Figure 12, it can be seen that larger amplitudes result in the particles traveling further along the negative Z-axis direction, which aligns with the aforementioned observation. Similar phenomena and patterns were observed for the curved chutes in case 3, which will not be reiterated here.
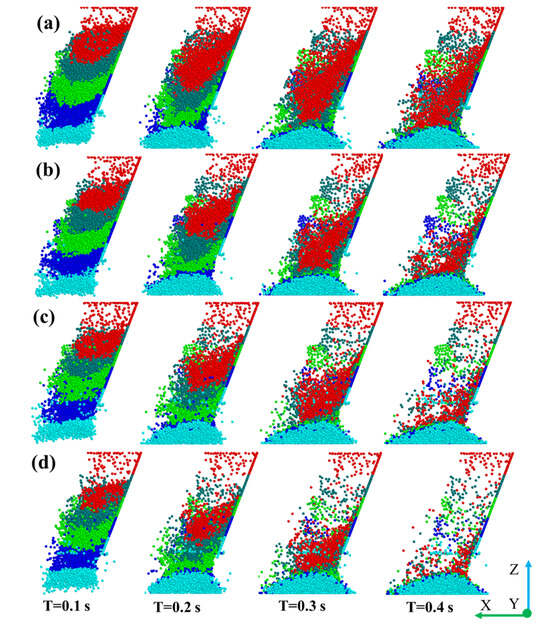
Figure 11.
Particle flow patterns in the linear chute under the different amplitude conditions in cases 1 and 3. The vibration amplitudes are 2 (a), 4 (b), 6 (c), and 8 mm (d) where the particle flow is stratified into five distinct layers from top to bottom, each designated by a unique color, with the red layer designated as the topmost stratum.
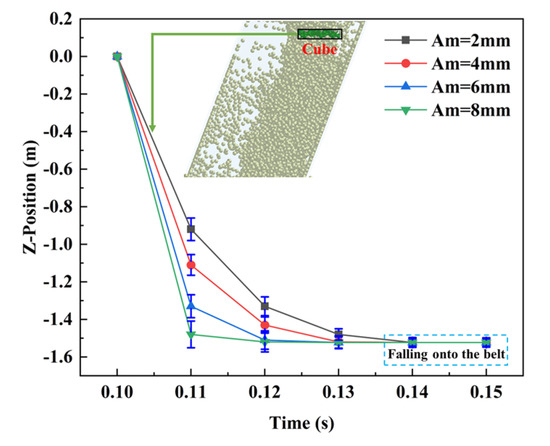
Figure 12.
Z-position of particles inside the selected cube of the linear chute.
3.2.2. Influence of Vibration Frequency
Cases 1 and 3 were selected as the research objects. Taking a vibration amplitude of 8 mm and vibration frequencies of 50 Hz and 60 Hz as the examples, the force chains inside the linear chute are illustrated in Figure 13. It is evident that strong force chains are mainly concentrated at the impact point and near the wall. Under the 60 Hz condition shown in Figure 13b,d, the number of strong force chains near the wall is significantly fewer than that under the 50 Hz condition shown in Figure 13a,c. This implies that increasing the vibration frequency can significantly reduce the adhesive effect between the particles and the wall.
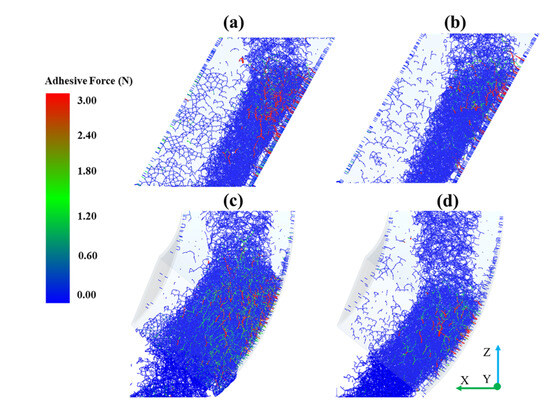
Figure 13.
The force chains are displayed for the linear chute vibrating at frequencies of 50 (a) and 60 Hz (b), and the curved chute vibrating at frequencies of 50 (c) and 60 Hz (d).
Reducing the adhesion force between the particles and the wall is crucial for addressing blockages. In Figure 14a, the area nearing the chute surface is divided into six parts, labeled parts (1) to (6). The average adhesive forces of the six parts are illustrated, and the average adhesive force significantly decreases with an increasing vibration frequency. Additionally, the error bars indicate that when the vibration frequency is lower, the adhesive force distribution near the chute wall is uneven along the Z-axis direction, which means a rising frequency reduces all the adhesive forces. The above information collectively indicates that increasing the vibration frequency can significantly enhance the adhesive bulk material flow. Figure 14b marks a specific region (cube) inside the chute where the particles were tracked for their motion trajectory, and the Z-axis coordinate variation was extracted. It can be observed that, at higher frequencies, the particles reached the conveyor belt first, indicating higher particle flowability, which aligns with the above conclusion.
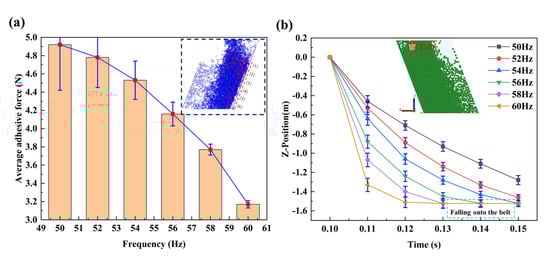
Figure 14.
The average adhesive forces (a) and Z-position of particles (b) near the transfer chute, where blocks 1 to 6 correspond to five distinct zones partitioned vertically from top to bottom within the near-wall region, representing the spatial distribution of force chains.
Similarly, vibration can increase the kinetic energy of particles and improve their flowability, as confirmed in other fields. Li et al. [39] discovered that external vibrations provide additional kinetic energy for particles, reduce the deposition effects of particles, and improve the passability of particles in the centrifugal pumps of deep-sea mining systems. Cao et al. [38] found that vibration can disrupt stronger contact properties, increase the flowability of fresh concrete, and may cause particle segregation. Furthermore, Chen [41], Nie [42], Qi [43], Arifuzzaman [44], and Jezerska [45] discovered that vibration can improve the efficiency of potato–soil separation, filling density, compaction of subgrade, percolation characteristics, and particle flowability, respectively, by weakening or breaking the contact properties between particles, such as friction and adhesion.
3.3. Optimization of Vibrations and Structures
Through the above analysis, it is evident that both the vibration frequency and amplitude are beneficial for improving adhesive materials’ flowability and alleviating blockages.
To more systematically demonstrate the impact of vibration on adhesive bulk materials’ flowability, the vibration intensity was selected as the variable. Figure 15a shows the particle velocities at the bottom. The particle velocity increased with the growth in the vibration intensity, and it was directly proportional to the vibration intensity. The power exponent of the linear chute was almost 0.24 (cases 1 and 3) and the power exponent of the curved chute was almost 0.30 (cases 2 and 4). Therefore, the curved chute was more sensitive to the vibration intensity than the linear chute. In addition, the particle velocities in the curved chute were generally lower than those in the linear chute. The above results coincide with those in Section 3.2.1.
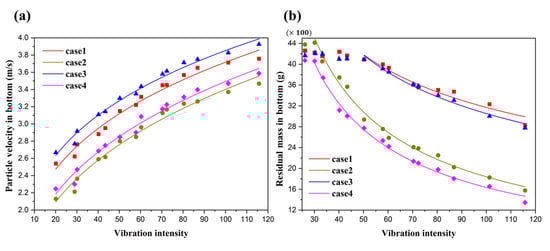
Figure 15.
Average particle velocities at the bottom: (a) “Deflect hood + Linear chute”: ; “Deflect hood + Curved chute”: ; “Impact plate + Linear chute”: ; and “Impact plate + Curved chute”: . Residual mass in the chute: (b) “Deflect hood + Linear chute”: ; “Deflect hood + curved chute”: ; “Impact plate + Linear chute”: ; and “Impact plate + curved chute”: .
Figure 15b shows the residual mass adhered to the transfer chute. It is obvious that the residual mass of the adhesive coals increased with the growth in the vibration intensity, and it was also directly proportional to the vibration intensity. The power exponent of the linear chute was almost −0.45 (cases 1 and 3) and the power exponent of the curved chute was almost −0.75 (cases 2 and 4), indicating that the curved chute was more sensitive to the vibration intensity, which is consistent with the above velocity model. Under the same conditions, the residual materials’ mass in the curved chute was lower than that in the linear chute, which is consistent with the results in Section 3.2.2. Therefore, the curved chute is superior to the linear chute.
In addition, it can also be observed that there is a critical value of vibration intensity for the residual materials’ mass. Taking a residual mass of 4 kg as the initial value where no vibration was used on the chute, it was found that the critical vibration intensity for cases 1 to 4 was 55, 35, 52, and 30, respectively. When the vibration intensity that acted on the transfer chute was lower than the critical value, it could not improve the materials’ flowability and relieve blockages. Therefore, case 4, namely, “Impact plate & curved chute”, was the best structure under this vibration condition. Furthermore, the corresponding critical value of the vibration intensity was almost 30. The critical intensity value can be used as a reference for engineers in terms of adhesive bulk materials conveyance.
The experiments were conducted by Longking Environmental Protection Co., Ltd., Longyan, China and the blockage weighing tests were completed at Xiamen Huaxia Power Plant. The on-site test equipment is shown in Figure 16, which mainly includes the deflect hood on the left and the linear chute on the right, with the vibratory motor located at the chute.
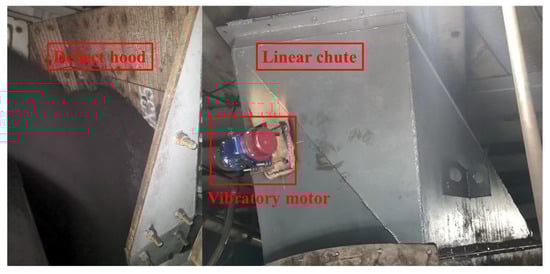
Figure 16.
The test equipment.
Due to the processing and assembly difficulties of the curved chute, the company has not yet conducted tests on this part. The experimental results mainly refer to the original linear chute. The residual mass from the experiment (Exp) and DEM simulations are summarized as follows in Figure 17. Figure 17a,b show the material residue mass in case 1 and case 2, respectively. Based on the specifications of the vibration motor, five vibration intensities were designed: 20, 40, 60, 80, and 100. From the figures, it can be seen that when the vibration intensity exceeded 40, the material residue decreased significantly as the vibration intensity increased. This is consistent with the conclusion from Figure 15b. Furthermore, the trend of the DEM simulation values is also consistent with the experimental measured values. However, due to the limitations of the adhesion model used in the DEM, which cannot account for the consolidation characteristics of granular materials, the DEM simulation values are smaller than the experimental measured values. Although the numerical values are difficult to align perfectly, the overall pattern is indeed consistent, and the conclusion can still guide the industrial material transport process.
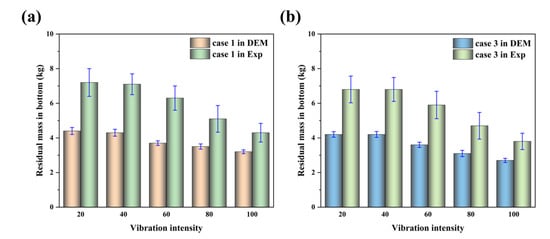
Figure 17.
The residual mass within the chute in the DEM and experiment (Exp): (a) case 1: deflect and linear chute; (b) case 3: impact plate and linear chute.
This study primarily investigated the blockage issue of wet coal during conveying processes. The applicability of the findings is subject to material-specific limitations. While blockage phenomena occur universally in the handling of any cohesive bulk materials, the conclusions drawn herein may not extend to all material types. Nevertheless, the methodological approach proposed—specifically, combining curved chutes with impact plates alongside optimized vibrational parameters, which need not be identical to the values used in this study—could be used to mitigate blockage risks in broader industrial contexts.
4. Conclusions
In this research, the viscous material flow in a transfer system was researched based on the DEM. The results indicate that the adhesive behaviors varied among the different structures, and that vibration could significantly improve the wet coals’ flow. The details are provided below:
- (1)
- The coals primarily adhered to the upper and chute areas of the transfer system. In the upper area, the adhesive coals tended to stick near the deflector or the surface of the impact plate. In the chute area, the coals primarily adhered to the impact point and the nearby chute wall.
- (2)
- The adhesive force and residual materials’ amount on the impact plate were all slightly lower than those on the deflect hood. The particles’ flowability on the impact plate was slightly superior than that on the deflect hood. For the chute, the particle velocity and amounts of adhered materials in the curved chute were lower than those in the linear chute because the curved chute was more sensitive to vibration.
- (3)
- Both the vibration frequency and amplitude could, to some extent, disrupt the adhesive bonds between the particles and the wall, thereby improving the flowability of the adhered bulk materials. Therefore, increasing the vibration parameters contributed to higher material flowability.
- (4)
- The average particle velocity inside the chute was directly proportional to the positive power of the vibration intensity, while the residual materials’ mass was inversely proportional to the negative power of the vibration intensity. Furthermore, for the curved chute, the flowability and adhered mass were more sensitive to the vibration intensity. The vibration intensity had a critical value; only when the applied vibration parameters exceeded this threshold could the vibration improve the adhesive bulk materials’ flowability. It was found that the critical vibration intensity from cases 1 to 4 was 55, 35, 52, and 30, respectively. Therefore, case 4, namely, “Impact plate & curved chute”, was the best structure. The critical intensity value can be used as a reference for engineers in terms of adhesive bulk materials conveyance.
Author Contributions
Conceptualization, J.L.; methodology, J.L., S.Z. and Y.T.; software, Y.T.; validation, J.L., Y.T. and S.Z.; formal analysis, J.L.; investigation, J.L., Y.T., S.Z. and J.Z.; resources, Y.T.; data curation, J.L.; writing—original draft preparation, J.L.; writing—review and editing, J.L., Y.T. and S.Y.; visualization, J.L. and S.Y.; supervision, Y.T.; project administration, Y.T.; funding acquisition, Y.T. All authors have read and agreed to the published version of the manuscript.
Funding
This research was funded by the Science and Technology Plan Project of Quanzhou, China (2023GZ5) and the High-Level Talent Recruitment Project of Quanzhou, China (2023CT011).
Data Availability Statement
The original contributions presented in this study are included in the article. Further inquiries can be directed to the corresponding author.
Acknowledgments
During this study, the authors used Rocky DEM 4.3 version for the purposes of simulating. The authors have reviewed and edited the output and take full responsibility for the content of this publication. The authors would also like to thank the National and Local Joint Engineering Research Center for Intelligent Manufacturing Technology of Brittle Material Products for the materials tests.
Conflicts of Interest
The authors declare no conflicts of interest or personal relationships that could have appeared to influence the work reported in this paper.
References
- Bortnowski, P.; Kawalec, W.; Król, R.; Ozdoba, M. Types and causes of damage to the conveyor belt—Review, classification and mutual relations. Eng. Fail. Anal. 2022, 140, 106520. [Google Scholar] [CrossRef]
- Bortnowski, P.; Doroszuk, B.; Krol, R.; Marasova, D.; Moravic, M.; Ozdoba, M. Forecasting blockades of conveyor transfer points based on vibrodiagnostics. Measurement 2023, 216, 112884. [Google Scholar] [CrossRef]
- Roberts, A.W. Chute design considerations for feeding and transfer. In Proceedings of the BELTCON 11 International Materials Handling Conference, Randburg, South Africa, 31 July–2 August 2001; Available online: https://login.totalweblite.com/Clients/doublearrow/beltcon%202001/3.chute%20design%20considerations%20for%20feeding%20and%20transfer.pdf (accessed on 12 May 2023).
- Hann, D.; Strazisar, J. Influence of particle size distribution, moisture content, and particle shape on the flow properties of bulk solids. Instrum. Sci. Technol. 2007, 35, 571–584. [Google Scholar] [CrossRef]
- Grima, A.; Fraser, T.; Hastie, D.; Wypych, P. Discrete element modelling: Trouble-shooting and optimisation tool for chute design. In Proceedings of the Beltcon 16 Proceedings, Johannesburg, South Africa, 3–4 August 2011; Available online: https://hdl.handle.net/10779/uow.27694800.v1 (accessed on 10 May 2023).
- Aldrich, J.; Zhang, Y. Minimizing Belt Wear and Damage From Optimized Chute Design. In Proceedings of the SME Annual Meeting Conference, Salt Lake City, UT, USA, 23–26 February 2014; Available online: http://conveyor-dynamics.com/wp-content/uploads/2014/05/2014-SME-Minimizing-Belt-Wear-and-Damage-from-Optimized-Chute-Design-Aldrich-and-Zhang-Rev1-4.pdf (accessed on 10 May 2023).
- Kukreja, K.; Soni, M.K.; Nainegali, M.S.; Mohapatra, B. Development of transfer chute design through discrete element modelling for using refused derived fuel in Indian cement plants. Sustain. Energy Technol. Assess. 2022, 53, 102567. [Google Scholar] [CrossRef]
- Ji, C.Y. Discrete Element Simulation Study on the Flow Behavior of Coal Particles in Transfer Systems. Master’s Thesis, Huaqiao University, Quanzhou, China, 2022. [Google Scholar] [CrossRef]
- Yoshida, M.; Takatsuki, R.; Sakamoto, G.; Oshitani, J.; Gotoh, K. Dem simulation and analysis of the effects of adhesive forces and rotations of admixed particles on improving main particle flowability. Adv. Powder Technol. 2016, 27, 2084–2093. [Google Scholar] [CrossRef]
- Nguyen, D.; Rasmuson, A.; Thalberg, K.; Björn, I.N. The exchange of fines between carriers in adhesive particle mixing: A study using dem simulation. Powder Technol. 2016, 288, 266–278. [Google Scholar] [CrossRef]
- Komori, M.; Yoshida, M.; Shimosaka, A.; Shirakawa, Y. Dem simulation analysis of the improvement in particle discharge flowability using adhesive force distribution models based on admixed particle coating. Adv. Powder Technol. 2022, 33, 103355. [Google Scholar] [CrossRef]
- Li, J.; Wu, Y. Lubricants in pharmaceutical solid dosage forms. Lubricants 2014, 2, 21–43. [Google Scholar] [CrossRef]
- Persson, A.; Alderborn, G.; Frenning, G. Flowability of surface modified pharmaceutical granules: A comparative experimental and numerical study. Eur. J. Pharm. Sci. 2011, 42, 199–209. [Google Scholar] [CrossRef] [PubMed]
- Wassgren, C.R.; Hunt, M.L.; Freese, P.J.; Palamara, J.; Brennen, C.E. Effects of vertical vibration on hopper flows of granular material. Phys. Fluids 2002, 14, 3439–3448. [Google Scholar] [CrossRef]
- Zhou, S.; Ren, Z.; Zhang, Y.; Ju, J. Analysis of flow characteristics of granular material unloaded on nonlinear vibration inclined platform. Appl. Math. Model. 2020, 78, 57–74. [Google Scholar] [CrossRef]
- Zhao, L.; Duan, C.; Jiang, H.; Li, H.; Zhao, Y.; Zheng, Q. Dem simulation of size segregation of binary mixtures of cohesive particles under a horizontal swirling vibration. Powder Technol. 2022, 404, 117456. [Google Scholar] [CrossRef]
- Fartashvand, V.; Abdullah, A.; Vanini, S.A.S. Effects of high power ultrasonic vibration on the cold compaction of titanium. Ultrason. Sonochemistry 2017, 36, 155–161. [Google Scholar] [CrossRef] [PubMed]
- Zhu, G.; Luo, Y.; Chen, C.; Shen, K.; Zhang, Y. Effect of metakaolin on the microstructure of cement-based artificial marble slabs incorporating natural marble offcuts under vacuum vibration compaction method. Constr. Build. Mater. 2023, 369, 130478. [Google Scholar] [CrossRef]
- Zhang, J.; Tan, Y.; Bao, T.; Xu, Y.; Jiang, S. Discrete element simulation for effects of roller’s vibrations on powder spreading quality. China Mech. Eng. 2020, 31, 1717–1723. [Google Scholar] [CrossRef]
- Tahmasebi, P. A state-of-the-art review of experimental and computational studies of granular materials: Properties, advances, challenges, and future directions. Prog. Mater. Sci. 2023, 138, 101157. [Google Scholar] [CrossRef]
- Rycroft, C.H.; Kamrin, K.; Bazant, M.Z. Assessing continuum postulates in simulations of granular flow. J. Mech. Phys. Solids 2009, 57, 828–839. [Google Scholar] [CrossRef]
- Wu, K.; Francia, V.; Coppens, M. Dynamic viscoplastic granular flows: A persistent challenge in gas-solid fluidization. Powder Technol. 2020, 365, 172–185. [Google Scholar] [CrossRef]
- Zou, Y.; Zou, R.; Wu, Y. CFD-DEM study on agglomeration and spout-assisted fluidization of cohesive particles. Powder Technol. 2024, 436, 119512. [Google Scholar] [CrossRef]
- Nan, W.; Goh, W.P.; Rahman, M.T. Elasto-plastic and adhesive contact: An improved linear model and its application. Powder Technol. 2022, 407, 117634. [Google Scholar] [CrossRef]
- Zhang, J.; Tan, Y.; Xiao, X.; Jiang, S. Comparison of roller-spreading and blade-spreading processes in powder-bed additive manufacturing by dem simulations. Particuology 2022, 66, 48–58. [Google Scholar] [CrossRef]
- Zhao, L.; Li, Y.; Yang, X.; Jiao, Y.; Hou, Q. Dem study of size segregation of wet particles under vertical vibration. Adv. Powder Technol. 2019, 30, 1386–1399. [Google Scholar] [CrossRef]
- Bahramian, A.; Olazar, M. Influence of restitution and friction coefficients on the velocity field of polydisperse TiO2 ag-glomerates in a conical fluidized bed by the adhesive CFD-DEM simulation. Powder Technol. 2021, 386, 491–504. [Google Scholar] [CrossRef]
- Louati, H.; Bednarek, X.; Martin, S.; Ndiaye, A.; Bonnefoy, O. Qualitative and quantitative dem analysis of cohesive granular material behaviour in ft4 shear tester. Chem. Eng. Res. Des. 2019, 148, 155–163. [Google Scholar] [CrossRef]
- Zhong, W.; Zakhvatayeva, A.; Zhang, L.; Wu, C. Powder flow during linear and rotary die filling. Int. J. Pharm. 2021, 602, 120654. [Google Scholar] [CrossRef]
- Jiang, S.; Chen, X.; Cao, G.; Tan, Y.; Xiao, X.; Zhou, Y.; Liu, S.; Tong, Z.; Wu, Y. Optimization of fresh concrete pumping pressure loss with cfd-dem approach. Constr. Build. Mater. 2021, 276, 122204. [Google Scholar] [CrossRef]
- Wu, C. DEM simulations of die filling during pharmaceutical tabletting. Particuology 2008, 6, 412–418. [Google Scholar] [CrossRef]
- Chen, J.; Krengel, D.; Nishiura, D.; Furuichi, M.; Matuttis, H. A force–displacement relation based on the jkr theory for dem simulations of adhesive particles. Powder Technol. 2023, 427, 118742. [Google Scholar] [CrossRef]
- Hertz, H. Ueber die Berührung fester elastischer Körper. J. Reine Angew. Math. 2009, 1882, 156–171. [Google Scholar] [CrossRef]
- Bierwisch, C.; Kraft, T.; Riedel, H.; Moseler, M. Three-dimensional discrete element models for the granular statics and dynamics of powders in cavity filling. J. Mech. Phys. Solids 2009, 57, 10–31. [Google Scholar] [CrossRef]
- Chen, X.; Elliott, J.A. On the scaling law of JKR contact model for coarse-grained cohesive particles. Chem. Eng. Sci. 2020, 227, 115906. [Google Scholar] [CrossRef]
- Carr, M.J.; Roessler, T.; Robinson, P.W.; Otto, H.; Richter, C.; Katterfeld, A.; Wheeler, C.A. Calibration procedure of discrete element method (dem) parameters for wet and sticky bulk materials. Powder Technol. 2023, 429, 118919. [Google Scholar] [CrossRef]
- Mohajeri, M.J.; van Rhee, C.; Schott, D.L. Replicating cohesive and stress-history-dependent behavior of bulk solids: Feasibility and definiteness in DEM calibration procedure. Adv. Powder Technol. 2021, 32, 1532–1548. [Google Scholar] [CrossRef]
- Cao, G.; Bai, Y.; Shi, Y.; Li, Z.; Deng, D.; Jiang, S.; Xie, S.; Wang, H. Investigation of vibration on rheological behavior of fresh concrete using cfd-dem coupling method. Constr. Build. Mater. 2024, 425, 135908. [Google Scholar] [CrossRef]
- Li, Y.; Liu, D.; Cui, B.; Lin, Z.; Zheng, Y.; Ishnazarov, O. Studying particle transport characteristics in centrifugal pumps under external vibration using cfd-dem simulation. Ocean Eng. 2024, 301, 117538. [Google Scholar] [CrossRef]
- Zhao, L.; Zhao, Y.; Bao, C.; Hou, Q.; Yu, A. Laboratory-scale validation of a dem model of screening processes with circular vibration. Powder Technol. 2016, 303, 269–277. [Google Scholar] [CrossRef]
- Chen, M.; Liu, X.; Hu, P.; Zhai, X.; Han, Z.; Shi, Y.; Zhu, W.; Wang, D.; He, X.; Shang, S. Study on rotor vibration potato-soil separation device for potato harvester using dem-mbd coupling simulation. Comput. Electron. Agric. 2024, 218, 108638. [Google Scholar] [CrossRef]
- Nie, Z.; Chen, Y.; Qi, Q.; Zeng, J.; Lai, R. Investigating the effects of particle spatial evolutions on the vibration-induced compaction deformation of gap-graded mixtures via dem models. Powder Technol. 2023, 428, 118841. [Google Scholar] [CrossRef]
- Qi, Q.; Nie, Y.; Wang, X.; Liu, S. Exploring the effects of size ratio and fine content on vibration compaction behaviors of gap-graded granular mixtures via calibrated dem models. Powder Technol. 2023, 415, 118156. [Google Scholar] [CrossRef]
- Arifuzzaman, S.; Dong, K.; Zhu, H.; Zeng, Q. Dem study and machine learning model of particle percolation under vibration. Adv. Powder Technol. 2022, 33, 103551. [Google Scholar] [CrossRef]
- Jezerska, L.; Prokes, R.; Gelnar, D.; Zegzulka, J. Hard gelatine capsules: Dem supported experimental study of particle arrangement effect on properties and vibrational transport behaviour. Powder Technol. 2022, 405, 117525. [Google Scholar] [CrossRef]


Disclaimer/Publisher’s Note: The statements, opinions and data contained in all publications are solely those of the individual author(s) and contributor(s) and not of MDPI and/or the editor(s). MDPI and/or the editor(s) disclaim responsibility for any injury to people or property resulting from any ideas, methods, instructions or products referred to in the content. |
© 2025 by the authors. Licensee MDPI, Basel, Switzerland. This article is an open access article distributed under the terms and conditions of the Creative Commons Attribution (CC BY) license (https://creativecommons.org/licenses/by/4.0/).