Article

Improving Recovery Mechanism Through Multi-Well Water and Gas Injection in Underground River Reservoirs

1
Shengli Oilfield Company, Sinopec, Dongying 257000, China
2
School of Petroleum Engineering, China University of Petroleum (East China), Qingdao 266580, China
*
Authors to whom correspondence should be addressed.
Processes 2025, 13(9), 2743; https://doi.org/10.3390/pr13092743
Submission received: 11 July 2025 / Revised: 5 August 2025 / Accepted: 8 August 2025 / Published: 27 August 2025
(This article belongs to the Special Issue Advances in Unconventional Reservoir Development and CO2 Storage)

Abstract

Underground river reservoirs are dominated by large-scale elongated caves and are typical fractured–vuggy carbonate reservoirs. This paper established physical models of underground river reservoirs with different filling modes. We first conducted bottom water flooding experiments and then studied multi-well, alternating water flooding and gas injection. The remaining oil distribution patterns and key factors under different filling modes and well locations were studied to clarify the recovery-improvement mechanisms of multi-well water and gas injection. The results show that the remaining oil after bottom water flooding can be categorized into the following five types: “insufficient well control remaining oil”, “attic remaining oil”, “bypass remaining oil”, “residual oil in filling medium”, and “shielded oil in filling medium”. Early water injection effectively recovers “insufficient well control remaining oil”, “bypass remaining oil”, and “residual oil in filling medium”. Gas injection targets included “attic remaining oil”. Late water injection can further improve recovery. When the cave is partially filled, there exists a large amount of “shielded oil in filling medium” that is difficult to recover, reducing recovery by 27% compared to unfilled cases. This study clarified the remaining oil distribution laws and water–gas flooding mechanisms for underground river reservoirs, providing guidance for efficient development.

1. Introduction

Because of growing global demand for oil resources, carbonate reservoirs have become an important source of reserve and production growth in oilfields worldwide [1,2,3]. Carbonate reservoirs often contain abundant natural fractures and dissolution pores, referred to as fractured–vuggy reservoirs, which exhibit extreme heterogeneity compared with conventional reservoirs [4,5]. The heterogeneous distribution of fractures and vugs leads to complex multiphase flow behavior during water flooding in fractured–vuggy reservoirs [6]. The interactions between matrix, fractures, and vugs result in an unfavorable mobility ratio, complex wettability conditions, and variable relative permeability curves [7,8]. These complex flow mechanisms often cause low sweep efficiency, premature water breakthrough, and a large amount of remaining oil enriched in fractures and vugs after water flooding [9,10]. Therefore, it is of great significance to reveal the displacement process, remaining oil distribution patterns and recovery mechanisms in fractured–vuggy reservoirs for guiding oilfield development.
As typical fractured–vuggy carbonate reservoirs, underground river reservoirs are dominated by kilometer-scale elongated caves, which were formed by prolonged underground river erosion over geological periods [11,12]. The large-scale caves are often partially or fully filled with sediments, containing a large amount of oil reserves. The existence of complex underground river cave systems poses a significant challenge to the development of this type of reservoir [13]. Firstly, the extreme heterogeneity caused by cave distribution leads to serious water channeling along high-permeability zones during water flooding. Secondly, the complex connectivity between caves and fractures results in variable flow patterns under different well arrangements. Thirdly, the partial filling of caves changes the flow regimes within different cave segments. These factors interact with each other and render the displacement process fundamentally distinct from common fractured–vuggy reservoirs.
Recently, researchers have conducted experimental and numerical simulation studies on oil displacement mechanisms and remaining oil distributions in fractured–vuggy reservoirs. Jing Wang [14] identified via water flooding experiments on full-diameter core models that the remaining oil in fractured–vuggy reservoirs can be mainly divided into the following five types: attic oil, sealed oil, corner oil, dead-end oil, and oil film. He believed that attic oil is caused by oil–water gravity differentiation, that sealed oil is formed due to delayed oil–water displacement, and that corner oil and dead-end oil are caused by the irregularity of caves and the weak connectivity of fractures and caves; moreover, he asserts that the existence of oil film is due to the oil-wet wettability of rocks in fractured–vuggy reservoirs. Wei Li [15] found similar types of remaining oil through visualization experiments with carbonate plate models and pointed out that the remaining oil at high positions (attic oil) was the key to improving the recovery of fractured–vuggy reservoirs. Dengyu Yuan [16], when studying the physical experiment of remaining oil distribution patterns, considered the filling characteristics in caves and found that cone-shaped remaining oil similar to that in sandstone reservoirs also existed in filled and semi-filled caves in fractured–vuggy reservoirs. Guang Lu [17] established an organic glass-etched model with complex fractures and caves based on the actual geological map of the Tahe Oilfield; they carried out bottom water flooding experiments. In addition to discovering the abovementioned residual oil types proposed by previous scholars, he further refined the classification of attic oil and sealed oil. He believes that attic oil can be divided into the following types: well-spot type, inter-well type, and local-high-point type. He asserts that sealed oil can be divided into single-channel type, multi-channel type, and longitudinal-parallel type. The huge scale of caves and complex cave–fracture connectivities make the displacement process and remaining oil distribution much different from common fractured–vuggy reservoirs [18,19].
For underground river reservoirs in Tahe Oilfield, bottom water flooding had been commonly employed prior to well pattern implementation, which can effectively maintain formation energy and improve oil recovery [20,21]. However, due to gravity differentiation between oil and water, water channeling through high-permeability zones, and poor horizontal displacement efficiency, a large amount of oil remains after bottom water flooding. Revealing the features and influential factors of the remaining oil distribution is of considerable importance for guiding subsequent infilling well pattern implementation and enhanced oil recovery. Currently, the understanding of flow mechanisms and remaining oil distribution laws in underground river reservoirs is still insufficient. Physical simulation experiments allow for the direct observation of the displacement process and remaining oil morphology, providing valuable insights.
In this paper, firstly, based on the characteristics of the underground river reservoir and fluid parameters, a physical experiment was designed; then, a bottom water flooding oil recovery experiment was carried out, and the types and formation mechanisms of remaining oil were analyzed; finally, the remaining oil exploitation mechanism was studied by using the method of multi-well water and gas injection to enhance oil recovery. The innovation of this article lies in the following aspects: (1) designs physical models simulating three filling modes (no/high/partial filling); (2) quantification of five types of remaining oil and their recovery mechanisms; (3) the unique role of gas injection in recovering attic oil is revealed. The results provide new insights for enhancing EOR in heterogeneous carbonate reservoirs.

2. Experiments and Methods

This study employed physical experiments for research. The fabrication of the experimental model, the scaling of the scale, the selection of fluid parameters, the establishment of the experimental process, and the design of the experimental scheme are essential components.

2.1. Experimental Model and Materials

The underground river reservoir is characterized by large-scale elongated caves. The area controlled by wells TK438, TK469, and TK403 in the southwest corner of unit S48 in Tahe Oilfield is a typical underground river reservoir. According to the inter-well geological section, the morphology of caves and fractures is outlined by using AutoCAD 2020 version software to construct the physical model, as shown in Figure 1. The geometric scaling ratio of 1:100,000 was applied based on Buckingham π theorem. This scaling preserved similarity maintaining similarity in gravity–capillary forces (Bond number) and viscosity–gravity forces (Rayleigh number) to ensure dynamic similarity with actual reservoirs. The model dimensions were 50 cm (length) × 30 cm (height) × 2 cm (width), wih caves and fractures etched to a depth of 1 cm. Given that low-resolution fractures typically exert a relatively minor influence (typically less than 5%), the modeling of small-scale fractures was neglected. The width of the large fault and the fracture is 2 mm and 0.5 mm, respectively. The wellbore radius is 4 mm. The experimental model was fabricated from acrylic material (Qingdao Kaiyu Intelligent Equipment Co., Ltd., Qingdao, China), which was selected for its exceptional optical transparency (enabling the direct visualization of fluid flow dynamics and remaining oil distribution) and its high mechanical strength (able to withstand the experimental pressure conditions). The fluids were formulated to match in situ reservoir properties. The specific method can be referred to in our previously published article in Physics of Fluids. The experimental set-up was designed independently, as shown in Figure 2.

2.2. Experimental Scheme and Procedures

For the underground river reservoir, the following three filling modes were considered: no filling media in the caves, high filling in the caves, and partial filling in the caves (Figure 3). Bottom water flooding and multi-well water and gas flooding after bottom water flooding were carried out. The injection rate (including bottom water, injection water, and injection gas) was 5 mL/min. Each group of experiments was divided into 6 stages. Stage 1 was the bottom water flooding period; stages 2 and 3 were the early water injection periods; stage 4 was the gas injection stage; stages 5 and 6 were the late water injection periods. Among them, the gas injection stage is a continuous gas injection process, and the gas type is nitrogen. Stage transitions were triggered when oil production rates fell below 0.1 mL/min for >10 min. The schematic diagrams of underground river reservoir models with different filling modes are shown in Figure 4, Figure 5 and Figure 6. The wells were designated as Well 1# (middle well), Well 2# (left well), and Well 3# (right well) for differentiation. The specific experimental schemes and well locations are shown in Table 1 and Table 2.

3. Results and Discussion

This section presents experimental findings through the following three analytical dimensions: bottom water flooding patterns, remaining oil classification, and enhanced recovery mechanisms of water–gas injection.

3.1. Bottom Water Flooding Pattern

3.1.1. Early Stage of Bottom Water Flooding

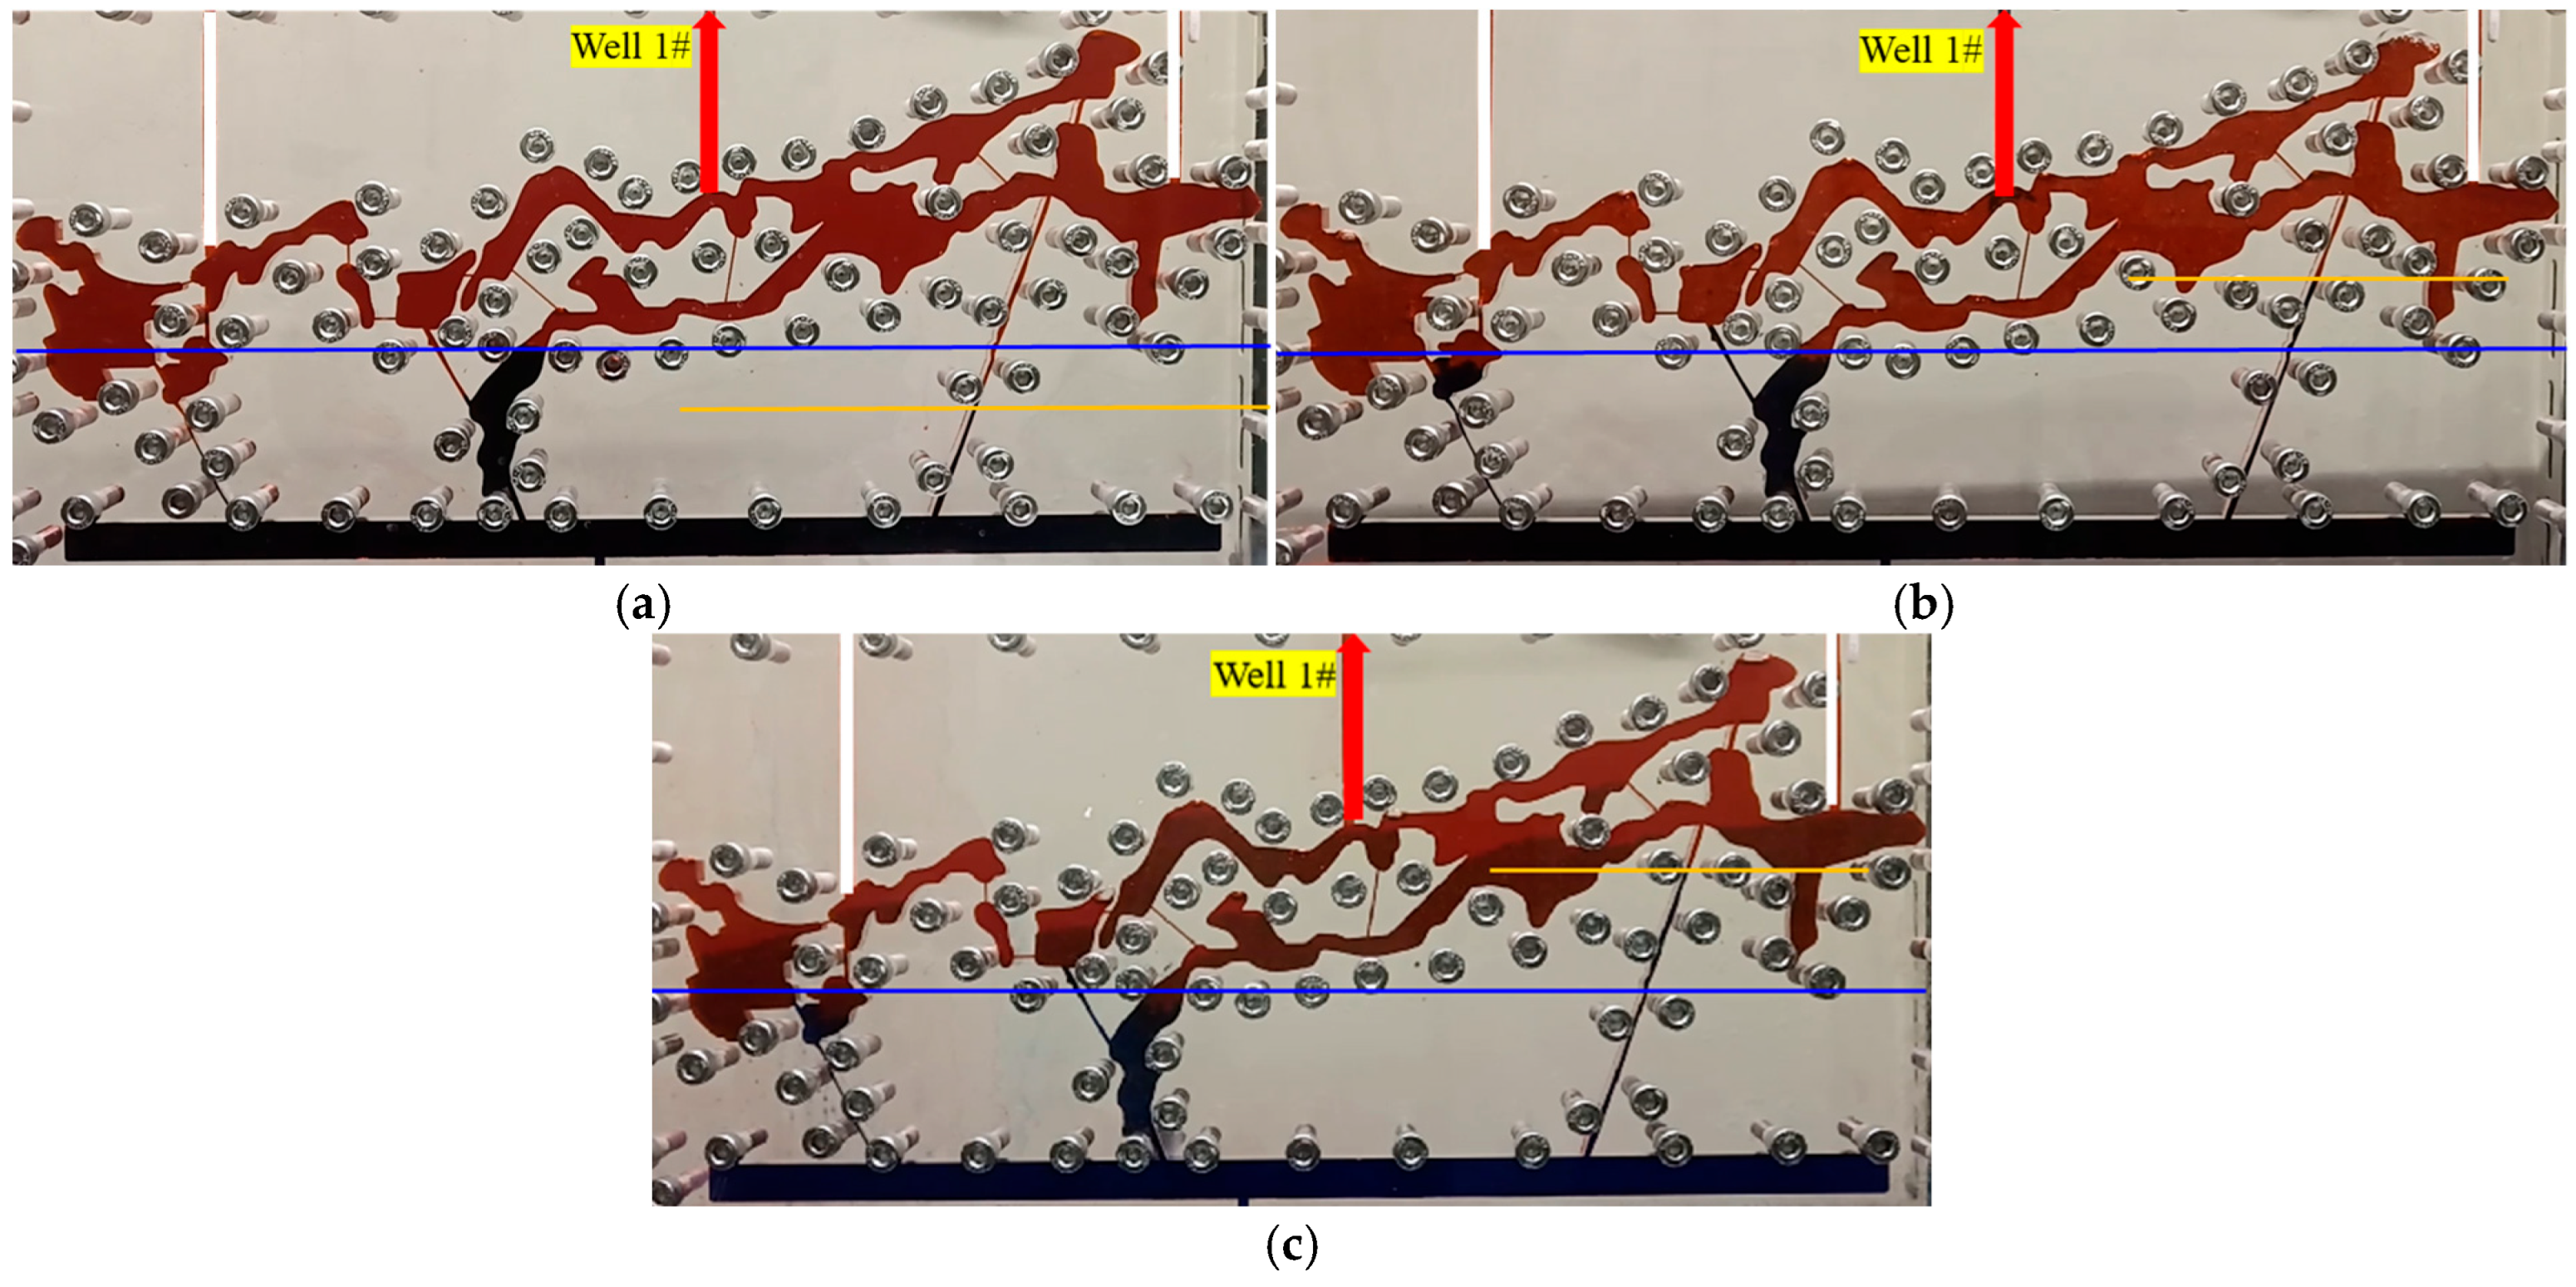
Due to the different flow resistance of the cavity area in cave voids, cave fillings, and fractures, the oil–water flow patterns were significantly different with different filling modes during bottom water flooding. Setting Well 1# as the production well, the oil–water distributions of the underground river reservoirs with different filling modes at the early stage of bottom water flooding are shown in Figure 4.
Although the density difference between oil and water remains unchanged, the oil–water interfaces exhibited elevation disparities between caves and fractures (the blue line is the oil–water interface elevation in the cave, and the orange line is the oil–water interface elevation in the fracture). Evidently, in unfilled caves, the oil–water interface in the cave was higher than that in the fracture. Conversely, in completely or partially filled caves, the oil–water interface in the fracture was higher than that in the cave. In addition, increased filling degree amplified elevation discrepancies in oil–water interface elevation between the fracture and the cave, with the partially filled cave having the largest difference.
The model wall surface exhibited weak oil-wet wettability. In Figure 4a, capillary forces within fractures impeded water flood efficiency, hindering oil displacement. In the caves, due to the large flow space diameter, the capillary force can be ignored. Consequently, flow resistance was substantially lower in caves than in fractures, resulting in a higher cave oil–water interface. In Figure 4b, the filling medium (also weakly oil-wet) possessed smaller pore diameters than fracture width. Therefore, the capillary resistance to water flooding in the filling area of the caves is greater than that in the fracture, causing the oil–water interface in the fracture to rise higher. According to Figure 4b,c, the highly filled caves presented a path to the production well (via the right large fracture) dominated by filling material, whereas the partially filled caves offered a path primarily comprising void space. The distribution differences of this filling pattern result in a higher oil–water interface for the latter.

3.1.2. Late Stage of Bottom Water Flooding

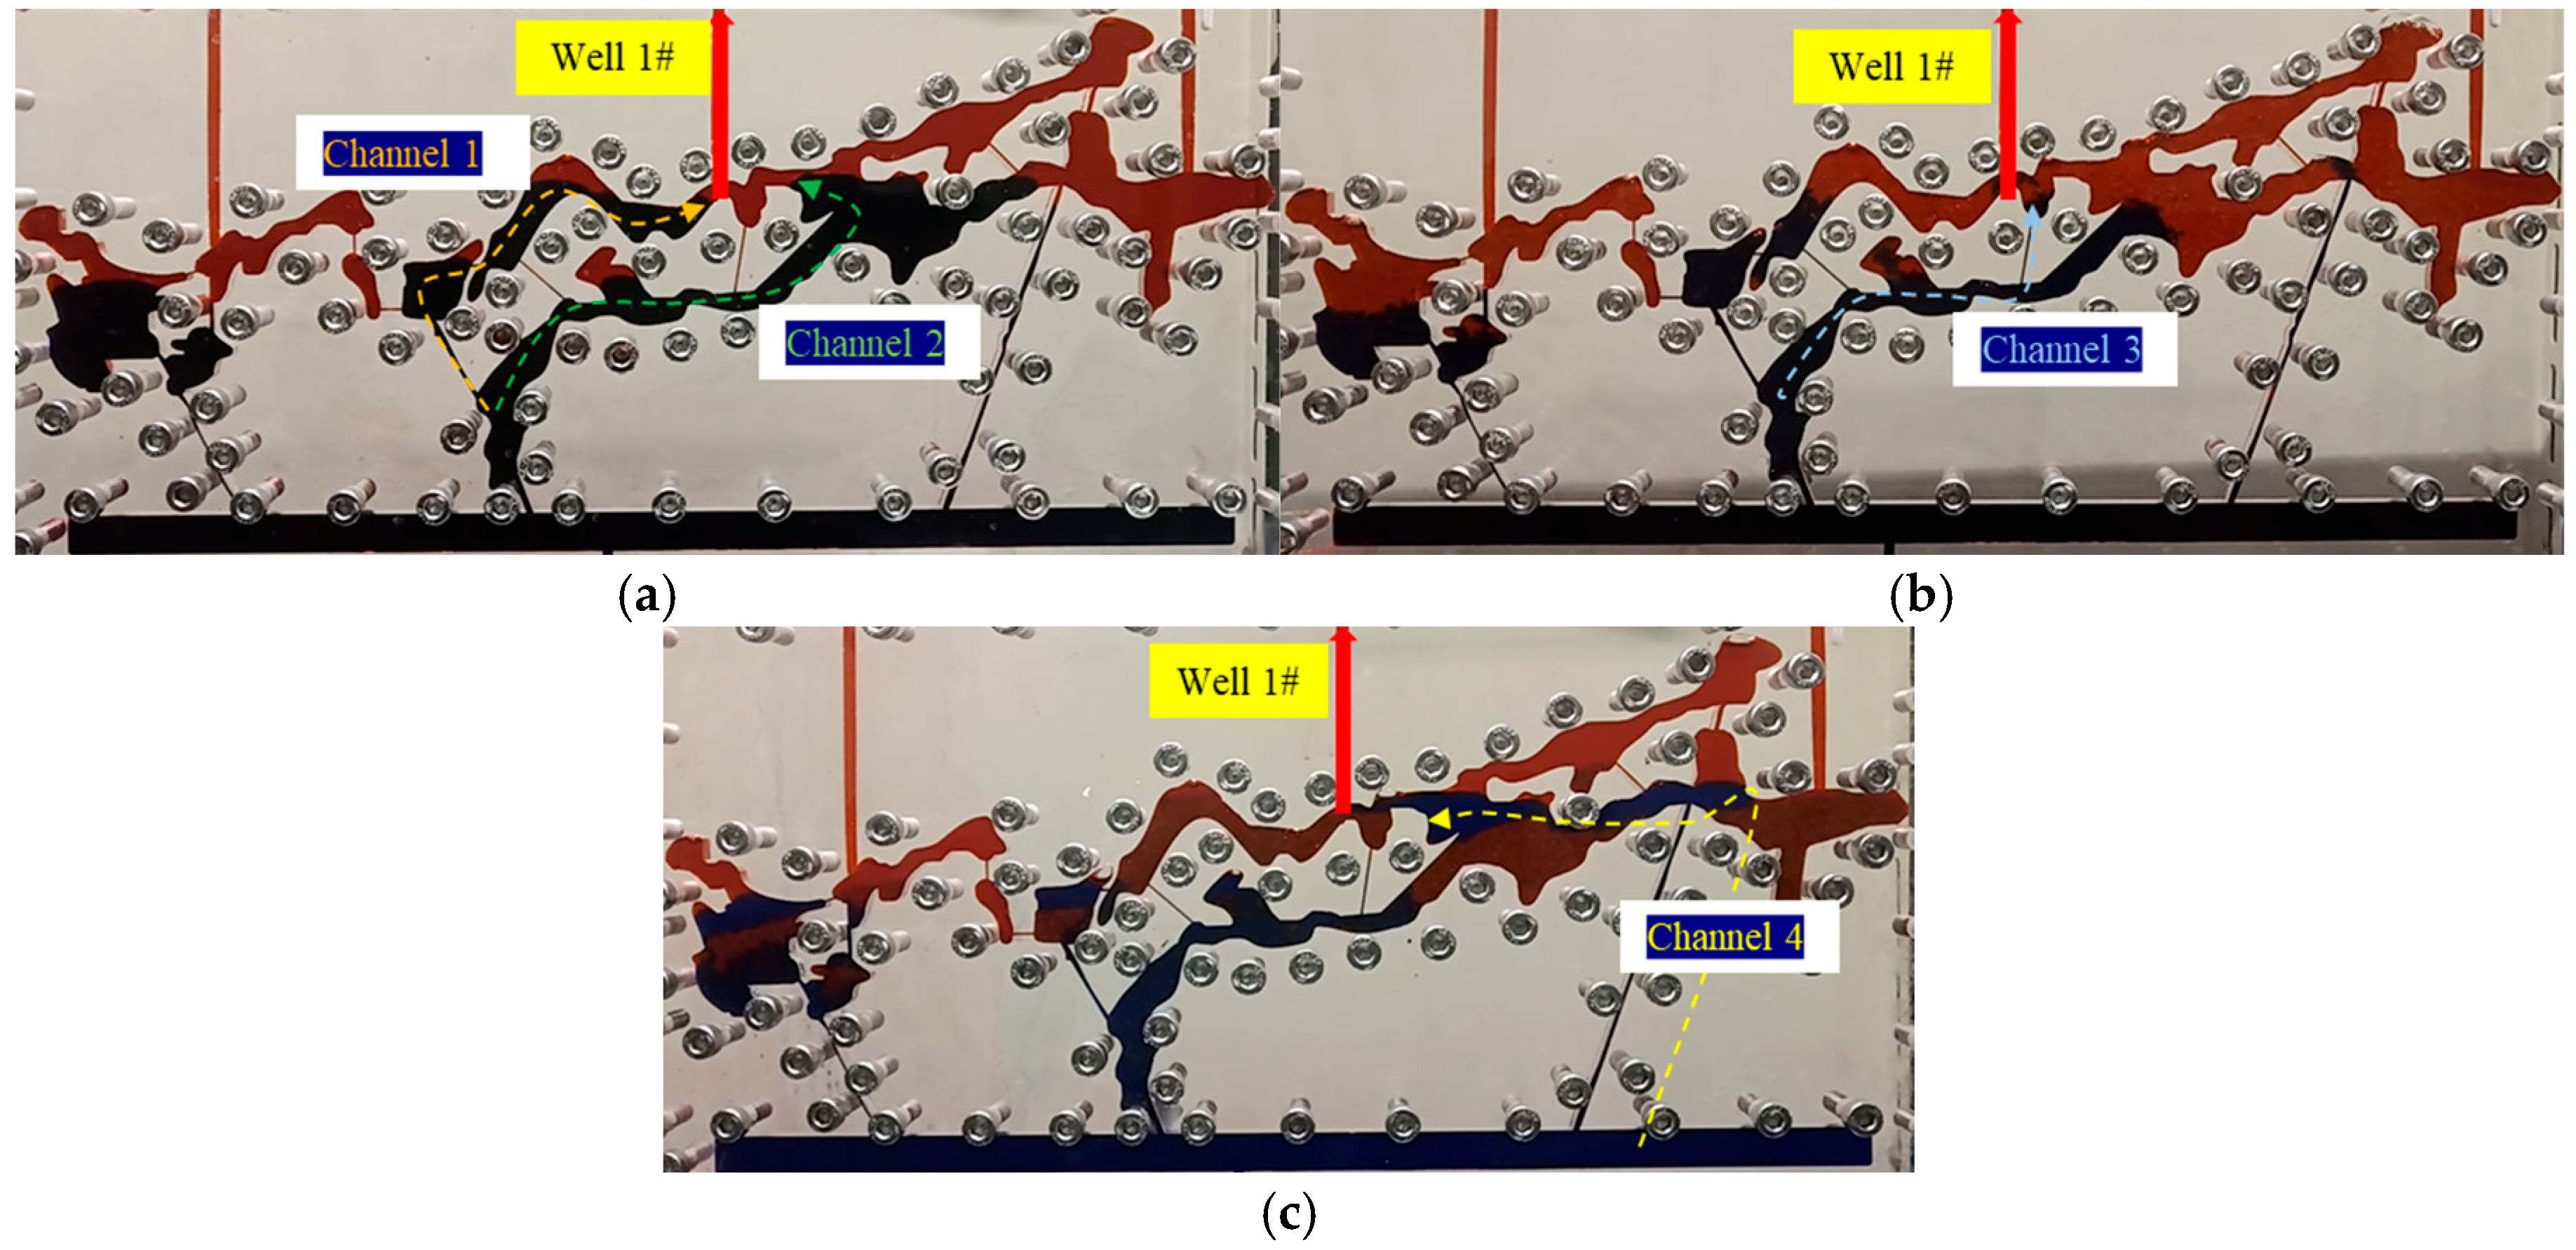
According to the analysis of the underground river reservoir structure, it can be seen that there are mainly 4 flow channels for bottom water to flow towards the production well, i.e., Channel 1 along the left side of the production well, Channel 2 and Channel 4 along the right side, and Channel 3 along the bottom fracture, as shown in Figure 5.
The oil–water distributions, with different filling modes when bottom water drives near the bottom of the production well, are shown in Figure 6. Influenced by fracture and filling medium distribution, the bottom water flow channels show significant differences for different filling modes. It can be seen from the figure that, with unfilled caves, the main channels for bottom water to flow to the bottom of the production well were Channel 1 and Channel 2; with completely filled caves, the bottom water mainly flows along Channel 3 towards the bottom of the production well; with partially filled caves, the bottom water mainly flows along Channel 4 to the bottom of the production well.
In the unfilled case (Figure 6a), Channel 2 was all a cavity area in the caves, while Channel 1 contains both cavity areas and fractures. When water flooding along Channel 2, the flow resistance was mainly gravity and viscous resistance; meanwhile, along Channel 1, there was also capillary resistance in the fractures. Therefore, from the perspective of flow resistance, bottom water was more likely to flow along Channel 2 towards the production well. However, Channel 2 was longer and the structural height of the fracture in Channel 1 was lower, so some bottom water flowed and rose along Channel 2, while the other part of the bottom water broke through the fracture in Channel 1. After the bottom water broke through the fracture, the water flooding resistance along the two channels became close, and they finally reached the bottom of the production well at almost the same time. In the completely filled case (Figure 6b), the higher waterflooding resistance within the filling medium (compared to fractures) directed bottom water preferentially upwards along the lower-resistance Channel 3. For the partially filled case (Figure 6c), the minimal flow resistance within the void space, coupled with Channel 4, exhibiting the lowest filling degree, resulted in bottom water advancing predominantly along Channel 4.

3.2. Remaining Oil Distribution Pattern and Mechanism After Bottom Water Flooding

The differences in oil–water distribution after bottom water flooding were huge for underground river reservoir models with different production wells and filling modes. The oil–water distributions after bottom water flooding in experimental schemes DXH01~DXH07 are shown in Figure 7.
Due to the extreme irregularity of the cave morphology in this underground river reservoir model, and the relatively complex connectivity between fractures and caves, the oil–water distributions exhibit significant differences under different production wells and filling modes. To facilitate the analysis of remaining oil distribution patterns after bottom water flooding, the model was divided into three regions: Region A (middle region), Region B (left region), and Region C (right region). Region A and Region C mainly comprised the main underground river, both with upper and lower layers; Region B comprised the branch caves of the underground river. According to the distribution of fractures and caves in different regions, Region A can be divided into the branch cave, the upper underground river, and the lower underground river; Region B can be divided into Cave 1, Cave 2, Cave 3, and Cave 4; Region C can be divided into the upper underground river and the lower underground river. The division of model regions is shown in Figure 8.

3.2.1. No Filling Media in the Caves

According to experimental schemes DXH01, DXH04 and DXH06, when there was no filling media in the caves, the oil–water distributions in Region A under different production wells are shown in Figure 9.
In the branch cave of Region A, production from Well 1# or Well 3# resulted in a small amount of “attic remaining oil” being stored in the top closure. Production from Well 2# yielded lower oil–water interfaces and greater remaining oil due to the poor connectivity of the cave with the production well, limited pressure drop propagation, and insufficient well control capacity.
In the lower underground river of Region A, when Well 1# or Well 3# was assigned for production, the region achieved near-complete sweep, with only a small amount of “attic remaining oil” in local high positions. When Well 2# was assigned for production, the pressure drop propagation range towards the main underground river was small, resulting in limited flooding extent. Oil retention stemmed from production well control can be called “insufficient well control remaining oil”.
In the upper underground river of Region A, when Well 1# was assigned for production, the injected water flowed along Channel 1 and Channel 2 towards the production well (the flow channels refer to Figure 5). Therefore, the spread range by bottom water was higher. However, as the bottom water flowed into the production well along Channel 1 first and water breakthrough happened immediately, a small amount of remaining oil was “sandwiched” between the two water zones. This kind of remaining oil from channel flow–capacity contrasts can be called “bypass remaining oil”. When Well 3# was assigned for production, bottom water was more likely to flow towards Region C and cause water breakthrough, resulting in more “bypass remaining oil”. When Well 2# was assigned for production, “insufficient well control remaining oil” was the main type of remaining oil.
The oil–water distributions in Region B under different production wells are shown in Figure 10. The differences in oil–water distribution in this region were mainly in Cave 1 and Cave 3.
In Cave 1, the oil–water interface was highest when Well 2# was assigned to production, and it was lowest when Well 3# was assigned to production. This phenomenon shows a pattern: the farther away the production well is, the lower the oil–water interface will be. This is because, the farther away the production well is, the more difficult it is for the pressure drop to propagate to the cave, the smaller the pressure difference, and the more difficult it is to overcome gravity differentiation; this which is the result of the combined influence of multiple factors. The remaining oil formed under the greater influence of gravity at structural highs can be called “attic remaining oil”, while that formed under the greater influence of the wells’ control capacities, below the structural highs, can be called “insufficient well control remaining oil”.
In Cave 3, when Well 1# or Well 3# were assigned for production, the bottom water failed to break through the fracture between Cave 2 and Cave 3, resulting in significant oil accumulation persisting in the cave. When Well 2# was assigned for production, a small amount of remaining oil was displaced due to the direct connection between the cave and the production well. But because the oil drainage point position was low, and violent water breakthrough happened, a large amount of oil remained. This part of remaining oil was the “attic remaining oil”.
Under the three production well locations, common to all production scenarios, Cave 2 was completely flooded while Cave 4 was enriched with remaining oil. This was because Cave 2 was connected to the bottom water through a large fracture, and held a low position. Cave 4 was connected to the main underground river through a small fracture, with poor connectivity. The remaining oil formed in Cave 4 due to the bypass of bottom water can also be called the “bypass remaining oil”.
The oil–water distributions in Region C under different production wells are shown in Figure 11. Due to the higher structural position of the upper underground river and its location at the edge of the cave, a large amount of “attic remaining oil” existed there, regardless of production well location. In the lower underground river, the closer the production well was to the right side, the higher the flooding range. When Well 3# was assigned for production, only a small amount of “attic remaining oil” existed in local high positions. When Well 2# was assigned for production, the water could not flood this region at all. The “attic remaining oil” and the “insufficient well control remaining oil” were the dominant remaining oil types in this region.

3.2.2. High Filling in the Caves

According to experimental schemes DXH02, DXH05, and DXH07, when the caves were highly filled, the oil–water distributions in Region A under different production wells are shown in Figure 12. When Well 2# was assigned for production, the remaining oil content in this region was the highest, consistent with the case when there was no filling media in the caves. The remaining oil was mainly “insufficient well control remaining oil”. Compared with Figure 9b and Figure 12b, the content of this type of remaining oil was higher when the caves were highly filled. The existence of filling medium increased the resistance of water flooding and the difficulty of pressure propagation. When Well 1# or Well 3# were assigned for production, the remaining oil was mainly “bypass remaining oil” and “attic remaining oil”. Compared with the case with no filling media in the caves, when the cave was highly filled, the “bypass remaining oil” in the upper underground river decreased (especially when Well 3# was assigned for production). In addition, the increased lateral flow resistance in the filling medium enabled some water to spread longitudinally, reducing the “attic remaining oil”.
The oil–water distributions in Region B under different production wells when the caves were highly filled are shown in Figure 13. When Well 1# or Well 3# were assigned for production, the oil–water distributions in this region were almost the same. Compared with the case where there were no filling media in the caves (Figure 10a,c), in the cases when the caves were completely filled, the oil–water interface in Cave 1 was lower, and the oil in Cave 3 and Cave 4 could not be spread at all, due to the increased flow resistance. The content of “insufficient well control remaining oil” was greater. When Well 2# was assigned for production, similar to no filling media in the caves, a large amount of “attic remaining oil” existed at the top of Cave 1 and Cave 3. Differently, there was no “bypass remaining oil” in Cave 4, and a small amount of remaining oil existed at the top of the filled areas of Cave 1, Cave 2, Cave 3, and Cave 4. The lack of bypass remaining oil was due to the reduced difference in flow resistance along each drive channel caused by the filling medium. The remaining oil in the filled areas of the caves was caused by water rapidly channeling into the fracture or production well from the filling medium, which can be called the “residual oil in filling medium”.
The oil–water distributions in Region C under different production wells when the caves were highly filled are shown in Figure 14. Production from Wells 1# or 3# accumulated significant “attic remaining oil” in the local high positions of the lower underground river and the upper underground river, which consistent with unfilled conditions. When Well 2# was assigned for production, there was a large amount of “insufficient well control remaining oil” in Region C. In addition, comparing Figure 14a,c, it was found that more remaining oil remained when Well 3# was assigned for production. On one hand, when Well 1# was assigned for production, oil–water displacement was sufficient near the bottom of Well 3#. When Well 3# was assigned for production, water easily channeled into the wellbore, causing insufficient oil–water displacement, and thus affecting the displacement efficiency and resulting in “residual oil in filling medium”. On the other hand, after bottom water entered the lower underground river along the fracture, the lateral flow towards the production well formed a dominant water flooding channel, resulting in some “bypass remaining oil”.

3.2.3. Partial Filling in the Caves

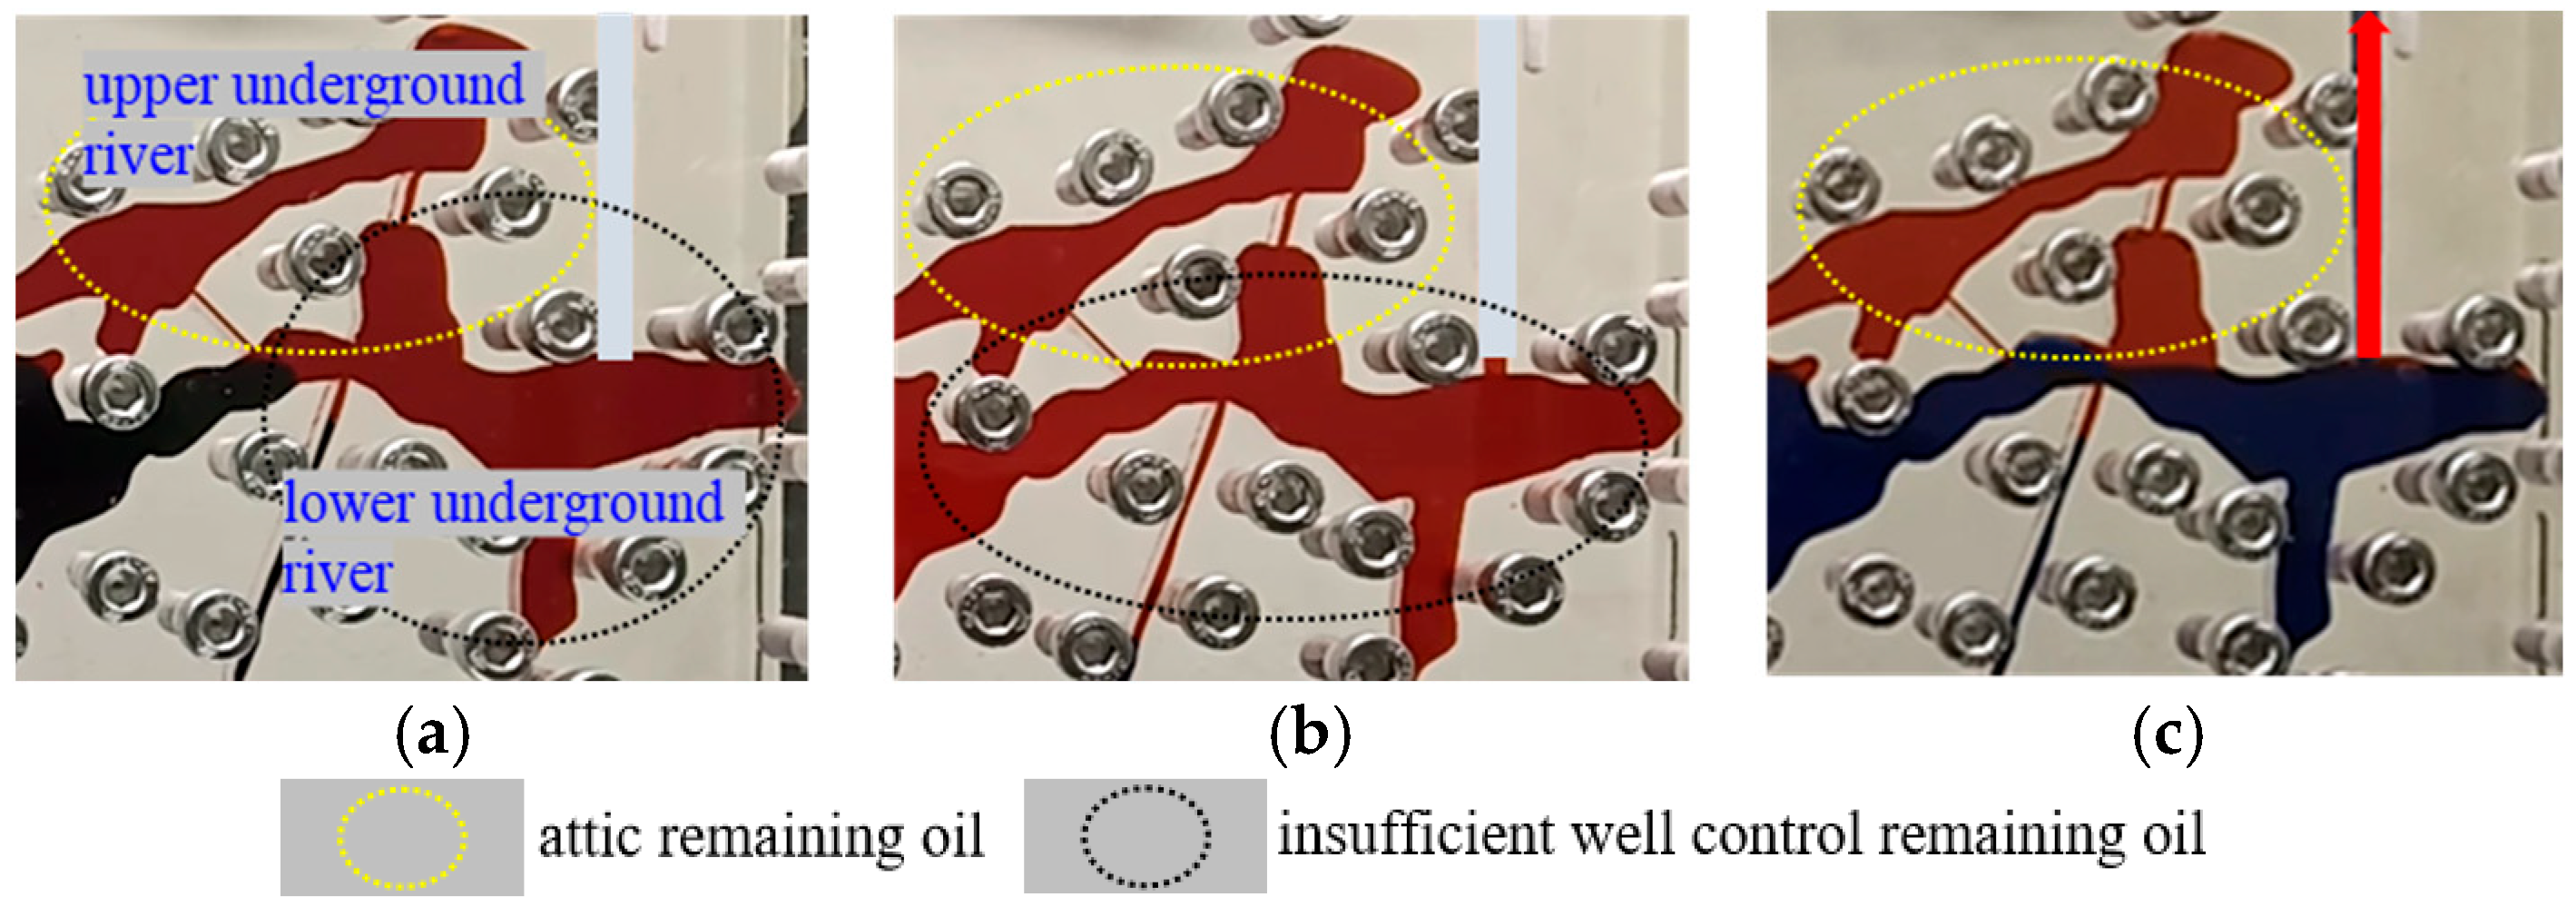
Experimental scheme DXH03 illustrates that, when the caves were partially filled, the remaining oil distribution in the underground river reservoir shown great differences from the cases with no filling media and high filling (Figure 15). Using Well 1# production as an example, we can report the following observation: in the branch cave in Region A and Cave 1, Cave 2 in Region B, a large amount of residual oil is “sandwiched between two spread zones”. This was because the upper part of the cave was unfilled and was a cavity area. Due to the much smaller fluid flow resistance in the cavity area than in the filled area, after the bottom water was channeled into the cavity area along a certain path, it was difficult to spread in the filling medium. The formation mechanism of this part of remaining oil was consistent with that of the remaining oil in the upper part of the filled cave when the bottom water was channeled into the fracture, which can also be called “residual oil in filling medium”. The remaining oil in the filled areas on the right side of the lower underground river in Regions A and C and on the left side of the lower underground river in Region C was not caused by the channeling of bottom water, but by the inability of gravity differentiation to overcome capillary force in the filling medium. This type of remaining oil was called the “shielded oil in filling medium”. In addition to the above, the remaining oil when the cave was partially filled also included “attic remaining oil” and “bypass remaining oil” caused by differences in flow resistance and drive pressure. Here, the remaining oil in the continuous filling medium was explained as follows: if water flowed into and out of the filling medium in a region, the remaining oil was the “residual oil in filling medium”; if water could not flow into the filling medium, the remaining oil there was the “shielded oil in filling medium”.

3.2.4. Comparison of Oil Production and Recovery

The oil production and recovery after bottom water flooding under different filling modes and well locations are compared in Figure 16. The differences in filling modes significantly influenced oil production and recovery. In general, as the underground river was dominated by large and elongated caves, and the flow resistance in the cavity area was the smallest, the recovery and oil production with no filling media in the cave were much higher than that highly filled of the caves (comparing DXH01 with DXH02, DXH04 with DXH05, and DXH06 with DXH07). In addition, comparing DXH01~DXH03, when the caves were partially filled and the same well (Well 1#) was assigned, the recovery factor of this filling mode was the lowest, only 37.1%. There was a large amount of “shielded oil in filling medium” that the other two filling modes did not have. This is a consequence of discontinuous flow paths between cavities and filled zones that prevent water invasion. This contrasts sharply with unfilled systems where gravity-driven sweep dominates.
Well location also had a large impact on oil production and recovery. When there were no filling media in the cave or the cave was highly filled, DXH04 and DXH05 resulted in lower oil production and recovery, with the lowest being only 27.3%. Among all the experiments, only DXH01 and DXH06 achieved a recovery factor of over 80%.

3.3. Mechanism of Improving Recovery by Multi-Well Alternating Water Flooding and Gas Injection

The main remaining oil types after stage 1 of bottom water flooding were “insufficient well control remaining oil”, “attic remaining oil”, and “bypass remaining oil” when there were no filling media in the caves. When the caves were highly filled, there was also “residual oil in filling medium”. When the caves were partially filled, there was also “shielded oil in filling medium”. The remaining oil distributions varied greatly under different production wells and filling modes. Multi-well water and gas injection can effectively recover most of the remaining oil in the underground river reservoir.

3.3.1. Early Water Injection Period

According to Table 2, stages 2 and 3 reflect the early water injection period. The oil–water distributions at the end of this period under different experimental schemes are shown in Figure 17. Comparing Figure 7 and Figure 17, it was found that early water injection can effectively recover some “insufficient well control remaining oil”, “bypass remaining oil”, and “residual oil in filling medium”.
Recovering “Insufficient Well Control Remaining Oil”
Taking the Region A in experimental schemes DXH04 and DXH05 and Region B in DXH06 and DXH07 as examples, we analyzed the mechanism of recovering “insufficient well control remaining oil” by early water injection. The oil–water distributions before and after early water injection period in the two regions are shown in Figure 18 and Figure 19, respectively.
For the “insufficient well control remaining oil” in Region A, during the early water injection period, the injected water can displace oil horizontally along the upper and lower underground rivers, which can effectively increase the recovering of “insufficient well control remaining oil”. In addition, the filling pattern differences in Region A also lead to differences in recovering the remaining oil. When there was no filling media in the caves, due to the small fluid flow resistance in the cavity area of the caves, the gravity differentiation effect was more significant, and more injected water was used to supplement the bottom water or flow in the lower underground river for oil displacement. When the caves were highly filled, the existence of filling medium restricted the gravity differentiation of oil and water, causing more injected water to flow in the upper underground river, making the remaining oil recovery effect in the upper underground river better than that in the former under this filling pattern.
For the “insufficient well control remaining oil” in Region B, since the connectivity between this region and the main underground river was poor, the injected water mainly recovered remaining oil in Cave 1 and Cave 3 by switching production wells and expanding pressure drop propagation.
Recovering “Bypass Remaining Oil”
Taking Region A in experimental schemes DXH06 and DXH07 and Region B in DXH04 and DXH05 as examples, we analyzed the mechanism of recovering “bypass remaining oil” by early water injection. The oil–water distributions before and after early water injection period in the two regions are shown in Figure 20 and Figure 21, respectively.
In Region A, the “bypass remaining oil” was distributed in the upper underground river near Well 1#. This region had good connectivity. By displacing oil through water injection, changing the water flooding channel, most of the bypass remaining oil can be recovered. In Region B, when there was no filling media in the caves, there was bypass remaining oil in Cave 4. Under the same production well, there was no bypass remaining oil when the cave was highly filled.
Recovering “Residual Oil in Filling Medium”
Taking Region B in experimental scheme DXH05 and Region C in DXH07 as examples, we analyzed the mechanism of recovering “residual oil in filling medium” by early water injection. The oil–water distributions before and after early water injection period in the two regions are shown in Figure 22 and Figure 23, respectively.
Comparing the remaining oil recovering effects in the two regions, it can be seen that the recovering effect of remaining oil in filling medium in Region B was significantly worse than that in Region C through the early water injection period. In Region B, when Well 2# switched to the injection well, the injected water flowed from Cave 3 to Cave 2 and then into the bottom water zone, instead of entering Cave 1. When it was switched back to being a production well, the injected water still flowed along the original dominant channel, making it difficult to recover more residual oil in the filling medium. In Region C, when Well 3# switched from being a production well to being an injection well, under injection pressure and gravity, the injected water displaced and driven the oil upwards until production, which can increase the flooding range and improve the oil displacement efficiency.
Comparison of Oil Production and Recovery
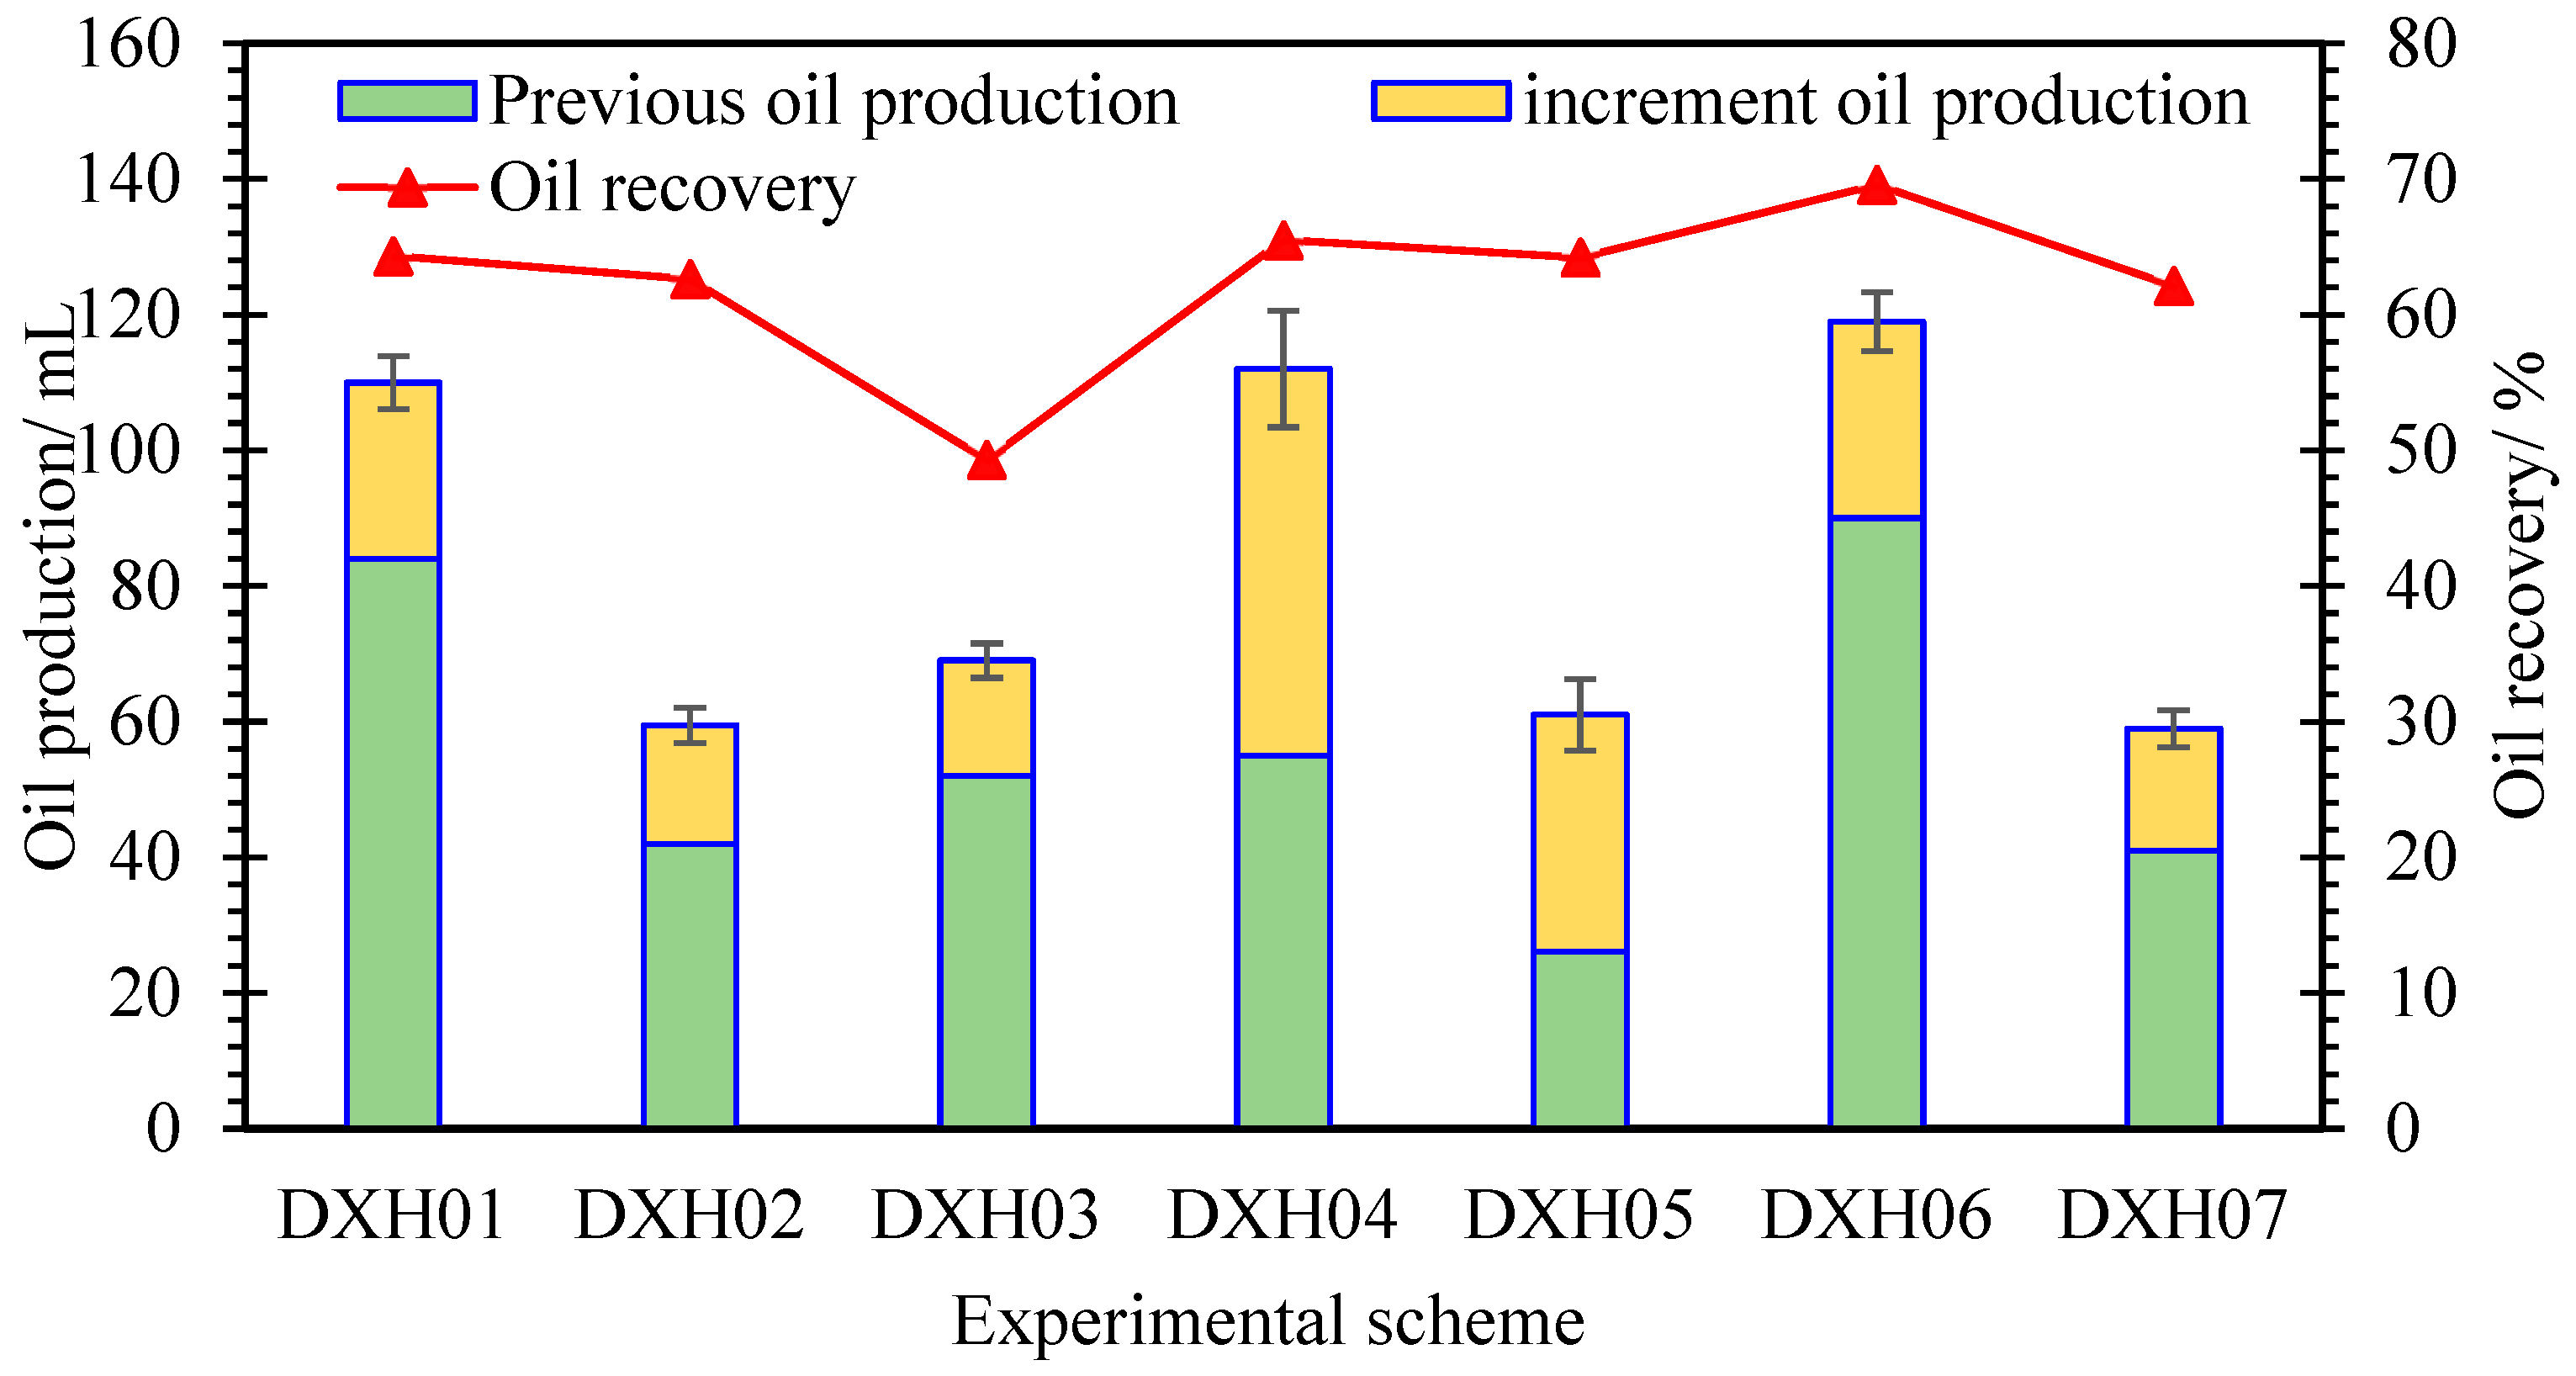
The increment in oil production and recovery after the early water injection period under different filling modes and well locations are compared in Figure 24. In this period, when there were no filling media in the caves, DXH04 had the highest stage oil increment (about 50 mL), and the recovery factor was close to those of DXH01 and DXH06. When the caves were highly filled, DXH05 also had the highest stage oil increment, and the recovery factor was close to those of DXH03 and DXH07. This indicated that early water injection period effectively overcame the deficiency caused by constrained production well locations with more remaining oil. Comparing DXH01~DXH03, under the same production well, the increment in the recovery factor in the partial filling of the caves was close to that in the high filling cases, but the increase was the smallest, at only 12.1% (18.4% for highly filling and 15.2% for no filling media). This showed that the remaining oil recovering effect of alternating water flooding was the worst for partially filled caves, which was related to the large amount of “shielded oil in filling medium”. As evidenced by DXH04’s 50 mL increment, early water injection achieves optimal efficiency in branch caves through pressure redistribution—reducing “insufficient well control oil” by 89% when switching from single-well to multi-well production. Conversely, partially filled systems (DXH03) exhibit limited response due to capillary barriers.

3.3.2. Middle Gas Injection Period

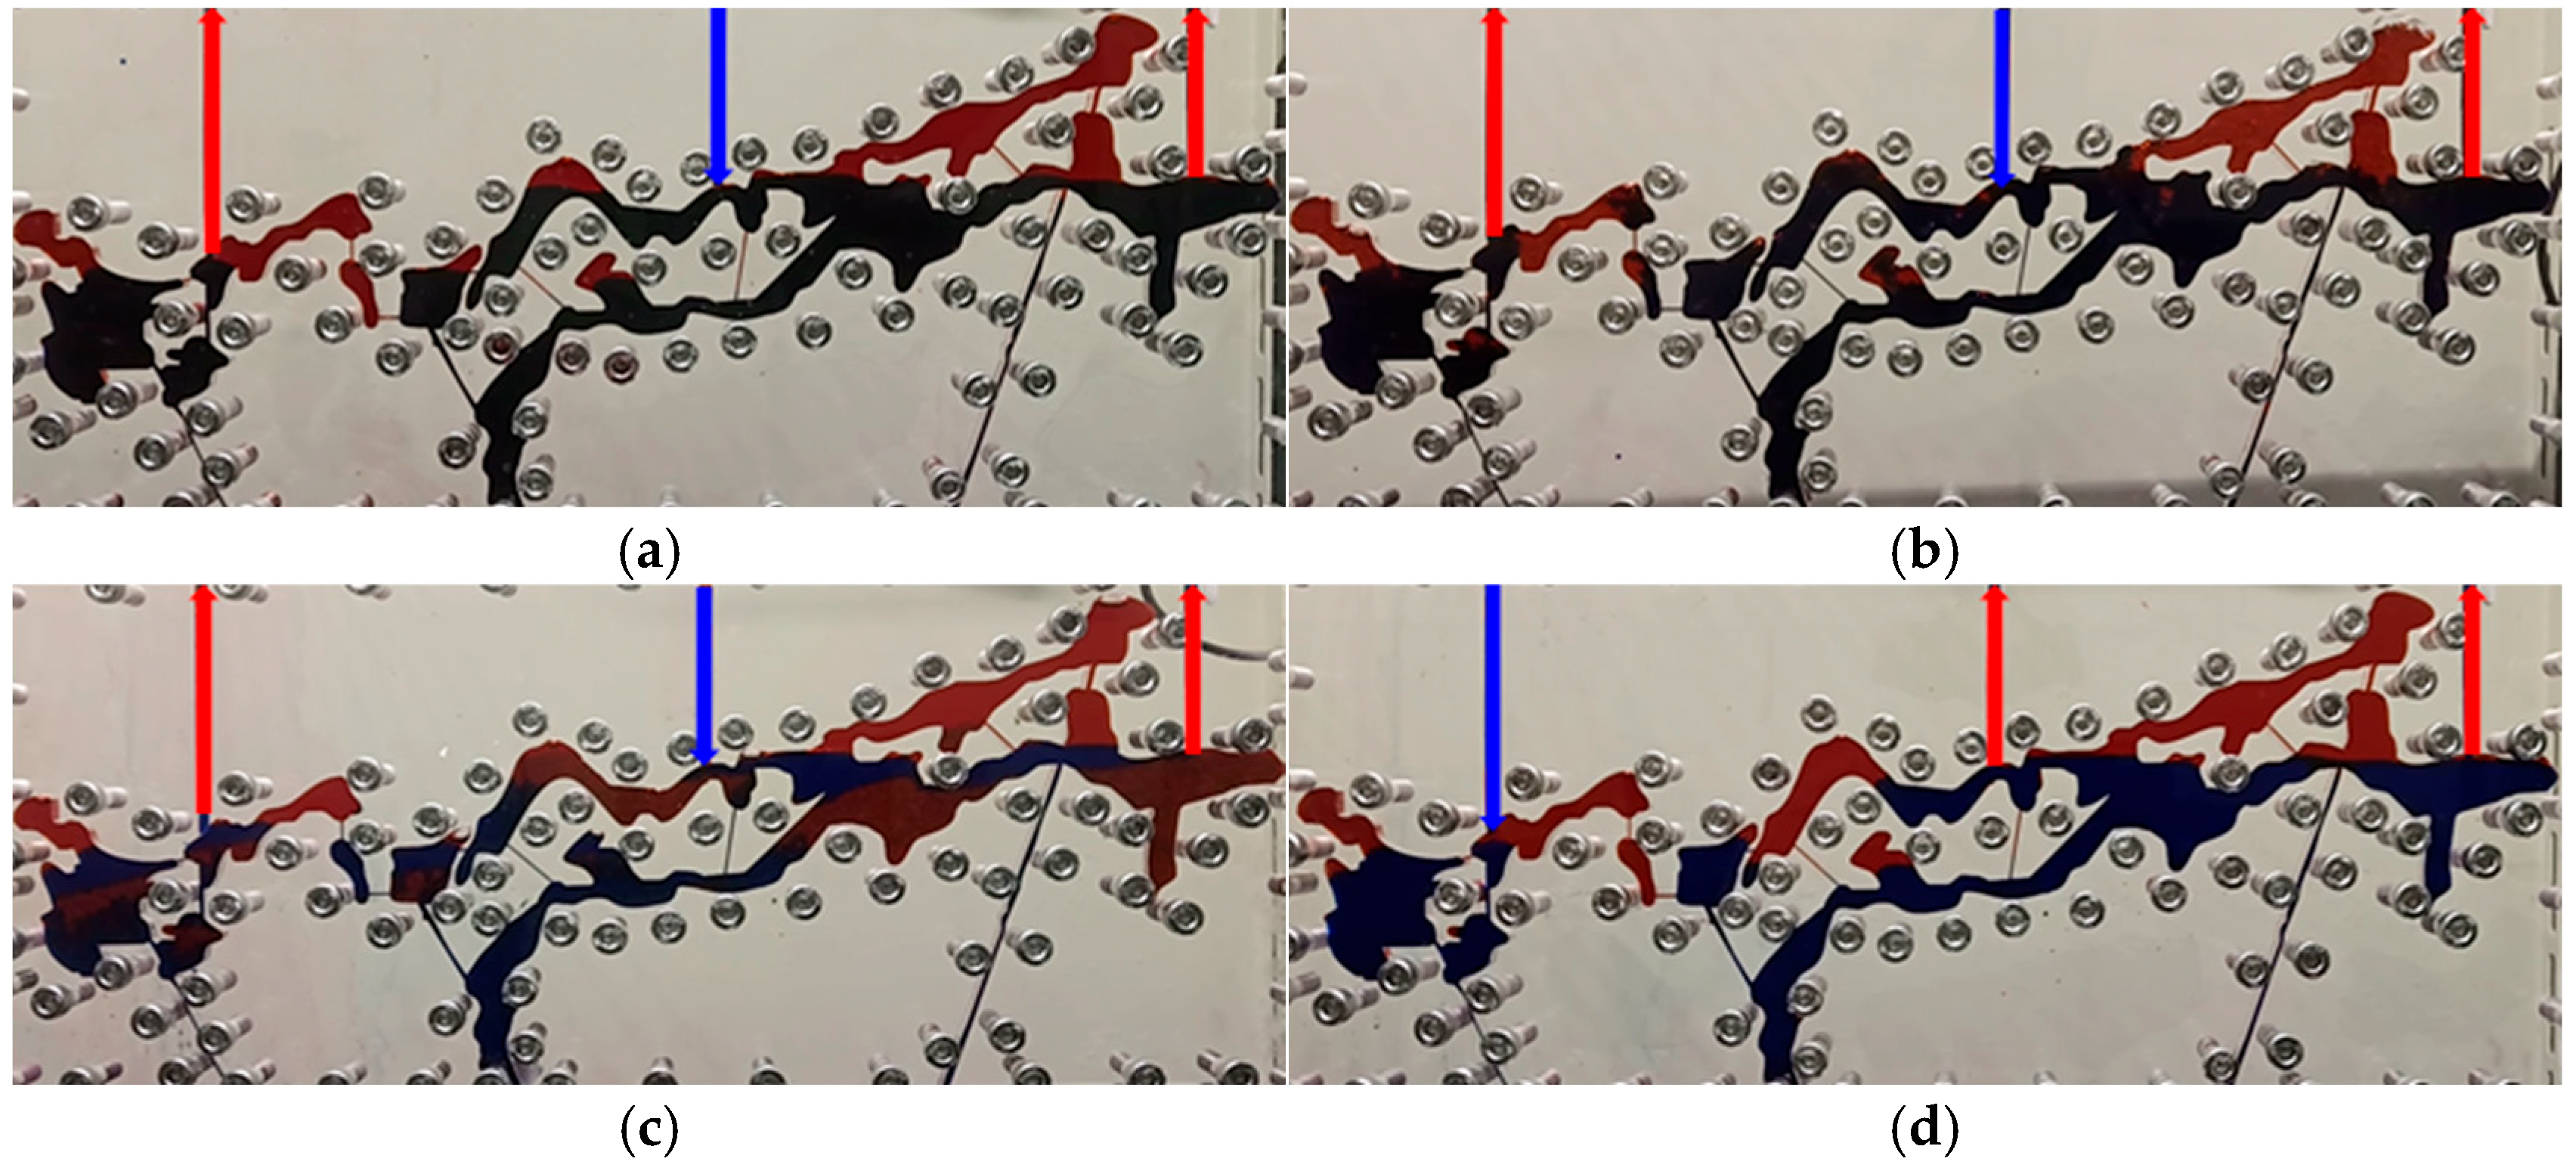
According to Table 2, stage 4 was the gas injection period. The oil–water distributions at the end of this period under different experimental schemes are shown in Figure 25. Comparing Figure 7, Figure 17 and Figure 25, it can be seen that gas injection can mainly recover “attic remaining oil” and some “bypass remaining oil”.
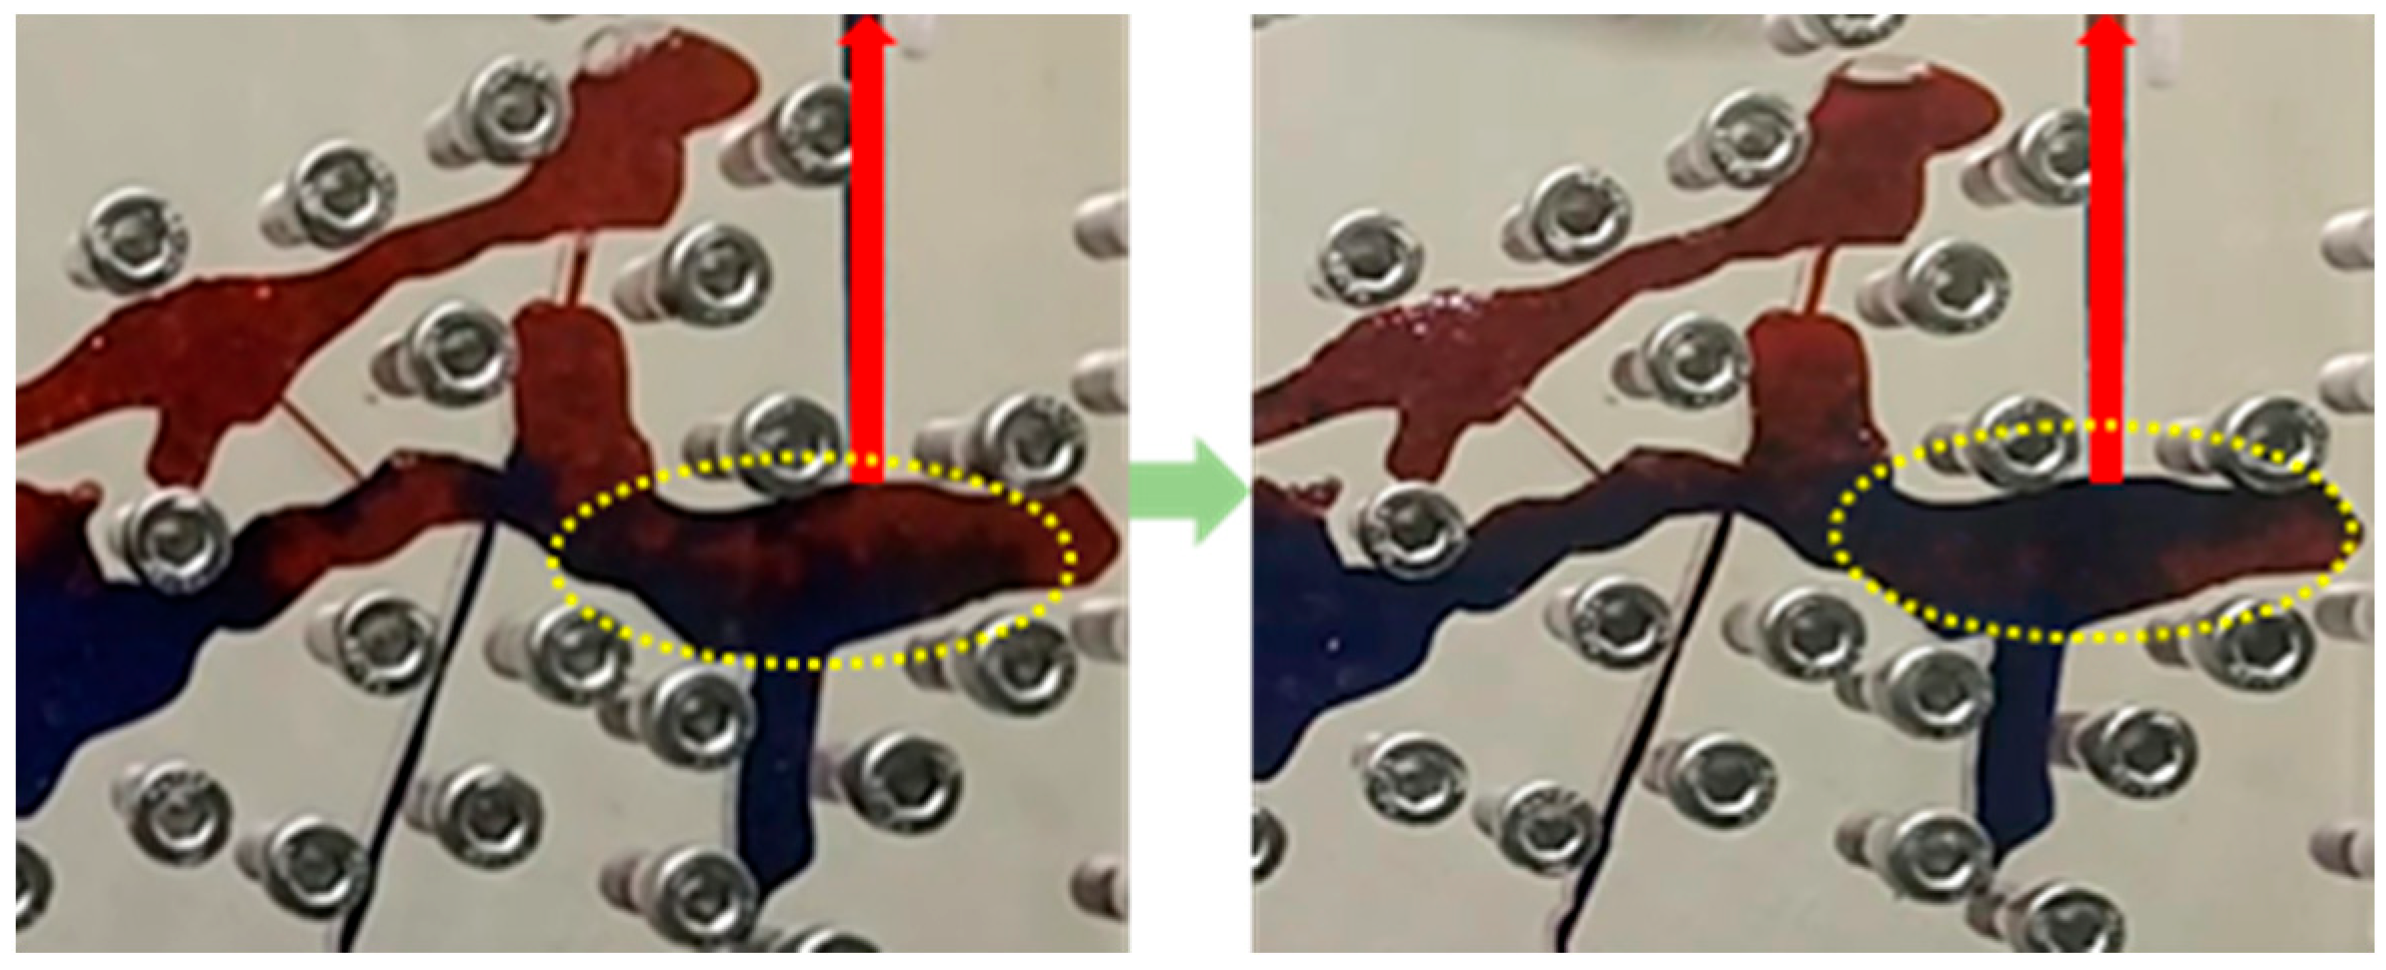
It can be clearly seen from Figure 25 that gravity difference between gas and oil–water system enables the gas to sweep oil at high positions to low positions, thus effectively recovering most of the “attic remaining oil”. However, the injected gas also lowered the oil–water interface and “sandwiches” some remaining oil between water and gas, causing the displaced remaining oil to be untappable. This phenomenon was especially obvious when there were no filling media in the caves. The differences in gas injection and production well locations also had some influence on the remaining oil recovery. When Well 2# was used for injection and Well 3# was used for production, gas migrated into Cave 1 in Region B. When Well 3# was used for injection and Well 2# was used for production, after the injected gas neared Well 2#, it was quickly channeled to the bottom and failed to recover the remaining oil in the cave. In addition, under the gas injection and production pattern with gas injection in the main underground river and production in the branch cave, the longitudinal spreading range of gas in the main underground river was greater (the yellow dashed line indicates the gas drive channel).
In addition, it is known from the previous analysis that early water injection can recover some bypass remaining oil, but this approach was found to be ineffective for the bypass remaining oil in Cave 4 of Region B. Unlike the injected water, the injected gas had lower density, stronger flow capacity, and a better ability to flow through fractures, and its capillary resistance to gas drive oil or gas drive water was smaller than the buoyancy observed when gas reached the bottom water zone. Therefore, the injected gas can successfully overcome resistance and recover the bypass residual oil in Cave 4 of Region B.
The increment in oil production and recovery after the middle gas injection period under different filling modes and well locations are compared in Figure 25. In this period, DXH04 had the highest stage oil increment; this was because of the broader longitudinal spreading range of the gas injection, with Well 3# injecting and Well 2# producing (gas injection occurring in the main underground river and production occurring in a branch cave). However, under the same injection and production pattern, the oil increment in DXH05 was not high. This was because the experimental filling pattern of DXH05 was highly filled, and the oil-wetness of the filling medium causes the displaced remaining oil to adhere to the surface of the filling medium in the form of an oil film. At the end of this period, the lowest recovery factor was still DXH03 (about 60%), indicating that gas injection was ineffective for the “shielded oil in filling medium”.
The differential efficacy of gas injection is further quantified in Figure 26, as follows: DXH04’s 28.5% incremental recovery underscores the gas’s unique ability to access attic zones via fracture networks (e.g., recovering 92% of the attic oil in Region C), whereas DXH05’s modest 12% gain reflects the oil-wet filling media’s retention of displaced oil as films. This divergence confirms that gas injection efficiency is intrinsically governed by fracture–cavity connectivity rather than the filling degree alone.

3.3.3. Late Water Injection Period

According to Table 2, stages 5 and 6 comprised the late water injection period. The oil–water distributions at the end of this period under different experimental schemes are shown in Figure 27.
At the end of the previous gas injection period, most of the structurally high positions were occupied by gas, and the oil–water interface was lowered. Through the two rounds of injection and production well switching in this period, the remaining oil “sandwiched” between gas and water in the previous period can be further recovered. Moreover, in the gas injection period, under gravity and imbibition, the oil–water in the filling medium will redistribute to some extent. Water injection, again, can effectively improve the oil displacement efficiency in the filled areas of the caves. As shown in Figure 27d,e, after six stages of water and gas injection, a large amount of the remaining oil in Cave 1 of Region B still cannot be effectively recovered, which was related to the gas injection and production well locations in the gas injection period. No matter how the water injection changed, the remaining oil could not be recovered. As shown in Figure 27c, the water and gas injection were also ineffective for the shielded oil in filling medium. When the cave was partially filled, the remaining oil content after six stages of water flooding and gas injection was the highest.
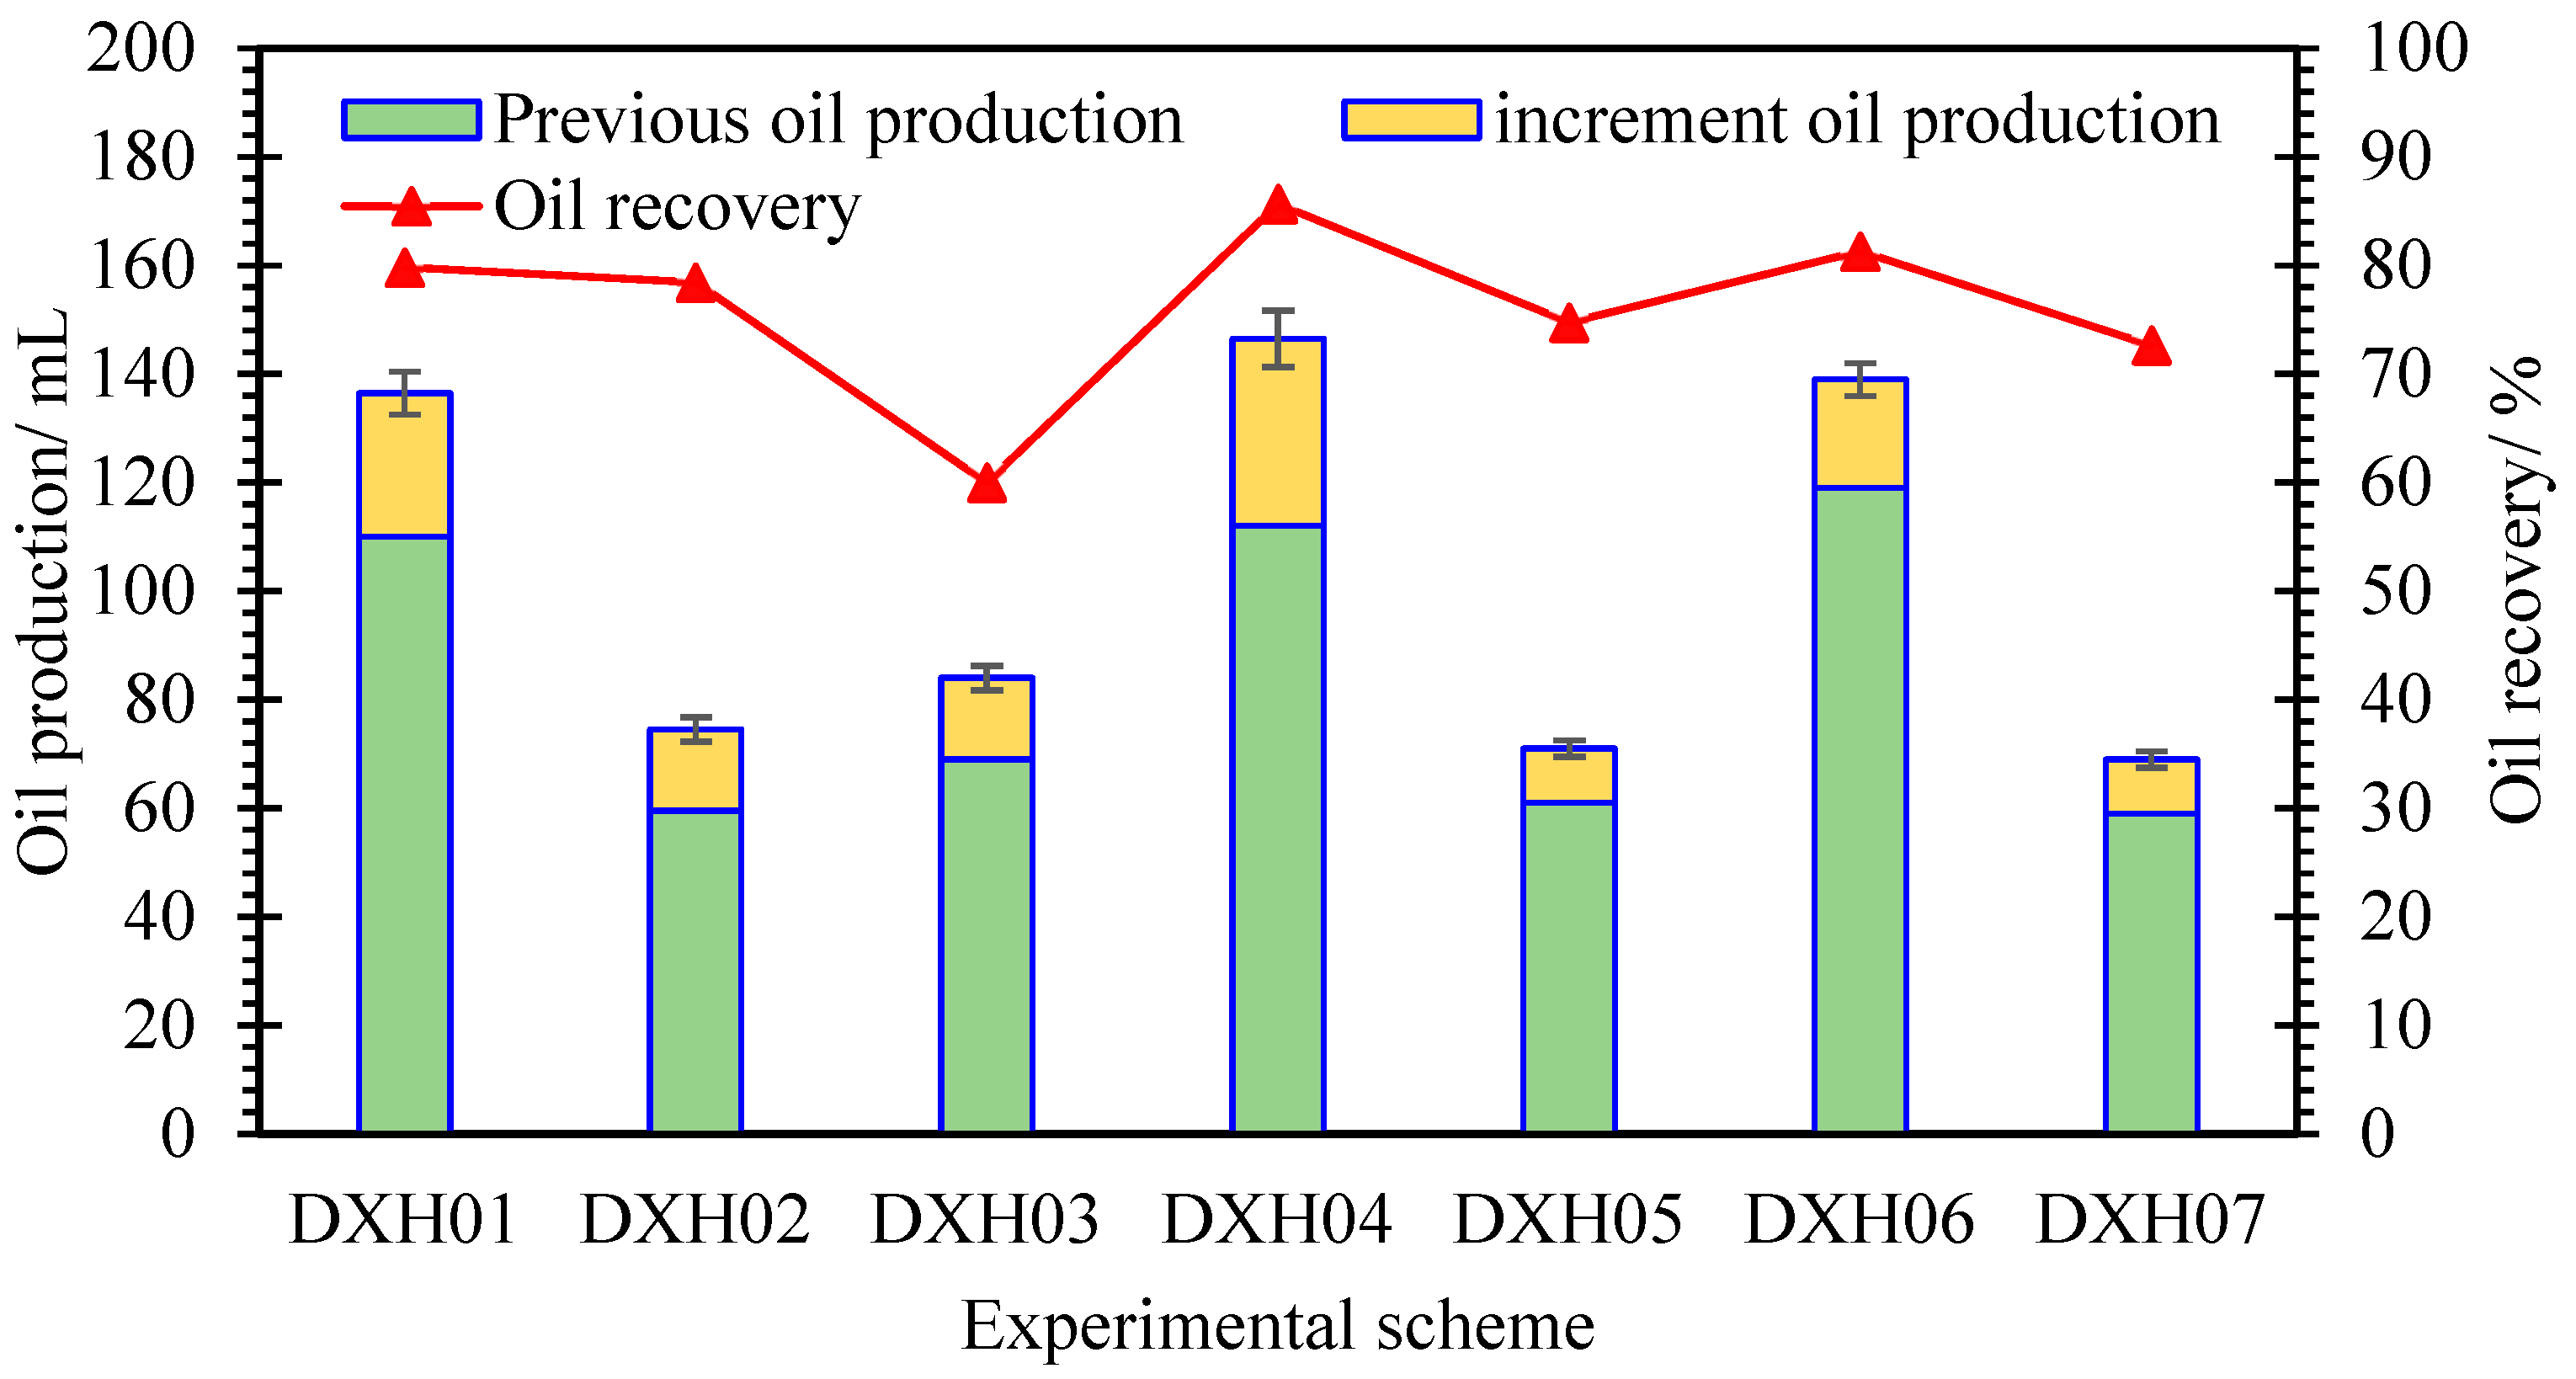
The increment in oil production and recovery after the late water injection period under different filling modes and well locations are compared in Figure 28. The main role of this period was to wash the oil again and increase the oil–gas–water interface, so the oil increment was generally low. After three periods of water and gas injection (with the exception of the recovery factor of DXH03, which was around 65%), the recovery factors under other schemes were higher than 70%. The marginal 3–8% gain from late water injection primarily mobilizes oil trapped at gas–water interfaces through viscous displacement—a process that is most effective in unfilled cavities (e.g., DXH01’s 8.2% increase) but negligible in partially filled systems where capillary shielding persists. This reinforces that late-stage recovery enhancement is contingent upon pre-existing sweep conformance.
Compared with less than 50% after bottom water flooding, the recovery had been greatly improved. It is noteworthy that, although the experiment tried to consider the actual reservoir characteristics as much as possible, due to the extreme heterogeneity of the fractured–vuggy reservoirs and the lack of geological understanding of fractured–vuggy reservoirs, there were still very large differences between indoor experiments and actual production. The purpose of this experiment was only to provide guidance and mechanism support for production practices.

4. Conclusions

Physical–simulation experiments were conducted to characterize the remaining oil distributions after bottom water flooding in karstic underground river reservoirs; moreover, we aimed to quantify how these distributions depend on cavity-filling modes and well placement. The mechanism of improving recovery by multi-well alternating water flooding and gas injection after bottom water flooding was revealed. The main conclusions are as follows:
  • The remaining oil after bottom water flooding can be divided into the following five types: “insufficient well control remaining oil”, “attic remaining oil”, “bypass remaining oil”, “residual oil in filling medium”, and “shielded oil in filling medium”. The distribution is greatly affected by filling modes and well locations. The highest recovery after bottom water flooding was 83.7% (DXH01), while partially filled caves averaged at only 37.1%
  • Early water injection can effectively recover “insufficient well control remaining oil”, “bypass remaining oil”, and “residual oil in filling medium”. Gas injection is favorable for recovering “attic remaining oil”. Late water injections can further improve recovery.
  • When the cave is partially filled, there exists a large amount of “shielded oil in filling medium” that is difficult to recover by multi-well water and gas injection.
  • This study has clarified the remaining oil distribution laws and water–gas flooding mechanisms for underground river reservoirs under different conditions, providing guidance for efficient development.
The physical simulation experiments still have differences from actual reservoirs. Further study can focus on presenting megascopic descriptions of the remaining oil evolution rules and achieving the optimization of water–gas injection parameters. The results are expected to better guide field development practices.

Author Contributions

Data curation, W.G.; Methodology, A.L.; Investigation, W.G. and A.L.; Supervision, W.G.; Formal analysis, W.G.; Writing—original draft preparation, W.G. and S.Y.; Writing—review and editing, M.D. All authors have read and agreed to the published version of the manuscript.

Funding

This research received no external funding.

Data Availability Statement

The datasets used and/or analyzed during the current study are available from the corresponding author upon reasonable request.

Conflicts of Interest

Authors Shenghui Yue, Wanjiang Guo, and Mingshan Ding were employed by Shengli Oilfield of Sinopec. The remaining author declares that the research was conducted in the absence of any commercial or financial relationships that could be construed as potential conflicts of interest.

References

  1. Sagbana, P.I.; Sarkodie, K.; Nkrumah, W.A. A critical review of carbonate reservoir wettability modification during low salinity waterflooding. Petroleum 2023, 9, 317–330. [Google Scholar] [CrossRef]
  2. Li, Y.; Kang, Z.; Xue, Z.; Zheng, S. Theories and practices of carbonate reservoirs development in China. Pet. Explor. Dev. 2018, 45, 712–722. [Google Scholar] [CrossRef]
  3. Tan, Y.; Li, Q.; Xu, L.; Ghaffar, A.; Zhou, X.; Li, P. A critical review of carbon dioxide enhanced oil recovery in carbonate reservoirs. Fuel 2022, 328, 125256. [Google Scholar] [CrossRef]
  4. Moore, C.H.; Wade, W.J. Chapter 11—Natural Fracturing in Carbonate Reservoirs. In Developments in Sedimentology; Moore, C.H., Wade, W.J., Eds.; Elsevier: Amsterdam, The Netherlands, 2013; pp. 285–300. [Google Scholar]
  5. Chen, S.; Wang, Y.; Guo, J.; He, Q.; Yin, X. Multi-scale evaluation of fractured carbonate reservoir and its implication to sweet-spot optimization: A case study of Tazhong oilfield, Central Tarim Basin, China. Energy Rep. 2021, 7, 2976–2988. [Google Scholar] [CrossRef]
  6. Lei, G.; Liao, Q.; Zhang, D. A new analytical model for flow in acidized fractured-vuggy porous media. Sci. Rep. 2019, 9, 8293. [Google Scholar] [CrossRef] [PubMed]
  7. Li, B.; Tan, X.; Wang, F.; Lian, P.; Gao, W.; Li, Y. Fracture and vug characterization and carbonate rock type automatic classification using X-ray CT images. J. Pet. Sci. Eng. 2017, 153, 88–96. [Google Scholar] [CrossRef]
  8. Liu, B.; Jin, Y.; Chen, M. Influence of vugs in fractured-vuggy carbonate reservoirs on hydraulic fracture propagation based on laboratory experiments. J. Struct. Geol. 2019, 124, 143–150. [Google Scholar] [CrossRef]
  9. Pirayesh, E.; Jamali, A.; Soliman, M.Y. Enhancing volumetric sweep efficiency in waterfloods using in-situ non-conductive barrier fractures. J. Pet. Sci. Eng. 2014, 122, 119–133. [Google Scholar] [CrossRef]
  10. He, J.; Liu, X.; Zhu, X.; Jiang, T.; He, H.; Zhou, L.; Liu, Q.; Zhu, Y.; Liu, L. Water-flooding characteristics of lithologic reservoir in Ordos basin. Sci. Rep. 2021, 11, 2503. [Google Scholar] [CrossRef] [PubMed]
  11. Yan, L.; Liu, Q.; Liu, X. Research on 3D geological modeling of fractured-vuggy carbonate reservoirs. Energy Rep. 2022, 8, 491–500. [Google Scholar] [CrossRef]
  12. Cao, N.; Lei, G.; Su, Y.; Li, H.; Zhang, J.; Zhang, C. A New Model for Predicting Flow in Fractured-Vuggy Carbonate Reservoirs under Pseudosteady State Condition. Geofluids 2021, 2021, 5613966. [Google Scholar] [CrossRef]
  13. Bin, L.; Zhengyu, L.; Shucai, L.; Lichao, N.; Maoxin, S.; Huaifeng, S.; Kerui, F.; Xinxin, Z.; Yonghao, P. Comprehensive surface geophysical investigation of karst caves ahead of the tunnel face: A case study in the Xiaoheyan section of the water supply project from Songhua River, Jilin, China. J. Appl. Geophys. 2017, 144, 37–49. [Google Scholar] [CrossRef]
  14. Wang, J.; Liu, H.; Xu, J.; Hongfang, Z. Formation mechanism and distribution law of remaining oil in fracture-cavity reservoir. Pet. Explor. Dev. 2012, 39, 624–629. [Google Scholar] [CrossRef]
  15. Li, W.; Hou, J.; Ding, G.; Li, H.; Zhang, L. Remaining oil types and influence factors for fractured-vuggy carbonate reservoir. Fault-Block Oil Gas. Field 2013, 20, 458–461. [Google Scholar]
  16. Yuan, D.; Hou, J.; Song, Z.; Wang, Y.; Luo, M.; Zheng, Z. Residual oil distribution characteristic of fractured-cavity carbonate reservoir after water flooding and enhanced oil recovery by N2 flooding of fractured-cavity carbonate reservoir. J. Pet. Sci. Eng. 2015, 129, 15–22. [Google Scholar] [CrossRef]
  17. Lu, G.; Zhang, L.; Liu, Q.; Xu, Q.; Zhao, Y.; Li, X.; Deng, G.; Wang, Y. Experiment analysis of remaining oil distribution and potential tapping for fractured-vuggy reservoir. J. Pet. Sci. Eng. 2022, 208, 109544. [Google Scholar] [CrossRef]
  18. Zhang, X.; Huang, Z.; Lei, Q.; Yao, J.; Gong, L.; Sun, S.; Li, Y. Connectivity, permeability and flow channelization in fractured karst reservoirs: A numerical investigation based on a two-dimensional discrete fracture-cave network model. Adv. Water Resour. 2022, 161, 104142. [Google Scholar] [CrossRef]
  19. Yang, M.; Zhong, H.; Li, Y. Research on fluid flow mechanism of fracture-cave carbonate reservoirs based on fluid mechanics. Energy Sources Part A Recovery Util. Environ. Eff. 2021, 47, 1051–1069. [Google Scholar] [CrossRef]
  20. Li, Y.; Sun, J.; Hou, J.; Tang, L. Characterization of underground river reservoirs in Tahe Oilfield, Tarim Basin, China. Arab. J. Geosci. 2022, 15, 1687. [Google Scholar] [CrossRef]
  21. Zheng, S.; Yang, M.; Kang, Z.; Liu, Z.; Long, X.; Liu, K.; Li, X.; Zhang, S. Controlling factors of remaining oil distribution after water flooding and enhanced oil recovery methods for fracture-cavity carbonate reservoirs in Tahe Oilfield. Pet. Explor. Dev. 2019, 46, 786–795. [Google Scholar] [CrossRef]
  22. Zhang, S.; Jin, Q.; Cheng, F.; Sun, J.; Wei, H.; Zhang, X. Genesis relation of surface and underground rivers and reservoir characteristics in paleokarst drainage systems: A case study of Ordovician karst in the Tahe oilfield. Carsologica Sin. 2020, 39, 900–910. [Google Scholar]
Figure 1. Geological section and model design of underground river reservoirs. (a) Geological model diagram [22]; (b) experimental model design diagram.
Processes 13 02743 g001
Figure 2. Diagram of the experimental set-up. Container 1, Container 2, Container 3, and Container 4 contained experimental gas, experimental water, experimental oil, and experimental water, respectively.
Processes 13 02743 g002
Figure 3. Schematic diagram of underground river reservoir model with different filling modes. (a) Without filling media in the caves; (b) high filling in the caves; (c) partial filling in the caves.
Processes 13 02743 g003
Figure 4. The oil–water distributions with different filling modes at the early stage of bottom water flooding. (a) No filling media in the caves; (b) high filling in the caves; (c) partial filling in the caves.
Processes 13 02743 g004
Figure 5. Analysis of flow channel near Well 1#.
Processes 13 02743 g005
Figure 6. The oil–water distributions with different filling modes when bottom water drives near the bottom of Well 1#. (a) No filling media in the caves; (b) high filling in the caves; (c) partial filling in the caves.
Processes 13 02743 g006
Figure 7. The oil–water distribution after bottom water flooding with different experimental schemes: (a) scheme DXH01; (b) scheme DXH02; (c) scheme DXH03; (d) scheme DXH04; (e) scheme DXH05; (f) scheme DXH06; (g) scheme DXH07.
Processes 13 02743 g007aProcesses 13 02743 g007b
Figure 8. The division of model regions.
Processes 13 02743 g008
Figure 9. The oil–water distributions in Region A under different production wells when there was no filling media in the caves. (a) Well 1# was used as the production well; (b) Well 2# was used as the production well; (c) Well 3# was used as the production well.
Processes 13 02743 g009
Figure 10. The oil–water distributions in Region B under different production wells when there was no filling media in the caves. (a) Well 1# was used as the production well; (b) Well 2# was used as the production well; (c) Well 3# was used as the production well.
Processes 13 02743 g010
Figure 11. The oil–water distributions in Region C under different production wells when there was no filling media in the caves. (a) Well 1# was used as the production well; (b) Well 2# was used as the production well; (c) Well 3# was used as the production well.
Processes 13 02743 g011
Figure 12. The oil–water distributions in Region A under different production wells when the caves were highly filled. (a) Well 1# was used as the production well; (b) Well 2# was used as the production well; (c) Well 3# was used as the production well.
Processes 13 02743 g012
Figure 13. The oil–water distributions in Region B under different production wells when the caves were highly filled. (a) Well 1# was used as the production well; (b) Well 2# was used as the production well; (c) Well 3# was used as the production well.
Processes 13 02743 g013
Figure 14. The oil–water distributions in Region C under different production wells when the caves were highly filled. (a) Well 1# was used as the production well; (b) Well 2# was used as the production well; (c) Well 3# was used as the production well.
Processes 13 02743 g014
Figure 15. The oil–water distributions in each region when the caves were partially filled: (a) Region A; (b) Region B; (c) Region C.
Processes 13 02743 g015
Figure 16. The comparison of oil production and oil recovery after bottom water flooding.
Processes 13 02743 g016
Figure 17. The oil–water distribution after early water injection period with different experimental schemes. (a) scheme DXH01; (b) scheme DXH02; (c) scheme DXH03; (d) scheme DXH04; (e) scheme DXH05; (f) scheme DXH06; (g) scheme DXH07.
Processes 13 02743 g017aProcesses 13 02743 g017b
Figure 18. The oil–water distribution before and after the insufficiently controlled remaining oil was recovered in region A. (a) No filling media in the caves (experimental scheme of DXH04); (b) high filling in the caves (experimental scheme of DXH05).
Processes 13 02743 g018
Figure 19. The oil–water distribution before and after the insufficiently controlled remaining oil was recovered in region B. (a) No filling media in the caves (experimental scheme of DXH06); (b) high filling in the caves (experimental scheme of DXH07).
Processes 13 02743 g019
Figure 20. The oil–water distribution before and after the bypass remaining oil was recovered in Region A. (a) No filling media in the caves (experimental scheme of DXH06); (b) high filling in the caves (experimental scheme of DXH07).
Processes 13 02743 g020
Figure 21. The oil–water distribution before and after the bypass remaining oil was recovered in Region B. (a) No filling media in the caves (experimental scheme of DXH04); (b) high filling in the caves (experimental scheme of DXH05).
Processes 13 02743 g021
Figure 22. The oil–water distribution before and after the residual oil in filling medium was recovered in Region B (experimental scheme of DXH05).
Processes 13 02743 g022
Figure 23. The oil–water distribution before and after the residual oil in filling medium was recovered in Region C (experimental scheme of DXH07).
Processes 13 02743 g023
Figure 24. The comparison of oil production and oil recovery after early water injection period.
Processes 13 02743 g024
Figure 25. The oil–water distribution after middle gas injection period with different experimental schemes: (a) scheme DXH01; (b) scheme DXH02; (c) scheme DXH03; (d) scheme DXH04; (e) scheme DXH05; (f) scheme DXH06; (g) scheme DXH07.
Processes 13 02743 g025
Figure 26. The comparison of oil production and oil recovery after middle gas injection period.
Processes 13 02743 g026
Figure 27. The oil–water distribution after late water injection period with different experimental schemes: (a) scheme DXH01; (b) scheme DXH02; (c) scheme DXH03; (d) scheme DXH04; (e) scheme DXH05; (f) scheme DXH06; (g) scheme DXH07.
Processes 13 02743 g027
Figure 28. The comparison of oil production and oil recovery after the late water injection period.
Processes 13 02743 g028
Table 1. The bottom water flooding experimental scheme of underground river fractured–vuggy reservoir.
N.O.Production WellFilling Mode
DXH01The middle well (Well 1#)No filling media in the caves
DXH02The middle well (Well 1#)High filling in the caves
DXH03The middle well (Well 1#)Partial filling in the caves
DXH04The left well (Well 2#)No filling media in the caves
DXH05The left well (Well 2#)High filling in the caves
DXH06The right well (w ell 3#)No filling media in the caves
DXH07The right well (Well 3#)High filling in the caves
Table 2. The well arrangement during the multi-well water and gas injection flooding period.
N.O.Well ArrangementBottom Water Flooding PeriodEarly Water Injection PeriodMiddle Gas
Injection Period
Late Water Injection Period
Stage 1Stage 2Stage 3Stage 4Stage 5Stage 6
DXH01, DXH02, DXH03Injection well/Well 1#Well 2#Well 2#Well 3#Well 1#
Production wellwell 1#Well 2#Well 3#Well 3#Well 1#Well 2#
DXH04, DXH05Injection well/Well 2#Well 1#Well 3#Well 2#Well 1#
Production wellwell 2#Well 1#Well 3#Well 2#Well 1#Well 3#
DXH06, DXH07Injection well/Well 3#Well 1#Well 2#Well 3#Well 1#
Production wellwell 3#Well 1#Well 2#Well 3#Well 1#Well 2#
Disclaimer/Publisher’s Note: The statements, opinions and data contained in all publications are solely those of the individual author(s) and contributor(s) and not of MDPI and/or the editor(s). MDPI and/or the editor(s) disclaim responsibility for any injury to people or property resulting from any ideas, methods, instructions or products referred to in the content.