Article

CFD Simulation of Aerosol and Odor Gas Transport Dynamics in Shipboard Underwater Lavatories

1
Qinghai Provincial Laboratory for Intelligent Computing and Application, School of Energy and Electrical Engineering, Qinghai University, Xining 810016, China
2
Wuhan Second Ship Design and Research Institute, Wuhan 430205, China
3
School of Aeronautic Science and Engineering, Beihang University, Beijing 100191, China
4
College of Plant Protection, Nanjing Agricultural University, Nanjing 211800, China
*
Author to whom correspondence should be addressed.
Processes 2025, 13(9), 2706; https://doi.org/10.3390/pr13092706
Submission received: 14 July 2025 / Revised: 20 August 2025 / Accepted: 21 August 2025 / Published: 25 August 2025
(This article belongs to the Section Chemical Processes and Systems)

Abstract

The underwater lavatories aboard ships are compact and suffer from inadequate ventilation, thereby increasing the likelihood of infection and odor issues. The crew will endure discomfort from the poor air quality within the lavatories, especially following prolonged travel. This study establishes a three-dimensional numerical model of an underwater lavatory unit, employing computational fluid dynamics (CFD) to assess ventilation performance and contaminant distributions. The concentration of odor gas and the fate of particles within the lavatory were evaluated for a duration of 3 min subsequent to flushing, considering two scenarios: occupants using either the toilet or the urinal. Additionally, the exhaust air volume and the layouts of the lavatory vents were optimized. The results indicate that the individual using the toilet has a lower concentration of ammonia inhalation, and both scenarios remain unaffected by odors within 60 s after flushing. In contrast to the scenario of using the toilet, the case of using the urinal poses notably fewer risks of human contact, with 65.7% of the deposited particles residing on the urinal surfaces and a mere 8.9% adhering to the manikin surfaces. Enhancing the exhaust air volume can facilitate odor removal in the urinal scenario while slightly improving odor control in the case of using the toilet. An airflow rate of 250 m3/h resulted in a 40% increase in particle deposition within the urinal and a roughly 70% decrease on the manikin during the toileting scenario. The existing ship lavatory ventilation is insufficient to manage the risk of aerosol exposure and sense of smell in the breathing zone of standing crew. The air quality within a lavatory can be significantly improved by employing upper air-supply and lower air-exhaust ventilation.

1. Introduction

The confined space of shipboard underwater lavatories [1,2] and the increased frequency of usage can result in insufficient ventilation, causing a rapid reduction in air quality that may lead to discomfort or health issues for the crew [3,4]. In response to an epidemic of COVID-19, the Japanese cruise ship, Diamond Princess, implemented a ban on the use of public lavatories to reduce the risk of cross-infection [5]. Compared with aircraft and high-speed rail lavatories, shipboard underwater lavatories not only have limited ventilation but are also unable to directly connect with the external environment, making it more difficult to maintain healthy air quality [6]. Therefore, it is highly necessary to assess the performance of existing underwater lavatories, particularly with regard to odor distribution and aerosol transmission, with the aim of offering recommendations for potential ventilation optimization.
The lavatories in transportation cabins such as on ships, aircraft, and high-speed rail utilize negative pressure ventilation to effectively contain odors and airborne contaminants within the enclosed space, thereby preventing their dispersion into adjacent cabin areas [7,8]. Unlike the ceiling air supply–bottom air exhaust arrangement commonly used in airplane lavatories, the air inlet and mechanical exhaust vents are in the upper section of the shipboard underwater lavatory [9,10]. Furthermore, unlike the use of grilles on doors for air supplementation in transportation cabin lavatories, underwater lavatories typically employ watertight doors and are equipped with separate pressure equalization air inlets [11]. Obviously, variations in the locations of air inlets, exhaust outlets, and air supplementation inlets result in a more unique airflow pattern in underwater lavatories. Current data reveal that fewer than 1% of ocean-going vessels employ female crew members, with certain specialized ships explicitly prohibiting female seafarers [12]. To maximize space efficiency, these vessels typically feature compact single-occupancy underwater lavatories integrating both urinals and toilets. However, existing research on transportation cabin lavatories has largely overlooked such multifunctional designs, focusing instead on conventional single-fixture lavatories equipped solely with toilets [13].
The spatial variation in pollutant emission sources significantly alters the transport dynamics of gaseous contaminants in lavatories equipped with combined urinal-toilet systems under fixed ventilation conditions [14,15,16]. During flushing, aerosols generated from the urinal and the toilet exhibit distinct dispersion behaviors, ascending to varying heights and following suspension, deposition, and eventual extraction via the exhaust system [17]. The transport is governed by the interaction between flushing-induced plumes and ventilation airflow. The presence of occupants further disrupts airflow organization due to the confined spatial configuration, thereby causing different exposure risks [18]. Moreover, residual contaminants on the inner surfaces of the toilet and urinal bowl will continue to release ammonia. When the ammonia concentration in the occupant breathing zone exceeds the olfactory threshold of 0.5 mg/m3, a distinct malodor becomes perceptible to lavatory users [19,20]. The simultaneous emission of malodorous gases from both the urinal and toilet will intensify the unpleasant odor perceived by lavatory users.
Enhancing the exhaust airflow mostly facilitates the quick removal of gaseous pollutants from the lavatory. Previous study has shown that increased exhaust air volumes reduce the average volumetric concentration of contaminants more rapidly [21,22]. However, transient high-velocity airflow may induce rapid pollutant dispersion, causing abrupt concentration spikes in occupant breathing zones [23,24]. Reducing the distance between the exhaust vent and the pollutant emission source can enhance the effectiveness of pollution removal and limit the widespread distribution of pollutants within the lavatory [25,26]. Additionally, incorporating air inlets into the breathing zones of the lavatory, where individuals are either standing or sitting, may prove beneficial in reducing inhalation exposure and perception of odor [27,28].
Drawing from the above literature analysis, the ventilation performance of the shipboard underwater lavatory has not been effectively evaluated, and the odor distribution and aerosol transportation are not clear. In this study, a simplified CFD model was established based on an actual lavatory, ignoring the impact of toilet flushing plumes on odor and aerosol transmission. It was assumed that the toilet and urinal after flushing released a constant concentration of odor gas and a fixed number and size distribution of aerosol particles, so as to evaluate the impact of ventilation airflow in both cases of using the toilet and urinal, and to compare the optimization performance of exhaust air volume and ventilation layout.

2. Materials and Methods

2.1. Lavatory Model

A numerical simplified physical model, as shown in Figure 1, was developed using on-site measurements and the configuration of the shipboard underwater lavatory. The dimensions of the lavatory, after the removal of the faucet and unnecessary internal pipes, are 2.0 m × 1.5 m × 1.9 m. The maximum dimensions of the toilet are 30 cm × 45 cm × 45 cm, the urinal measures 50 cm × 30 cm × 70 cm, and the washbasin measures 50 cm × 50 cm × 100 cm. The air inlet duct extends 20 cm into the interior, featuring a circular air inlet with a diameter of 8 cm, with the center position coordinates of (0.8 m, 1.8 m, 1.5 m). The exhaust duct continues 0.2 m into the interior, including a circular exhaust exit with a diameter of 8 cm, with the circle center positioned at (1.3 m, 0.3 m, 1.5 m). The dimensions of the manikin were 40 cm × 20 cm × 170 cm. In Figure 1a,b, a geometrical model of the standing manikin was created to flush the urinal and the toilet, considering the different scenarios of toileting and urinating. This model remained unchanged except for the alteration in the position of the manikin.

2.2. Numerical Strategies

The continuity equation, momentum equation, and energy equation are the primary regulating equations when using the turbulence model to address the flow and heat transfer issues in an underwater lavatory on a ship. The generalized version of the equation is as follows:
t ( ρ ϕ ) + d i v ( ρ u ϕ ) = d i v ( Γ ϕ g r a d ϕ ) + S ϕ
where t is the time, s; ρ is the air density, kg·m−3; ϕ can be expressed as ui, T; in the momentum and energy equations; Γ ϕ is the generalized diffusion coefficient; and S ϕ is the generalized source term.
Since the ventilation airflow in the ship lavatory flows in a turbulent form not involving transient toilet flushing plumes, the RNG k-ε model is used to solve for the more linear airflow in the lavatory. To determine the airflow organization and temperature distribution, the Navier–Stokes equations and the energy equations were solved by coupled CFD simulations in COMSOL 6.1 software. The fluid is discretized in the first-order shape function discretization, using the linear shape function to solve for the fluid velocity field and pressure field. In COMSOL, “P1 + P1” is a commonly used finite element discretization method, which is mainly used for numerical simulations of fluid dynamics. It discretizes the velocity field and pressure field of the fluid by using different approximation methods, so as to solve the problem of fluid flow. The algorithm is deemed to converge when the relative tolerance is less than 10−3. The ship lavatory is a pneumatic drain commode. By injecting a certain pressure of compressed air into the flushing water tank, the compressed air is used to push the water to flush the wall of the commode in order to achieve the purpose of water conservation.
The amount of water consumed by each flush is about 1 L. Unlike the vacuum toilet, which experiences a significant pressure drop near the outlet during discharge, the pneumatic drain toilet discharges maintain pressure comparable to that of the lavatory. Therefore, this article focuses mainly on simulating aerosol release and spread in association with lavatory ventilation airflow, disregarding variations in flushing-generated airflow and aerosol dynamics within the toilet during flushing.
Table 1 presents the primary boundary conditions employed in the numerical simulation of the flow field, temperature field, and pollutant dispersion within the ship lavatory. The ship lavatory has an air supply of approximately 50 m3/h from its air intake, while the air exhaust located on the upper right side of the urinal discharges air from the lavatory at a flow rate of 100 m3/h. The ship lavatory operates under negative pressure ventilation, with the exhaust air volume being twice that of the purified air supply. The air from the external compartment of the lavatory is replenished at a rate of 50 m3/h through a balanced hole located on the right side of the toilet. The airflow temperature was 22 °C, and the balanced hole was set as a pressure inlet, sustaining atmospheric pressure. The standing manikin in the lavatory had a skin surface temperature of 31 °C. It is assumed that the remaining solid walls are adiabatic.
The Lagrangian method is applied to determine the flow field within the shipboard underwater lavatory by tracking the released aerosol particles. The force balance equation of particles based on Newton’s second law equations are as follows:
m p d u p d t = F
where m p is the particle mass, u p is the particle velocity vector, and F is the combined external force on particles.
The evaporation of these particles during the flow is not considered, and their movement is solely influenced by gravity and trailing force. Aerosol particles lose their momentum upon striking a wall and are subsequently captured by it. Aerosol particle emission occurs just from the toilet when the user stands in front of it to flush, and exclusively from the urinal when the user is standing in front of the urinal to flush. This study ignored the effect of the instant plume on odor gas and aerosol particles. Based on previous studies of Li [7,31], 0.5–1 μm aerosol particles generated from the toilet account for almost 80–90%, and particles larger than 1 μm account for only 10–20%. In addition, the emission source intensity of aerosol particles is also on the order of thousands. Therefore, this paper assumes that the total number of released particles is 7200, the release ratio of 0.5 μm particles is 50%, that of 1 μm particles 33%, and that of 5 μm particles 17%, and the particle size distribution is 3:2:1. The study time is 0–180 s, and assuming that the personnel using the lavatory have finished flushing in 31–35 s (the flushing program is set to complete in 5 s), particles are generated in the toilet bowl or urinal and begin to spread with the ventilation airflow.
The evaporation of ammonia from the liquid film on the inner wall of the urinal and toilet bowl is unavoidable, as flushing cannot completely remove the residual ammonia present in the liquid film on the surface of the toilets and urinals. Ammonia is known to irritate the eyes and upper respiratory tract and is considered the primary source of odor in lavatories. In a ship lavatory, it is posited that the ammonia release rate from the walls of the commode is equivalent to that of a domestic toilet, characterized by a uniform and constant release at a rate of 5 × 10⁻⁶ m3/s [29,30]. In a similar manner, the previously solved flow field is utilized to determine the distribution of ammonia concentration within the ship lavatory by analyzing the spread of ammonia emitted from the inner wall surfaces of the toilet and urinal bowl.
The direct solver PARDISO serves to perform the solution process. The total solution duration of this study was 180 s, the time step was 1 s, and the aerosol particles were released to the following flow field in 31–35 s. An unstructured tetrahedral mesh defines and establishes the geometrical model illustrated in Figure 1. The grid cell size ranges from a maximum of 90.4 mm to a minimum of 25.1 mm, with a growth rate of 1.15. In proximity to the intake, exhaust, and make-up air inlets, the minimum grid size is specified as 10 mm. The grid irrelevance test in Table A1 and Figure A1 determined the optimal grid size to be 250,000 elements.

2.3. Case Setting of Air-Exhaust Volumes and Ventilation Layouts

Table 2 shows the case design intended to assess the impact of varying air-exhaust volumes and ventilation vent layouts. Specifically, in Cases 1 to 4, the air supply volume remains constant at 50 m3/h, whereas the air exhaust volumes are adjusted to 100, 150, 200, and 250 m3/h, with the ventilation layouts as illustrated in Figure 2. Furthermore, in Case 1a and 1b, the ventilation layouts are configured as depicted in Figure 2, with the air-supply and air-exhaust volumes held steady at 50 m3/h and 100 m3/h, respectively. Figure 2a depicts the design of the exhaust vent positioned beneath the urinal, with its center located at coordinates (1.3 m, 0.75 m, 0.2 m). This design retains the existing air supply configuration and is designated as Case 1a. Figure 2b presents Case 1b, which builds on Case 1a and features a ceiling air supply center designed at coordinates (0.8 m, 1.2 m, 1.7 m). Case 1 illustrates real working conditions and provides a basis for subsequent research.

2.4. Validation of the Simulation Program

While validation should ideally focus on airflow patterns and odor gas transmission within shipboard lavatory environments using clearly defined boundary conditions, experimental data specific to shipboard lavatories are currently unavailable in the published literature. As a practical alternative, the reported airspeed and temperature data in the literature [32] were used to validate the accuracy of the CFD model. The geometric dimensions are 2.5 m × 3.65 m × 3 m, as illustrated in Figure 3. The room utilizes displacement ventilation, introducing fresh air at a temperature of 21 °C and a flow rate of 0.05 m3/s from a floor-level inlet. The room contains a heater fan that circulates air at a temperature of 45 °C with a flow rate of 0.028 m3/s. The exhaust vent, utilized for heat removal, is located above the ceiling. Temperature and velocity data are obtained post-simulation for comparison with corresponding measurement points in the lavatory, ensuring that the numerical strategy setup and boundary conditions match with the observed data in the literature.
The steady-state flow field and temperature distribution in the room were analyzed using conventional wall functions and the k-ω turbulence model. Figure 4 presents the extracted temperatures and velocities along the line segment from the median line of the warm air jet inlet at Z = 0 m to Z = 2.3 m for a comparison. Temperature and velocity decrease consistently with increasing height, as illustrated in the image. The jet surrounds the air, resulting in velocity attenuation, while the low-temperature airflow similarly envelops the hot airflow, leading to cooling. The simulated and calculated velocity and temperature values exhibit greater concordance with the measured values. The maximum and average velocity deviations are 0.23 m/s and 0.14 m/s, respectively, while the maximum and average temperature deviations are 1.8 °C and 1.1 °C. The turbulence modeling technique used in this study demonstrates high accuracy, supported by CFD modeling results that align closely with previous research [32].

3. Results

3.1. Flow Field, Odor Gas, and Particle Transport of Underwater Lavatory in Original Case

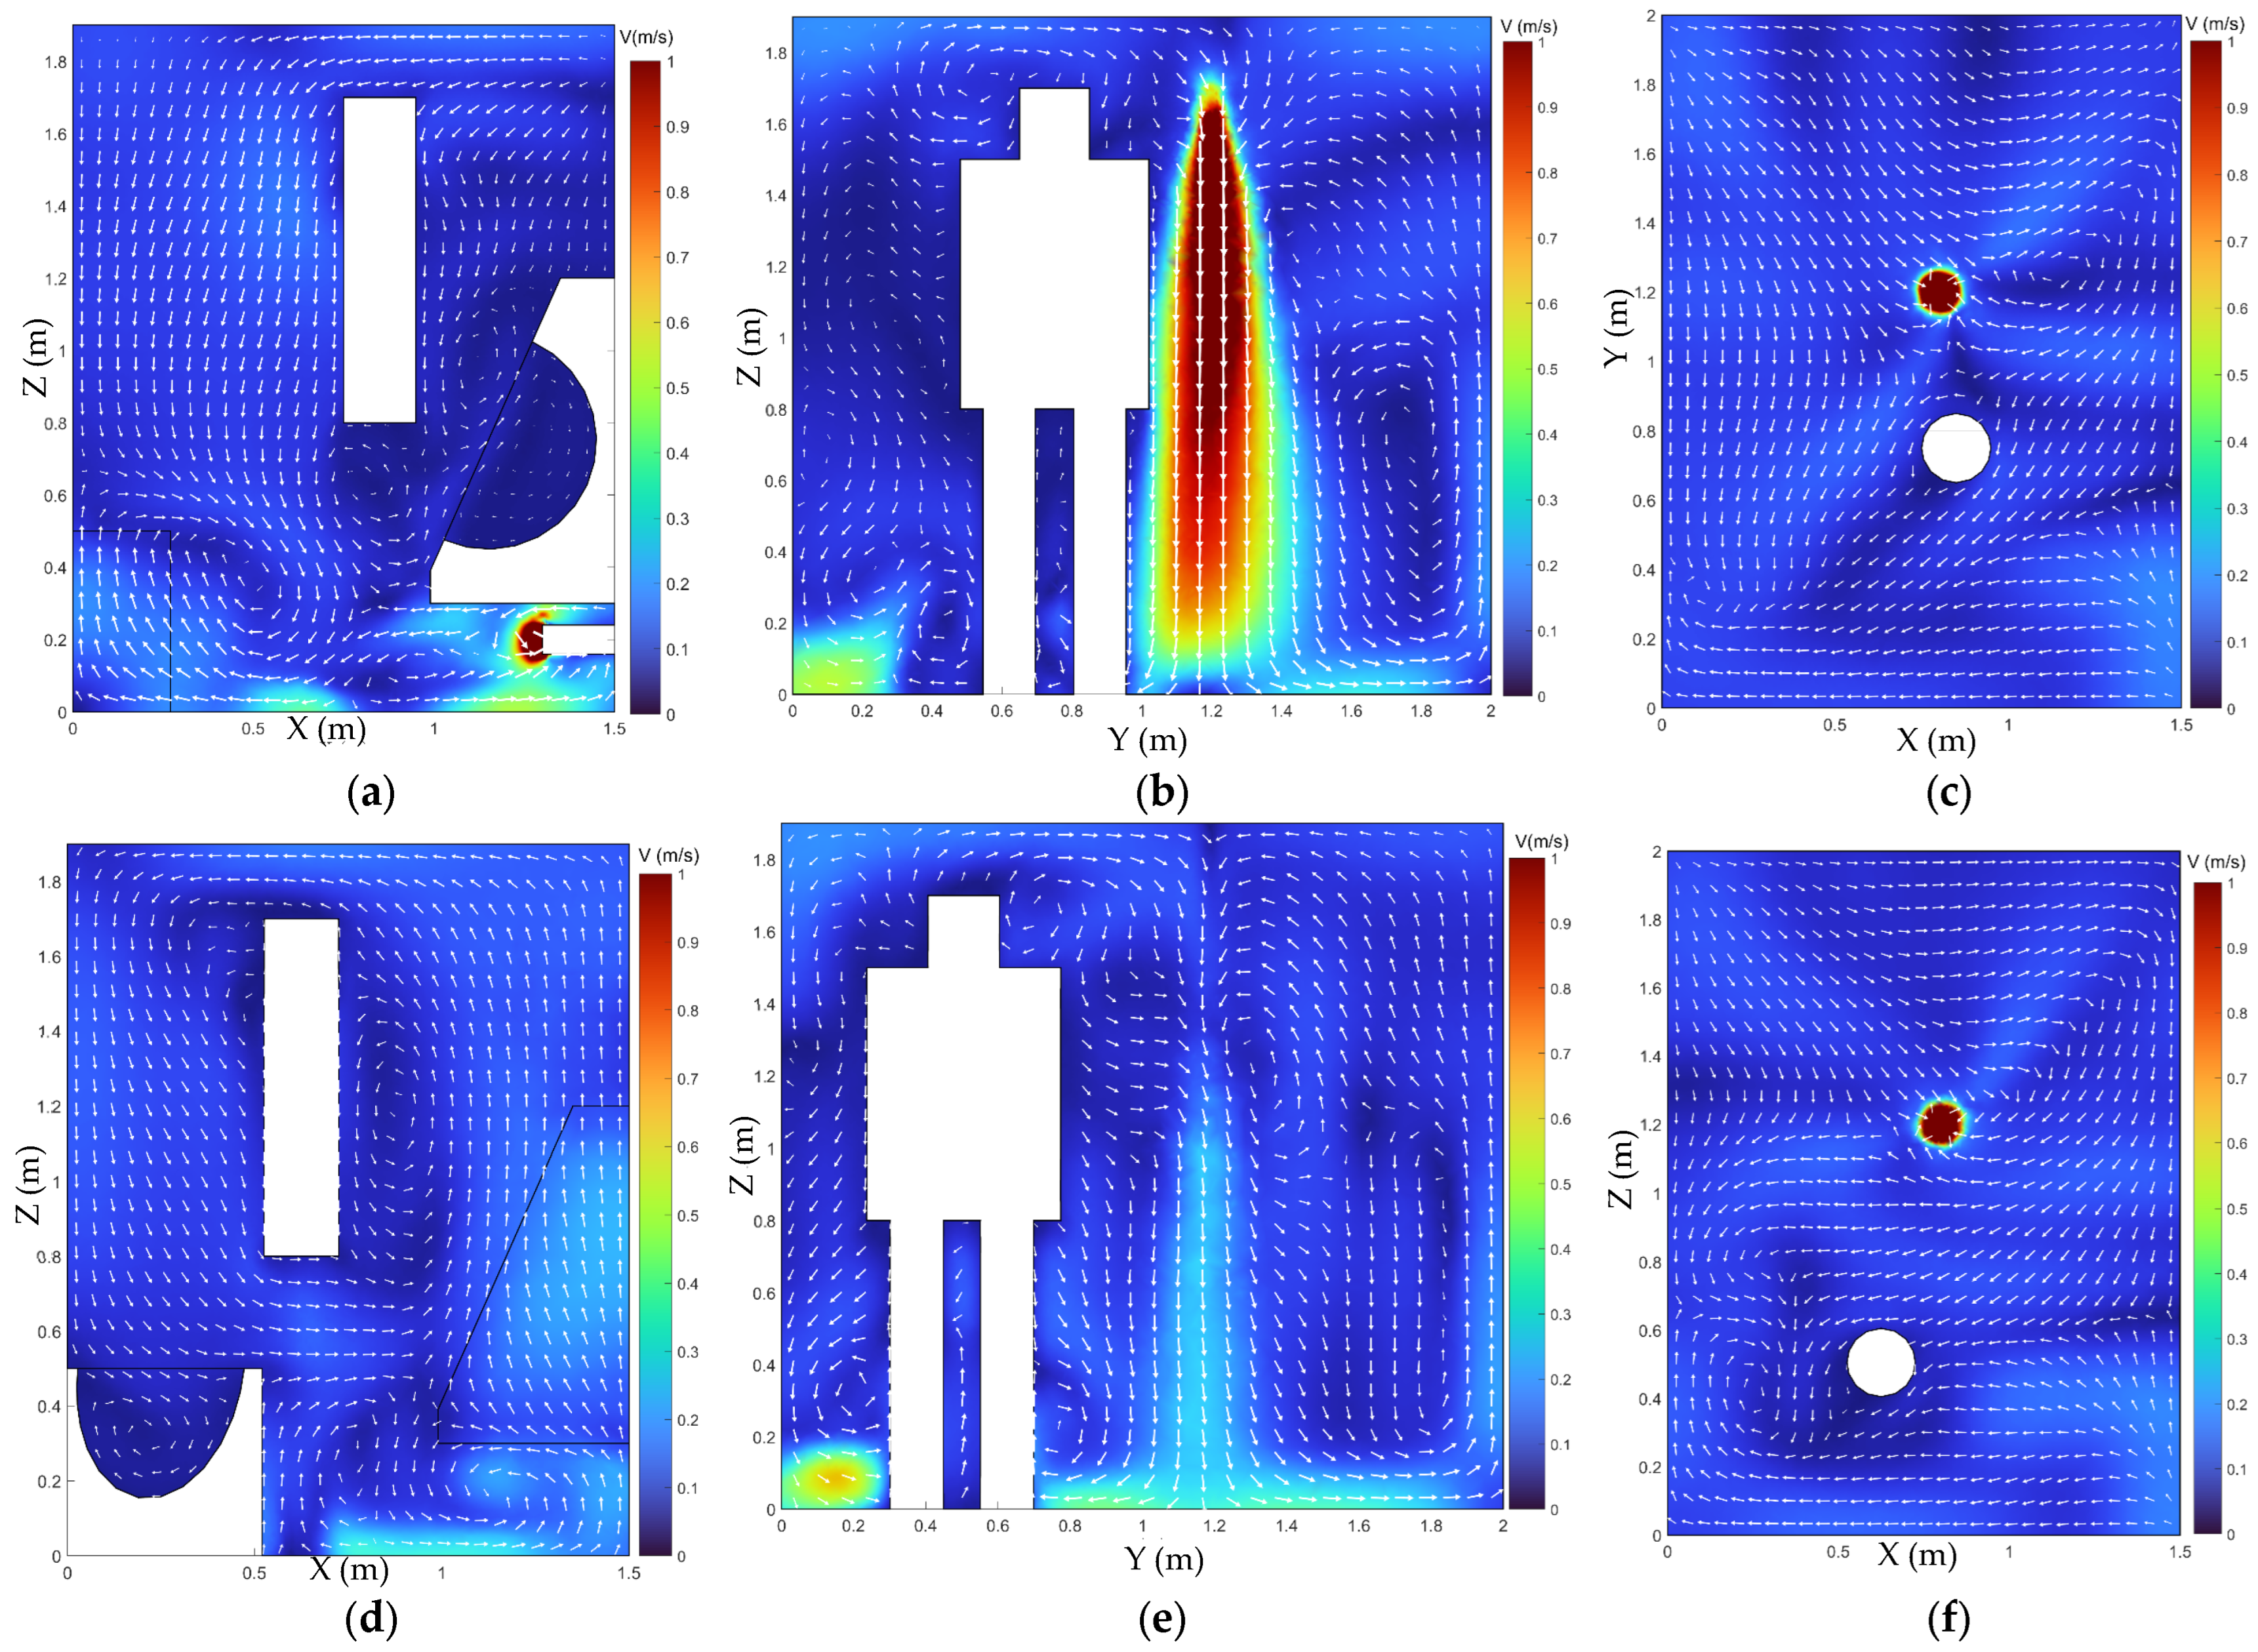
Figure 5 illustrates the airflow field in the symmetric vertical section for both scenarios involving a person standing in front of the urinal and the toilet. Figure 5a shows the airflow distribution in the case of using the urinal within the symmetric vertical section of the lavatory at Y = 0.75 m. Because the inlet nozzle airflow directly impinges on the person, the lavatory user’s head may experience a high airflow velocity on both sides. A distinct vortex circulation develops within the urinal because of the influence of the wall surface, characterized by a vertical downward airflow directed toward the base of the urinal. This circulation is further divided into two sections: the interior wall surface and the outside of the urinal. Exposure and odor issues may result from aerosols and residual odorous gases in the urinal that are carried outward by air currents. Figure 5b illustrates the airflow distribution in the case of using the urinal within the symmetric vertical section of the lavatory at X = 0.70 m. The large vortices can be observed developing on the sides of the manikin. The right side of the manikin exhibits a vortex due to the increased velocity of the inlet airflow entrainment. The airflow is directed upward, suggesting that the pollutants released by the urinal will rise to an approximate height of 1.4 m. Contaminants may not be entirely spread due to the clockwise circulation above the shoulder and the counterclockwise circulation below the shoulder, which separate the vortex on the left side of the manikin. In Figure 5c, the airflow entering impacts the head of the individual and branches out, implying a potential risk of draught during the use of the lavatory.
Figure 5d,e indicate the vertical section of the lavatory, encompassing both the toilet and the manikin. When standing facing the toilet, the central position of the manikin is misaligned with the axial direction of the inlet air flow, so that the inlet air flow will no longer directly impact the head of the person, which will reduce the draught risk, as shown in Figure 5f. A robust counterclockwise vortex circulation is generated over the toilet bowl because of the manikin obstructing the airflow. The odor and aerosol gases expelled from the toilet bowl rise to the breathing zone. The positioning of the manikin in relation to the air inlet places it outside the path of the incoming airflow, consequently resulting in a reduced airflow velocity of approximately 0.25 m/s within the breathing zone. This indicates that the varying standing positions of the individual result in a significant alteration in the airflow field within the lavatory, particularly in the respiratory zones adjacent to the urinal and toilet, where the degree of pollutant dispersion varies.
Figure 6 depicts the distribution of ammonia gas concentration in the symmetric vertical section of the lavatory at t = 60 s, 120 s, and 180 s for both cases of personnel standing in front of the urinal and toilet. Figure 6a shows that ammonia continues to flow out of the toilet and urinal within a minute after flushing due to ventilation airflow in the lavatory. Ammonia accumulates mainly above the toilet, around the manikin, and above the urinal due to eddy circulation. The concentration of ammonia in the breathing zone remained low within 120 s. The ammonia concentration in the vortex circulation region increased at 180 s, and the ammonia concentration throughout the lavatory exceeded the human olfactory threshold of 0.5 mg/m3. Figure 6b shows the ammonia concentration in the case of using the toilet. The vortex generated above the toilet promotes the upward movement of released ammonia towards the manikin. However, obstructing airflow circulation significantly reduces the concentration of dispersed ammonia. The ammonia concentration around individuals using a toilet was consistently lower than that of individuals using a urinal for up to 180 s.
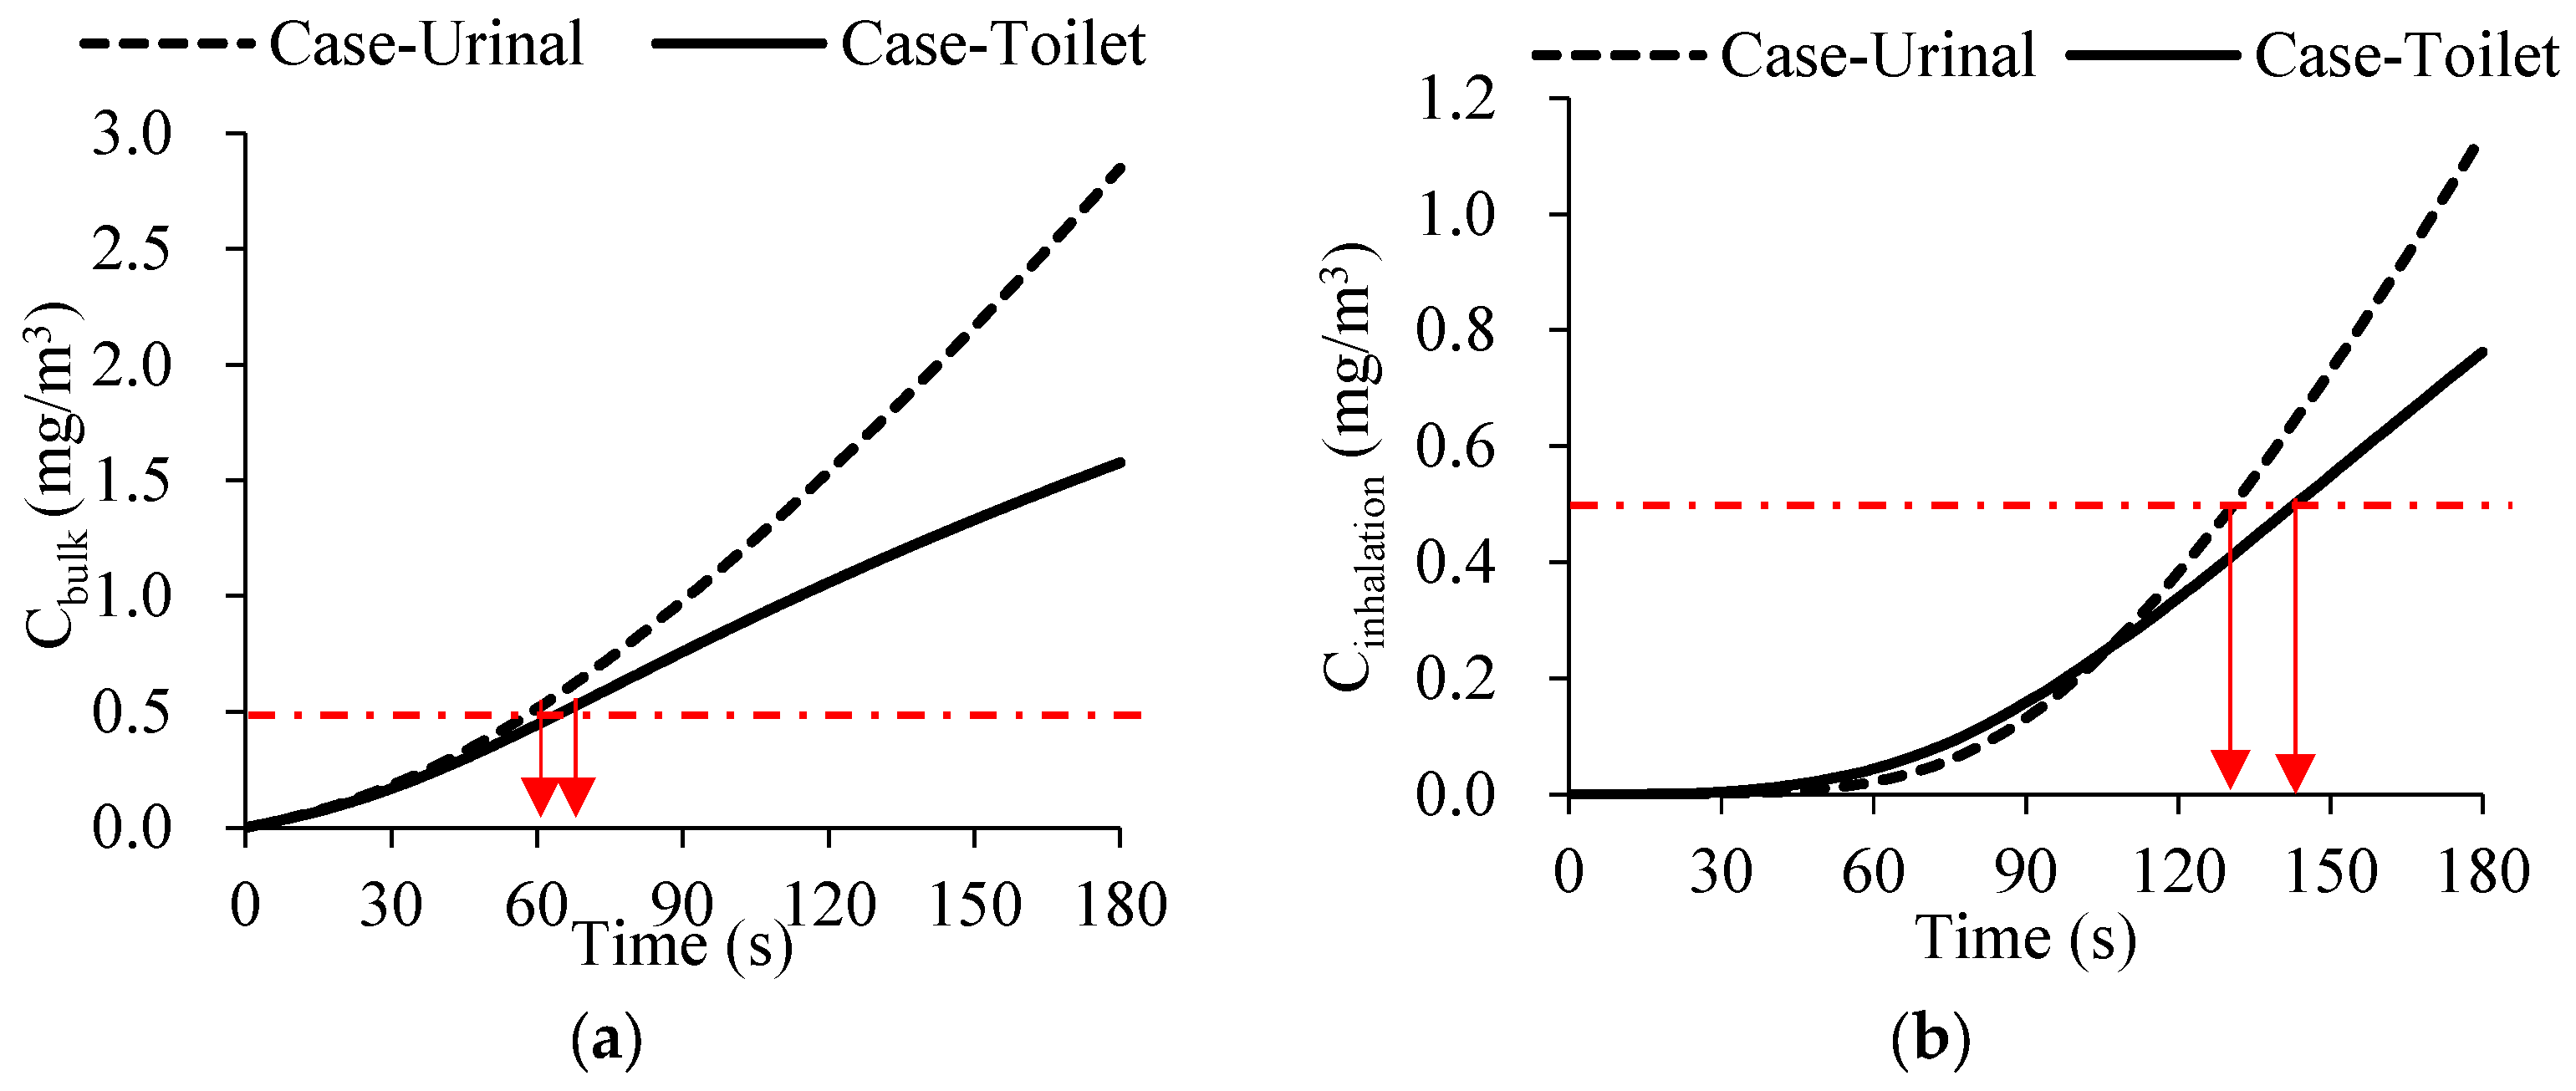
Figure 7 illustrates that the bulk concentrations and inhalation concentrations of the lavatory were lower in the case of using the toilet than using urinal. Figure 7a shows a significantly higher rate of increase in ammonia concentration in the case of using the urinal compared to the case of using the toilet. Ammonia concentrations in both cases were below 0.5 mg/m3 within 1 min after flushing, and the odor posed no annoyance to the users at that time. The ammonia concentration in the case of using the toilet is approximately 1.5 mg/m3, which is considerably lower than that observed in the case of using the urinal for 3 min. The positioning of lavatory users significantly influenced airflow circulation, leading to variations in the transmission process between the two cases, despite consistent release site and pollutant concentration. Figure 7b reveals that within 2 min, the ammonia concentration in the breathing zone was below the olfactory threshold concentration. In the case of using the urinal, the ammonia concentration in the breathing zone increased from 0.5 mg/m3 to 1.1 mg/m3 within 120–180 s, significantly exceeding the final concentration of 0.8 mg/m3 observed in the case of using the toilet.
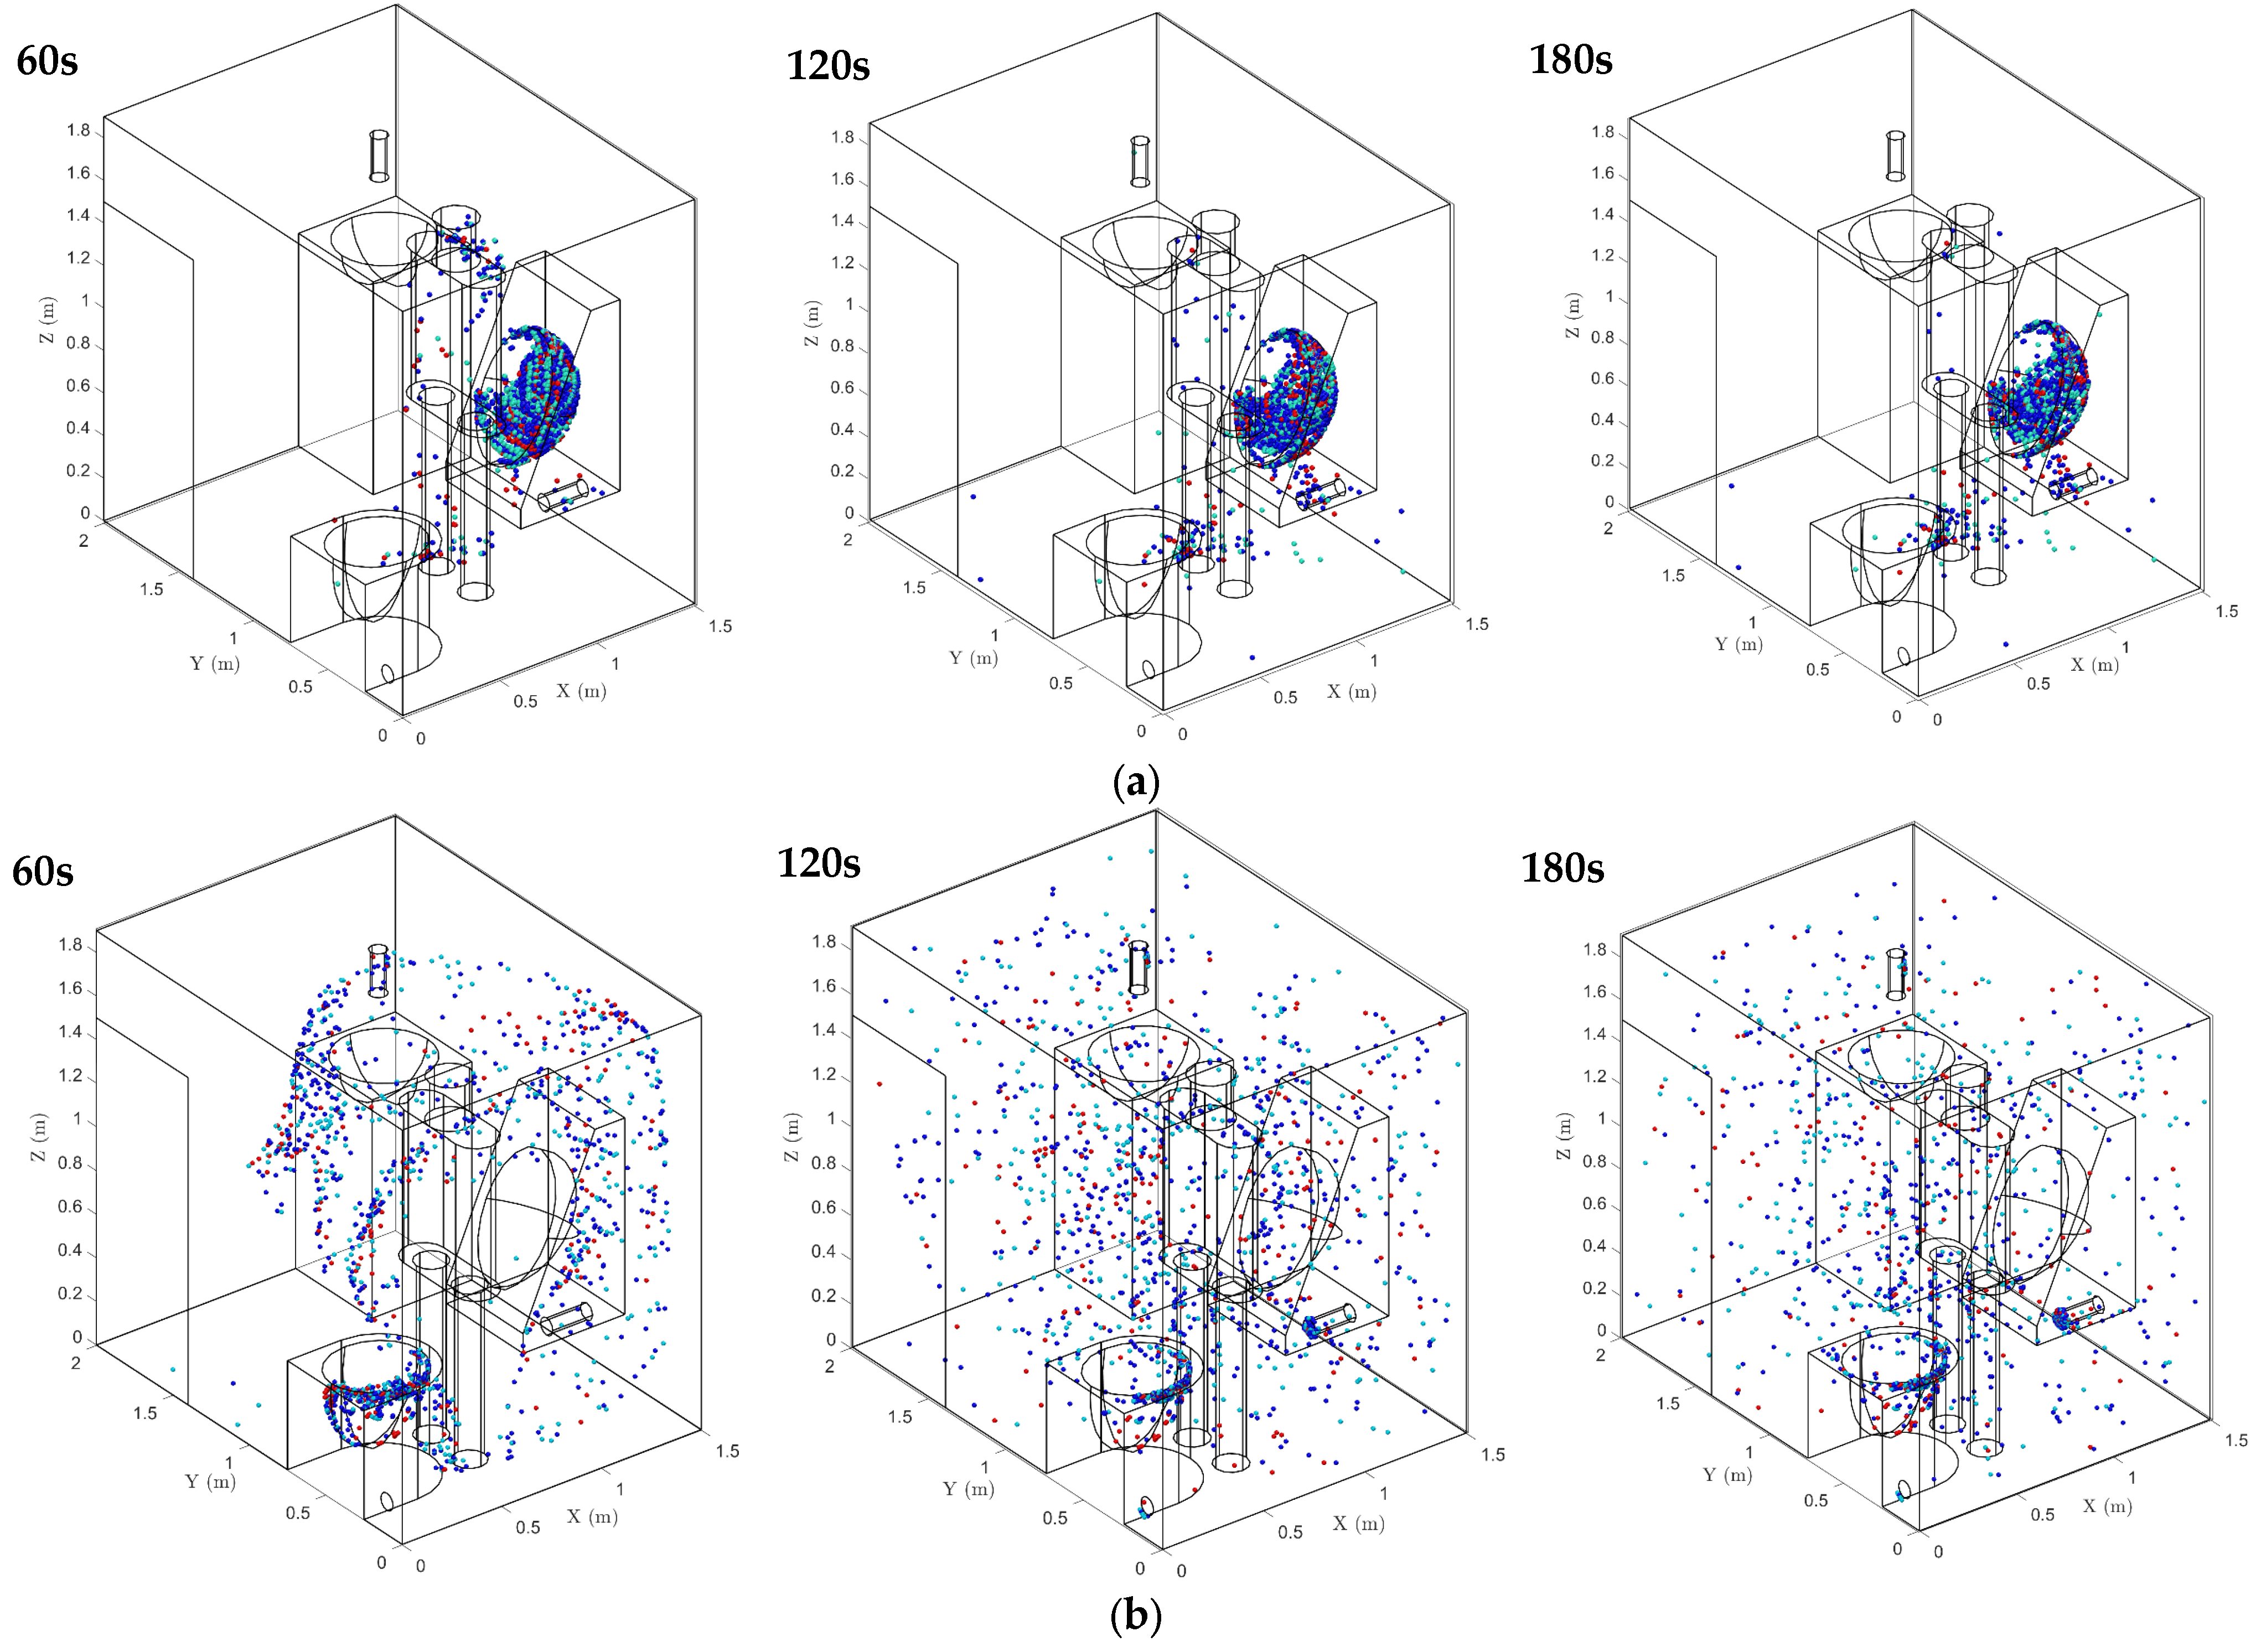
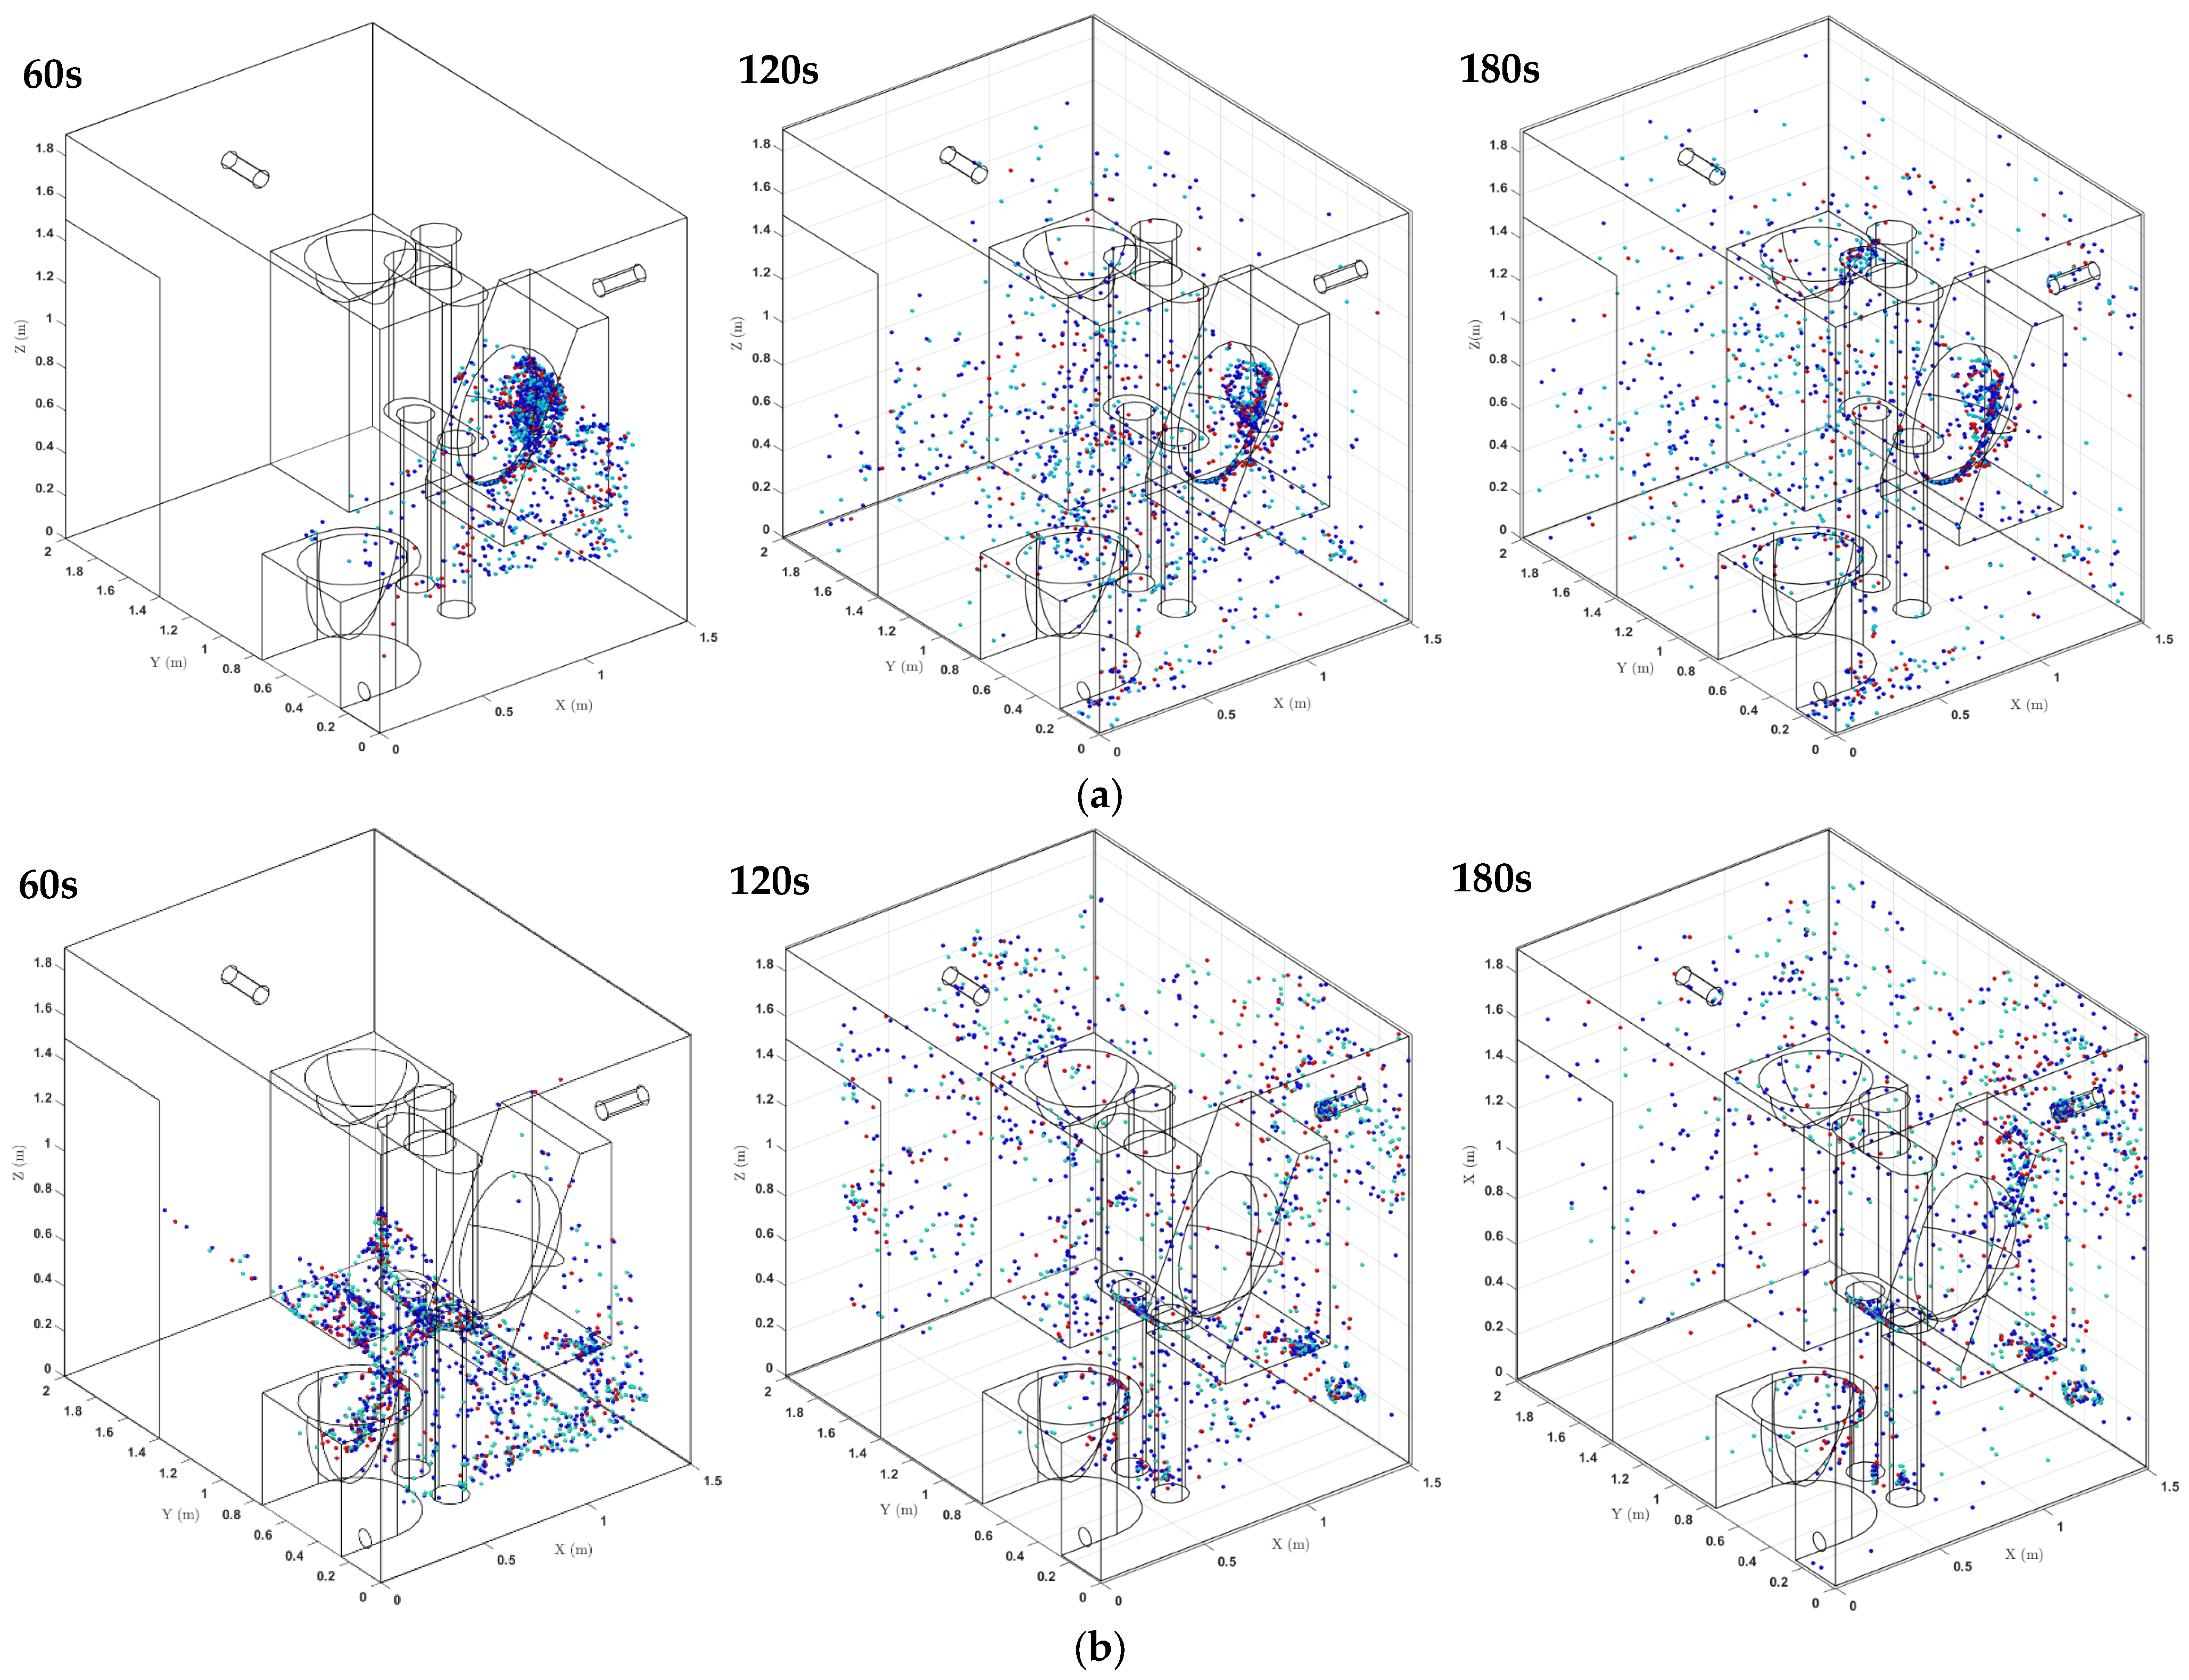
Figure 8 shows the dynamic transport of aerosols released from the urinal and toilet within the lavatory, with particle release occurring between 31 s and 35 s. Figure 8a indicates that just a small number of aerosol particles enter the lavatory air circulation from the urinal, while the majority remain within the urinal after 30 s. Particles were deposited on the lavatory walls at 120 s; however, only a few were found near the air-exhaust vent. After 180 s, the urinal particles spread throughout the lavatory, resulting in apparent deposition on the walls, floor, and manikin. Figure 8b demonstrates that the particles released from the toilet spread to Wall 1 and into the lavatory in significant amounts within 30 s because of the upward vortex entrainment. Most of the particles stayed in the air and deposited on the urinal and manikin surfaces, with only a small portion left in the toilet bowl at 120 s. The exhaust vent discharged considerably more particles during 180 s than in the case of using the urinal.
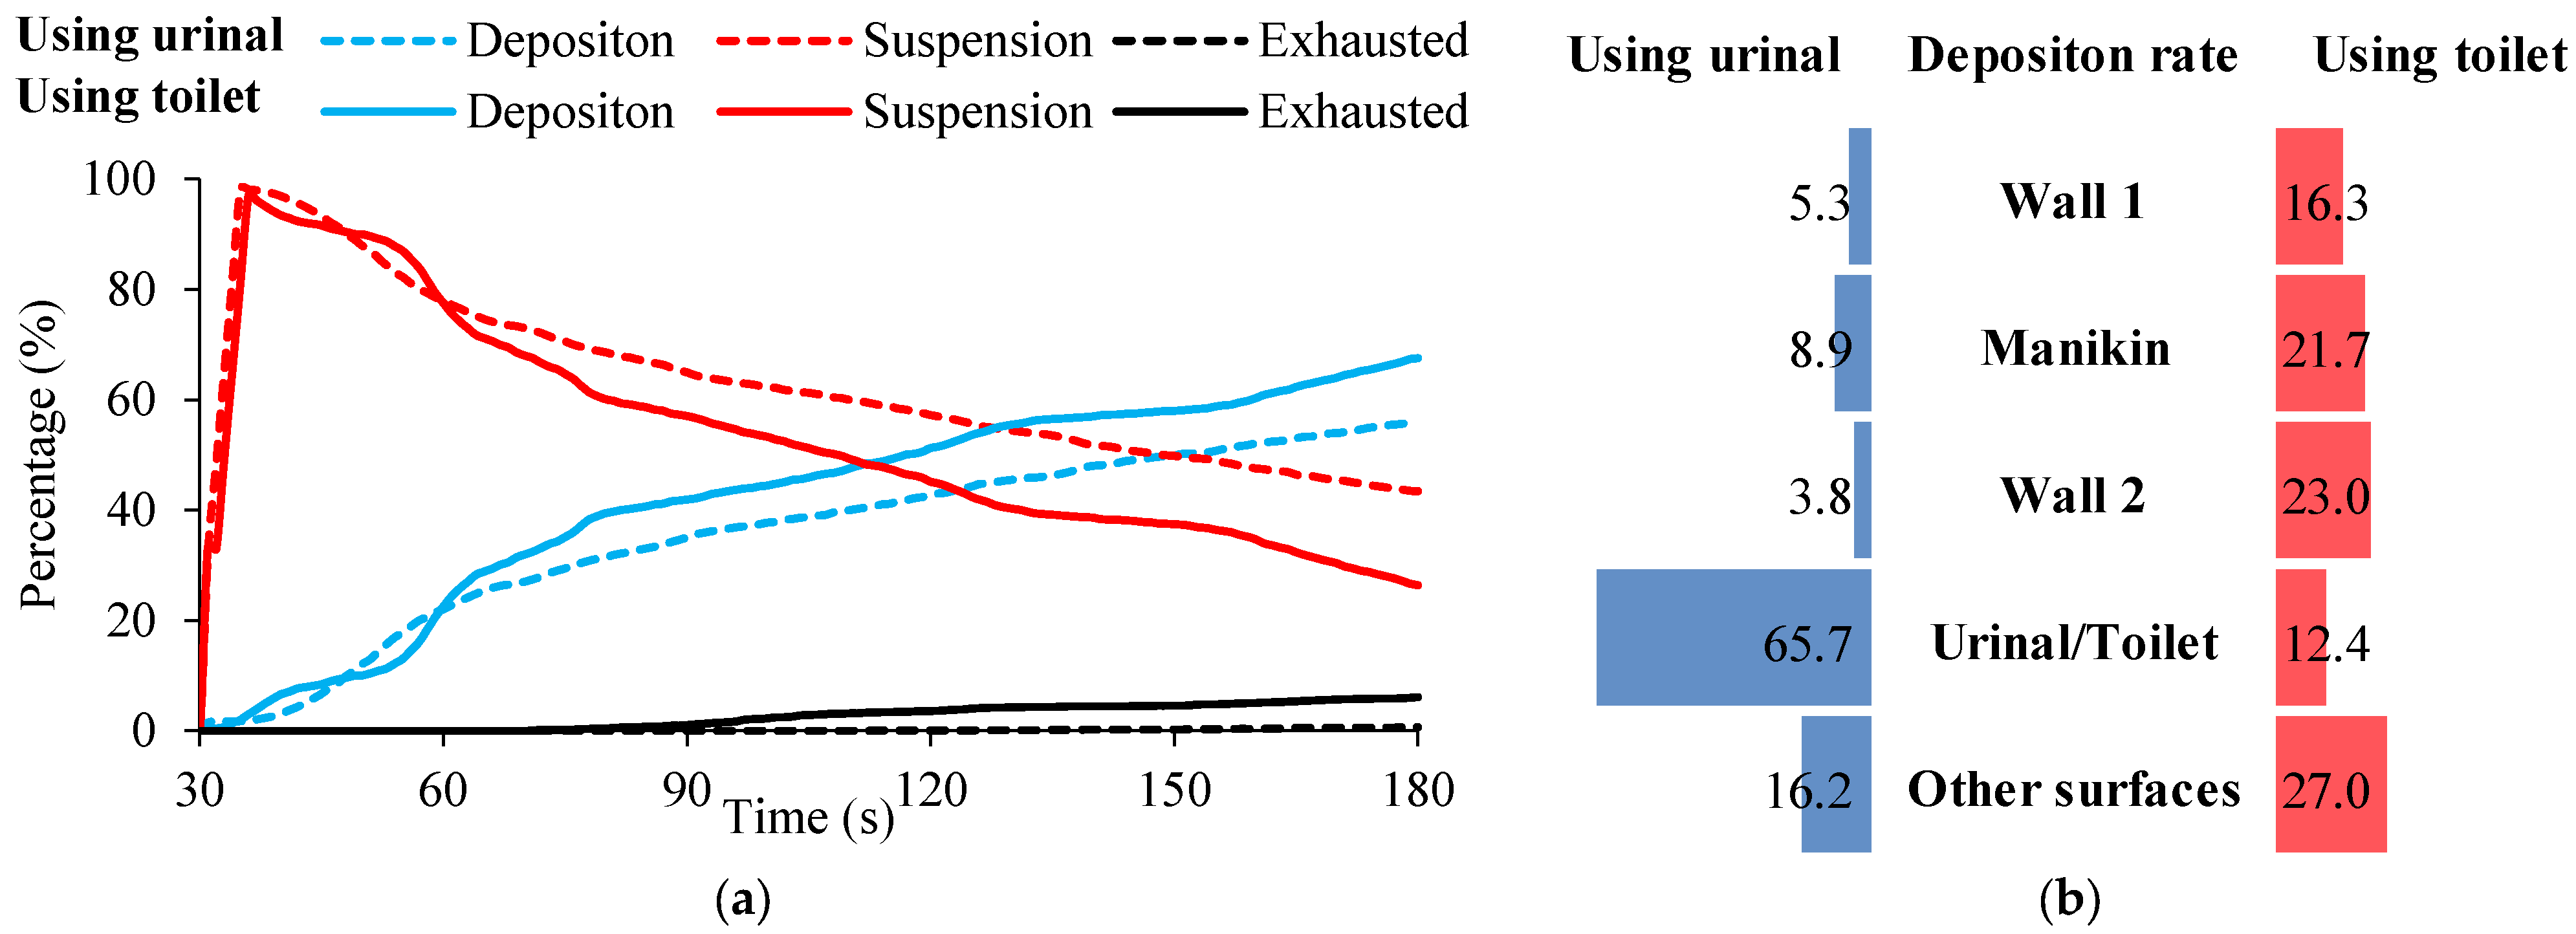
Figure 9 illustrates the statistics related to particle fate and the distribution rate of deposited particles on each surface. Figure 9a demonstrates that deposition and exhausted particles decrease the ratio of suspended particles in the air, regardless of whether the particles are released from the toilet or the urinal. The percentages of suspended particles within the lavatory in cases of using the toilet and urinal are finally maintained at 27% and 44%, respectively. The case of using the urinal exhibits a deposition rate of 56% for deposited particles, which is 12% lower than that recorded in the case of using the toilet. After 120 s, the case of using the toilet had an exhaust efficiency of 6%, which was significantly higher than the 0.6% in the case of using the urinal. Figure 9b depicts the distribution of deposited particles in the cases of using the urinal and toilet. The results suggest that 65.7% of the particles are deposited on the urinal surface, indicating a minimal risk of contact. In the case of using the toilet, the deposited particles are almost evenly distributed on all surfaces of the lavatory, and the proportion of deposited particles on the manikin surface is about 22%, which is much higher than that in the case of using the urinal. It is worth noting that only 12.4% of the particles are deposited on the surface of the toilet bowl, which means that all the particles released in the toilet bowl escape into the lavatory, causing a greater risk of infection.

3.2. Influence of Air-Exhaust Volume on Odor Gas Concentration and Particle Fates

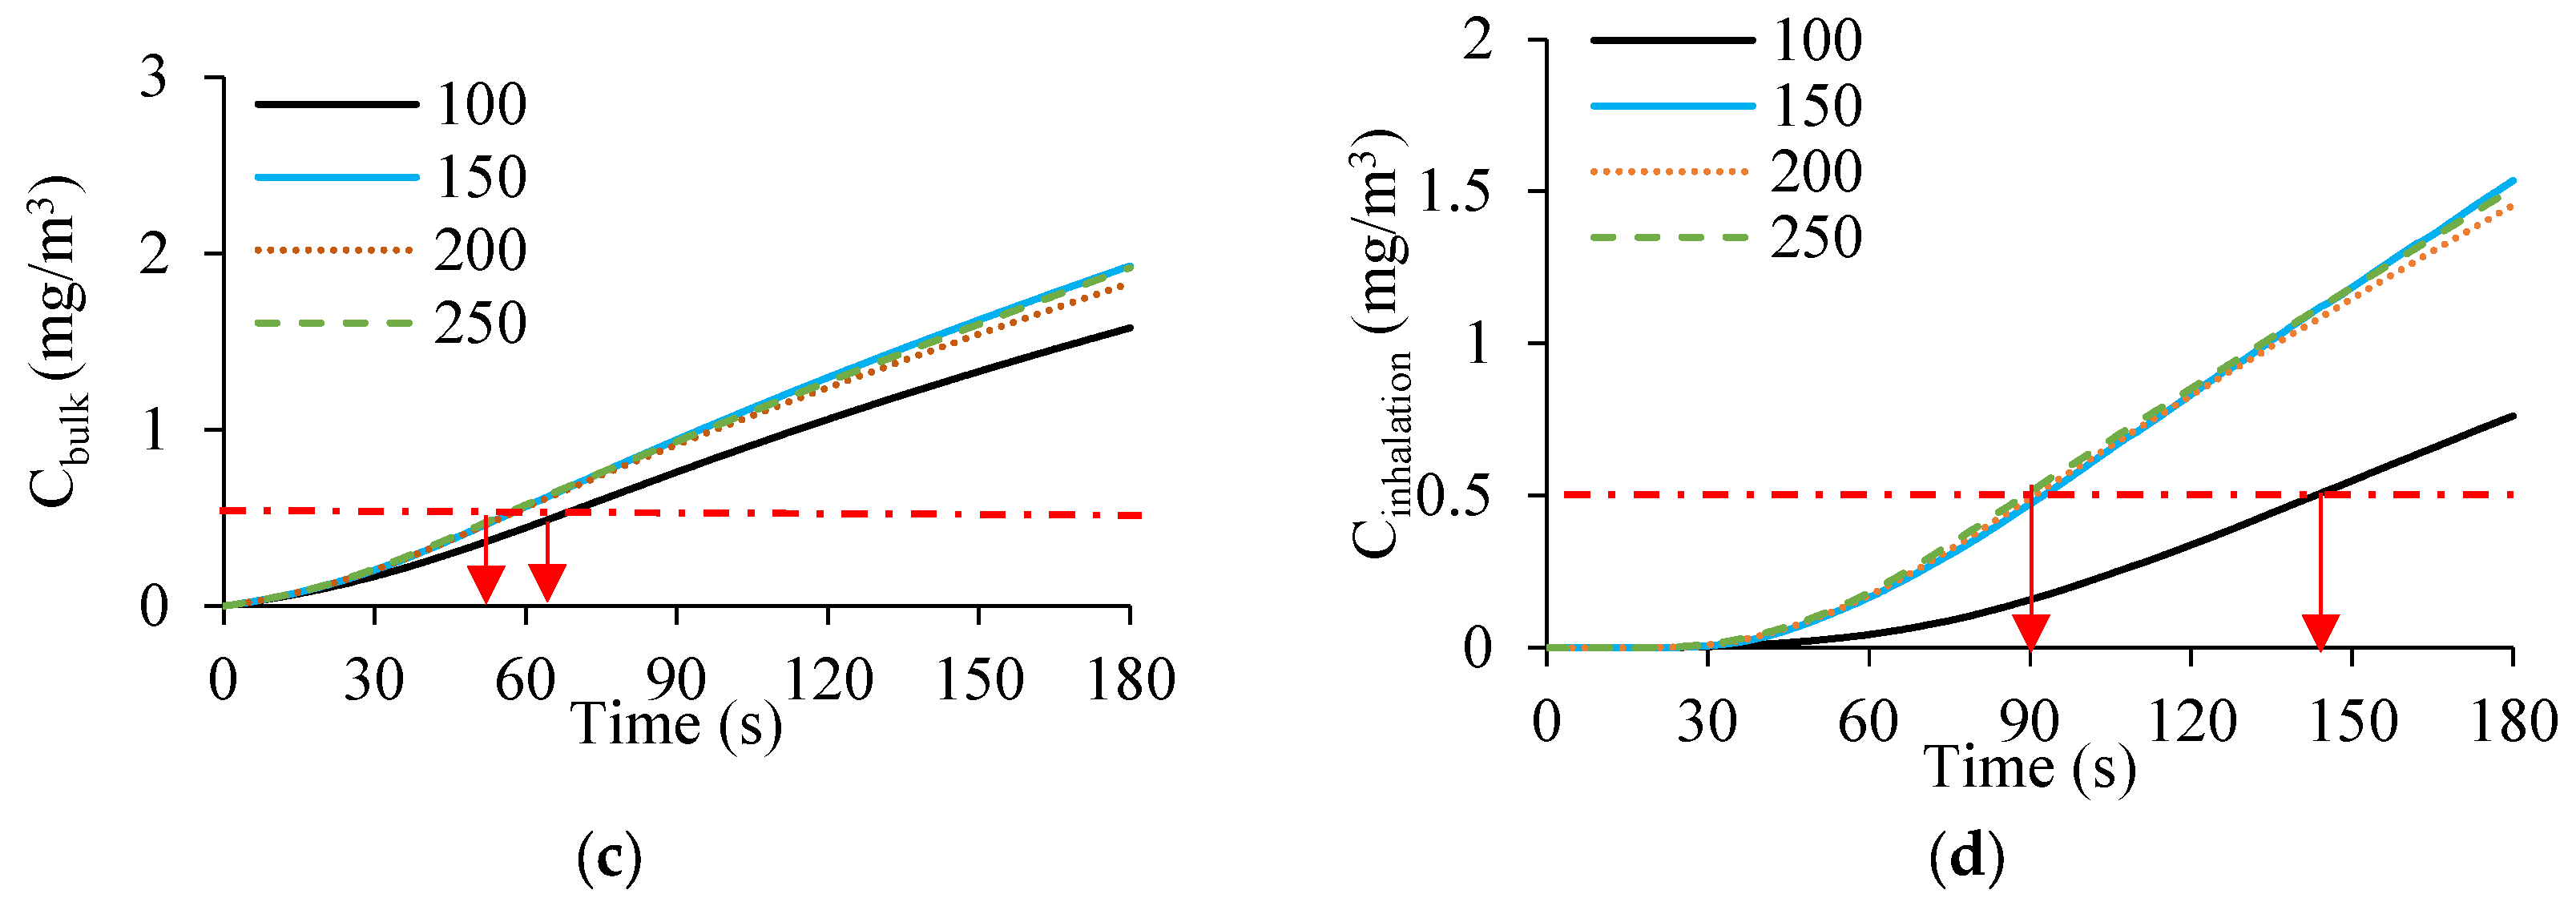
Figure 10 illustrates the bulk concentrations of lavatory and inhalation concentrations in cases 1–4 at air-exhaust volumes of 100, 150, 200, and 250 m3/h. In Figure 10a, for the case of using the urinal, increasing the air-exhaust volume beyond 150 m3/h resulted in a 45% reduction in bulk concentrations, which decreased to 1.6 mg/m3. Within 60 s after flushing, the increase in exhaust volume had no impact on the change in volumetric concentration. This is most likely because the ammonia released from the toilet and urinal has not yet entered the airflow circuit within the lavatory. Figure 10b shows that increasing the air-exhaust volume considerably increased ammonia concentrations in the breathing zone. When the exhaust air volume hits 150 m3/h, the ammonia concentration in the breathing zone approaches the olfactory threshold in roughly 100 s, which is 30 s faster than that at 100 m3/h. The large volume of exhaust air causes a progressive reduction in the ammonia concentration in the breathing zone, which reaches 1 mg/m3. Increasing air-exhaust volumes elevated the airflow velocity in the lavatory, thereby intensifying the transmission of ammonia and facilitating its removal, ultimately leading to a more rapid increase in ammonia concentration within the breathing zone. However, despite this, odor control in the lavatory remained virtually unchanged when exhaust air volumes exceeded 150 m3/h.
Figure 10c,d show that in the case of using the toilet, an increase in exhaust airflow correlates with a rise in both the inhalation concentration and the volumetric concentration of ammonia in the lavatory. The inhalation concentration for the toilet user increased considerably. Exhaust air volumes of 150, 200, and 250 m3/h make the odor concentrations slightly increase. The ammonia concentration in the lavatory increased from 0.3 mg/m3 to 0.9 mg/m3 at 180 s and 0.5 mg/m3 approximately 10 s earlier when the exhaust flow was increased. Increasing the exhaust airflow resulted in persons experiencing the odor 1 min earlier. At 180 s, the odor concentration of 1.5 mg/m3 exceeds the original design concentration for inhalation by more than double. The increased exhaust volume caused increased airflow circulation above the toilet, which resulted in a higher accumulation of ammonia within the airflow zone, limiting efficient removal and increasing both volume and inhalation concentrations.
Figure 11 depicts the particle fate for both cases of using a urinal and a toilet at different air exhaust volumes. Figure 11a reveals that the deposition and suspension rates of particles released from the urinal were reduced as the air-exhaust volume rose. When exhaust volume exceeds 200 m3/h, the deposition rate approaches 78%, representing a 39% increase. The ratio of suspended particles in lavatory air circulation decreased from 43% to 21%. Increasing exhaust air volume improved efficiency, although the rate at 250 m3/h was lower than at 150 and 200 m3/h. This is because most particles are deposited before entering the system of exhaust. Figure 11b shows that an increase in exhaust airflow had no effect on particle dispersion from the toilet. The deposition rate of particles released by the toilet ranged between 55% and 66% and remained consistent despite changes in airflow. Changes in airflow had a limited impact on around 32% of the toilet particles that stayed airborne. The exhaust effectiveness in the case of using the toilet increased from 6% to 11% as a result of improved airflow.
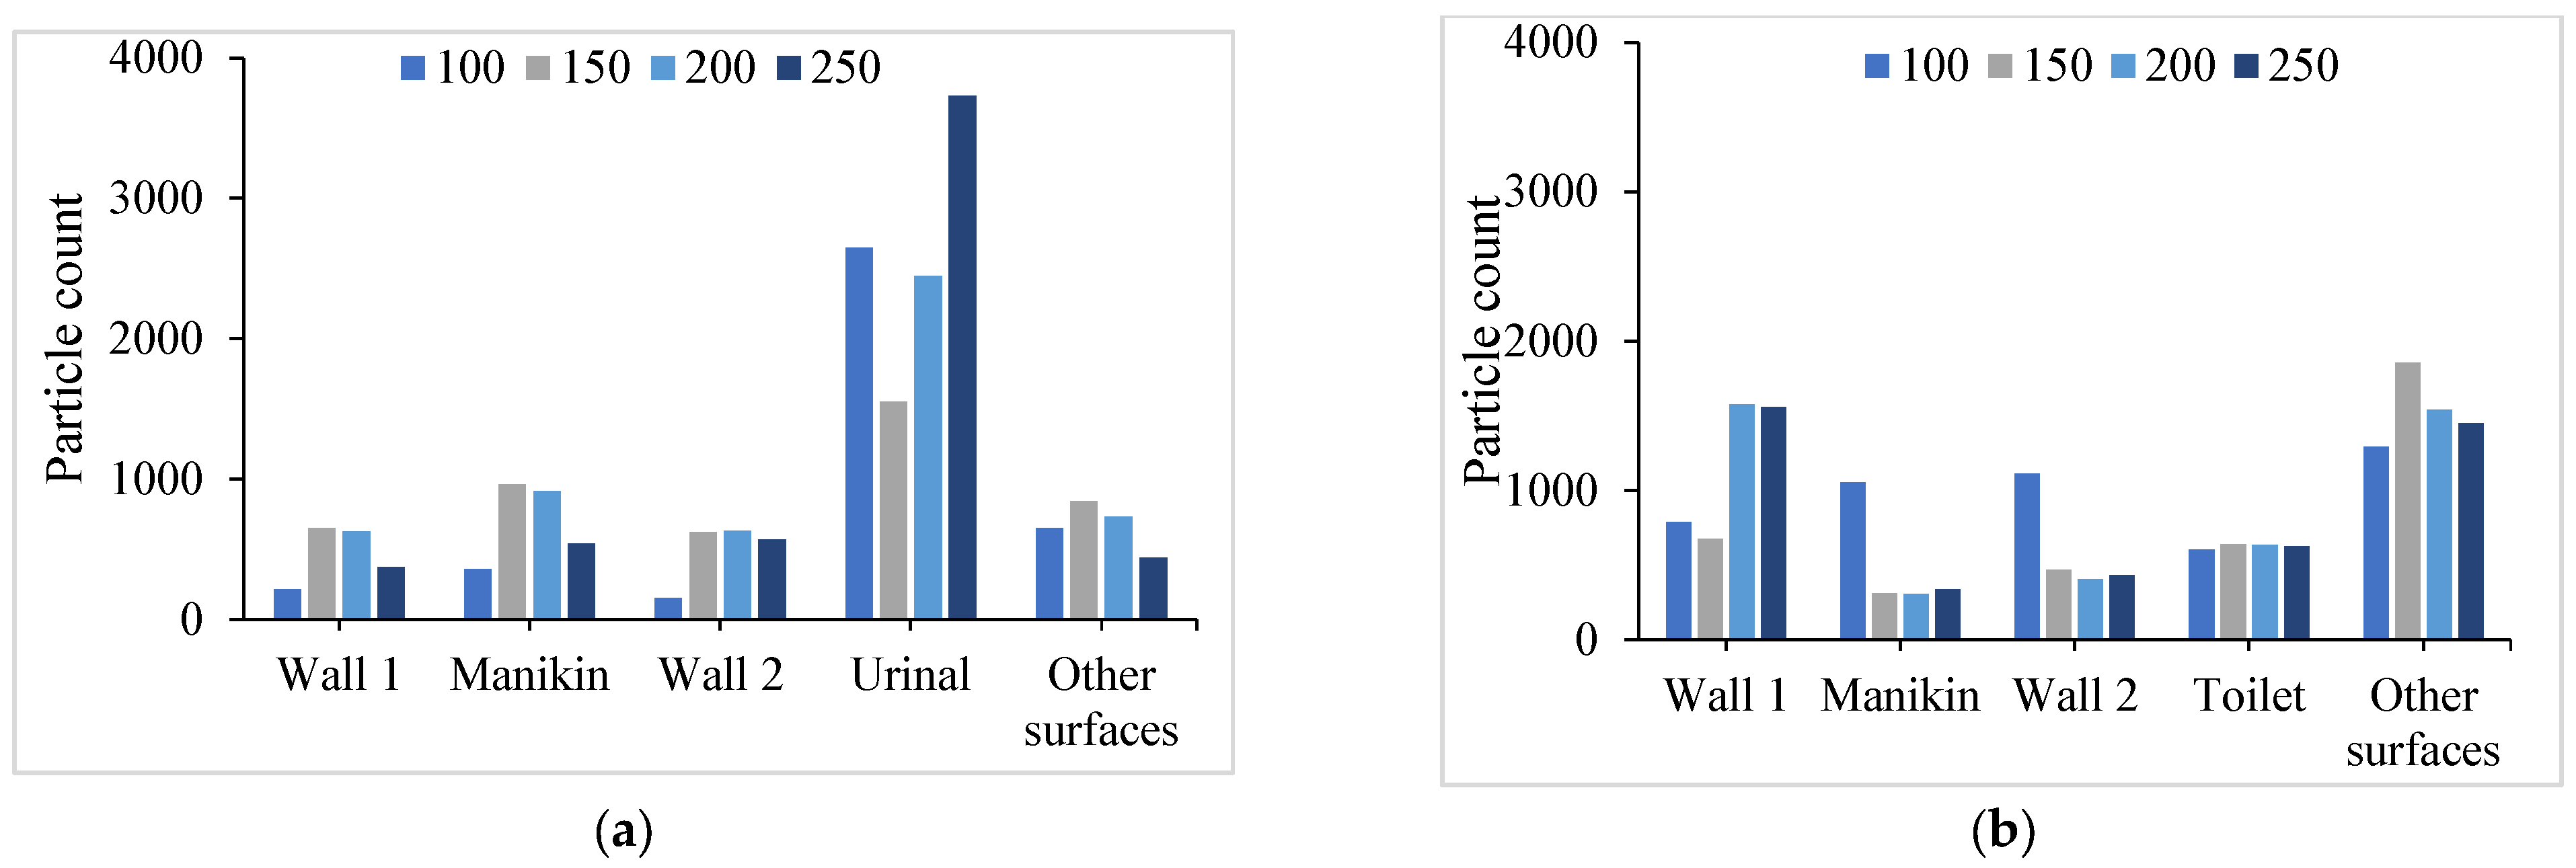
Figure 12 shows the number of deposited particles released from the urinal and toilet at different air-exhaust volumes. In Figure 12a, increasing the exhaust air volume to 250 m3/h results in the maximum deposition of particles from the urinal, totaling 3500, exceeding the suspension of urinal particles. Nonetheless, the number of particles deposited on all other lavatory surfaces was fewer than 500. As shown in Figure 12b, the number of toilet particles deposited on wall 1 increased from 800 to 1600 as the air-exhaust volume rose. The number of deposited particles on the manikin surface was almost 70% less than the initial 1000, greatly reducing the number of contaminated particles on the manikin surface. The increased exhaust airflow had no effect on the number of deposited particles remaining in the toilet bowl. The analysis suggests improving the airflow in the original design to lower the risk of exposure to urinal and toilet particles.

3.3. Influence of Ventilation Layouts on Odor Gas Concentration and Particle Fate

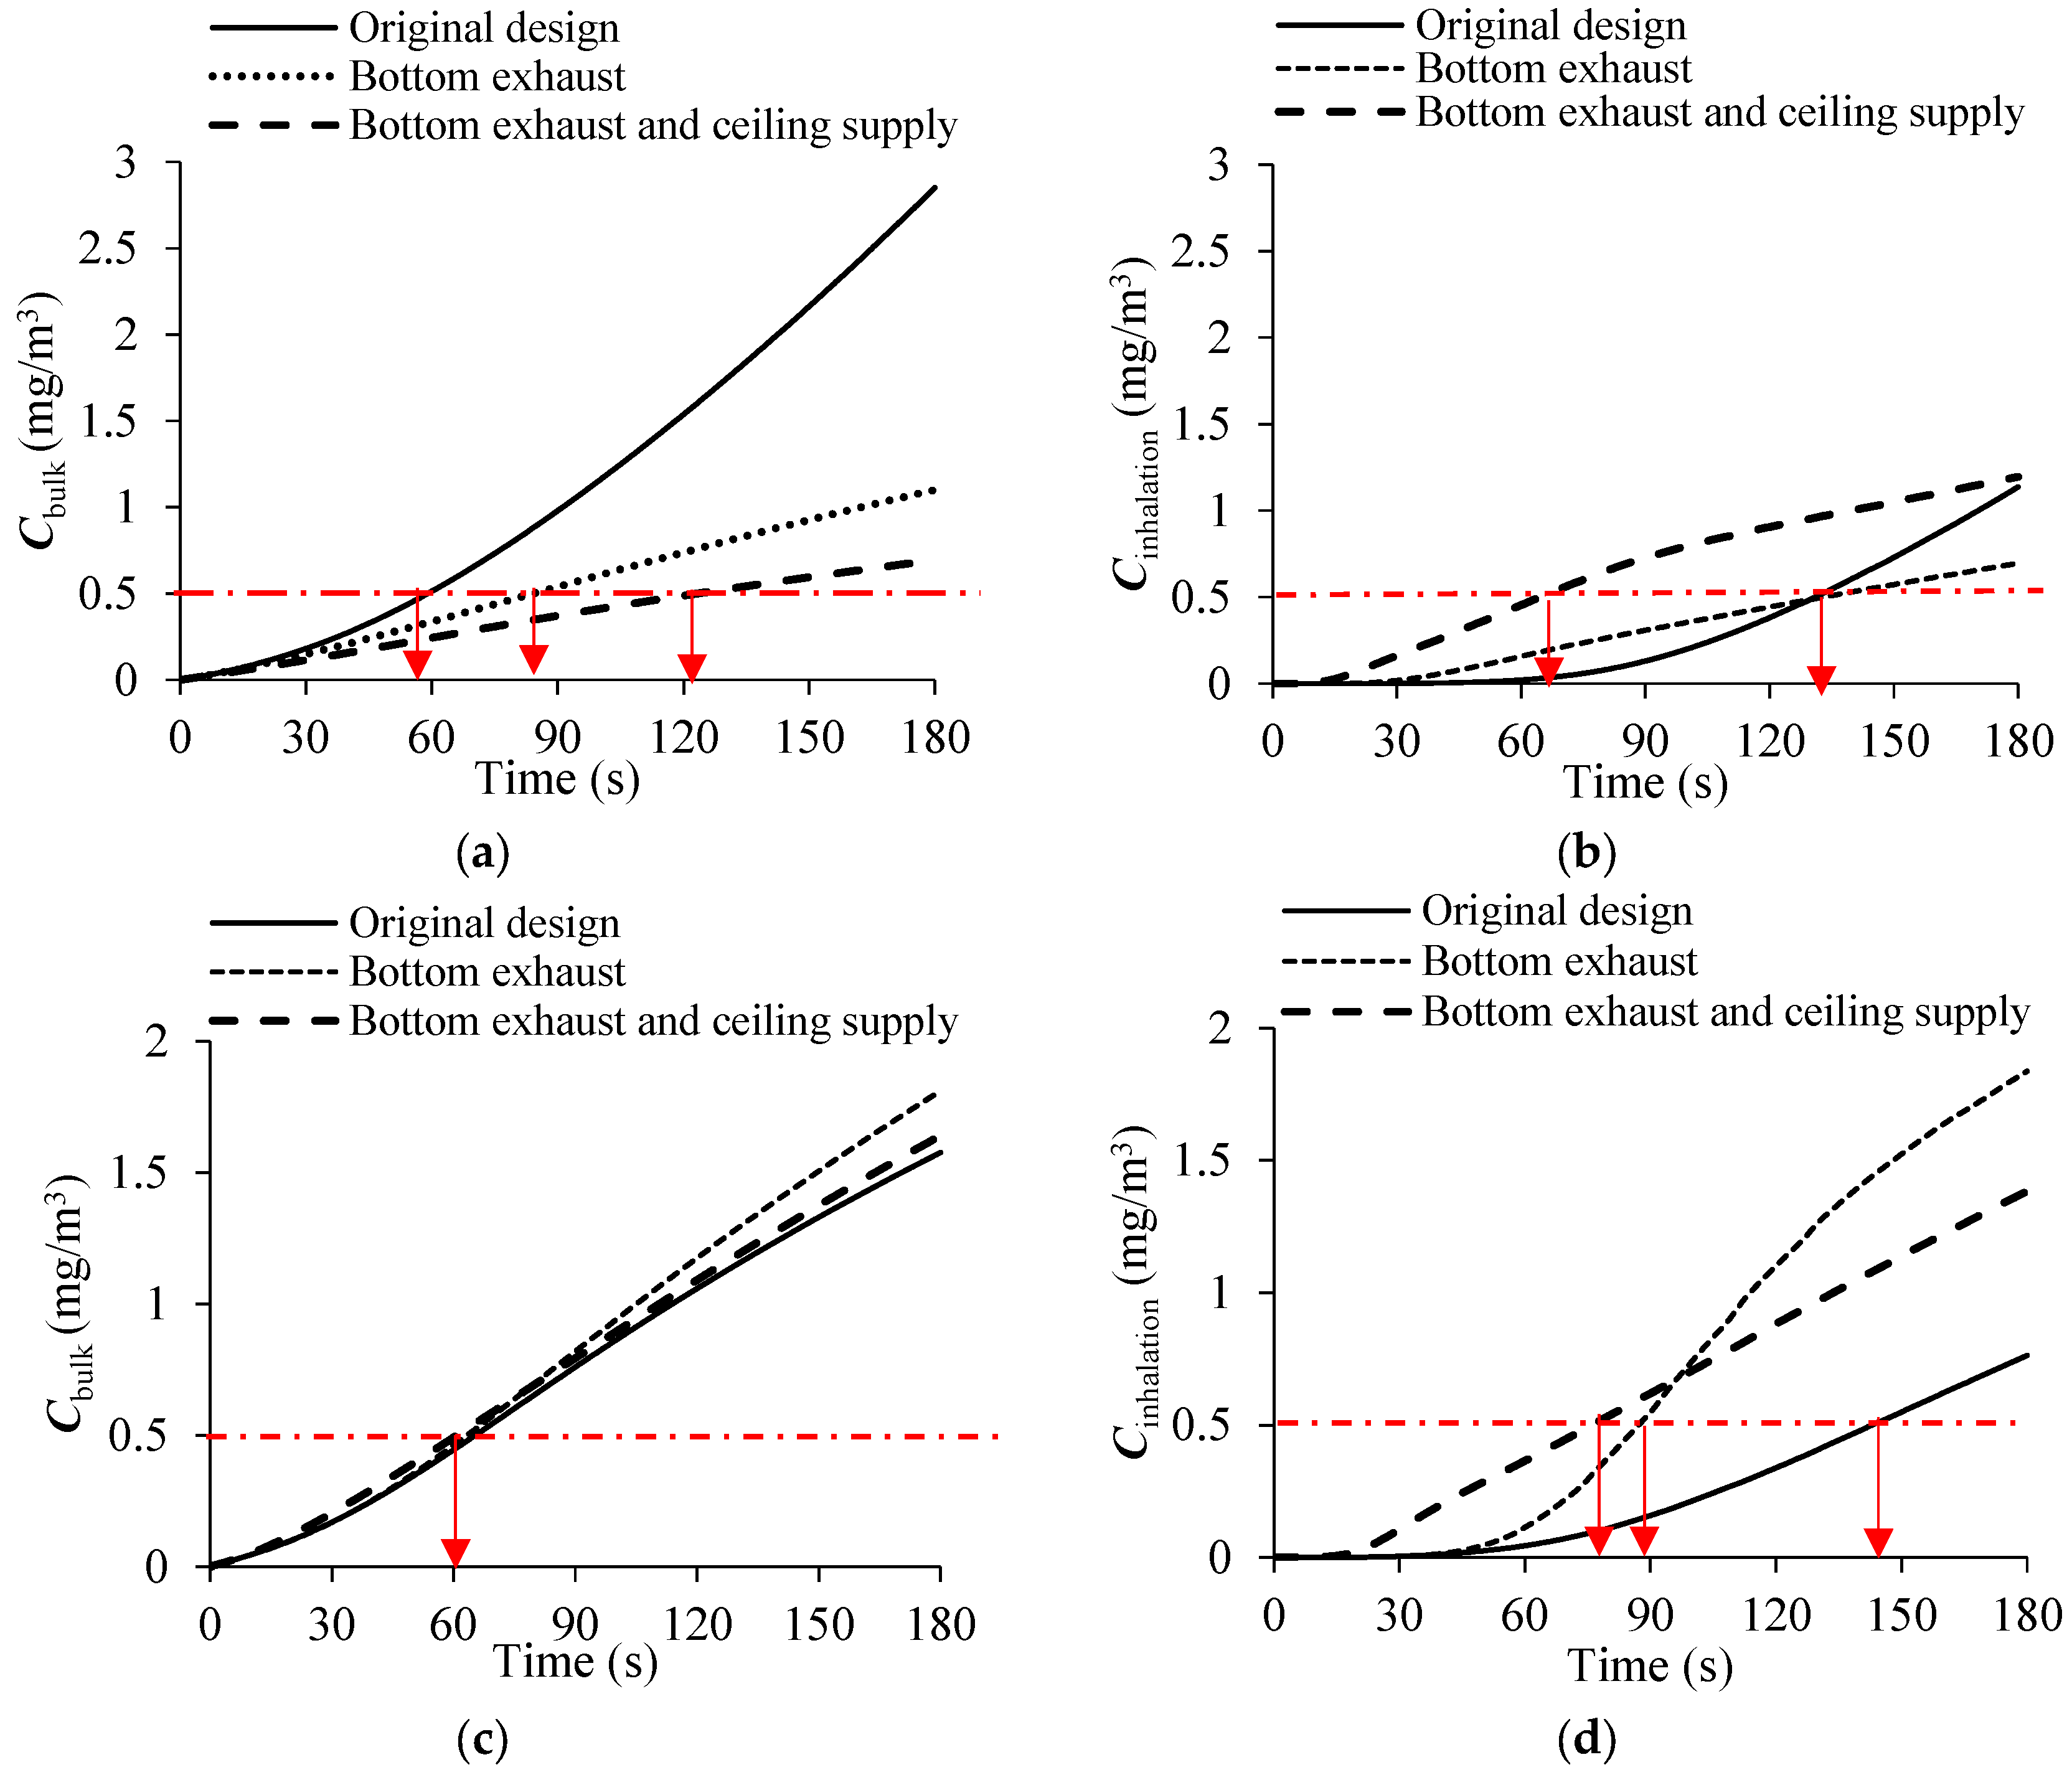
Figure 13 shows the bulk concentrations of lavatory and inhalation concentrations in cases 1, case 1a, and case 1b under varied ventilation designs. Figure 13a shows that bottom exhaust and ceiling supply ventilation designs effectively remove odor gas from the urinal, reducing bulk concentrations to less than 0.5 mg/m3 after 120 s. The exhaust at the bottom significantly surpasses the initial design performance, featuring a maximum bulk concentration of not more than 1 mg/m3, a marked decrease from the 3 mg/m3 recorded in the original design. According to the airflow visualization results for ceiling air supply and bottom air exhaust, the air circulation in the lavatory has produced a significant downward airflow, while the airflow circulation in the urinal has been significantly weakened. This explains that the ammonia volume concentration in the toilet in the urinal scenario has been maintained at a low level.
Figure 13b depicts a ventilation design with ceiling air supply and bottom air exhaust, and the inhalation concentration peaks at more than 0.5 mg/m3 within around 65 s. In contrast, the inhalation concentration in case 1 and the bottom air-exhaust design remained low for 130 s without the presence of odor. The difference between bulk concentration and inhalation concentration could be linked to the ventilation design of the bottom exhaust and ceiling supply, which improves air circulation in the lavatory while also allowing odorous gases released from the urinal and toilet to rise quickly into the breathing zone. The airflow, odor transport, and particle distribution in the ventilation design with the ceiling air supply and bottom air exhaust are illustrated in Figure A2, Figure A3 and Figure A4.
In Figure 13c, altering the ventilation design failed to decrease the overall concentration of odor gas in the lavatory but led to a marginal increase. The geometric link between the toilet and the air inlet vent plays a crucial role. The manikin in front of the toilet creates a steady airflow zone, reducing the impact of ventilation airflow on the odor gas produced by the toilet. The gas odor released by the urinal may enhance travel due to the ventilation layout, resulting in a larger inhalation concentration, as shown in Figure 13d.
Figure 14 shows the particle fate in both cases of using the urinal and toilet under different ventilation layouts. Figure 14a shows that the setup of the ceiling air supply and bottom air exhaust results in the maximum deposition of particles released from the urinal, at 61%, a 4% increase over the original design. The ratios of suspended particles within the lavatory air are low, measuring only 30%, especially with the lower air exhaust. The bottom exhaust layout improves exhaust efficiency greatly, although its effectiveness decreases as the position of the air inlet vent changes. The ventilation layout of the ceiling air supply and bottom air exhaust shown in Figure 14b allow for early deposition of particles released from the toilet, resulting in a final deposition proportion of around 46%. Although the ratio of suspended particles in the case design with a bottom air exhaust is low, the ratio of suspended particles in the air within 30–100 s exceeds 85%, potentially posing a significant inhalation risk. Furthermore, moving the exhaust outlet to the bottom of the lavatory can greatly improve exhaust efficiency, improving it from 5% to around 13.5% compared to the original design.
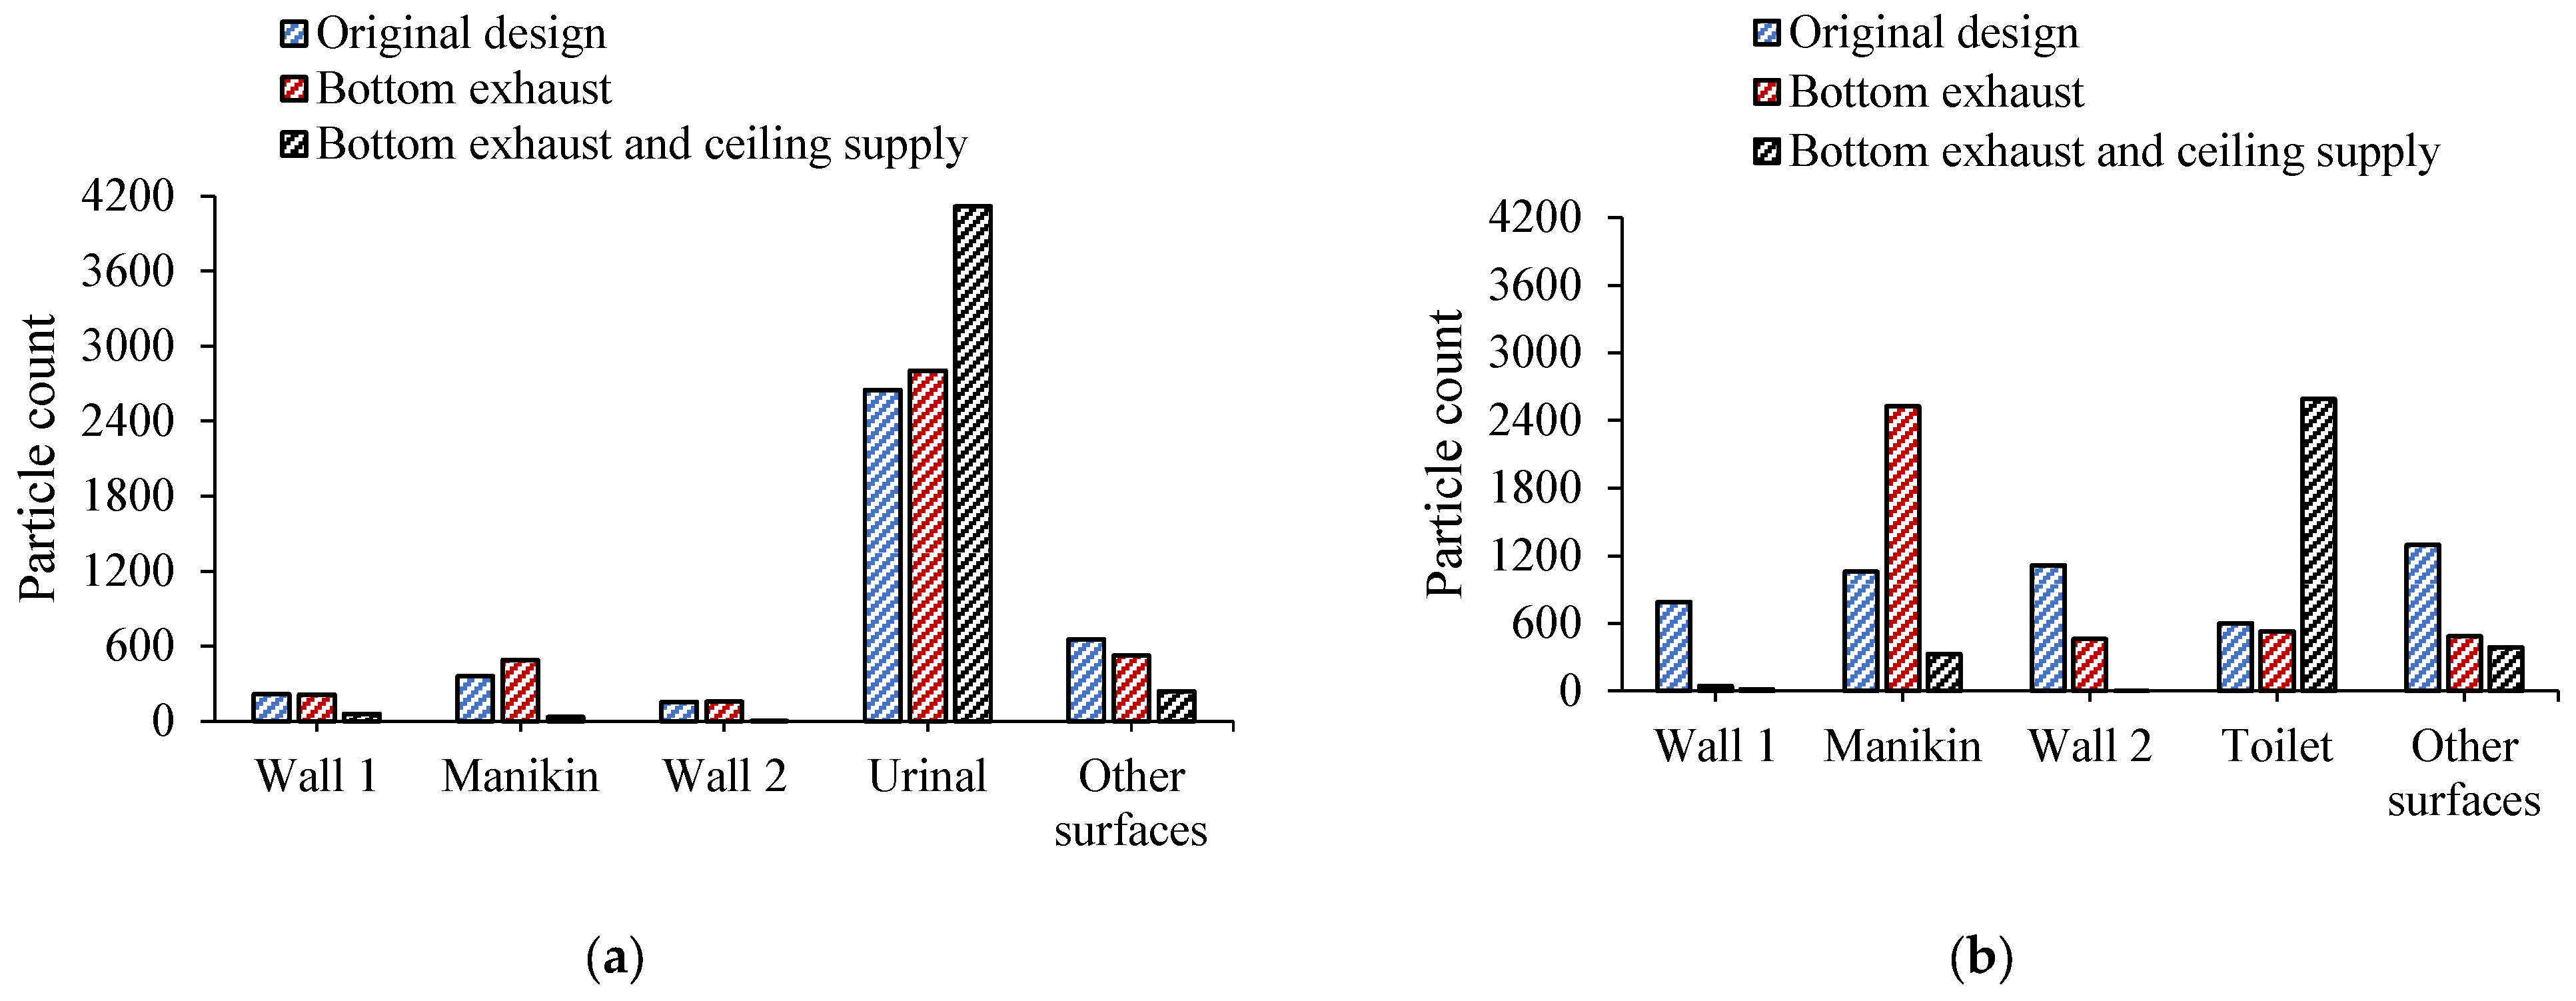
Figure 15 shows the number of deposited particles released from the urinal and toilet under various ventilation designs. Figure 15a shows that the ceiling air supply and bottom air exhaust caused a 56% increase in the number of deposited particles in the urinal, directly mitigating the risk of particle transport. In terms of the manikin surface and lavatory walls, the deposited particles connected with this ventilation design are the lowest in number. The adjustment of shifting the exhaust outlet to the bottom results in a slight enhancement over the original design. In Figure 15b, the design with the ceiling air supply and bottom air exhaust for particles released from the toilet greatly improved the deposition ratio, resulting in a fourfold increase in the quantity of particles deposited over the original design. The number of particles deposited on the manikin surface was drastically decreased, thus accounting for only one-third that of the original design. The ceiling air supply and bottom air exhaust, like urinals, reduce particles released from toilet deposits on all lavatory surfaces.

4. Discussion

The shipboard lavatory includes a urinal and toilet, as well as a water seal door and a pressure equalizing hole to facilitate air circulation, distinguishing it from standard airplane lavatories [33]. The compact space and inadequate ventilation cause differential air circulation patterns between the urinal and toilet facilities, resulting in different odor perceptions and particle exposure risks. Figure 7 and Figure 9 show that, with the original ventilation design, in the first 120 s, people using the lavatory do not experience a perceived odor. However, as time passes, the risk of odor complaints in the lavatory grows after urinal usage. In terms of aerosol particle transmission, most urinal particles are deposited on urinal surfaces, whereas particles released by toilets spread more widely. The existing underwater lavatory design can be modified to increase odor management and reduce particle exposure.
Enhancing the exhaust volume of the shipboard lavatory can markedly increase the efficiency of odor gas removal during urinal use. However, a larger exhaust volume also accelerates the time at which the inhalation concentration of odor gas reaches the threshold concentration by approximately 30 s in the case of using the urinal. Raising the exhaust air volume had no influence on the removal efficacy of the lavatory within 180 s following toilet use, but the odor perception among crew members was expedited by roughly 50 s. The principal cause of this problem is the large distance between the toilet and the ventilation vents in the original design. Increasing the exhaust air volume slightly increased the spread of odors in the case of using the toilet. In all cases, increasing the exhaust volume clearly reduces the risk of exposure to aerosol particles. As a result, the findings of this study show that it is advisable to increase exhaust air volume quickly after crew members use the urinal.
Optimizing the ventilation design, while more involved than just raising exhaust air volume, has the potential to drastically modify air circulation within the lavatory and improve air quality. Reducing the distance between the exhaust outlet and the pollution source improves pollutant discharge efficiency [31]. This paper examines two optimal designs for shipboard lavatory ventilation, inspired by aircraft lavatories. The first design involves relocating the exhaust to the bottom of the urinal while maintaining the original air supply. The second design incorporates ceiling air supply and bottom air exhaust, similar to that used in aircraft lavatories. The ventilation configuration with the ceiling air supply and bottom air exhaust not only enhanced odor control in the case of using the urinal but also reduced the risk of particle exposure in both cases of using the urinal and toilet. This ventilation configuration produces a relatively obvious downward airflow in the lavatory, which effectively inhibits the spread of odor and aerosol particles in the case of using the urinal.
This study has limitations because it does not investigate the disruption effect of the flushing plume on lavatory airflow, instead focusing primarily on the spread of odor gas and aerosol particles in the steady flow field following flushing. The vacuum toilet in aircraft lavatories is constrained by the volume of rinsing water, resulting in significant negative pressure airflow and disturbances in the transport of pollutants. Our investigations indicate that the flushing mechanisms of underwater lavatories on ships lack standardization, resembling those of building lavatories. Future research must enhance measurement techniques and examine the generated particle size distribution, as well as modeling specifics of aerosols released from ship toilets and urinals. This will serve as a dependable reference for the optimized design of shipboard lavatories.
The results of this investigation suggest that the positioning of the manikin in the same lavatory notably influences the transmission of odor gases and aerosols from both the urinal and toilet. The obstruction of ventilation airflow by the manikin may lead to a temporary alteration in the airflow pattern. Future research should perform a thorough examination of the factors contributing to this variation. The simulation time following flushing addressed in this article was 180 s, not excluding the possibility of individuals remaining in the lavatory for a shorter duration. In addition, personnel walking around and leaving the lavatory can also change the airflow distribution. Further exploration is needed on the transmission of particles and odor control in lavatories with different user postures and in the absence of a user in the lavatory.

5. Conclusions

This study employed computational fluid dynamics (CFD) to simulate airflow, the spread of odor gas, and particle transmission within an underwater lavatory. The effects of increasing air-exhaust volumes and adjusting ventilation designs have been assessed. The results indicate the following conclusions.
(1)
The shipboard lavatory is equipped with both a urinal and a toilet, and the ventilation airflow differs due to the position of the user. In contrast to the case of using the urinal, the ammonia concentration levels during the toilet usage were consistently lower. For 1 min after using the lavatory, people will not experience an odor smell.
(2)
The original design indicated that the case of using the urinal presented a significantly lower risk of human contact compared to using the toilet, with 65.7% of the deposited particles found on urinal surfaces, in contrast to only 8.9% on the manikin surfaces. Only 12.4% of the deposited particles were on the toilet surface, while 21.7% were found on the manikin surface, indicating a nearly uniform deposition of particles across all lavatory surfaces.
(3)
Increasing exhaust airflow in the urinal use-case accelerated the reduction of odor gas concentrations, but marginally enhanced odor perception in toilet use scenarios. In the case of toilet use, an airflow of 250 m3/h resulted in a reduction of approximately 70% in the ratio of particles deposited on the manikin surface, while increasing the deposited ratio in the urinal by 40%. Increasing the exhaust airflow after lavatory use is recommended to improve odor perception in the case of using the urinal and minimize the risk of particle exposure during both toilet and urinal use.
(4)
The layout of an aircraft-style design with a ceiling air supply and bottom exhaust effectively enhanced the removal of odorous gases while maintaining airflow during urinal use. This ventilation design concentrates most of the deposited particles on the surface of the urinal and toilet, while significantly reducing the risk of aerosol exposure for users. It is worth noting that this ventilation design does not seem to improve the odor control in the case of using the toilet, but rather slightly increases the odor sensation.

Author Contributions

Conceptualization, P.L., Y.C. and S.W.; methodology, P.L. and S.W.; formal analysis, P.L.; investigation, P.L., Y.C., S.W. and Y.M.; data curation, P.L. and Y.C.; writing—original draft preparation, P.L.; writing—review and editing, S.W.; supervision, S.W.; project administration, S.W. and P.L.; funding acquisition, P.L. All authors have read and agreed to the published version of the manuscript.

Funding

This research was financially supported by the Science and Technology Planning Project of Hainan Tibetan Autonomous Prefecture (2025-KZ02-A).

Data Availability Statement

The data presented in this study are available on request from the corresponding author. The data are not publicly available due to privacy.

Conflicts of Interest

The authors declare no conflicts of interest.

Appendix A

Table A1 shows three different grid meshes adopted for numerical solution. The total grid cell numbers, maximum grid cell sizes, and the minimum grid cell sizes were different. Figure A1 compares the solved airflow speed on the vertical line from Z = 0.5 m to Z = 1.50 m and above the toilet bowl. The airspeeds from the coarse grid meshes were lower than those from the medium and fine grid meshes. This implies that the coarse meshes were too coarse to achieve grid-independent results, while the medium grid meshes provided results similar to those of the fine grid meshes. It shows that the adopted medium grid meshes in this investigation had already reached the grid independence.
Table A1. Three different sets of grid meshes adopted for the grid-independence check.
GridCoarseMediumFine
Total grid cell number139,622257,472673,072
Minimum grid cell size0.03 m0.01 m0.006 m
Maximum grid cell size0.11 m0.08 m0.06 m
Growth rate1.151.131.1
Figure A1. The grid-independent analysis.
Processes 13 02706 g0a1
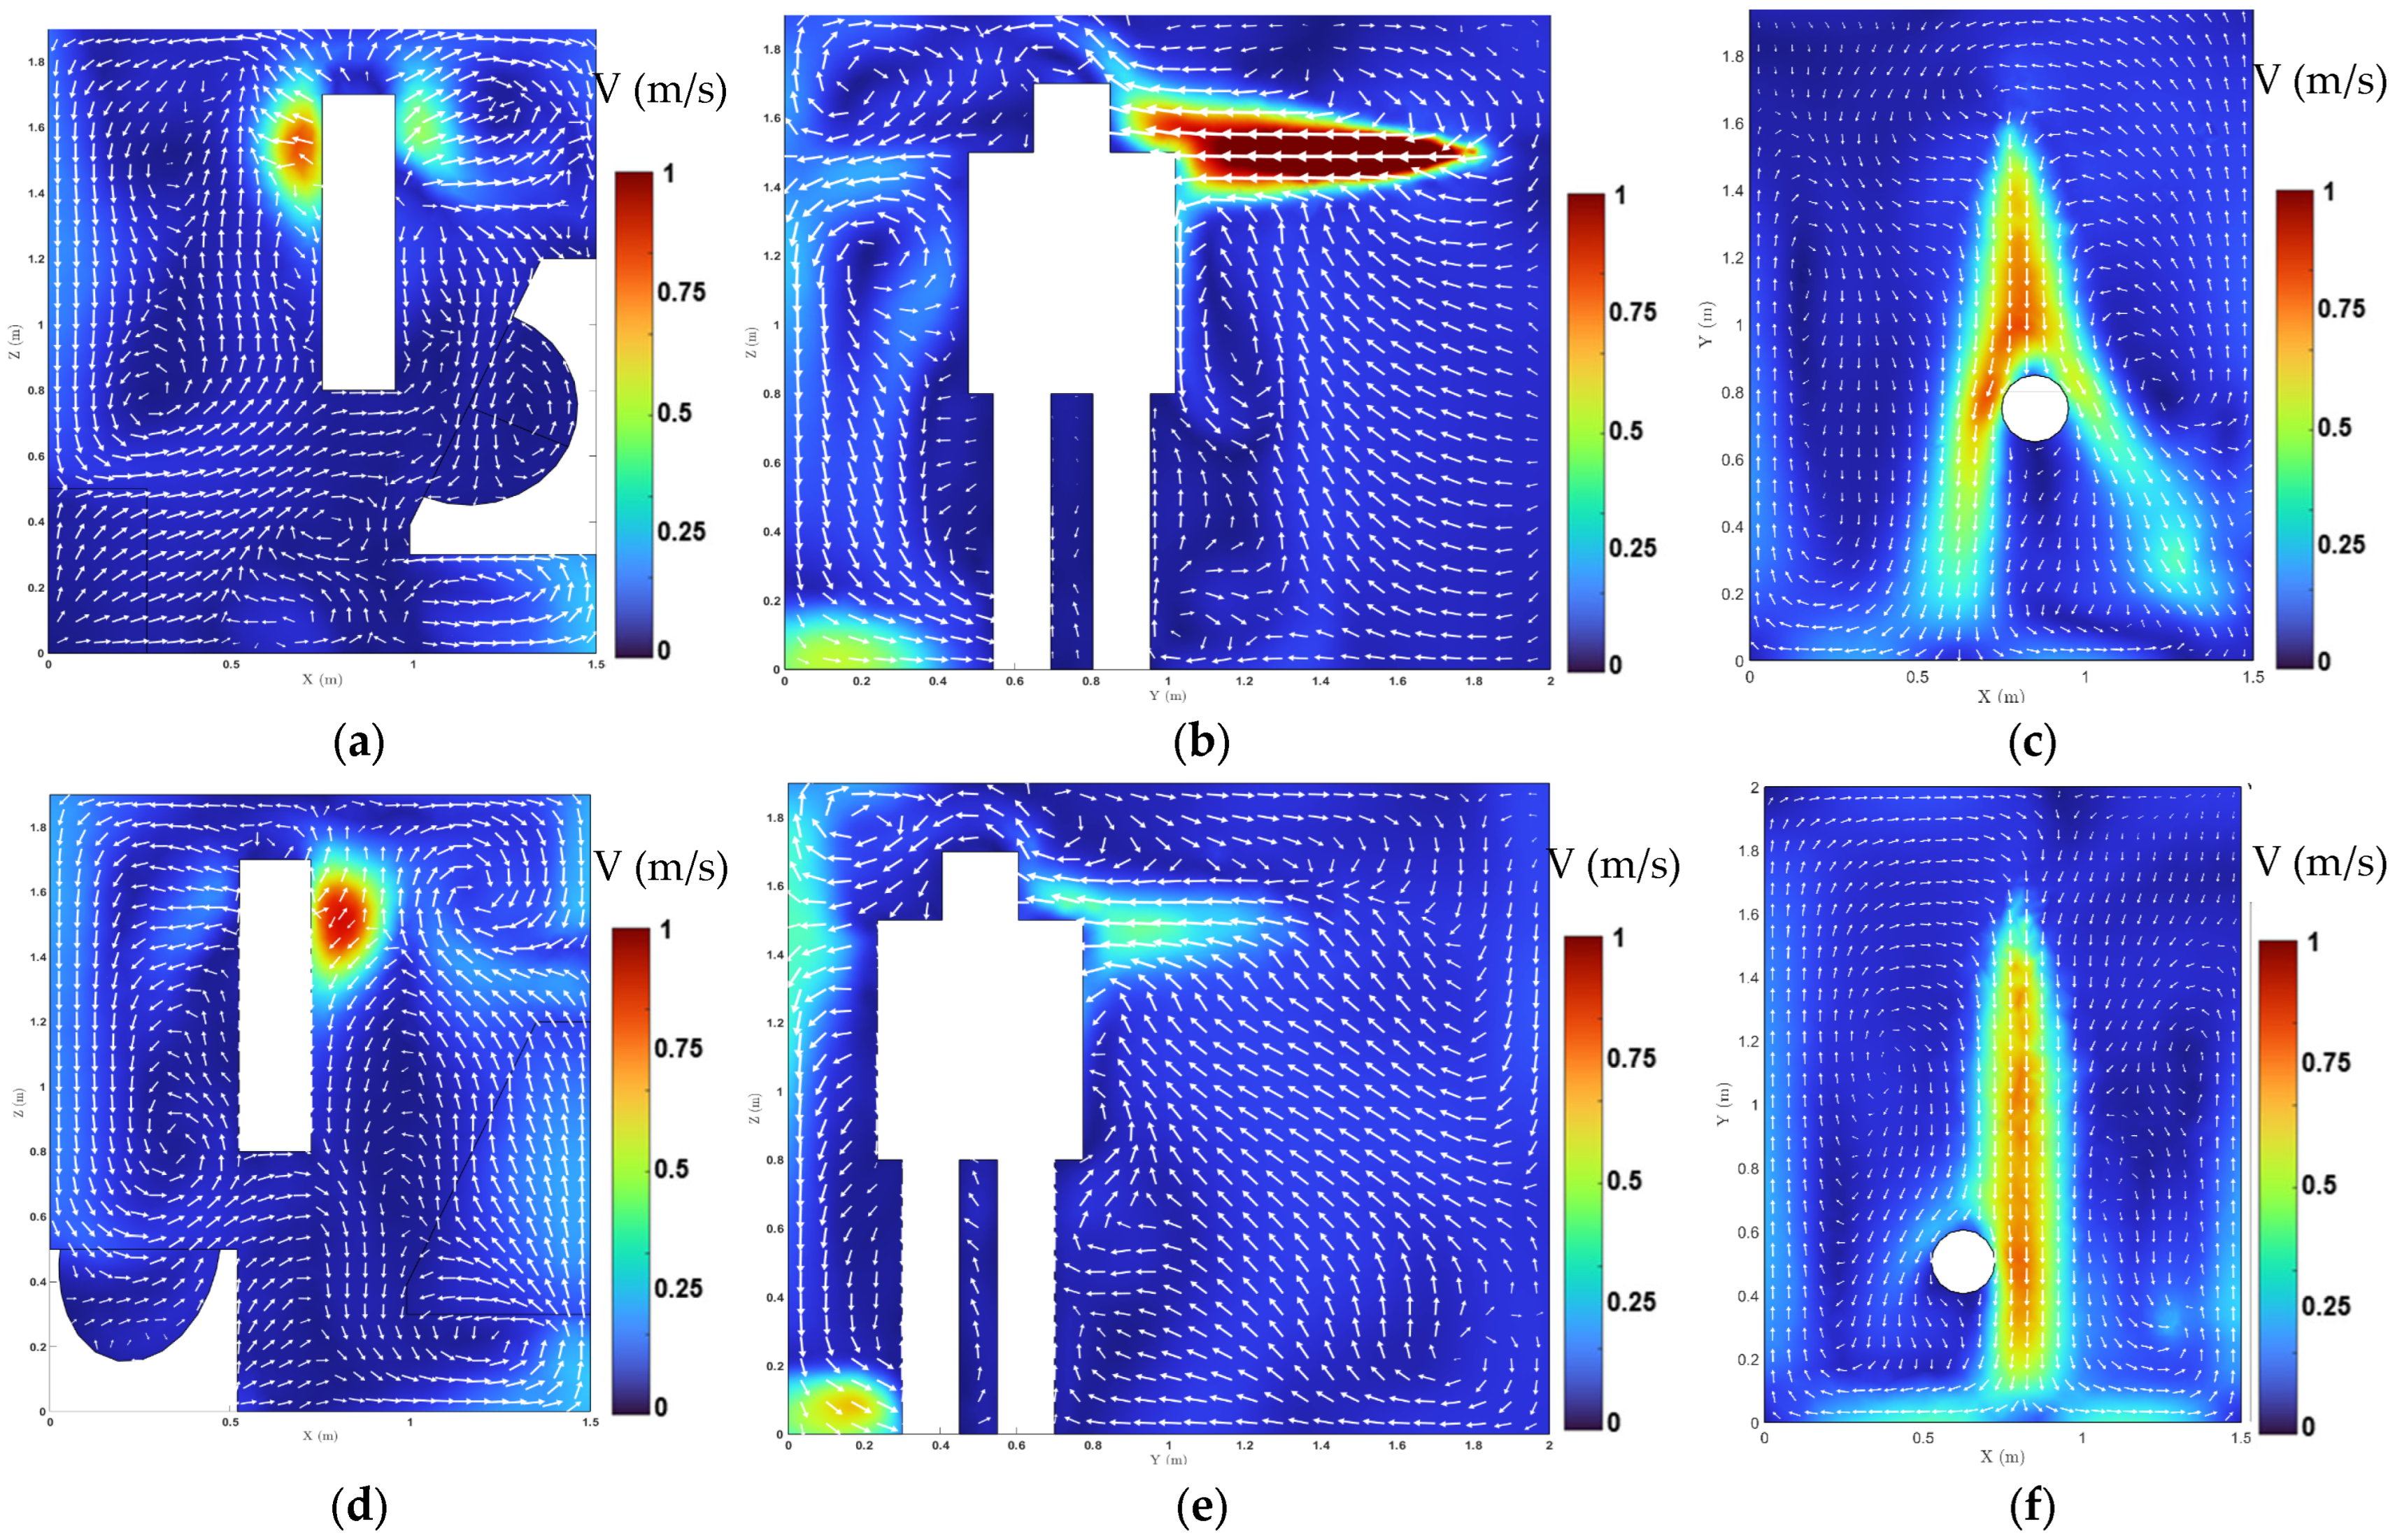
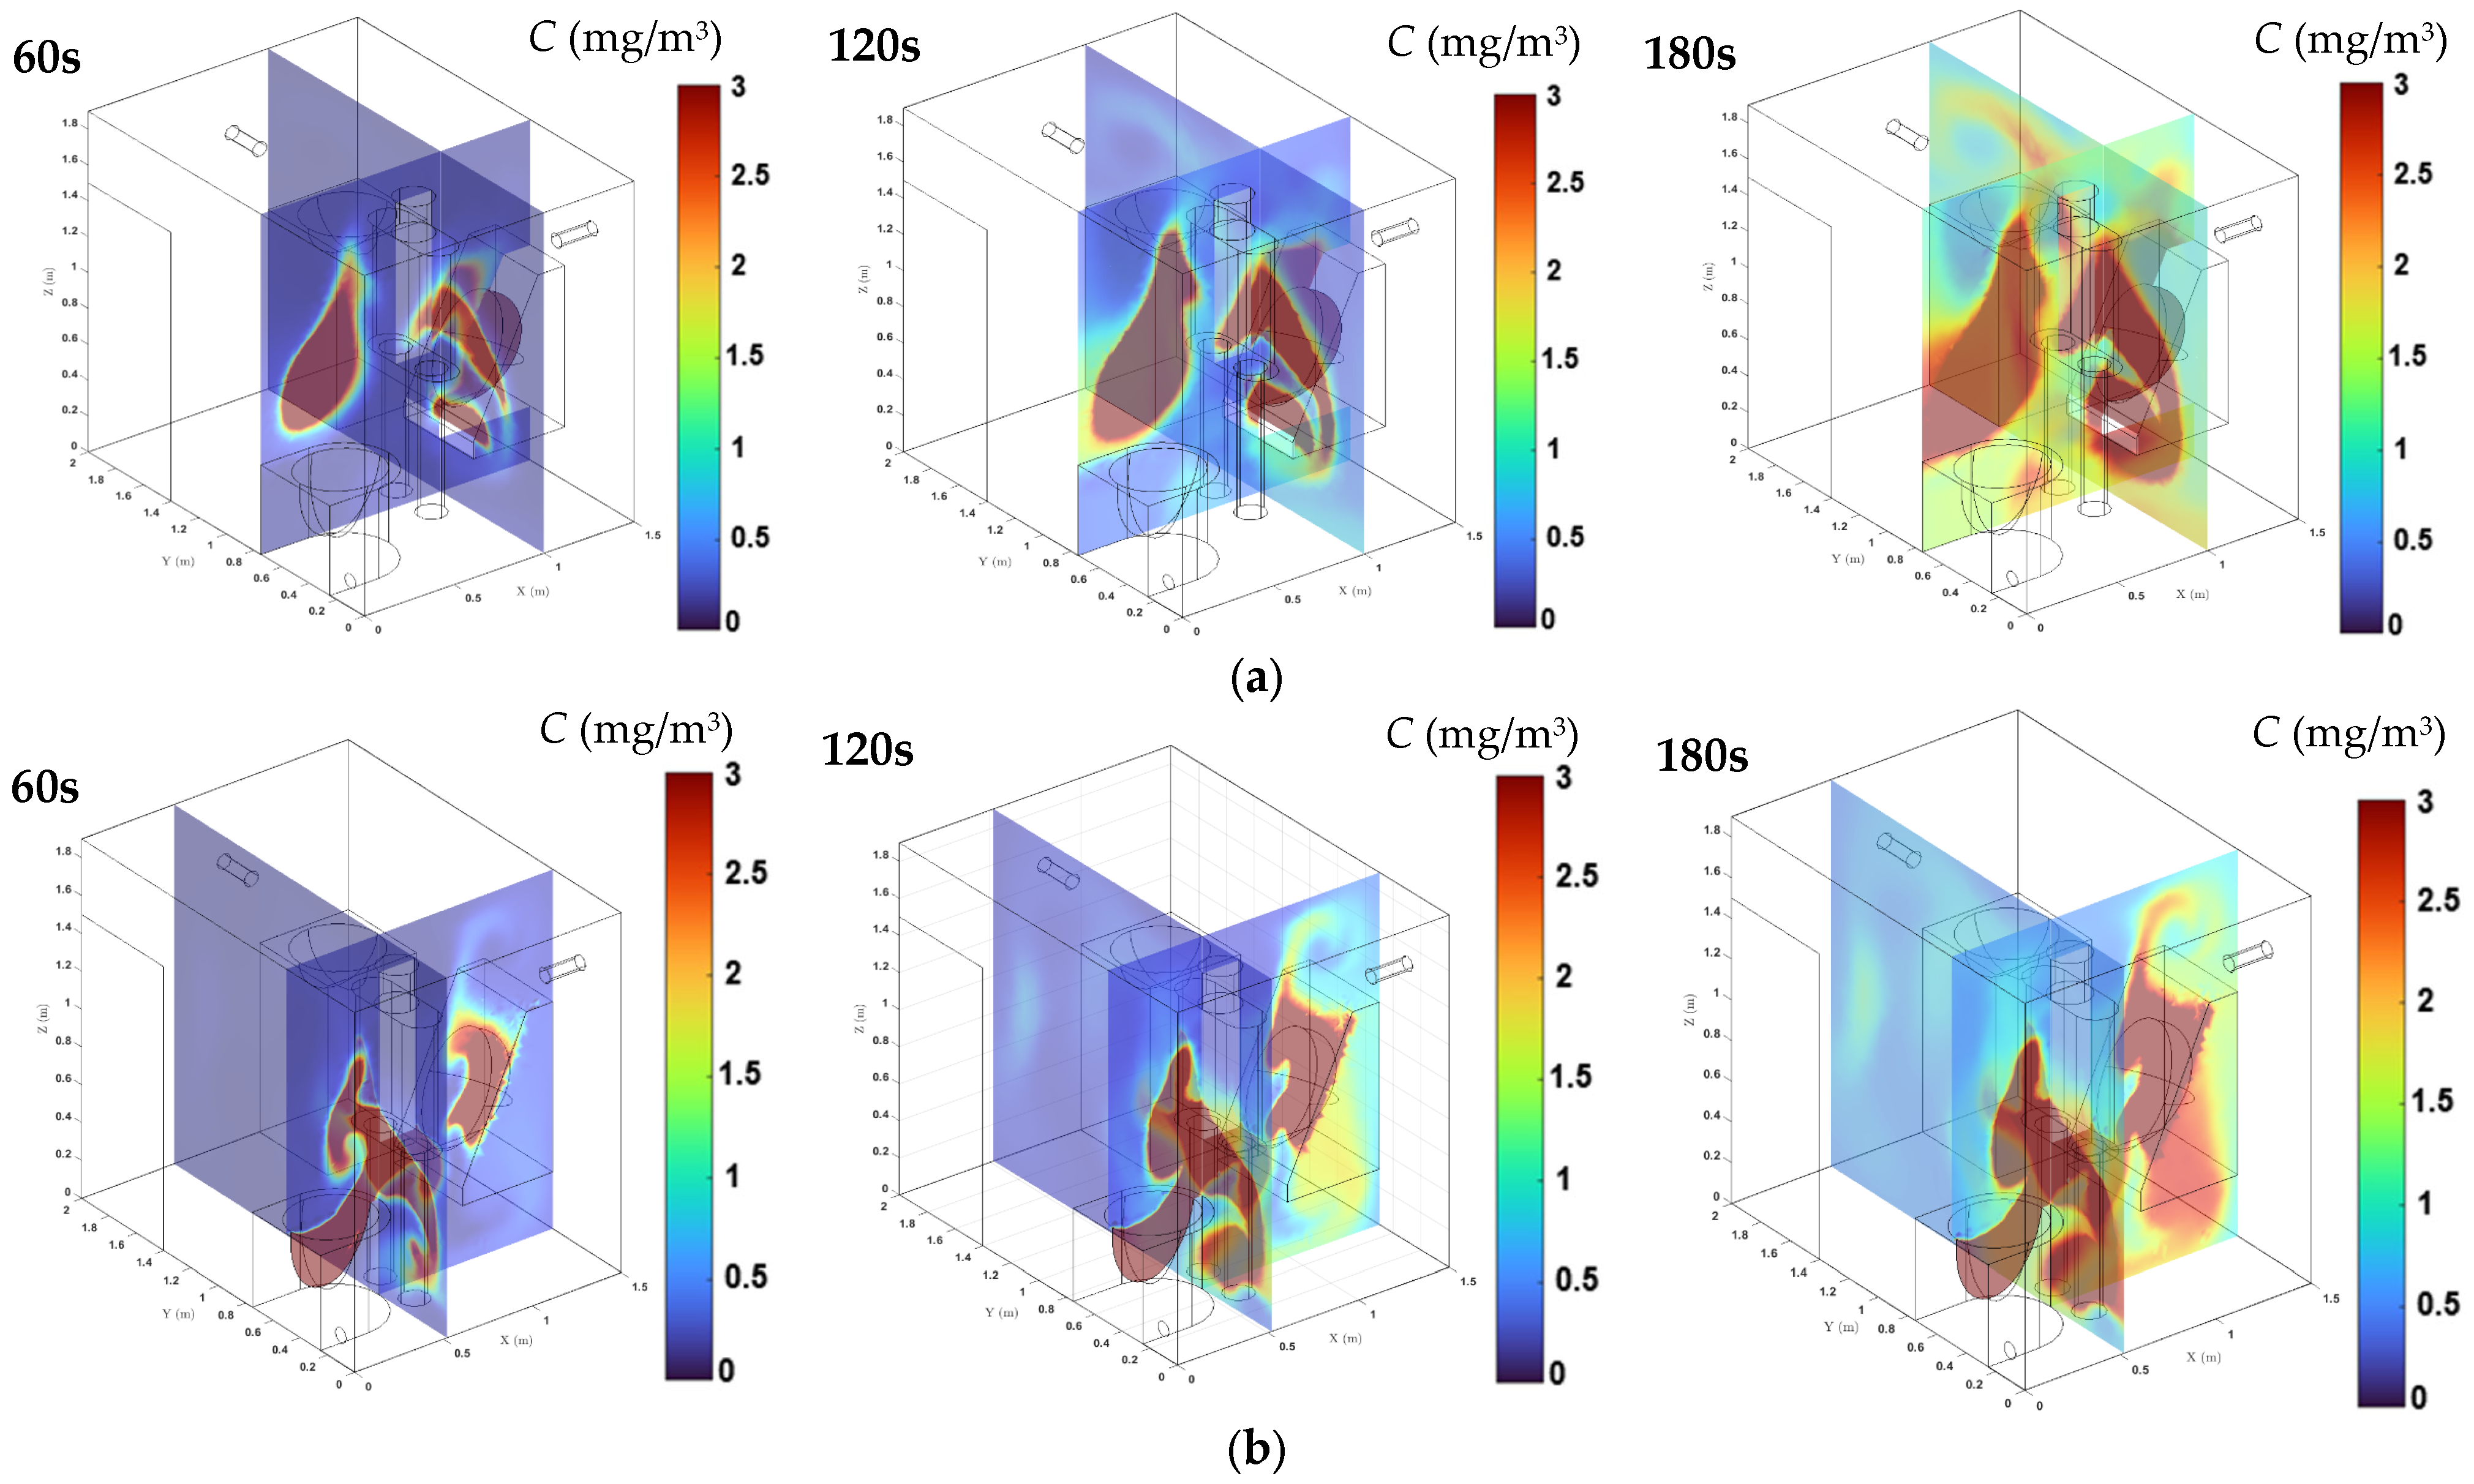
Figure A2, Figure A3 and Figure A4 shows the airflow, odor transportation, and particle distribution in the ventilation design with ceiling air supply and bottom air exhaust.
Figure A2. Velocity field of the lavatory for Case 1b with bottom air exhaust and ceiling air supply after flushing, with the white arrow indicating the direction of flow: (a) at the symmetrical plane of Y = 0.75 m in the case of using the urinal; (b) at the symmetrical plane of X = 0.70 m in the case of using the urinal; (c) at the symmetrical plane of Z = 1.60 m in the case of using the urinal; (d) at the symmetrical plane of Y = 0.50 m in the case of using the toilet; (e) at the symmetrical plane of X = 0.80 m in the case of using the toilet; (f) at the symmetrical plane of Z = 1.60 m in the case of using the toilet.
Processes 13 02706 g0a2
Figure A3. Simulated odor gas distributions in Case 1b with bottom air exhaust and ceiling air supply at 60 s, 120 s, and 180 s: (a) person standing in front of urinal, (b) person standing in front of urinal.
Processes 13 02706 g0a3aProcesses 13 02706 g0a3b
Figure A4. Simulated aerosol transport of 0.5 μm particles in dark blue, 1 μm particles in light blue, and 5 μm particles in red in Case 1b with bottom air exhaust and ceiling air supply at 60 s, 120 s, and 180 s: (a) person standing in front of urinal, (b) person standing in front of urinal.
Processes 13 02706 g0a4

References

  1. Byrnes, T.A.; Dunn, R.J. Boating-and shipping-related environmental impacts and example management measures: A review. Mar. Sci. Eng. 2020, 8, 908. [Google Scholar] [CrossRef]
  2. Widdowson, M.-A.; Glass, R.; Monroe, S.; Beard, R.S.; Bateman, J.W.; Lurie, P.; Johnson, C. Probable transmission of norovirus on an airplane. J. Am. Med. Assoc. 2005, 293, 1855–1860. [Google Scholar] [CrossRef]
  3. Shinohara, N.; Ogata, M.; Kim, H.; Kagi, N.; Tatsu, K.; Inui, F.; Naito, W. Evaluation of shields and ventilation as a countermeasure to protect bus drivers from infection. Environ. Res. 2023, 216, 114603. [Google Scholar] [CrossRef] [PubMed]
  4. Zhang, Z.; Han, T.; Yoo, K.H.; Capecelatro, J.; Boehman, A.L.; Maki, K. Disease transmission through expiratory aerosols on an urban bus. Phys. Fluids 2021, 33, 015116. [Google Scholar] [CrossRef]
  5. Yamahata, Y.; Shibata, A. Preparation for quarantine on the cruise ship Diamond Princess in Japan due to COVID-19. JMIR Public Health Surveill. 2020, 6, e18821. [Google Scholar] [CrossRef]
  6. Dong, X.; Chen, Z.; Luo, Y.; Wang, Z.; Lin, Y.; Su, J. Numerical investigation and dynamics of pollutant dispersion in underground restroom ventilation. Build. Eng. 2024, 88, 109132. [Google Scholar] [CrossRef]
  7. Li, P.; Zhang, T.T.; Zhang, Y. Measuring the flushing-generated flow and aerosols in lavatory of commercial aircraft. Build. Environ. 2022, 214, 108948. [Google Scholar] [CrossRef]
  8. Li, Z.; Guan, J.; Yang, X.; Lin, C.-H. Source apportionment of airborne particles in commercial aircraft cabin environment: Contributions from outside and inside of cabin. Atmos. Environ. 2014, 89, 119–128. [Google Scholar] [CrossRef]
  9. Lin, Y.-P. Natural ventilation of toilet units in K–12 school restrooms using CFD. Energies 2021, 14, 4792. [Google Scholar] [CrossRef]
  10. Ding, B.; Liu, W.; Yang, M.; Liu, K.; Liu, T. Diffusion of aerosol pollution in residential bathroom under different air distribution. E3S Web Conf. 2022, 356, 05051. [Google Scholar] [CrossRef]
  11. Mihai, V.; Rusu, L. An overview of the ship ventilation systems and measures to avoid the spread of diseases. Inventions 2021, 6, 55. [Google Scholar] [CrossRef]
  12. MacNeil, A.; Ghosh, S. Gender Imbalance in the Maritime Industry: Impediments, Initiatives and Recommendations. Aust. J. Marit. Ocean Aff. 2017, 9, 42–55. [Google Scholar] [CrossRef]
  13. Xiang-yan, L.; Kai-bao, W.; Li-li, Y.; Bao-xin, W. Design and Study of the Environmental Protection and Energy Saving Toilet for the Long-Distance Train. In Proceedings of the International Conference on Mechatronic Science, Electric Engineering and Computer (MEC), Jilin, China, 19–22 August 2011; pp. 771–774. [Google Scholar] [CrossRef]
  14. Essa, A.; Yamanaka, T.; Kobayashi, T.; Choi, N. Effect of source location on contaminant dispersion pattern and occupants inhaled air quality in lecture room under displacement ventilation. Jpn. Archit. Rev. 2023, 6, e12313. [Google Scholar] [CrossRef]
  15. Zhang, Z.; Zeng, L.; Shi, H.; Liu, H.; Yin, W.; Shen, H.; Yang, L.; Gao, J.; Wang, L.; Zhang, Y. CFD study on the ventilation effectiveness in a public toilet under three ventilation methods. Energies 2021, 14, 8379. [Google Scholar] [CrossRef]
  16. Chen, Q.; Wang, H.; Dai, Y.; Hu, Y. Prompt location of indoor instantaneous air contaminant source through multi-zone model-based probability method by utilizing airflow data from coarse-grid CFD model. Indoor Built Environ. 2022, 31, 944–954. [Google Scholar] [CrossRef]
  17. Wan, J.; Wei, J.; Lin, Y.; Zhang, T. Numerical investigation of bioaerosol transport in a compact lavatory. Buildings 2021, 11, 526. [Google Scholar] [CrossRef]
  18. Wilson, G.M.; Jackson, V.B.; Boyken, L.D.; Schweizer, M.L.; Perencevich, E.N. Bioaerosols generated from toilet flushing in rooms of patients with Clostridioides difficile infection. Infect. Control Hosp. Epidemiol. 2020, 41, 517–521. [Google Scholar] [CrossRef]
  19. Zhang, Z.; Zeng, L.; Shi, H.; Liu, H.; Yin, W.; Gao, J.; Wang, L.; Zhang, Y.; Zhou, X. CFD studies on the spread of ammonia and hydrogen sulfide pollutants in a public toilet under personalized ventilation. Build. Eng. 2022, 46, 103728. [Google Scholar] [CrossRef]
  20. Zhang, Z.; Zeng, L.; Shi, H.; Yang, G.; Yu, Z.; Yin, W.; Gao, J.; Wang, L.; Zhang, Y.; Zhou, X. Dynamics and numerical simulation of contaminant diffusion for a non-flushing ecological toilet. Energies 2021, 14, 7570. [Google Scholar] [CrossRef]
  21. Tung, Y.-C.; Hu, S.-C.; Tsai, T.-Y. Influence of bathroom ventilation rates and toilet location on odor removal. Build. Environ. 2009, 44, 1810–1817. [Google Scholar] [CrossRef]
  22. Tung, Y.-C.; Shih, Y.-C.; Hu, S.-C.; Chang, Y.-L. Experimental performance investigation of ventilation schemes in a private bathroom. Build. Environ. 2010, 45, 243–251. [Google Scholar] [CrossRef]
  23. Johnson, D.L.; Mead, K.R.; Lynch, R.A.; Hirst, D.V. Lifting the lid on toilet plume aerosol: A literature review with suggestions for future research. Am. J. Infect. Control 2013, 41, 254–258. [Google Scholar] [CrossRef] [PubMed]
  24. Zhang, T.; Yao, L.; Gao, Z.; Wang, F. Particle exposure risk to a lavatory user after flushing a squat toilet. Sci. Rep. 2022, 12, 21088. [Google Scholar] [CrossRef] [PubMed]
  25. Yang, C.; Yang, X.; Xu, T.; Sun, L.; Gong, W. Optimization of bathroom ventilation design for an ISO Class 5 clean ward. Build. Simul. 2009, 2, 133–142. [Google Scholar] [CrossRef]
  26. Mui, K.W.; Wong, L.T.; Yu, H.; Cheung, C.; Li, N. Exhaust ventilation performance in residential washrooms for bioaerosol particle removal after water closet flushing. Build. Serv. Eng. Res. Technol. 2017, 38, 32–46. [Google Scholar] [CrossRef]
  27. Zhao, Z.; Zhu, L.; Huang, Q.; Wang, Y.; Sun, Y.; Bi, D. Optimization of toilet bowl ventilation technology for odor control and energy efficiency enhancement in public toilet. Sci. Rep. 2025, 15, 4941. [Google Scholar] [CrossRef]
  28. Tu, R.; Shang, Y.; Li, X.; He, F.; Tu, J. Optimizing cabin air inlet velocities and personal risk assessment: Introducing the Personal Contamination Ratio (PCR) method for enhanced aircraft cabin infection risk evaluation. PLoS ONE 2024, 19, e0309730. [Google Scholar] [CrossRef]
  29. Chung, S.-C.; Lin, Y.-P.; Yang, C.; Lai, C.-M. Natural ventilation effectiveness of awning windows in restrooms in K-12 public schools. Energies 2019, 12, 2414. [Google Scholar] [CrossRef]
  30. Yu, J.; Qian, C.; Zhao, J.; Tao, J.; Leng, K.; Xu, X. Indoor air quality improvement in public toilets at railway stations in China: A field and numerical study. Sustainability 2023, 15, 8720. [Google Scholar] [CrossRef]
  31. Li, P.; Liu, W.; Zhang, T.T. CFD modeling of dynamic airflow and particle transmission in an aircraft lavatory. Build. Simul. 2023, 16, 1375–1390. [Google Scholar] [CrossRef]
  32. Dominique, M.; Guitton, P. Validation of Displacement Ventilation Simplified Models. Proc. Build. Simul. 1997, 1, 233–239. [Google Scholar]
  33. Schreck, J.H.; Lashaki, M.J.; Hashemi, J.; Dhanak, M.; Verma, S. Aerosol generation in public restrooms. Phys. Fluids 2021, 33, 033320. [Google Scholar] [CrossRef] [PubMed]
Figure 1. Geometric modeling of underwater lavatory: (a) person standing in front of urinal; (b) person standing in front of toilet.
Processes 13 02706 g001
Figure 2. Design of ventilation layouts: (a) bottom exhaust; (b) bottom exhaust and ceiling supply.
Processes 13 02706 g002
Figure 3. Schematic of validation model in experiments [32].
Processes 13 02706 g003
Figure 4. Comparison of the simulated and measured results: (a) temperature, (b) velocity.
Processes 13 02706 g004
Figure 5. Velocity field of the lavatory for Case 1 after flushing, with the white arrow indicating the direction of flow: (a) at the symmetrical plane of Y = 0.75 m in the case of using the urinal; (b) at the symmetrical plane of X = 0.70 m in the case of using the urinal; (c) at the symmetrical plane of Z = 1.60 m in the case of using the urinal; (d) at the symmetrical plane of Y = 0.50 m in the case of using the toilet; (e) at the symmetrical plane of X = 0.80 m in the case of using the toilet; (f) at the symmetrical plane of Z = 1.60 m in the case of using the toilet.
Processes 13 02706 g005
Figure 6. Simulated odor gas distributions in Case 1 at 60 s, 120 s, and 180 s: (a) person standing in front of urinal, (b) person standing in front of toilet.
Processes 13 02706 g006
Figure 7. Odor gas concentration changes in Case 1, with the red arrow representing the time when the odor concentration exceeds the olfactory threshold: (a) bulk concentrations, (b) inhalation concentrations.
Processes 13 02706 g007
Figure 8. Simulated aerosol transport of 0.5 μm particles in dark blue,1 μm particles in light blue, and 5 μm particles in red in Case 1 at 60 s, 120 s, and 180 s: (a) person standing in front of urinal, (b) person standing in front of toilet.
Processes 13 02706 g008
Figure 9. Particle fate statistics in Case 1: (a) dynamic change rate of deposition, suspension, and exhaust; (b) deposition distributions.
Processes 13 02706 g009
Figure 10. Odor gas bulk concentrations and inhalation concentrations in Cases 1–4 at exhaust volumes of 100, 150, 200 and 250 m3/h, with the red arrow representing the time when the odor concentration exceeds the olfactory threshold: (a,b) person standing in front of urinal, (c,d) person standing in front of toilet.
Processes 13 02706 g010aProcesses 13 02706 g010b
Figure 11. Particle fate statistics in Cases 1–4 at exhaust volumes of 100, 150, 200, and 250 m3/h: (a) person standing in front of urinal, (b) person standing in front of toilet.
Processes 13 02706 g011aProcesses 13 02706 g011b
Figure 12. Counts of deposited particle in Cases 1–4 at exhaust volumes of 100, 150, 200, and 250 m3/h: (a) person standing in front of urinal, (b) person standing in front of toilet.
Processes 13 02706 g012
Figure 13. Odor gas bulk concentrations and inhalation concentrations in case 1 and cases 1a–1b under different ventilation layouts, with the red arrow representing the time when the odor concentration exceeds the olfactory threshold: (a,b) person standing in front of urinal, (c,d) person standing in front of toilet.
Processes 13 02706 g013
Figure 14. Particle fate statistics in case 1 and cases 1a–1b for different ventilation layouts: (a) person standing in front of urinal, (b) person standing in front of toilet.
Processes 13 02706 g014
Figure 15. Counts of deposited particles in case 1 and cases 1a–1b under different ventilation layouts: (a) person standing in front of urinal, (b) person standing in front of toilet.
Processes 13 02706 g015
Table 1. Primary boundary parameters for CFD simulations.
ItemsBoundary Settings
Air inletFlow rate inlet, 50 m3/h, 22 °C
Exhaust air ventFlow rate outlet, 100 m3/h
Supply air ventPressure inlet, Atmospheric, 22 °C
Manikin surface31 °C
The rest of the wall surfaceAdiabatic
Flushing-generated aerosol
Releasing time: 31–35 s
0.5 μm, 3600
1 μm, 2400
5 μm, 1200
Continuous ammonia leakage from the walls of the commode5 × 10−6 m3/s [29,30]
Table 2. Case setting of air-exhaust volumes and ventilation layouts.
CaseAir-SupplyAir-ExhaustVentilation Layouts
150 m3/h100 m3/hAs in Figure 1
2150 m3/h
3200 m3/h
4250 m3/h
1a50 m3/h100 m3/hAs in Figure 2a
1bAs in Figure 2b
Disclaimer/Publisher’s Note: The statements, opinions and data contained in all publications are solely those of the individual author(s) and contributor(s) and not of MDPI and/or the editor(s). MDPI and/or the editor(s) disclaim responsibility for any injury to people or property resulting from any ideas, methods, instructions or products referred to in the content.