Article

Analysis of the Effectiveness Mechanism and Research on Key Influencing Factors of High-Pressure Water Injection in Low-Permeability Reservoirs

1
Luming Oil and Gas Exploration and Development Co., Ltd., Shengli Oilfield, Sinopec, Dongying 257064, China
2
Cooperative Innovation Center of Unconventional Oil and Gas, Yangtze University, Wuhan 430100, China
3
State Key Laboratory of Low Carbon Catalysis and Carbon Dioxide Utilization, Yangtze University, Wuhan 430100, China
*
Authors to whom correspondence should be addressed.
Processes 2025, 13(8), 2664; https://doi.org/10.3390/pr13082664
Submission received: 27 July 2025 / Revised: 14 August 2025 / Accepted: 19 August 2025 / Published: 21 August 2025
(This article belongs to the Special Issue Recent Advances in Hydrocarbon Production Processes from Geoenergy)

Abstract

Low-permeability oil reservoirs, due to their weak seepage capacity and high start-up pressure, have limited yield-increasing effects through conventional water injection development methods. High-pressure water injection can significantly change the seepage environment around the well and within the reservoir, expand the effective swept volume of injected water, and thereby greatly enhance the oil recovery rate of water flooding. However, there is still a relative lack of research on the mechanism of high-pressure water injection stimulation and its influencing factors. This paper systematically analyzes the effectiveness mechanism of high-pressure water injection technology in the exploitation of low-permeability reservoirs. The internal mechanism of high-pressure water injection for effective fluid drive and production increase is explained from the aspects of low-permeability reservoir seepage characteristics, capacity expansion and permeability enhancement by high-pressure water injection, and the dynamic induction of micro-fractures. Based on geological and engineering factors, the main factors affecting the efficiency enhancement of high-pressure water injection are studied, including formation deficit, reservoir heterogeneity, dominant channel development and fracturing stimulation measures, injection displacement and micro-fractures, etc. The results of numerical simulation showed the following: (1) formation depletion, reservoir heterogeneity, and the formation of dominant channels significantly affected the effect of water flooding development and (2) engineering factors such as the fracture direction of hydraulic fracturing, water injection rate, and the development of micro-fractures under high-pressure water injection directly determined the propagation path of reservoir pressure, the breakthrough speed of the water drive front, and the ultimate recovery factor. Therefore, during the actual development process, the construction design parameters of high-pressure water injection should be reasonably determined based on the geological reservoir conditions to maximize the oil production increase effect of high-pressure water injection. This study can successfully provide theoretical guidance and practical support for the development of low-permeability oil reservoirs.

1. Introduction

Statistics show that about 38% of global oil reserves are located in low-permeability reservoirs [1]. The development of low-permeability oil reservoirs has long faced problems such as poor injection capacity of water injection wells and difficulty in achieving results from oil wells, resulting in continuous low liquid and oil production, which seriously affects the development effect [2,3]. In response to this problem, major oil fields have developed and implemented technologies such as pressurized water injection and surfactant water injection, which have achieved certain results in reservoirs with relatively high permeability and weak heterogeneity [4,5]. However, for tight oil reservoirs with extremely low permeability, these traditional technologies are still difficult to meet the development requirements. In order to break through this technical bottleneck, Shengli Oilfield in China has innovatively carried out research on the pressurized water injection development technology above the fracture pressure in recent years. Subsequently, field tests of high-pressure water injection have been successively carried out in multiple blocks [6,7,8]. This technology combines hydraulic fracturing equipment with water injection development. Through high pressure (wellhead injection pressure is generally greater than 35 MPa) and high speed (daily water injection volume of a single well is generally greater than 1000 m3/d), it rapidly supplements reservoir energy and increases formation pressure in a short period of time, thereby significantly increasing the production pressure difference in oil wells, effectively enhancing the liquid and oil production [9,10]. The high-pressure water injection mechanism and influencing factors of this technology in low-permeability reservoirs have received extensive attention, and the related achievements provide important technical support for improving the water injection development effect of low-permeability reservoirs [11].
Regarding the mechanism of pressure-increasing water injection above the fracture pressure for low-permeability reservoirs, Wang et al. [12] divided the mechanism of this technology into increasing water injection volume, establishing effective displacement, and expanding sweep efficiency. Wang et al. [13], based on the analysis of oilfield production data, believed that waterflood-induced fracture dynamic propagation is the main factor causing changes in reservoir properties of low-permeability reservoirs, and in combination with the dynamic formation mechanism of fractures and its influence on water injection development, found that the existence of dynamic fractures exacerbates reservoir heterogeneity. Zhao et al. [14,15] took the Chang 6 oil layer group in the Ansai Oilfield of the Ordos Basin as an example to specifically analyze the characteristics, mechanism, identification methods, and key influencing factors of water injection dynamic fractures, providing reference data for the research on water injection-induced dynamic fractures. Wang et al. [16] applied various methods to study the dynamic opening mechanism of fractures during water injection development. They believed that the dynamic change in fractures is related to water injection pressure and the in situ stress in the direction of the connection line between injection and production wells. Meanwhile, they studied the opening pressure limit and extension mechanism of fractures and proposed a guidance scheme for the later well pattern infill adjustment. Liang et al. [17] established a characterization method for water injection-induced dynamic fracture formation and conducted corresponding reservoir numerical simulation research, simulating the dynamic changes in bottom hole pressure of injection wells in ultra-low-permeability reservoirs.
The factors influencing the effect of high-pressure water injection mainly include geological and engineering factors [18,19,20,21,22]. Comparison of the effective range zones of high-pressure water injection is shown in Figure 1. During the high-pressure water injection development process, the deformation mechanism of the enhanced permeability zone (the zone of preferential flow channels) is influenced by the coupling of multiple factors, mainly manifested as morphological expansion, dynamic evolution of permeability, and migration of water flow paths. During the pressurized fracture initiation stage, the fractures continue to expand. The front of the expanding fluid approaches the front of the fracture network. The injected water is mainly concentrated within the fractured and stimulated zone. The velocity of the pressure front > the velocity of the fluid front > the velocity of the fracture network front. Ma et al. [23] studied the well selection method of high-pressure water injection from aspects of geological reservoir and engineering integration. Cui et al. [24] established a pressure analysis model for injection wells that considers the influence of fractures induced by high-pressure water injection. They divided the fluid flow in high-pressure injection wells into five stages: the initial stage of fracture generation, the stage of fracture propagation, the stage of linear flow, the stage of transitional flow, and the stage of boundary control flow. Zhu et al. [25] studied the injection capacity of high-pressure water injection technology in combination with the background and reservoir physical properties and found that the production pressure difference is the key factor determining the injection capacity.
Based on the above literature, it can be seen that in-depth research has been conducted on the effect, influencing factors, and field application of high-pressure water injection technology at home and abroad. However, there has been no systematic study on the influence of laws of various factors on the effect of high-pressure water injection in low-permeability reservoirs from both the geological and engineering perspectives. Based on the above issues, this paper analyzes the mechanism of production enhancement by high-pressure water injection technology in low-permeability reservoirs. From multiple perspectives, such as reservoir seepage characteristics, the effect of high-pressure water injection on expanding capacity and enhancing permeability, and the induced generation of dynamic fractures, it deeply analyzed the internal mechanism of high-pressure water injection for achieving efficient displacement of reservoir fluid and production enhancement. Finally, from two aspects of geological factors (degree of formation energy deficit, reservoir heterogeneity, and strength of water flow dominant channel) and engineering factors (hydraulic fracturing, water injection rate, and existence of dynamic micro-fractures), the influence of these factors on the enhanced oil recovery effect of high-pressure water injection was systematically analyzed. The results of this study provide theoretical innovation and technical guidance for the efficient development of low-permeability reservoirs.

2. Effective Mechanism of High-Pressure Water Injection Development in Low-Permeability Reservoirs

Low-permeability reservoirs have weak seepage capacity and high start-up pressure, and the efficiency of conventional water injection development is limited. High-pressure water injection is an important technology to enhance the water flooding development effect of low-permeability reservoirs. It can effectively expand the swept volume of injected water, improve the formation permeability around the injection well, and then enhance the oil recovery efficiency. This section analyzes the mechanism of the enhanced production and efficiency of high-pressure water injection in low-permeability oil reservoirs from multiple perspectives, including fluid dynamics characteristics, the induction mechanism of microfracture propagation, and changes in formation permeability.

2.1. Seepage Characteristics of Low-Permeability Reservoirs

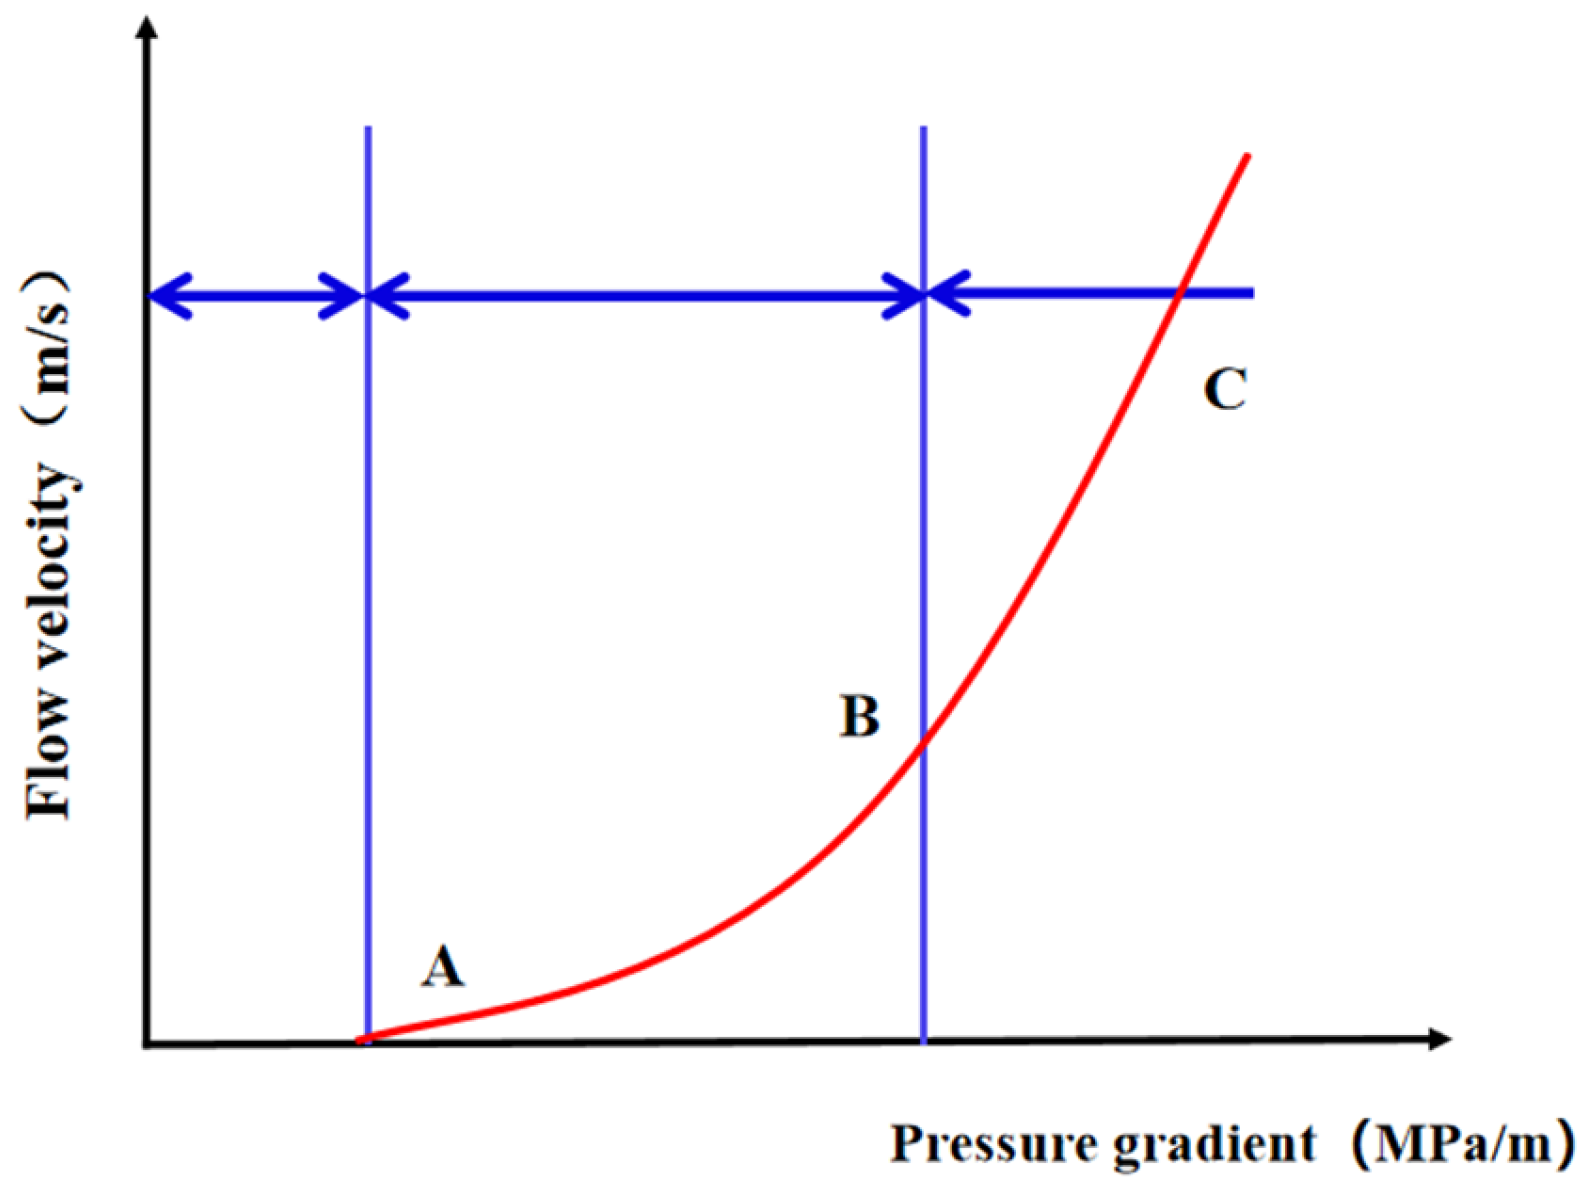
The seepage behavior in low-permeability oil reservoirs exhibits non-Darcy flow characteristics, and an apparent threshold pressure gradient is present. The corresponding seepage equation of is given by Equation (1). When fluid flows in low-permeability reservoirs, the seepage state is closely related to the displacement pressure gradient. Fluid seepage can only occur when the displacement pressure gradient is greater than a certain pressure gradient. The seepage curve can be divided into three stages, as shown in Figure 2. Non-flow section (OA): When the pressure gradient is lower than λ, the fluid does not flow. Nonlinear flow section (AB): The pressure gradient is slightly higher than λ, and the seepage velocity increases slowly. Quasi-linear flow section (BC)—the pressure gradient is much higher than λ, and the seepage approaches Darcy flow.
v = k μ p L λ
where k is formation permeability, 10−3 μm2; λ is the minimum starting pressure gradient, MPa/m; μ is the fluid viscosity, mPa·s; p L is the displacement pressure gradient, MPa/m.

2.2. The Mechanism of High-Pressure Water Injection Expansion and Permeability Enhancement in Low-Permeability Rock Strata

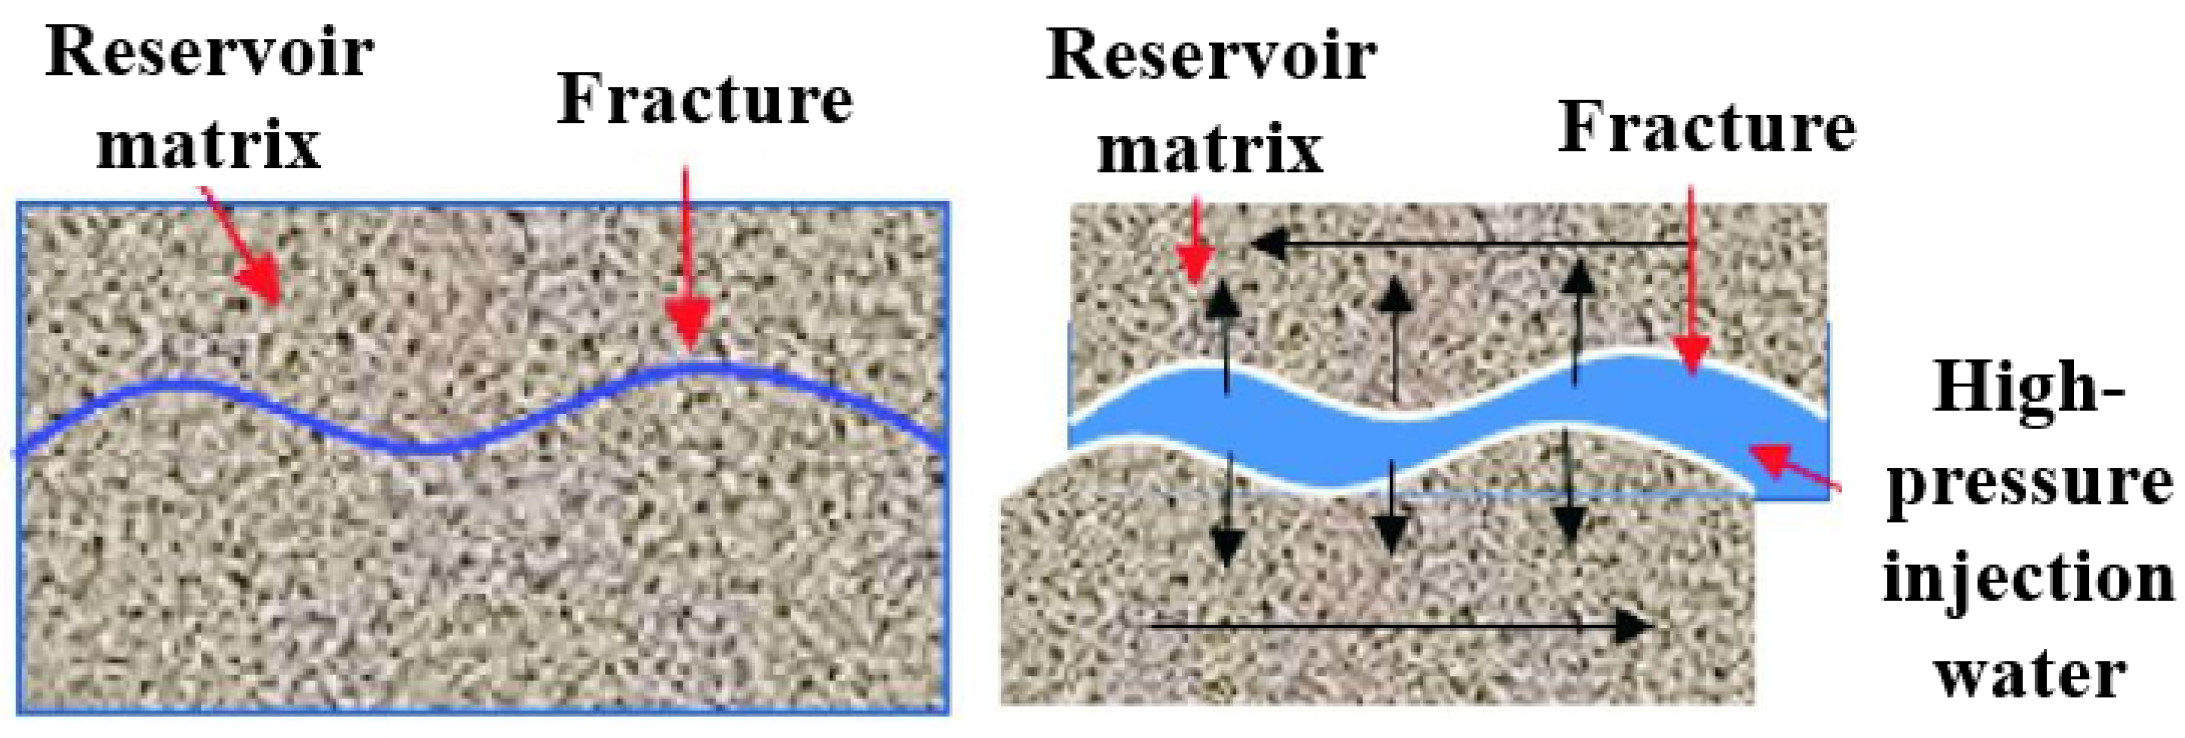
The mechanism of high-pressure water injection expansion and permeability enhancement in low-permeability rock strata mainly achieves effective fluid driving by changing the pressure field and flow characteristics inside the formation [26,27]. Fractures are usually blocked by materials such as gels, particles, and fibers. As shown in Figure 3, by injecting high-pressure fluid, the rock strata produce certain expansion under water injection pressure, thus changing the microscopic pore structure of the rock strata and enhancing its permeability. The high-pressure water injection expansion and permeability enhancement technology can not only improve the seepage characteristics of the reservoir but also effectively enhance the effect of water injection drive [28]. Specifically, as the injection pressure increases, the micro-fractures and pore network structure within the rock strata change, resulting in the improvement of the fluid flow path, thereby increasing the effective permeability of the fluid. The schematic diagram of high-pressure water injection fluid opening natural fractures is shown in Figure 4. The core of this mechanism lies in that by injecting with a certain external pressure, the natural barrier of the low-permeability reservoir can be overcome, allowing the fluid to enter the target area more smoothly and further enhancing oil and gas recovery.

2.3. Dynamic Fracture Induction Mechanism

During the injection process of high-pressure injection fluid, the internal microstructure of the rock strata will undergo certain changes. Especially under high-pressure conditions, the expansion of old fractures or the formation of new fractures will occur inside the formation. This type of fracture is called dynamic fractures [29]. The formation of these fractures will significantly increase the permeability of the reservoir and enable the injected fluid to better penetrate deep into the reservoir, thus effectively driving the flow of crude oil [30,31]. In addition, the effect of high-pressure water injection on rock strata may also lead to the change in the original pores within the rock strata, enhancing their adsorption and conduction capabilities for fluids. Therefore, a reasonable water injection strategy and efficient high-pressure water injection technology can achieve remarkable yield-increasing effects in actual development. When the bottom hole pressure reaches the formation fracture pressure, the reservoir fractures to generate a micro-fracture network, which continues to extend under the water injection condition. When water injection stops, under the action of the formation stress, the micro-fracture network will partially close. When the water injection occurs again, the fractures will reopen, thus forming water injection-induced dynamic fractures.
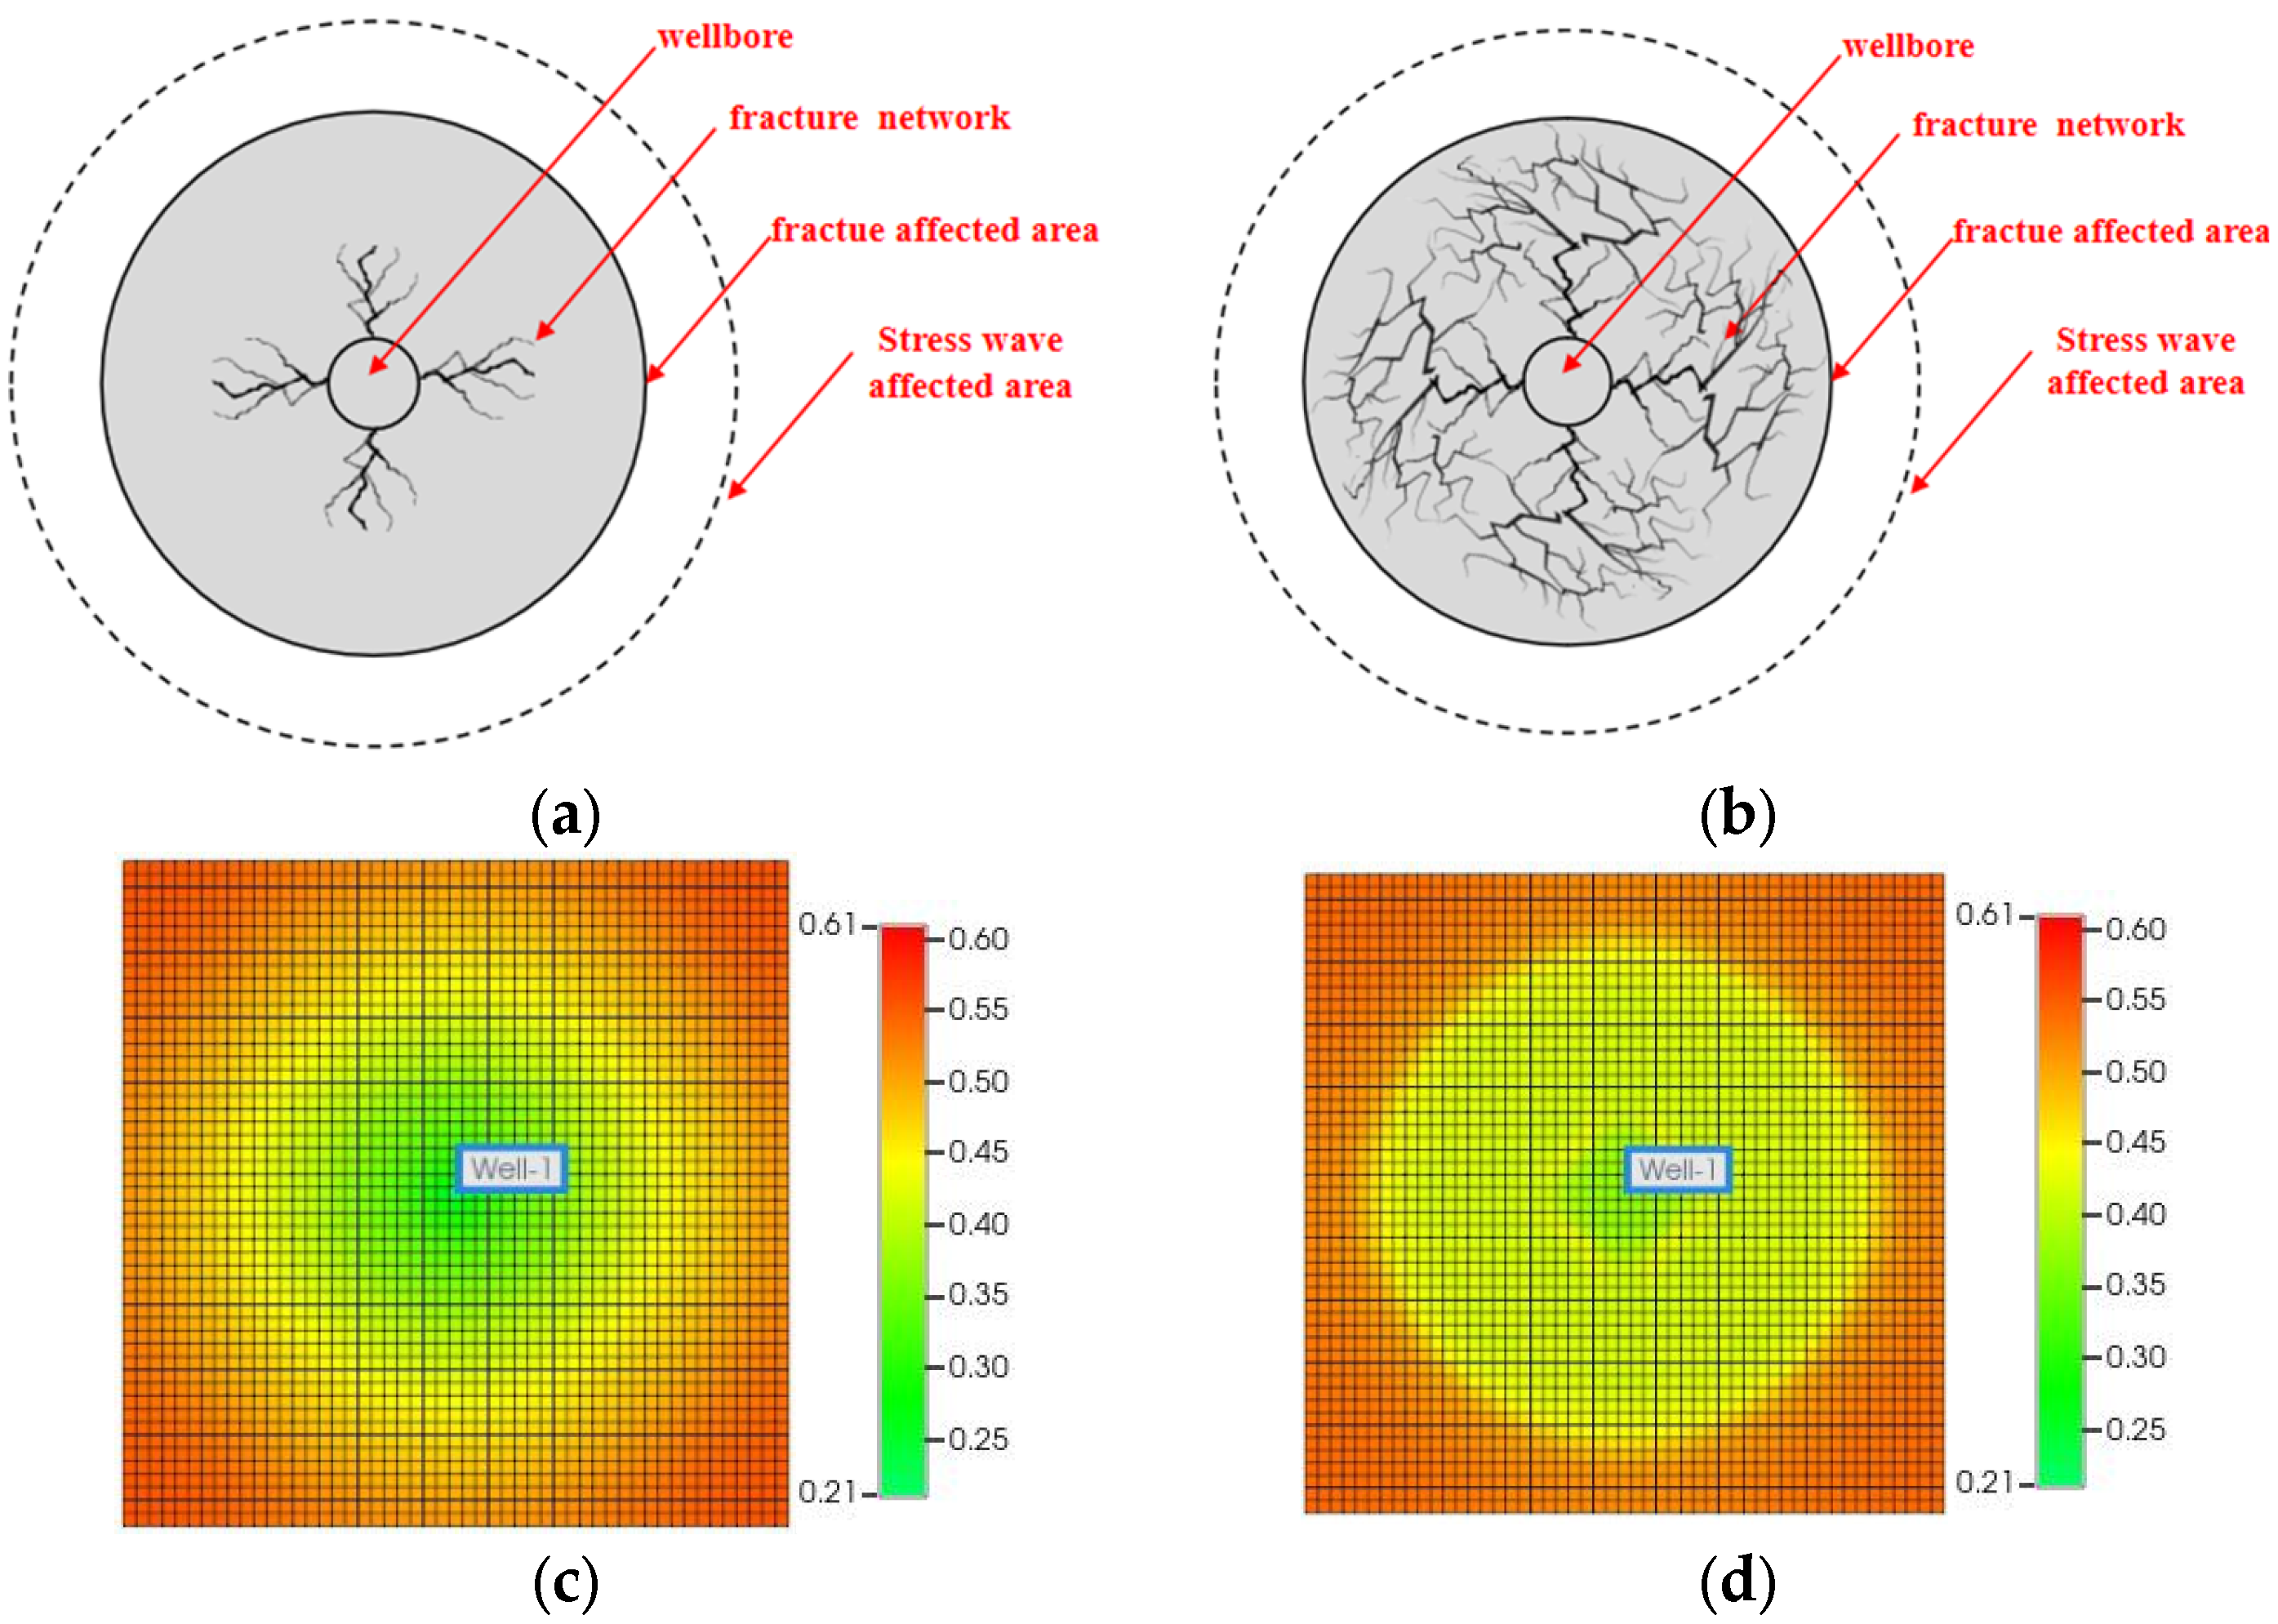
To distinguish the differences between conventional water injection and water injection for pressure drive, two models are adopted: one is a model based on the elastic expansion of conventional rocks, which is used to simulate the situation of conventional water injection; the other is an expansion–recompaction model to simulate the effect of water injection for pressure drive. When simulating high-pressure water injection, the injection well injects water at a rate of 300 m3/d for 6 months and then stops injection and is converted into a production well. As shown in Figure 5a,b, traditional hydraulic fracturing mainly promotes fracture extension and forms a single symmetrical long fracture. The characteristics of high-pressure water injection fracturing are short a fracture boundary relatively small fracture volume, which slows down fracture extension during the fracturing process. The key is to form a complex fracture network that diffuses outward with the injection well as the center. As shown in Figure 5c,d, the sweep coefficient of high-pressure water injection is high: a more balanced streamline distribution is generated during the high-pressure water injection process. Compared with the conventional injection mode (sweep coefficient 33%), the sweep coefficient after high-pressure water injection is 81%, an increase of approximately 48%.
In addition, high-pressure water injection has a higher oil displacement efficiency than conventional water injection, as shown in Figure 6. The colors of the bar chart represent the magnitude of permeability, with the unit being mD. High-pressure water injection effectively expands the pore space of the reservoir by promoting the plastic deformation of rocks improves the permeability of the area around the wellbore. Even after the formation pressure drops, this area still maintains a relatively high permeability. The comparison curve of daily oil production from the oil well and the remaining oil in the formation is shown in Figure 7. The daily oil production is high in the initial stage of high-pressure water injection, but the production decreases rapidly. The reason for the analysis is that high-pressure water injection, by forming an area of enhanced permeability around the well, rapidly restores formation energy in a short period of time, thereby driving crude oil to move towards the oil well. As development progresses, the formation energy reaches its peak. However, due to the high seepage resistance of the low-permeability reservoir, the crude oil cannot be effectively extracted, and the remaining oil content in the high-permeability zone gradually decreases, so the oil production of high-pressure injection water will also decrease accordingly.

3. Analysis of the Reasons for High-Pressure Water Injection in Research Block

3.1. Geological Factors

Geological factors are fundamental factors that affect the water flooding effect during reservoir development, including formation pressure depletion, reservoir heterogeneity, and the formation of dominant flow channels. These factors directly determine the swept volume of injected water, oil recovery, and effective characteristics of oil well.

3.1.1. Formation Pressure Depletion

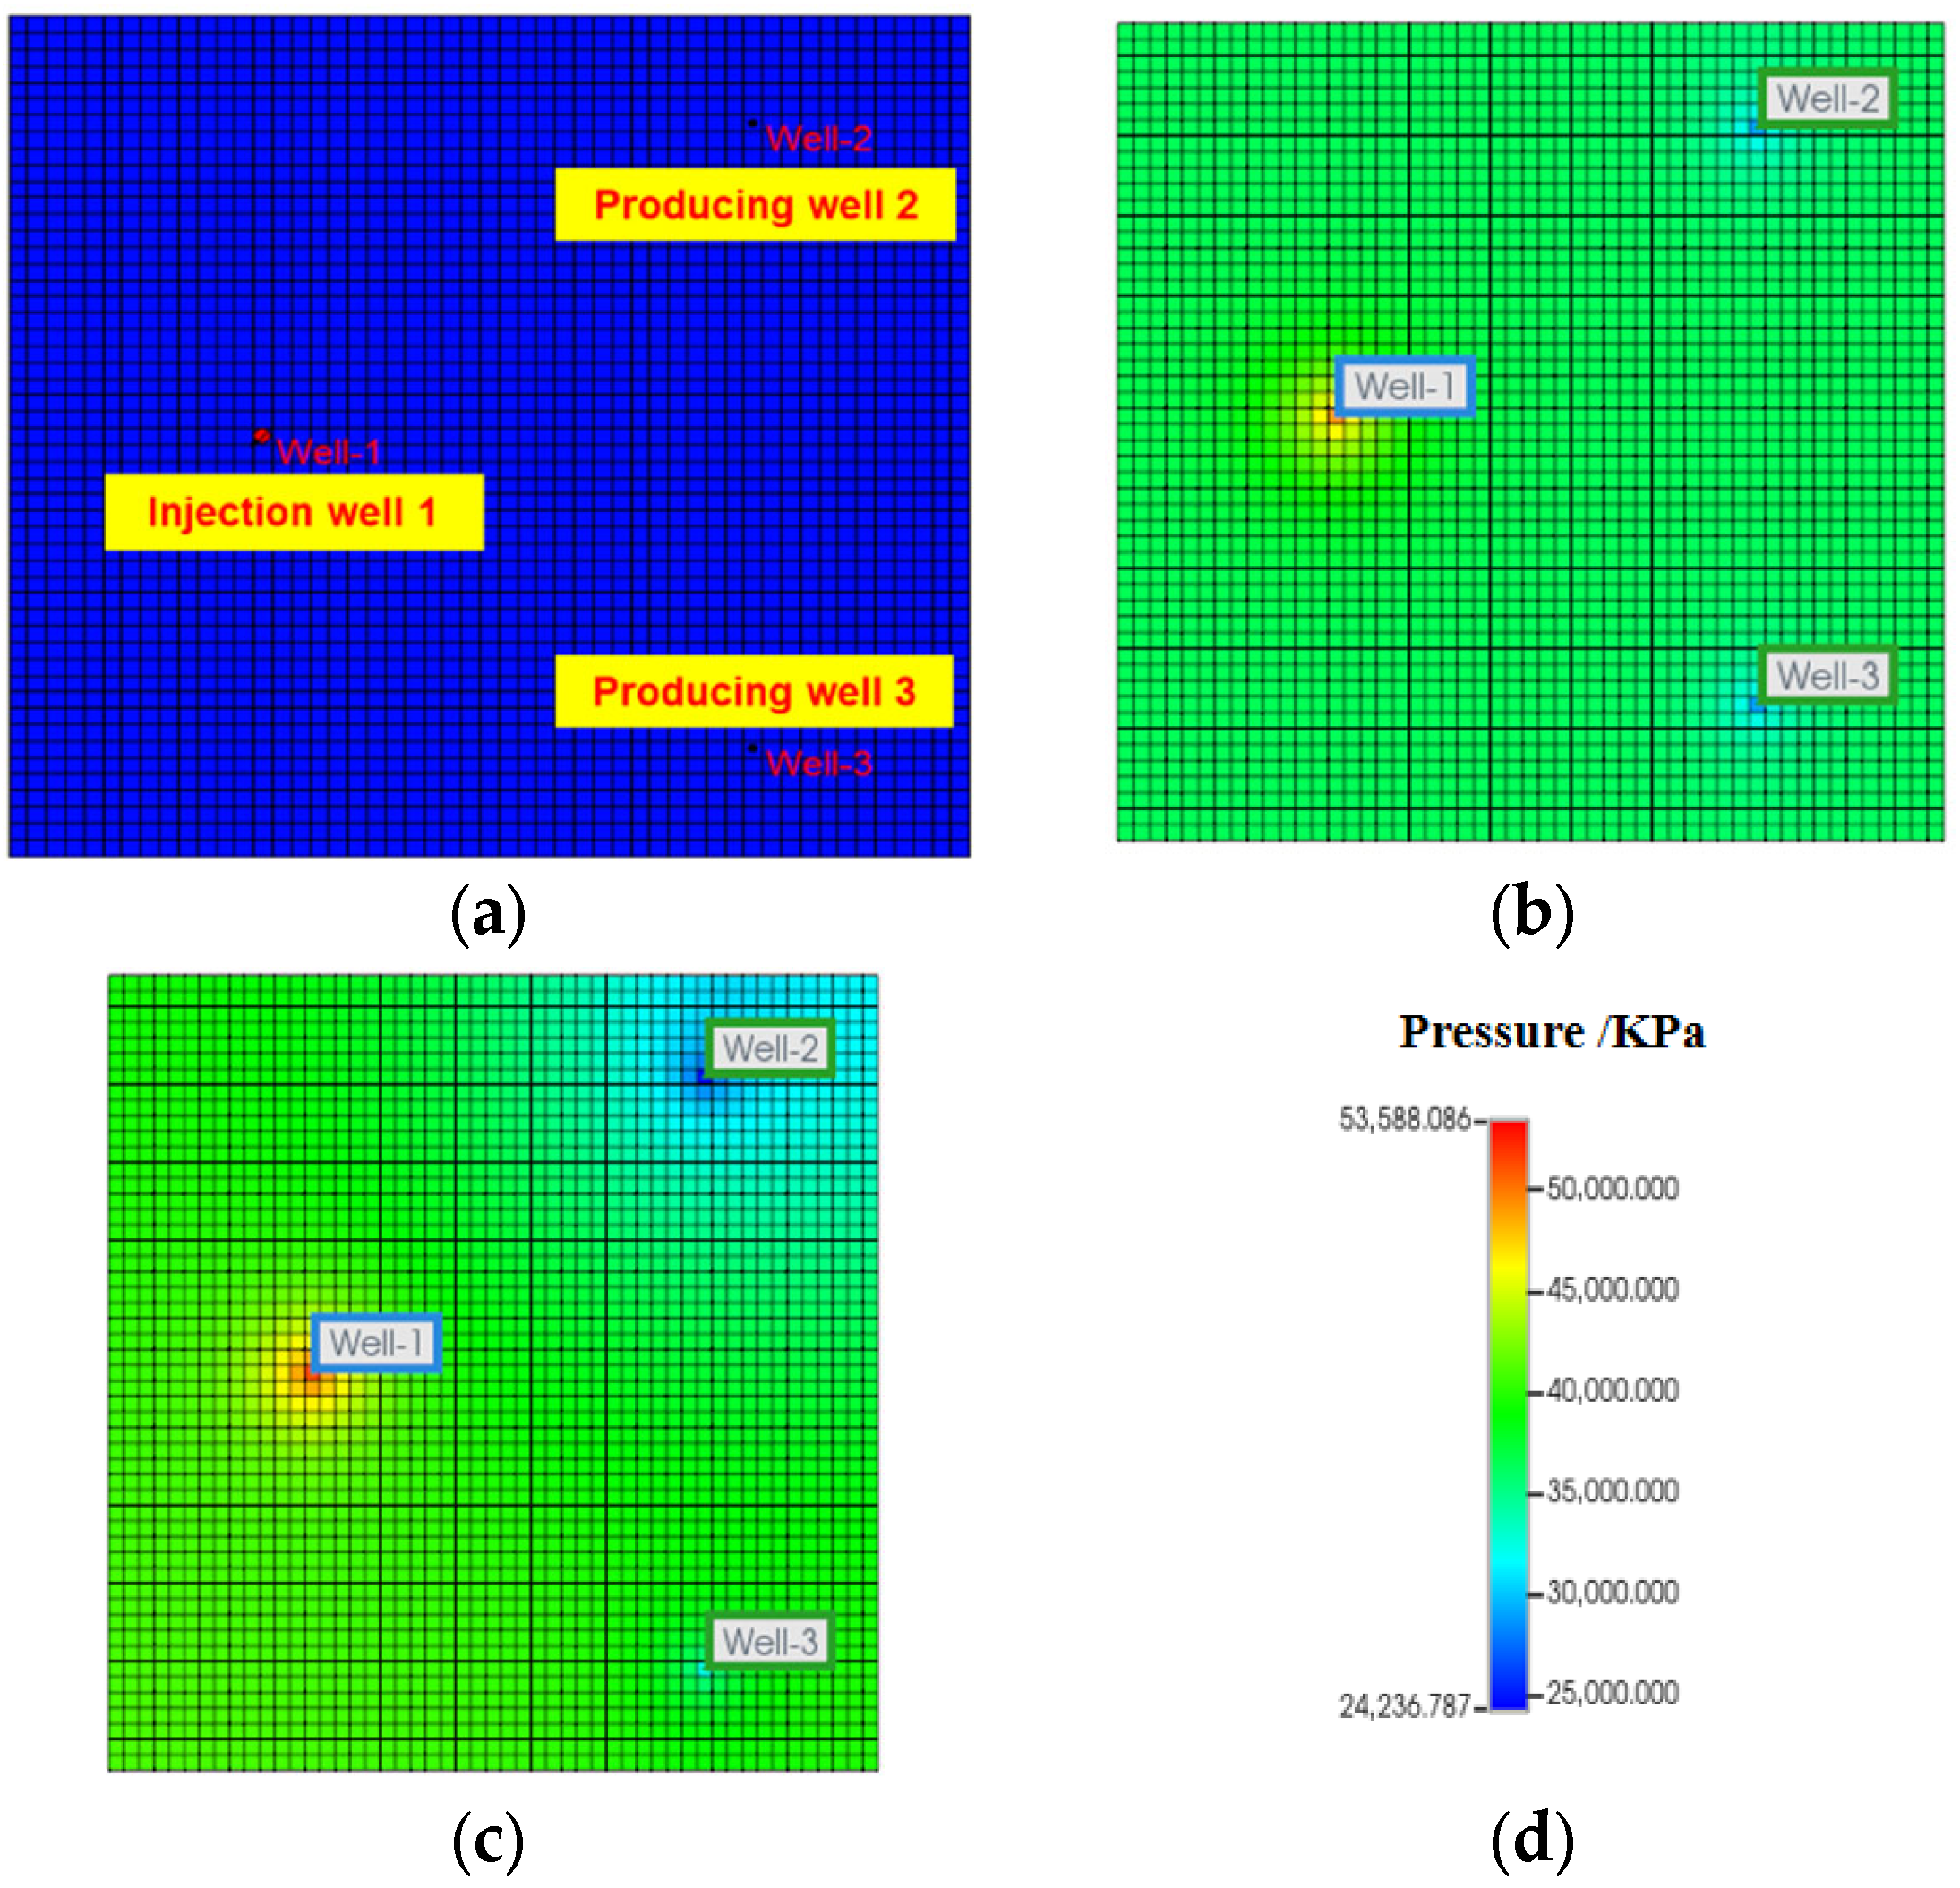
As shown in Figure 8, in order to simulate the water injection development effect under the condition of formation pressure depletion, a well pattern model of “one injection and two production” is set up. The distances between injection and production wells are both 300 m, and the production method is constant liquid production. The influence of formation pressure depletion on the production effect can be judged by observing the pressure rebound of the production wells during the water injection. In the experimental group ①, it was set that the injection Well-1 started water injection, and the production Well-2 and Well-3 were exploited simultaneously. In the control group ②, it was set that the production Well-2 was exploited for a period of time first, then the injection Well-1 started water injection, and at the same time, the production Well-3 was put into production.
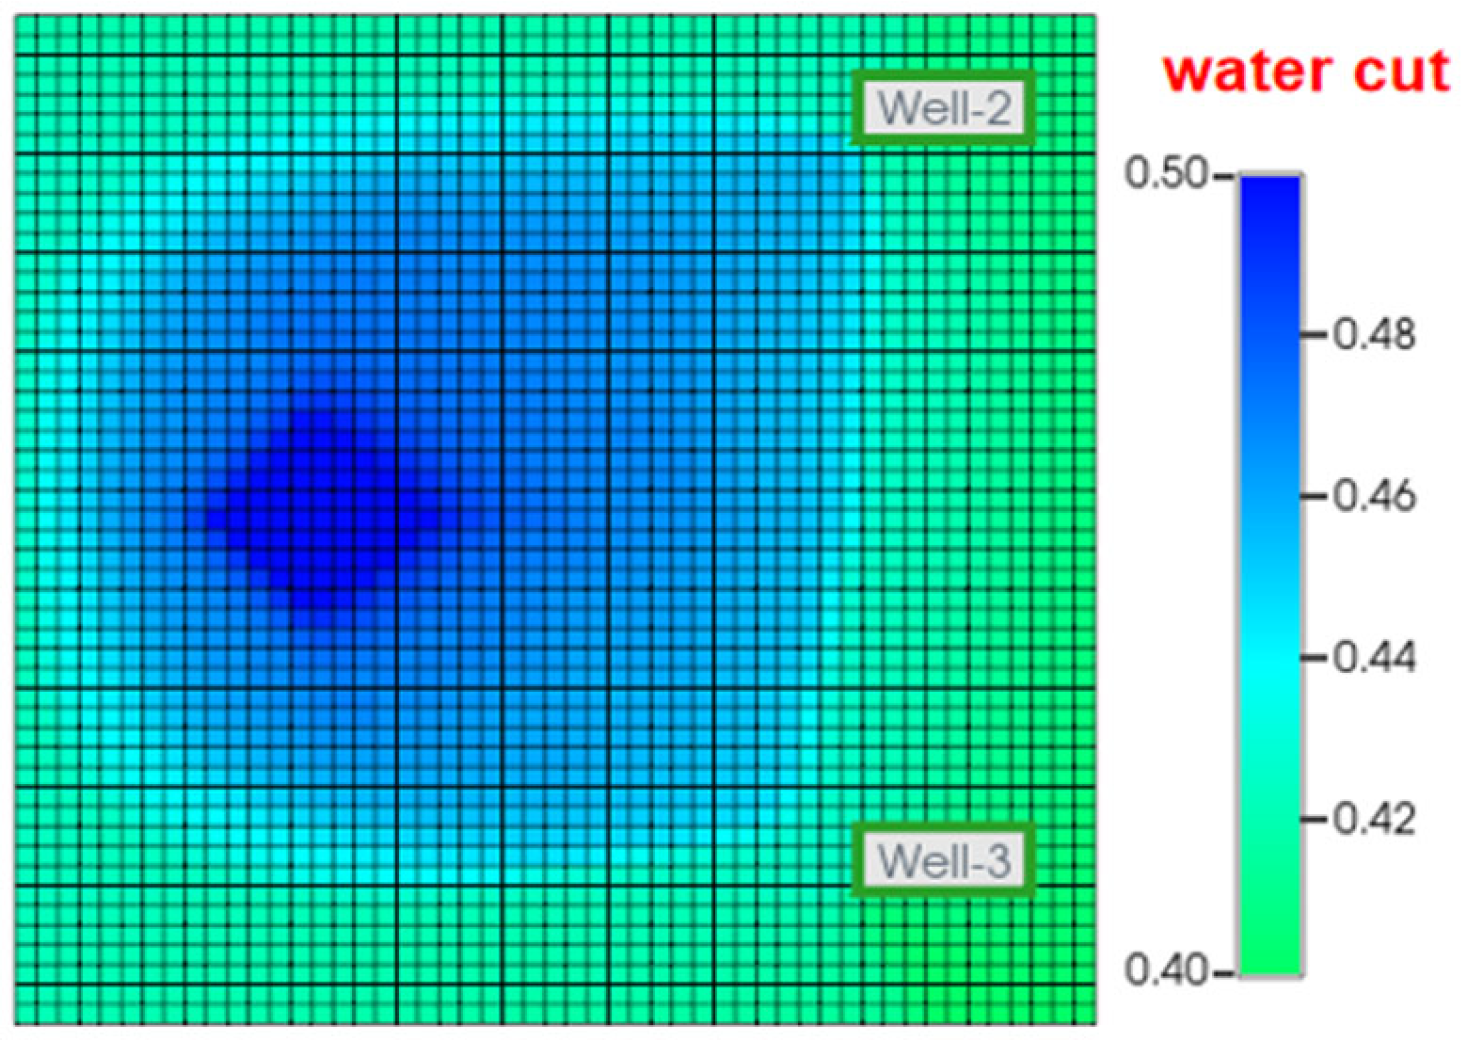
The pressure response results of the production wells are shown in Table 1. The production effect of two production wells in experimental group ① is completely consistent. But in control group ②, under the action of the same water injection well, the production Well-2, which has been exploited in the early stage, has an obvious effect: the bottom hole pressure rises again, and the newly added Well-3 has no obvious pressure response. This indicates that the production well with priority production and formation pressure depletion is more susceptible to the influence of water injection. The effective characteristics of water injection on production wells with formation pressure depletion are shown in Figure 9, and the influence curve of formation pressure depletion on water cut is shown in Figure 10. It is found that production wells with high cumulative production and large formation pressure depletion have a faster increase in water cut after high-pressure water injection to supplement energy. It shows that production wells with large formation pressure deficits, after injecting water to supplement energy, have a faster increase in water cut, and the waterflood front is easier to break through.

3.1.2. Reservoir Heterogeneity

A numerical simulation model with a total of six small layers was set up. Among them, layers 1 and 2 are high-permeability layers, and the rest are low-permeability layers. The simulation results are shown in Figure 11. Depletion exploitation was carried out before 2022, and high-pressure water injection was conducted after 2022. High-pressure water injection was carried out when the liquid supply was insufficient and formation water content was high. These injected waters mainly replenish the energy of the high-permeability layers (high-permeability layer 1 and high-permeability layer 2), enabling these layers to restore their liquid production capacity and, thus, increasing the oil production.
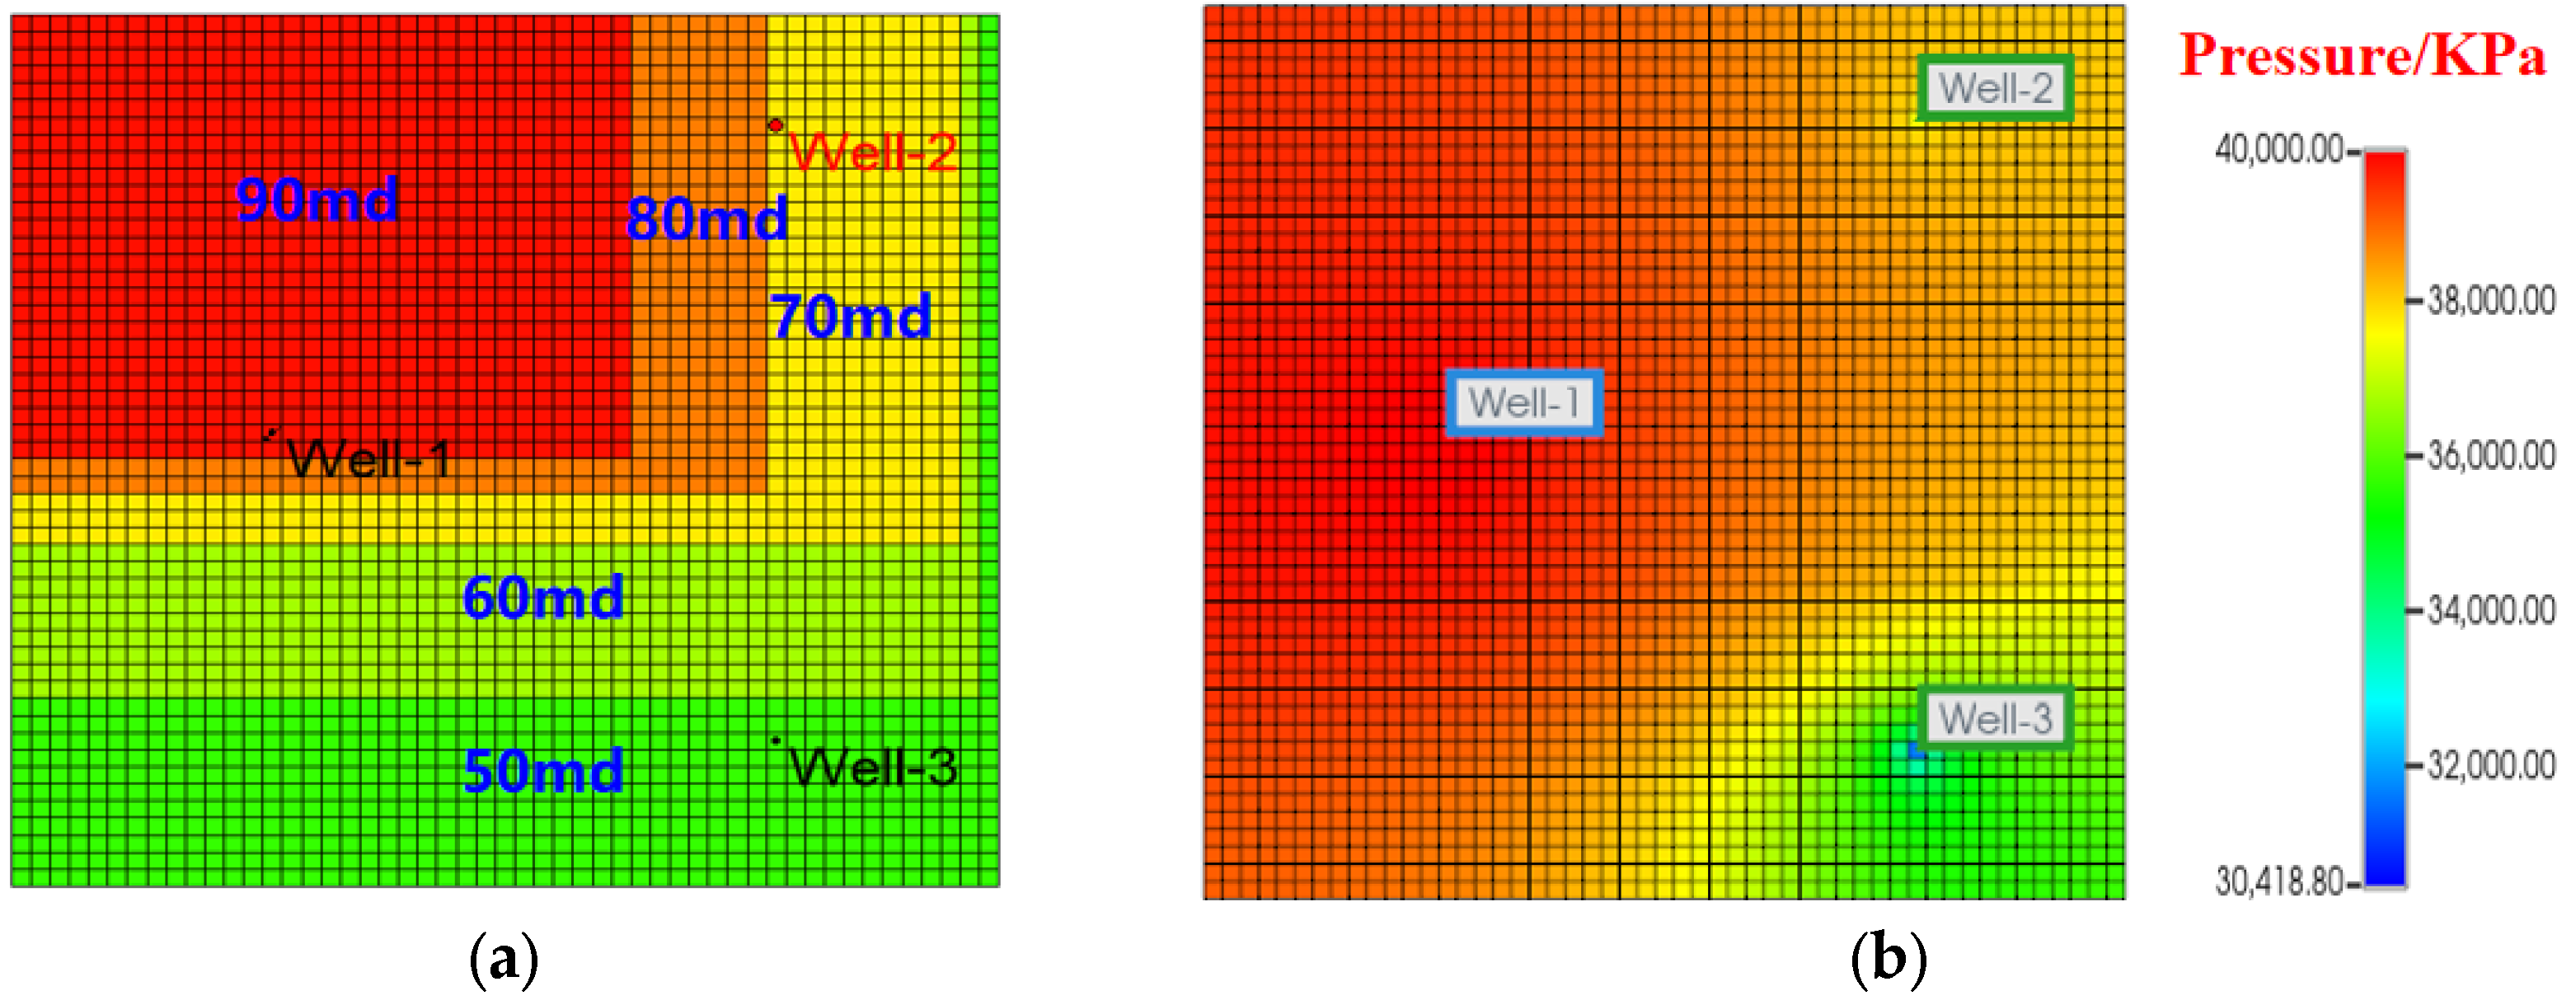
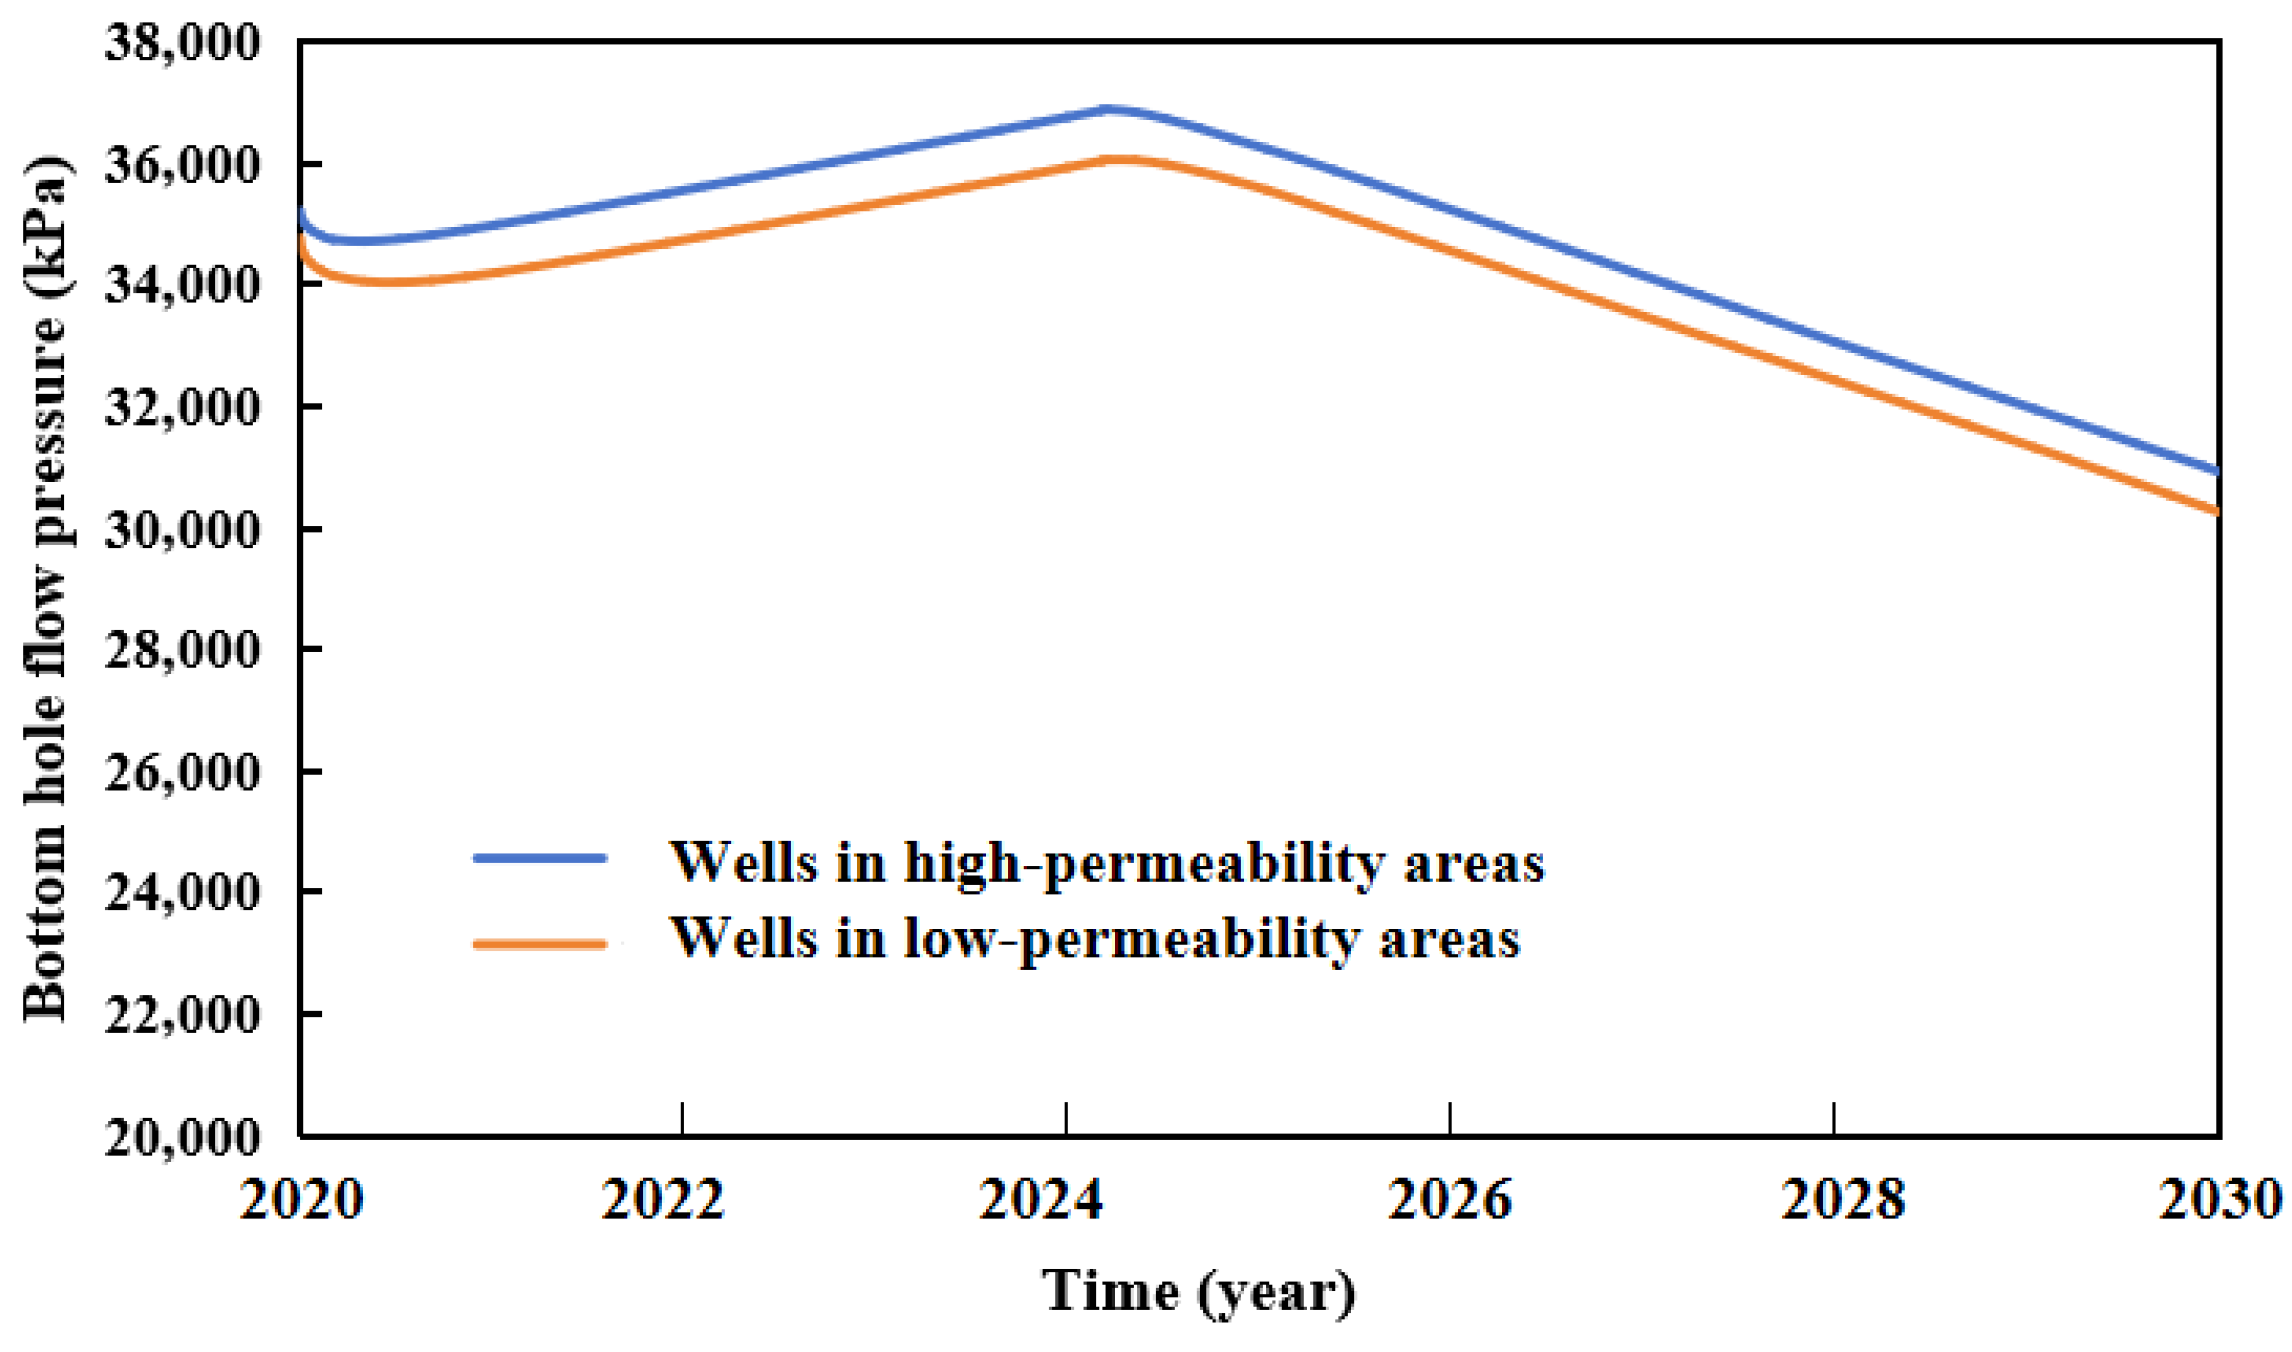
On the plane, during the process of water injection development, the injected water will preferentially rush rapidly along high permeability channels (such as fractures and large pores), resulting in a decrease in displacement efficiency. Based on the plane permeability difference in the target well group, an equivalent model is established, as shown in Figure 12a. Observing the pressure propagation during the water injection process, as shown in Figure 12b. The injected water will preferentially flow towards areas with high permeability and low seepage resistance, resulting in faster efficiency, more obvious pressure response, and better effect for production wells in high permeability areas. As shown in Figure 13, the higher the permeability is, the more injected water the high-permeability reservoir absorbs during the process of injecting water to replenish the formation pressure, and the more obvious the pressure recovery is.

3.1.3. Water Flow Dominant Channel

Waterflood-induced fracture refers to the open fractures or water flow dominant channels centered on the water injection well, formed when the water injection pressure exceeds the opening pressure of the natural fractures in the formation during the long-term water injection development process of low-permeability reservoirs. This fracture is usually a naturally formed water flow dominant channel. Based on the “one injection and four extraction” five-point well network, a numerical model including three heterogeneous reservoirs is constructed. By setting different conductivity parameters (medium–high permeability area (conductivity 15 mD) and low permeability area (1 mD)), the development characteristics of dominant channels are quantitatively characterized by setting different conductivity parameters, as shown in Figure 14 and Figure 15. Among them, Well-1 is an injection well, and the remaining four wells are production wells. Based on the equivalent model theory, a simulation study was carried out with the help of numerical simulation software. The model was calibrated through the fitting results. The grid size used in the modeling is a planar step size of 50 m × 50 m. The vertical length is 22 m in total. Each small layer is allocated one layer of grid.
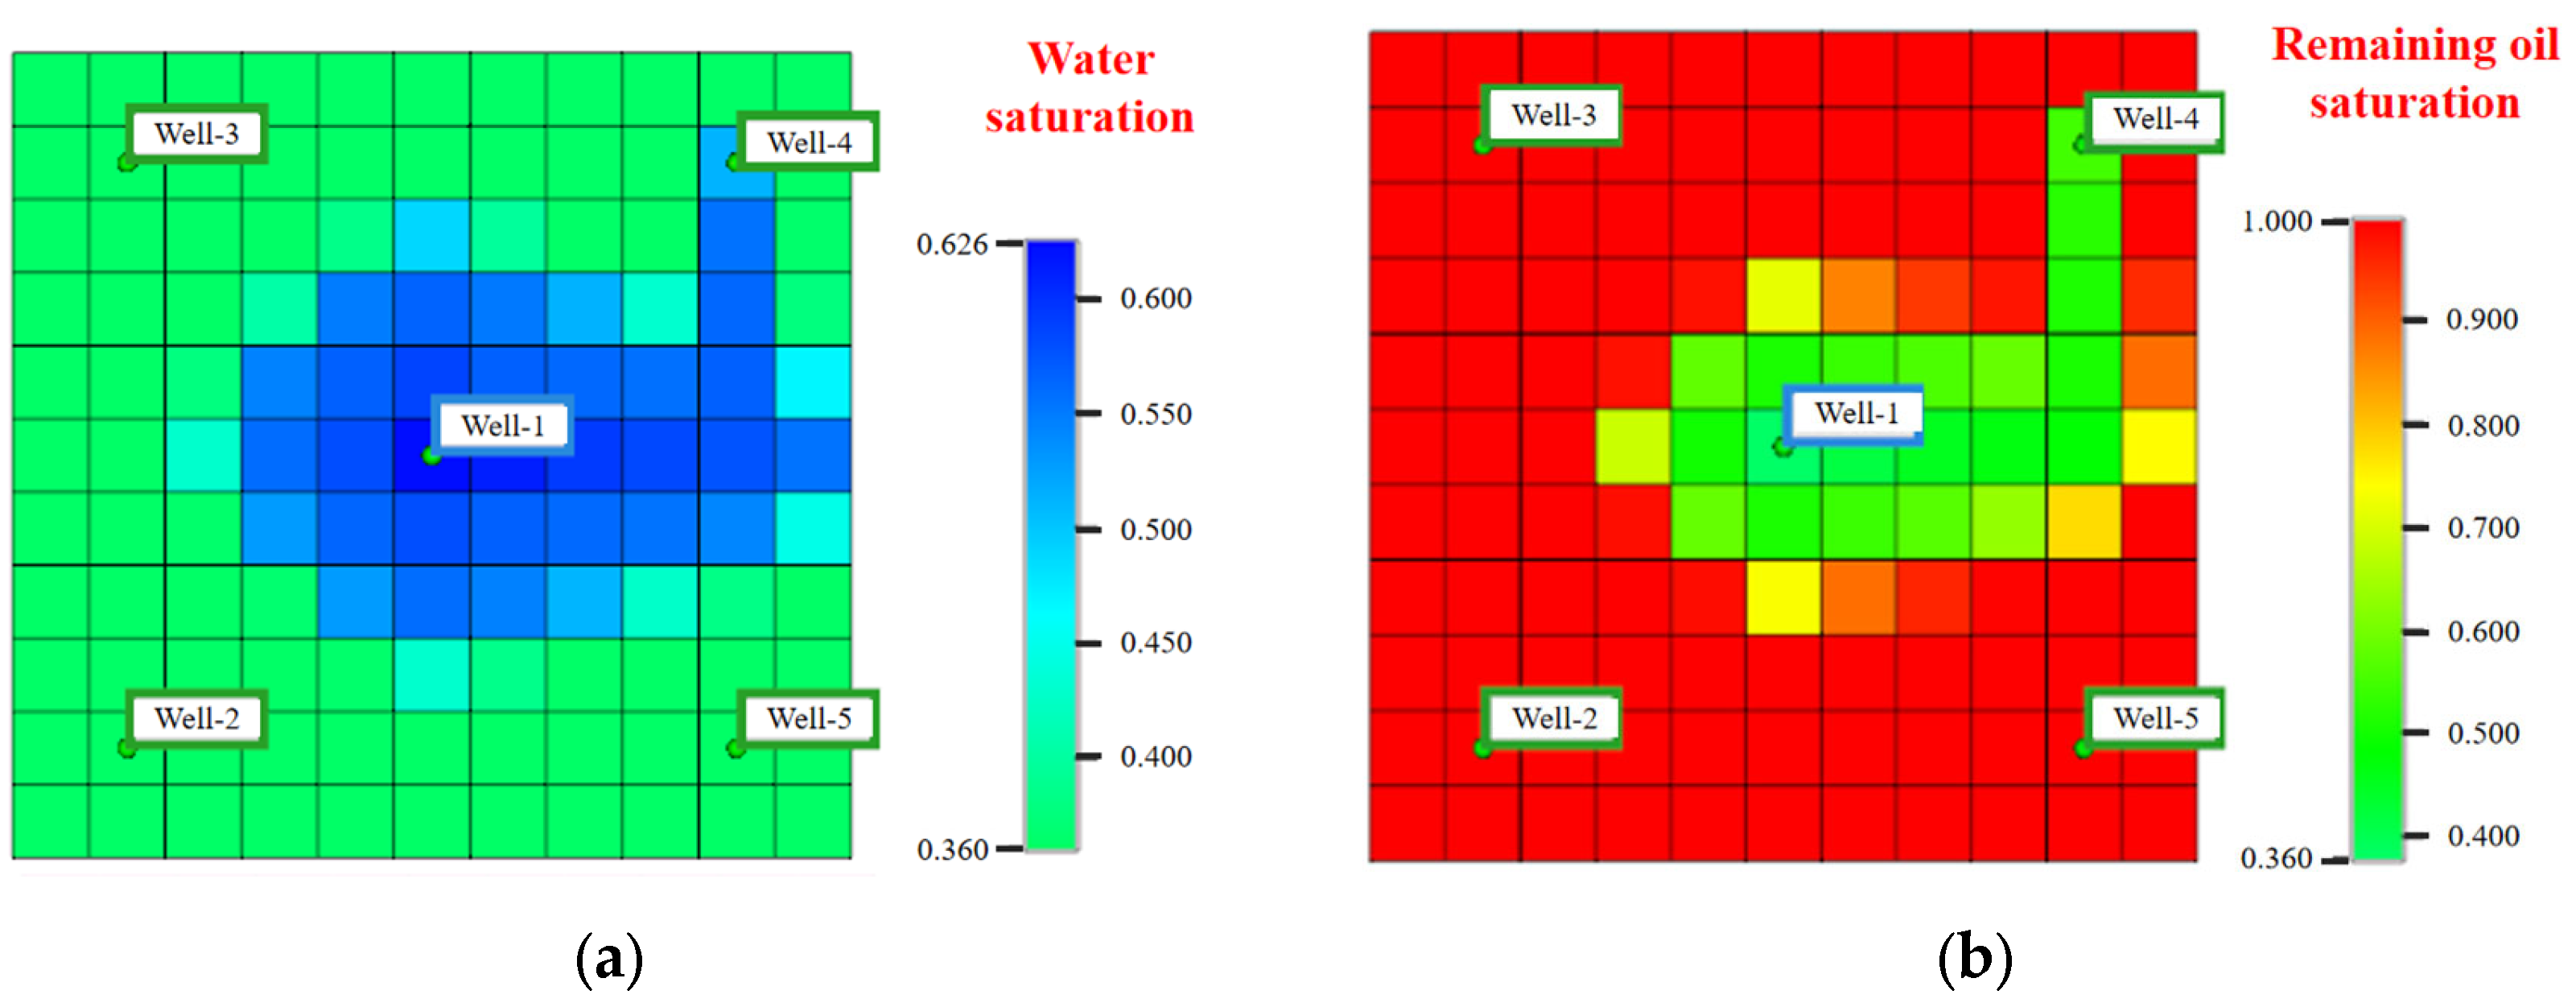
The simulation results are shown in Figure 16. Due to the high seepage resistance of the injected water in the low-permeability area, the injected water preferentially passes through the water flow dominant channel, resulting in a reduced swept range of injected water. As a result, the low-permeability area around the injection well cannot be fully improved, and the oil well production in the low-permeability area cannot be effectively increased. It indicates that the existence of a dominant seepage channel accelerates the flow velocity of injected water in the reservoir, allowing the waterflood front to reach the production well faster; that is, the production well sees water earlier, and the water cut rises faster.

3.2. Engineering Factors

Engineering factors refer to human intervention measures, mainly including fracturing stimulation measures, water injection rate, and micro-fractures produced during high-pressure water injection. These factors have a significant impact on the movement direction of fluids within the oil layer, the sweep range of injected water, and the effect of water flooding to enhance oil recovery. The following will analyze the impact of engineering factors on the development effect of high-pressure water injection in combination with numerical simulation methods.

3.2.1. Fracturing Stimulation Measures

In order to clarify the influence of artificial fracturing on the development effect of high-pressure water injection, a reservoir numerical simulation model was established based on the “one injection and two production” well pattern (Well-1 is the water injection well, and Well-2 and Well-3 are the production wells). Among them, the artificial fracture of production Well-2 is parallel to the injection Well-1, and the artificial fracture of production Well-3 is perpendicular to the injection Well-1. The influence of fracturing dominant channels on the water injection effect is comparatively studied through numerical simulation comparison. The simulation results are shown in Figure 17. ① For the fractured wells parallel to the injection and production direction: Since the dominant channel forms a direct high seepage channel from the injection well to the production well, the pressure response of the production well is rapid, and production takes effect quickly. However, the water cut also rises rapidly; that is, it is easy to cause rapid flooding. ② For fractured wells perpendicular to the injection and production direction, the pressure propagation is relatively slow, and the immediate effect is slightly poor. However, the artificial fractures effectively extend to more oil layer areas. In the long term, obtaining a larger effective water flooding sweep area can enhance the oil displacement effect and the overall development effect. Therefore, when implementing hydraulic fracturing stimulation measures, the stress direction in the reservoir and the direction of injection and production wells should be comprehensively considered, and the direction of the fracturing fractures should be reasonably selected to avoid the premature formation of dominant flow channels between the injection and production wells, which would lead to a rapid increase in water cut of production wells and their scrapping.

3.2.2. Water Injection Rate

Assuming that the total water injection volume in two groups of injection and production well groups is the same, two groups of simulation schemes (the injection rates of the injection wells c: 50 m3/day and 200 m3/day) are designed to study the influence of water injection rate on effective sweep breakthrough of the waterflood front. The result in Figure 18 shows the following: ① in the short term, the scheme with a high water injection rate has faster water injection pressure propagation, and the dynamic liquid level rises faster; the early oil production effect of production wells is better. But the waterflood front breaks through quickly, and the sweep coefficient decreases. In the long term, the water cut increases significantly and rapidly, and the cumulative recovery rate is relatively low. ② The lower injection rate scheme leads to slower waterflood front breakthrough, and the effective sweep area gradually expands, which is beneficial increasing the water drive effect in long-term development, reducing water cut in the produced fluid, and improving the final cumulative crude oil recovery rate. Therefore, a reasonable water injection rate should be selected in the actual production process, especially for low-permeability reservoirs, and a reasonable and moderate water injection velocity should be maintained to achieve long-term stable and efficient development results.

3.2.3. Microfracture Produced by High-Pressure Water Injection

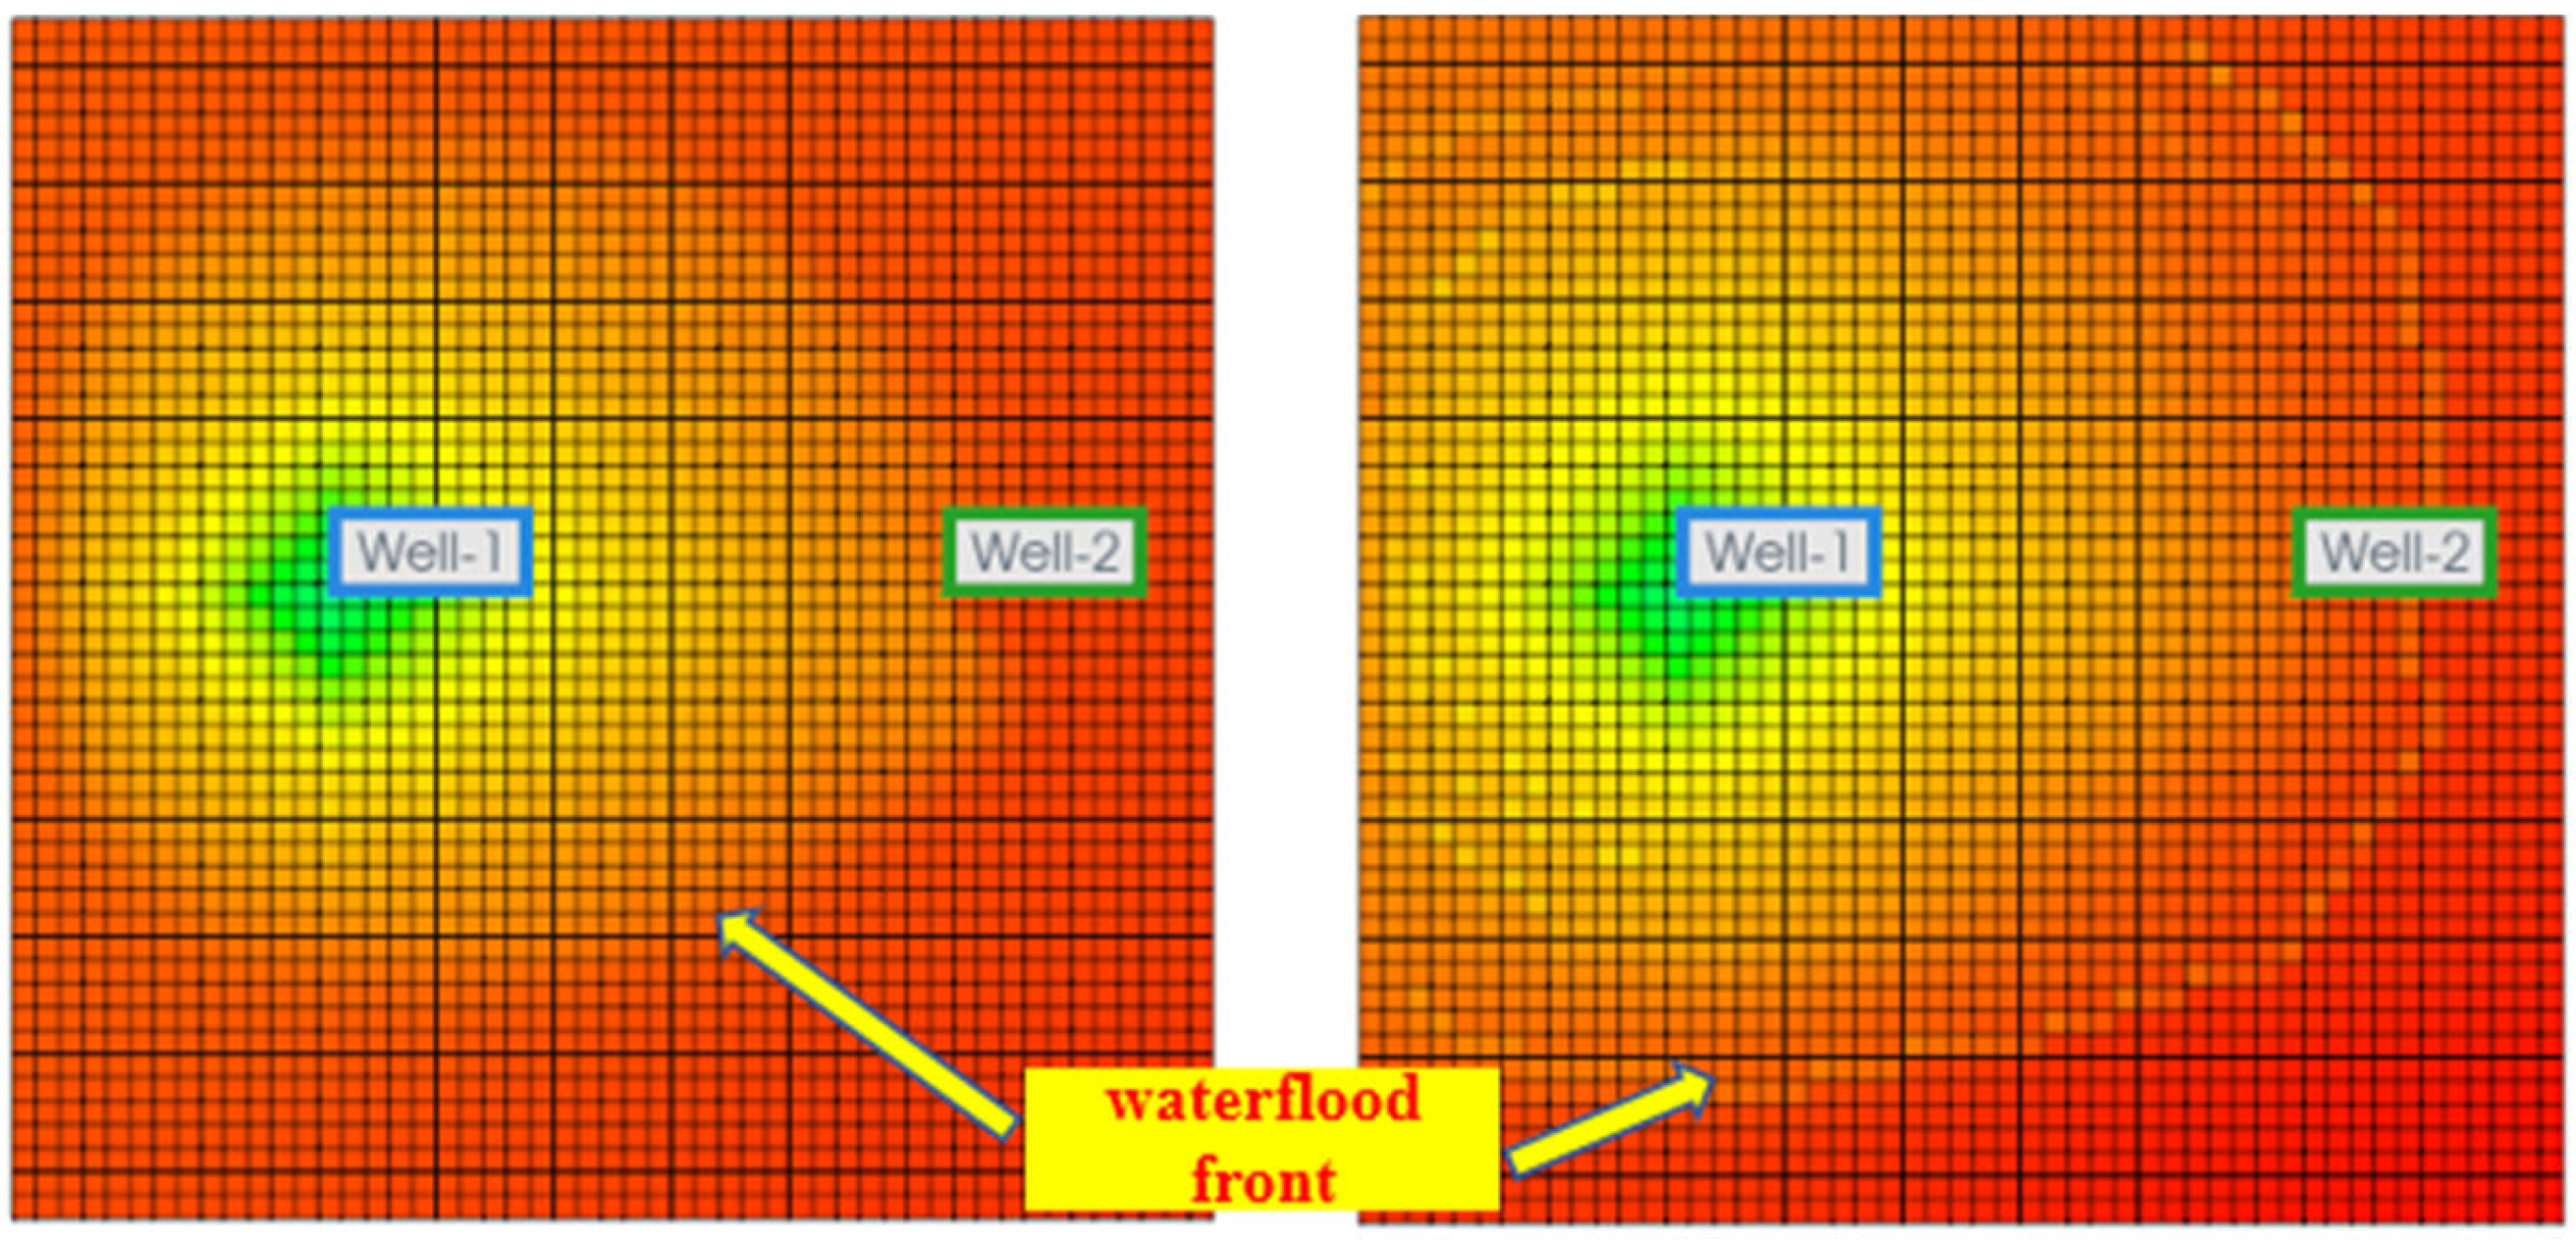
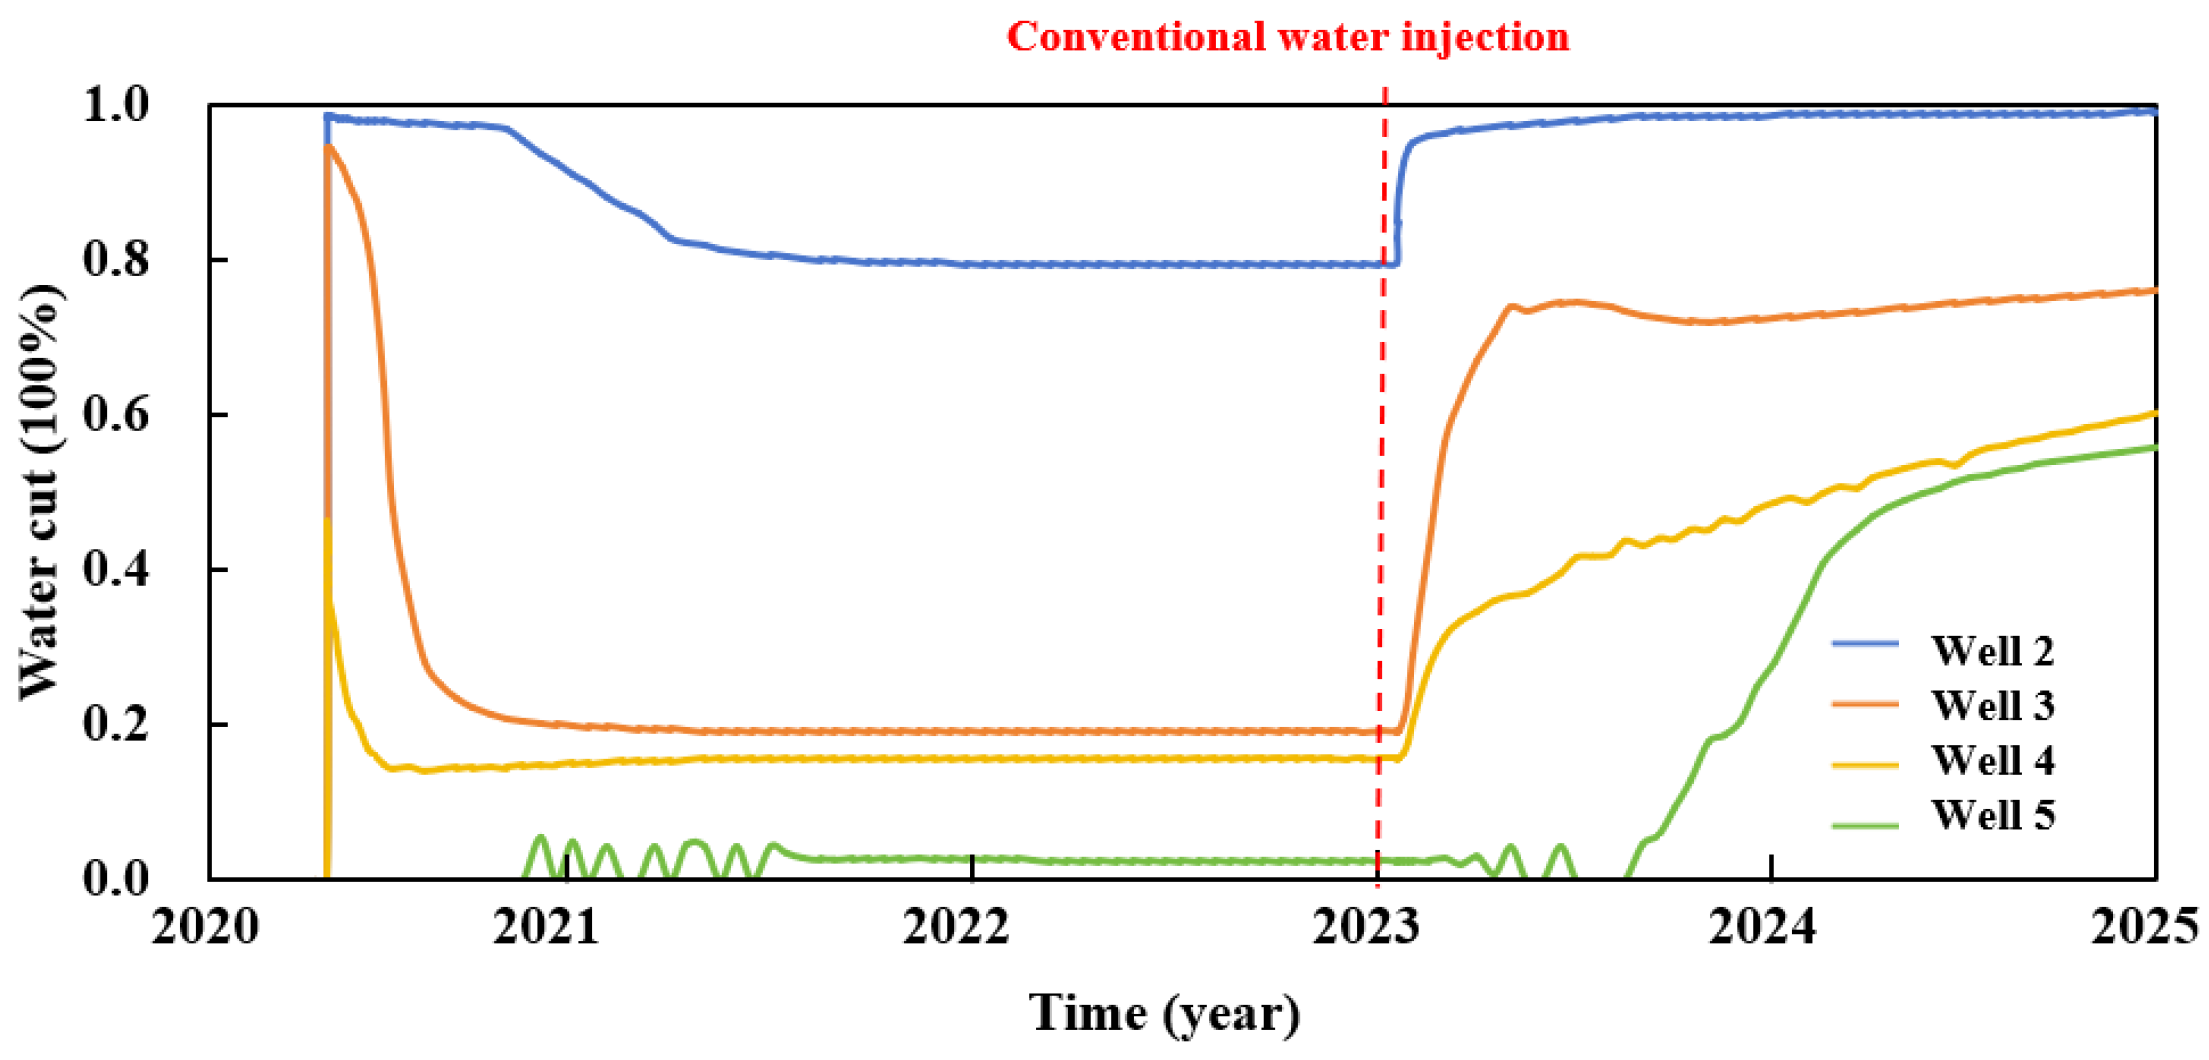
By numerical simulation method, the influence of microfracture (reservoir permeability enhancement channel) on development effect and water cut change law in high-pressure water injection development is studied [17,32,33,34,35]. Oil wells are set in different zones (pure oil zone, swept zone, and permeability enhancement zone), as shown in Figure 19. Four oil wells are set up for production in the reservoir after high-pressure water injection. Among them, Well-2 is located in the enhanced permeability zone, Well-5 is located in the pure oil zone, and Well 3 and Well 4 were located near the injection well and at the edge of the swept zone, respectively. Distance from water injection well: Well-5> Well-4> Well-3> Well-2. The simulation results are shown in Figure 20. The problem of rapid water channeling occurs in production wells in the permeability enhancement area (Well-2), and high water cut appeared earlier. In the swept zone (Well-3, Well-4), the water content at the wellhead increases first and then gradually stabilizes. In the pure oil zone (Well-5), the water cut is relatively low at the beginning, until the front edge of the injection water sweep is reached, and then the water cut begins to increase significantly, showing a sweep law of uniform diffusion outward from the injection well as the center.
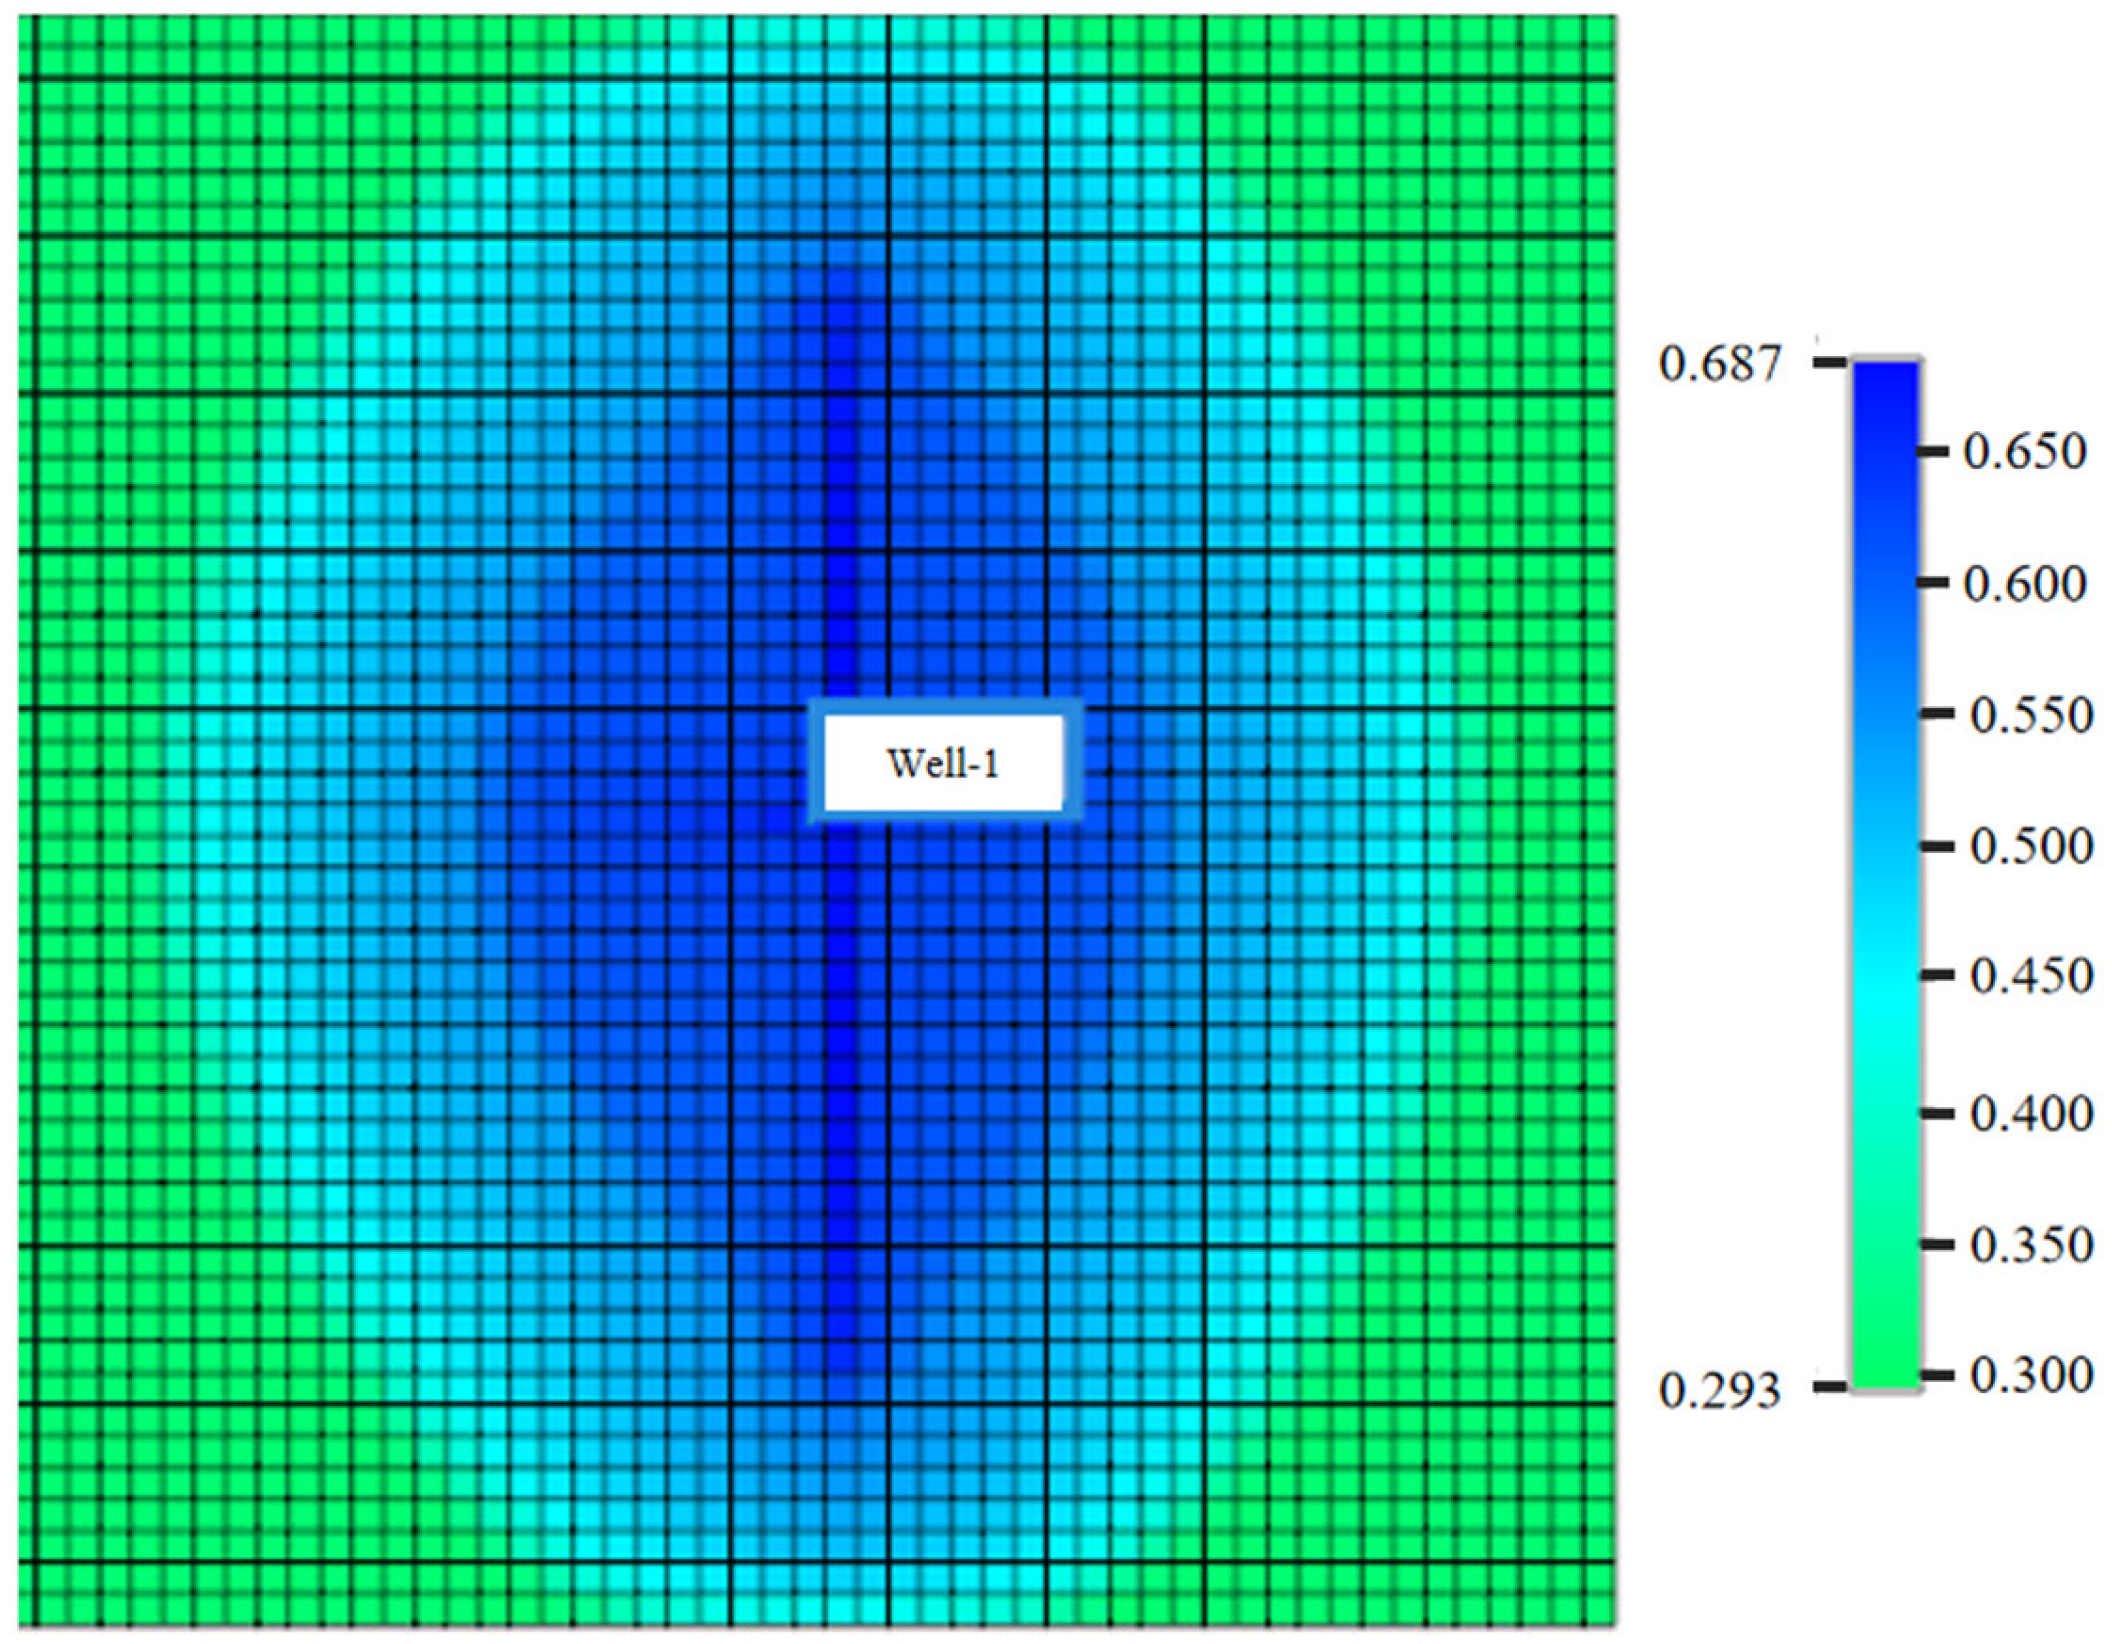
As shown in Figure 21 and Figure 22, when a transverse artificial microfracture is added to the model area, the swept area formed by high-pressure water injection again obviously presents a significantly non-uniform expansion distribution: the reservoir permeability enhancement range expands in the direction of the fracture zone, resulting in a significant increase in the reservoir swept area. The existence of micro-fractures in high-pressure water injection leads to the appearance of an obvious directional flow dominant channel for the injected water, and the water flooding sweep direction shows a directional effect. Therefore, in order to give full play to the production increase measures effect of high-pressure water injection, it is necessary to analyze the regional stress distribution field, the extension direction of micro-fractures, and the injection-production well pattern to reasonably optimize the opening and extension of micro-fractures guided by formation stress, further enhance the effect of reservoir water injection and oil displacement, and effectively enhance the oil recovery of the reservoir.

4. Conclusions

This article systematically analyzes the mechanism of high-pressure water injection technology in increasing formation water absorption capacity in low-permeability reservoir development and analyzes the inherent relationship between high-pressure water injection to achieve effective fluid drive and production increase from the aspects of seepage characteristics, high-pressure water injection expansion and permeability enhancement, and induced fractures, etc. Finally, by combining geological factors (formation pressure depletion, reservoir heterogeneity, water flow dominant channels) and engineering factors (fracturing stimulation measures, water injection rate, micro-fractures produced by high-pressure water injection), the influence of different factors on water injection development effect was studied. The main conclusions and recommendations are as follows:
(1) Since the mechanism of water flooding during the high-pressure water injection development of low-permeability reservoirs is not yet clear, this study analyzed the influence of geological and engineering factors on the development effect of high-pressure water injection. The research shows that during high-pressure water injection, production wells with a large formation pressure depletion experience a faster increase in water cut after water injection to replenish energy. The existence of preferential water flow channels causes the injected water to flow preferentially along high-permeability channels. High-permeability layers absorb the injected water first, resulting in a relatively rapid increase in the water cut of production wells in these layers, while the water cut of low-permeability layers changes relatively slowly. At the same time, it is necessary to consider the direction of formation stress, combined with a reasonable hydraulic fracture orientation and water injection rate, to increase the low-water-cut oil production time of production wells.
(2) Combining the compaction-expansion mechanism formed in the reservoir during high-pressure water injection, the reservoir after high-pressure water injection was divided into a permeability-increasing zone, a swept zone, and a pure oil zone, and the mining effects of production wells in different zones were numerically simulated. After high-pressure water injection, the change in reservoir water cut shows zonal characteristics: permeability-increasing zone (rapid water flooding) > swept zone (steady increase in water cut) > pure oil zone (delayed increase). It is analyzed that the strong connectivity between injection and production wells in the permeability-increasing zone is the main reason for the rapid water flooding of production wells in this area.
(3) When the distribution of the water saturation and pressure increase zones formed after high-pressure water injection is affected by various factors in the formation, it usually shows a certain directionality. During the high-pressure water injection process, the micro-fractures formed cause the injected water to exhibit obvious directional flow, which in turn affects the change in water cut. The existence of micro-fractures makes the water flooding sweep direction show a directional effect, further accelerating the rise in water cut. Through numerical simulation of the flow directionality of high-pressure water injection in hydraulic fractures and local high-permeability zones, the results show that the extension direction of high-pressure water injection micro-fractures is comprehensively affected by factors such as high-permeability regions natural or artificial fractures.

Author Contributions

Y.L., H.X., H.Z., Z.C., and X.B.: Writing—original draft, methodology, investigation, formal analysis. J.W.: writing—review and editing, conceptualization. J.L., C.X., S.F. and L.Z.: investigation. All authors have read and agreed to the published version of the manuscript.

Funding

This work is financially supported by the Key project of scientific research plan of Education Department of Hubei Province, (NO. D20231301) and Open Fund of Hubei Key Laboratory of Oil and Gas Drilling and Production Engineering (Yangtze University) (NO. YQZC202401).

Data Availability Statement

The original contributions presented in the study are included in the article, further inquiries can be directed to the corresponding authors.

Conflicts of Interest

Authors Yang Li, Hongtao Zhao, Xuejing Bai, Chunhong Xiu, Lianshe Zhang were employed by the company Luming Oil and Gas Exploration and Development Co., Ltd., Shengli Oilfield, Sinopec. The remaining authors declare that the research was conducted in the absence of any commercial or financial relationships that could be construed as a potential conflict of interest. The company had no role in the design of the study; in the collection, analyses, or interpretation of data; in the writing of the manuscript, or in the decision to publish the results.

References

  1. Zeng, F.; Dong, C.; Lin, C.; Tian, S.; Wu, Y.; Lin, J.; Liu, B.; Zhang, X. Pore structure characteristics of reservoirs of Xihu Sag in East China Sea Shelf Basin based on dual resolution X-ray computed tomography and their influence on permeability. Energy. 2022, 239, 122386. [Google Scholar] [CrossRef]
  2. Xiao, W.; Ren, J.; Pu, W.; Yuan, C.; Meng, L.; Zeng, L.; Zhao, H.; Chen, Q. Laboratory tests and field pilot of foam-assisted deoxidized-air flooding in a low-permeability sandstone reservoir. Fuel 2023, 352, 129150. [Google Scholar] [CrossRef]
  3. Wang, Z.; Cao, G.; Bai, Y.; Wang, P.; Wang, X. Development Status and Prospect of EOR Technology in Low-Permeability Reservoirs. Spec. Oil Gas Reserv. 2023, 30, 1–13. [Google Scholar]
  4. Li, X.; Yang, Z.; Li, S.; Huang, W.; Zhan, J.; Lin, W. Reservoir characteristics and effective development technology in typical low-permeability to ultralow-permeability reservoirs of China National Petroleum Corporation. Energy Explor. Exploit. 2021, 39, 1713–1726. [Google Scholar] [CrossRef]
  5. Park, S.Y.; Ahn, K.I. Evaluation of an accident management strategy of emergency water injection using fire engines in a typical pressurized water reactor. Nucl. Eng. Technol. 2015, 47, 719–728. [Google Scholar] [CrossRef]
  6. Yang, Y.; Zhang, S.; Cao, X.; Lv, Q.; Wang, J.; Liu, H.; Yu, C.; Sun, H. Practice and understanding of pressure-driven development technology in Shengli Oilfield. Pet. Geol. Recovery Effic. 2023, 30, 61–71. [Google Scholar] [CrossRef]
  7. Chen, L.; Jia, C.; Zhang, R.; Yue, P.; Jiang, X.; Wang, J.; Su, Z.; Xiao, Y.; Lv, Y. High-pressure capacity expansion and water injection mechanism and indicator curve model for fractured-vuggy carbonate reservoirs. Petroleum 2024, 10, 511–519. [Google Scholar] [CrossRef]
  8. Worm, J.; Naber, J.; Duncan, J.; Barros, S.; Atkinson, W. Water injection as an enabler for increased efficiency at high-load in a direct injected, boosted, SI engine. SAE Int. J. Engines 2017, 10, 951–958. [Google Scholar] [CrossRef]
  9. Mahdavi, S.; James, L.A. High pressure and high-temperature study of CO2 saturated-water injection for improving oil displacement; mechanistic and application study. Fuel 2020, 262, 116442. [Google Scholar] [CrossRef]
  10. Tian, T.; Meng, Y.; Shi, S.; Wang, W. Development technologies and practice of undeveloped reserves in Shengli Oilfield. Pet. Geol. Recovery Effic. 2024, 31, 122–129. [Google Scholar] [CrossRef]
  11. Ma, X.; Bi, Y.; Jiang, M.; Li, D.; Gu, X. Characteristics of water phase permeability variation in medium-low permeability oil reservoirs during high multiple waterflooding. Pet. Reserv. Eval. Dev. 2025, 15, 103–109. [Google Scholar] [CrossRef]
  12. Wang, J.; Liu, L.; Wu, Y.; Liu, H.; Jia, Y. Progress and direction of water flooding development technologies in Shengli Oilfield. Pet. Geol. Recovery Effic. 2024, 31, 99–112. [Google Scholar] [CrossRef]
  13. Wang, Y.; Song, X.; Tian, C.; Shi, C.; Li, J. Dynamic fractures are an emerging new development geological attribute in water-flooding development of ultra-low-permeability reservoirs. Pet. Explor. Dev. 2015, 42, 222–228. [Google Scholar] [CrossRef]
  14. Zhao, X.; Zeng, L.; Ji, B.; Jiao, J.; Li, P.; Zhang, Y.; Chen, M. Discussion on optimal injection pressure of fractured low-permeability sandstone reservoirs—A case study from Wangyao block in Ansaioilfield, Ordos Basin. Oil Gas Geol. 2015, 36, 855–861. [Google Scholar]
  15. Zhao, X.; Lv, W.; Wang, C.; Zhu, S.; Fan, J. Major factors controlling waterflooding-induced fracture development in low-permeability reservoirs-A case study of Chang 6 reservoir in W block in Ansai oilfield, Ordos Basin. Oil Gas Geol. 2020, 41, 586–595. [Google Scholar]
  16. Wang, W.; Peng, Y.; Li, G.; Lei, Z.; Lv, W. Research on Water Flooding Dynamic Fractures to Optimize Infill Drilling Spacing in Ultra-low-permeability reservoirs, Changqing Oilfield. Pet. Drill. Tech. 2015, 43, 106–110. [Google Scholar] [CrossRef]
  17. Liang, W.; Dang, H.; Liu, B.; Zhang, T.; Wang, X.; Hou, B.; Cui, P.; Wang, Q.; Zhang, F. Experiment and numerical simulation of water injection induced dynamic fractures in ultra-low-permeability reservoirs. Pet. Geol. Exp. 2023, 45, 566–575. [Google Scholar]
  18. Wang, Y.; Song, X. Comprehensive characterization integrating static and dynamic data for dynamic fractures in ultra-low-permeability reservoirs: A case study of the Chang 6 reservoir of the Triassic Yanchang Formation in the Ordos Basin, China. Minerals 2022, 12, 1277. [Google Scholar] [CrossRef]
  19. Wang, J.; Zheng, X.; Wang, Z.; Li, B.; Li, Y. Integrated approach to identify and control the water-injection induced fractures in the low-permeability reservoir. In Proceedings of the SPE Annual Caspian Technical Conference and Exhibition, Astana, Kazakhstan, 31 October–2 November 2018. [Google Scholar] [CrossRef]
  20. Zhang, Y.; Yang, Y.; Sun, Z.; Yu, C.; Sun, Q.; Bei, J. Physical simulation of fracturing-flooding and quantitative characterization of fractures in low-permeability oil reservoirs. Pet. Geol. Recovery Effic. 2022, 29, 143–149. [Google Scholar] [CrossRef]
  21. Lv, Y.; Guo, Z.; Chen, X.; Liu, D.; Zhang, Y.; Wang, Z. Analysis of Key Geological Factors of High Pressure Water Injection in Fractured Reservoir. Adv. Geosci. 2019, 11, 1050–1055. [Google Scholar] [CrossRef]
  22. Souza, A.L.S.; Fernandes, P.D.; Mendes, R.A.; Rosa, A.J.; Furtado, C.J.A. The impact of injection with fracture propagation during waterflooding process. In Proceedings of the SPE Latin America and Caribbean Petroleum Engineering Conference. Rio de Janeiro, Brazil, 20–23 June 2005. [Google Scholar] [CrossRef]
  23. Ma, X.; Li, H.; Luo, H.; Nie, S.; Gao, S.; Zhang, Q.; Yuan, F.; Ai, W. Research on well selection method for high-pressure water injection in fractured-vuggy carbonate reservoirs in Tahe oilfield. J. Pet. Sci. Eng. 2022, 214, 110477. [Google Scholar] [CrossRef]
  24. Cui, C.; Li, H.; Wu, Z.; Zhang, C.; Li, H.; Zhang, Y.; Zheng, W. Analysis of pressures in water injection wells considering fracture influence induced by pressure-drive water injection. Pet. Reserv. Eval. Dev. 2023, 13, 686–694. [Google Scholar] [CrossRef]
  25. Zhu, W.; Gao, Y.; Wang, Y.; Liu, P.; Liu, Y. The injection capacity evaluation of high-pressure water injection in low permeability reservoir: Numerical and case study. Front. Earth Sci. 2024, 12, 1411451. [Google Scholar] [CrossRef]
  26. Zheng, S.; Yang, M.; Kang, Z.; Liu, Z.; Long, X.; Liu, K.; Li, X.; Zhang, S. Controlling factors of remaining oil distribution after water flooding and enhanced oil recovery methods for fracture-cavity carbonate reservoirs in Tahe Oilfield. Pet. Explor. Dev. 2019, 46, 786–795. [Google Scholar] [CrossRef]
  27. Wang, X.; Qiao, X.; Mi, N.; Wang, R. Technologies for the benefit development of low-permeability tight sandstone gas reservoirs in the Yan’an Gas Field, Ordos Basin. Nat. Gas Ind. B 2019, 6, 272–281. [Google Scholar] [CrossRef]
  28. Zeng, L.; Gao, C.; Qi, J.; Wang, Y.; Li, L.; Qu, X. The distribution rule and seepage effect of the fractures in the ultra-low permeability sandstone reservoir in east Gansu Province, Ordos Basin. Sci. China Ser. D Earth Sci. 2008, 51 (Suppl. SII), 44–52. [Google Scholar] [CrossRef]
  29. Prioul, R.; Jocker, J. Fracture characterization at multiple scales using borehole images, sonic logs, and walkaround vertical seismic profile. AAPG Bull. 2009, 93, 1503–1516. [Google Scholar] [CrossRef]
  30. Wanniarachchi, W.A.M.; Ranjith, P.G.; Perera, M.S.A.; Rathnaweera, T.D.; Zhang, D.C. Investigation of effects of fracturing fluid on hydraulic fracturing and fracture permeability of reservoir rocks: An experimental study using water and foam fracturing. Eng. Fract. Mech. 2018, 194, 117–135. [Google Scholar] [CrossRef]
  31. Hu, W.; Wei, Y.; Bao, J. Development of the theory and technology for low permeability reservoirs in China. Pet. Explor. Dev. 2018, 45, 685–697. [Google Scholar] [CrossRef]
  32. Di, S.; Zhao, Y.; Ma, S.; Wei, Y.; Chen, S.; Miu, L. Fracture-to-fracture stimulation method for horizontal wells in fractured tight reservoir. Pet. Geol. Oilfield Dev. Daqing 2025, 44, 168–174. [Google Scholar] [CrossRef]
  33. Wang, Y.; Song, X.; Meng, F.; Liang, Y.; Jiang, T. Dynamic fracture characteristics and controlling factors of ultra-low permeability reservoirs in Ordos Basin. Acta Pet. Sin. 2025, 46, 588–598. [Google Scholar]
  34. Yang, Y.; Wang, J.; Bu, Y.; Sun, D. Practice and understanding of pressure-driven development technology in Shengli Oilfield. Pet. Geol. Recovery Effic. 2023, 1–7. Available online: https://link.cnki.net/urlid/37.1359.TE.20230424.1050.002 (accessed on 18 August 2025).
  35. Gao, Y.; Li, D.; Chen, H.; Cao, Y.; Yu, J.; Wu, S.; Chen, X.; Yuan, H.; Chen, Z. Mechanism and application of rock dilation-induced injectivity enhancement in injection wells for offshore oil field. J. Northwest Univ. (Nat. Sci. Ed.) 2025, 55, 613–632. [Google Scholar] [CrossRef]
Figure 1. Comparison of the effective range zones of high-pressure water injection. (a) Conventional water injection; (b) high-pressure water injection.
Processes 13 02664 g001
Figure 2. Low-permeability reservoir permeability curve.
Processes 13 02664 g002
Figure 3. High-presser injection fluid induces micro-fractures.
Processes 13 02664 g003
Figure 4. High-pressure injection fluid opens natural fractures.
Processes 13 02664 g004
Figure 5. Schematic diagram of fracture distribution and oil displacement effect in conventional low-pressure water injection and high-pressure water injection. (a) The fracture network formed around the injection well by conventional hydraulic fracturing; (b) fractures network in formation around high-pressure water injection wells; (c) distribution of remaining oil around conventional water injection wells; (d) distribution of remaining oil around high-pressure water injection wells.
Processes 13 02664 g005
Figure 6. Change in formation permeability around water injection well after stopping water injection. (a) Conventional low-pressure water injection; (b) high-pressure water injection.
Processes 13 02664 g006
Figure 7. Comparison of daily oil production of oil wells and remaining oil in the formation. (a) Daily oil production; (b) residual oil.
Processes 13 02664 g007
Figure 8. Setting of the formation pressure depletion model. (a) Well pattern model setup; (b) experimental group; (c) control group; (d) pressure bar chart.
Processes 13 02664 g008
Figure 9. Effective characteristics of water injection on production wells with formation pressure depletion.
Processes 13 02664 g009
Figure 10. Influence curve of formation pressure depletion on water cut.
Processes 13 02664 g010
Figure 11. Comparison of water injection effects under insufficient liquid supply. (a) Change rate of water cut before and after high-pressure water injection; (b) liquid production of each small layer after water injection.
Processes 13 02664 g011
Figure 12. Equivalent plane model and pressure response. (a) Permeability distribution map; (b) pressure propagation map; Well-1 is an injection well, and Well-2 and Well-3 are production wells.
Processes 13 02664 g012
Figure 13. Pressure effects of injected water on different permeability zones.
Processes 13 02664 g013
Figure 14. “One injection, four production” five-point well pattern model.
Processes 13 02664 g014
Figure 15. Modified conductivity indicates dominant channel.
Processes 13 02664 g015
Figure 16. Sweep effect of injected water in the presence of water flow dominant channels. (a) Water saturation; (b) remaining oil saturation.
Processes 13 02664 g016
Figure 17. Results of the influence of artificial fractures in different directions on water injection development effect. (a) The “one injection and two production” well pattern model with artificial fractures; (b) daily liquid production rate curve of production well; (c) water cut curve of production well.
Processes 13 02664 g017
Figure 18. Distribution of remaining oil saturation.
Processes 13 02664 g018
Figure 19. Distribution of production well locations.
Processes 13 02664 g019
Figure 20. Water cut variation curves of production wells in different areas after high-pressure water injection.
Processes 13 02664 g020
Figure 21. Microfracture display and permeability distribution in the enhanced permeability area; color represents permeability size, mD.
Processes 13 02664 g021
Figure 22. Distribution of water saturation in each area after high-pressure water injection; color represents water cut, 100%.
Processes 13 02664 g022
Table 1. Comparison of pressure responses of production wells.
YearExperimental Group, Bottom Hole Flowing Pressure (kPa)Control Group, Bottom Hole Flowing Pressure (kPa)
Well-2
(Deficit Well)
Well-3
(Newly Opened Well)
Well-2
(Deficit Well)
Well-3
(Newly Opened Well)
202026,471.9626,471.9626,401.1436,430.00
202116,885.4416,885.4815,789.7636,256.08
202217,040.8117,040.7912,907.0235,563.70
202318,581.4718,581.4210,951.8534,639.21
202421,986.0921,986.069274.3633,633.14
202525,274.6825,274.667718.7732,588.81
202625,274.6027,878.656566.7131,530.23
202727,878.6629,624.725882.6330,459.88
202829,624.7131,624.324907.0410,321.08
202931,624.3034,015.217666.738006.76
203034,015.2236,258.507999.327718.35
Disclaimer/Publisher’s Note: The statements, opinions and data contained in all publications are solely those of the individual author(s) and contributor(s) and not of MDPI and/or the editor(s). MDPI and/or the editor(s) disclaim responsibility for any injury to people or property resulting from any ideas, methods, instructions or products referred to in the content.