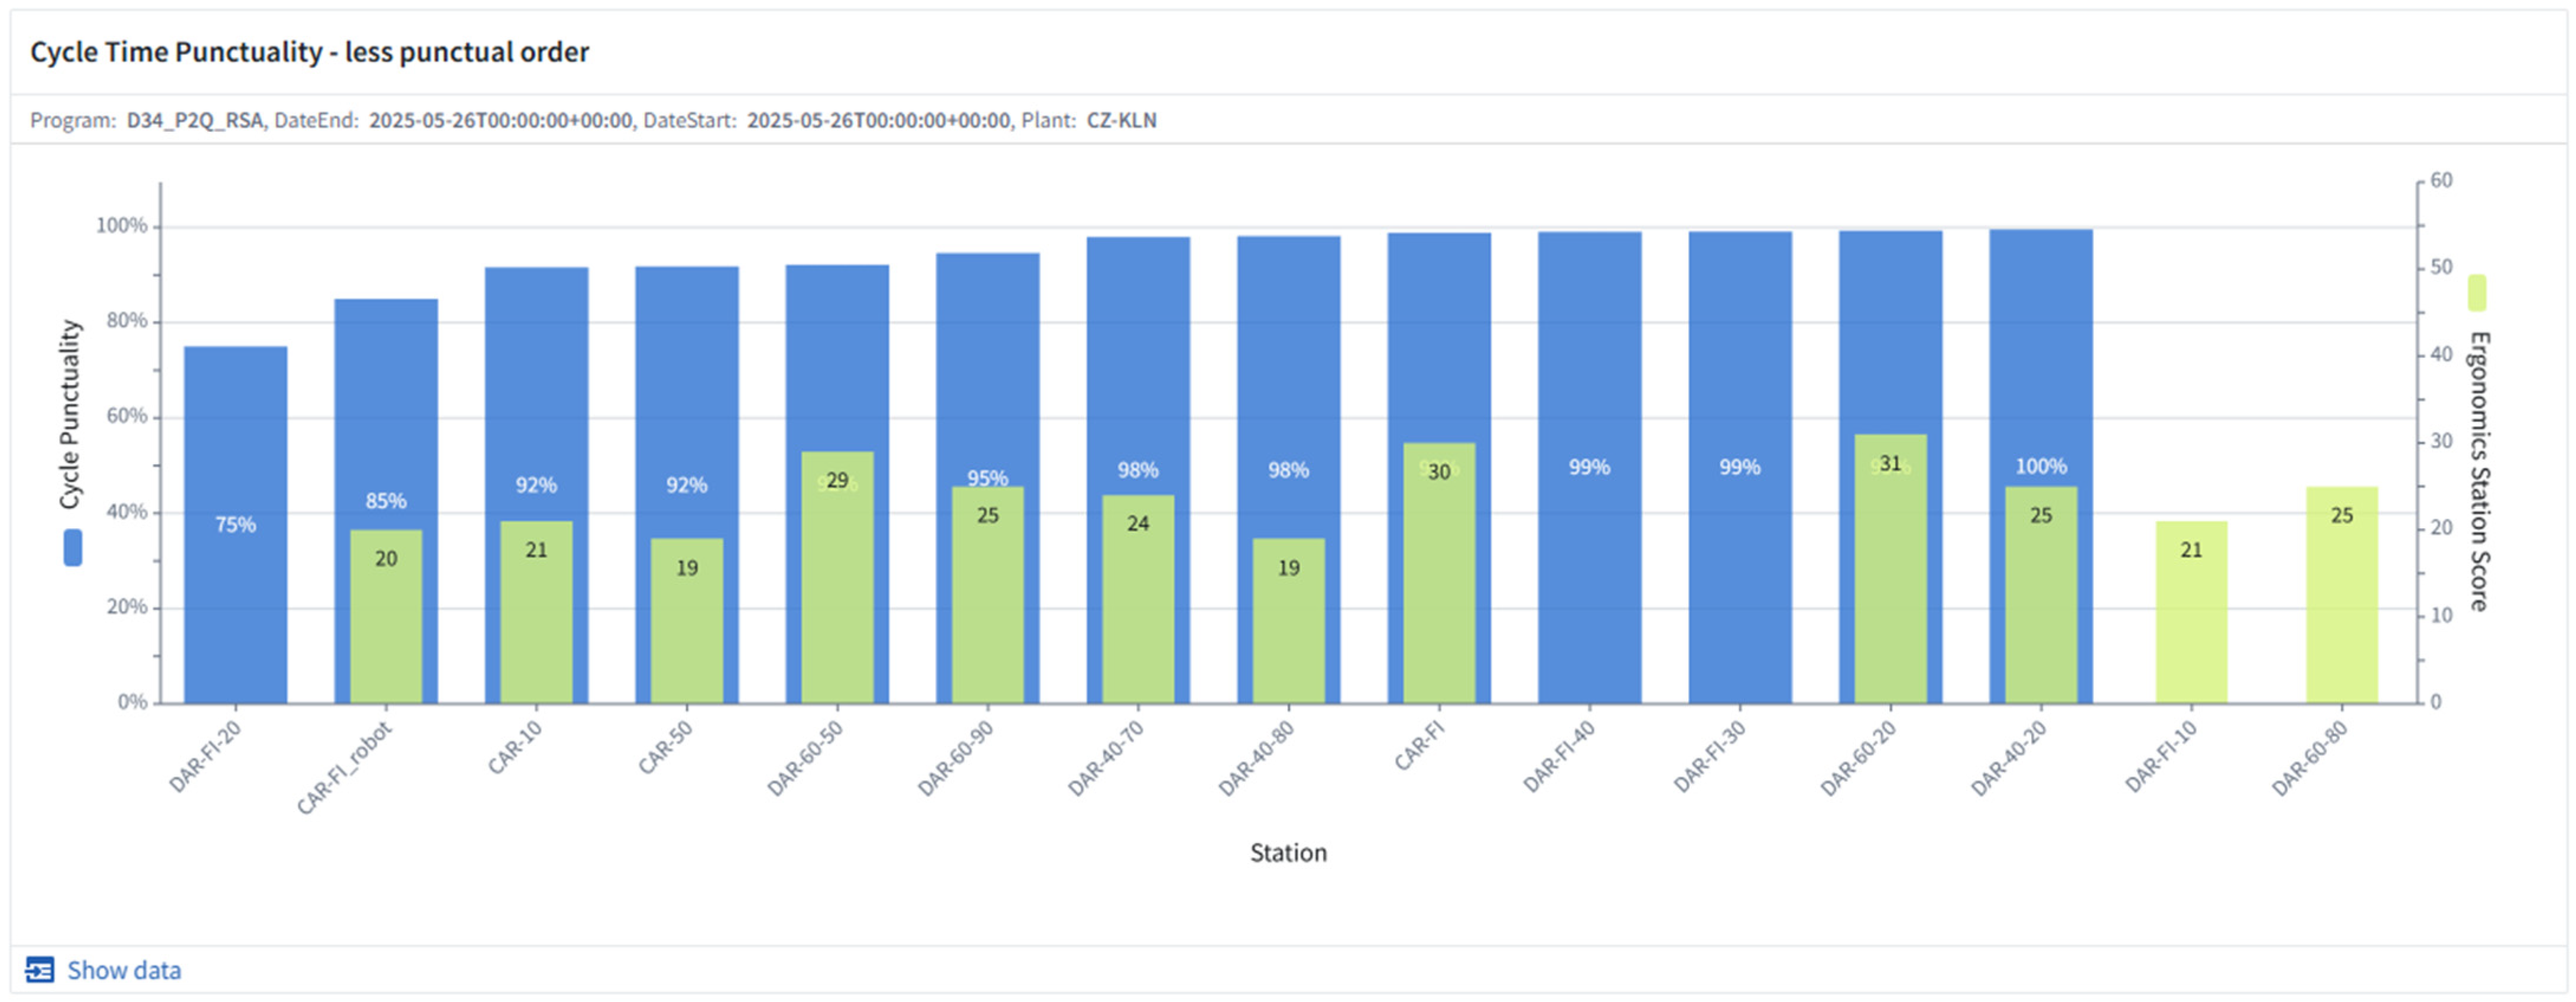
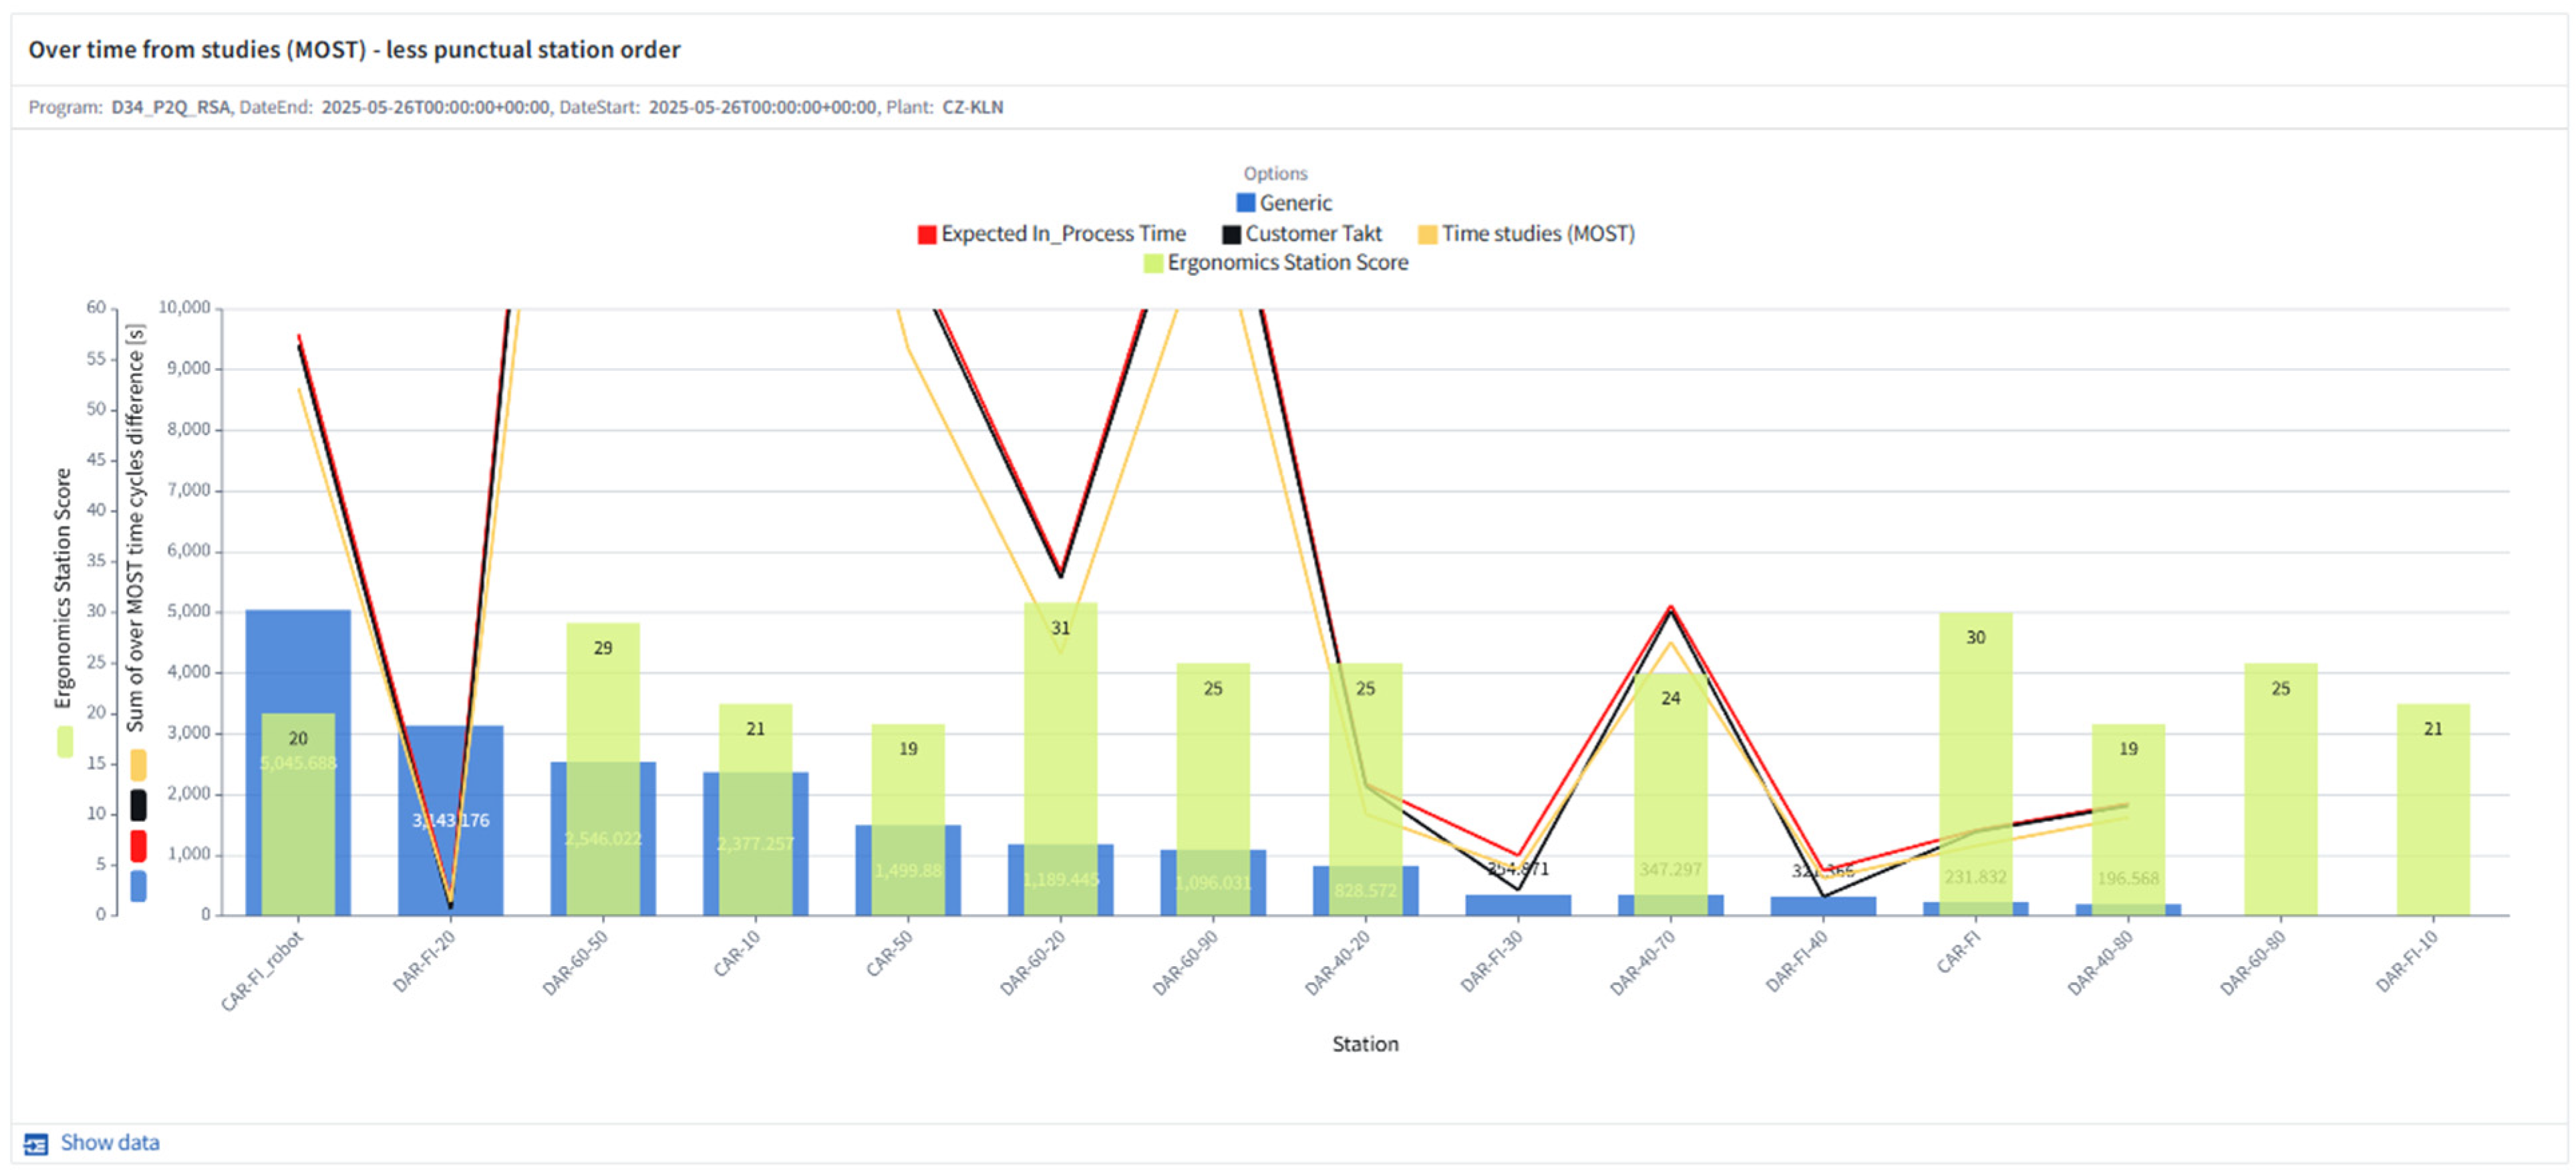
The methodological framework of this research consists of two main stages. The first stage is dedicated to analyzing the current state—including existing procedures, applications, and the overall functioning of the process—along with a description of commonly used tools. Based on this analysis and the identification of key issues, the second stage focuses on proposing a solution. This solution aims to help users understand the impact of station ergonomics scores on cycle time punctuality, by comparing actual assembly times with projected ones.
The study is based on real-world data provided by a major global automotive company specializing in car seat manufacturing.
2.1. Current State
The current state consists of two applications. The first application, which collects ergonomics data, is from VelocityEHS–Industrial Ergonomics and is referred to as HumanTech (Ann Arbor, MI, USA). The second application, called Cycle Time Deviation (CTD), was developed internally using the Palantir Foundry (version 6.440.22) platform.
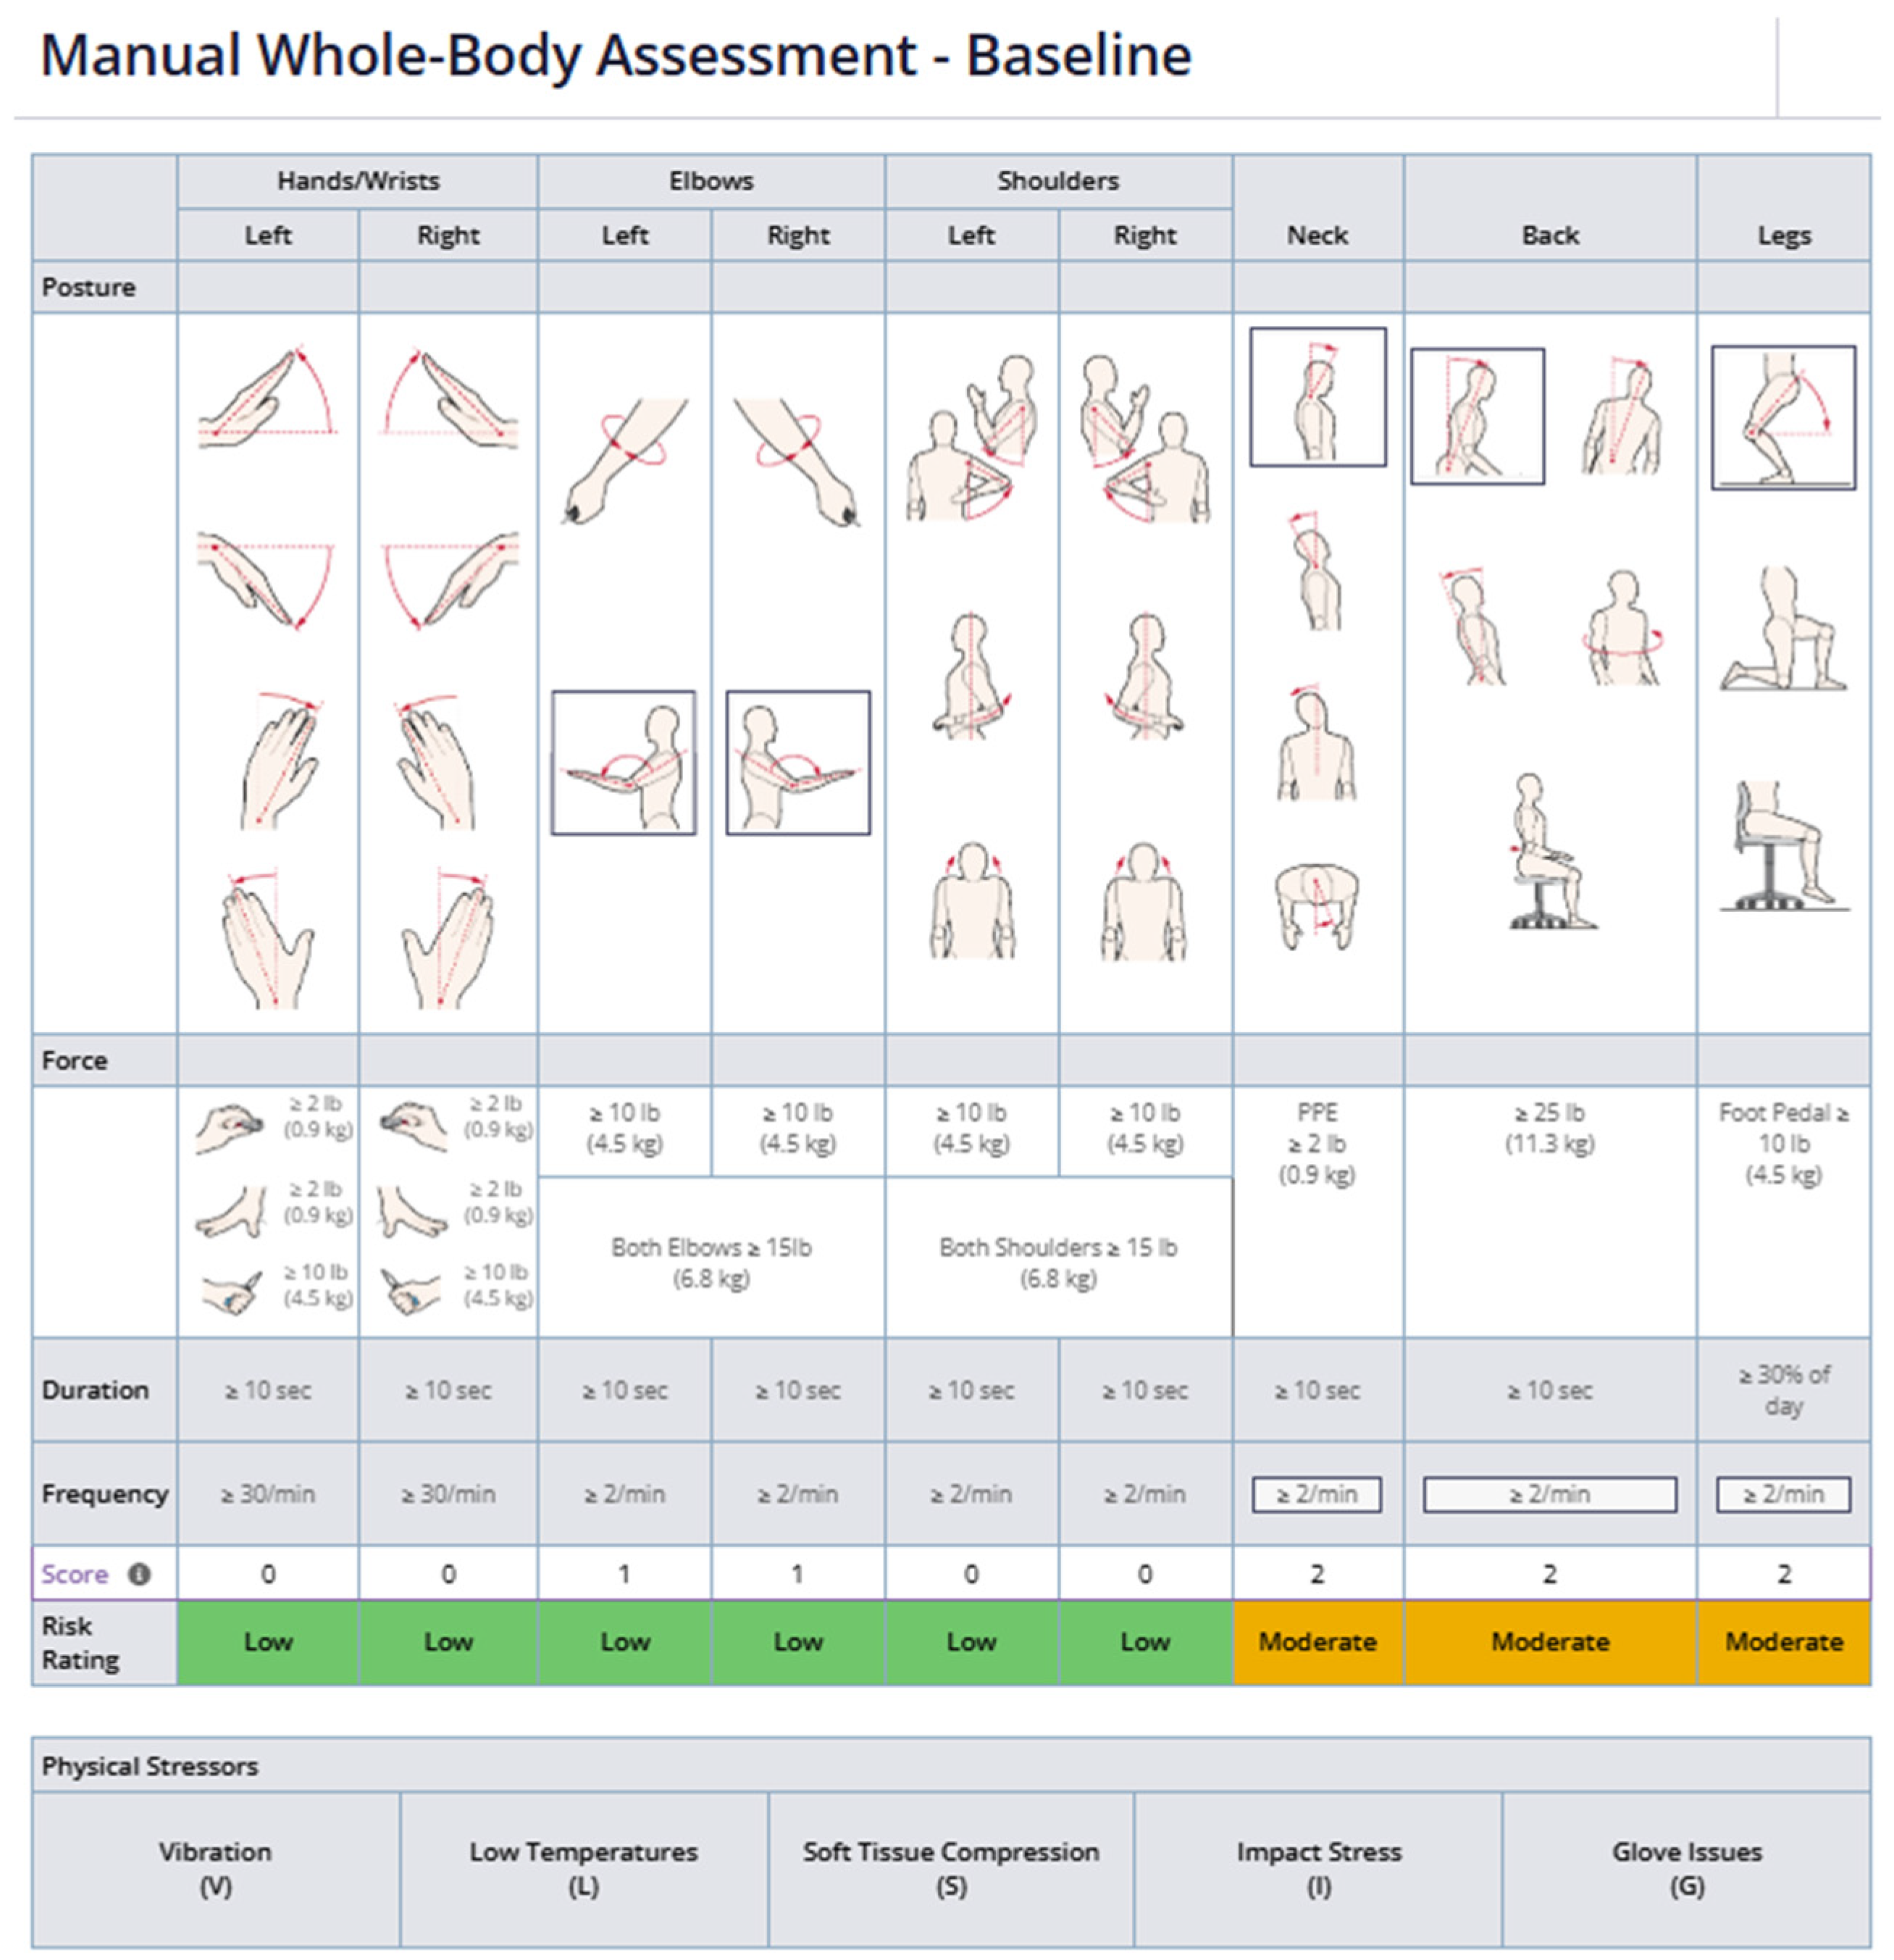
HumanTech solution: In general, the HumanTech platform is an online, web-based interface that allows users to create and manage ergonomics studies on production stations or machines. Each study can be created in one of two modes. The first mode, called Manual Whole-Body Assessment (
Figure 1), is completed based on manual input from an Environmental Health and Safety (EHS) specialist and requires precise evaluation with a focus on all activities.
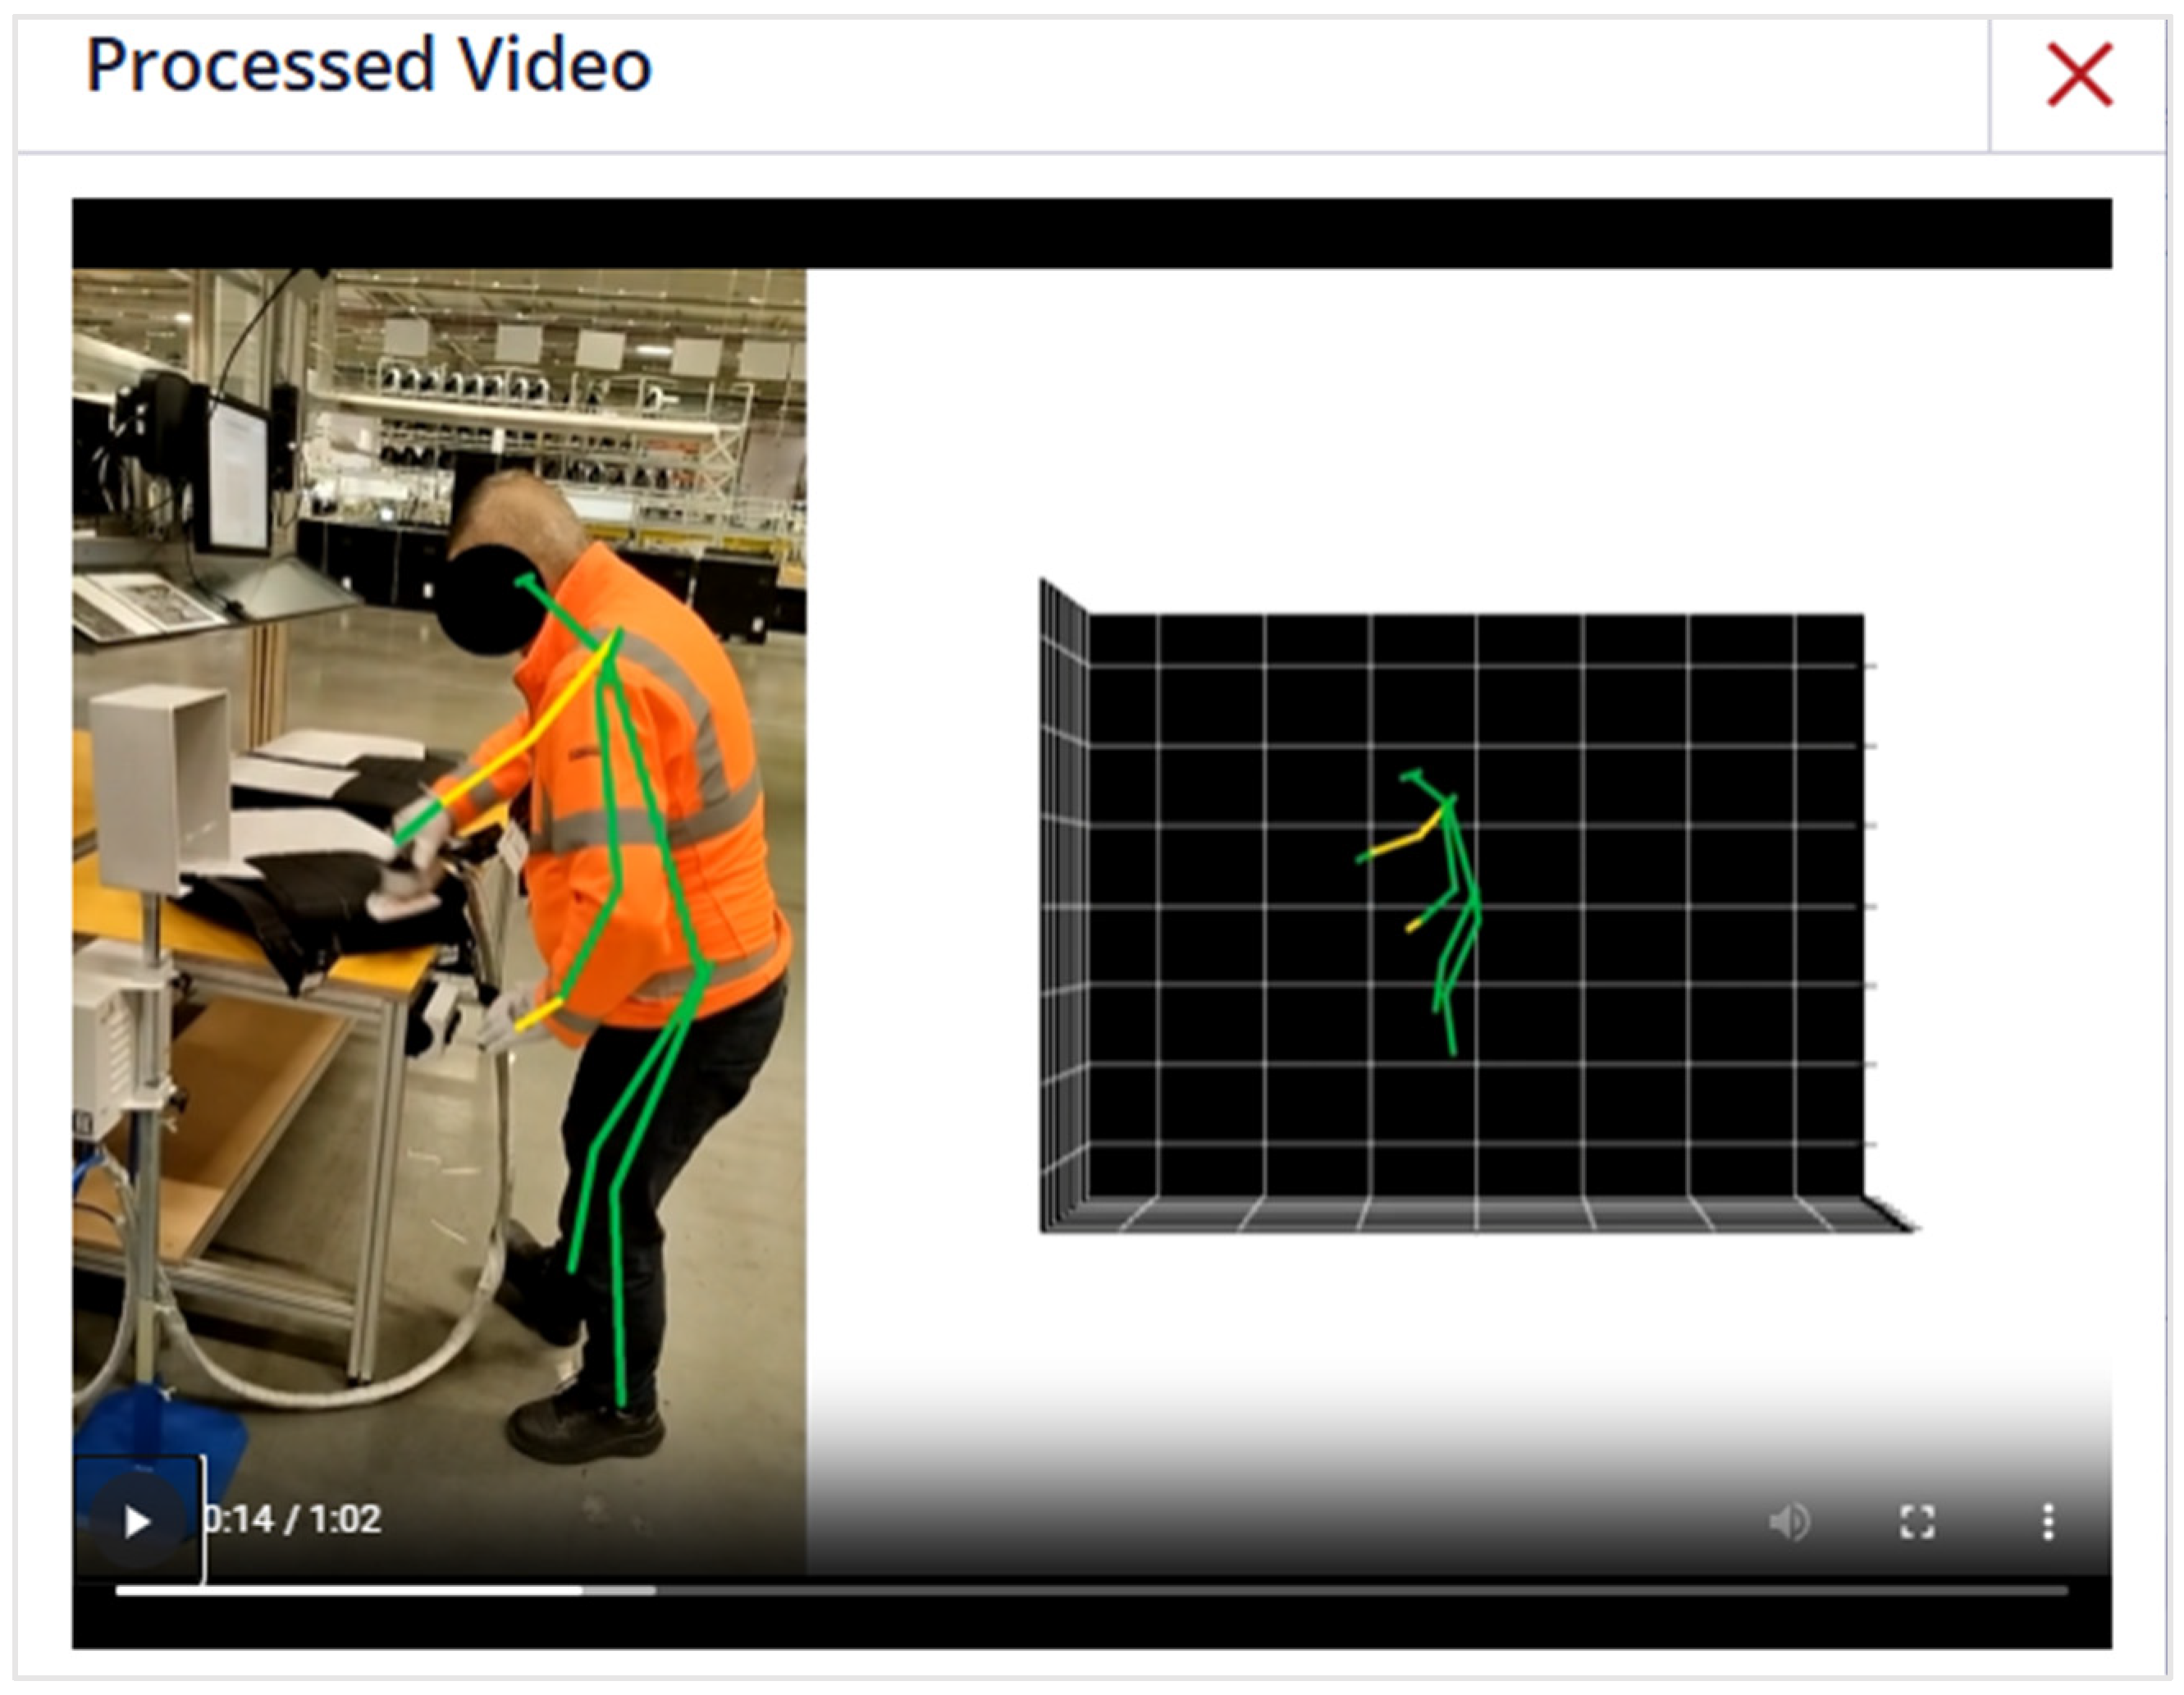
The second option for creating an ergonomics assessment, known as the Advanced Whole-Body Assessment, is automated and based on artificial intelligence (AI) analysis. All operator actions can be recorded, and the video is then uploaded to the HumanTech platform. After processing, the pre-built AI analyzes the footage and automatically categorizes all movements (
Figure 2).
All assessments can be edited at any time, including the addition of force data, vibration information, temperature conditions, impact stress factors, or glove-related issues. One of the key advantages of the AI-assisted Advanced Whole-Body Assessment over the Manual Whole-Body Assessment is the significant reduction in data-entry errors. Whereas manual input relies on an EHS specialist to record body postures and force parameters step by step, the AI pipeline automatically extracts joint angles, segment durations, and ergonomic risk factors from video frames with consistent precision. This automation minimizes human bias and transcription mistakes, ensuring higher repeatability and reliability of ergonomics scores across multiple stations and shifts. The result of each assessment is an ergonomics station score, which reflects the difficulty of the process and its impact on human health.
The score is calculated based on key ergonomic risk factors, including posture angles, force exertion, movement frequency, task duration, and environmental conditions such as vibration or temperature. These inputs are analyzed either manually by EHS specialists or automatically through AI-based motion capture, resulting in a standardized risk value for each station.
Assessments can be updated based on process improvements and are categorized into three groups—Baseline, Projected, and Follow-up—making all modifications easily trackable.
Conducting such assessments requires solid knowledge of EHS techniques and processes; therefore, all assessments should be managed by an EHS specialist.
HumanTech employs proprietary risk assessment methods, such as Baseline Risk Identification of Ergonomic Factors (BRIEF) and Integrated Design and Ergonomic Assessment (IDEA), which quantify ergonomic risk using internally developed scoring models tailored for manufacturing operations. Unlike widely used public-domain tools like Rapid Entire Body Assessment (REBA), Rapid Upper Limb Assessment (RULA), or Ovako Working Posture Analysis System (OWAS), which rely on human-observed posture-based scoring systems, HumanTech’s methodology is built into the platform (e.g., through guided postural assessment workflows and AI-driven calculations) and cannot be directly mapped to those standard metrics. Consequently, conventional benchmark comparisons with REBA/RULA/OWAS were not applicable in this implementation.
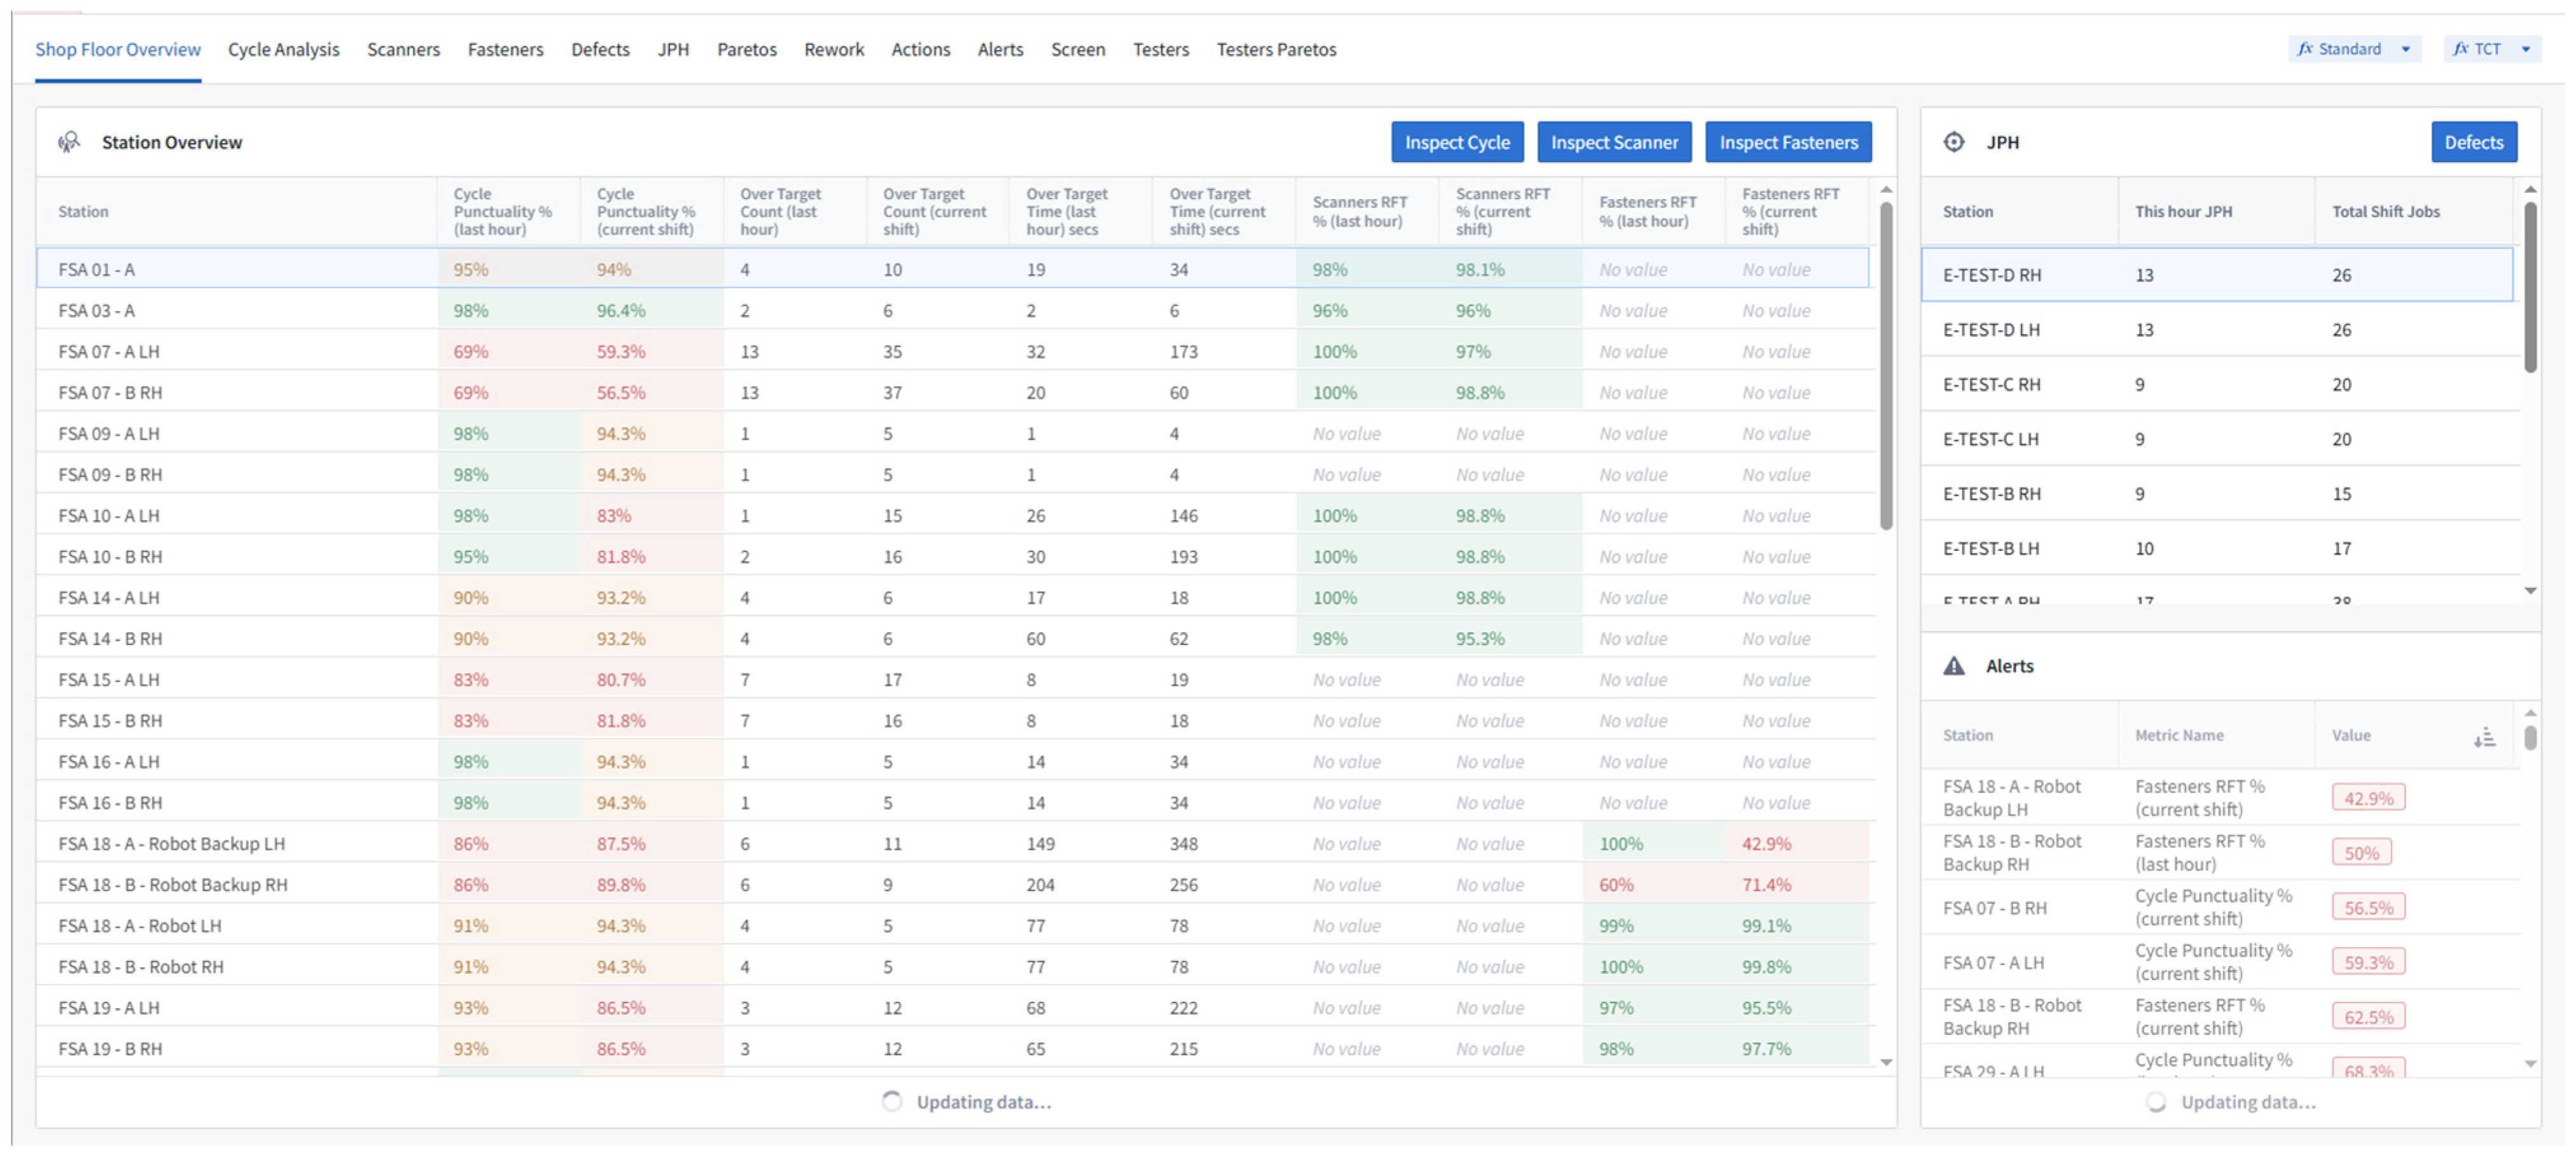
CTD application: The Cycle Time Deviation application was developed as a production monitoring tool that tracks and analyzes various types of production data—primarily cycle times and cycle punctuality, scanner Right First Time (RFT), fastener RFT, and scrap rates. All analyses are based on different time frames. The Workshop application (
Figure 3) focuses on live data that is no older than 24 h, while the Shift Report Contour analysis processes historical data up to six months old [
11]. This time range is determined by system constraints: the CTD application stores a maximum of six months of historical data due to the large volume of inputs generated across more than 300 manufacturing sites worldwide, making long-term storage impractical within the current corporate infrastructure.
Currently, to assess the impact of the station ergonomics score on cycle punctuality, it is necessary to manually compare data from two different systems. The request is to develop an automated solution that connects and analyzes all data within a single application, with the possibility to extend its functionality in the future to include additional indicators if needed.
2.2. Solution Proposal
The first step was to clearly define the development scope. Based on an analysis of customer needs, we designed the solution. In the proposed approach, all data processing and analysis will be fully automated using a cloud-based system, eliminating the need for manual comparisons.
Instead, a unified standard will be implemented and applied across all manufacturing plants, ensuring greater consistency and standardization.
The goal of the development is to analyze data displayed in the Shift Report application from the CTD project, where the ergonomics score will be overlaid onto cycle punctuality, over tact, and over most statistics.
Overlaying the ergonomics station score data onto standard CTD charts allows shop floor teams to quickly visualize whether cycle time punctuality performance at the station level could be related to the associated ergonomics station score—a quantified measure of physical burden. A higher ergonomics score may indicate difficulties in completing assembly tasks within the defined or targeted time.
Feedback from many continuous improvement teams supports this feature in the shift report. In many cases, teams have manually analyzed potential trends or causes and, in numerous projects, improved cycle time punctuality by addressing station ergonomics conditions.
Before the data are analyzed, it is necessary to establish a connection between the Palantir Foundry CTD project and the HumanTech database, as both operate on separate platforms. Since HumanTech uses a closed environment without direct access to its data, a third-party cloud solution is required to stream data to the Foundry platform. For this purpose, the SNOWFLAKE solution was chosen to establish all data connections (
Figure 4).
2.2.1. Data Sources
Data sources for both platforms can be divided into two groups: online data and manual data. The first group consists of automatically collected data from processes, referred to as online data, while the second group includes manually documented data, referred to as manual data. All data may be stored in multiple databases using various formats. These spreadsheet-like databases in their raw form are considered data sources.
Online data from the CTD application includes data directly gathered from Programmable Logic Controllers (PLCs) or other devices such as Automatic Inspection Devices (AIDs), fasteners, scanners, and other equipment used in assembly processes, which upload collected data into the corporate Manufacturing Execution System (MES).
Manual data from the CTD application can include time studies, shift calendars, and similar records. Manual data from HumanTech consists of studies manually entered by EHS specialists, where all body movements are recorded step by step. Manual data from the CTD application typically originates from industrial engineering activities, such as time studies or shift planning, and is often collected and maintained by local production teams. In contrast, manual data in HumanTech is structured within ergonomics protocols and entered by certified EHS specialists following specific corporate assessment procedures, which ensures consistency and expert-level authority over data quality. A more advanced approach involves uploading videos of whole-body operations, which are automatically evaluated by AI and segmented into spreadsheet cells with generated assessment results.
Since we are dealing with two different platforms, both use different data formats and storage logics. The CTD application and Shift Report, built using the Palantir Foundry solution, were developed to meet specific corporate needs based on data availability from the corporate MES, which collects data from multiple internal sources in specific formats. To evaluate data from these two systems—CTD Shift Report and HumanTech—we need to define proper data transformation methods and build customizable logic that can also accommodate future requirements.
2.2.2. Data Specification
During the phase of defining the development scope, a crucial aspect involves clearly specifying and defining the data requirements. This step is essential because the entire solution will depend on the accuracy and availability of these data. It is necessary to map out data lineages and design all computations in accordance with the formats and structures of the data that are accessible.
The CTD Shift Report application was originally developed to address specific corporate requirements, meaning that the data it handles are already organized in a standardized format preferred by the company. Building on this foundation, we have identified and selected multiple relevant datasets from the available data sources to be utilized in the solution (see
Table 1). These datasets form the backbone for subsequent analysis and reporting, ensuring that the system functions reliably and consistently across different manufacturing contexts.
By thoroughly defining and specifying the data at this early stage, we minimize potential integration issues and enable smoother data transformation and processing workflows throughout the project lifecycle.
Once the relevant datasets are successfully joined, transformed, and extracted, it will be possible to comprehensively describe the ergonomics assessment scores at multiple levels, including ‘Location’, ‘Station’, and ‘Advanced Tool’ (see
Figure 5). These scores will provide detailed insights into the ergonomic conditions across different production areas and tools, enabling a more precise evaluation of their impact on worker health and operational efficiency. This structured approach ensures that the analysis is grounded in integrated and harmonized data, supporting informed decision-making and targeted improvements within the manufacturing process.
For data sorting, the ‘Location’ field will serve as the primary criterion. This field is organized into six hierarchical levels, providing a structured framework for categorizing and analyzing data efficiently across different manufacturing sites and operational units (see
Table 2). By using this multi-level classification, we can ensure consistency and clarity in data management, enabling detailed tracking of ergonomics scores and other key metrics at various organizational layers. These six levels reflect the standardized organizational breakdown used across all manufacturing sites and ensure that each ergonomic assessment is accurately linked to the corresponding region, plant, department, and station in the corporate structure. This approach facilitates targeted analysis and supports better decision-making by highlighting specific areas that may require ergonomic improvements or process adjustments.
When creating new assessments, it is essential that users strictly follow the agreed-upon standard naming conventions. This consistency is vital because the naming structure plays a key role in the logic used to accurately merge and integrate data from multiple sources. Without adherence to these standards, data processing could become unreliable, leading to errors or misinterpretations in the analysis.
Implementing standardized data entry protocols was therefore a foundational step in the development of this application. By enforcing these conventions, the system ensures data integrity, facilitates seamless automation, and enables efficient data management. This approach ultimately supports accurate reporting and decision-making based on harmonized and well-structured data.
2.2.3. Data Structure
Since many of the datasets sourced from HumanTech contain essential information for application development but are not organized according to a unified standard format, it is imperative to standardize these datasets and generate the required data formats. To achieve consistency and interoperability, we will adopt the data structure and naming conventions established for the CTD application as a reference template.
To facilitate this, we will utilize the Pipeline Builder module within the Palantir Foundry platform. Pipeline Builder is a powerful tool for data integration and transformation that allows the design and automation of complex data workflows. Through this module, raw data from various HumanTech sources can be extracted and subjected to cleaning, normalization, and mapping operations to ensure the data aligns with the CTD standard format. This process includes tracking data lineage to maintain full transparency and auditability of the data sources and transformation steps.
Additionally, Pipeline Builder supports automation by enabling scheduled or event-driven workflows that process new or updated data with minimal manual intervention. The module also incorporates error handling and validation mechanisms to detect anomalies and ensure data quality before integration. By leveraging these capabilities, we ensure that the processed datasets from HumanTech become fully compatible with the CTD application’s data ecosystem, thereby supporting reliable analytics, reporting, and scalability for future needs.
2.2.4. Data Lineages
The results from ergonomics assessments conducted in HumanTech, represented as ergonomics score data, are distributed across five distinct datasets. All of these datasets require thorough cleaning and proper joining to create a unified dataset that can serve as a reliable data source for this use case. To establish and manage data lineage effectively, we utilize the Pipeline Builder within the Palantir Foundry platform.
The data lineage is built and visualized using node-based mapping, join logic tracing, and data version tracking within the Pipeline Builder tool, which allows users to audit transformations, track dataset dependencies, and verify update propagation in real time.
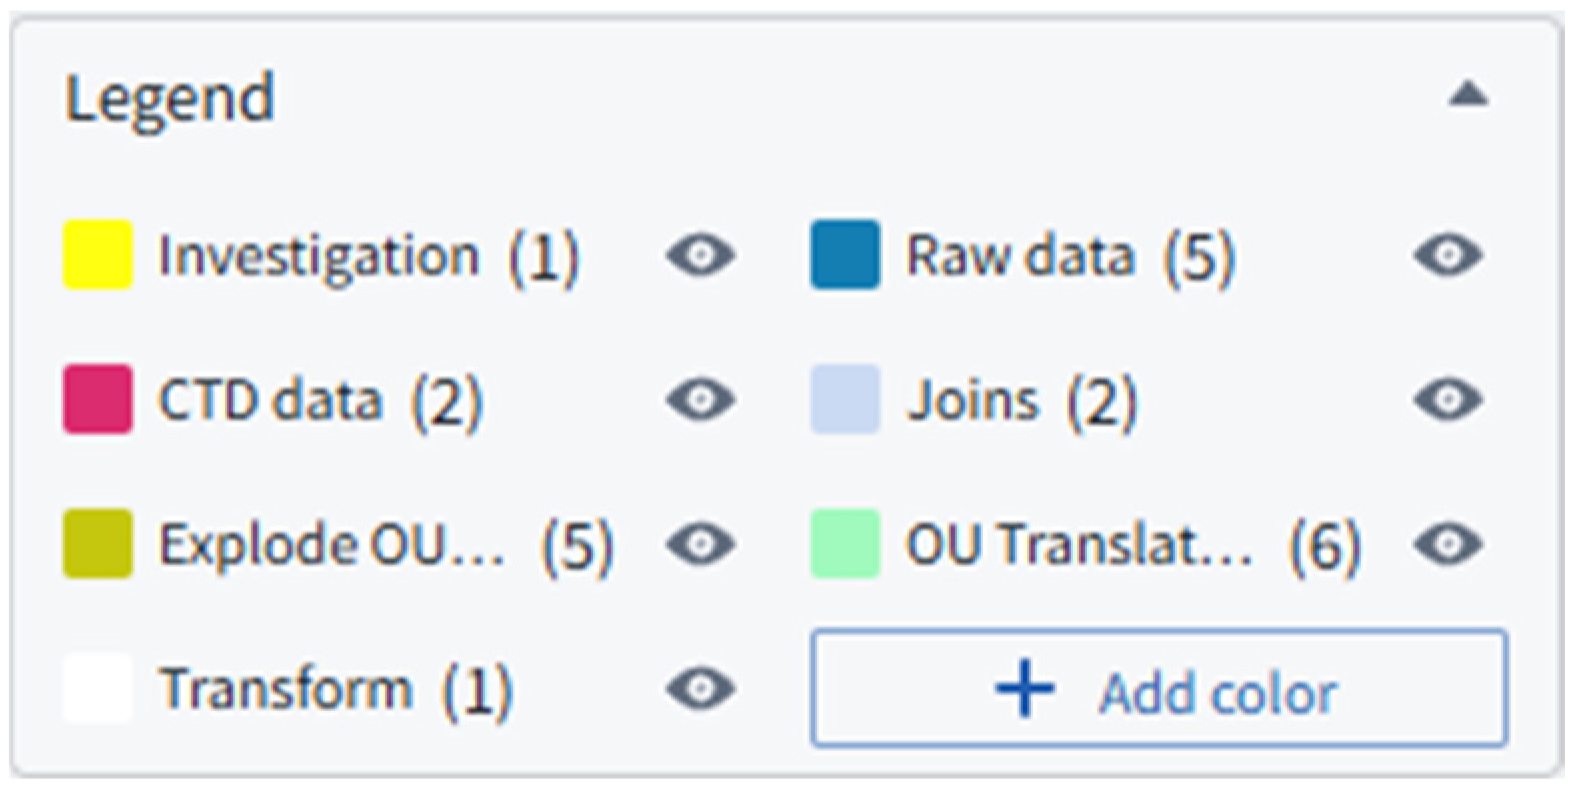
Within the Pipeline Builder interface, standard color codes are applied to each node to facilitate easier understanding of data lineage and to visually separate different segments of the data processing workflow. A legend explaining these color codes is located in the top right corner of the Pipeline Builder interface (see
Figure 6).
To create our data lineage, we begin by importing raw datasets from SNOWFLAKE, specifically JOB_INFO_VIEW, ASSESSMENT_VIEW, and ANALYSIS_TOOL_DATA_VIEW. In the initial stages, we need to join these datasets using the join function. The selected datasets can either be copied into the Pipeline Builder workspace or accessed directly from files stored within the Foundry platform.
The first join, called ‘Assessment ID join’, merges the Assessment IDs from both raw datasets. This step is crucial for linking the actual ergonomics score with the corresponding job info ID.
In the subsequent join, referred to as ‘Join actual data’, we join the datasets using ‘Job info ID’. This operation combines all three datasets and brings together ‘Previous assessment ID’ and ‘Assessment ID’. These values may change over time; when a user modifies an assessment in the HumanTech platform, the ‘Previous assessment ID’ remains constant, while the ‘Assessment ID’ updates to the latest version. This approach allows us to track historical entries while filtering out only the most recent data (see
Figure 7).
In the subsequent join operations, it is necessary to integrate the hierarchical level information sourced from the ‘OU_POSITION_VIEW’ dataset. This dataset provides detailed organizational structure data, which allows us to enrich the previously joined datasets by mapping each data entry to its corresponding organizational levels. As a result, we can assign precise numerical values representing different levels such as region, plant, department, or workstation, depending on the granularity of the data.
This process effectively “explodes” the information contained in the earlier datasets, enabling more granular analysis and reporting. By incorporating these level distinctions, we improve the ability to filter, segment, and aggregate data according to specific organizational units, thereby enhancing the overall insight into ergonomics scores and their impact across different parts of the production system (see
Figure 8).
In the next join function, we transform and map each hierarchical level into a standardized, user-friendly format that can be easily understood by all standard users (see
Figure 9). This step ensures consistency and clarity across the dataset, enabling more intuitive interpretation of the data.
To maintain uniformity, we strictly follow the naming conventions and level definitions outlined in
Table 2. By adhering to these predefined standards, we facilitate seamless integration and comparability of data across different systems and reporting tools.
In the subsequent transformation and join functions, we merge the sorted data from HumanTech with corresponding data from the CTD application. The ‘plant_mapping’ dataset plays a key role in this process by linking the assessment location data to the precise site locations within the production network. This ensures accurate geographical alignment of the data.
A similar approach is applied in the ‘station_mapping’ join, where line and station identifiers are matched and translated into clear, descriptive names. These standardized names are essential for the frontend application, enabling users to easily identify and navigate through different production lines and stations (see
Figure 10). To ensure accuracy, the mapping logic was reviewed and validated by EHS and production experts across multiple plants, using test datasets and cross-checks between station codes, location identifiers, and known ergonomic scores.
The final stage of the data lineage focuses on the last data transformations, where duplicate and null values are systematically identified and removed to ensure data quality and integrity. The resulting output is a consolidated dataset named ‘Ergo_Score,’ which is standardized according to corporate specifications.
This clean and standardized dataset serves as the foundation for overlaying station ergonomics scores within the application, enabling accurate and consistent analysis of ergonomics impact across different production stations (see
Figure 11).
During the development and testing phases of the application, we identified that certain data, such as variant combinations, were initially missing. This issue was addressed and corrected during the course of the development.
With the updated logic, the application now supports filtering multiple assessments for the same station across a variety of assembly variants. This enhancement significantly expands the functionality and usability of the application, allowing users to perform more detailed and variant-specific analyses.
2.2.5. Building Schedules for Pipeline Deployment
After creating the pipeline, it is necessary to establish periodic schedules for pipeline deployment to ensure the data is regularly refreshed, as the data in both the CTD project and HumanTech platforms are continuously updated. Without these scheduled updates, the latest data will not be reflected in the frontend applications, and computations will not be performed on the most current information.
This process can be fully automated, with pipeline deployments triggered automatically based on predefined conditions. In this case, the ‘When to build’ parameter is configured to initiate a pipeline build whenever a specific resource, such as the initial raw datasets, is updated (see
Figure 12). This scheduling mechanism guarantees that the data remains consistently up-to-date and accurate for all users.
2.2.6. Implementation into the CTD Shift Report Application
Once all datasets have been properly cleaned, sorted, and updated, they are ready for use in the Contour analysis. As part of this activity, it was requested to extend the existing charts in the Contour analysis module of the CTD Shift Report. Specifically, the charts targeted for extension were: ‘Cycle Time Punctuality—less punctual order’, ‘Over takt time—less punctual station order’, and ‘Over time from studies (MOST)—less punctual station order’, where CTD data are overlaid with the ergonomics score.
Since the implementation procedure is the same for all charts, this demonstration will focus on the ‘Over takt time—less punctual station order’ chart.
The first step is to open the Contour analysis application and navigate to the folder or path where the chart is located. Once the chart is found, open its settings and add an overlay layer (see
Figure 13).
After adding the new overlay, it is necessary to change the dataset by selecting the ‘Ergo_score’ dataset from the data source project. Once the overlay is created and the dataset selected, the next step is to configure the overlay parameters.
First, select the chart type as ‘Vertical Bar Chart’. Set the x-axis to ‘station_name_frontend’ and the y-axis to ‘SCORE_new’ with the option ‘Exact Values’. In the options menu, set the segmenting method to ‘Grouped’. After the chart is computed and saved, the initial data visualization will be displayed.
In the formatting parameters, rename the y-axis label from ‘SCORE_new’ to ‘Ergonomics Station Score’ and adjust the color to the preferred scheme.
2.2.7. Issues Detected During Implementation
The main obstacles to standardization were related to data entry within the HumanTech platform. We identified issues with the insertion of data according to our specified levels—the six levels outlined in
Table 2. Although this procedure was defined long ago, users frequently did not adhere to the standardized data entry protocols.
Another standardization challenge involved the use of obsolete assessments or reliance on manual analysis rather than employing the Advanced Tool, which is defined as the corporate standard. The use of the Advanced Tool significantly reduces human error in selecting body movements or angles and ensures that no important movements are overlooked during the assessment.
Additionally, problems with the completeness of assessments were detected. Many station assessments were either missing entirely or left incomplete, with missing data such as force measurements or other key parameters. Now that the data are consistently available on the platform, there is considerable potential for deeper investigations and enhanced analysis. Furthermore, the developed solution enables tracking of assessments on the same station, segmented by different assembly variants, providing more granular insights.
