1. Introduction
As the era of carbon neutrality unfolds, it is increasingly vital to establish power systems primarily fueled by renewable energy to meet the goals of carbon neutrality and peak carbon emissions. Consequently, effective power system planning plays a critical role in sustainable development strategies [
1,
2]. Given the rapid transformation in the energy sector, traditional power grid planning and operational methods face unprecedented challenges. On the one hand, the unpredictable and fluctuating nature of renewable energy generation creates new demands for power system planning [
3,
4]. On the other hand, the widespread adoption of renewable energy raises the complexity of both planning and operational processes. Traditional planning approaches are insufficient to ensure the necessary flexibility and stability of the system under the variability of renewable energy [
5,
6,
7]. In this context, energy storage emerges as a high-quality, flexible resource capable of effectively increasing renewable energy consumption. Previous studies indicated that the optimal site selection and sizing of renewable energy sources and energy storage significantly influence the economic operation of power systems and market profitability. Therefore, systematically studying coordinated planning methods for wind, solar, and storage resources has great significance for improving the system flexibility and economic performance.
In the past several years, a large number of studies have focused on the planning and scheduling optimization of wind energy, solar energy, and energy storage systems [
8,
9,
10]. These studies mainly consider different objective functions from various perspectives, such as the investment costs of distributed energy resources, environmental economic benefits, harmful gas emissions, as well as the reduction in voltage fluctuations and network losses caused by the integration of distributed energy sources into the distribution grid [
11,
12]. Reference [
13] proposed a multi-objective optimization method for optimizing the joint scheduling of wind and solar energy, focusing on solving the load balancing issues caused by the volatility of renewable energy. Reference [
14] employed genetic algorithms to optimize the capacity configuration of distributed generation systems, improving the system economy and stability by considering the output uncertainty of wind energy and photovoltaics. While these methods are effective, they mostly rely on traditional heuristic algorithms, which are prone to local optima and have a high computational complexity. Reference [
15] used a two-step scheduling and control strategy to configure the power and capacity of energy storage systems connected to the grid with distributed energy resources. Reference [
16] established a multi-objective planning model considering distribution network losses and load balancing and used a fuzzy ant colony algorithm to plan the distribution network, determining the capacity and location of distributed photovoltaics and reactive power compensators, ultimately improving the voltage quality and reducing network losses. Reference [
17] aimed at minimizing distribution network losses and based on the time-series characteristics of the distributed energy output power, employed an improved particle swarm optimization algorithm to determine the site and capacity of distributed energy resources connected to the distribution network. Reference [
18] targeted the investment cost of the distributed energy resource integration, electricity purchase cost, network loss costs, and voltage enhancement indices, using the Analytic Hierarchy Process (AHP) for multi-objective normalization and solving it with an improved seagull optimization algorithm. From the above analysis, it is evident that, whether single-objective or multi-objective, the existing literature primarily focuses on studying the impact of the distributed energy integration on the distribution grid and then determining the location and capacity of distributed energy sources connected to the distribution grid. However, this approach still lacks an effective operational optimization analysis that characterizes and extracts typical daily scenario sets for the entire year at the planning-year time scale, and it lacks a systematic model that balances the grid’s economy, flexibility, and coordination.
Considering the coordinated optimization of the source–network–load–storage (SNLS) method and the correlation of the renewable energy output during the planning process can increase the proportion of the renewable energy absorption [
19,
20,
21]. Reference [
22] considered the uncertainty of the source–load in active distribution networks with energy storage, aiming to maximize the photovoltaic (PV) integration capacity, and established a two-stage robust optimization model for solving the problem. Reference [
23] established a bi-level optimization model based on time-of-use electricity pricing, aiming to maximize the consumption rate of distributed energy sources and minimize voltage deviation. The upper layer focuses on the site selection and capacity configuration of distributed energy sources, while the lower layer considers the operation of energy storage devices. The integration of both layers achieves the coordinated planning of distributed energy sources and energy storage. By conducting an in-depth study on the site selection and capacity configuration planning for distributed energy sources and energy storage systems connected to the distribution network, the adverse effects of the high penetration of distributed energy sources on the distribution network can be effectively alleviated. The planning and operation of the distribution network involve multiple decision variables, and the choice of the solution method has a significant impact on the planning scheme. Reference [
24] used a nested two-layer iterative hybrid particle swarm algorithm to solve the site selection and capacity configuration of the renewable energy sources and energy storage in the distribution network. Reference [
25] applied genetic algorithms to optimize the location and scale of distributed energy sources. Although it evaluated the overall economic performance to measure the effectiveness of network planning with distributed energy sources, it did not sufficiently consider the investment and operation costs of distributed energy sources in the objective function, which is not conducive to planners in configuring distributed energy sources based on the actual conditions of the grid. Reference [
26] established a multi-objective mathematical model considering investment benefits, network losses, and voltage stability and used particle swarm optimization to optimize distribution network planning. Reference [
27] considered the depth of the charge and discharge of batteries, as well as economic, environmental, and reliability factors in the multi-objective function, using the cuckoo algorithm to optimize the configuration of distributed energy sources. However, it did not consider the dynamic process of energy storage within a single day, and the impact on the site selection and sizing of renewable energy stations has not been deeply studied. In addition, the algorithm used in the solution process has a slow convergence speed and long fitting time in network training. During the optimization process, the algorithm may stagnate at local optimal solutions, thus failing to ensure that the final solution is globally optimal. Although various optimization techniques have been applied to energy system planning, these methods are often limited by their slow convergence and a tendency to fall into local optimal solutions, making it difficult to achieve global optimality in large-scale systems.
To address the planning and operation issues of integrating renewable energy generation into distribution networks, this paper proposes a coordinated planning and operation optimization method for distributed generation and energy storage based on an improved bat algorithm. To validate the feasibility and effectiveness of the proposed bi-level optimization model, the IEEE 33-node standard distribution system is used as the test platform. This system is widely used in power dispatch and distributed energy optimization research, featuring a typical radial structure, a moderate node density, and diverse load characteristics. It effectively reflects the operational characteristics of the energy storage–photovoltaic–grid interaction in medium- and low-voltage distribution networks, making it an ideal benchmark for the multi-level optimization algorithm. The main contributions are as follows:
(1) A bi-level optimization model for the joint planning of wind, solar, and energy storage has been established. The upper-level model, from the perspective of the investment entity, aims to maximize returns by reasonably selecting sites and determining capacities for renewable energy stations and energy storage devices. The lower-level model seeks to obtain the optimal wind and solar curtailment, as well as network loss costs, under the distributed generation and energy storage system planning scheme from the upper level, coordinating the output distribution of renewable energy units and energy storage systems to ensure the coordinated operation of the system.
(2) A chaotic mapping technique is used to optimize the pulse frequency, pulse amplitude, and inertia weight of bat individuals. This improves the global search capability of the bat algorithm and prevents the algorithm from falling into local optima during the iteration process, thereby affecting the global results.
(3) The Levy flight strategy is applied to optimize the bat algorithm, expanding the search space. This effectively enhances the optimization performance in high-dimensional spaces, improving the algorithm’s rapid convergence and solution accuracy.
This paper is organized as follows:
Section 2 introduces the bi-level optimization approach for integrating wind energy, solar energy, and storage.
Section 3 outlines the solution technique based on the improved bat algorithm.
Section 4 provides an in-depth simulation analysis and validation. The conclusions are presented in
Section 5.
3. Optimized Model Solution Utilizing the Improved Bat Algorithm
The bi-level optimization model proposed in this paper decomposes investment decisions from the system operation. The coordinated planning and operational optimization are achieved through the interaction between the upper and lower levels. At the strategic level, investment choices are centered around economic optimization, determining the construction schemes for distributed generation units and the configuration plans for energy storage systems. At the lower level, the optimal wind curtailment, solar curtailment, and network losses are computed based on the planning configurations provided by the upper level. Additionally, the power dispatch between the renewable generation and storage is coordinated to ensure a stable and reliable system operation. Meanwhile, the lower tier provides insights on generation dispatch outcomes to inform adjustments in the higher-level objectives and constraints. To balance the structural characteristics of the model’s layers and the solution efficiency, this paper adopts a hybrid optimization framework. The upper layer addresses the capacity investment decision problem, which has convexity and a linear structure and is solved using the CPLEX solver to obtain the global optimal solution. The lower layer focuses on power flow scheduling and energy storage control, involving nonlinear objectives and variable coupling, and utilizes the improved bat algorithm (IBA) for the swarm intelligence search. The upper and lower layers achieve coordinated optimization through iterative feedback, ensuring solution accuracy, robustness, and computational efficiency.
The bat algorithm obtains the optimal solution by iteratively updating the frequency, velocity, pulse emission rate, and loudness of each bat individual. In this algorithm, the flight speed is determined by the pulse frequency used in the search process, while the probability of accepting a new position is influenced by both the pulse loudness and emission rate.
In the
D-dimensional search space, the position
and velocity
update formulas for bat
i in the
t-th iteration are as follows:
where
is the random factor uniformly distributed in the interval (0,1);
and
represent the velocity of the
i-th bat at iterations
t − 1 and
t, respectively;
and
denote the position of the
i-th bat at iterations
t − 1 and
t, respectively; and
and
denote the upper and lower bounds of pulse frequency.
With increasing iterations in the standard bat algorithm, individual differences within the population progressively reduce, leading to a decline in diversity, which ultimately converges to zero. To address this limitation, chaotic mapping is adopted in this study to initialize the population, thereby improving the coverage of the initial solution space. Furthermore, the algorithm is enhanced through adaptive step-size updates and the introduction of the inverse cumulative distribution function of the Cauchy mutation. The proposed improvement strategies are detailed as follows:
3.1. Optimization of Bat Individuals’ Pulse Frequency and Loudness Using Chaotic Mapping
To enhance the global optimization capability of the bat algorithm, this study utilizes the advantages of chaotic mapping, specifically its non-repetitiveness, ergodicity, and hybrid characteristics. A sine chaotic map is adopted to optimize the pulse rate and intensity of the bat agents. The update rules for the pulse rate and intensity of each bat are given below:
where
represents the pulse rate of bat
i;
represents the pulse intensity of bat
i; and
is the control parameter used in the chaotic mapping process.
3.2. Introduction of Chaotic Inertia Weight
During the iterative process, the bat algorithm is prone to becoming trapped in local optima, which often prevents it from accurately identifying the global optimum. To overcome this challenge, a chaotic inertia weight strategy is proposed in this paper to enhance the original velocity update mechanism of the bat algorithm. By incorporating chaotic inertia weight, the algorithm’s capacity to avoid local optima is enhanced, thereby enhancing the global search performance. The chaotic inertia weight generated at each iteration is expressed as follows:
where
and
denote the upper and lower bounds of the inertia weight, respectively; Maxiter represents the total number of iterations; and iter refers to the current iteration.
In this study, the chaotic inertia weight strategy is integrated into the velocity update equation. During each iteration, the chaotic inertia weight is computed and applied to enhance the dynamic adjustment of the bat’s velocity. The velocity update equation incorporating the chaotic inertia weight is expressed as follows:
3.3. Levy Flight Strategy
The Levy flight introduces large, sporadic jumps during the search process, with frequent and abrupt changes in direction. This behavior helps individuals avoid becoming trapped in local optima and expands the overall search space. As a result, the optimization performance in high-dimensional spaces is significantly improved, thereby enhancing the overall effectiveness of the algorithm. Therefore, in this study, the bat algorithm is improved by incorporating the stochastic walk characteristics of Levy flight. The position update formula for each bat individual after applying the Levy flight strategy is expressed as follows:
where
denotes the Levy random walk path;
is the scaling parameter; and
represents the Gamma function. The flowchart of the IBA-based double-layer model is as shown in
Figure 1.
4. Simulation Analysis
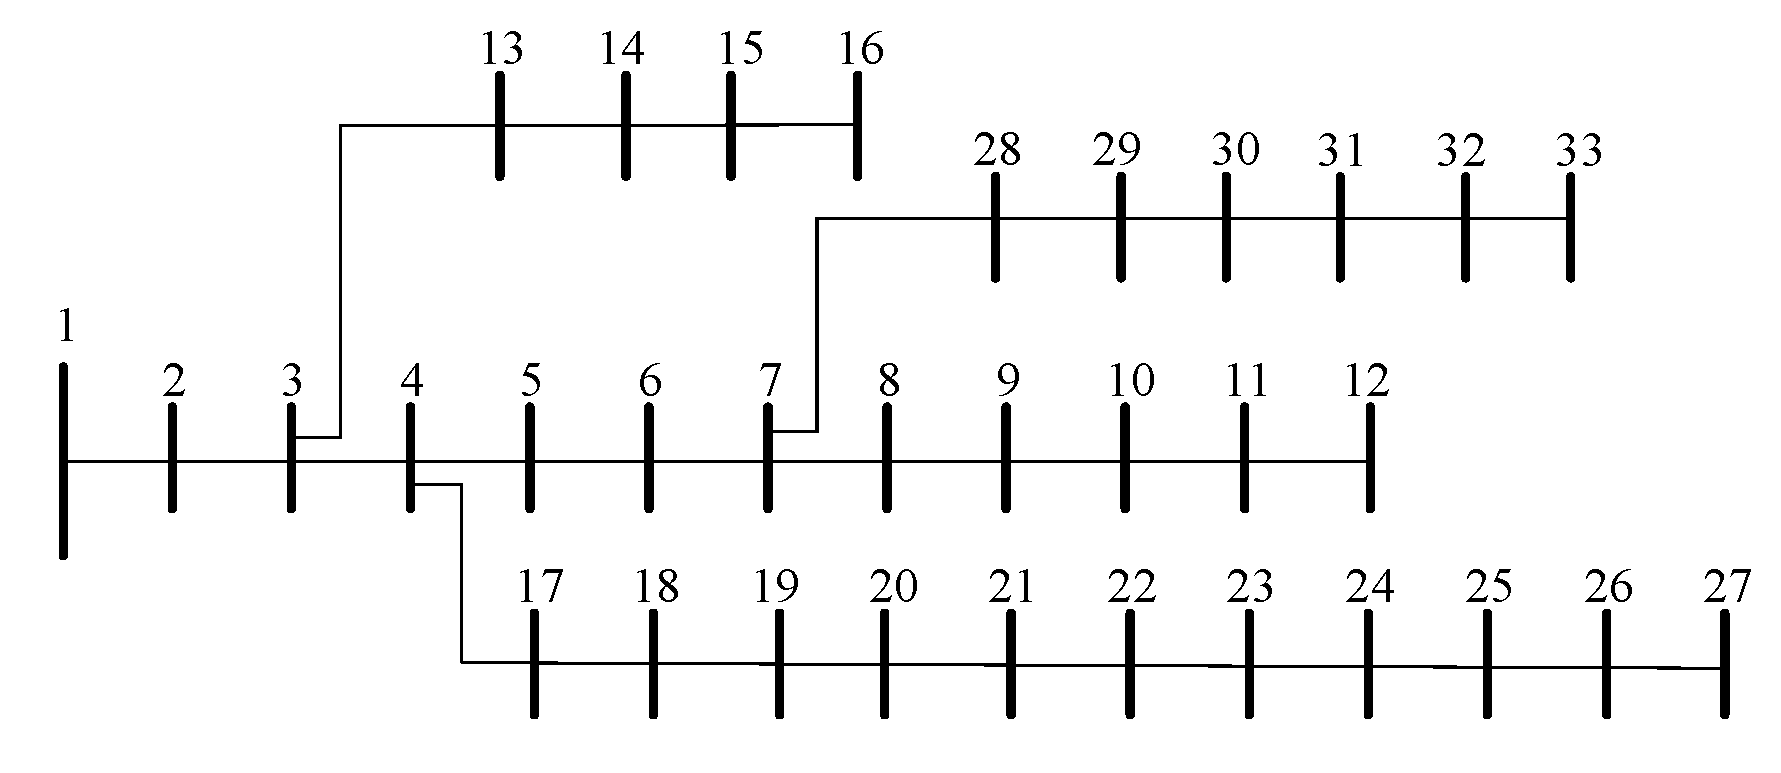
To verify the validity of the proposed model, a simulation analysis was conducted using the IEEE 33-bus test system [
28], whose topology is illustrated in
Figure 2. The parameters of the energy storage system and distributed generation units are provided in
Table 1 and
Table 2, respectively. The electricity price profile is shown in
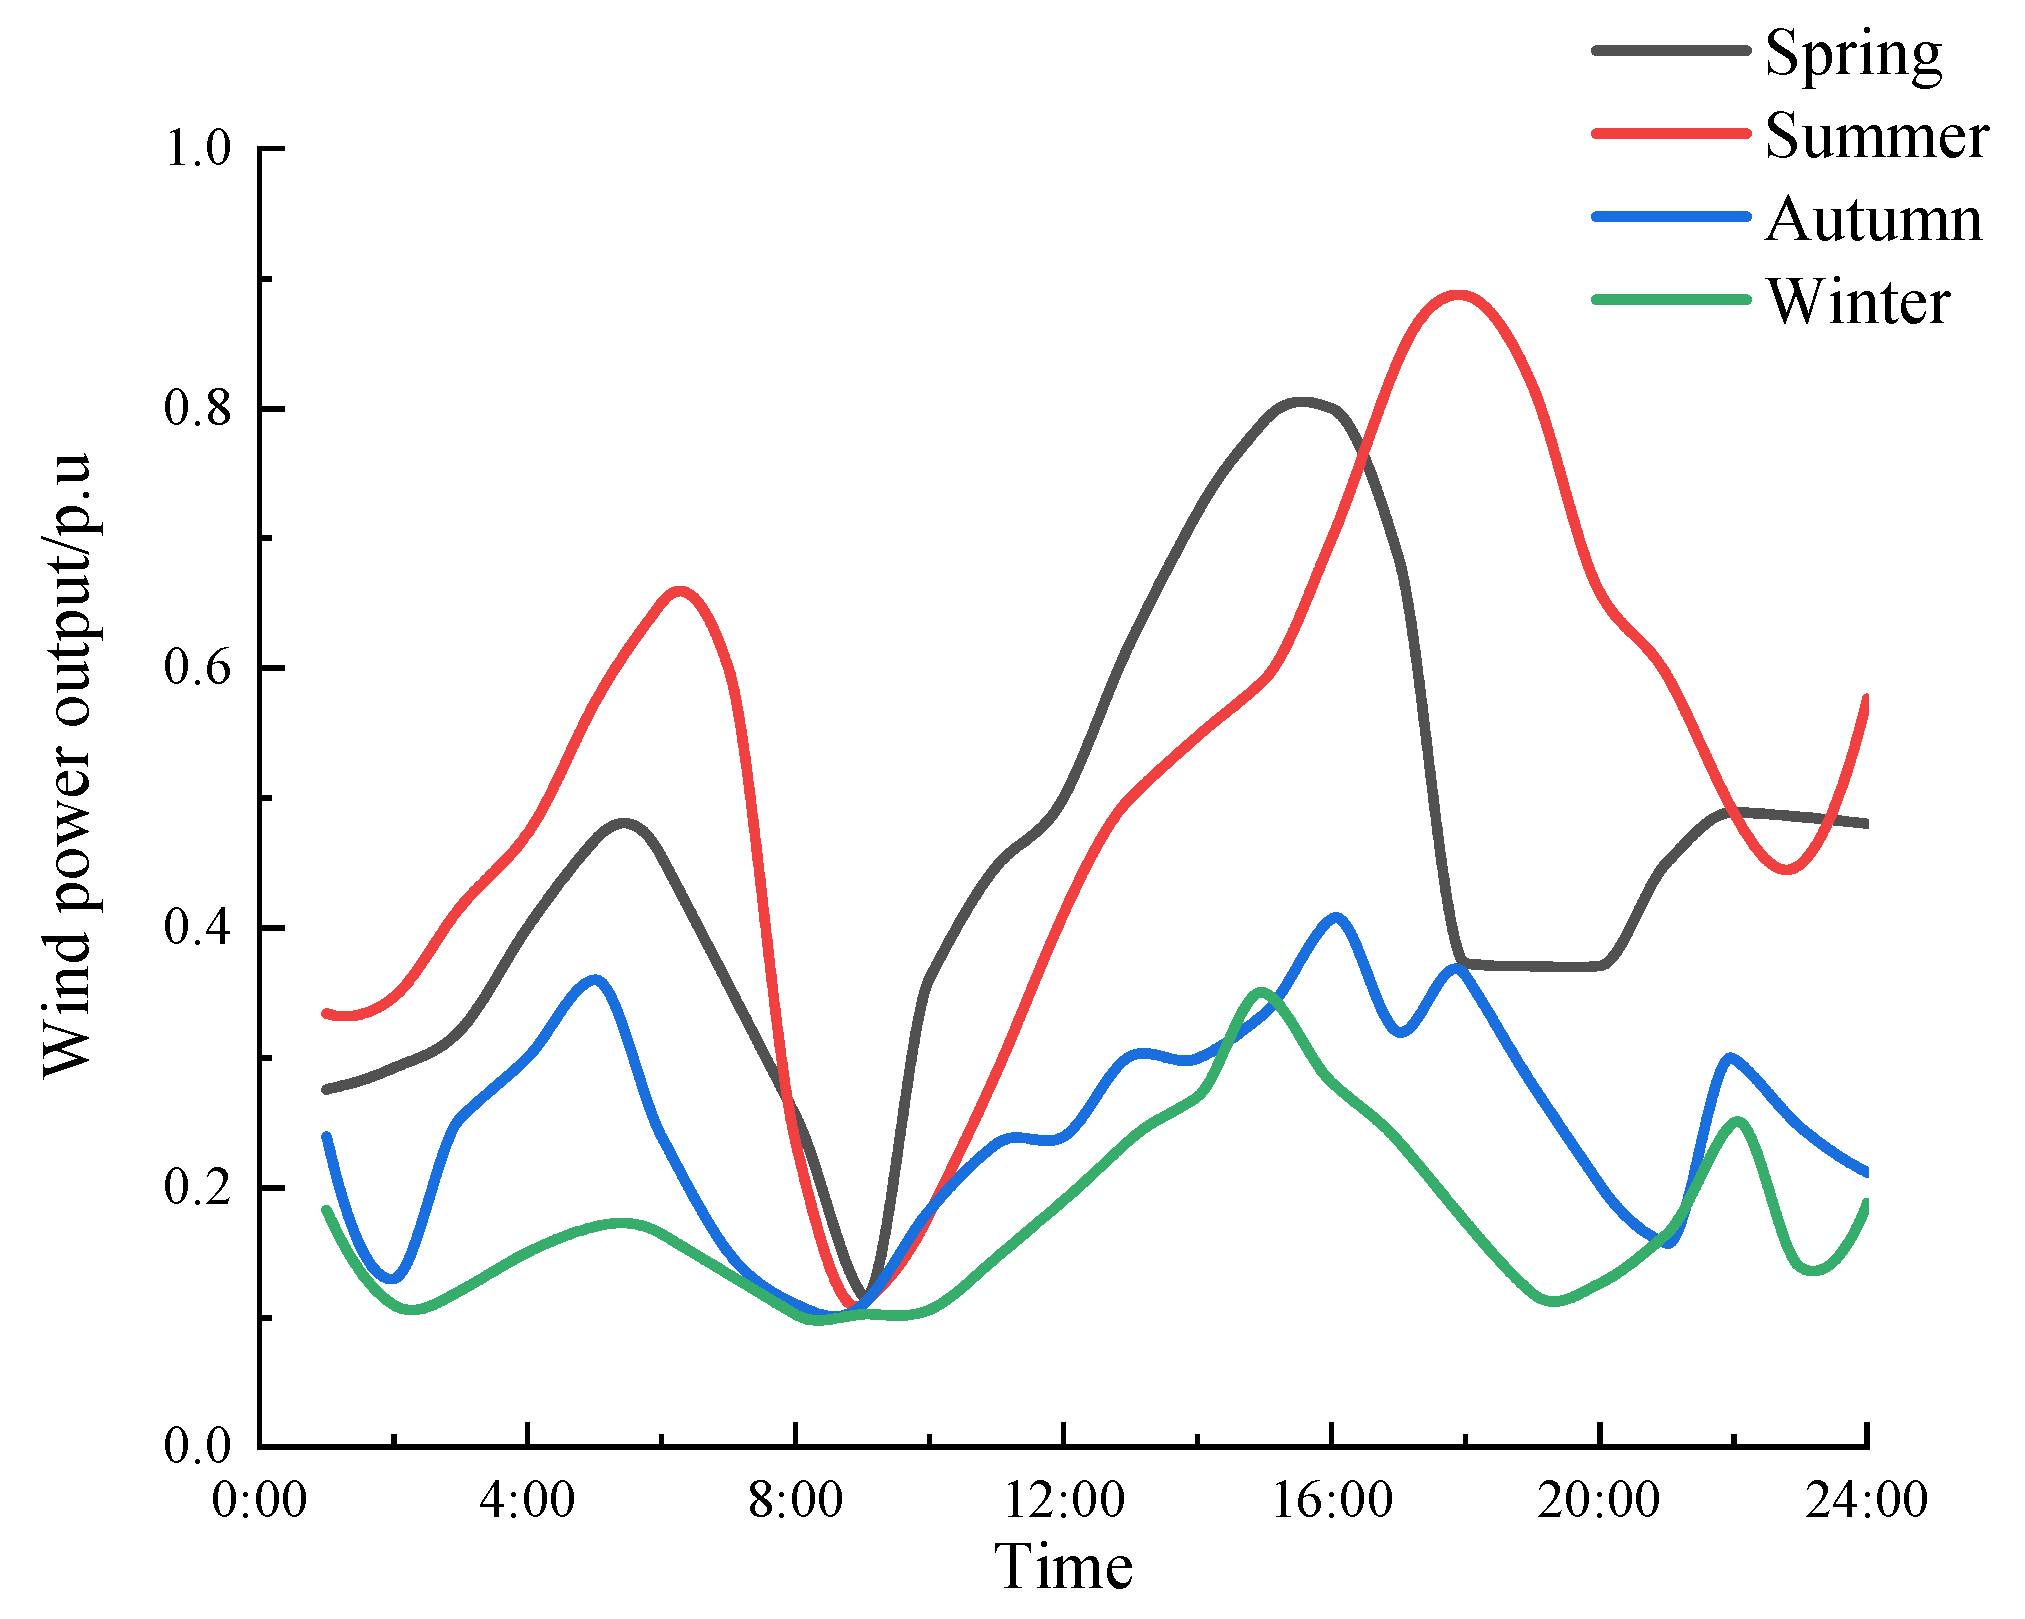
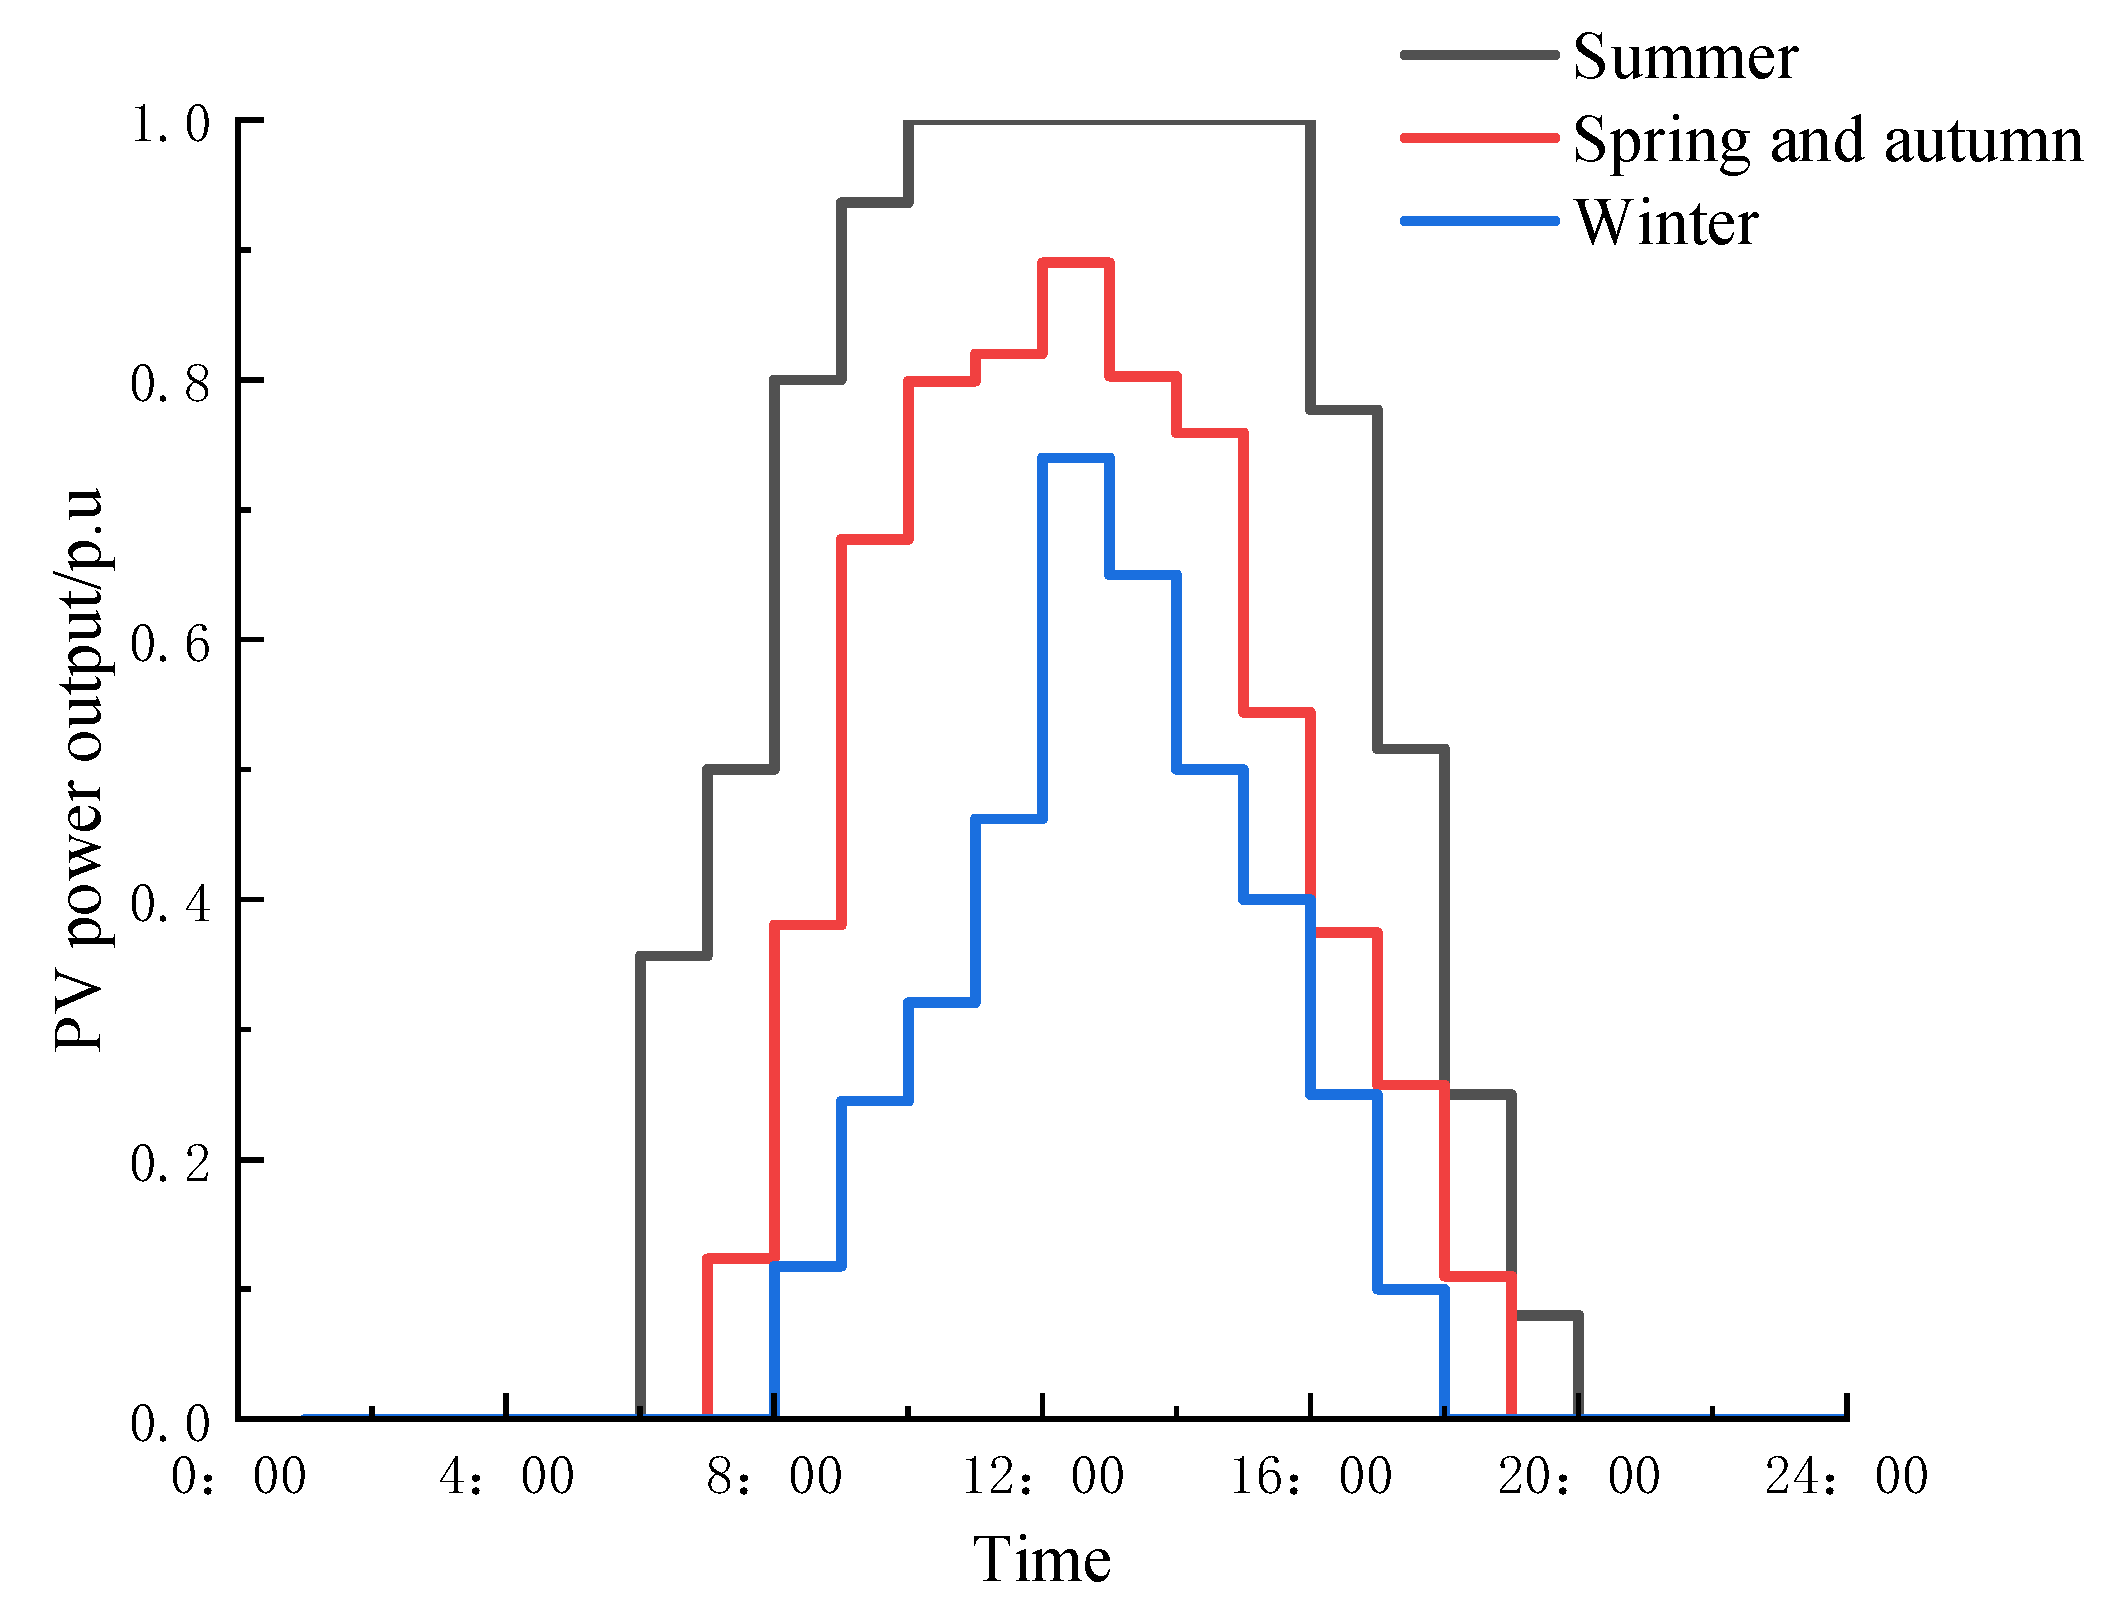
Figure 3. To accurately reflect the fluctuation characteristics of the renewable energy output, the typical daily output curves of the wind power and photovoltaic systems in different seasons are shown in
Figure 4 and
Figure 5, respectively.
Figure 4 illustrates the significant seasonal variation in the wind power daily output, with a stable and high output in winter and spring, while the output becomes more volatile in summer.
Figure 5 presents the typical bell-shaped daily output curve of the photovoltaic generation, with the peak in summer being the highest and the lowest in winter. These curves serve as the input basis for the simulation model, driving the dynamic simulation of energy storage scheduling, load balancing, and energy trading mechanisms. During the simulation, various energy storage configuration schemes were tested. The iteration process was terminated when the relative error of the upper-level objective function between two consecutive iterations was less than 0.5%. The economic performance and system operation under different configuration schemes were analyzed.
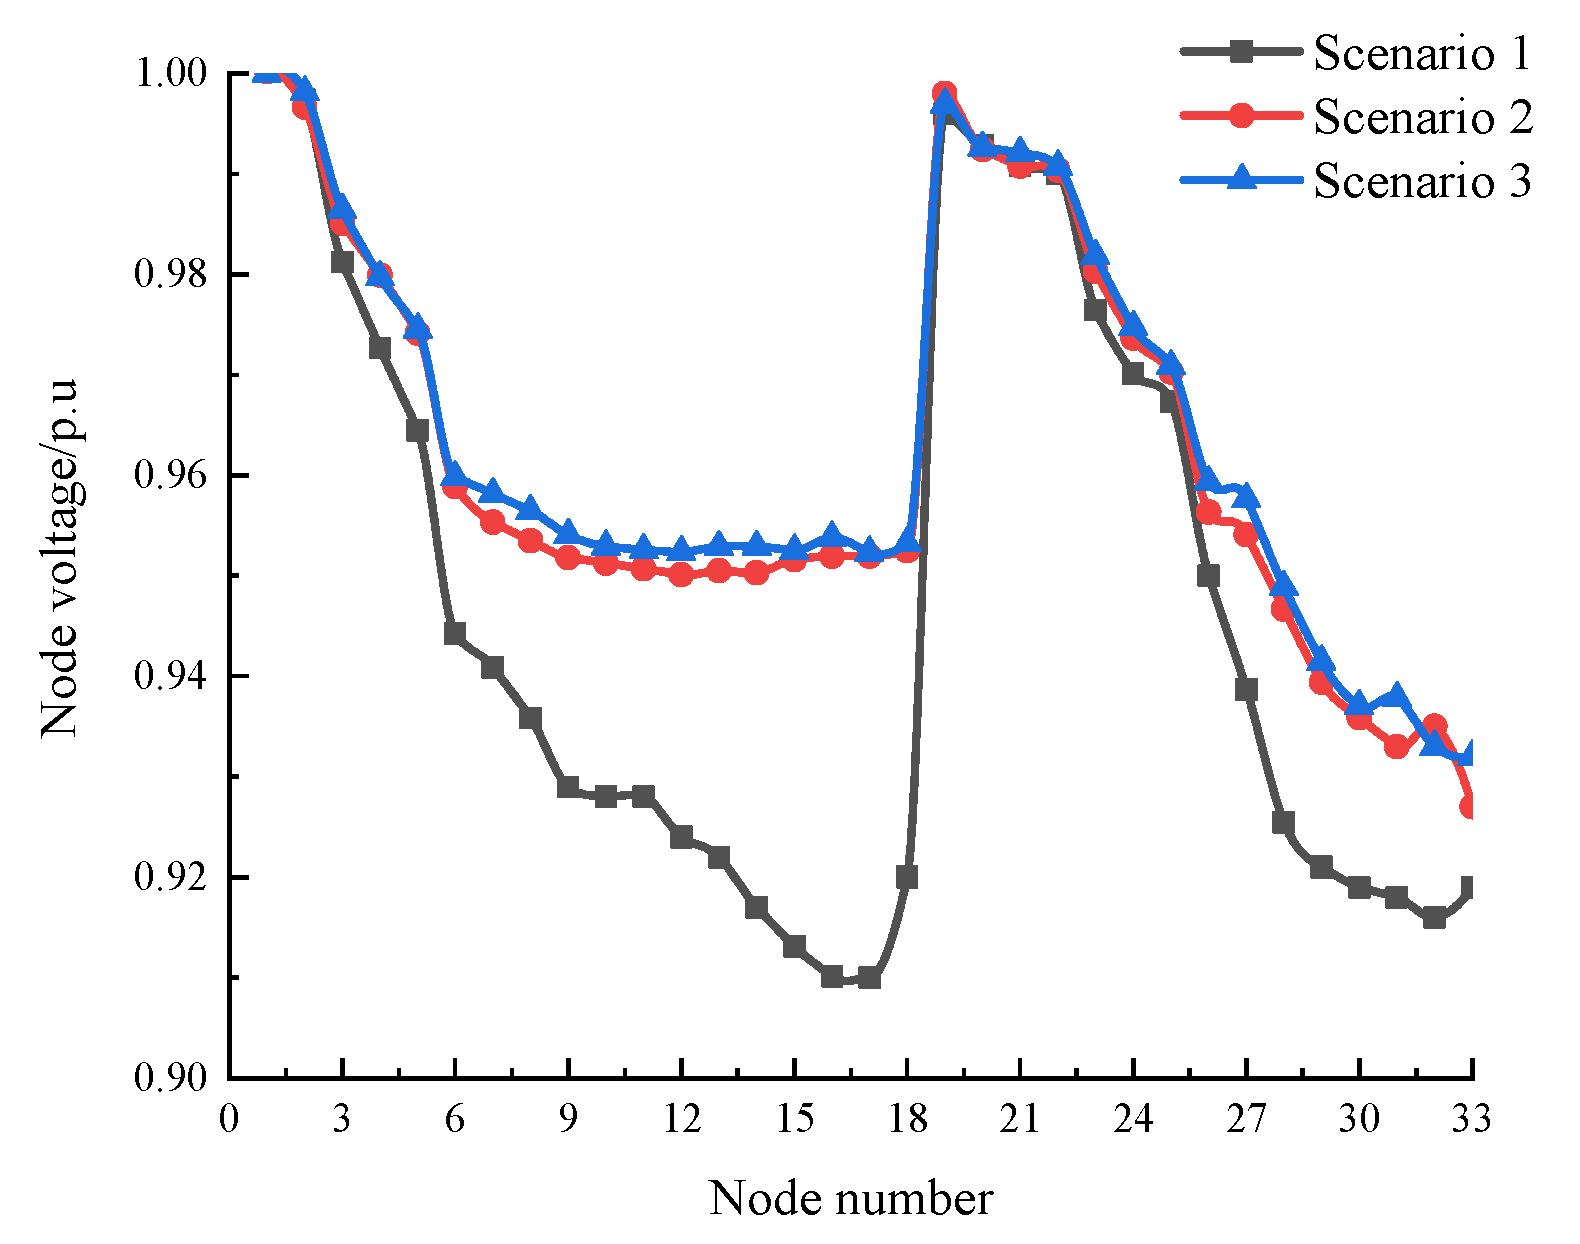
To comprehensively validate the proposed model and solution method, three scenarios were designed for a comparative analysis:
Scenario 1: Distributed generation is considered, but no energy storage system is integrated.
Scenario 2: Both distributed generation and energy storage are considered, and the standard bat algorithm is used for optimization.
Scenario 3: Both distributed generation and energy storage are considered, and the improved bat algorithm is used for optimization.
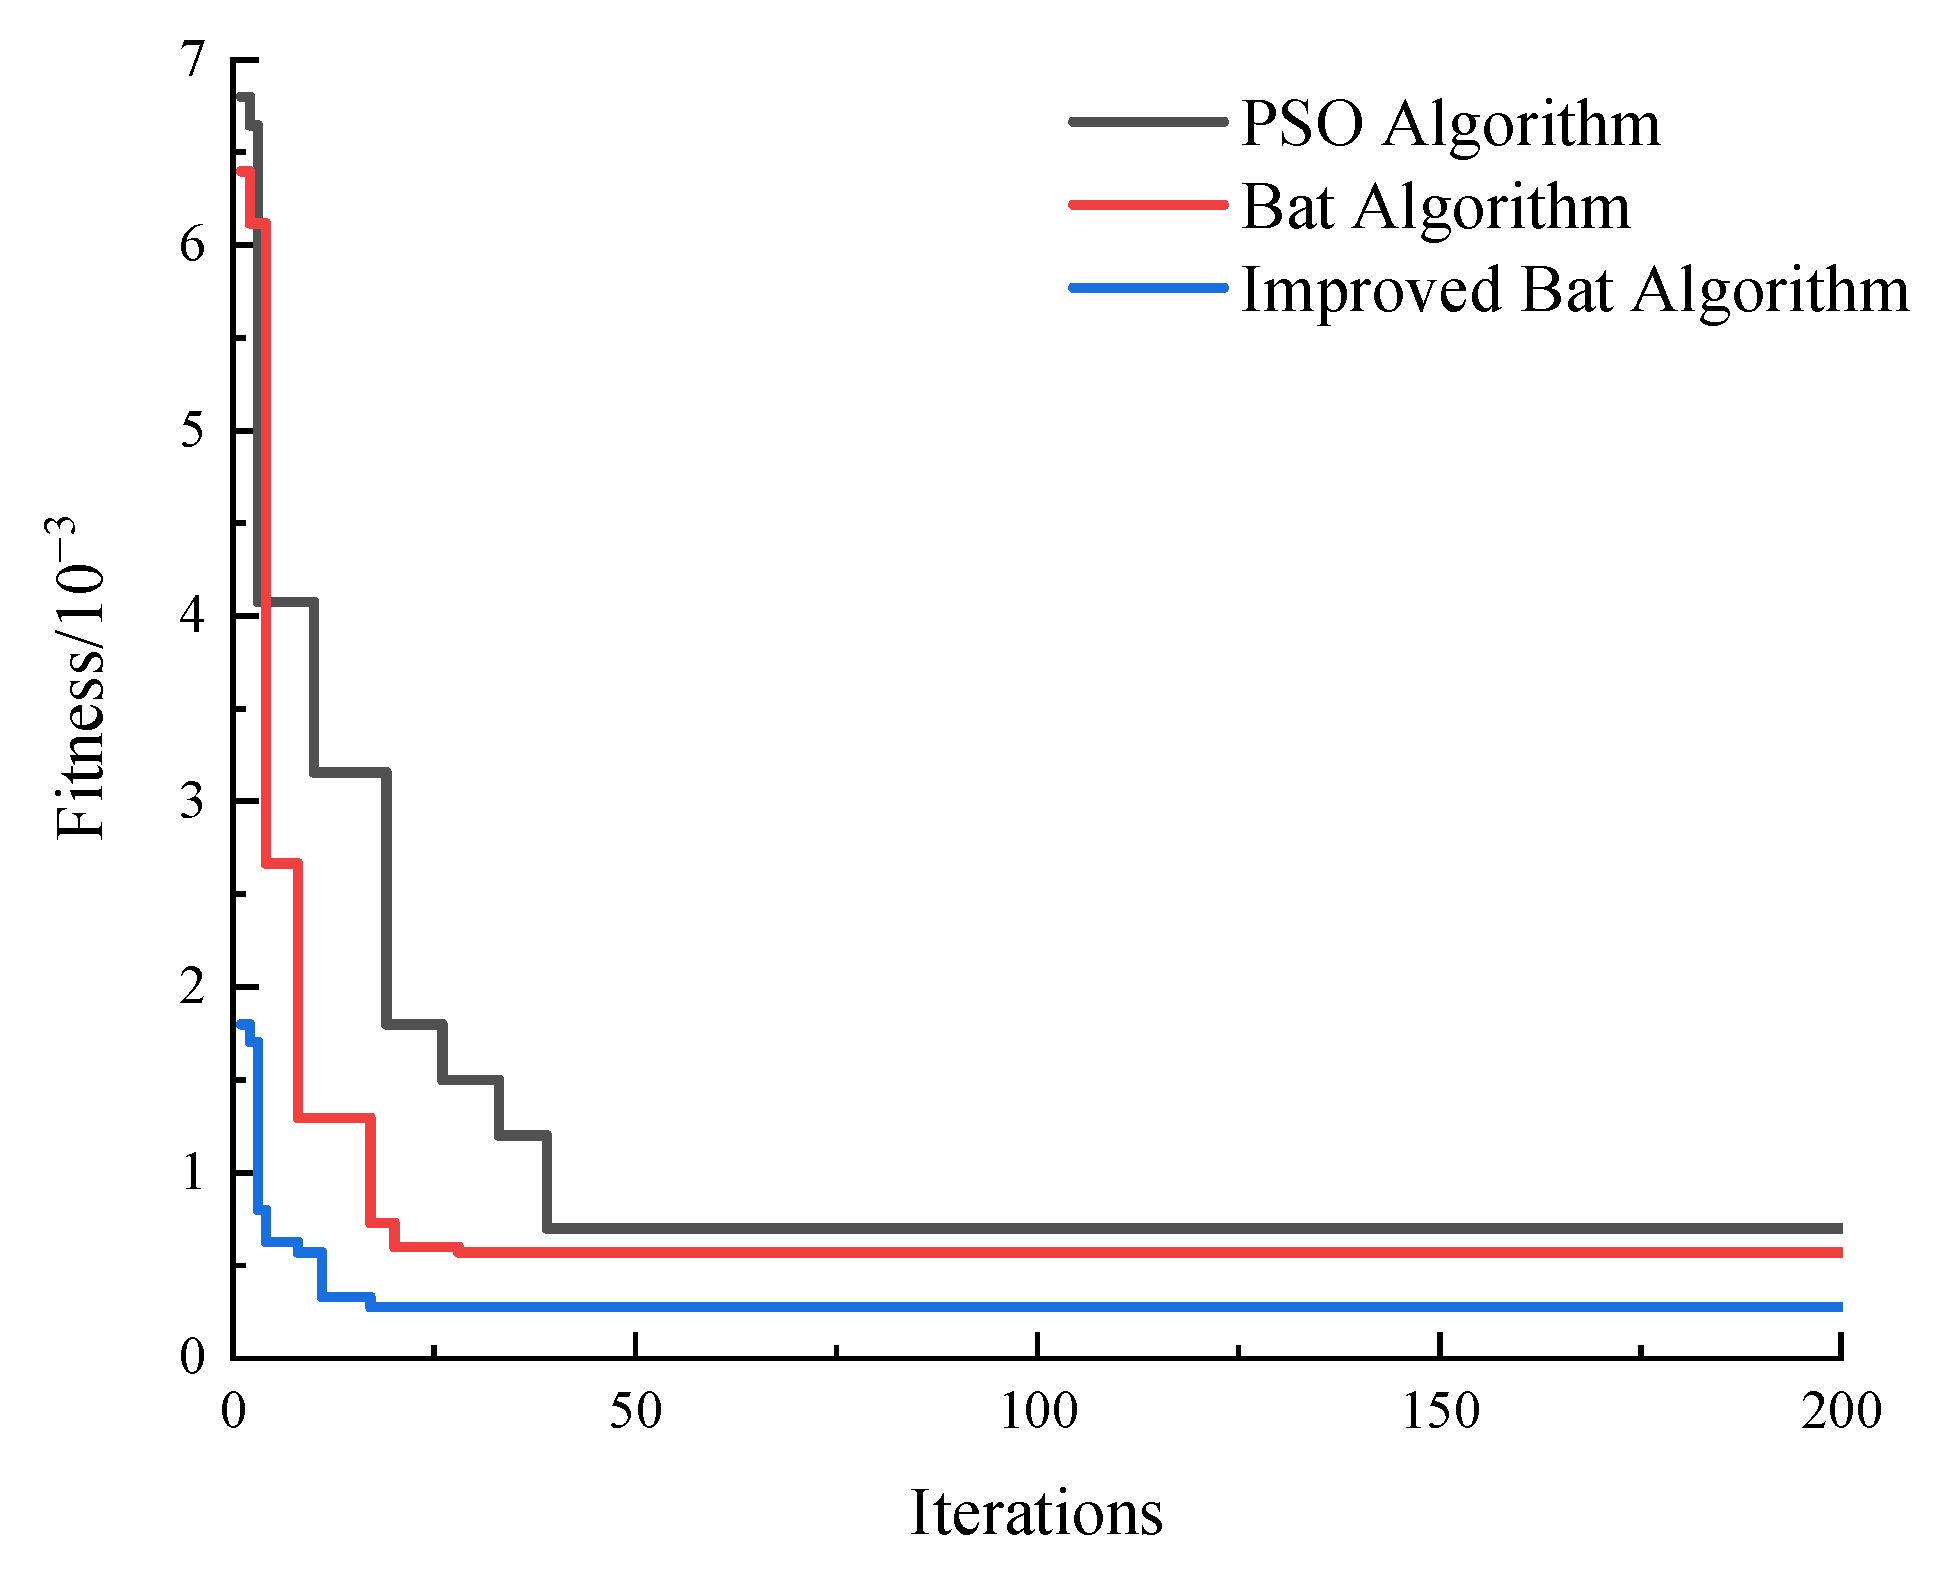
In spring and autumn when the value of the objective function converges, it indicates that the model parameters have reached their optimal values. The iterative processes of different algorithms are illustrated in
Figure 6. It can be seen that the PSO algorithm reaches the optimal value after 39 iterations, the bat algorithm (BA) reaches the optimal solution after 28 iterations, and the improved bat algorithm (IBA) reaches the optimal parameters after 17 iterations, with a higher convergence accuracy. The standard BA outperforms PSO in this study, mainly due to its dynamic frequency control and local perturbation, which enhance the search space’s ability to jump, thus avoiding a premature convergence in high-dimensional non-convex scheduling problems. This phenomenon also validates the superior adaptability of BA-type algorithms in optimizing complex energy systems. In this study, chaotic mapping is used to optimize the pulse frequency, pulse amplitude, and inertia weight of the bat individuals, enhancing the global search capability of the bat algorithm and preventing it from getting trapped in local optima during iterations, which could affect the global results. Additionally, the Levy flight strategy is adopted to expand the search space, thereby improving the algorithm’s rapid convergence and solution accuracy.
Table 3 presents the configuration outcomes for the wind energy, solar energy, and storage across various scenarios.
As shown in
Table 3, in Scenario 1, where no energy storage system is configured, wind turbines with capacities of 635 kW and 350 kW are installed at nodes 15 and 17, respectively, along with photovoltaic (PV) units of 180 kW each at the same nodes. In contrast, Scenarios 2 and 3 involve higher levels of wind and solar integration, indicating that the inclusion of energy storage significantly increases the hosting capacity of the distributed generation. This demonstrates that configuring energy storage systems effectively enhances the utilization and consumption of distributed renewable energy. In both Scenarios 2 and 3, energy resources are deployed at nodes 9, 15, and 24; however, the configured capacities differ. This discrepancy is attributed to the use of different solution methods for the lower-level model. The variation in optimal operation schemes derived from different algorithms leads to diverse capacity planning outcomes in the upper-level model. A comparative analysis of the economic performance under different planning scenarios is presented in
Table 4.
As shown in
Table 4, Scenario 1 results in the lowest total cost compared to Scenarios 2 and 3, primarily because it does not include energy storage systems. Consequently, the investment in wind and PV units is relatively conservative, resulting in a lower capital expenditure. Correspondingly, both the operational costs and annual electricity sales revenue are also lower in Scenario 1. Compared to Scenario 1, the network loss costs in Scenario 2 and Scenario 3 are reduced by 25.7% and 32.9%, respectively. This demonstrates that the coordinated integration of wind, PV, and energy storage can effectively reduce system network losses during operation. When compared to configurations without energy storage, the addition of storage reduces operational costs. The construction cost of the energy storage can be offset by its comprehensive benefits—such as reductions in network losses and wind and solar curtailment costs—which, in the long term, contributes to lowering the total system cost. Although the investment cost in Scenario 3 is 2.2% higher than that in Scenario 2, the operational costs in Scenario 3 are lower across all components, resulting in an overall total cost reduction of 4.1%. This is because Scenario 3 involves higher installed capacities of wind, PV, and storage, leading to increased capital investment. However, the use of a more effective operational strategy enables a reduction in operational costs. Furthermore, the higher capacity allows for increased electricity generation, resulting in greater electricity sales revenue. In fact, the electricity sales revenue in Scenario 3 increases by 4.9% compared to Scenario 2. Therefore, from the perspective of long-term planning, Scenario 3 demonstrates a better economic performance. These results confirm that the improved bat algorithm significantly enhances the integration capacity of distributed energy sources, validating the economic efficiency and superiority of the proposed bi-level model and optimization approach. The wind and solar curtailment rates under the three planning scenarios are summarized in
Table 5.
As shown in
Table 5, the PV and wind power utilization rates in Scenario 1 are 83.67% and 87.23%, respectively. In Scenario 2, the PV utilization rate increases to 85.32%, and the wind power utilization rate rises to 89.45%. In Scenario 3, these figures further improve to 90.27% for PV and 92.18% for wind power. These results indicate that the rational configuration of energy storage systems can significantly reduce both the solar and wind curtailment, thereby improving the incorporation and efficiency of renewable energy.
The integration of the DG tends to increase node voltages within the distribution network. However, the addition of energy storage systems leads to a more noticeable improvement in voltage profiles. The voltage distribution across network nodes under the three scenarios is illustrated in
Figure 7. The results show that the enhanced bat algorithm achieves the best voltage regulation performance. Without energy storage (Scenario 1), the minimum node voltage is 0.908 p.u. After the optimization using the standard bat algorithm (Scenario 2), the minimum node voltage increases to 0.936 p.u., while the improved bat algorithm (Scenario 3) further enhances it to 0.937 p.u. The findings indicate that the proposed enhanced algorithm significantly improves the voltage stability and power quality, especially in distribution networks with a substantial integration of distributed generation, thereby ensuring more reliable and efficient grid operations.
The analysis of the quantified impact of the prosumer behavior on the system performance based on the planning scheme of Scenario 3 is discussed. Three trading modes are set as follows: Case 1: No prosumer participation, meaning all energy demand is supplied by the grid. Case 2: The benchmark scenario, where prosumers are present, but their participation is limited, and they only rely on purchasing electricity from the grid. Case 3: Optimized prosumer participation, where prosumers not only locally consume photovoltaic generation but also adjust loads through storage systems and participate in P2P trading based on the planning scheme. The revenue comparison under different generation trading modes is shown in
Table 6.
In
Table 6, it can be seen that in the trading mode without the participation of prosumers, the distribution network’s electricity sales revenue is the highest, while the DG and ESS operational profits are the lowest, and the user electricity purchase costs are the highest. Compared to Scenario 1, the daily net profit of the distribution network in the trading modes of Scenario 2 and Scenario 3 decreased by 61.3% and 33.4%, respectively, while the operational profits of the DG and ESS increased by 76.7% and 58.7%. Regarding the electricity purchase costs for users, compared to Scenario 1, the electricity purchase costs for users in Scenario 2 and Scenario 3 decreased by 6.7% and 6.9%, respectively. It can be observed that in the trading mode of Scenario 2, the distribution network’s electricity sales revenue is the lowest, while the operational profits of the DG and ESS significantly improved, and the electricity costs for users decreased to some extent. Scenario 3, compared to Scenario 2, saw an increase in the distribution network electricity sales revenue, but at the cost of some reduction in DG and ESS operational profits. The results indicate that the distributed generation trading mode can promote the development of clean energy such as DG, improving DG and ESS operational profits without harming user interests. In particular, Scenario 3 can increase its own profits by flexibly adjusting electricity prices, while also reducing electricity purchase costs for users, benefiting both DG operators and electricity consumers.
5. Conclusions
In this study, a coordinated wind–solar–storage planning method based on an improved bat algorithm is proposed, aimed at optimizing the planning and operation of distributed generation (DG) and energy storage systems (ESSs) through upper–lower level coordination. The simulation results demonstrate that, on one hand, compared to scenarios without energy storage configuration, the integration of the ESS significantly reduces the wind and solar curtailment, thereby lowering system operating costs. The coordinated integration of wind, solar, and storage resources also effectively reduces network losses in the distribution system. On the other hand, the improved bat algorithm prevents the search process from getting trapped in local optima during iterations, achieves a faster convergence, and substantially enhances the renewable energy hosting capacity of the system. These outcomes verify the economic efficiency and superiority of the proposed algorithm in solving the bi-level optimization model, with a particular emphasis on the unique contributions of the improved bat algorithm. Compared to traditional heuristic algorithms, the improved bat algorithm demonstrates a higher efficiency and stronger adaptability in solving complex distributed energy and energy storage system planning problems by improving the global search ability, accelerating convergence, and avoiding local optima.
Although the optimization method proposed in this paper shows good results in theory and simulations, there are still certain challenges to be addressed for its implementation in real systems. First, the integration of distributed energy sources and energy storage systems used in the model requires solving issues such as the technical standardization and compatibility of communication protocols in actual power grids. Second, the algorithms for energy trading and scheduling need to consider more real-time information in dynamic environments, such as weather forecasts and load fluctuations, to incorporate uncertainties in real-time. Therefore, during the actual deployment process, it is necessary to integrate with the existing smart grid infrastructure, especially by introducing the optimization method of this model into real-time operation systems. Based on this, future research will further explore how to enhance the model’s dynamic responsiveness through Digital Twin and Supervisory Control and Data Acquisition (SCADA), providing effective support for the online optimization of real power systems.

