Article

Optimizing Texture and Drying Behavior of Squid (Todarodes pacificus) for Elder-Friendly Applications Using Alkaline Pretreatment and Intermittent Drying: An Experimental and Numerical Study

by
Timilehin Martins Oyinloye
1,2 and
Won Byong Yoon
1,2,*
1
Department of Food Science and Biotechnology, College of Agriculture and Life Sciences, Kangwon National University, Chuncheon 24341, Republic of Korea
2
Elder-Friendly Food Research Center, Agriculture and Life Science Research Institute, Kangwon National University, Chuncheon 24341, Republic of Korea
*
Author to whom correspondence should be addressed.
Processes 2025, 13(8), 2592; https://doi.org/10.3390/pr13082592 (registering DOI)
Submission received: 30 July 2025 / Revised: 13 August 2025 / Accepted: 14 August 2025 / Published: 16 August 2025
(This article belongs to the Special Issue Feature Papers in the "Food Process Engineering" Section)

Abstract

This study addresses the increasing demand for texture-modified seafood products suitable for elderly consumers by focusing on dried squid, a popular protein source. The aim was to optimize the softening and drying procedures to produce a dried squid product with improved chewability and quality. Fresh squid was pretreated using sodium bicarbonate or potassium carbonate solutions (0, 0.3, 0.6, and 0.9 mol/kg) and dried at 40 °C using either continuous (CD) or intermittent drying (ID) until the final moisture content reached 18.34 ± 0.44%. Hardness generally increased with higher alkaline concentrations, with the potassium carbonate-treated samples showing better softening effects. Based on standards for elderly-friendly foods targeting chewable hardness (10,000–50,000 N/m2), low water activity (<0.58), and limited color change (ΔE = 14.32), the optimal result was achieved with 0.3 mol/kg potassium carbonate and ID. Among the thin-layer drying models, the Midilli–Kucuk model showed the best fit, with the highest average R2 (0.9974), and lowest SSE (0.0481) and RMSE (0.1688), effectively capturing the drying kinetics. Scanning electron microscopy (SEM) revealed smoother surfaces and consistent porosity in samples dried intermittently, indicating less structural degradation. Finite element analysis showed that ID improved internal moisture distribution, reduced surface crusting, and alleviated internal stresses. These results support mild alkaline soaking combined with ID as an effective strategy for enhancing dried squid quality for elderly individuals.

1. Introduction

Seafood is globally valued for its high-quality proteins, essential amino acids, and bioavailable micronutrients such as iodine, vitamin B12, selenium, and omega-3 fatty acids [1,2]. Among seafood, squid (Todarodes pacificus) is notable for its nutritional benefits and versatility in processed foods [3]. Its muscle composition of approximately 75–80% moisture, 15–18% protein, 1–2% fat, and 1–2% ash makes it a lean, protein-rich option [4,5]. However, high moisture and enzymatic activity make squid highly perishable, promoting microbial and biochemical spoilage [4]. Drying, particularly hot-air drying, is widely used to extend the shelf life by lowering water activity due to its simplicity and cost-effectiveness [5].
Nevertheless, continuous hot-air drying (CD) often causes surface hardening, shrinkage, and uneven internal moisture distribution, leading to poor texture and color quality [6,7,8]. These drawbacks are critical when aiming to produce squid snacks with improved softness and palatability. Traditional drying methods often yield tough textures unsuitable for consumers such as elderly individuals seeking more tender options. Age-related physiological changes, including reduced saliva production and muscle strength, can limit food intake and reduce the enjoyment and safety of meals [9,10,11]. As such, developing chewable yet softer-textured seafood snacks can improve the dietary experience for older adults, without necessarily targeting individuals with clinical dysphagia who require puréed or minced foods.
To improve the drying performance and texture, chemical pretreatments like alkaline soaking have gained interest. Soaking in sodium bicarbonate (NaHCO3) or potassium carbonate (K2CO3) solutions increases the alkalinity of the soaking medium, which affects the muscle’s structural proteins, primarily myofibrillar proteins. The elevated pH leads to an increase in net negative charge on these proteins, causing electrostatic repulsion that relaxes muscle fiber packing and weakens the intermolecular bonds responsible for firmness and toughness [12,13,14]. This process enhances porosity, facilitates water migration, and promotes muscle network loosening, thereby softening the final product texture. Such structural modifications make the product more easily chewable and digestible, which is particularly important for elderly consumers facing reduced chewing efficiency and oral moisture [12,13]. For instance, Lin et al. [14] reported improved tenderness and moisture loss in abalone treated with NaHCO3, while Liu et al. [15] demonstrated that alkaline treatment enhanced the drying rates and softened the texture by loosening the muscle structure and increasing water mobility. However, the specific application of alkaline pretreatment for squid to meet the texture requirements of elder-friendly foods remains underexplored and warrants further investigation.
In addition to pretreatments, modifying the drying strategy through intermittent drying (ID), which introduces rest periods during drying, has been shown to improve moisture redistribution, reduce shrinkage, and enhance texture [16,17]. While ID has been tested in plant and meat products, its application to seafood and in combination with alkaline soaking remains underexplored.
Given the complexity of moisture transport in biological tissues during drying, understanding the heat and mass transfer mechanisms is critical to optimizing the drying parameters. Numerical modeling offers an efficient approach to simulate internal transport phenomena, predict drying behaviors, and reduce trial and error in process development. Finite element modeling (FEM) has gained traction in simulating temperature and moisture profiles in porous food matrices. Soydan [18] used FEM to study the drying characteristics of lean and minced meat samples and validated the predicted moisture distributions with experimental data. Similarly, Sun and Hu [19] modeled simultaneous heat and mass transfer in meat during vacuum cooling and emphasized the importance of incorporating tissue-specific thermal properties to enhance model accuracy. These models provide critical insights into how the drying conditions and pretreatments influence the internal dynamics and guide process design for industrial applications [19]. Despite the increasing adoption of computational tools in drying research, there is limited integrative work combining simulation with experimental quality evaluation for squid or other soft-textured seafood products.
Therefore, this study addresses these knowledge gaps by exploring the potential of alkaline soaking and controlled intermittent drying to produce soft-dried squid suitable for the elderly or people with chewing problems. Specifically, this research aims to (1) evaluate the influence of sodium bicarbonate and potassium carbonate soaking on squid drying kinetics and texture properties, (2) compare continuous and intermittent hot-air drying regimes in terms of drying efficiency and product quality, (3) analyze microstructural behavior using scanning electron microscopy (SEM), and (4) develop and validate a finite element model to simulate heat and moisture transfer during drying. The findings will provide insights into how pre-drying treatments and drying regimes can be optimized to meet the textural and nutritional needs of elderly consumers, while enhancing the efficiency of seafood drying processes.

2. Materials and Methods

2.1. Sample Preparation

Fresh squid (Todarodes pacificus), averaging 18–20 cm in body length, were purchased from a local seafood market in Chuncheon, South Korea. Upon arrival, they were cleaned, gutted, and cut into uniform 5 cm × 5 cm sections with an average thickness of 0.5 ± 0.1 cm to ensure consistent heat and moisture transfer during drying and simulation. Surface moisture was removed using paper towels before treatment. Samples were soaked in two alkaline solutions: (a) sodium bicarbonate (BS; NaHCO3) and (b) potassium carbonate (PC; K2CO3), prepared at concentrations of 0, 0.3, 0.6, and 0.9 mol/kg using deionized water. These concentrations were selected based on preliminary experiments balancing effective softening and product quality without compromising safety or sensory properties. The pH of these solutions ranged approximately from 8.3 (BS) to 11.4 (PC), providing mild to moderate alkalinity suitable for seafood muscle modification. Soaking was conducted for 60 min at room temperature (25 ± 2 °C) under mild agitation, based on preliminary tests. After soaking, samples were briefly rinsed with distilled water to remove surface alkali and blotted dry.

2.2. Drying Procedure

Drying was performed using a laboratory-scale hot-air oven (Model: NB-901M, N-BIOTEK, Bucheon, Gyeonggi, Republic of Korea) with chamber dimensions of 550 mm × 520 mm × 600 mm. The drying temperature was set at 40 °C, selected from preliminary trials at 40 °C and 50 °C. Among the tested conditions, 40 °C provided an optimal balance between drying efficiency, textural softening, and minimal thermal degradation of sensitive nutrients such as proteins, making it suitable for elder-friendly squid products [5]. Drying conditions included 10% relative humidity and 3 m/s inlet air velocity, measured using a digital hot-wire anemometer (Model: TES-1341N, TES Electrical Electronic Corp., Taipei, Taiwan, China).
Two drying regimes were used as follows: (1) continuous drying (CD), where samples were dried to a target moisture content of 18.34 ± 0.44% (wet basis); and (2) intermittent drying (ID), applying a 3:1 drying-to-rest ratio, i.e., 45 min of drying followed by 15 min of rest (no airflow, heater off), repeated until the same moisture target was reached.
The approximately 18% final moisture level ensured optimal softness (hardness: 10,000–50,000 N/m2) and water activity below 0.68, balancing chewability and microbial stability [11]. Under both regimes, five samples were arranged horizontally in the dryer at 300 mm intervals following the drying conditions in Park and Yoon [17] (Figure 1).

2.3. Moisture Content Determination and Drying Kinetic of Squid

The drying behavior of the squid samples was evaluated by determining the moisture ratio (MR) and drying rate at various time intervals. The moisture content on a wet basis (MCwb), MR, and drying rate were calculated using the following equations [20,21]:
M C w b = W w D w W w ,
where MCwb is the wet base moisture content (g of water/g of sample), Ww is the sample’s initial weight (g), and Dw is the final dry weight (g).
M R = M C w b M e M i M e ,
where MR denotes the moisture ratio (dimensionless), Mi is the initial moisture content (g of water/g of sample), and Me represents the equilibrium moisture content (g of water/g of sample). The drying rate was assessed at different stages of the drying process using the following equations:
At the start (t = t0),
d M d t = M i M 0 t 1 t 0 ,
During drying (t = ti i = 1, 2, …, n − 1),
d M d t = M t + 1 M t 1 t i + 1 t i 1 ,
At the final time point (t = tn),
d M d t = M n M n 1 t n t n 1 ,
where M 0 , M i , M i + 1 , M i 1 , M n , M n 1 are the moisture content (g water/g sample) at corresponding drying time (min) points ( t 0 , t i , t i + 1 , t i 1 , t n , t n 1 ).
The experimental moisture loss data were fitted to the selected thin-layer models using MATLAB (R2024a, MathWorks Inc., Natick, MA, USA) (Table 1). Model performance was assessed by evaluating the R-squared (R2) values and Sum of Squared Errors (SSEs), with the model yielding the highest R2 and the lowest SSE values considered the most appropriate. The model parameters were subsequently used to estimate the drying time required to reach an approximated target moisture content of 18%.

2.4. Texture Analysis

The textural properties of the dried squid samples were evaluated using a texture analyzer (Model TA.XT Plus, Stable Micro Systems, Surrey, UK). A cutting test was conducted with a flat blade (0.5 mm thick) at a constant speed of 1 mm/s to quantify resistance to deformation. Samples were consistently oriented on the platform to ensure uniform contact with the blade. The maximum cutting force required to shear each sample was recorded, and the cutting stress (N/m2) was calculated by dividing the peak force by the cross-sectional area in contact with the blade, allowing comparison across samples of varying thickness.
The cutting test provides insights into the material’s mechanical behavior, distinguishing between brittle and ductile characteristics. Brittle materials typically fracture suddenly with little deformation and exhibit sharp breaks, which may be perceived as hard or tough, potentially causing discomfort for consumers, especially elderly individuals with reduced chewing ability. In contrast, ductile materials deform plastically before breaking, resulting in a softer, more gradual failure that tends to be easier to chew and more acceptable to consumers seeking tender textures. Thus, understanding whether the dried squid exhibits brittle or ductile behavior is critical for assessing its suitability for elderly consumers who require foods that are easy to bite and chew without excessive effort or risk of injury. Each treatment was replicated seven times, and results were reported as mean ± standard deviation. All measurements were conducted at ambient temperature (25 ± 2 °C) and completed within 24 h post-drying to minimize the effect of ambient humidity on texture.

2.5. Scanning Electron Microscopy (SEM)

Microstructural changes from soaking and drying were analyzed using an ultrahigh-resolution scanning electron microscope (Model SU8600, Hitachi High-Tech Corporation, Tokyo, Japan), following the procedure of Deng et al. [26]. Dried squid pieces (~5 mm × 5 mm) were mounted on copper grids and sputter-coated with gold to enhance conductivity. Imaging was performed at 3000× magnification, 15 kV accelerating voltage, and 10.00 mm working distance. These settings enabled detailed visualization of surface features such as porosity, voids, and tissue collapse. Images were used to qualitatively evaluate the effects of alkaline treatments and drying methods on the internal structure. A 10 µm scale bar was included in all micrographs.

2.6. Color Measurement

The surface color of the dried squid samples was measured using a calibrated colorimeter (Model CR-300, Minolta, Osaka, Japan) with a standard white tile. Color parameters (lightness (L*), redness/greenness (a*), and yellowness/blueness (b*)) were recorded to evaluate visual changes from different treatments. Total color difference (ΔE) was calculated relative to fresh, untreated squid using the equation:
Δ E = ( L * L 0 * ) 2 + ( a * a 0 * ) 2 + ( b * b 0 * ) 2
where L 0 * , a 0 * , and b 0 * represent the color values of the fresh sample. This provided an objective measure of color change due to soaking and drying.

2.7. Microbial Analysis of Dried Squid

Microbial stability of the dried squid samples was evaluated by measuring the total viable counts (TVCs), representing the total aerobic mesophilic bacteria, to assess general microbial load and storability under different temperatures. Samples were stored at 25 °C and 40 °C for two weeks, with microbial analysis conducted on days 0, 7, and 14. At each time point, 5 g of the sample was aseptically mixed with 45 mL sterile peptone water (0.1% w/v) and homogenized for 2 min. Serial dilutions were plated on Plate Count Agar (PCA) for TVC, incubated at 37 °C for 48 h. Results were expressed as log colony-forming units per gram (log CFU/g). Microbial changes were compared to evaluate the impact of the storage temperature on the shelf life and safety.

2.8. Water Activitiy Analysis of Dried Squid

Water activity (aw) of the dried squid samples was measured to assess microbial stability and storage potential. A water activity meter (Model: AMITTARI WA-160A, Guangzhou Anmiao Instrument Co., Ltd., Guangzhou, China) calibrated with standard salt solutions was used. About 2–3 g of each sample was placed in the holder, and readings were taken at room temperature (25 ± 2 °C). Each sample was measured in triplicate, and the average value reported. Water activity values were compared across soaking treatments and storage temperatures to evaluate their impact on drying efficiency and product stability.

2.9. Numerical Simulation

2.9.1. Modeling of Heat and Moisture Transport in Squid Sample

The simulation was based on a 3D model constructed from the measured geometry of the dryer chamber and squid samples (Figure 1). Forced convection drying was applied with an air velocity of 3 m/s. While the airflow field was not explicitly simulated, the velocity was used to estimate surface convective heat and mass transfer coefficients, assuming turbulent flow over flat surfaces [27,28]. Local convective transfer coefficients were calculated using empirical correlations applicable to turbulent boundary layer flow over flat plates. To quantify convective heat and mass transfer, the Nusselt number (Nu) and Sherwood number (Sh) were computed through well-established empirical relations linked to forced convection drying processes. These dimensionless numbers correlate the convective transfer rates to the flow conditions and physical properties of the air and samples, facilitating accurate estimation of heat and moisture fluxes on the sample surfaces [29,30]:
N u = 0.682 · R e 0.466 · P r 0.333
S h = 0.683 · R e 0.466 · S c 0.333
The Reynolds number (Re), Prandtl number (Pr), and Schmidt number (Sc) were calculated from standard fluid mechanics relations:
R e = ρ a i r · u · L μ a i r ;   P r = μ a i r · C p , a i r k T ;   S c = μ a i r ρ a i r · D
where ρair is the density of air (kg/m3), u is the drying air velocity (3 m/s), L is the characteristic length of the sample (0.05 m), μair is the dynamic viscosity (Pa·s), Cp,air is the specific heat capacity (J/kg·K), kT is the thermal conductivity of air (W/m·K), and D is the binary diffusion coefficient of water vapor in air (m2/s). These air properties were evaluated at the film temperature Tf, defined as the average of the air temperature (T) and the sample surface temperature (Ts):
T f = T + T s 2
The heat (h) and mass (hm) transfer coefficients were subsequently calculated as follows:
h = N u · k T L
h m = S h · D L
All thermo-physical air properties were temperature-dependent and implemented via interpolation in COMSOL Multiphysics (Version 5.1, COMSOL Inc., Burlington, MA, USA), using data from Park and Yoon [17] (Table 2). A free tetrahedral mesh was applied to the squid sample geometry with localized mesh refinement near the boundaries to enhance the resolution of the surface temperature and moisture gradients during the simulation.

2.9.2. Modeling of the Internal Temperature and Moisture Fields of the Sample

The internal heat and moisture transport in the squid sample was modeled by solving coupled transient heat and mass diffusion equations in 3D Cartesian coordinates. Sample shrinkage, internal heat generation, and radiation effects were neglected. The governing equations are as follows:
T t = α 2 T x 2 + 2 T y 2 + 2 T z 2
M t = D e f f 2 M i x 2 + 2 M i y 2 + 2 M i z 2
where T is the temperature (K), M i is the moisture content (g water/g dry matter), α is the thermal diffusivity of squid (m2/s), and Deff is the effective moisture diffusivity (m2/s), assumed constant at each drying temperature and extracted from the literature values for aquatic-based biological materials under convective drying [31,32].
Initial conditions assumed uniform temperature and moisture:
T x , y , z , 0 = T i , M x , y , z , 0 = M i
Boundary conditions on the sample surface (top, bottom, and lateral) incorporated convective transfer of heat and moisture:
k T · T n = h ( T s T b )
D e f f · M n = h m ( M s M e )
where n represents the outward normal direction, Tb and Me are the ambient air temperature and equilibrium moisture content, and Ts and Ms are the local surface temperature and moisture content of the squid, respectively.

2.10. Statistical Analysis

All experimental data were analyzed to determine the significance of differences among treatments using one-way analysis of variance (ANOVA), followed by Duncan’s post hoc test to identify statistically distinct groups using SPSS statistics software (Version 26.0, IBM Corp., Armonk, NY, USA). A significance level of p < 0.05 was applied. Results are presented as mean ± standard deviation, with different superscripts indicating significant differences. For the simulation, model accuracy was assessed by comparing the predicted and experimental moisture ratios, and the root mean square error (RMSE) was calculated as follows:
R M S E M R = 1 N i = 1 N ( M R s i m , i M R e x p , i ) 2
where MR = M/Mi is the moisture ratio, MRsim is the simulation moisture ratio, MRexp denotes the experimental moisture ratio, and N is the number of sampling points used for comparison.

3. Results

3.1. Drying Characteristics of Squid

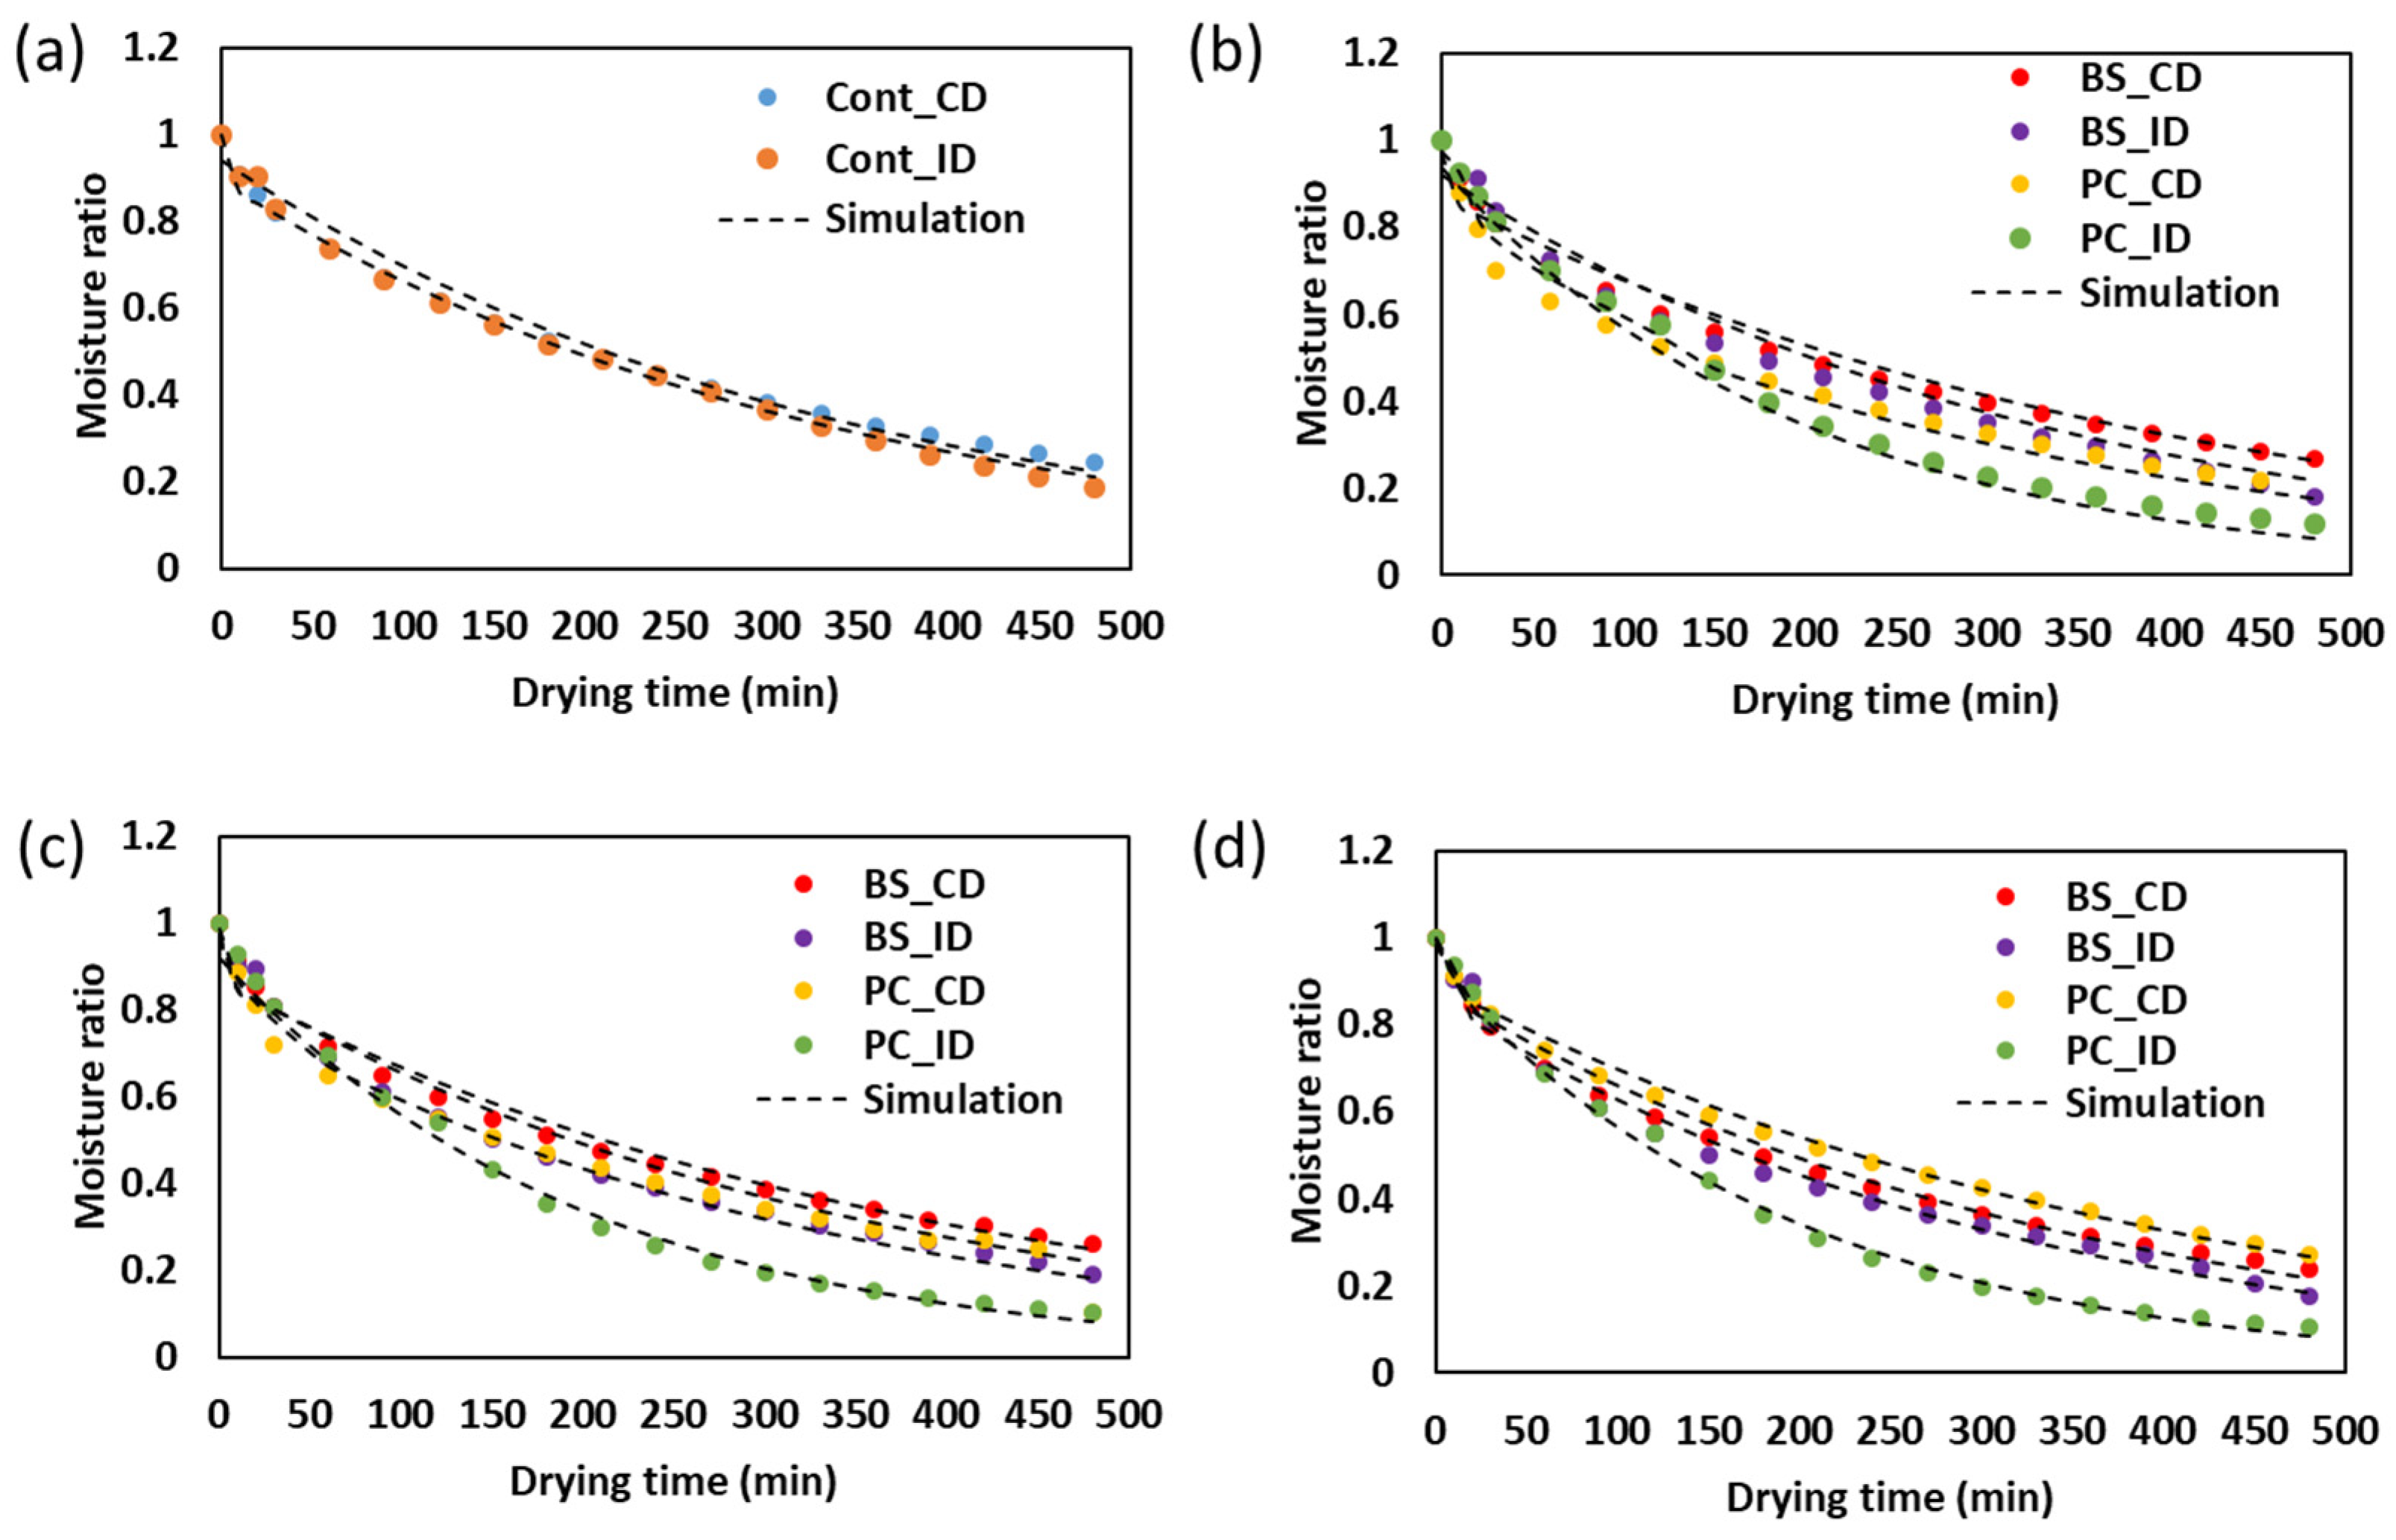
The moisture ratio (MR) shown in Figure 2 illustrates the drying behavior of the squid samples under different drying regimes and alkaline pretreatments. The MR decreased steadily across all treatments, indicating progressive moisture loss through evaporation. However, notable differences were observed depending on the drying method and type of pretreatment. Intermittent drying (ID) resulted in a faster MR decline than conventional drying (CD), likely due to tempering periods that allowed internal moisture redistribution and reduced surface hardening (case hardening). This redistribution improved moisture migration from the core to the surface, maintaining a more uniform drying gradient [33].
Alkaline pretreatment further enhanced the drying efficiency. Both sodium bicarbonate (BS) and potassium carbonate (PC) lowered the MR compared to the untreated controls, with the PC-treated samples exhibiting the lowest values. This superior performance can be attributed to two main factors: (i) stronger alkalinity—PC has a higher pH (~11.4) than BS (~8.3), which promotes more extensive protein denaturation by disrupting hydrogen bonds and weakening electrostatic interactions in squid muscle, increasing porosity and enhancing water diffusion; and (ii) ion-specific effects—potassium ions (K+) have a smaller hydration radius (~3.31 Å) than sodium ions (Na+, ~3.58 Å), meaning K+ retains less bound water and can penetrate muscle microstructures more easily [34]. This deeper penetration raises the local osmotic pressure within cells, causing greater cell swelling, expansion of inter-fibrillar spaces, and loosening of the muscle matrix. Additionally, K+ ions have higher ionic mobility in aqueous environments, facilitating faster ionic exchange and structural modification compared to Na+. These combined effects promote more efficient moisture migration from the tissue core to the surface, accelerating the drying process and explaining why PC consistently outperforms BS in MR reduction.
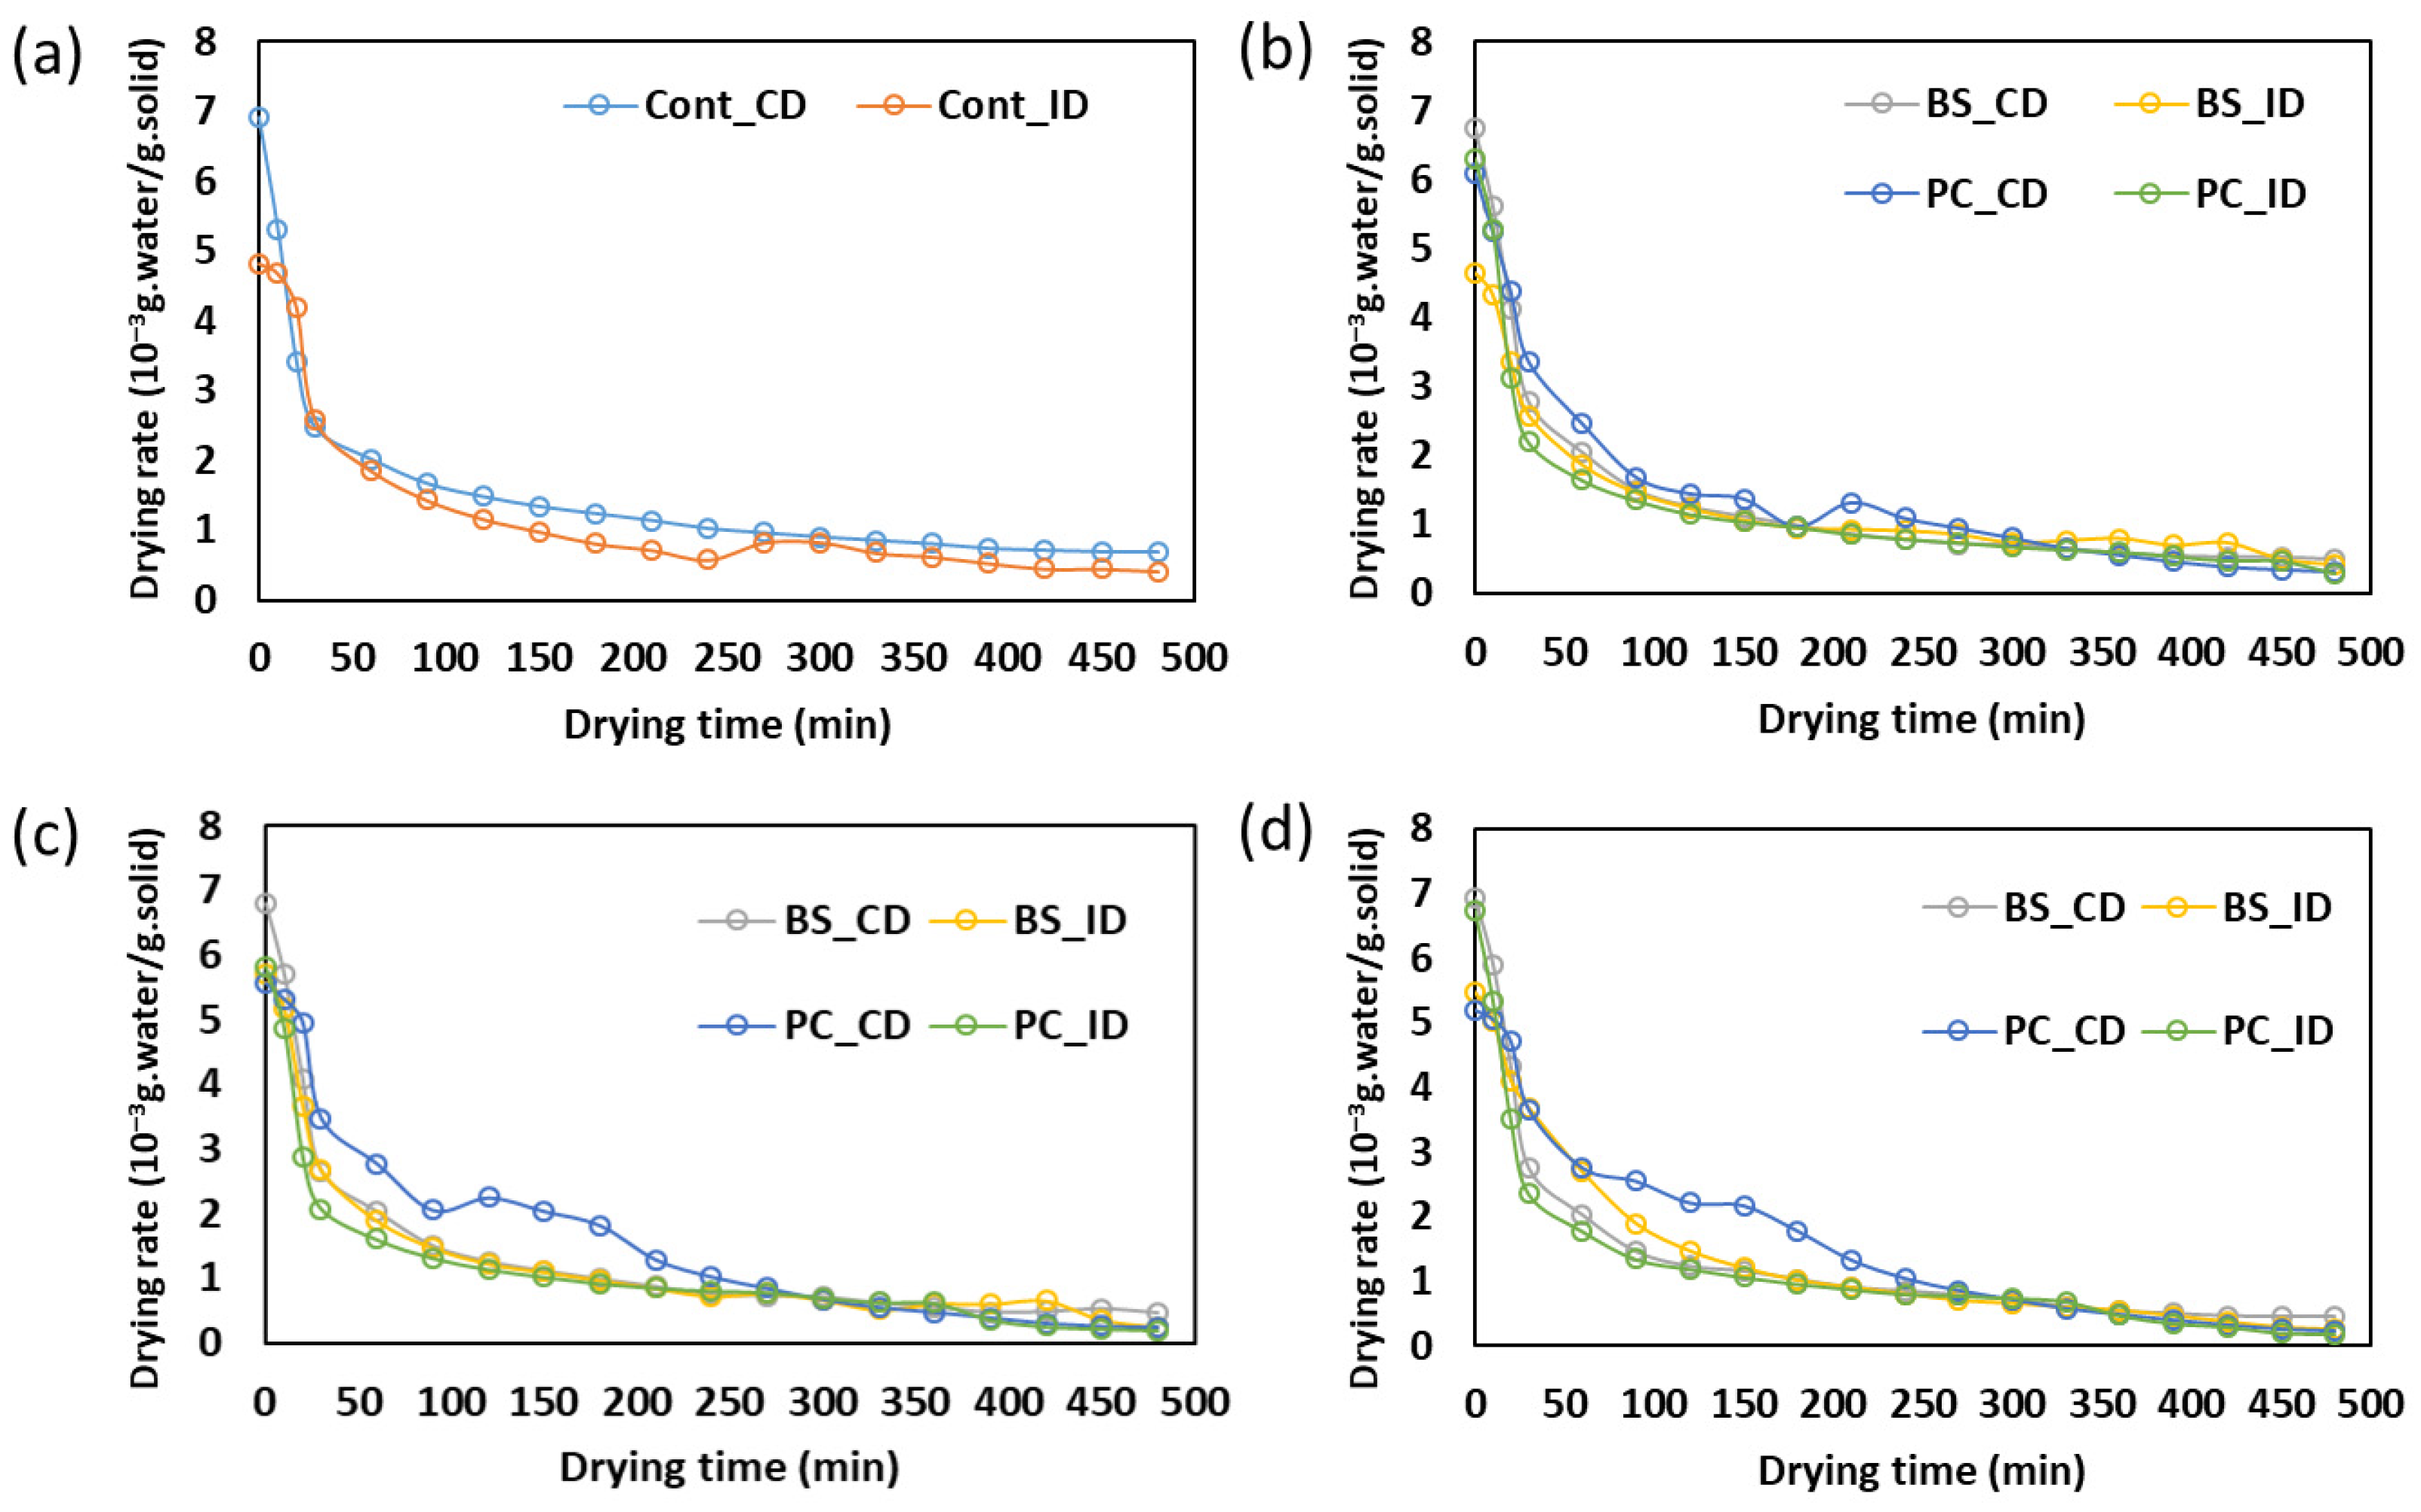
Figure 3 displays the drying rate curves, showing an initial rising rate followed by a falling rate period, typical for biological materials. The initial stage corresponds to rapid surface evaporation, while the latter reflects slower internal moisture diffusion. The ID-treated samples consistently demonstrated higher drying rates, particularly in the early stage, supporting the idea that ID reduces surface crusting and improves internal water migration. Among the pretreatments, PC again outperformed BS and the control samples, especially at the 0.3 and 0.6 mol/kg concentrations, which sustained higher drying rates. These levels appear to achieve optimal structural loosening without compromising tissue integrity. In particular, 0.3 mol/kg exhibited superior performance compared with higher concentrations, likely because excessive alkalinity can lead to over-swelling or structural collapse, which hinders effective water transport [34,35]. In addition, high-pH conditions can alter protein–protein and protein–water interactions, promoting capillary water movement through structural weakening [34,35]. Thus, the combination of strong alkalinity and ID significantly improved moisture removal.
The drying kinetics were analyzed using four thin-layer models: Page, Newton, Henderson and Pabis, and Midilli–Kucuk (Table 3). Model performance was evaluated using three metrics: (i) R-squared (R2), indicating the proportion of variance in the experimental data explained by the model, with values closer to 1 representing better fit, (ii) Sum of Squared Errors (SSEs), measuring the total squared deviation between the predicted and observed values; a lower SSE indicates better accuracy, and (iii) root mean square error (RMSE), providing the average magnitude of the prediction error, with a lower RMSE signifying more precise model predictions. Based on these criteria, the Midilli–Kucuk model showed superior performance, with the highest average R2 (0.9974) and the lowest SSE (0.0481) and RMSE (0.1688), effectively capturing both exponential and linear moisture loss behaviors. The model constants offered further insights. The parameter a, ideally near 1, reflects model alignment with the experimental data; most samples showed values close to 1.000, confirming accuracy.
The drying constant k reflects the drying rate, with higher values observed in the PC-treated samples, particularly PC_ID_0.3 (0.0609) and PC_ID_0.6 (0.0580), indicating enhanced internal diffusivity. The exponent n reflects the drying behavior throughout the process. Values around 1.3–1.5 in the ID samples suggest a more gradual drying curve after initial evaporation, consistent with internal redistribution facilitated by both ID and alkaline-induced porosity [23]. The linear term b accounts for residual moisture loss during the slower final phase. Although typically small, b was higher in the CD samples, reflecting slower final drying due to crust formation. In contrast, the PC and ID treatments had lower b values, indicating less resistance to internal moisture flow. Altogether, the constants confirm that the Midilli–Kucuk model accurately describes the drying dynamics and the synergistic effect of the PC pretreatment and intermittent drying.
The drying time required to reach ~18% moisture varied significantly. The ID treatments shortened the drying time compared to CD. PC_ID_0.3 achieved the shortest drying time (421 min), followed by PC_ID_0.6 (428 min) and BS_ID_0.3 (431 min), while the control CD sample required the longest (495 min). These findings demonstrate that the PC pretreatment, especially when paired with ID, enhances dehydration by improving porosity, moisture diffusion, and minimizing structural damage.
Overall, the combined effects of the alkaline pretreatment and drying regime critically influence the drying kinetics and product quality. The Midilli–Kucuk model, due to its robust predictive capability, is recommended for simulating and optimizing squid drying processes under such variable conditions.

3.2. Texture Characteristics of Dried Squid

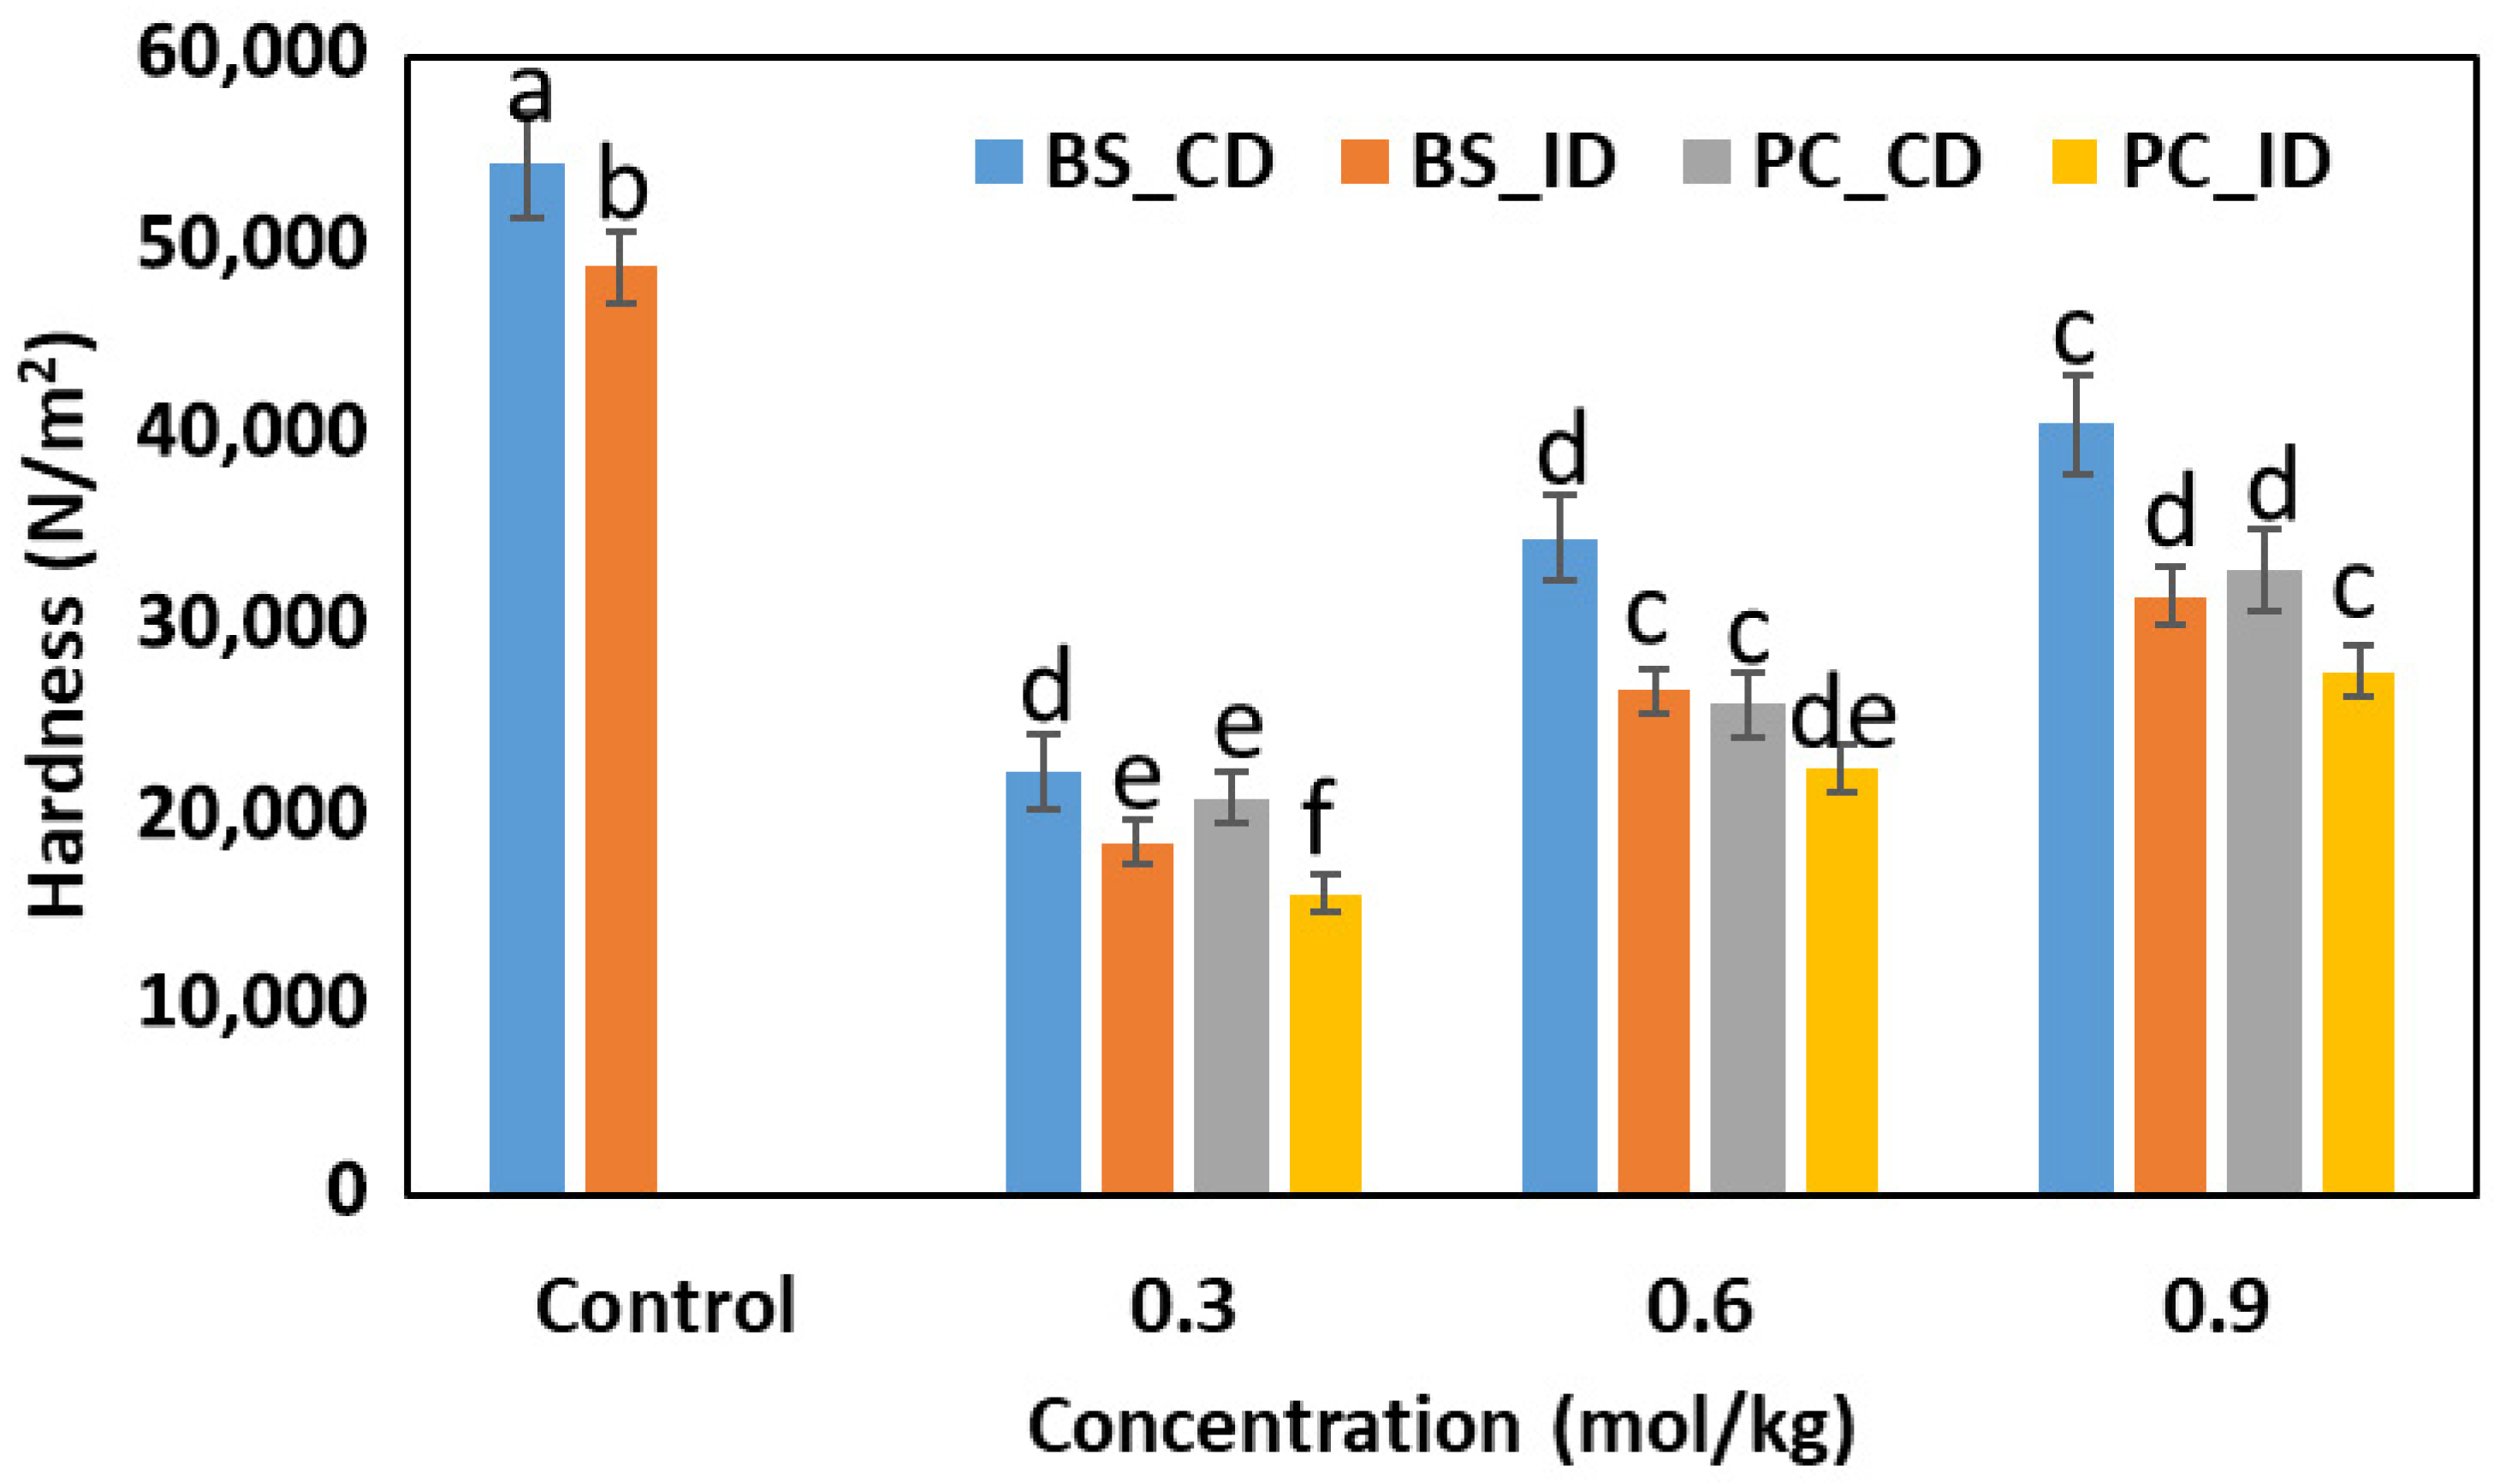
Figure 4 presents the hardness values of the dried squid samples, expressed as stress (N/m2). The control samples under CD and ID exhibited the highest values, 56,408 N/m2 and 49,325 N/m2, respectively. These elevated values suggest surface hardening, typically caused by rapid surface dehydration during CD, which forms a crust and restricts internal moisture movement [33]. ID, by incorporating rest periods, mitigated this effect, lowering hardness and promoting uniform internal moisture redistribution.
The alkaline-treated samples showed markedly lower hardness across all concentrations and drying modes. Notably, PC_ID_0.3 mol/kg recorded the lowest value (15,870 N/m2), followed by PC_ID at 0.6 mol/kg (22,364 N/m2), indicating that PC was more effective than BS in softening squid tissue. This effectiveness is linked to PC’s higher alkalinity, which facilitates protein unfolding, collagen solubilization, and weakening of the muscle matrix [36,37]. Alkaline soaking may also induce partial proteolysis and electrostatic repulsion among myofibrillar proteins, further improving softness [38].
From a mechanical perspective, the cutting test results suggest that the control samples exhibit a more brittle texture, characterized by abrupt fracture and resistance to deformation, which may result in a tough, less palatable mouthfeel. In contrast, the alkaline-treated samples, especially those soaked with potassium carbonate and dried intermittently, exhibited more ductile behavior with gradual deformation before fracture, leading to a softer, easier-to-chew texture. This ductile-like behavior is particularly important for elderly consumers, who often experience reduced chewing strength and saliva production, making brittle or hard textures difficult and potentially unsafe to consume.
Practically, hardness values between 10,000 and 50,000 N/m2 are considered appropriate for easier mastication in older adults [11]. All the alkaline-treated samples, especially those with potassium carbonate under intermittent drying, met this criterion, supporting their suitability for inclusion in age-targeted dried seafood products. These findings align with previous research where Harikedua and Mireles [39] reported significant softening effects in fish fillets pretreated with alkaline salts. Additionally, Pacheco-Aguilar and Mazorra-Manzano [40] found that proteolytic activity enhanced by high-pH treatments reduces the mechanical resistance of seafood muscle during mastication, improving its appropriateness for individuals with chewing difficulties.
Overall, alkaline soaking, particularly with potassium carbonate, coupled with intermittent drying is a promising strategy for producing dried squid with a significantly improved, ductile-like texture, offering potential for inclusion in elderly food systems.

3.3. Color Changes in Dried Squid

The color parameters (L*, a*, b*) of and total color difference (ΔE) in the dried squid samples are shown in Table 4. Fresh squid had a light, slightly yellow color with a high L* (58.21), low a* (1.91), and moderate b* (4.32). All drying treatments reduced L* and increased a* and b*, indicating darkening and browning due to Maillard reactions, pigment oxidation, and protein denaturation [41].
The control samples showed a higher ΔE under CD (27.80) than ID (22.07), suggesting that intermittent drying reduces color degradation by moderating the temperature and heat exposure. Pretreatment with BS or PC improved color retention, especially at higher concentrations (0.9 mol/kg), which helped preserve the L* values. Among all samples, PC_ID_0.3 had the lowest ΔE (14.32), highest L* (45.18), and moderate a* (6.71) and b* (7.81), indicating reduced browning and better visual quality.
PC’s superior performance, particularly under ID, may result from its alkalinity and mineral content, which stabilize pigments and inhibit non-enzymatic browning [41]. ID likely enhances this by reducing thermal stress and allowing moisture redistribution. This aligns with Fathi et al. [42], who reported that intermittent drying preserves color in heat-sensitive foods. The BS-treated samples showed greater variation (ΔE = 16.92–25.03) and did not demonstrate consistent improvements across concentrations. Overall, PC_ID_0.3 provided the best color retention in dried squid, effectively preserving the visual appearance.

3.4. Water Activity of Dried Squid

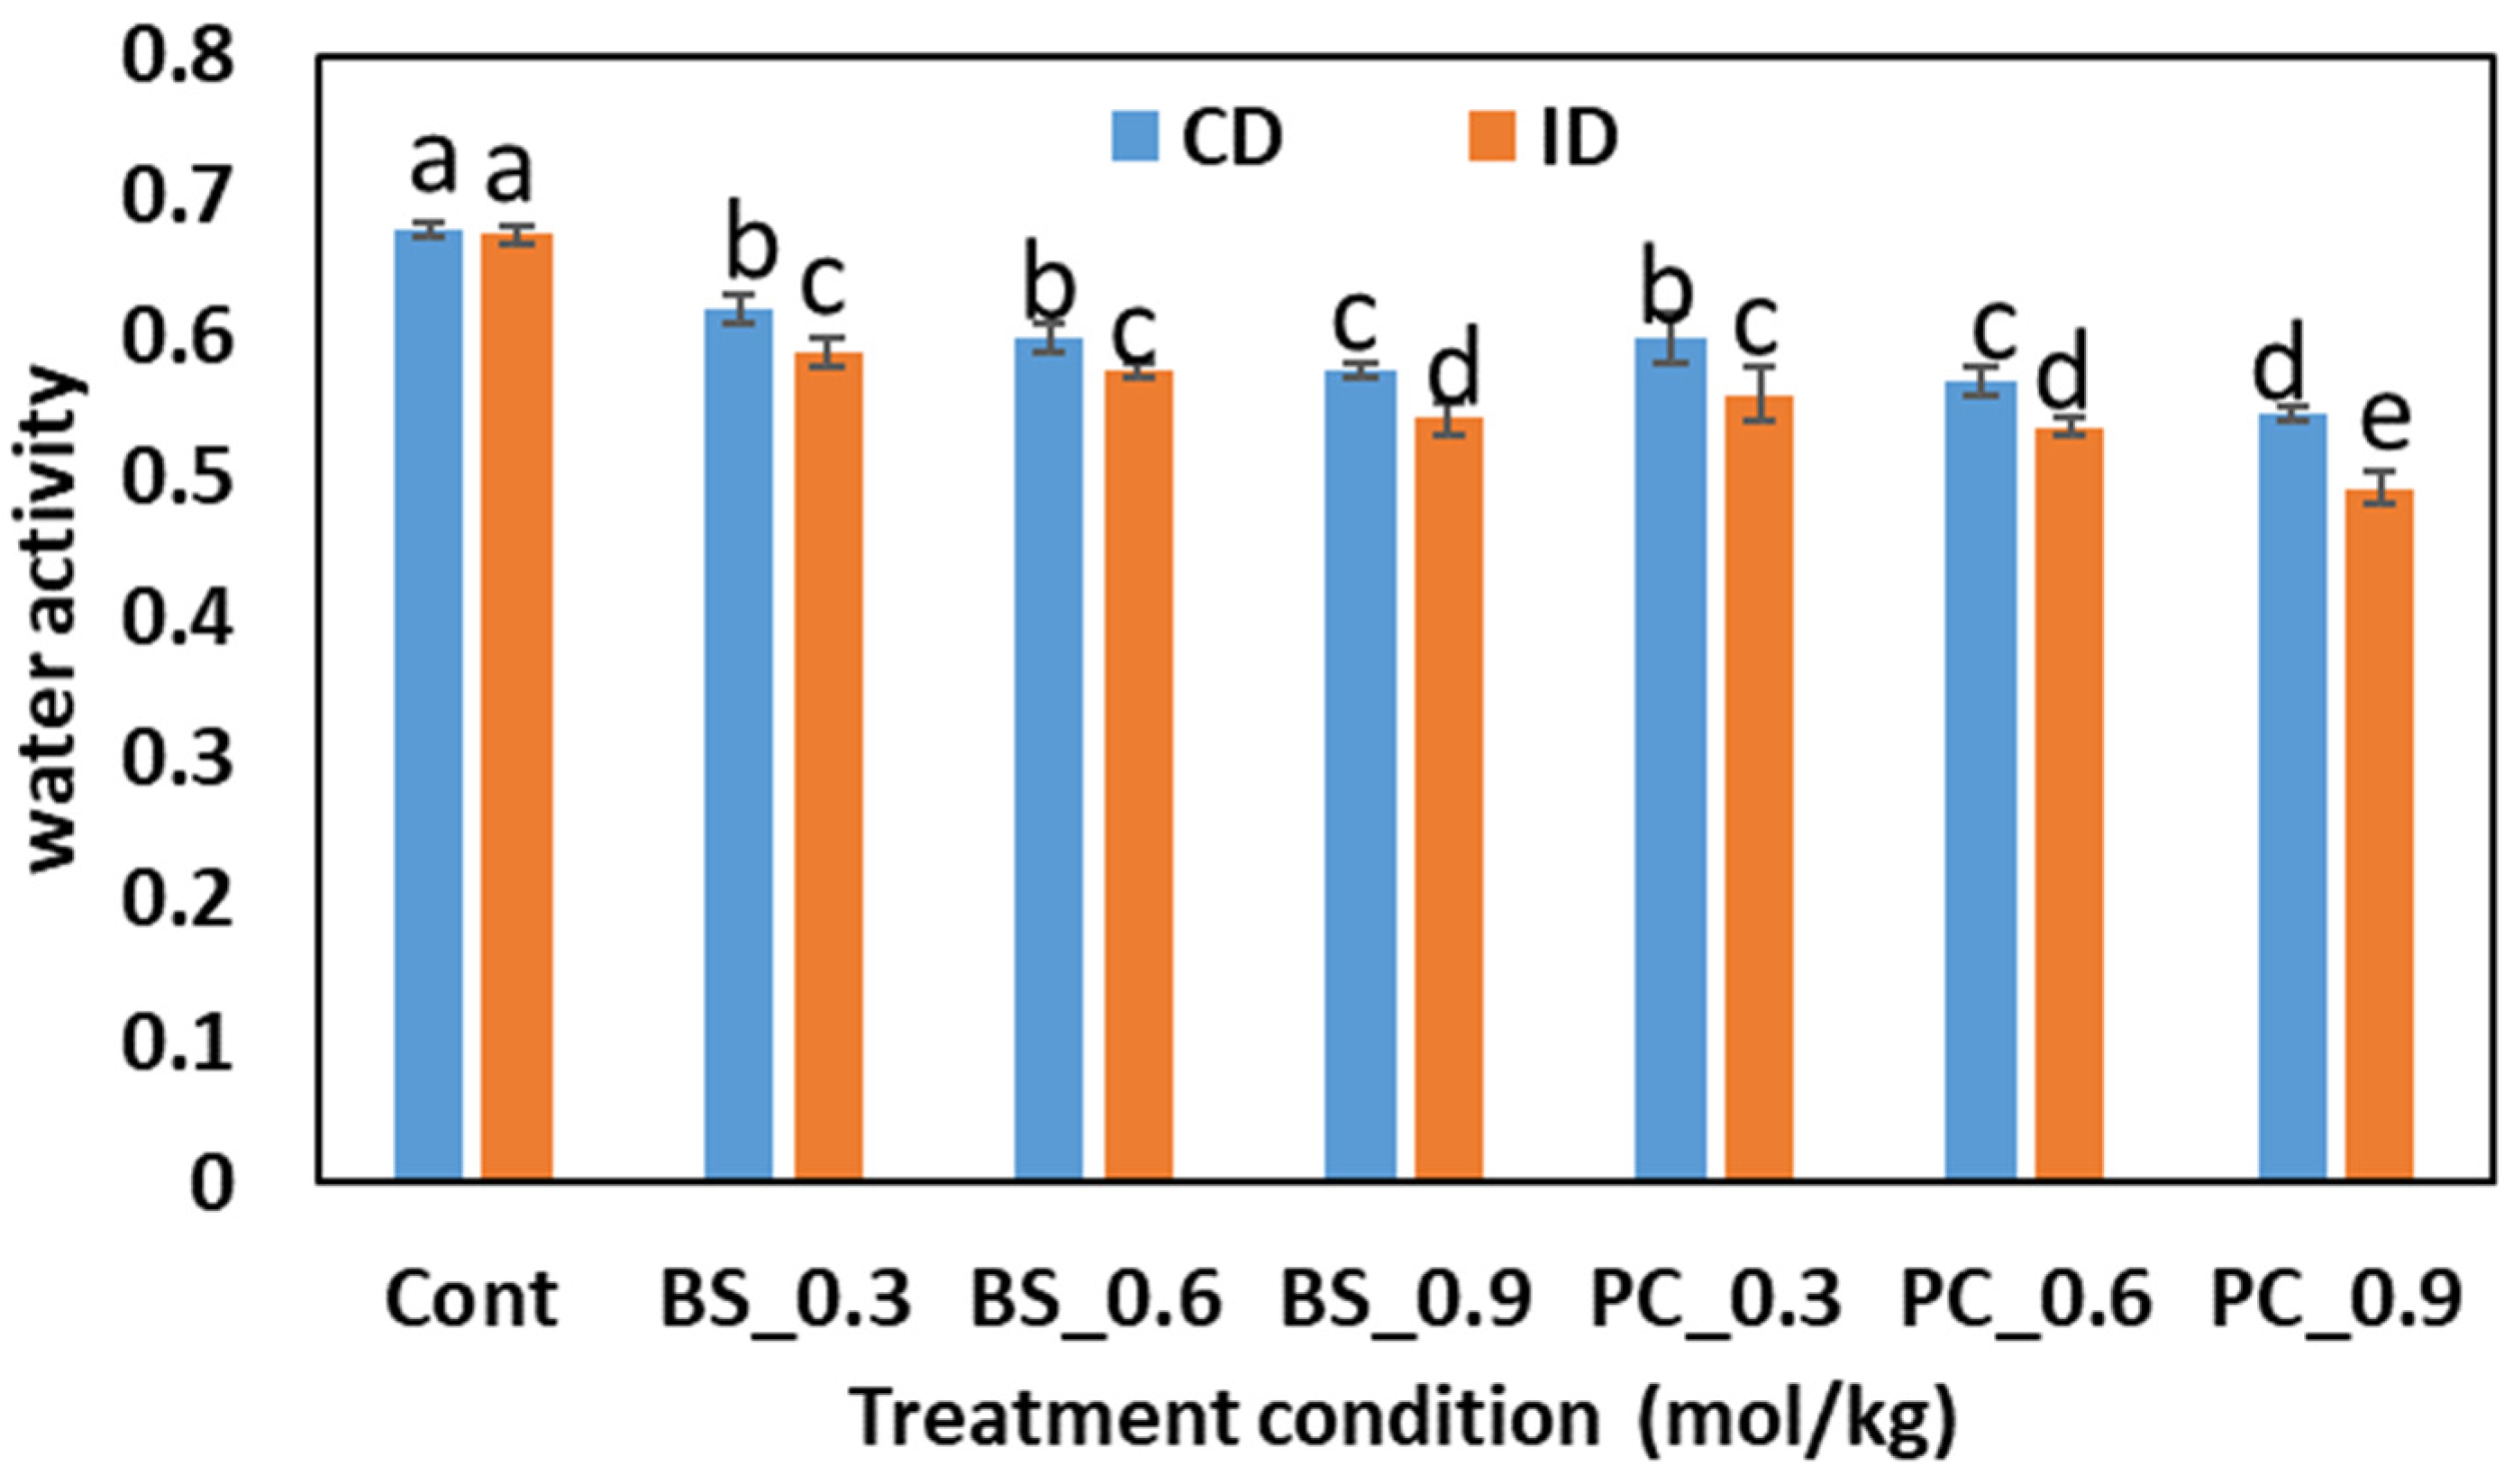
The water activity (aw) of the dried squid samples is shown in Figure 5. Water activity critically influences microbial stability, chemical reactivity, and overall shelf life. For dried seafood, a aw below 0.6 is generally considered effective for inhibiting microbial growth [43]. In this study, the control samples had the highest aw (CD: 0.67, ID: 0.66), exceeding the safe threshold. This indicates that drying alone, without pretreatment, was insufficient to reduce the moisture-binding capacity to desirable levels.
In contrast, the alkali-treated samples, particularly those dried under intermittent conditions (ID), showed a significantly lower aw. The lowest value was observed in PC_0.9_ID (aw = 0.50), followed by PC_0.6_ID (aw = 0.53), both well below 0.6, suggesting improved shelf stability. This reduction is linked to chemical modifications of squid proteins. Both PC and BS disrupt ionic bonds and unfold myofibrillar proteins, facilitating greater moisture release during drying [34]. PC’s higher alkalinity caused more extensive protein swelling and matrix loosening, explaining its stronger effect compared to BS at equivalent concentrations.
Additionally, ID outperformed CD in lowering aw, especially at higher alkaline concentrations. The tempering phases in ID reduce surface crusting, enabling more uniform internal moisture migration [24]. This improves deep moisture removal and contributes to lower final aw values.
Overall, alkaline soaking, especially with PC and intermittent drying, substantially improved moisture diffusivity and reduced aw, enhancing microbial safety and storability. These treatments are promising for producing elder-friendly dried squid products stable at ambient temperatures without refrigeration.

3.5. Scanning Electron Microscopy of Dried Squid

The SEM micrographs in Figure 6 show microstructural differences in squid muscle fibers affected by soaking agents (BS or PC), their concentrations (0.3, 0.6, 0.9 mol/kg), and drying methods (CD or ID). Major structural changes included fiber shrinkage, compaction, and inter-fiber space retention. The control samples showed highly compact, collapsed fibers, which are severe under CD and moderate under ID due to direct thermal stress and irreversible protein denaturation, contributing to increased hardness and discoloration, as discussed in Section 3.2 and Section 3.3.
Alkaline soaking reduced structural damage, but preservation depended on the alkaline type, concentration, and drying mode. The BS-treated samples, especially at 0.6–0.9 mol/kg, had dense, indistinct muscle fibers under CD. This likely resulted from over-swelling during soaking and collapse during drying, weakening connective tissues and reducing porosity. The compact matrix limited moisture removal and explained the higher hardness values.
In contrast, the PC-treated samples, particularly PC_ID_0.3, maintained porous, well-separated fibers, indicating lower thermal stress and better tissue preservation. Visible inter-fiber gaps and less shrinkage suggest potassium carbonate at 0.3 mol/kg provided optimal structural modification by increasing the pH and improving myofibrillar protein stability. The associated lower hardness and higher brightness support this, highlighting PC_ID_0.3’s superior microstructural integrity.
Overall, the SEM results confirm that intermittent drying combined with mild alkaline pretreatment (PC at 0.3 mol/kg) minimizes structural degradation and enhances the final product quality. This approach is promising for producing dried squid with improved texture and appearance, particularly for applications requiring softer, more manageable food structures.

3.6. Storability Analysis

The microbial stability of the dried squid samples was assessed during storage at 25 °C and 40 °C for 14 days (Table 5). The initial microbial loads ranged from 2.42 to 2.71 log CFU/g, indicating effective microbial reduction during drying. At 25 °C, the microbial counts remained stable, with minimal increases (<0.1 log CFU/g), confirming that both the drying and alkaline treatments effectively inhibited microbial growth under ambient conditions.
At 40 °C, microbial loads increased slightly by day 7, reaching 2.62–2.80 log CFU/g. Notably, PC_ID_0.3, identified earlier for its soft texture and better appearance (Section 3.2 and Section 3.3), also showed relatively lower microbial counts (2.71 log CFU/g), suggesting enhanced preservation due to improved moisture removal. This supports findings that intermittent drying disrupts microbial cycles by extending thermal exposure [44].
The control samples (Control_CD and Control_ID) showed slightly higher growth at 40 °C, reaching up to 2.92 log CFU/g, highlighting the additional microbial suppression provided by alkaline soaking. Alkaline pretreatment is known to alter osmotic balance and damage microbial membranes [45].
The combination of alkali soaking and ID drying proved most effective in maintaining microbial stability. Although all samples remained below the spoilage limit of 5 log CFU/g [46], the observed increase at 40 °C underscores the importance of cool storage to extend the shelf life of dried squid products.

3.7. Numerical Simulation of Heat and Mass Transfer in Squid During Drying Proccess

The simulation of squid drying behavior was validated by comparing the predicted moisture ratio (MR) curves with the experimental data (Figure 7). The MR profiles generated from the mass transfer model aligned closely with the experimental values for both the continuous drying (CD) and intermittent drying (ID) conditions. The root mean square error (RMSE) was <0.068 for CD and <0.055 for ID, indicating high predictive accuracy. This confirms the model’s reliability in capturing squid drying kinetics under different regimes, consistent with prior seafood drying simulations [18,28].
The simulation enabled the accurate prediction of the drying time needed to reach the target moisture content, crucial for improving energy efficiency and product quality. MR trends varied between CD and ID: CD showed a steady MR decline due to continuous heat and mass transfer, while ID exhibited a stepwise MR decrease, resulting from tempering periods that facilitated internal moisture redistribution and reduced surface hardening [33]. Consequently, the ID samples generally retained lower moisture at equivalent times.
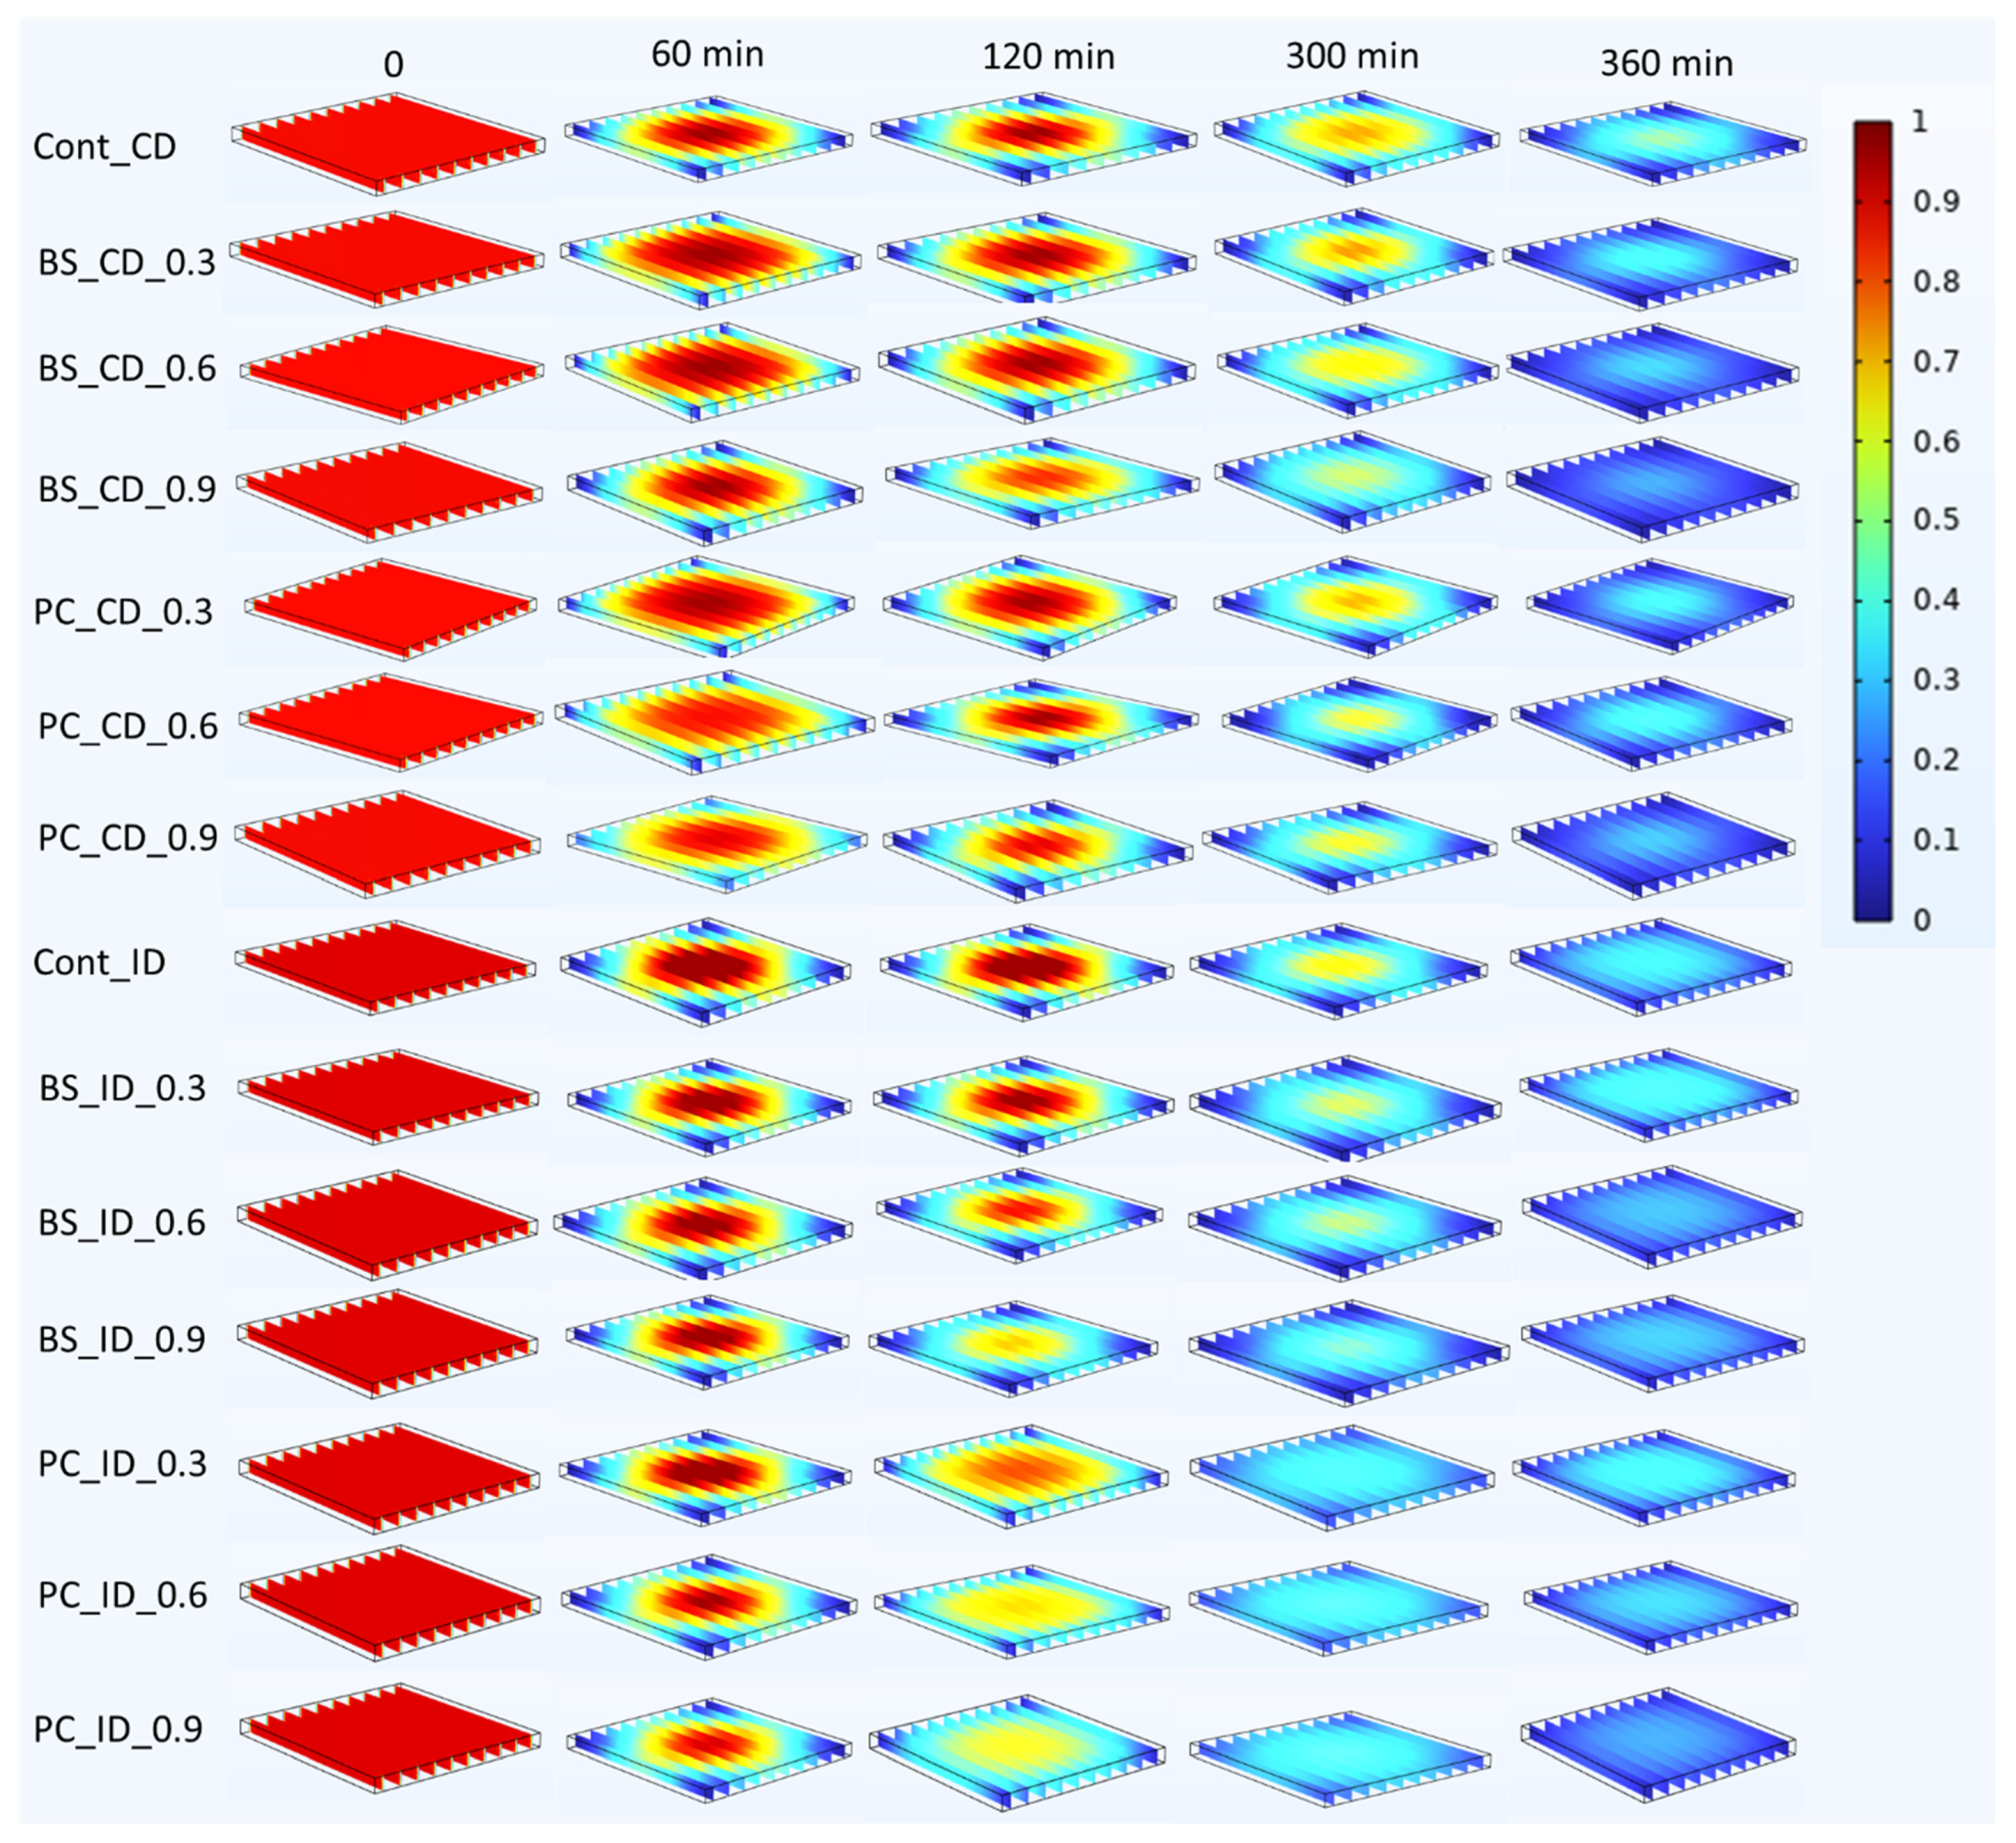
Figure 8 displays the spatial moisture distribution within the squid. The CD samples retained high core moisture due to crust formation, impeding internal moisture migration. In contrast, ID produced more uniform moisture profiles, attributed to rest intervals that allow equilibration. These results are consistent with reports that ID enhances internal moisture mobility and reduces stress gradients, leading to better texture [33].
Simulation also examined the influence of the soaking medium concentration. Higher concentrations led to a faster MR reduction, especially early in drying. This can be attributed to stronger osmotic gradients enhancing water loss and increasing porosity, which promotes internal moisture migration. Similar behavior has been reported in the osmotic dehydration of marine products [47].
The relationship between the moisture content and internal temperature distribution is further demonstrated in Figure 9. Under CD conditions, the sample exhibited a temperature gradient with lower temperatures at the center, especially during the early and middle drying stages (≤300 min). This is consistent with the high moisture content in the core, which absorbs latent heat during evaporation, thereby lowering the temperature. In contrast, the ID-treated samples exhibited more uniform temperature profiles across the tissue. This can be attributed to the intermittent resting periods, which allow heat conduction to equalize the internal temperature while moisture redistribution limits local evaporative cooling. Among the ID-treated samples, no significant variation in temperature profiles was observed across different soaking medium concentrations. Similarly, the CD-treated samples exhibited consistent temperature trends regardless of the soaking concentration. These results can be partly attributed to the thin geometry of the squid samples (0.5 ± 0.1 cm), which reduces the thermal and moisture gradients due to the small diffusion path and rapid equilibration across the thickness. This agrees with prior studies highlighting that sample geometry significantly influences the thermal and mass transfer behavior in drying processes [17].
These findings hold significant implications for the development of texture-modified seafood products suitable for elderly individuals and patients with dysphagia. The ID method’s ability to achieve uniform moisture and temperature distribution offers a controlled approach to softening the product structure, reducing toughness and enhancing the rehydration properties. This is crucial for producing safe-to-consume, easily chewable and swallowable dried squid products that align with the dietary guidelines for texture-modified diets [11]. The simulation model thus serves as a valuable tool not only for process optimization but also for designing personalized, elder-friendly foods with predictable and reproducible qualities tailored to the physiological needs of vulnerable populations.

4. Conclusions

This study developed an elder-friendly dried squid by optimizing softening and drying via alkaline soaking and intermittent drying (ID). Sodium bicarbonate (NaHCO3) and potassium carbonate (K2CO3) were tested at 0, 0.3, 0.6, and 0.9 mol/kg, with drying by continuous (CD) or intermittent (ID) hot air at 40 °C targeting 18.34 ± 0.44% moisture. The optimum condition was squid soaked in 0.3 mol/kg K2CO3 and dried with ID, yielding low hardness suitable for elderly mastication, safe water activity, minimal color change, and microbial safety. The drying kinetics fit best with the Midilli–Kucuk model (R2 = 0.9974), accurately describing both the rapid and slow drying phases. The drying constants (k, n, b) showed ID and K2CO3 improved the drying efficiency and reduced moisture resistance. SEM analysis indicated ID with 0.3 mol/kg K2CO3 increased porosity and reduced fiber collapse, enhancing moisture migration and surface quality. Numerical simulations matched the experiments (RMSE < 0.068 for CD, <0.055 for ID), showing ID improved moisture and temperature uniformity and lowered structural stress. Combining mild alkaline soaking with intermittent drying effectively produces dried squid with improved texture and stability. Predictive modeling is a valuable tool for optimizing the process and quality control of texture-modified seafood for aging consumers. Future work should include clinical validation, sensory evaluation, and consumer acceptance to ensure market readiness. These steps will facilitate industrial application and health-focused product development.

Author Contributions

Conceptualization, T.M.O. and W.B.Y.; methodology, T.M.O. and W.B.Y.; validation, T.M.O. and W.B.Y.; investigation, T.M.O.; resources, W.B.Y.; writing—original draft preparation, T.M.O.; writing—review and editing, W.B.Y. All authors have read and agreed to the published version of the manuscript.

Funding

Korea Institute of Planning and Evaluation for Technology in Food, Agriculture, Forestry and Fisheries (IPET) through the Food and Rural Affairs Research Center. Support program, funded by the Ministry of Agriculture, Food and Rural Affairs (MAFRA) (RS-2024-00509810). This research was supported by the Basic Science Research Program through the National Research Foundation of Korea (NRF), funded by the Ministry of Education (NRF2018R1D1A3B06042501).

Informed Consent Statement

Not applicable.

Data Availability Statement

The data presented in this study are available in the article. Further inquiries can be directed to the corresponding author.

Conflicts of Interest

The authors declare no conflicts of interest.

References

  1. Pearce, R.; Conlon, C.; Beck, K.; Mumme, K.; Mazahery, H.; Batty, R.; von Hurst, P. The effect of motivation type on intake and nutritional status of vitamin B12, omega-3 fatty acids, iron and nutrition knowledge in individuals following a vegan diet. Proc. Nutr. Soc. 2024, 83, E136. [Google Scholar] [CrossRef]
  2. Viji, P.; Debbarma, J.; Rao, B.Á. Nutritional significance of seafood. In Training Manual on Value Addition of Seafood; ICAR-Central Institute of Fisheries Technology: Cochin, India, 2018. [Google Scholar]
  3. Cui, Z.; Manoli, T.; Nikitchina, T.; Mo, H. Trends of Processed Products of Squid 2020. Available online: https://card-file.ontu.edu.ua/handle/123456789/16728 (accessed on 25 April 2025).
  4. Chen, J.M.; Li, F.; Zheng, Y.Q.; Shi, X.; Guo, Y. The review of comprehensive utilization with high value of squid processing by-products. Fish. Mod. 2015, 42, 44–47. [Google Scholar]
  5. Cheng, S.; Su, W.; Yuan, L.; Tan, M. Recent developments of drying techniques for aquatic products: With emphasis on drying process monitoring with innovative methods. Dry. Technol. 2021, 39, 1577–1594. [Google Scholar] [CrossRef]
  6. Zhu, Y.; Chen, X.; Qiao, K.; Chen, B.; Xu, M.; Cai, S.; Liu, Z. Combined effects of cold and hot air drying on physicochemical properties of semi-dried Takifugu obscurus fillets. Foods 2023, 12, 1649. [Google Scholar] [CrossRef]
  7. Khan, M.A.; Moradipour, M.; Obeidullah, M.; Quader, A.A. Heat and mass transport analysis of the drying of freshwater fishes by a forced convective air-dryer. J. Food Process Eng. 2021, 44, e13574. [Google Scholar] [CrossRef]
  8. Tan, C.H.; Hii, C.L.; Borompichaichartkul, C.; Phumsombat, P.; Kong, I.; Pui, L.P. Valorization of fruits, vegetables, and their by-products: Drying and bio-drying. Dry. Technol. 2022, 40, 1514–1538. [Google Scholar] [CrossRef]
  9. Thiyagalingam, S.; Kulinski, A.E.; Thorsteinsdottir, B.; Shindelar, K.L.; Takahashi, P.Y. Dysphagia in older adults. Mayo Clin. Proc. 2021, 96, 488–497. [Google Scholar] [CrossRef]
  10. De Sire, A.; Ferrillo, M.; Lippi, L.; Agostini, F.; de Sire, R.; Ferrara, P.E.; Migliario, M. Sarcopenic dysphagia, malnutrition, and oral frailty in elderly: A comprehensive review. Nutrients 2022, 14, 982. [Google Scholar] [CrossRef]
  11. IDDSI. Testing Methods. Available online: https://iddsi.org/Testing-Methods (accessed on 25 April 2025).
  12. Xiong, G.; Fu, X.; Pan, D.; Qi, J.; Xu, X.; Jiang, X. Influence of ultrasound-assisted sodium bicarbonate marination on the curing efficiency of chicken breast meat. Ultrason. Sonochem. 2020, 60, 104808. [Google Scholar] [CrossRef]
  13. Zhao, D.; Wei, J.; Hao, J.; Han, X.; Ding, S.; Yang, L.; Zhang, Z. Effect of sodium carbonate solution pretreatment on drying kinetics, antioxidant capacity changes, and final quality of wolfberry (Lycium barbarum) during drying. LWT 2019, 99, 254–261. [Google Scholar] [CrossRef]
  14. Lin, H.T.V.; Wu, H.X.; Sung, W.C. Hardness and quality of abalone (Haliotis discus hannai diversicolor diversicolor) muscle as suitably softened for seniors. Int. J. Food Prop. 2021, 24, 579–591. [Google Scholar] [CrossRef]
  15. Liu, Y.; Kang, Z.L.; Ge, Q.; Hou, Q.; Liu, R.; Meng, X. Effect of water and sodium carbonate swelling on the texture properties and water distribution of dried Abalone rugosa muscle. Food Mater. Res. 2023, 4, E004. [Google Scholar] [CrossRef]
  16. Nam, S.H.; Ha, Y.S.; Kim, T.W. Effects of drying methods based on exhaust cycle and time on the quality and drying of red peppers. J. Biosyst. Eng. 2014, 39, 101–110. [Google Scholar] [CrossRef]
  17. Park, H.W.; Yoon, W.B. Effects of air movement in a hot air dryer on the drying characteristics of colored potato (Solanum tuberosum L.) using computational fluid dynamics. Int. J. Agric. Biol. Eng. 2018, 11, 232–240. [Google Scholar] [CrossRef]
  18. Soydan Karabacak, M. Finite Element Modelling and Simulation of Drying Isotropic and Anisotropic Food Samples. Ph.D. Thesis, Middle East Technical University, Ankara, Türkiye, 2013. Available online: https://open.metu.edu.tr/handle/11511/22289 (accessed on 25 April 2025).
  19. Sun, D.W.; Hu, Z. CFD simulation of coupled heat and mass transfer through porous foods during vacuum cooling process. Int. J. Refrig. 2003, 26, 19–27. [Google Scholar] [CrossRef]
  20. Oyinloye, T.M.; Yoon, W.B. Characterization of the powder flow behavior of cooked Adzuki bean using image analysis and grinding models. J. Food Eng. 2024, 381, 112159. [Google Scholar] [CrossRef]
  21. Ghanem, T.H.M.; Nsasrat, L.S.; Younis, O.S.; Metwally, K.A.; Salem, A.; Orban, Z.; Elwakeel, A.E. Thin-layer modeling, drying parameters, and techno-enviro-economic analysis of a solar dried salted tilapia fish fillets. Sci. Rep. 2025, 15, 5073. [Google Scholar] [CrossRef]
  22. Page, G.E. Factors Influencing the Maximum Rates of Air Drying Shelled Corn in Thin layers. Master’s Thesis, Purdue University, West Lafayette, IN, USA, 1949. [Google Scholar]
  23. Erbay, Z.; Icier, F. A review of thin layer drying of foods: Theory, modeling, and experimental results. Crit. Rev. Food Sci. Nutr. 2010, 50, 441–464. [Google Scholar] [CrossRef]
  24. Midilli, A.; Kucuk, H.; Yapar, Z. A new model for single-layer drying. Dry. Technol. 2002, 20, 1503–1513. [Google Scholar] [CrossRef]
  25. Henderson, S.M.; Pabis, S. Grain drying theory. II. Temperature effects on drying coefficients. J. Agric. Eng. Res. 1961, 6, 169–174. [Google Scholar]
  26. Deng, Y.; Luo, Y.; Wang, Y.; Yue, J.; Liu, Z.; Zhong, Y.; Yang, H. Drying-induced protein and microstructure damages of squid fillets affected moisture distribution and rehydration ability during rehydration. J. Food Eng. 2014, 123, 23–31. [Google Scholar] [CrossRef]
  27. Park, H.W.; Han, W.Y.; Yoon, W.B. Drying characteristics of soybean (Glycine max) using continuous drying and intermittent drying. Int. J. Food Eng. 2018, 14, 20180057. [Google Scholar] [CrossRef]
  28. Komolafe, C.A. Numerical Simulation of the 3D simultaneous heat and mass transfer in a forced convection solar drying system integrated with thermal storage material. J. Sol. Energy Eng. 2023, 145, 051012. [Google Scholar] [CrossRef]
  29. Tu, Q.; Ma, Z.; Wang, H. Investigation of wet particle drying process in a fluidized bed dryer by CFD simulation and experimental measurement. Chem. Eng. J. 2023, 452, 139200. [Google Scholar] [CrossRef]
  30. Singh, S.; Kumar, S. Development of convective heat transfer correlations for common designs of solar dryer. Energy Convers. Manag. 2012, 64, 403–414. [Google Scholar] [CrossRef]
  31. Chen, C.; Pan, Z. An overview of progress, challenges, needs and trends in mathematical modeling approaches in food drying. Dry. Technol. 2023, 41, 2586–2605. [Google Scholar] [CrossRef]
  32. Delfiya, D.A.; Prashob, K.; Murali, S.; Alfiya, P.V.; Samuel, M.P.; Pandiselvam, R. Drying kinetics of food materials in infrared radiation drying: A review. J. Food Process Eng. 2022, 45, e13810. [Google Scholar] [CrossRef]
  33. da Silva, W.P.; Rodrigues, A.F.; Silva, C.M.D.E.; Gomes, J.P. Numerical approach to describe continuous and intermittent drying including the tempering period: Kinetics and spatial distribution of moisture. Dry. Technol. 2017, 35, 272–280. [Google Scholar] [CrossRef]
  34. Jung, J.; Zhao, Y. Alkali- or acid-induced changes in structure, moisture absorption ability and deacetylating reaction of β-chitin extracted from jumbo squid (Dosidicus gigas) pens. Food Chem. 2014, 152, 355–362. [Google Scholar] [CrossRef]
  35. Vidotto, D.C.; Tavares, G.M. Impact of dry heating in an alkaline environment on the structure and foaming properties of whey proteins. Food Bioprocess Technol. 2020, 13, 1755–1764. [Google Scholar] [CrossRef]
  36. Inyang, U.E.; Oboh, I.O.; Etuk, B.R. Kinetic models for drying techniques—Food materials. Adv. Chem. Eng. Sci. 2018, 8, 27–48. [Google Scholar] [CrossRef]
  37. Wang, J.; Xu, Z.; Lu, W.; Zhou, X.; Liu, S.; Zhu, S.; Ding, Y. Improving the texture attributes of squid meat (Sthenoteuthis oualaniensis) with slight oxidative and phosphate curing treatments. Food Res. Int. 2024, 176, 113829. [Google Scholar] [CrossRef]
  38. Konishi, F.; Fukunaga, Y.; Yoneda, C.; Shimomura, M.; Kasai, M.; Hatae, K. Changes in physicochemical properties and microstructure of dried squid during softening treatment. J. Sci. Food Agric. 2003, 83, 1565–1570. [Google Scholar] [CrossRef]
  39. Harikedua, S.D.; Mireles DeWitt, C.A. Preventing soft texture fish fillets through brine injection technology. J. Food Qual. 2017, 2017, 1875872. [Google Scholar] [CrossRef]
  40. Pacheco-Aguilar, R.; Mazorra-Manzano, M.A.; Ramírez-Suárez, J.C. Functional properties of fish protein hydrolysates from Pacific whiting (Merluccius productus) muscle produced by a commercial protease. Food Chem. 2008, 109, 782–789. [Google Scholar] [CrossRef] [PubMed]
  41. Chiou, T.K.; Chang, H.K.; Lo, L.; Lan, H.L.; Shiau, C.Y. Changes in chemical constituents and physical indices during processing of dried-seasoned squid. Fish. Sci. 2000, 66, 708–715. [Google Scholar] [CrossRef]
  42. Fathi, F.; Ebrahimi, S.N.; Matos, L.C.; Oliveira, M.B.P.P.; Alves, R.C. Emerging drying techniques for food safety and quality: A review. Compr. Rev. Food Sci. Food Saf. 2022, 21, 1125–1160. [Google Scholar] [CrossRef]
  43. Butkhot, N.; Soodsawaeng, P.; Samutsan, S.; Chotmongcol, K.; Vuthiphandchai, V.; Nimrat, S. New perspectives for surveying and improving Thai dried seafood qualities using antimicrobials produced by Bacillus velezensis BUU004 against foodborne pathogens. ScienceAsia 2019, 45, 116–126. [Google Scholar] [CrossRef]
  44. Fu, N.; Chen, X.D. Towards a maximal cell survival in convective thermal drying processes. Food Res. Int. 2011, 44, 1127–1149. [Google Scholar] [CrossRef]
  45. Tan, H.; Yu, Y.; Zhu, Y.; Liu, T.; Miao, R.; Hu, R.; Chen, J. Impacts of size reduction and alkaline-soaking pretreatments on microbial community and organic matter decomposition during wheat straw composting. Bioresour. Technol. 2022, 360, 127549. [Google Scholar] [CrossRef]
  46. Gram, L. Microbiological spoilage of fish and seafood products. In Compendium of the Microbiological Spoilage of Foods and Beverages; Springer: New York, NY, USA, 2009; pp. 87–119. [Google Scholar]
  47. Arvanitoyannis, I.S.; Veikou, A.; Panagiotaki, P. Osmotic dehydration: Theory, methodologies, and applications in fish, seafood, and meat products. In Progress in Food Preservation; Rahman, M.S., Ed.; Wiley: Hoboken, NJ, USA, 2012; pp. 161–189. [Google Scholar]
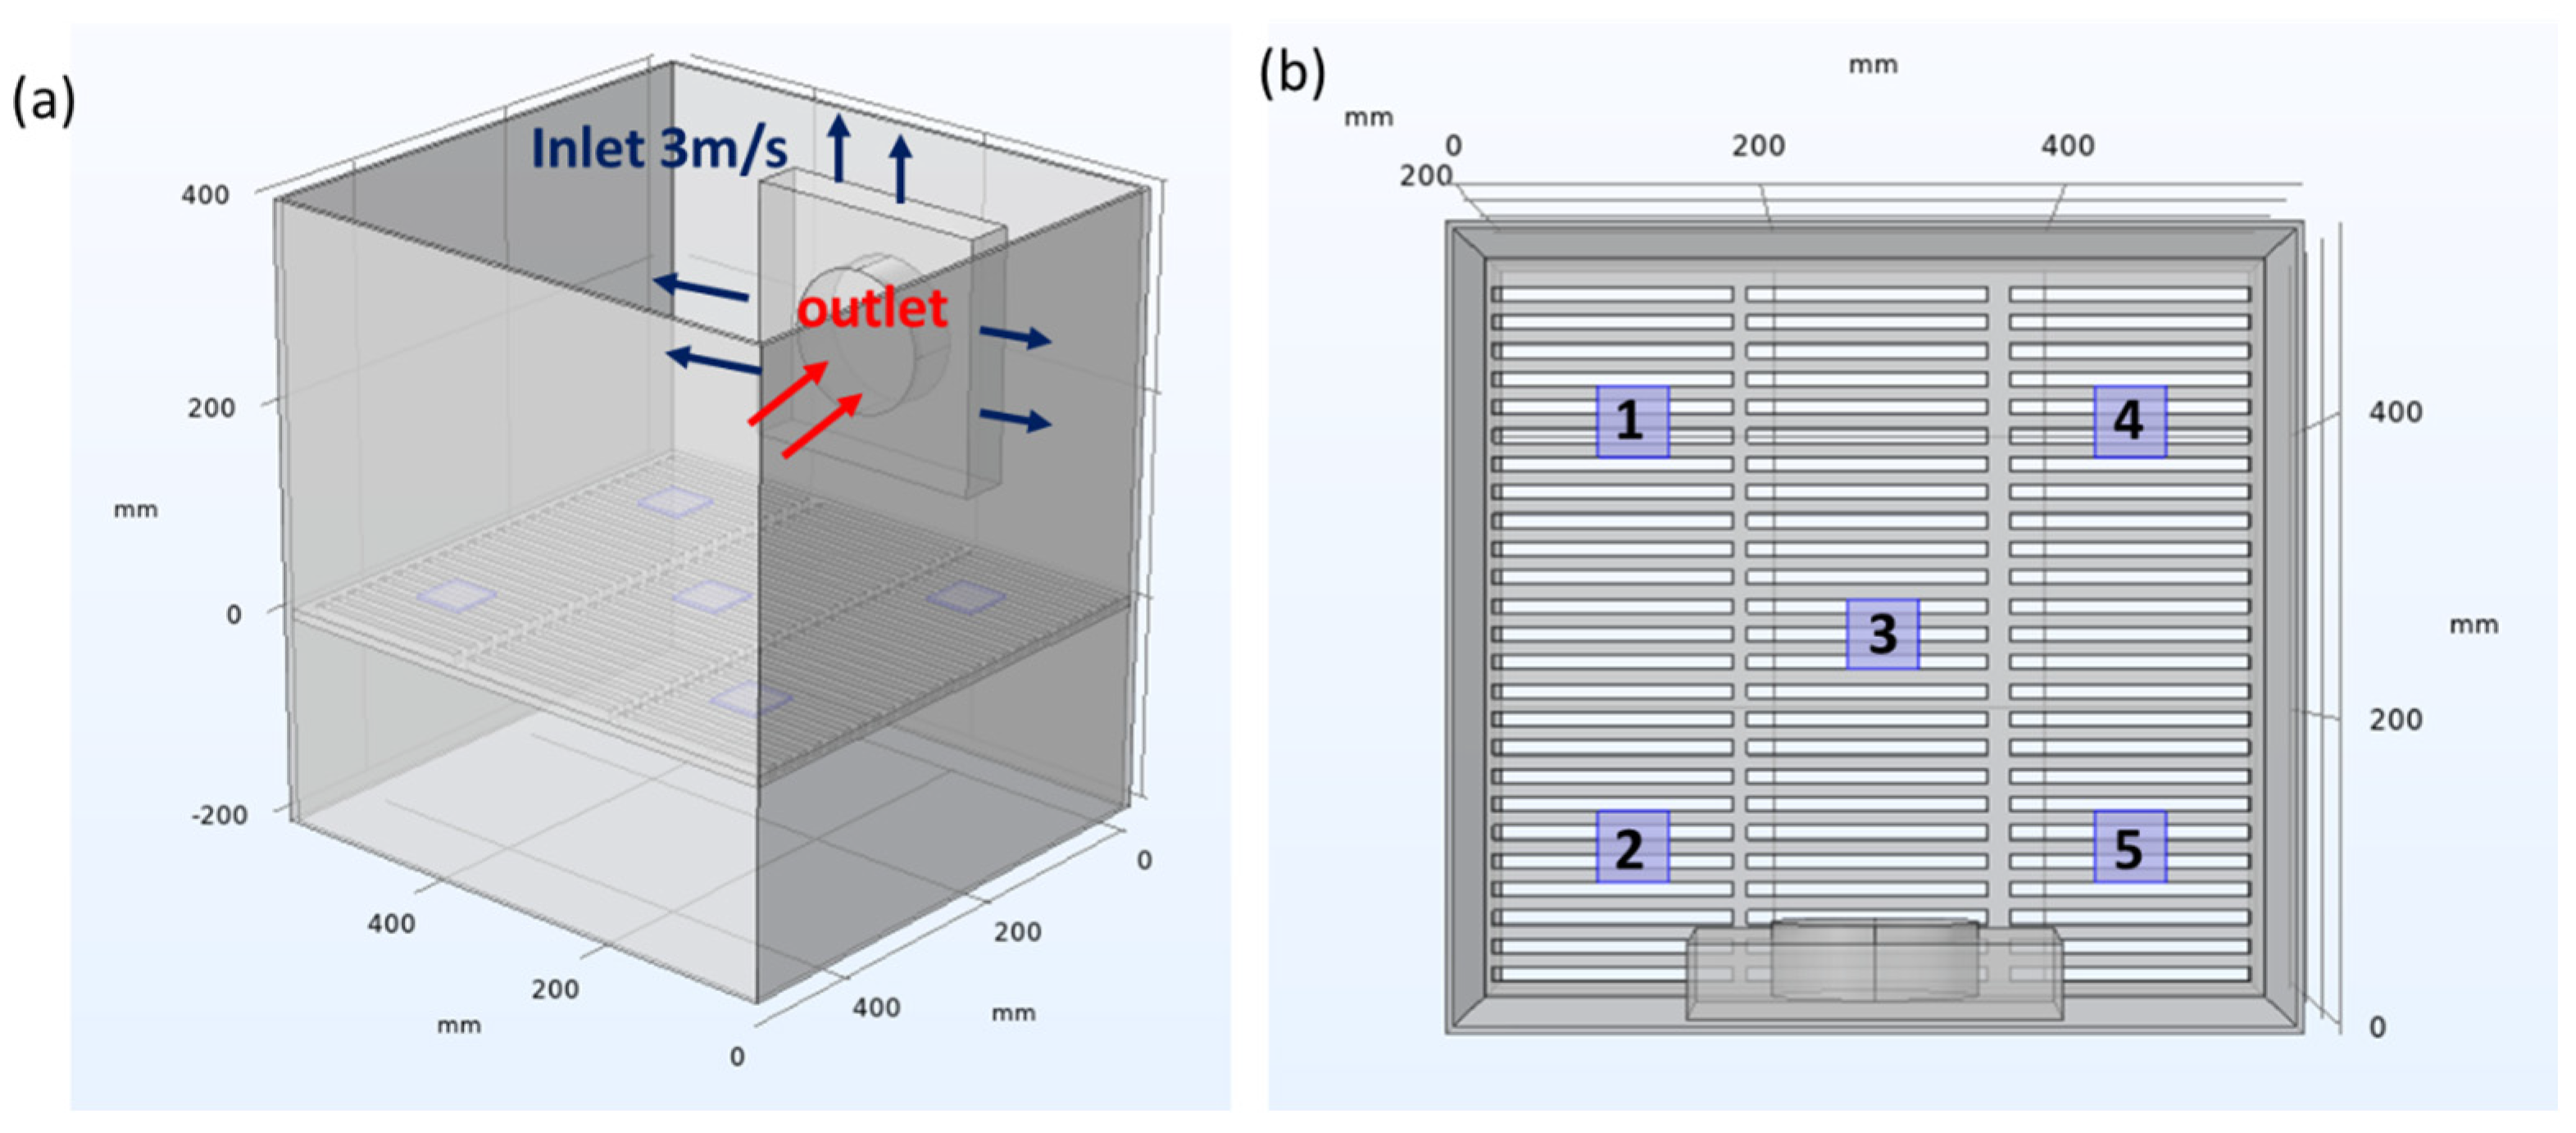
Figure 1. General view of 3D geometrical model of the hot-air dryer (a) and the positions of sample during drying (b) [17].
Processes 13 02592 g001
Figure 2. Moisture ratio of squid samples during drying under different conditions: (a) control, (b) 0.3 mol/kg, (c) 0.6 mol/kg, and (d) 0.9 mol/kg concentrations of sodium bicarbonate (BS) and potassium carbonate (PC). Each subplot compares continuous drying (CD) and intermittent drying (ID) modes. Dash lines represent the Midilli–Kucuk model fitting of the moisture ratio data.
Processes 13 02592 g002
Figure 3. Drying rate of squid samples during drying under different conditions: (a) control, (b) 0.3 mol/kg, (c) 0.6 mol/kg, and (d) 0.9 mol/kg concentrations of sodium bicarbonate (BS) and potassium carbonate (PC). Each subplot compares continuous drying (CD) and intermittent drying (ID) modes.
Processes 13 02592 g003
Figure 4. Effect of alkaline pretreatment and drying method on the hardness of dried squid samples. BS_CD: sodium bicarbonate-treated, continuous drying; BS_ID: sodium bicarbonate-treated, intermittent drying; PC_CD: potassium carbonate-treated, continuous drying; PC_ID: potassium carbonate-treated, intermittent drying. Different letters (a–f) above the bars indicate statistically significant differences (p < 0.05) among the treatments.
Processes 13 02592 g004
Figure 5. Water activity (aw) of dried squid samples subjected to different alkaline soaking treatments (BS: NaHCO3; PC: K2CO3) at varying concentrations (0.3–0.9 mol/kg) and drying methods (CD: continuous drying; ID: intermittent drying). Different letters (a–e) indicate statistically significant differences (p < 0.05) among treatments.
Processes 13 02592 g005
Figure 6. Scanning electron microscopy (SEM) images of dried squid samples treated with different concentrations (0.3, 0.6, and 0.9 mol/kg) of sodium bicarbonate (BS) and potassium carbonate (PC) and subjected to either continuous drying (CD) or intermittent drying (ID). Scale bar = 10 μm.
Processes 13 02592 g006
Figure 7. Comparison of simulated moisture ratio result with experimental data for squid treated with either sodium bicarbonate (BS) or potassium carbonate (PC) at varying concentrations: (a) 0 mol/kg, (b) 0.3 mol/kg, (c) 0.6 mol/kg, and (d) 0.9 mol/kg. Drying was was either continuous drying (CD) or intermittent drying (ID).
Processes 13 02592 g007
Figure 8. Comparison of simulated moisture ratio result for squid treated with either sodium bicarbonate or potassium carbonate solutions.
Processes 13 02592 g008
Figure 9. Comparison of simulated internal temperature profile for squid treated with either sodium bicarbonate or potassium carbonate solutions.
Processes 13 02592 g009
Table 1. Thin-layer drying models for analyzing the drying characteristics of squid.
Model NameModel NameReferences
Page MR = e k t n [22]
NewtonMR = ekt[23]
Midilli–Kucuk equation MR = a e k t n + b t [24]
Henderson and Pabis MR = a e k t [25]
Table 2. Thermal and physical properties of squid, aluminum, and air.
PropertyDensity (ρ) (kg/m3)Specific Heat (cp) (kJ/kg·K)Thermal Conductivity (k) (W/m·K)Reference
Control1065 ± 5 cd3.25 ± 0.03 d0.48 ± 0.02 b
BS_ 0.31070 ± 4 cd3.31 ± 0.04 c0.49 ± 0.01 b
BS_ 0.61082 ± 5 b3.38 ± 0.04 ab0.52 ± 0.02 a
BS_ 0.91095 ± 6 a3.42 ± 0.05 a0.54 ± 0.02 a
PC_ 0.31073 ± 5 c3.29 ± 0.03 cd0.50 ± 0.02 ab
PC_ 0.61088 ± 6 b3.35 ± 0.03 b0.53 ± 0.02 a
PC_ 0.91100 ± 6 a3.40 ± 0.04 a0.55 ± 0.03 a
Aluminum27000.9232.4COMSOL multiphysics (Version 5.1)
Air (at 40 °C)Ideal gas model6.10−7T2 − 4.10−5T + 17.10−5T + 0.0238[17]
“BS” refers to sodium bicarbonate (NaHCO3) treatment, and “PC” denotes potassium carbonate treatment (K2CO3). Concentrations (0.3, 0.6, and 0.9 mol/kg) refer to the soaking solutions applied prior to drying. Different superscript letters (a–d) within the same column indicate significant differences between treatment groups (p < 0.05).
Table 3. Fitted parameters of the thin-layer drying model for squid samples under different alkaline treatments and drying conditions and drying time to reach approximate 18% moisture content.
ConcentrationabknR-SquareSSERMSERequired Drying Time (min)
Cont_CD0.9984−0.00020.02070.64470.99998.3 × 10−50.0024495
Cont_ID1.0020−0.00040.01970.63640.99861.7 × 10−30.0105461
BS_CD_0.31.0040−0.00010.02510.62130.99972.9 × 10−40.0044478
BS_CD_0.61.0030−0.00010.02460.62960.99982.0 × 10−40.0037482
BS_CD_0.91.0030−0.00010.02570.62780.99963.6 × 10−40.0049491
PC_CD_0.31.0080−0.00040.06090.46510.99257.9 × 10−30.0229477
Midilli–Kucuk equPC_CD_0.61.0080−0.00040.05800.45570.98691.4 × 10−20.0301483
PC_CD_0.91.0020−0.00030.02700.56270.99981.4 × 10−40.0030489
BS_ID_0.31.0100−0.00020.01670.70890.99782.7 × 10−30.0134431
BS_ID_0.61.00700.00000.01930.71240.99782.6 × 10−30.0131439
BS_ID_0.91.0100−0.00010.02140.68720.99614.6 × 10−30.0174455
PC_ID_0.30.98440.00000.00690.93850.99803.2 × 10−30.0146421
PC_ID_0.60.9856−0.00010.00600.99360.99823.0 × 10−30.0142428
PC_ID_0.90.9883−0.00010.00610.98830.99833.0 × 10−30.0141435
Cont_CD0.9185 0.0030 0.98701.3 × 10−20.0277
Cont_ID0.9411 0.0033 0.99258.9 × 10−30.0229
BS_CD_0.30.9035 0.0028 0.97452.4 × 10−20.0372
BS_CD_0.60.9029 0.0029 0.97512.3 × 10−20.0372
BS_CD_0.90.9025 0.0031 0.97742.3 × 10−20.0365
PC_CD_0.30.8642 0.0035 0.95744.5 × 10−20.0514
Henderson and PabisPC_CD_0.60.8733 0.0033 0.95544.6 × 10−20.0521
PC_CD_0.90.9135 0.0026 0.98341.5 × 10−20.0295
BS_ID_0.30.9428 0.0034 0.98901.3 × 10−20.0280
BS_ID_0.60.9190 0.0035 0.97922.4 × 10−20.0378
BS_ID_0.90.9193 0.0035 0.97772.6 × 10−20.0391
PC_ID_0.30.9659 0.0048 0.99714.6 × 10−30.0164
PC_ID_0.60.9740 0.0053 0.99695.3 × 10−30.0176
PC_ID_0.90.9757 0.0052 0.99714.9 × 10−30.0170
Cont_CD 0.01540.72600.99881.2 × 10−30.0085
Cont_ID 0.01000.81600.99486.2 × 10−30.0190
BS_CD_0.3 0.02070.66830.99945.7 × 10−40.0058
BS_CD_0.6 0.02100.67020.99964.2 × 10−40.0050
BS_CD_0.9 0.02100.67940.99927.9 × 10−40.0068
PC_CD_0.3 0.03440.61830.98641.4 × 10−20.0290
Page modelPC_CD_0.6 0.03010.63200.97972.1 × 10−20.0352
PC_CD_0.9 0.01630.69860.99732.4 × 10−30.0119
BS_ID_0.3 0.01150.79700.99703.6 × 10−30.0146
BS_ID_0.6 0.01790.72550.99772.6 × 10−30.0125
BS_ID_0.9 0.01770.72700.99594.8 × 10−30.0168
PC_ID_0.3 0.00840.90220.99783.5 × 10−30.0144
PC_ID_0.6 0.00860.91660.99783.7 × 10−30.0148
PC_ID_0.9 0.00820.92030.99803.5 × 10−30.0143
Cont_CD 0.0034 0.95954.1 × 10−20.0476
Cont_ID 0.0036 0.95052.3 × 10−20.0358
BS_CD_0.3 0.0033 0.93226.3 × 10−20.0590
BS_CD_0.6 0.0033 0.93366.3 × 10−20.0591
BS_CD_0.9 0.0036 0.93886.1 × 10−20.0584
PC_CD_0.3 0.0043 0.89011.2 × 10−10.0803
NewtonPC_CD_0.6 0.0040 0.89391.1 × 10−10.0781
PC_CD_0.9 0.0030 0.94694.7 × 10−20.0512
BS_ID_0.3 0.0037 0.97832.6 × 10−20.0383
BS_ID_0.6 0.0040 0.95735.0 × 10−20.0526
BS_ID_0.9 0.0040 0.95605.1 × 10−20.0535
PC_ID_0.3 0.0050 0.99458.7 × 10−30.0220
PC_ID_0.6 0.0055 0.99567.6 × 10−30.0205
PC_ID_0.9 0.0054 0.99596.9 × 10−30.0196
Variations in the drying constant (a, b, k, n) representing the effects of drying mode and alkaline pretreatment on the drying behavior of squid. “CD” refers to continuous drying, “ID” to intermittent drying, “BS” to sodium bicarbonate (NaHCO3) treatment, and “PC” to potassium carbonate treatment (K2CO3). Concentrations (0.3, 0.6, and 0.9 mol/kg) refer to the soaking solutions applied prior to drying. Control samples (Cont_CD and Cont_ID) were not pretreated with any alkaline solution.
Table 4. Color parameters (L*, a*, b*, and ΔE) of dried squid samples as influenced by alkaline treatment and drying method.
SampleL*a*b*ΔE
Fresh58.21 ± 0.09 a1.91 ± 0.07 m4.32 ± 0.05 o
Control_CD30.99 ± 0.01 m7.27 ± 0.02 e6.23 ± 0.01 n27.80
Control_ID37.62 ± 0.02 h7.38 ± 0.06 c10.08 ± 0.04 a22.07
BS_CD_0.334.17 ± 0.01 k7.91 ± 0.01 b7.88 ± 0.02 j25.03
BS_CD_0.636.82 ± 0.01 j7.12 ± 0.02 f8.12 ± 0.01 h22.34
BS_CD_0.940.83 ± 0.03 e5.45 ± 0.02 k8.84 ± 0.02 e18.30
PC_CD_0.340.49 ± 0.01 f7.34 ± 0.01 d6.91 ± 0.01 m18.71
PC_CD_0.637.35 ± 0.03 i7.01 ± 0.02 g8.54 ± 0.02 f21.88
PC_CD_0.933.41 ± 0.03 l7.02 ± 0.02 g7.45 ± 0.01 l25.51
BS_ID_0.340.79 ± 0.03 e7.12 ± 0.02 f9.11 ± 0.02 c18.81
BS_ID_0.641.95 ± 0.03 c4.68 ± 0.02 l8.08 ± 0.01 i16.92
BS_ID_0.941.43 ± 0.02 d5.93 ± 0.02 j8.99 ± 0.01 d17.87
PC_ID_0.345.18 ± 0.10 b6.71 ± 0.01 i7.81 ± 0.01 k14.32
PC_ID_0.639.68 ± 0.01 g8.04 ± 0.02 a9.16 ± 0.01 b20.11
PC_ID_0.936.82 ± 0.01 j6.94 ± 0.03 h8.43 ± 0.01 g22.35
L*: Lightness (0 = black, 100 = white); a*: red/green axis (+ = red, − = green); b*: yellow/blue axis (+ = yellow, − = blue); ΔE: total color difference compared to fresh sample. Different superscript letters (a–o) within the same column indicate significant differences between treatment groups (p < 0.05).
Table 5. Microbial load (log CFU/g) of dried squid samples stored at 25 °C and 40 °C over 14 days.
Storage Condition (°C)
25 °C40 °C
SampleInitial (0 Day)7 Days14 Days7 Days14 Days
Control_CD2.70 ± 0.11 a2.72 ± 0.08 a2.88 ± 0.05 ab2.90 ± 0.13 a2.92 ± 0.03 a
Control_ID2.58 ± 0.03 ab2.61 ± 0.01 a2.87 ± 0.04 a2.79 ± 0.15 ab2.90 ± 0.05 a
BS_CD_0.32.59 ± 0.01 ab2.60 ± 0.01 a2.74 ± 0.05 abc2.72 ± 0.08 ab2.83 ± 0.09 a
BS_CD_0.62.58 ± 0.03 ab2.59 ± 0.01 a2.73 ± 0.09 abc2.70 ± 0.11 ab2.76 ± 0.02 a
BS_CD_0.92.60 ± 0.01 ab2.61 ± 0.01 a2.65 ± 0.06 c2.72 ± 0.08 ab2.86 ± 0.06 a
PC_CD_0.32.67 ± 0.15 a2.70 ± 0.11 a2.73 ± 0.06 c2.71 ± 0.09 ab2.81 ± 0.06 a
PC_CD_0.62.57 ± 0.04 ab2.58 ± 0.03 a2.61 ± 0.07 c2.72 ± 0.08 ab2.89 ± 0.07 a
PC_CD_0.92.68 ± 0.14 a2.72 ± 0.08 a2.74 ± 0.04 abc2.71 ± 0.09 ab2.81 ± 0.08 a
BS_ID_0.32.42 ± 0.16 b2.58 ± 0.03 a2.71 ± 0.03 c2.62 ± 0.02 b2.77 ± 0.01 a
BS_ID_0.62.71 ± 0.09 a2.71 ± 0.09 a2.72 ± 0.08 bc2.80 ± 0.14 ab2.85 ± 0.07 a
BS_ID_0.92.61 ± 0.01 ab2.63 ± 0.04 a2.65 ± 0.08 c2.73 ± 0.06 ab2.85 ± 0.07 a
PC_ID_0.32.59 ± 0.01 ab2.61 ± 0.01 a2.63 ± 0.06 c2.71 ± 0.04 ab2.89 ± 0.02 a
PC_ID_0.62.58 ± 0.03 ab2.59 ± 0.01 a2.62 ± 0.07 c2.74 ± 0.05 ab2.83 ± 0.07 a
PC_ID_0.92.61 ± 0.01 ab2.71 ± 0.09 a2.73 ± 0.05 abc2.73 ± 0.07 ab2.83 ± 0.05 a
Samples were treated with either sodium bicarbonate (BS) or potassium carbonate (PC) at concentrations of 0.3, 0.6, or 0.9 mol/kg and dried using continuous drying (CD) or intermittent drying (ID). Different superscript letters (a–c) within the same column indicate significant differences between treatment groups (p < 0.05).
Disclaimer/Publisher’s Note: The statements, opinions and data contained in all publications are solely those of the individual author(s) and contributor(s) and not of MDPI and/or the editor(s). MDPI and/or the editor(s) disclaim responsibility for any injury to people or property resulting from any ideas, methods, instructions or products referred to in the content.