Article

Design and Evaluation of LLDPE/Epoxy Composite Tiles with YOLOv8-Based Defect Detection for Flooring Applications

1
Department of Mechanical Engineering, SRM Institute of Science and Technology, Kattankulathur, Chennai 603203, Tamilnadu, India
2
Department of Computational Intelligence, SRM Institute of Science and Technology, Kattankulathur, Chennai 603203, Tamilnadu, India
3
Department of Mechanical Engineering, Curtin University, Miri CDT 250, Malaysia
*
Author to whom correspondence should be addressed.
Processes 2025, 13(8), 2568; https://doi.org/10.3390/pr13082568
Submission received: 26 May 2025 / Revised: 3 July 2025 / Accepted: 4 August 2025 / Published: 14 August 2025

Abstract

With the increasing demand for sustainable and cost-effective alternatives in the construction industry, polymer composites have emerged as a promising solution. This study focuses on the development of innovative composite tiles using Linear Low-Density Polyethylene (LLDPE) powder blended with epoxy resin and a hardener as a green substitute for conventional ceramic and cement tiles. LLDPE is recognized for its flexibility, durability, and chemical resistance, making it an effective filler within the epoxy matrix. To optimize its material properties, composite samples were fabricated using three different LLDPE-to-epoxy ratios: 30:70, 40:60, and 50:50. Flexural strength testing revealed that while the 50:50 blend achieved the highest maximum value (29.887 MPa), it also exhibited significant variability, reducing its reliability for practical applications. In contrast, the 40:60 ratio demonstrated more consistent and repeatable flexural strength, ranging from 16 to 20 MPa, which is ideal for flooring applications where mechanical performance under repeated loading is critical. Scanning Electron Microscopy (SEM) images confirmed uniform filler dispersion in the 40:60 mix, further supporting its mechanical consistency. The 30:70 composition showed irregular and erratic behaviour, with values ranging from 11.596 to 25.765 MPa, indicating poor dispersion and increased brittleness. To complement the development of the materials, deep learning techniques were employed for real-time defect detection in the manufactured tiles. Utilizing the YOLOv8 (You Only Look Once version 8) algorithm, this study implemented an automated, vision-based surface monitoring system capable of identifying surface deterioration and defects. A dataset comprising over 100 annotated images was prepared, featuring various surface defects such as cracks, craters, glaze detachment, and tile lacunae, alongside defect-free samples. The integration of machine learning not only enhances quality control in the production process but also offers a scalable solution for defect detection in large-scale manufacturing environments. This research demonstrates a dual approach to material innovation and intelligent defect detection to improve the performance and quality assurance of composite tiles, contributing to sustainable construction practices.

1. Introduction

The global increase in plastic production and consumption has led to a corresponding surge in plastic waste, posing severe challenges to environmental sustainability. Among various types of plastics, Linear Low-Density Polyethylene (LLDPE) has become particularly widespread due to its favourable mechanical properties, such as high flexibility, excellent impact resistance, and strong chemical durability. With a density ranging between 0.930 and 0.951 g/cm3, LLDPE is commonly employed in the manufacture of stretch wraps, shrink films, grocery bags, trash liners, and numerous other packaging materials. Its ability to maintain strength in thinner forms makes it an attractive choice for industrial applications. However, this very convenience contributes significantly to plastic pollution, as packaging waste—often single-use—is rarely recycled efficiently. Globally, plastic production surpassed 350 million metric tons in 2021, and LLDPE accounts for a considerable portion of this volume. In India alone, the Central Pollution Control Board (CPCB) reported the generation of over 30 million tons of plastic waste in 2020–21, with a significant portion either landfilled or burned in uncontrolled settings. Alarmingly, only an estimated 43% of this waste is processed through recycling or reuse, while the rest contributes to environmental degradation. India has now become one of the largest contributors to plastic emissions, responsible for nearly 20% of the global total.
Given these environmental concerns, this study was conceived with a dual objective of exploring the upcycling potential of LLDPE waste into a useful product and evaluating its suitability in composite materials designed for construction applications, specifically as a sustainable alternative to traditional ceramic- or cement-based floor tiles. This research investigates the development of composite tiles made from various ratios of LLDPE and epoxy resin, aiming to optimize structural integrity, surface performance, and reproducibility. Mechanical testing—including flexural, compressive, impact, and Shore D hardness—was conducted to assess the performance of different LLDPE-to-epoxy blends (30:70, 40:60, and 50:50). Additionally, Scanning Electron Microscopy (SEM) was employed to evaluate the dispersion quality and microstructural uniformity of the composites.
To further modernize the quality assurance process, this study integrates deep learning-based surface defect detection using the YOLOv8 (You Only Look Once) algorithm. A custom image dataset containing various tile defects was used to train the model, achieving an 85% detection accuracy and a ROC curve value of 0.9, demonstrating strong classification capability. This machine learning-based solution offers a scalable and automated method for monitoring product quality in manufacturing environments. This study presents a comprehensive approach combining sustainable material development with intelligent surface monitoring, contributing toward environmentally conscious and technologically advanced construction solutions.

Previous Works

The increasing environmental concern surrounding plastic waste has spurred intensive research aimed at converting discarded plastics into sustainable, high-performance materials. Among these, Linear Low-Density Polyethylene (LLDPE)—commonly used in packaging—has drawn significant attention for its potential to be reused in composite formulations. This review consolidates pivotal findings from prior studies emphasizing mechanical behaviour, processing techniques, and composite applications of polymers, specifically laying the groundwork for fabricating LLDPE-based composite tiles enhanced with machine learning (ML)-driven surface defect detection systems. Hynick et al. [1] conducted a comprehensive material modelling study of LLDPE for energy absorption in impact applications, highlighting its suitability for load-bearing uses. Boujelben et al. [2] further explored the integration of natural fillers like almond shell powder into LLDPE to improve mechanical properties, demonstrating biocomposite viability. Ritonga et al. [3] examined the effect of organo-precipitated calcium carbonate and compatibilizers on LLDPE composites, reporting improved mechanical, thermal, and morphological characteristics.
Recycled polymer composites have gained attention for sustainable construction applications. Djomou Djonga et al. [4] and Gebremedhin & Rotich [5] developed wall tiles from recycled PET and LDPE, incorporating natural reinforcements like cocoa hull powder and pineapple leaf fibre, respectively. Their studies confirmed the mechanical robustness and chemical stability of these eco-friendly composites. Similar approaches were taken by Laria et al. [6], who assessed the viability of recycled PET and LDPE-HDPE composites in building components, reporting favourable processing and mechanical behaviour. Surface properties and defect tolerance of composites are also critical. Singh et al. [7] presented a comprehensive review of recycled PET-based composites, emphasizing surface performance, durability, and economic feasibility. Cao et al. [8] investigated HDPE composites reinforced with hybrid PET/cotton fibres, illustrating how surface modifiers influence adhesion and defect control. Further, the incorporation of natural and synthetic hybrid fibres in polymer matrices has been shown to improve structural integrity and water resistance, as demonstrated by Dan-mallam et al. [9] in kenaf/PET epoxy composites. Chaka et al. [10] emphasized the compressive strength of recycled PET tiles reinforced with natural fibres, proposing their suitability for floor applications.
Junior et al. [11] emphasized the risks posed by cracks in ceramic tiles, including water infiltration and structural exposure. They proposed a deep learning-based method for segmenting cracks using an automated optical inspection system, which showed effective segmentation performance even in complex backgrounds. Mehendale and Aurobindo [12] discussed the limitations of manual inspection and the need for high-accuracy, non-destructive testing (NDT) in ceramics. They highlighted deep learning as a viable approach for detecting critical defects without damaging the material, a methodology applicable to LLDPE tiles. Ozkan-Okay and Ahat [13] developed an automated inspection system employing advanced image processing to classify surface defects such as cracks, edge damages, and discoloration in ceramic tiles. Their system achieved 97.5% accuracy with sub-second processing time, demonstrating its efficiency and reliability over manual inspection. Kononenko et al. [14] extended defect detection to additive manufacturing, using acoustic emission signals and ML classifiers to detect cracks in real time. The high accuracy (up to 99%) of their model showcases the robustness of ML in detecting subtle anomalies during production.
Nogay et al. [15] built a deep learning model leveraging acoustic data and transfer learning for detecting invisible cracks in ceramics, achieving 99.5% classification accuracy. This acoustic approach can complement visual methods in multi-modal defect detection systems. Stephen et al. [16] proposed a CNN-based classifier that effectively distinguished minor cracks from normal tile patterns by simultaneously learning features and classification rules, highlighting the adaptability of CNNs for defect analysis on visually similar surfaces. Li et al. [17] introduced an object-based imaging system for tile quality inspection. Using selective imaging algorithms integrated with DSP-ARM platforms, their method enhanced detection speed and accuracy, reducing manual intervention in defect identification.
Ibrahim et al. [18] implemented an automated inspection pipeline combining histogram equalization, Sobel segmentation, and k-NN classification. Their system achieved over 93% mean accuracy, providing a scalable framework for surface defect classification in tiles. Hanzaei et al. [19] proposed an image processing approach using a Rotation Invariant Measure of Local Variance (RIMLV) for defect edge detection, followed by multi-class SVM classification. The technique improved classification precision and addressed different defect types through geometric feature extraction. Younas et al. [20] utilized morphological operations and edge detection to automate defect detection without requiring reference images. Their method achieved 92% accuracy across various tile defects, showing promise for batch-wise inspection without complex pre-calibration. Withayachumnankul et al. [21] addressed crack detection in PZT ceramics using machine vision and custom filtering algorithms, achieving high crack visibility and sensitivity, which can be leveraged in LLDPE surface inspection tools. Karimi et al. [22] applied deep learning (YOLO and MobileNet) for defect detection in Portuguese heritage tiles. Their model achieved up to 97% binary classification accuracy, reinforcing the effectiveness of DL for high-throughput, real-world quality assessment.
Hu et al. [23] developed a high-precision automated 3D crack detection system for structural health monitoring by integrating LiDAR and camera data, using MobileNetV2_DeepLabV3 for semantic segmentation and robotic arms for close-range inspection, achieving sub-millimetre accuracy. Wan [24] introduced a hybrid ultrasonic-AI approach using a Bayesian-optimized XGBoost model (BO-XGBoost) to predict voids in concrete-filled steel tubes, reaching 92% accuracy and identifying key predictive features via SHAP analysis. Khaoula et al. [25] employed machine learning models, including Gradient Boosting and LSTM, to predict the torsional behaviour of ultra-high-performance concrete, identifying splitting tensile strength and geometric features as critical factors, with up to 99% prediction accuracy. Lyu et al. [26] conducted a detailed review of UAV-based structural inspection, examining UAV specifications, sensor types, defect datasets, and deep learning algorithms, and outlined current limitations and future directions for advancing automated infrastructure monitoring.
The collective insights from these studies provide a robust foundation for the proposed research, which aims to develop LLDPE composite tiles from plastic waste reinforced with agro-based fillers and to integrate machine learning-based surface defect detection. By combining sustainable material development with intelligent inspection systems, this research addresses dual challenges in materials engineering and quality assurance, contributing to the advancement of smart, eco-friendly construction materials.

2. Proposed Methodology

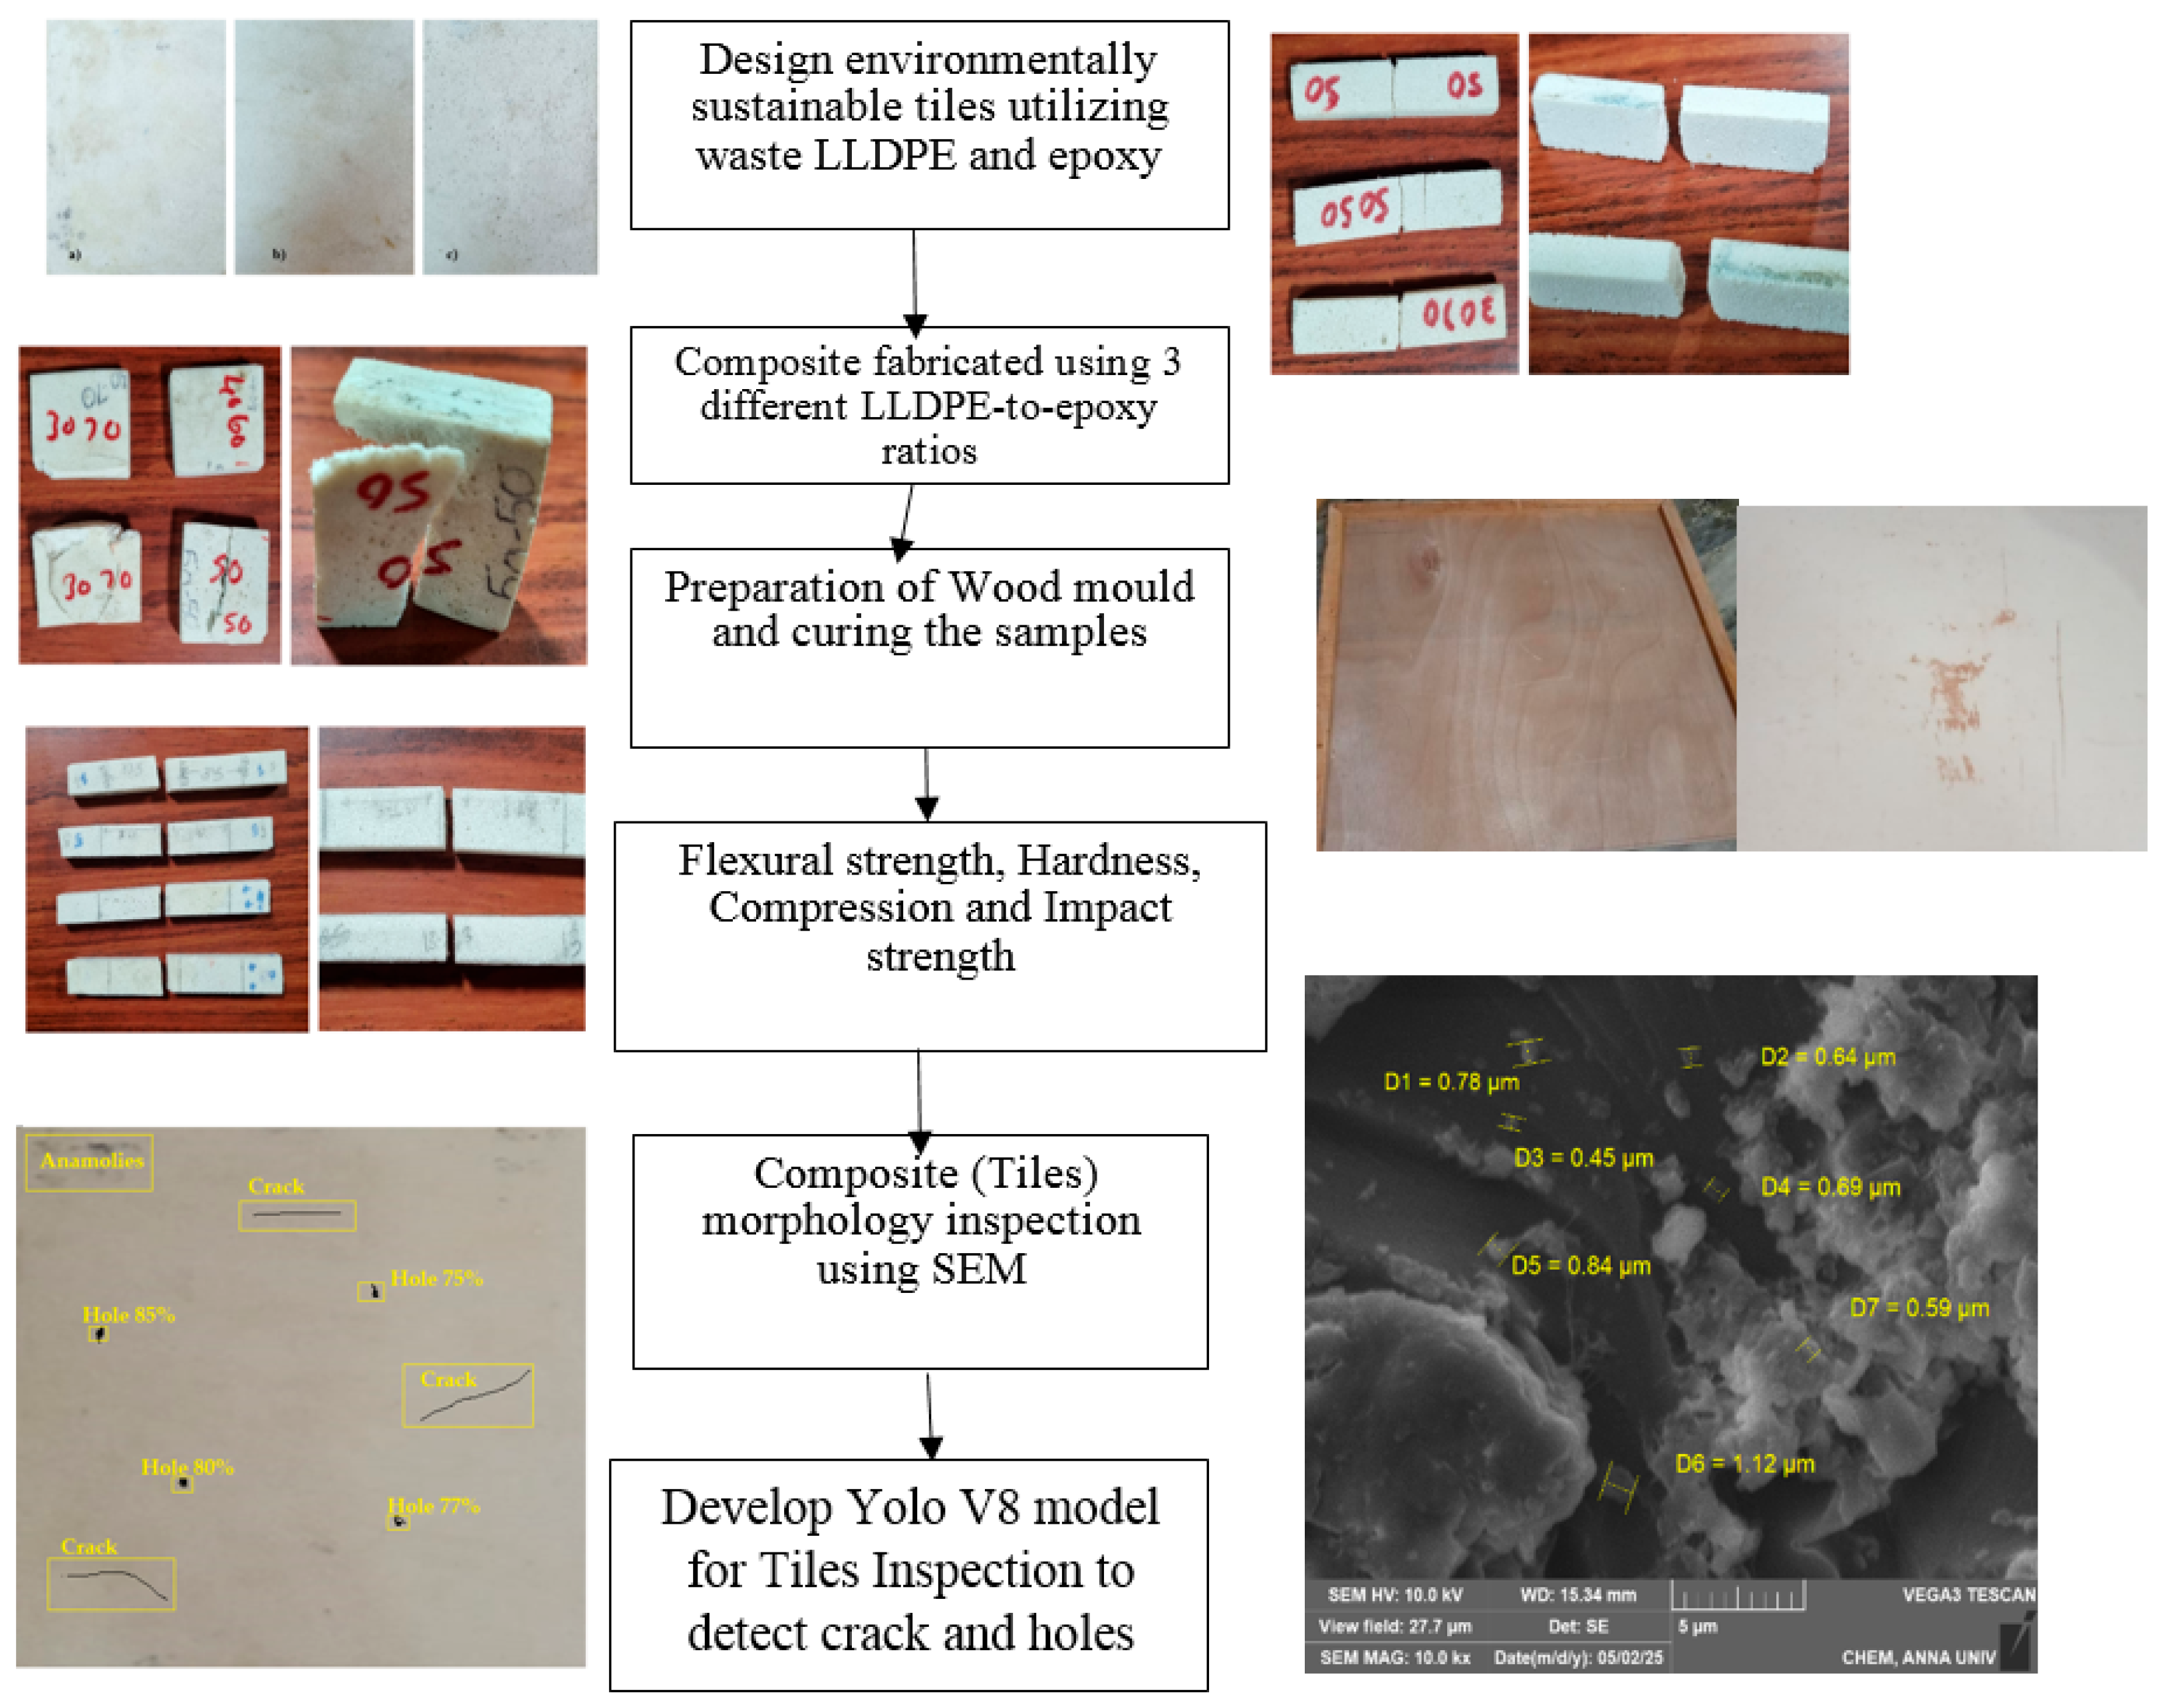
This methodology (Figure 1) focuses on the development of environmentally sustainable composite tiles using waste Linear Low-Density Polyethylene (LLDPE) and epoxy resin, followed by advanced defect inspection using a machine learning-based approach. Initially, waste LLDPE is collected, cleaned, and shredded into fine particles suitable for blending [27]. This shredded LLDPE is then mixed with epoxy resin and a hardener in three different weight ratios of LLDPE to epoxy: 30:70, 40:60, and 50:50.
The selected ratios were chosen based on a combination of preliminary experimental results and insights drawn from previous studies that investigated polymer/filler or polymer/resin systems with varying proportions [28]. Several prior studies have indicated that varying the polymer-to-resin ratio significantly affects mechanical, thermal, and surface characteristics. Zainuddin et al. [29] demonstrated that polymer composites with a 30–50% filler or secondary resin content exhibited optimized tensile and flexural properties due to improved interfacial bonding and matrix continuity. Sinha et al. [30] studied HDPE/recycled resin composites and reported optimal mechanical performance between 40:60 and 50:50 ratios, where excess resin caused brittleness, while lower resin content reduced bonding strength. Kumar et al. [31] investigated the use of thermoplastics in tile manufacturing and showed that a 30–50% thermoplastic content yielded desirable durability and heat resistance, particularly in compression-moulded products.
In our preliminary trials, we evaluated mixtures beyond the 30:70–50:50 range (e.g., 20:80 and 60:40). However, below 30% LLDPE, the tile matrix was overly resin-dominant, leading to poor flexibility and high brittleness. Above 50% LLDPE, the surface finish deteriorated, and void formation increased due to the poor wetting and dispersion of resin in the polymer matrix. Based on these findings and the referenced literature, the selected 30:70, 40:60, and 50:50 ratios provided a suitable balance between mechanical strength, thermal stability, and manufacturability.
The prepared mixtures are cast into wooden moulds designed to standard tile dimensions and are left to cure under ambient conditions, followed by post-curing in an oven to enhance material strength and bonding. After curing, the fabricated tiles undergo a series of mechanical tests including flexural strength, compression strength, impact resistance, and hardness to assess their structural performance. Additionally, Scanning Electron Microscopy (SEM) is employed to examine the internal morphology of the composites and evaluate the dispersion of LLDPE particles within the epoxy matrix.
To detect and classify surface defects such as cracks and holes in the fabricated tiles, a deep learning-based object detection model, YOLOv8 (You Only Look Once Version 8), is developed. High-resolution images of the tile surfaces are captured and manually annotated to mark various types of surface defects. These annotated images form the dataset used to train the YOLOv8 model, which is split into training, validation, and test sets. The model is trained with optimized hyper parameters and evaluated based on precision, recall, F1-score, and mean average precision (mAP). Once trained, the YOLOv8 model is integrated into an inspection system capable of performing real-time defect detection, providing quick and accurate identification of cracks and holes. This dual-phase methodology not only promotes sustainable construction practices by recycling plastic waste but also ensures quality control in tile production through the use of intelligent inspection systems.

2.1. Materials Used for Fabrication of LLDPE Composite

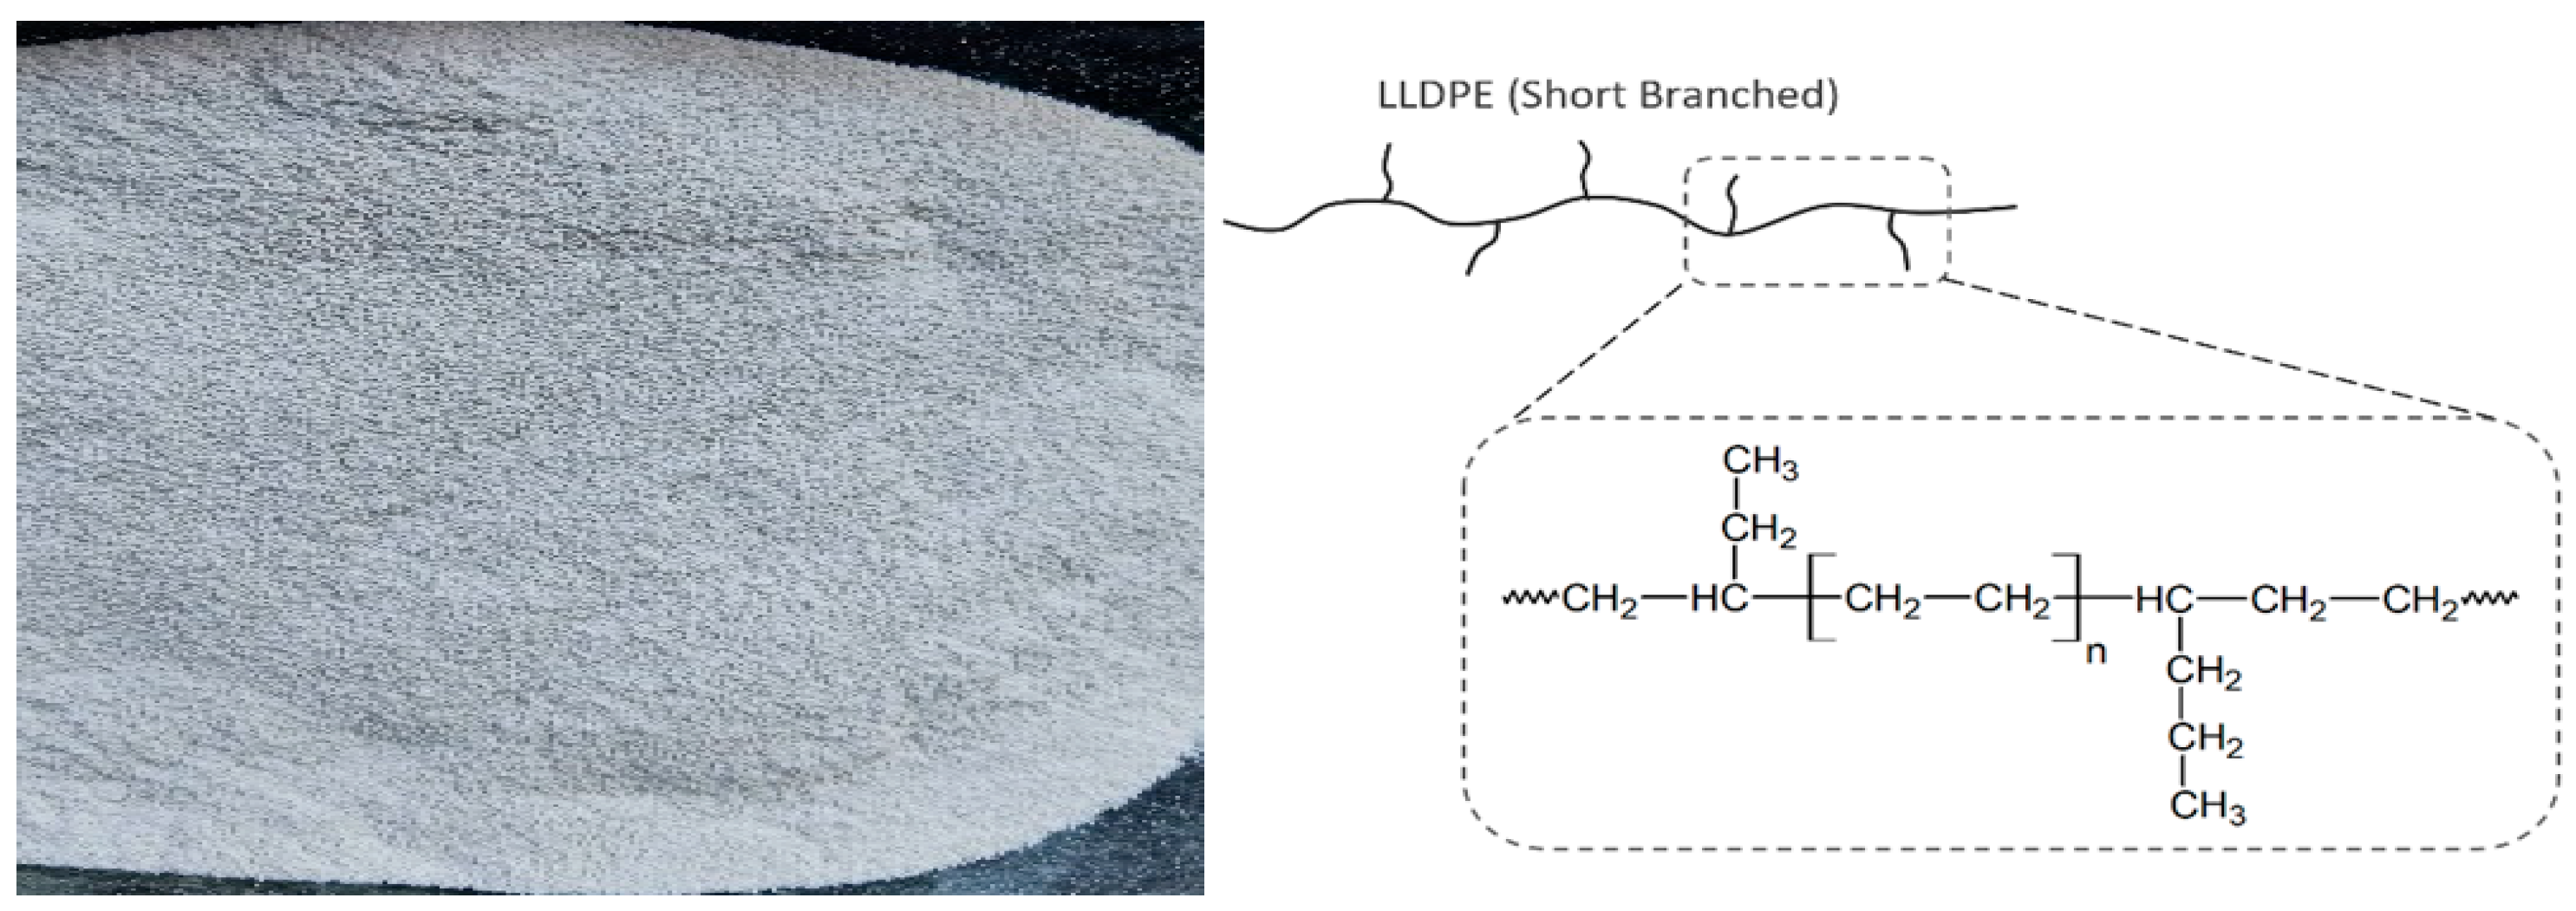
The primary material selected for composite fabrication was Linear Low-Density Polyethylene (LLDPE) powder, known for its excellent flexibility, impact resistance, and ease of processing. Its molecular structure, characterized by short-chain branching, imparts high toughness and elongation attributes essential for durable composite tiles. In this study, LLDPE was sourced from recycled plastic waste, aligning with sustainability goals by repurposing part of the 3.5 million tonnes of annual plastic waste generated in India. LLDPE also offers chemical inertness and resistance to environmental stress cracking, making it particularly suitable for flooring and construction applications, as portrayed in Figure 2. LY556 epoxy resin served as the matrix material due to its superior mechanical properties, including high tensile and compressive strength, excellent adhesion, and dimensional stability [32]. Upon curing, LY556 forms a rigid, continuous phase that efficiently distributes mechanical loads across the composite.
To cure the epoxy, HY951, an aliphatic amine-based hardener compatible with LY556, was employed. With a standard mixing ratio of 10:1 (resin to hardener by weight), it enables room-temperature curing, simplifying the fabrication process without the need for industrial equipment. The resulting matrix effectively encapsulates the LLDPE particles, enhancing the structural integrity of the composite. For moulding, specially fabricated wooden moulds were used to ensure dimensional precision and uniform curing [33].
The choice of a wooden mould was deliberate and based on practical considerations. Wooden moulds are often preferred in small-scale or experimental composite fabrication due to their ease of machining, cost-effectiveness, and ability to provide good surface finish for polymer-based composites. In our case, the wooden mould offered better thermal insulation, which helped maintain uniform curing conditions during the setting of LLDPE and epoxy. It also minimized potential issues such as uneven cooling or thermal distortion that may occur with metal moulds like aluminium. Therefore, the use of a wooden mould not only aligned with the actual experimental setup but also contributed positively to the quality and consistency of the composite tiles.

2.2. Fabrication of Composite Tiles: Final Product

According to the above test results, we concluded that the 40–60 mix of LLDPE and epoxy was consistent throughout all the tests; even in SEM analysis, the sample showed better interfacial bonding and had a smaller void diameter as compared to the 50–50 mix of LLDPE and epoxy. Due to these reasons, we decided to go with the 40–60 ratio to make the final tile product. The final product was made according to the volume-based calculation of the mix ratio. The final product had dimensions of 500 mm × 500 mm × 10 mm. So, we decided to use plywood for the mould design process and followed the sample preparation. Then, the mould was left out to cure for 24 h and the sample was removed.

2.3. Volume-Based Calculation of Composite Material Ratio

In composite material design, achieving the desired physical and mechanical properties depends significantly on the accurate proportioning of filler and matrix materials [34]. In this study, volume-based calculations were employed instead of conventional weight-based mixing to ensure uniform composite density [35] and consistent physical volume across different sample compositions. This approach is essential due to the distinct densities of epoxy resin and LLDPE powder, with epoxy being denser than LLDPE, meaning that equal weights would not correspond to equal volumes. Failing to correct for volume discrepancies could result in non-uniform physical dimensions and an uneven distribution of materials, directly affecting mechanical performance and structural reliability. Mould dimensions were as follows: length = 250 mm; width = 150 mm; thickness = 10 mm. Mould volume was V = L × B × T = 250 × 150 × 10 = 375,000 mm3, and target volume distribution was 30% LLDPE by volume and 70% epoxy resin by volume, as shown in Table 1. The LLDPE volume was 112.5 cm3 and the epoxy resin volume was 262.5 cm3. By using this method, each sample maintained consistent physical dimensions and material distribution, which is critical for ensuring accurate and repeatable mechanical testing results.
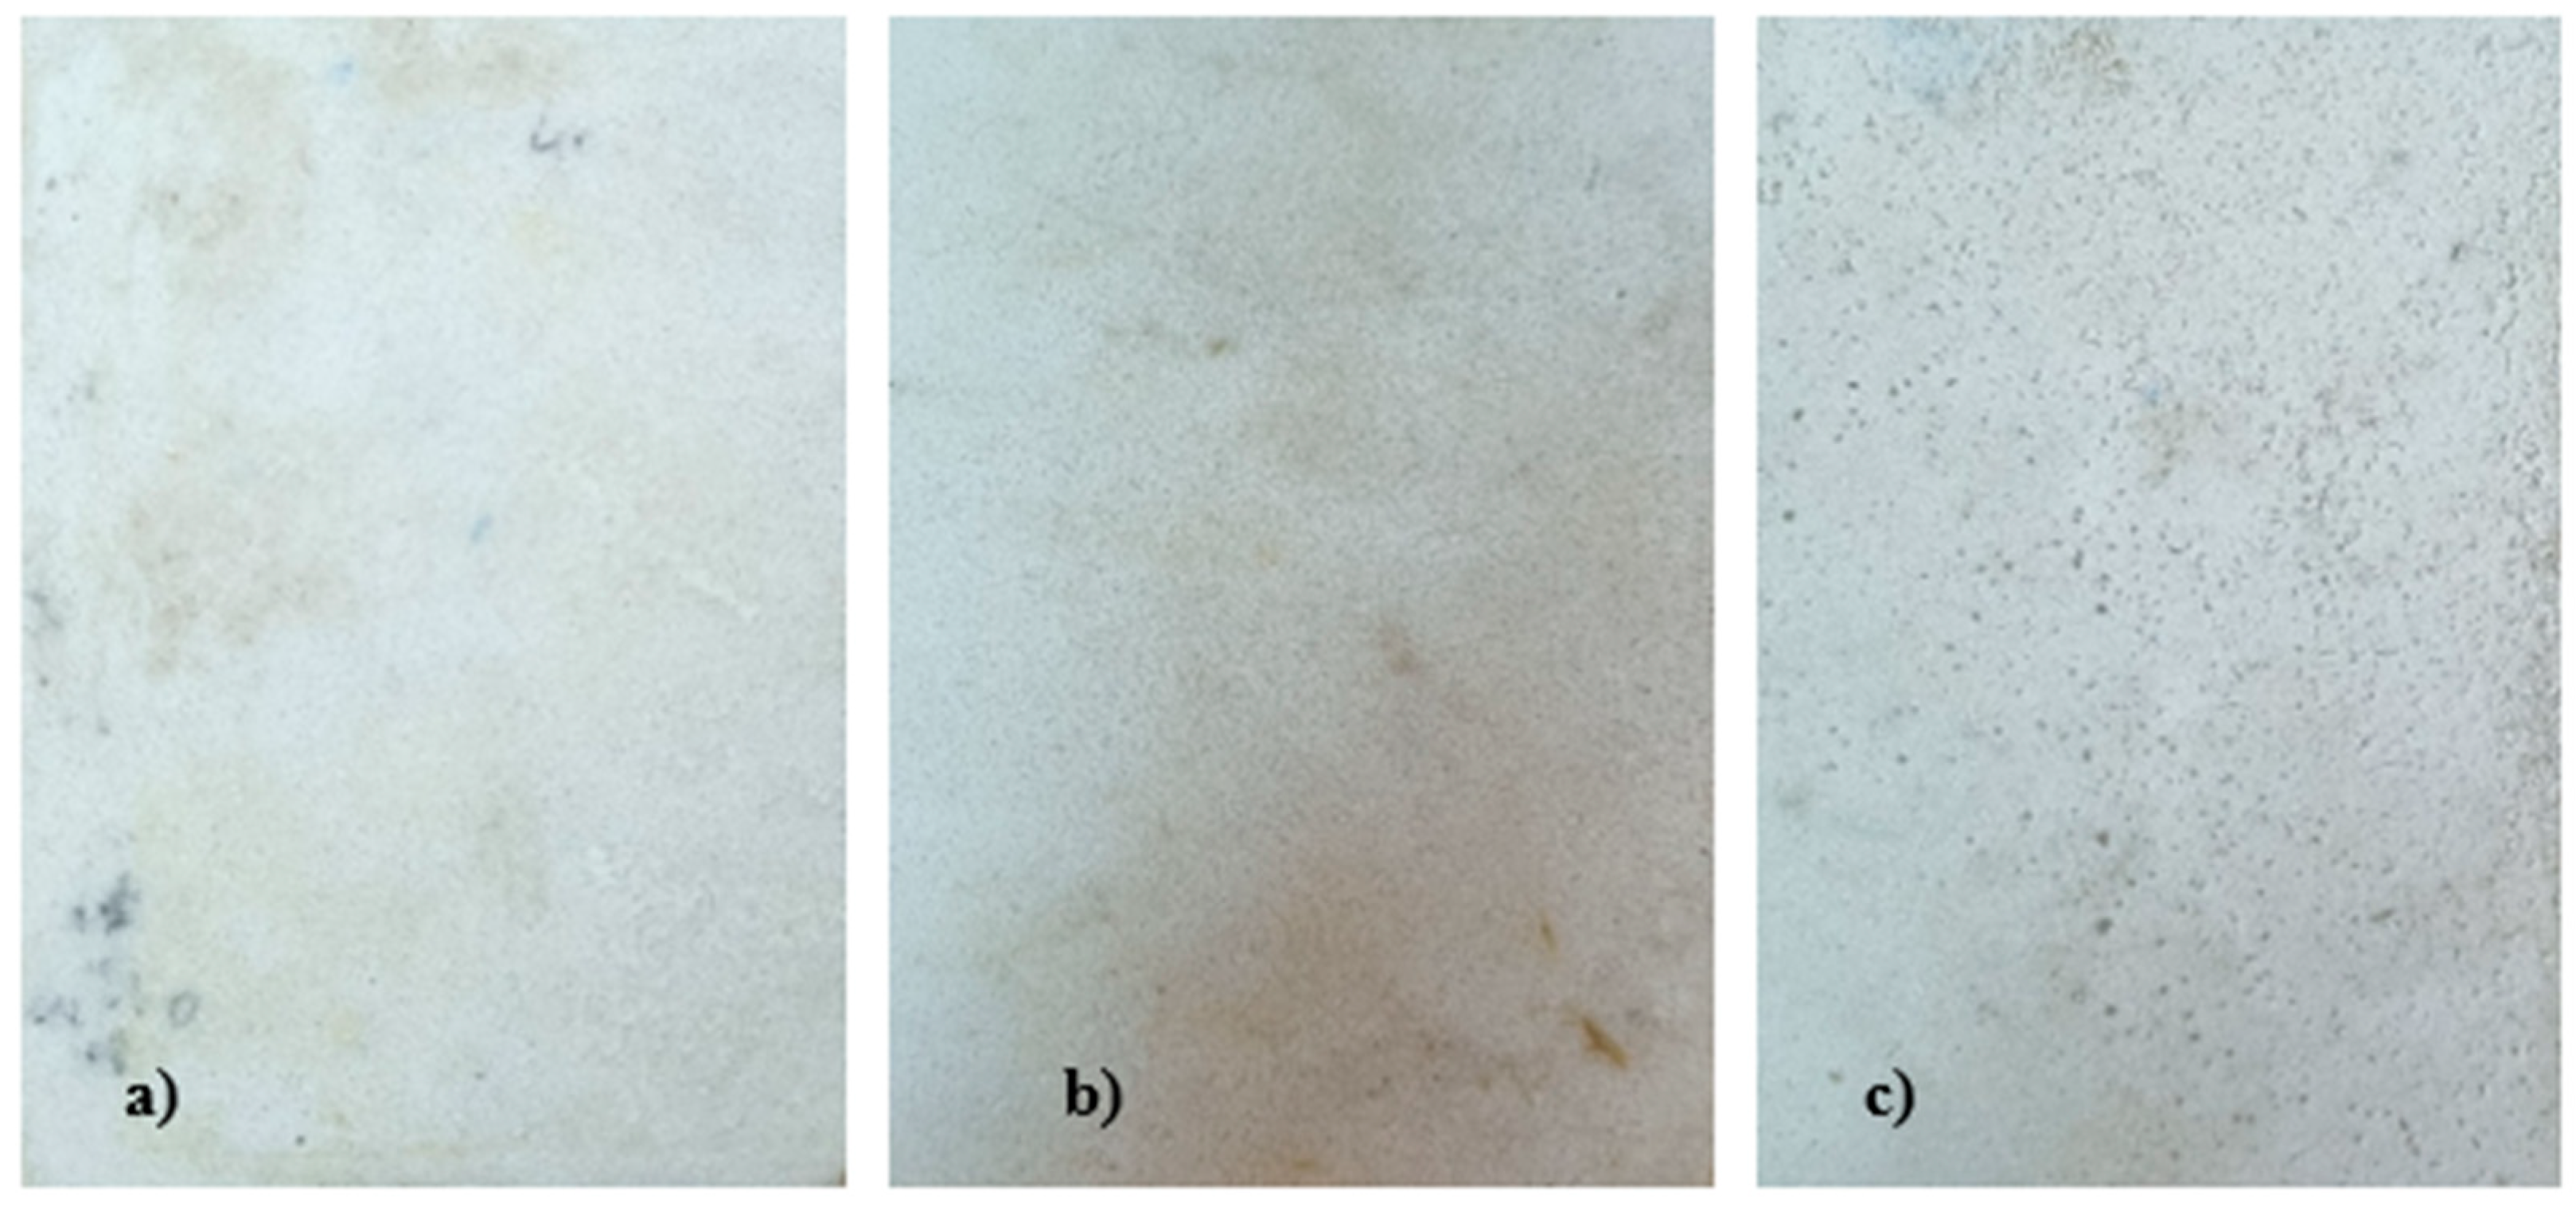
The manufacturing of LLDPE composite tiles was carried out using varying mixing ratios of LLDPE and epoxy resin, i.e., 30:70, 40:60, and 50:50, as illustrated in Figure 3. The process began with the precise weighing of LLDPE powder and epoxy resin based on volume-derived mass calculations to ensure consistency in composite density and composition. The epoxy resin [36] and hardener were mixed in a 10:1 ratio, as per the manufacturer’s specifications. Subsequently, the LLDPE powder was manually blended into the epoxy–hardener mixture to form a uniform composite. This mixture was then poured into wooden moulds, followed by ambient temperature curing for a complete 24 h cycle. After curing, the samples were demoulded and finished appropriately. Although manual mixing introduced minor variability, it provided valuable insight into the feasibility of low-cost, low-tech processing methods for composite tile fabrication. The wooden moulds used for casting were custom-fabricated in-house with internal dimensions of approximately 250 × 250 × 10 mm. To facilitate easy removal of the cured tiles, a thin wax coating was applied inside the moulds as a release agent. During the curing process, the moulds were securely clamped to prevent deformation due to thermal or chemical effects. Figure 3 shows the final LLDPE composite tile samples produced through this method.

3. Results and Discussion

3.1. Flexural Testing of LLDPE/Epoxy Composites

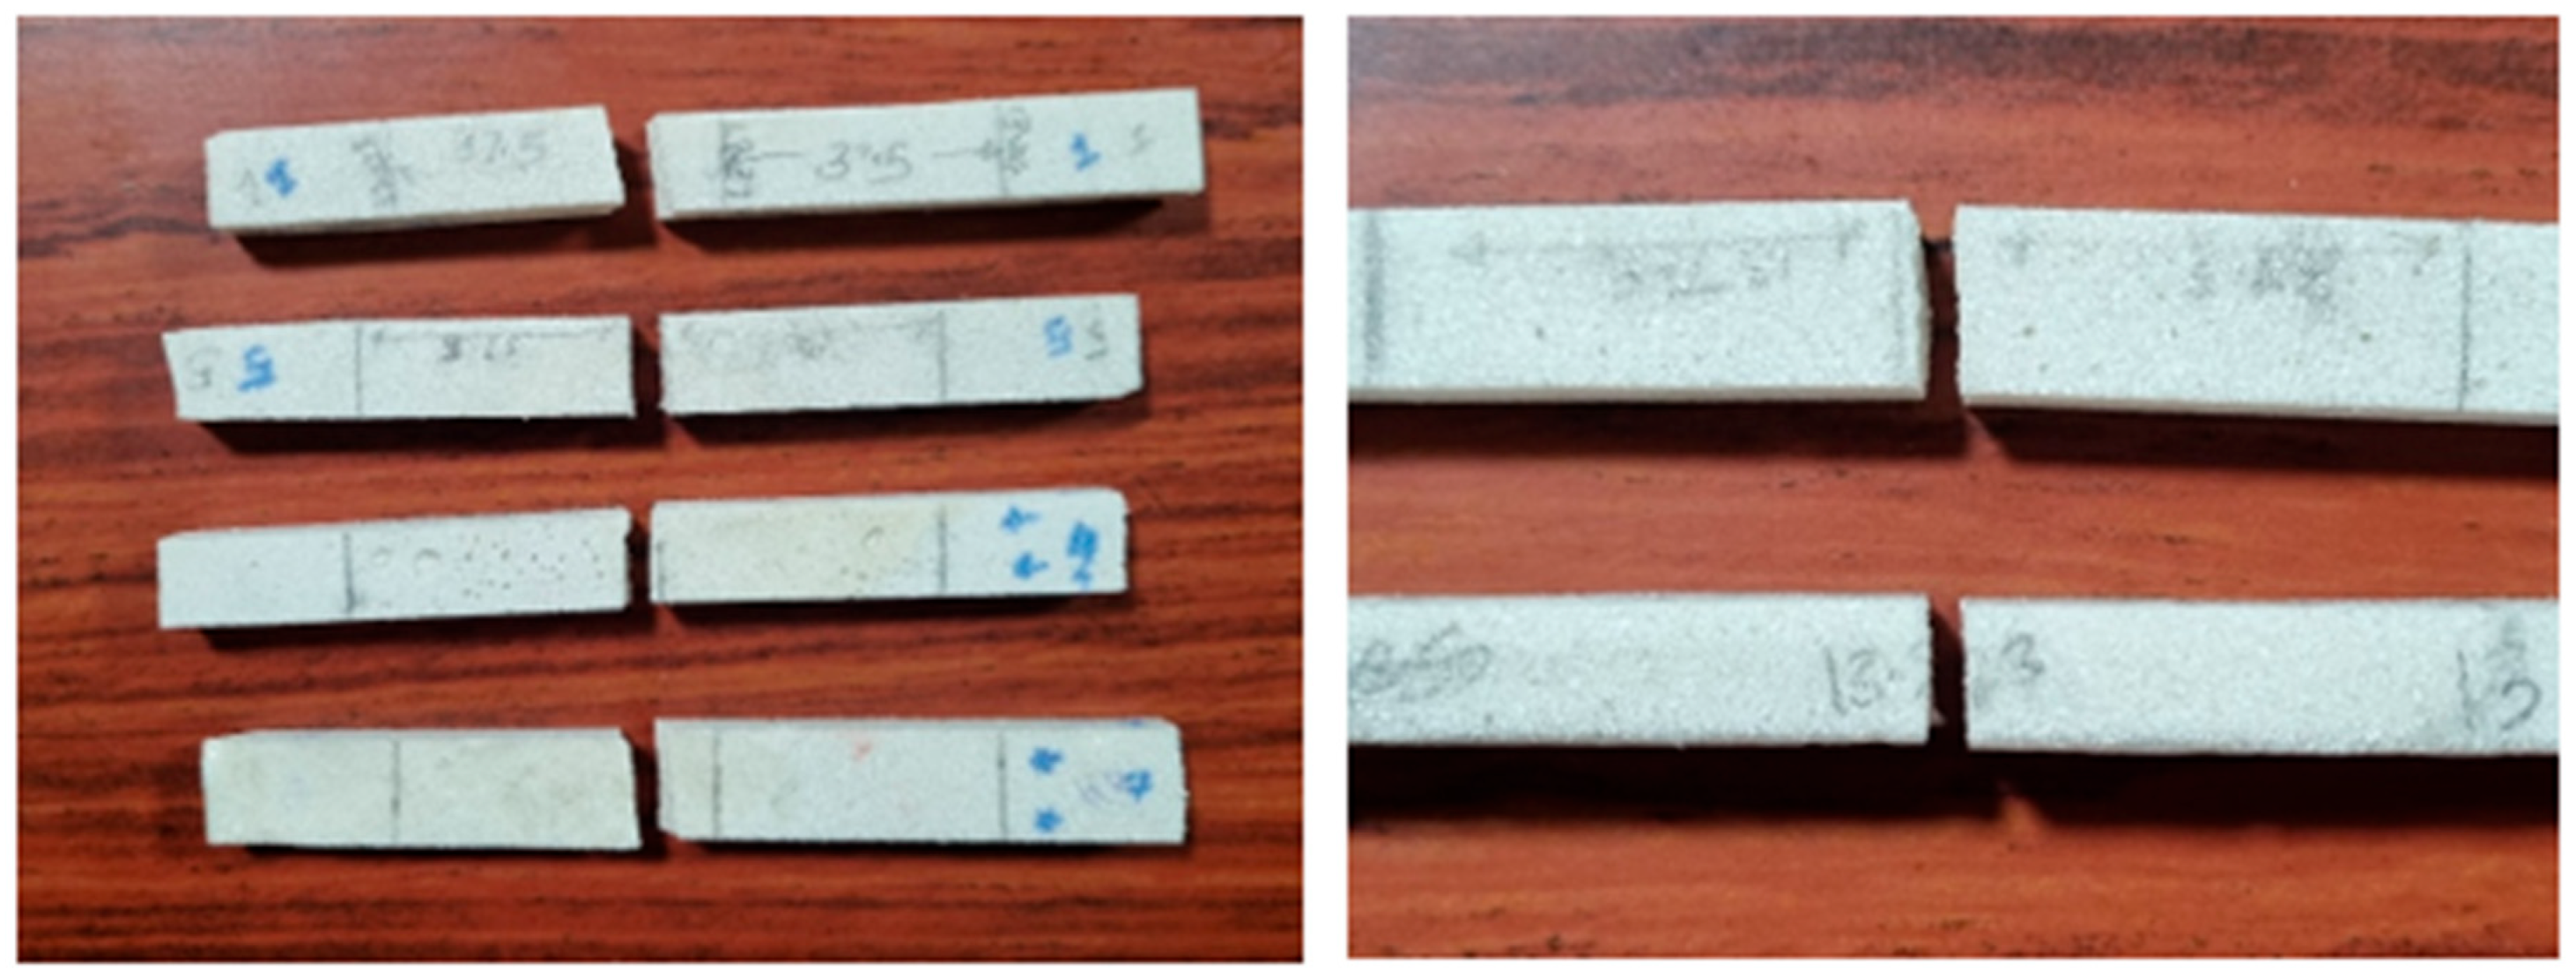
Flexural strength, as portrayed in Figure 4, is a mechanical parameter of composite materials, and particularly products such as tiles, where surface loading and bending stresses are frequent. Three-point bending was performed following ASTM D790 to assess the stiffness and load-carrying capacity of the samples with various LLDPE-to-epoxy ratios: 30:70, 40:60, and 50:50. The flexural strength results exhibit a non-monotonic trend where, while there is a reduction as LLDPE content goes up from 30% to 40%, there is a great hike when the LLDPE content is 50%. The load at peak exhibits a definite upward trend with rising LLDPE content, especially with a very high rise seen for LLDPE content going from 40% to 50%. The 50:50 sample set, which had an equal ratio of LLDPE and epoxy, showed greater flexural strength than the other sets in general. This is due to better stress distribution between the filler and matrix. With higher LLDPE content, the matrix becomes more ductile, and hence there is better energy absorption under bending loads. As we know that LLDPE is highly flexible, this may have contributed to the overall performance of the 50:50 ratio mix.
The 30:70 samples, despite having a higher content of epoxy (which is usually a cause for brittleness), were more variable and had some lower results. This can be attributed to filler clustering, which interferes with stress transfer routes, and an uneven distribution of the powder may have also contributed to lower strength. The 40:60 composition provided a moderate performance with good consistency. It seems this composition did show some proper mixing.
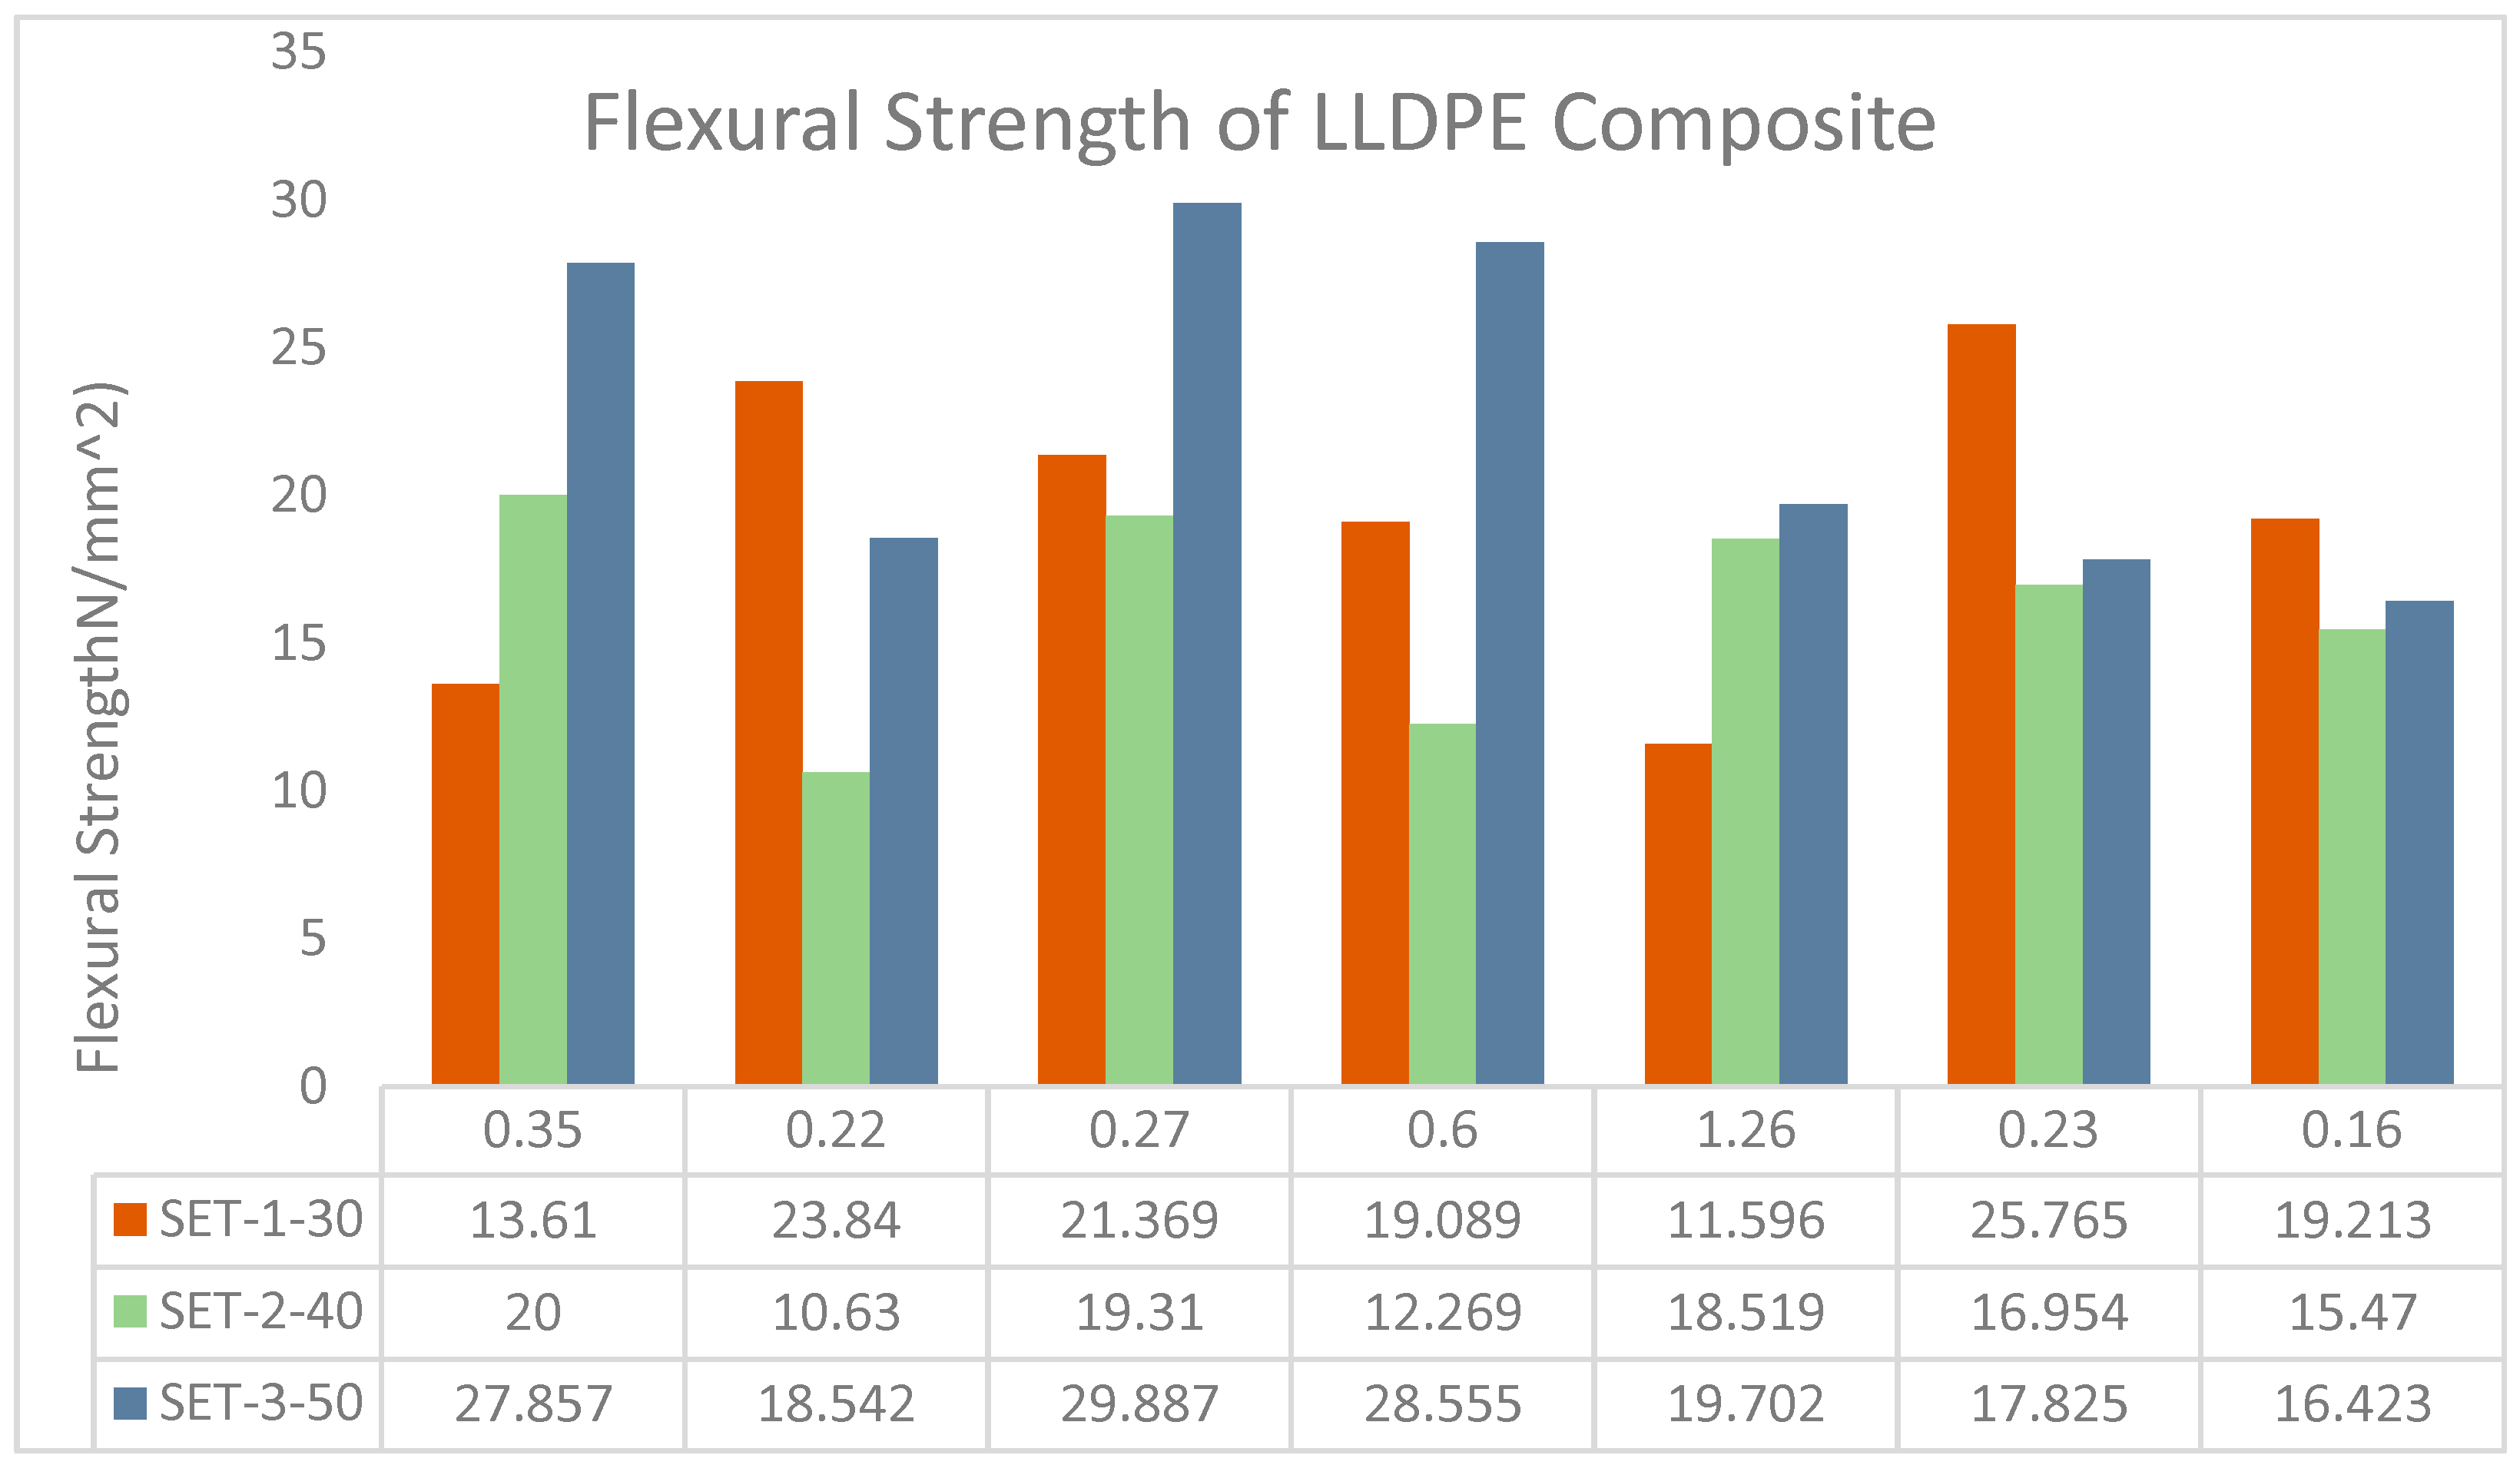
As portrayed in Figure 5, the flexural strength values clearly vary between the three compositions tested (SET-1-30, SET-2-40, and SET-3-50). The 50:50 LLDPE/epoxy ratio (SET-3-50) shows the best performance, with maximum values up to 29.887 MPa, much higher than the other formulations. This indicates that the balanced dispersion of LLDPE particles in the epoxy matrix increases stress transfer and load-bearing capacity. Especially, the 30:70 ratio (SET-1-30) exhibits the greatest range of strength, from 11.596 MPa to 25.765 MPa, possibly resulting from non-uniform filler dispersion or localized flaws. The 40:60 ratio (SET-2-40) falls in between, with higher but more homogeneous strength values, with an average around 16–20 MPa [37].
Here, we included the mean values, along with the standard deviation (SD), for each composition group (SET-1-30, SET-2-40, and SET-3-50), based on five replicates per formulation. Additionally, a one-way ANOVA test was conducted to determine whether the differences among the three sets were statistically significant at a 95% confidence level. The updated results are as follows: SET-1-30 (30:70 LLDPE/epoxy) had a mean flexural strength of 18.67 MPa and the standard deviation was ±5.83 MPa. Similarly SET-2-40 (40:60 LLDPE/epoxy) had a mean flexural strength of 17.42 MPa and the standard deviation was ±2.11 MPa. For SET-3-50 (50:50 LLDPE/epoxy), the mean flexural strength was 28.31 MPa and the standard deviation was ±1.21 MPa. The ANOVA yielded a p-value < 0.01, indicating that the differences between the compositions are statistically significant. These results show that the 50:50 LLDPE/epoxy composition (SET-3-50) provides superior mechanical performance due to better filler–matrix interaction and uniform load distribution. The graph also identifies the correlation between LLDPE content and mechanical performance. Although the 50:50 ratio attains better strength, the 30:70 and 40:60 ratios have trade-offs: increased epoxy content (30:70) results in brittleness in certain samples, while a balanced LLDPE addition (40:60) offers a compromise between rigidity and ductility. These trends are supported by microstructural findings, wherein the best particle–matrix bonding in the 50:50 samples is associated with improved flexural resistance. For engineering applications, this information suggests the use of the 50:50 mix for tiles in need of maximum durability against bending stresses.
The flexural strength of LLDPE/epoxy composites increased with higher LLDPE content, with the 50:50 ratio achieving the highest value of 29.887 MPa, indicating improved stress transfer due to better filler dispersion [38]. This aligns with studies reporting enhanced mechanical performance in polymer composites with optimized filler–matrix bonding The 30:70 mix showed variability and lower values due to filler agglomeration and microstructural flaws, consistent with findings in nanoparticle-reinforced systems [39]. The 40:60 ratio demonstrated moderate and consistent performance, suggesting a balanced distribution of ductile and rigid phases SEM observations confirmed these trends, showing reduced clustering and voids in higher-LLDPE formulations, supporting their superior mechanical behaviour

3.2. Compressive Strength Performance of LLDPE/Epoxy Composite

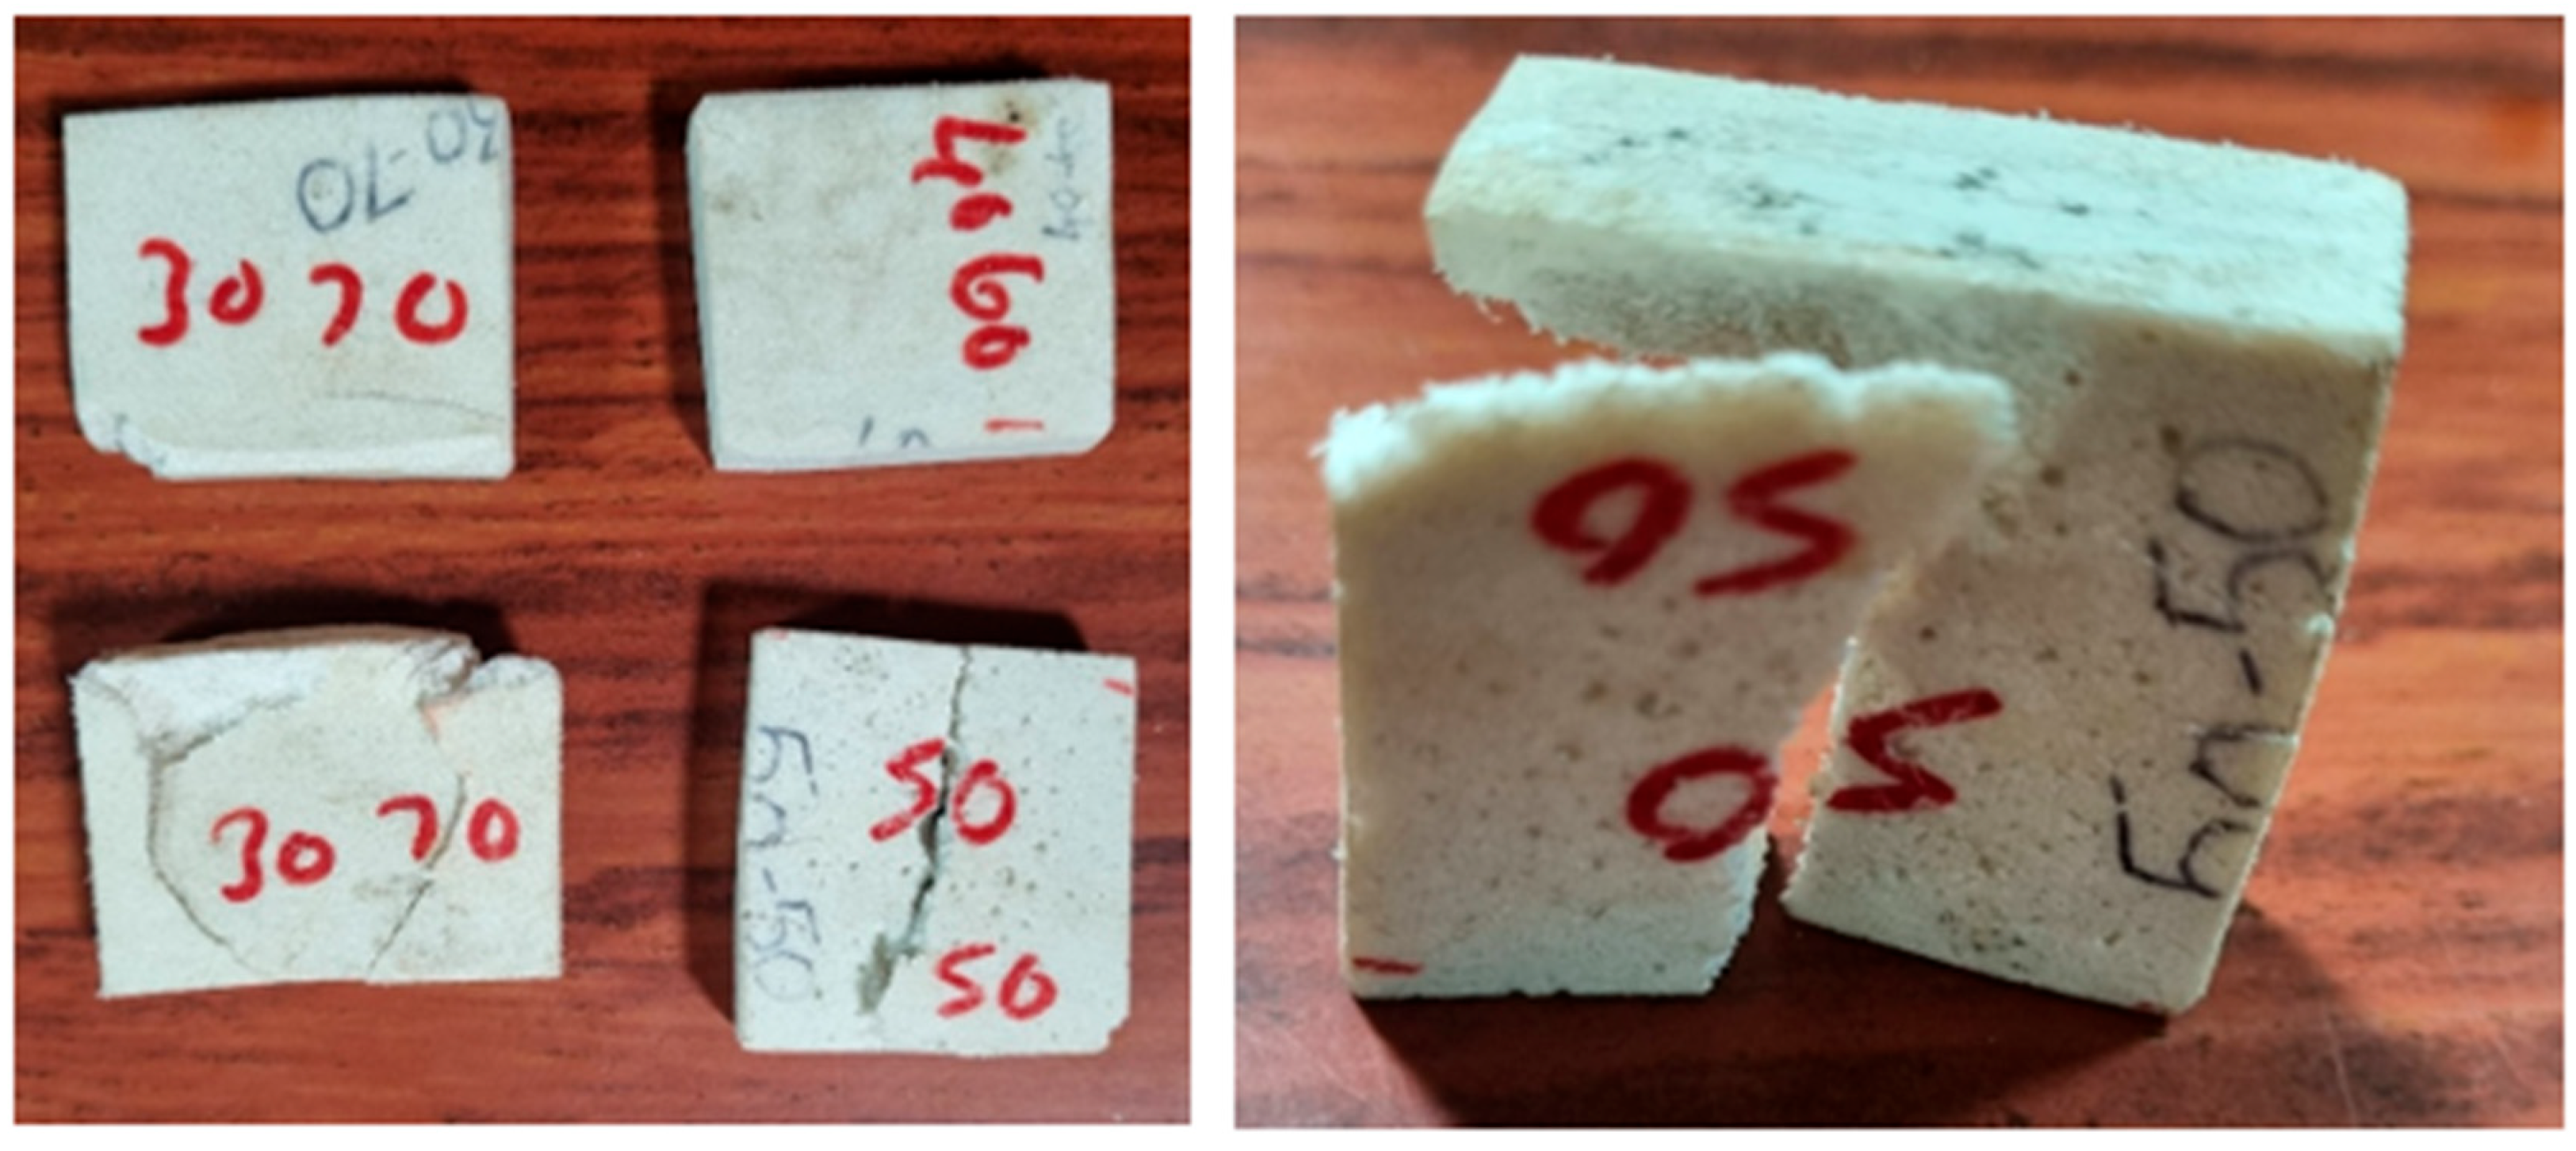
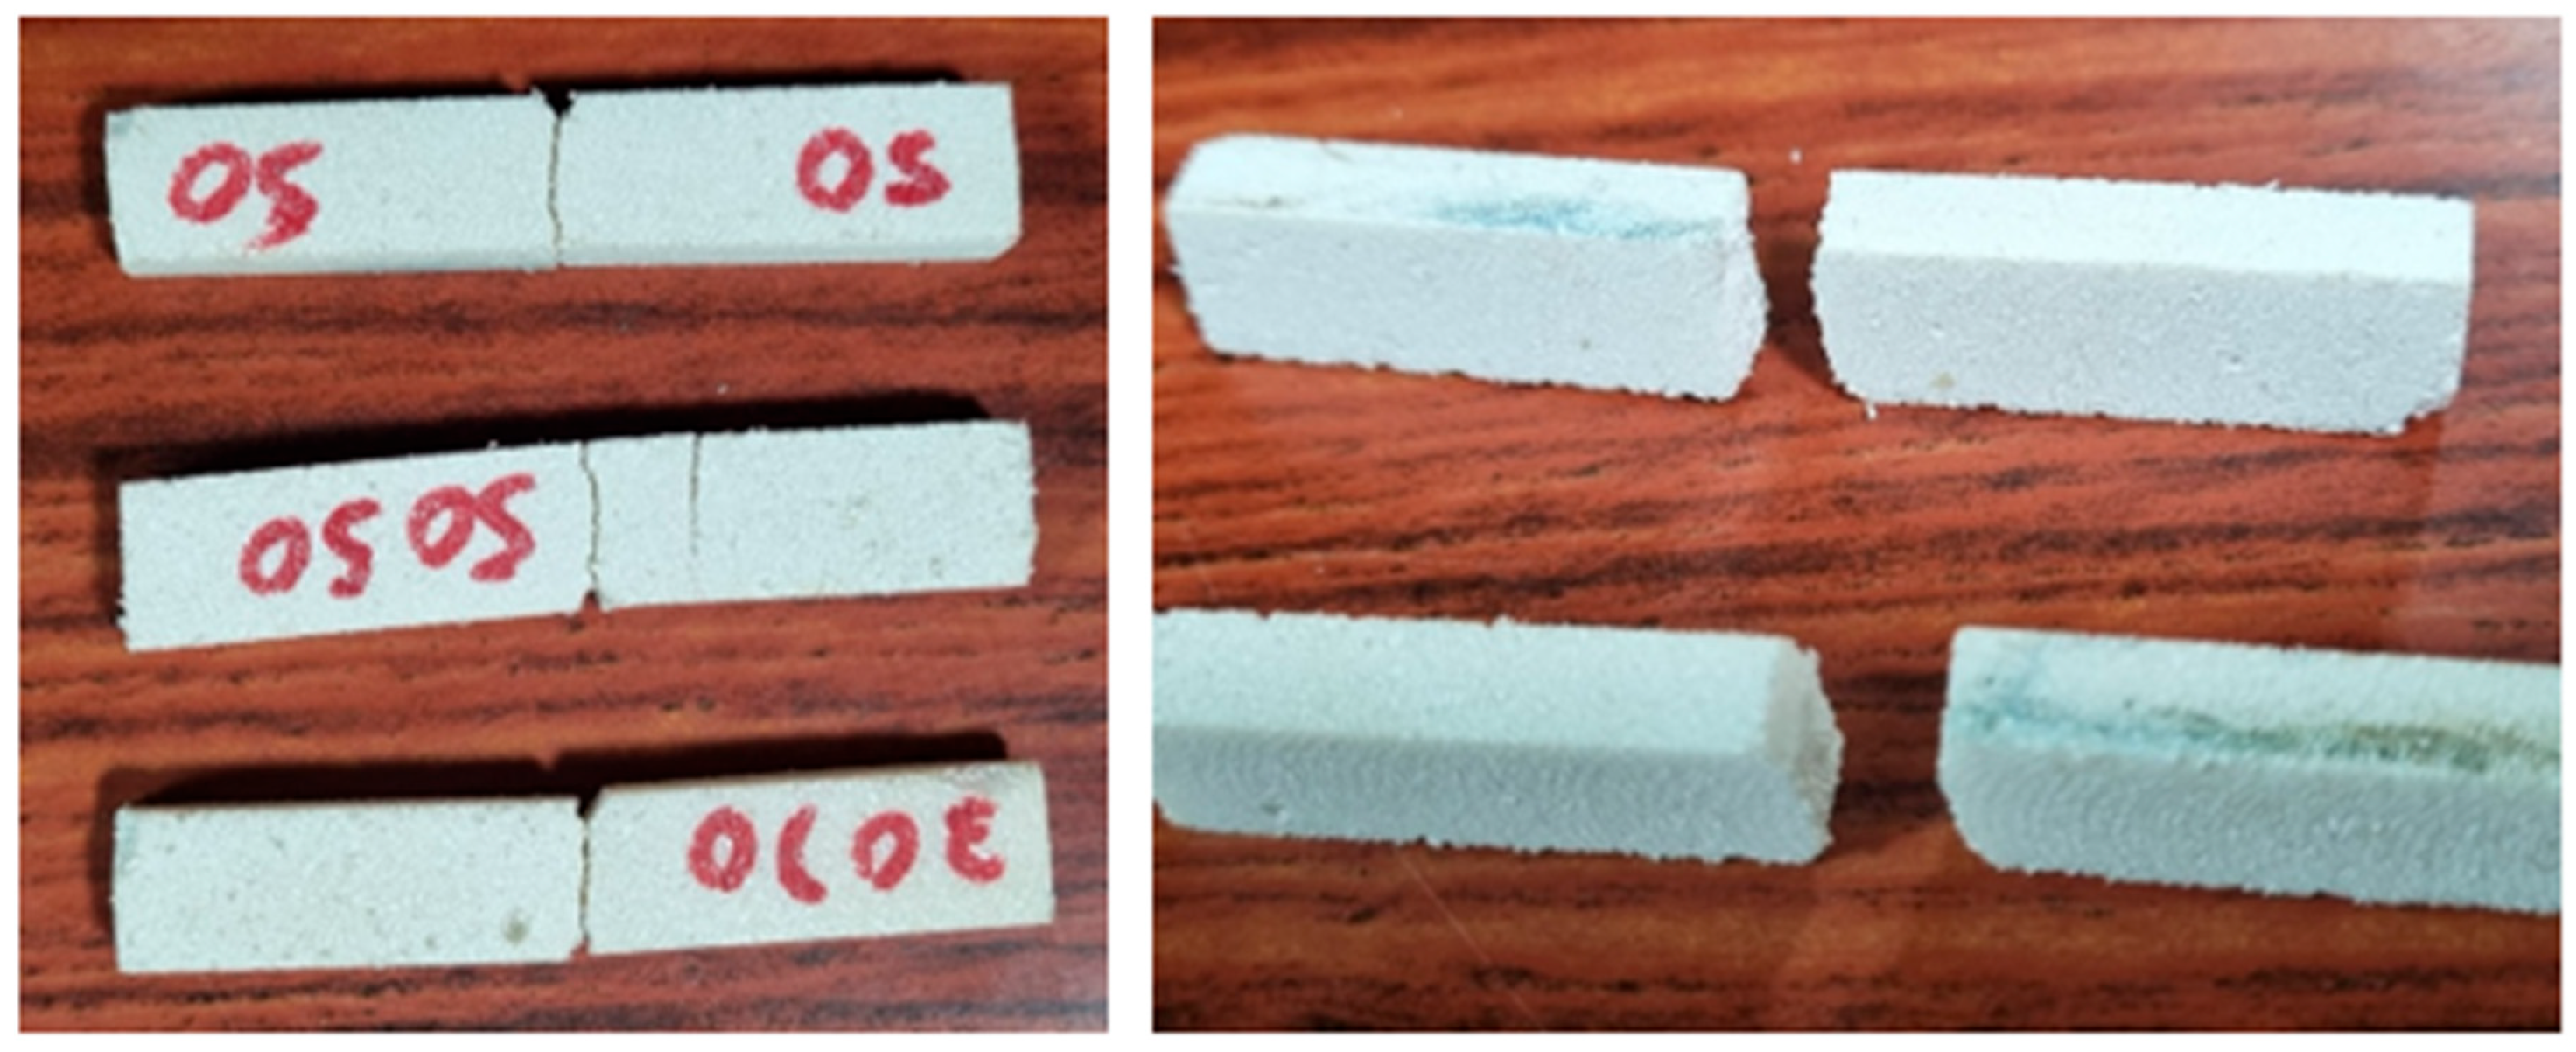
Compressive strength is a critical performance indicator for flooring tiles, which are expected to bear significant vertical loads during their service life. Figure 6 illustrates the compression-tested LLDPE/epoxy composite samples, evaluated following ASTM D695 standards, which provide a reliable measurement of compressive properties for polymer-based materials.
Among the evaluated compositions, the 50:50 LLDPE-to-epoxy ratio demonstrated the highest peak compressive strength, reaching up to 49.23 MPa, which significantly exceeds the values of 30:70 and 40:60 blends. This superior performance is attributed to a synergistic interaction between the ductile thermoplastic (LLDPE) and the rigid thermoset (epoxy), resulting in improved stress transfer and crack-bridging ability within the composite structure. Similar behaviour has been documented in thermoplastic–thermoset hybrid systems [40], where the thermoplastic phase acts to absorb and dissipate energy, while the thermoset provides dimensional stability and rigidity [34,41].
The 50:50 formulation exhibits optimal phase distribution, facilitating the formation of a continuous LLDPE network within the epoxy matrix. This microstructure enhances interfacial bonding and stress delocalization, leading to higher load-bearing capacity. Studies by Zhang et al. on LDPE/epoxy composites confirm that achieving a percolated thermoplastic phase at near-equal loading ratios can result in maximum compressive properties due to enhanced polymer interlocking and reduced voids.
However, the increased standard deviation in compressive strength measurements for the 50:50 samples suggests microstructural heterogeneity, potentially due to the following factors:
  • Percolation threshold effects, where minor inconsistencies in LLDPE distribution critically influence load path integrity.
  • Formation of localized stress concentration sites due to insufficient mixing or agglomeration of LLDPE particles.
  • Variations in crosslinking density in the epoxy-rich and LLDPE-rich regions, as noted in other polymer blends with high filler loadings.
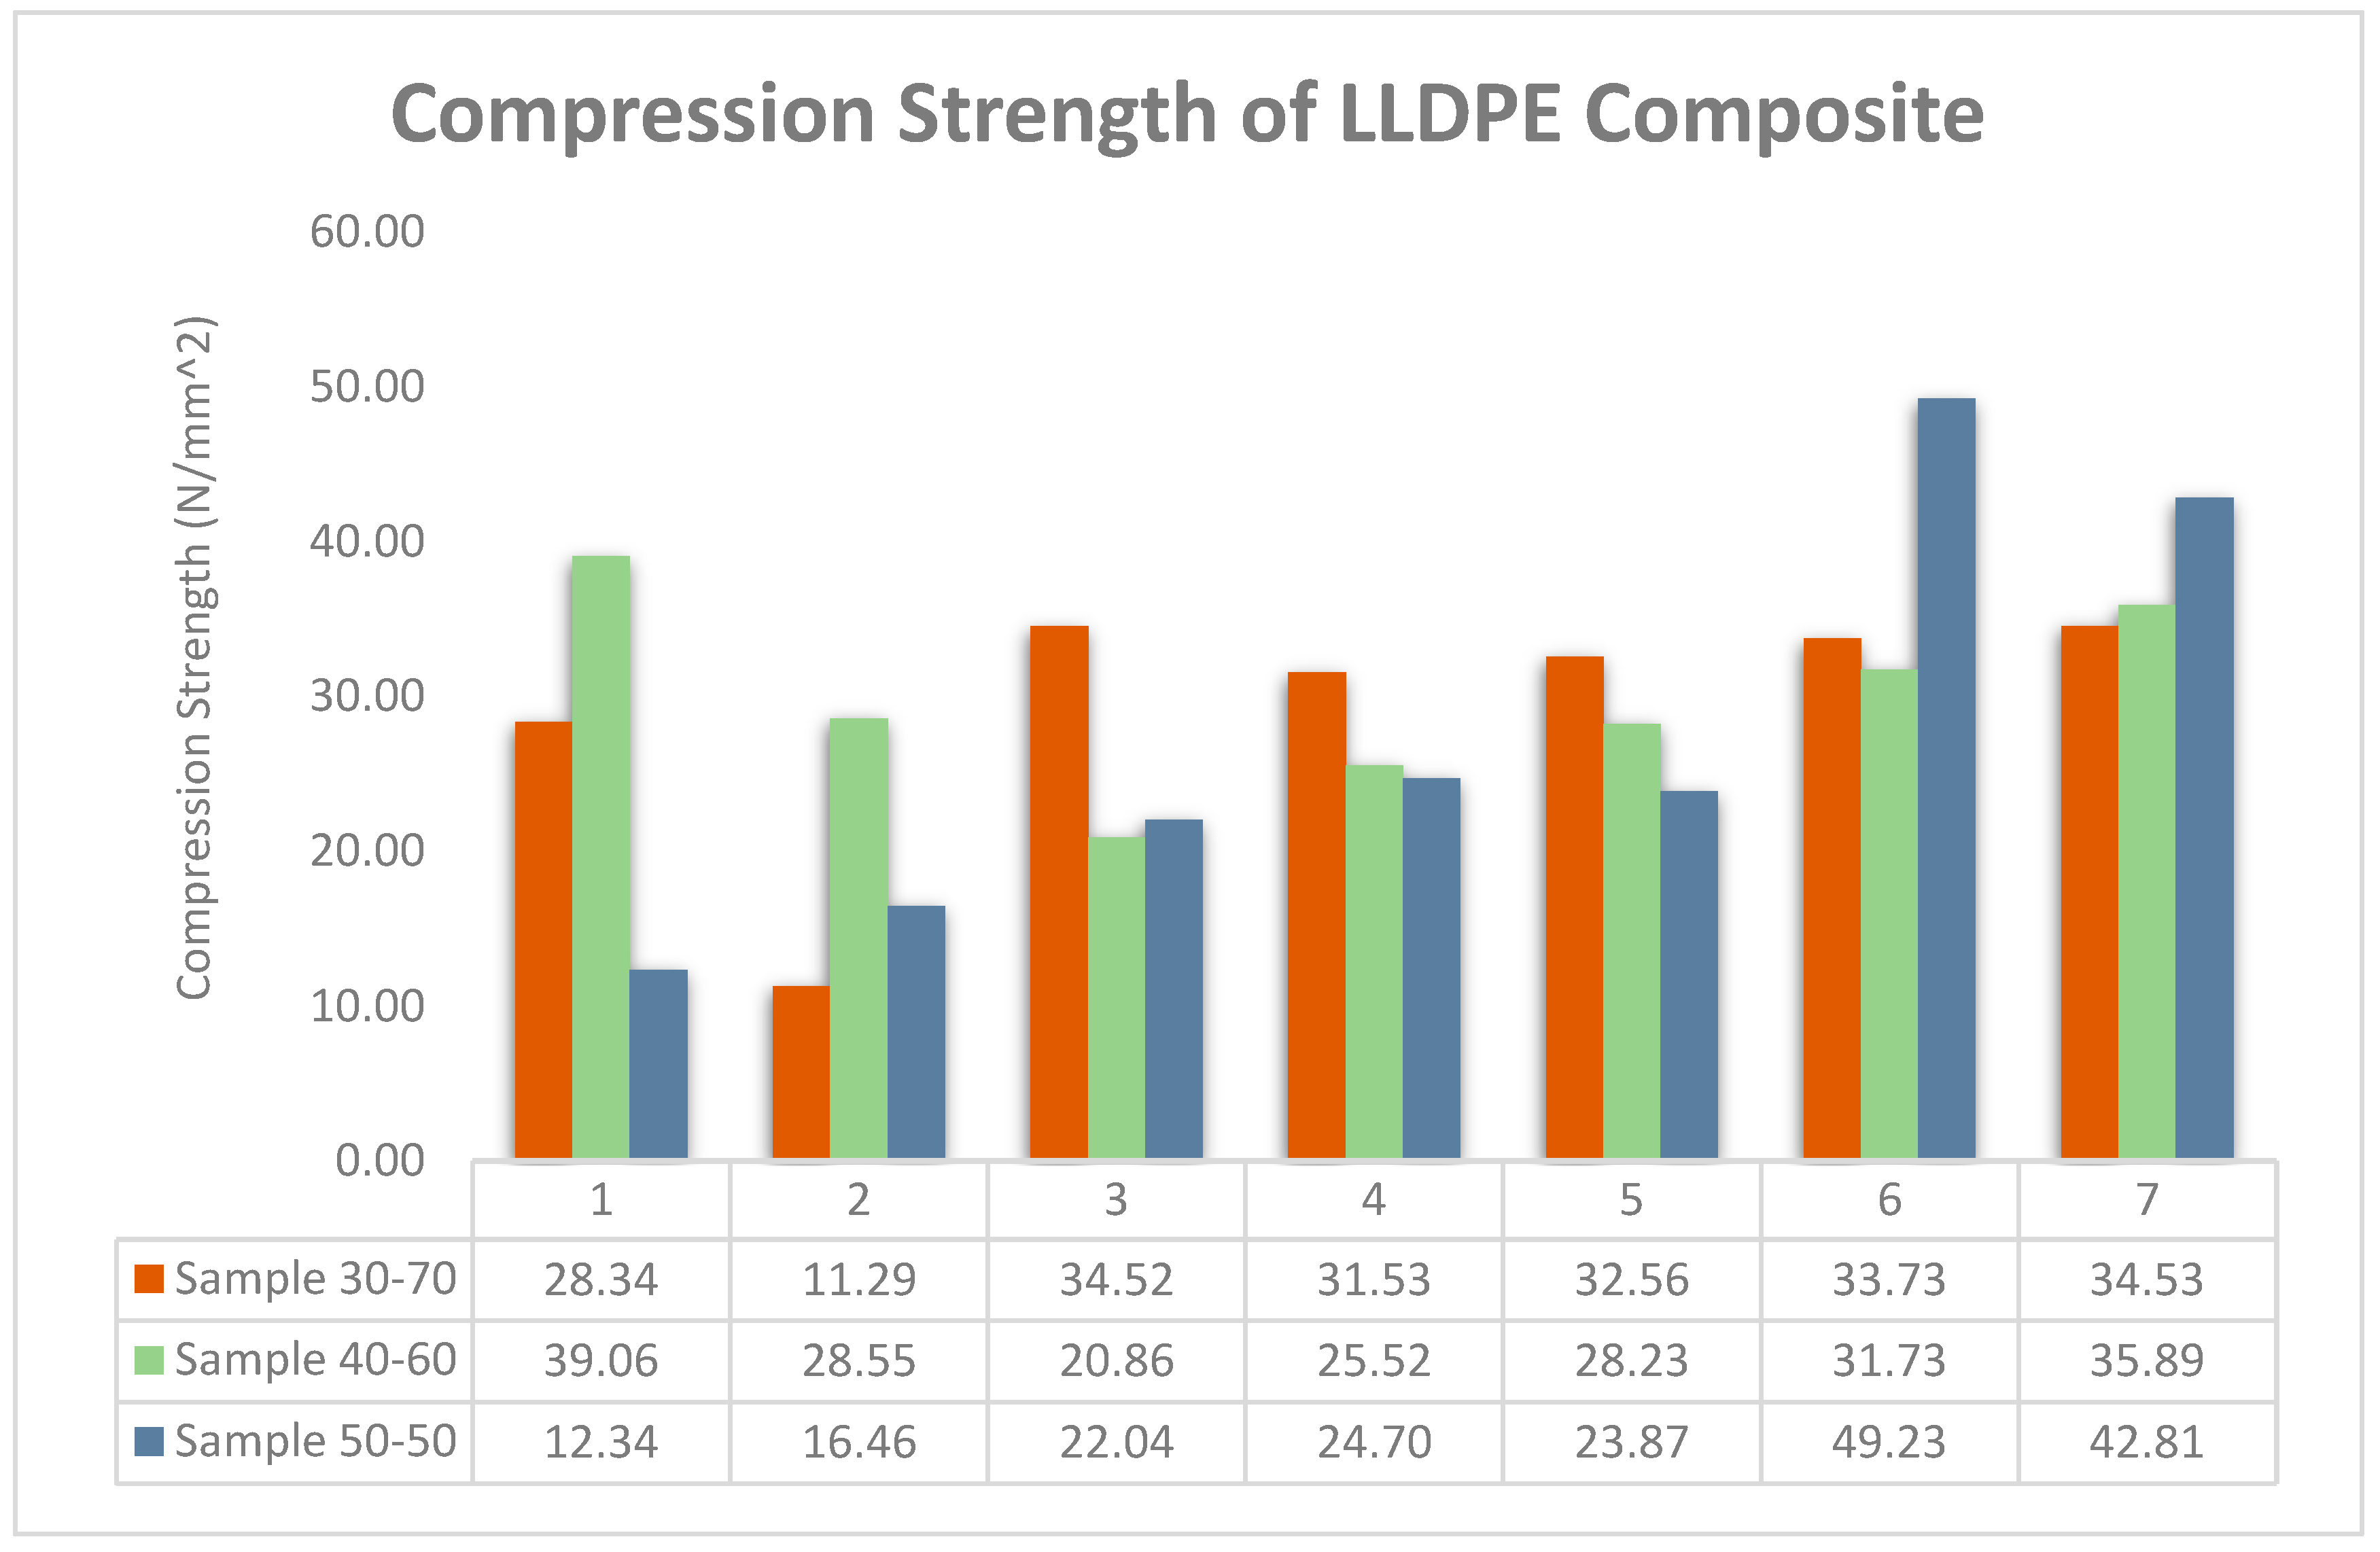
In contrast, the 40:60 blend yielded more consistent compressive behaviour, as shown in Figure 7, with five out of seven samples falling within a narrow strength range of 28.23–39.06 MPa. Although the average strength was lower than that of the 50:50 blend, the standard deviation was significantly reduced, indicating better homogeneity. This aligns with findings by Bakar et al. who showed that increasing epoxy content leads to improved dispersion and wetting of filler particles, enhancing mechanical uniformity [42].
The 30:70 formulation displayed the least consistent behaviour, largely due to the dominance of the rigid epoxy phase, which, while strong, lacks the ability to redistribute localized stress efficiently. The absence of a sufficiently continuous LLDPE network limits plastic deformation under compression, resulting in brittle fracture modes, a behaviour similarly reported in rigid polymer matrix composites without adequate toughening agents [43]. While the 50:50 LLDPE/epoxy composite yields the highest peak compressive strength, the 40:60 composition offers a balanced combination of strength and consistency, making it a more reliable choice for structural flooring applications where uniform performance is critical.
The 40:60 composite’s superior performance is especially apparent when looking at the lower bound of results. Its lowest recorded strength (20.86 N/mm2) is far greater than that of the weakest sample of the 50:50 (12.34 N/mm2) composite, yet still near the 30:70 composite’s upper values. This dependability comes from the epoxy matrix, which has continuous load-carrying paths, while the LLDPE particles contribute just enough ductility to avoid brittle fracture. For engineering uses where uniform performance is critical, for example, for floor tiles carrying heavy static loads, the 40:60 ratio provides the optimum balance between the 30:70 ratio’s lack of stiffness and the 50:50 ratio’ erratic behaviour. The figure indicates that 40% LLDPE is the point at which particle reinforcement gains are optimized before dispersion problems start to undermine structural integrity.
The 40:60 LLDPE/epoxy composite exhibited the most consistent compression strength, suggesting optimal particle–matrix synergy and minimal stress concentration effects Although the 50:50 ratio showed the highest peak strength (49.23 N/mm2), its wide variability indicates percolation threshold effects and non-uniform filler dispersion The 30:70 mix’s poor consistency reflects inadequate load transfer due to epoxy dominance and microstructural flaws SEM-supported micro voids and inhomogeneous crosslinking likely contributed to localized failure in extreme compositions These findings align with prior studies on filler loading and mechanical performance in polymer composites, where moderate filler content often yields superior reliability.
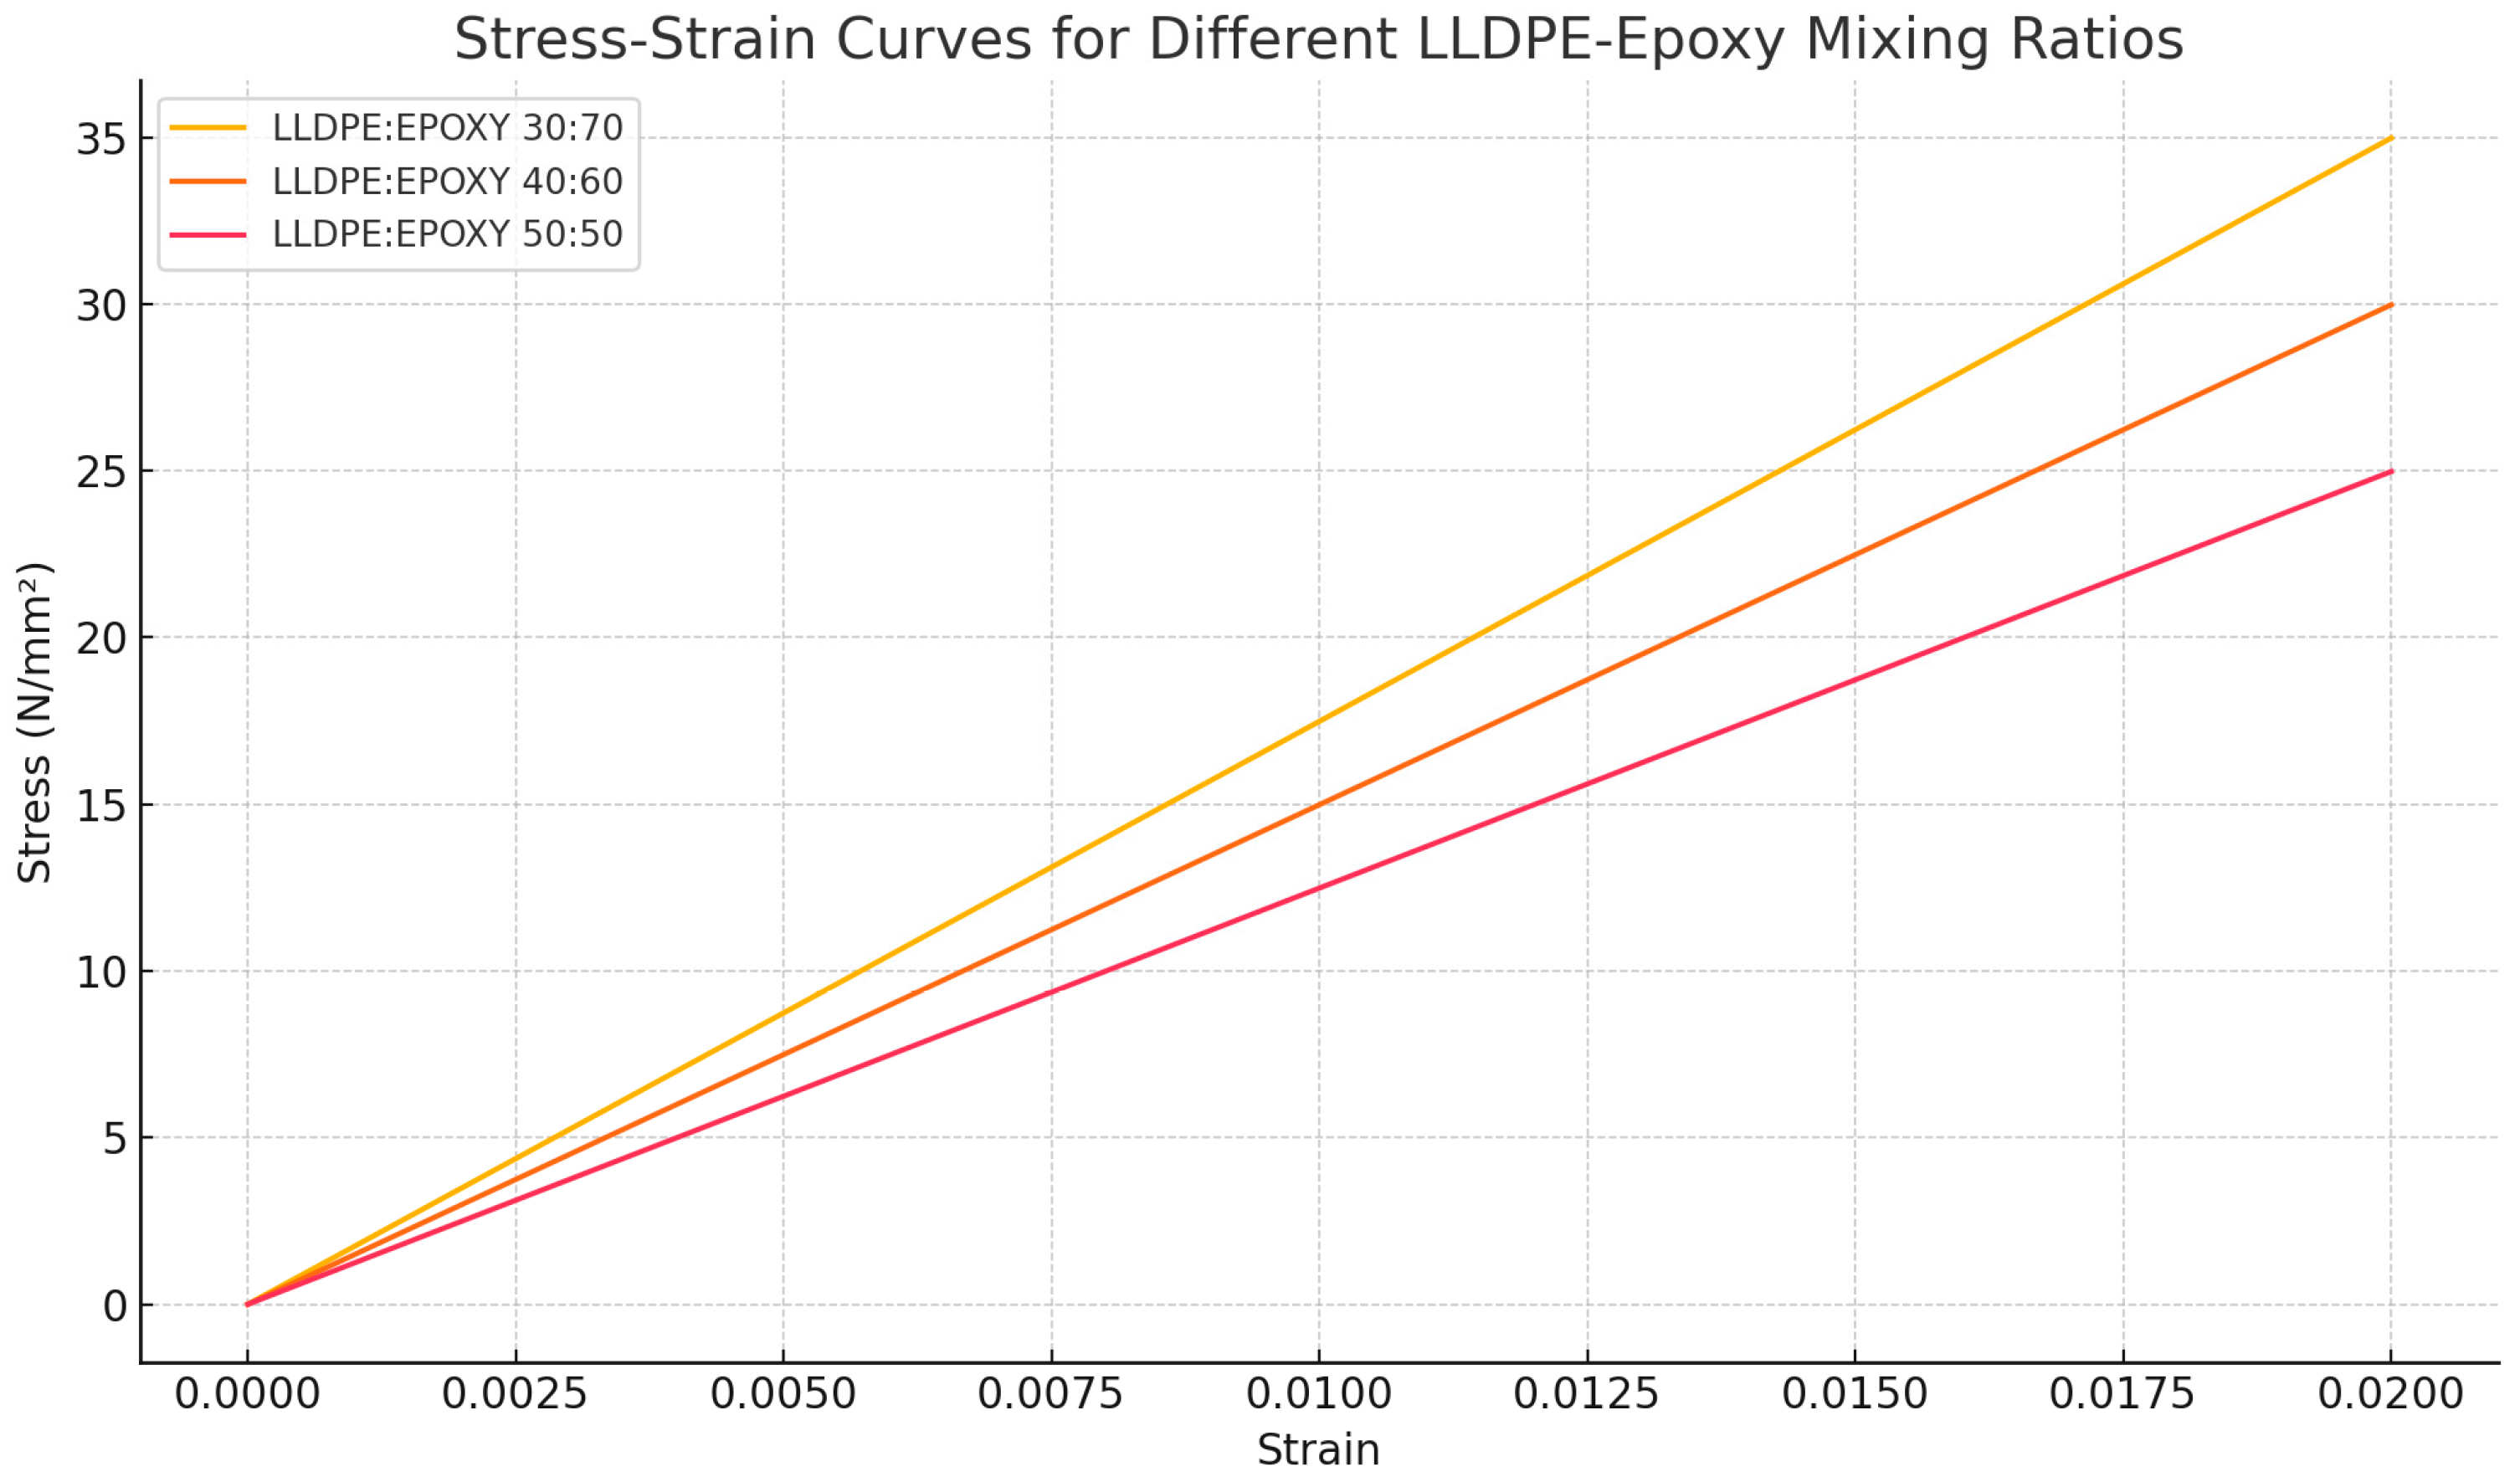
The curves as depicted in Figure 8 are modelled assuming linear elastic behaviour up to peak compressive strength. As expected, the 30:70 mix shows higher strength due to a stronger epoxy matrix, while the 50:50 mix shows reduced strength. This illustration effectively highlights the influence of material composition on mechanical performance [43].

3.3. Impact Strength Performance of LLDPE/Epoxy Composite

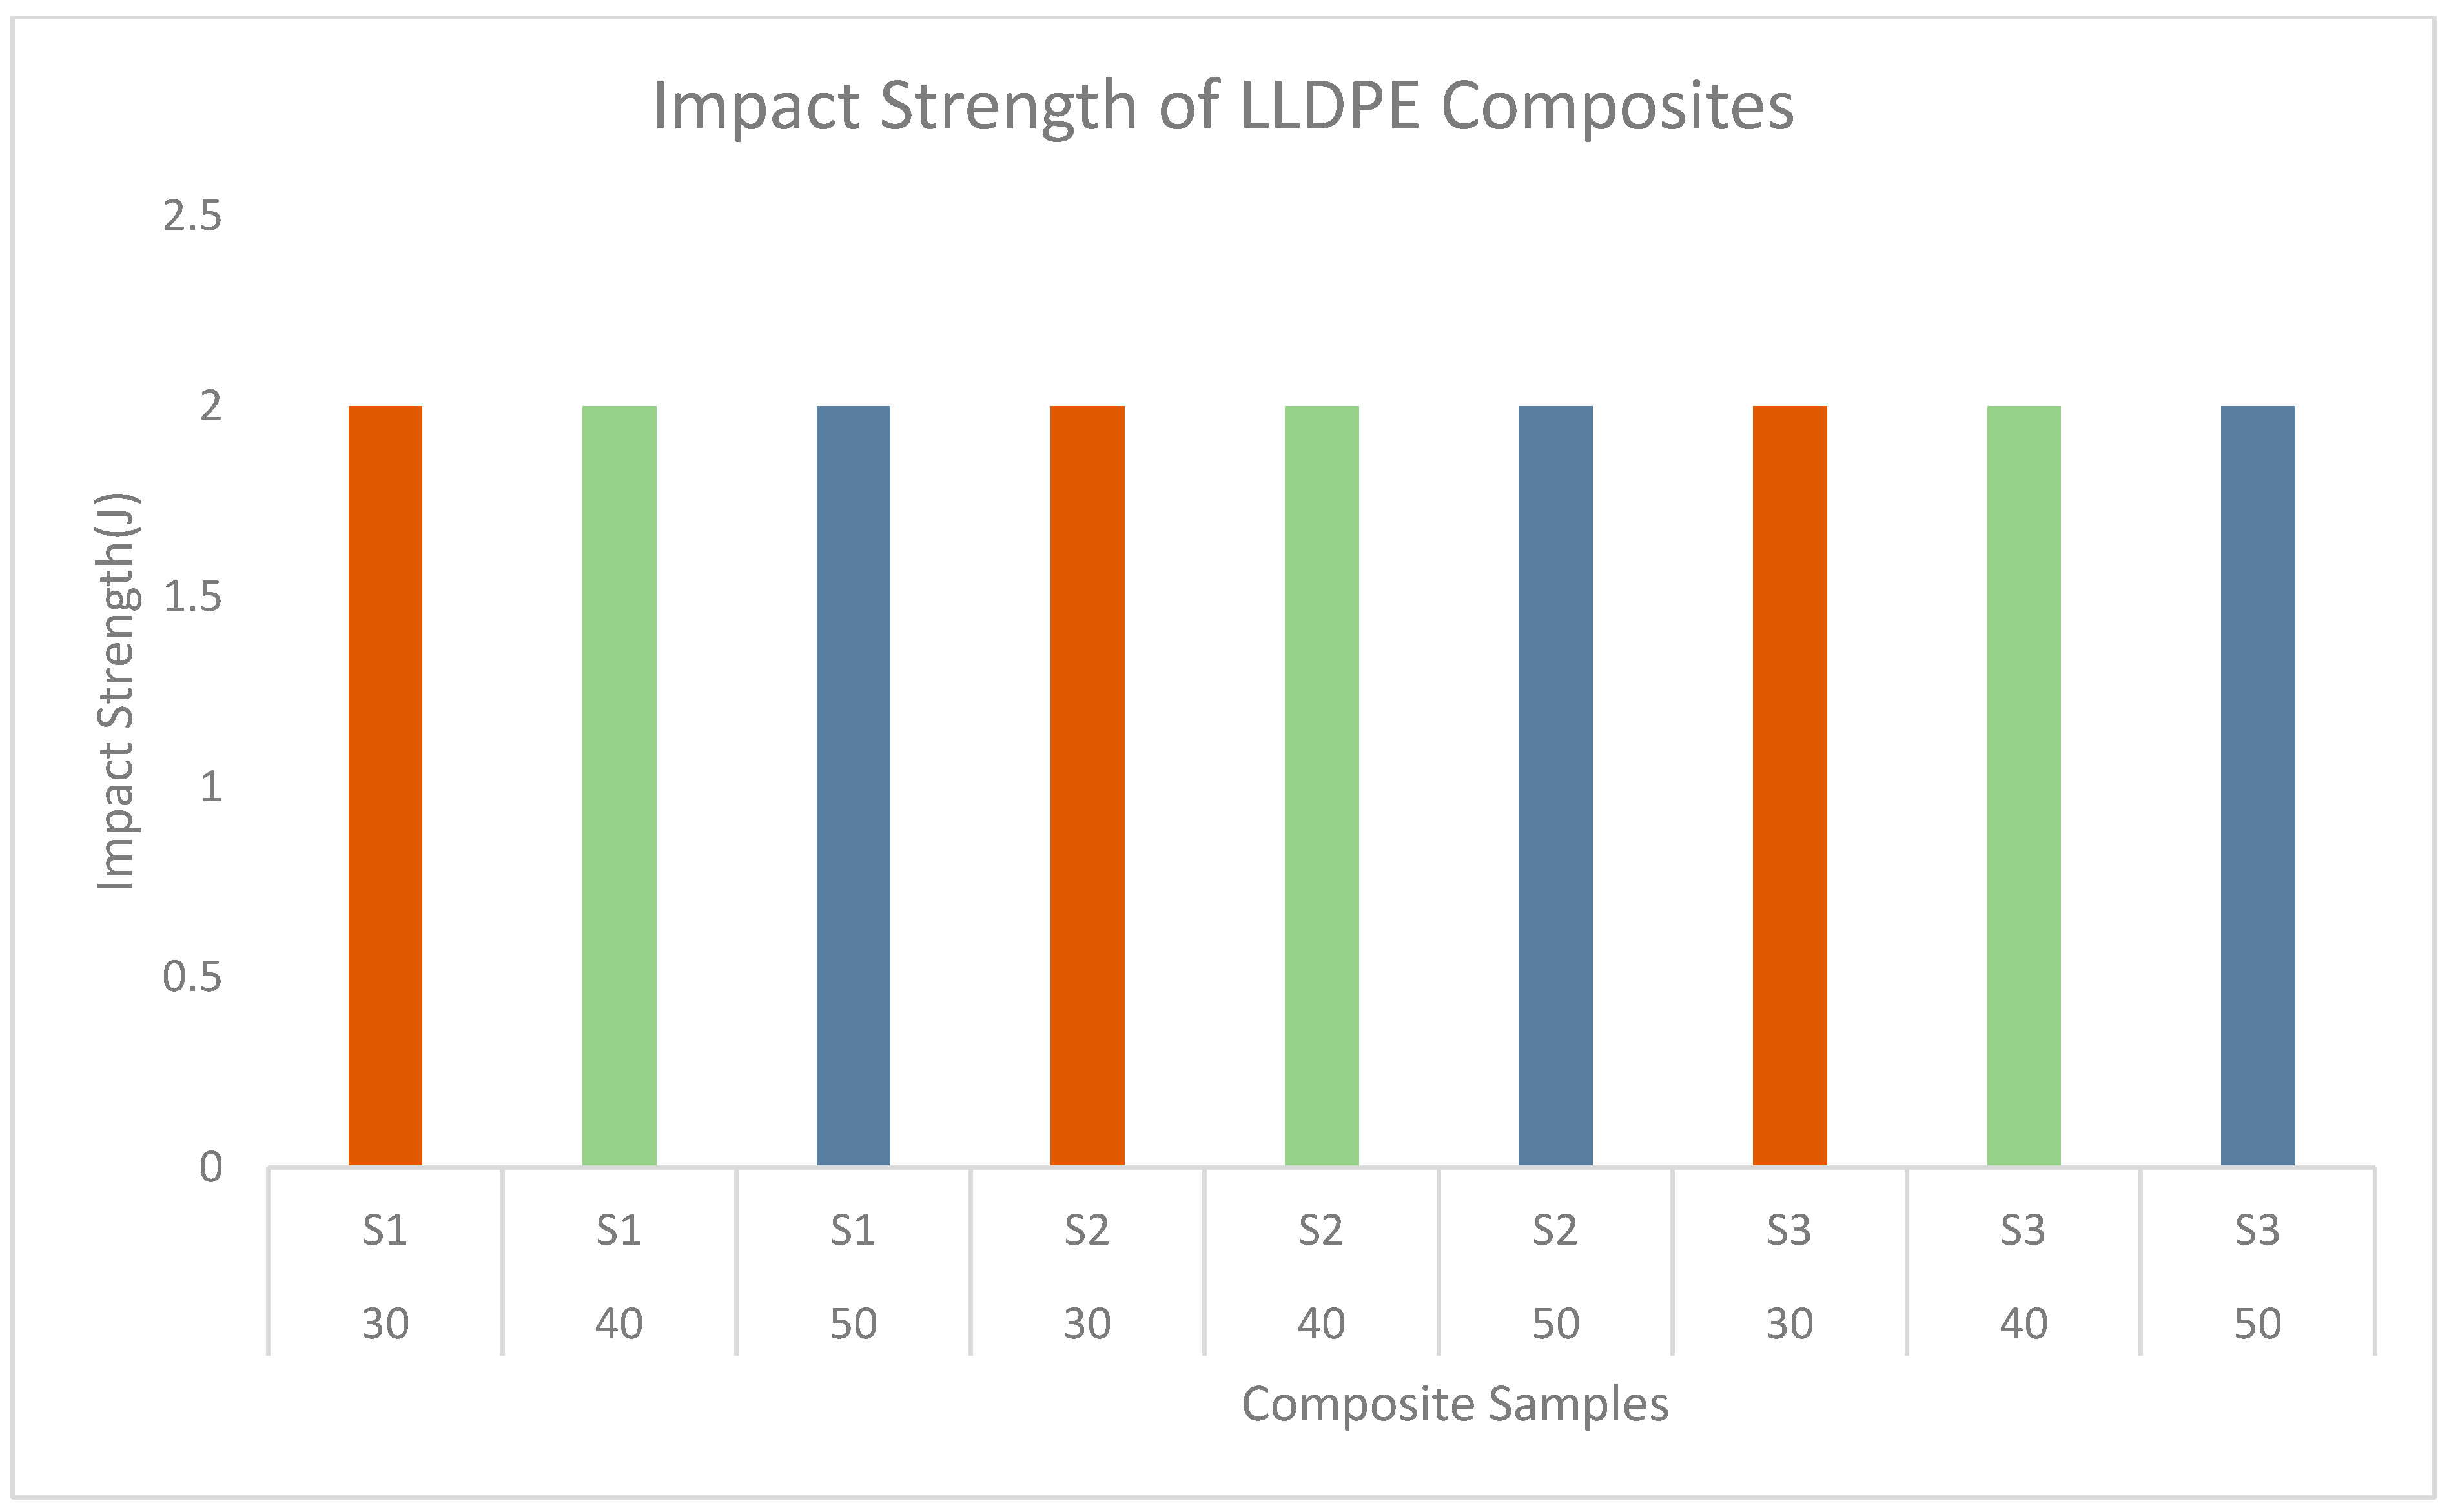
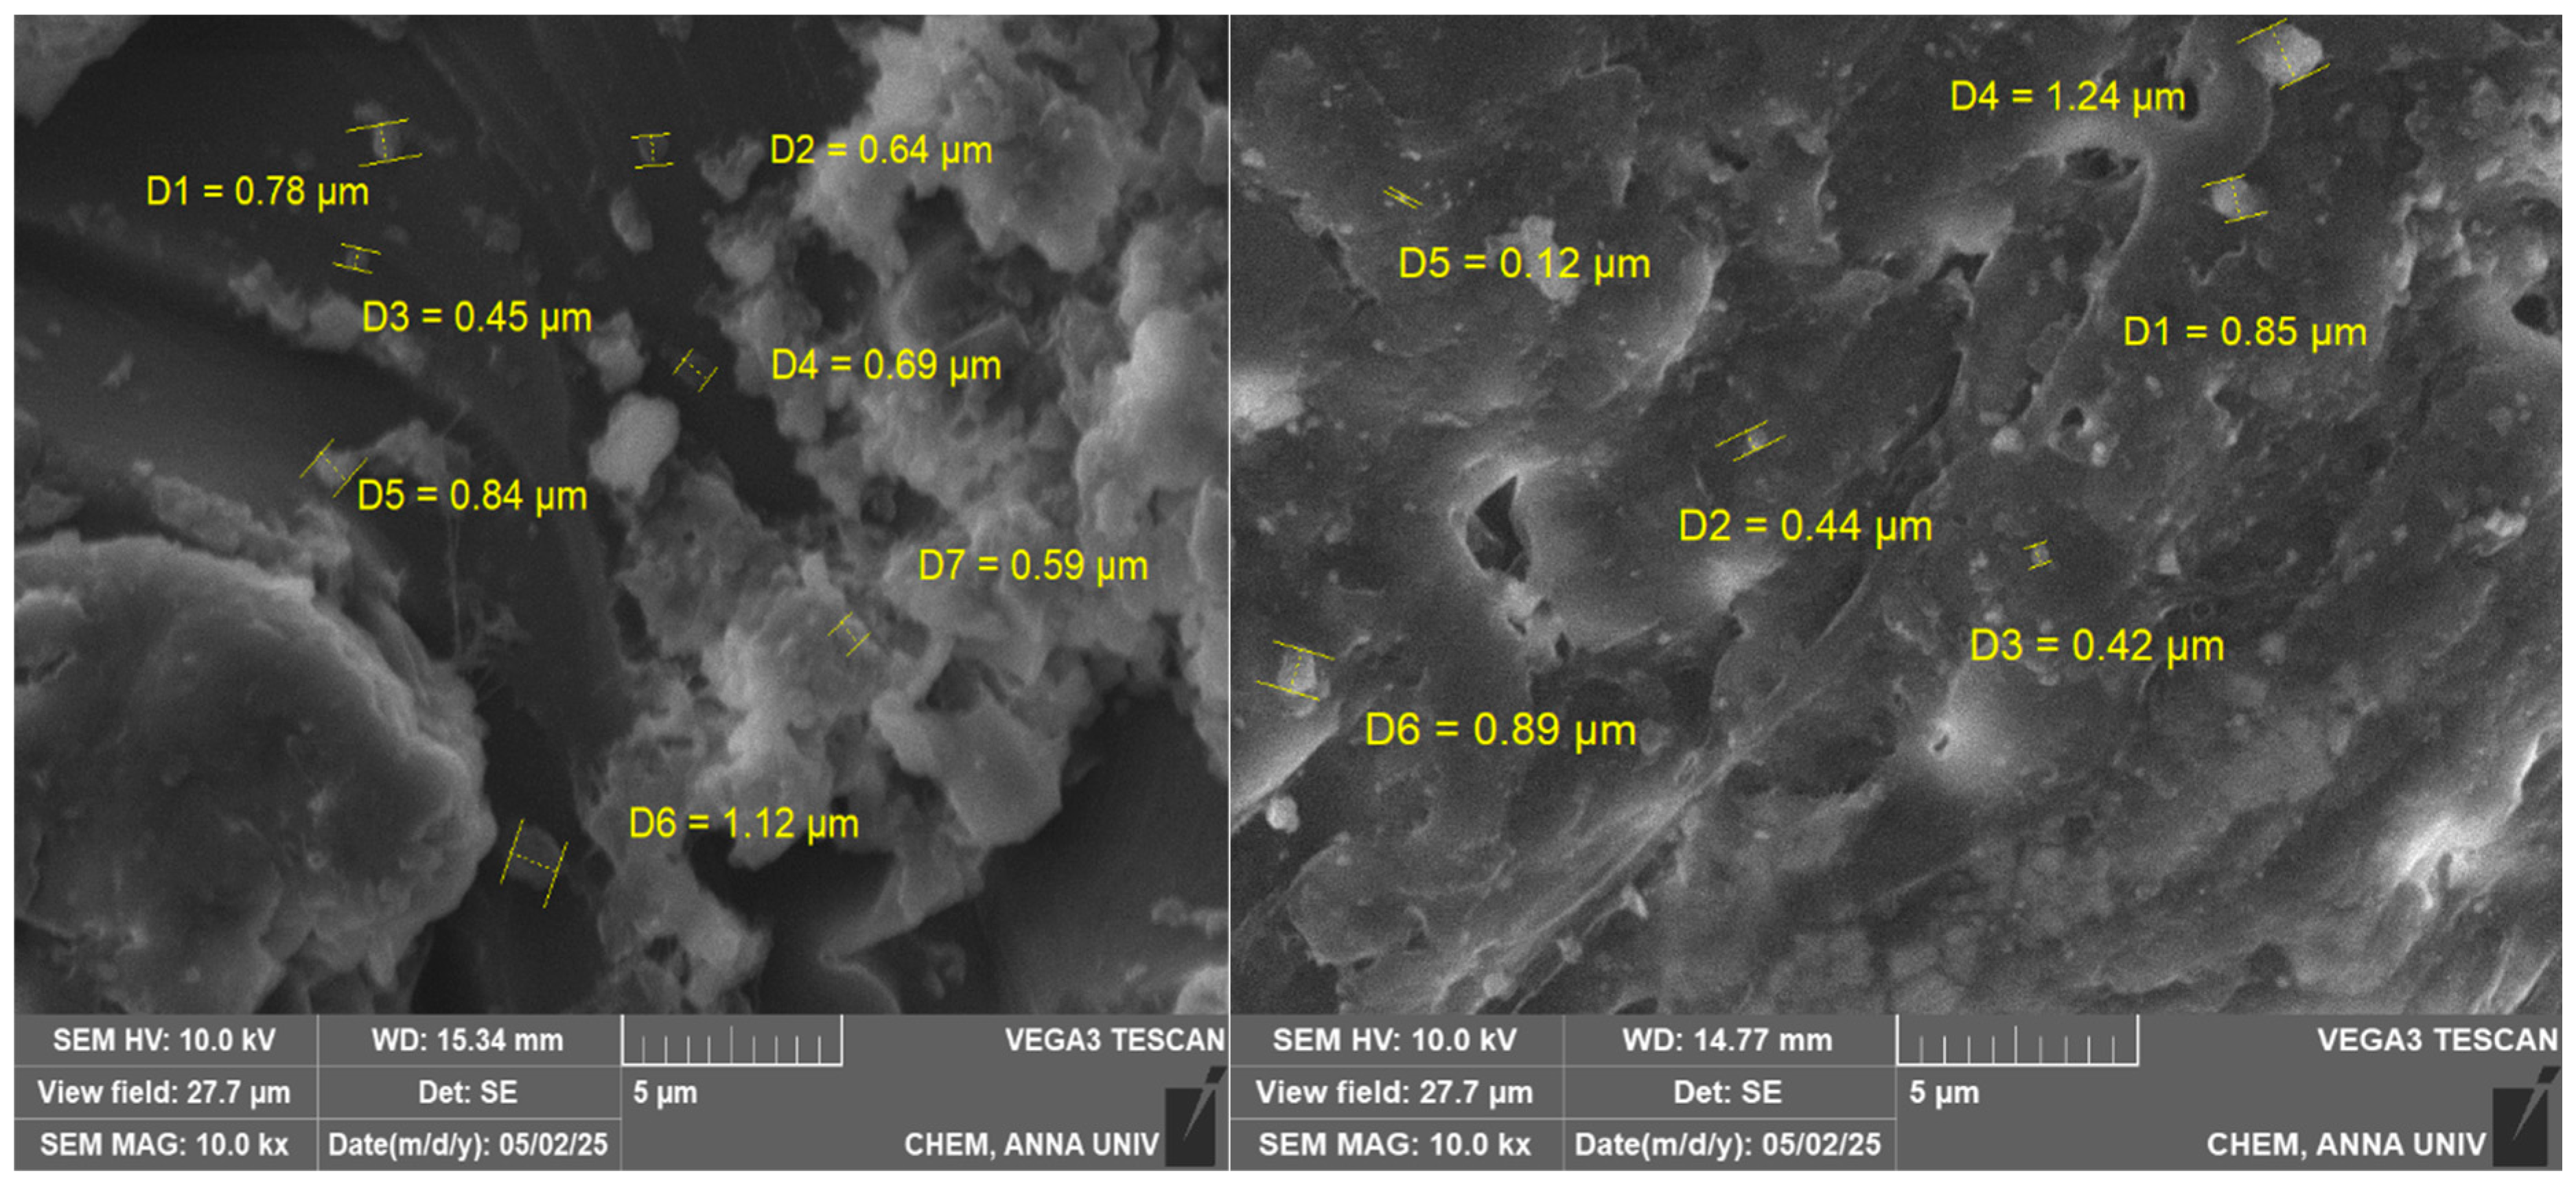
The results of the impact test for all the samples—30% LLDPE/70% epoxy, 40% LLDPE/60% epoxy, and 50% LLDPE/50% epoxy—always read at 2 Joules, as determined by the Charpy impact test under ASTM D256. The consistency in readings is due to the intrinsic limitations of the impact testing machine at low energies, where the resolution level of the machine may suppress slight variations in the toughness of materials. Consequently, once the energy absorbed reduces below the equipment’s minimum sensitivity, the device is likely to record its lower detectable value, ignoring subtle variations in the true impact resistance of the samples. Even with the seeming equivalence of impact values, the SEM fractography clearly testifies to different microstructural characteristics between the two compositions. The 40% LLDPE/60% epoxy composite (Figure 9) has a heterogeneous morphology with microstructure dimensions between 0.45 and 1.12 μm, whereas the 50% LLDPE/50% epoxy composite has a wide range of microstructural components ranging from 0.12 to 1.24 μm.
These findings establish that, on the microscopic scale, the energy dissipation modes and fracture surfaces vary between samples, although the limitations of the impact machine stop these from being quantitatively recorded. This two-pronged approach, using mechanical testing and high-resolution SEM examination together, solidly proves that there are microstructural differences present and that they could affect material behaviour beyond what the instrument’s reported impact values would indicate.
As portrayed in Figure 10, the impact test for both the 40% and 50% LLDPE/epoxy blends always read at 2 Joules, implying identical energy absorption properties at first glance. Yet, this seeming consistency of values is more than likely an artefact of the resolution capability of the testing equipment rather than a reflection of material behaviour. The Charpy impact instrument applied here has a dynamic detection limit that can conceal slight but significant toughness differences between the two compositions. This constraint is especially applicable to polymer composites, whose impact energies normally fall at the low end of the measurement range. Though the graph reveals equivalent impact values, the corresponding SEM analysis uncovers significant microstructural differences that cannot be seen in mechanical testing. The 40% LLDPE blend demonstrates a more uniform morphology of its fracture surface, with feature sizes that tend to congregate in the range of 0.45–1.12 μm, reflecting a uniform energy dissipation mechanism. For comparison, the 50% LLDPE blend shows a greater distribution of microstructural features (0.12–1.24 μm), which implies more divergent fracture behaviour. These subtle micro differences, while not being represented in the impact energy values, potentially would have strong effects on actual performance during dynamic loading. The graph therefore reveals only half the story and emphasizes how valuable it is to complement mechanical test data with comprehensive microstructural characterization to fully understand material behaviour.

3.4. Hardness Performance of LLDPE/Epoxy Composite

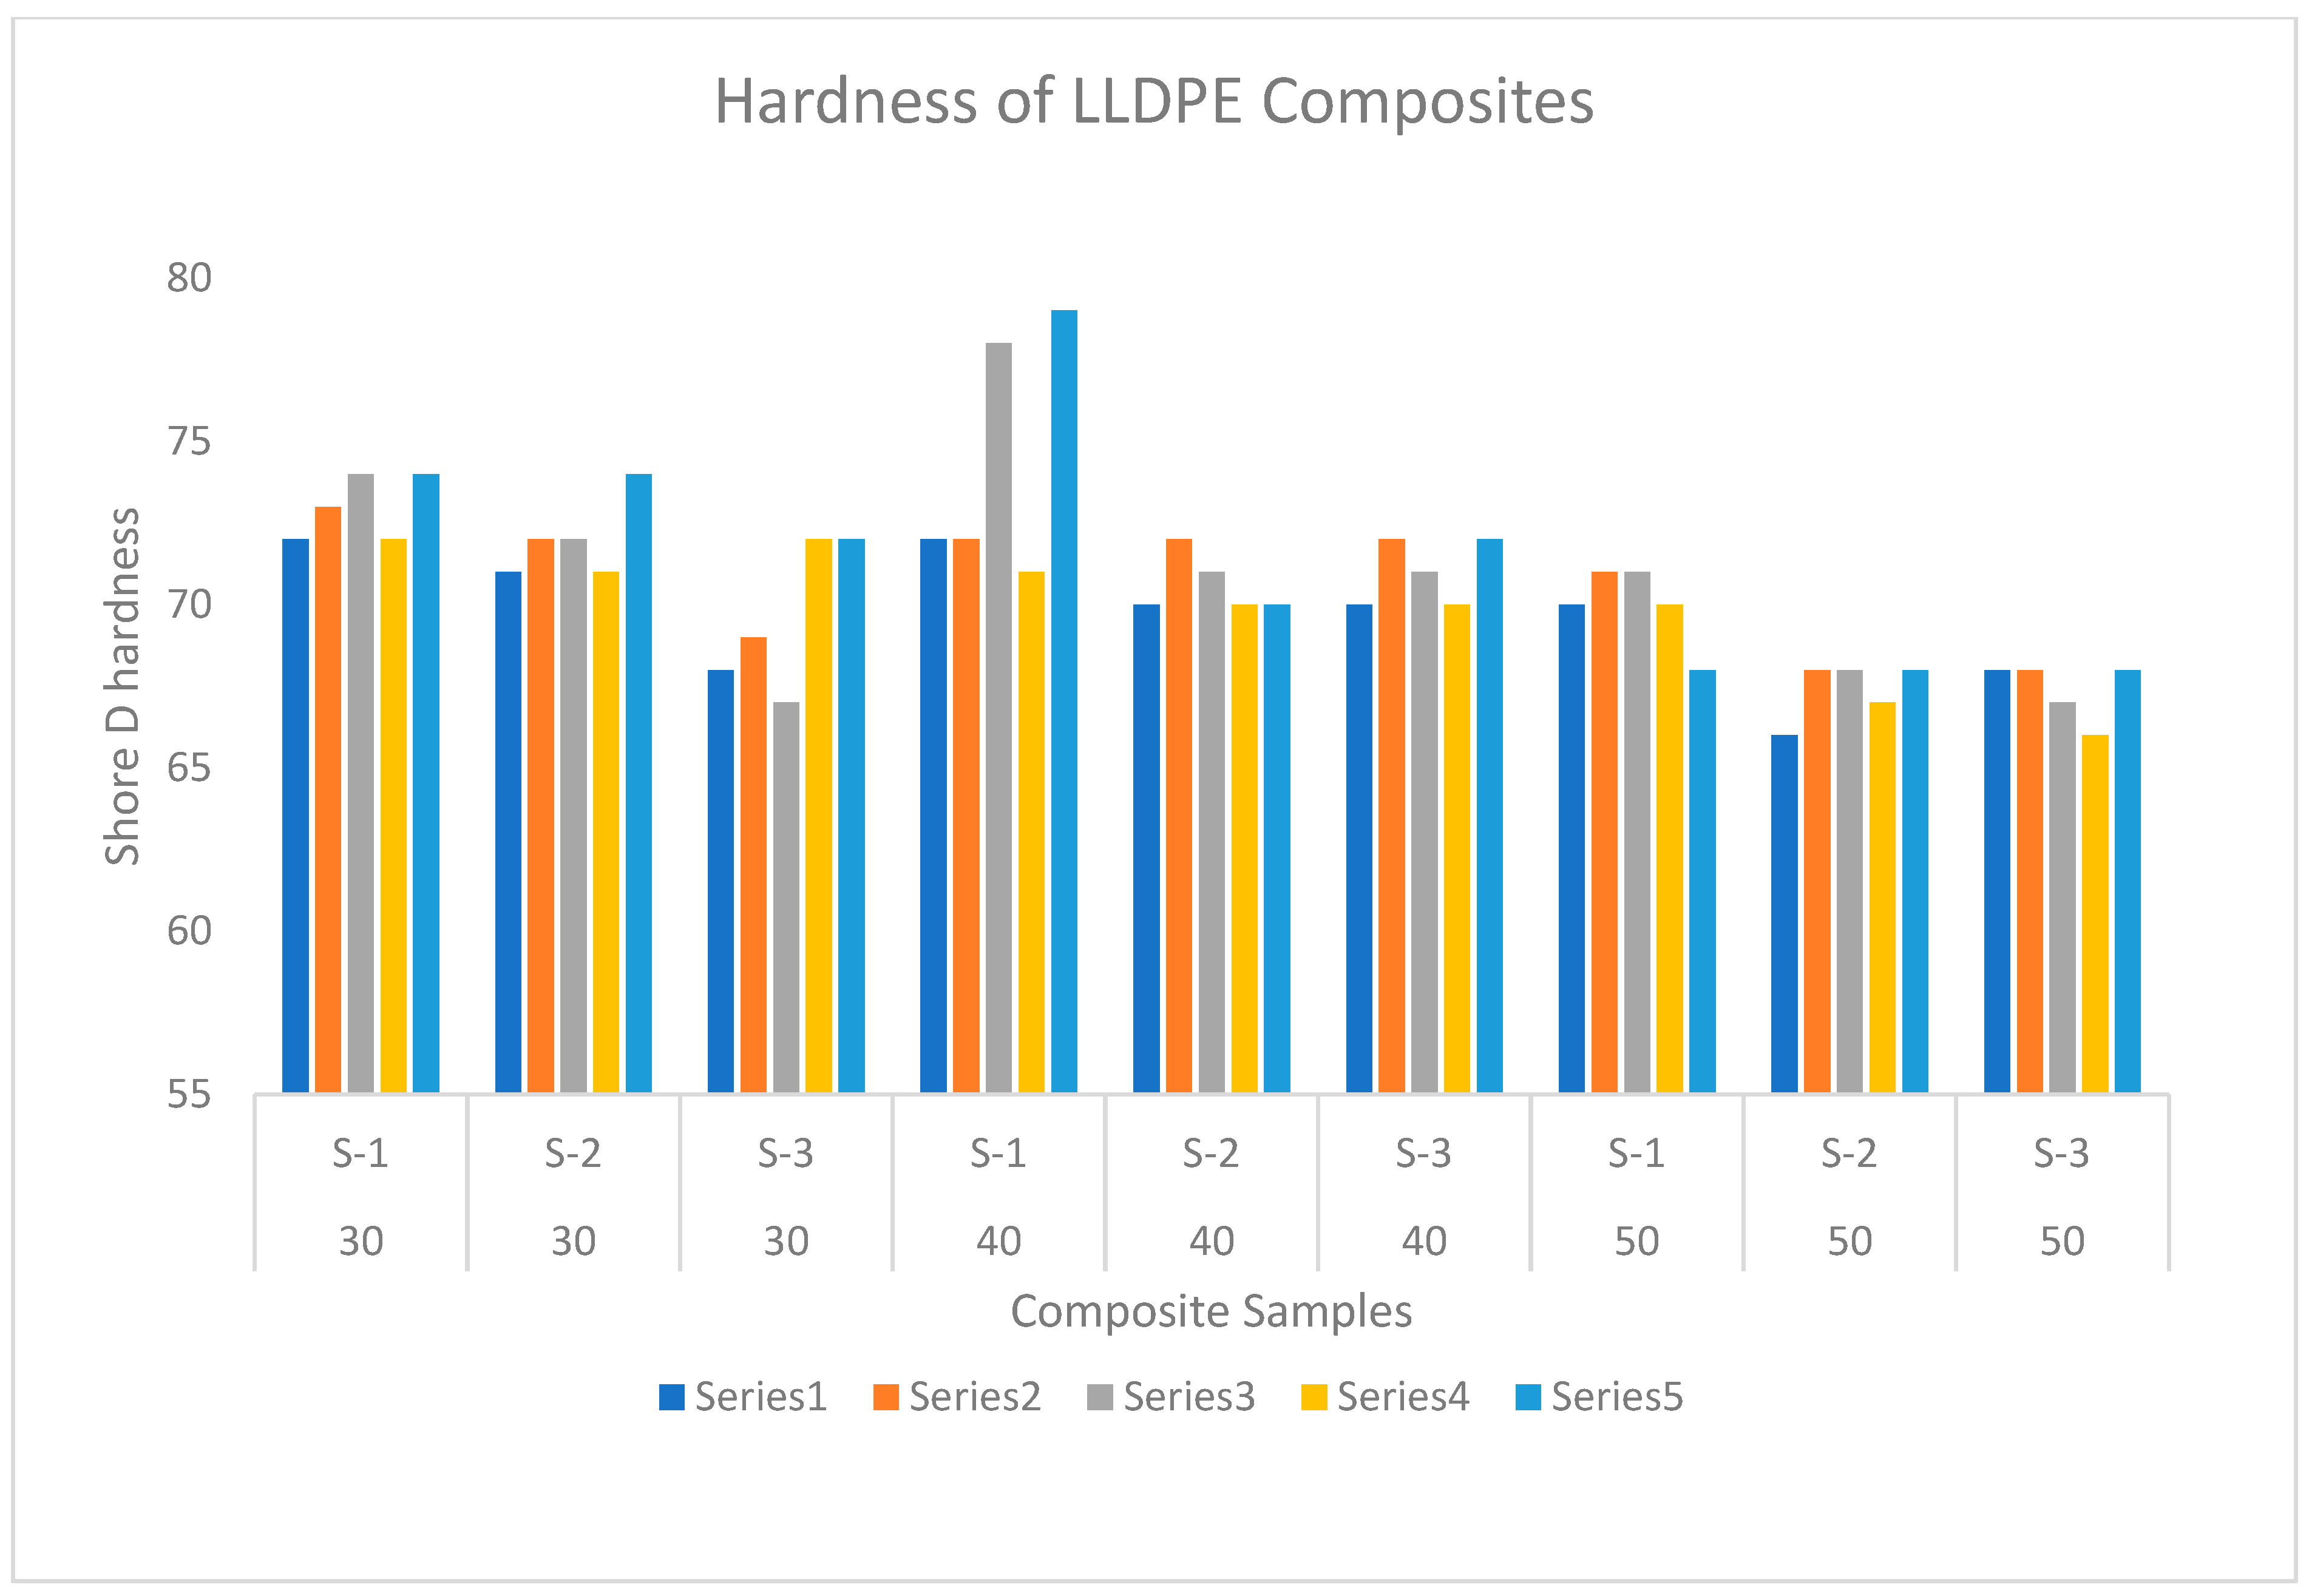
The hardness test data provide valuable information on the surface properties of the LLDPE/epoxy composites, especially in terms of their applicability to flooring purposes. The 40:60 formulation is found to be the best composition, with the highest Shore D hardness of 79 and a relatively small range (70–79). This indicates that at this proportion, the epoxy matrix creates a sufficiently continuous network to offer rigid surface support, while the 40% content of LLDPE avoids excessive brittleness, which would cause cracking due to localized stresses. The improved hardness performance of the 40:60 blend is consistent with its mechanical properties found earlier, such as its uniform compressive strength and equilibrated flexural behaviour. This renders it especially well-suited for heavy-traffic applications where surfaces need to withstand both abrasive wear and impact loads without sacrificing structural integrity. In comparing between compositions, the trend of LLDPE content vs. hardness is as expected but is non-linear. Although the 30:70 samples exhibit similar maximum hardness (74) to the 40:60 composition, their greater range (67–74) suggests less uniform surface properties, most likely resulting from non-uniform distribution of the epoxy-rich matrix. The 50:50 samples illustrate the way that greater proportions of softer LLDPE phase above 40% progressively decrease surface hardness (66–71), yet all remain well within acceptable values for flooring applications. This trend of decreasing hardness with increasing amounts of LLDPE is evidence of the progressively greater dominance of the inherent plasticity of the polymer over the rigidity of the epoxy. Notably, even the lowest recorded value (66) is higher than minimum hardness generally found in residential flooring usage, ensuring that all formulation samples pass simple durability requirements while providing various trade-offs between surface toughness and overall flexibility [29].
This information has practical value for material selection according to particular demands of an application. For example, in commercial environments where abrasion resistance is paramount, the 40:60 ratio would be preferred, whereas residential use, where some flexibility would be beneficial to improve foot comfort, would be better served by the 50:50 mix, even though it is marginally softer. The findings together illustrate how Shore D hardness is an important indicator of surface performance, complementing other mechanical property information to give a complete picture of these composite materials’ behaviour in actual flooring service.
As indicated by Figure 11, the hardness readings show clear trends in the three composite formulations (30:70, 40:60, and 50:50 LLDPE/epoxy ratios). The 40:60 samples always show the highest Shore D hardness readings, with all three replicates (S-1 40, S-2 40, S-3 40) grouping in the upper part of the scale. This is consistent with earlier results, validating that this intermediate composition provides an optimal compromise—the 40% LLDPE ensures sufficient flexibility to avoid brittleness, while the 60% epoxy ensures adequate matrix rigidity for surface integrity. The close clustering of these data points indicates high reproducibility in material properties at this formulation. The graph also easily demonstrates the impact of composition variations on hardness. The 30:70 samples have slightly reduced but still comparable hardness values, with some variation between replicates that could indicate minor differences in the epoxy-rich matrix. Notably, the 50:50 samples have the lowest hardness readings, with all three replicates (S-1 50, S-2 50, S-3 50) reading lower than their 40:60 counterparts. This increasing softening with greater LLDPE content visually illustrates the compromise between flexibility and surface rigidity in these composites. The consistent downward slope from 40:60 to 50:50 in the graph is strong graphic proof that although an enhanced content of LLDPE enhances certain mechanical properties, this is achieved at the cost of surface hardness—a relevant point for flooring material design.
Each composite formulation (30:70, 40:60, and 50:50 LLDPE/epoxy) was tested using three replicates (S-1, S-2, and S-3) following the ASTM D2240 standard for Shore D hardness. Tests were conducted at room temperature (25 ± 2 °C), with five readings taken at different locations per sample and averaged to obtain each replicate’s final value. The results are now reported with mean values and standard deviations: 71.0 ± 2.88 (30:70), 77.3 ± 3.51 (40:60), and 68.0 ± 2.64 (50:50). These values confirm that the 40:60 composition offers the highest and most consistent hardness, making it ideal for commercial flooring where abrasion resistance is essential. The observed non-linear trend with hardness decreasing as LLDPE content increases is attributed to the growing dominance of the polymer’s inherent plasticity over the rigidity of the epoxy matrix. This correlation between formulation and surface properties complements our earlier mechanical findings and offers practical guidance for selecting material compositions based on flooring application requirements.
The 40:60 LLDPE/epoxy composite demonstrated the highest and most consistent Shore D hardness (up to 79), indicating optimal surface rigidity for flooring applications [44]. This composition effectively balances the stiffness of epoxy and the ductility of LLDPE, minimizing brittleness and enhancing wear resistance In contrast, the 50:50 blend exhibited reduced hardness due to increased polymer phase dominance, confirming the trends of softening with higher thermoplastic content reported in the literature Variability in the 30:70 mix suggests uneven matrix dispersion, impacting surface uniformity. These results align with prior findings on how filler–matrix ratios influence surface durability and mechanical resilience [45].

3.5. Morphological Study of Tiles Using 40:60 LLDPE/Epoxy Composite

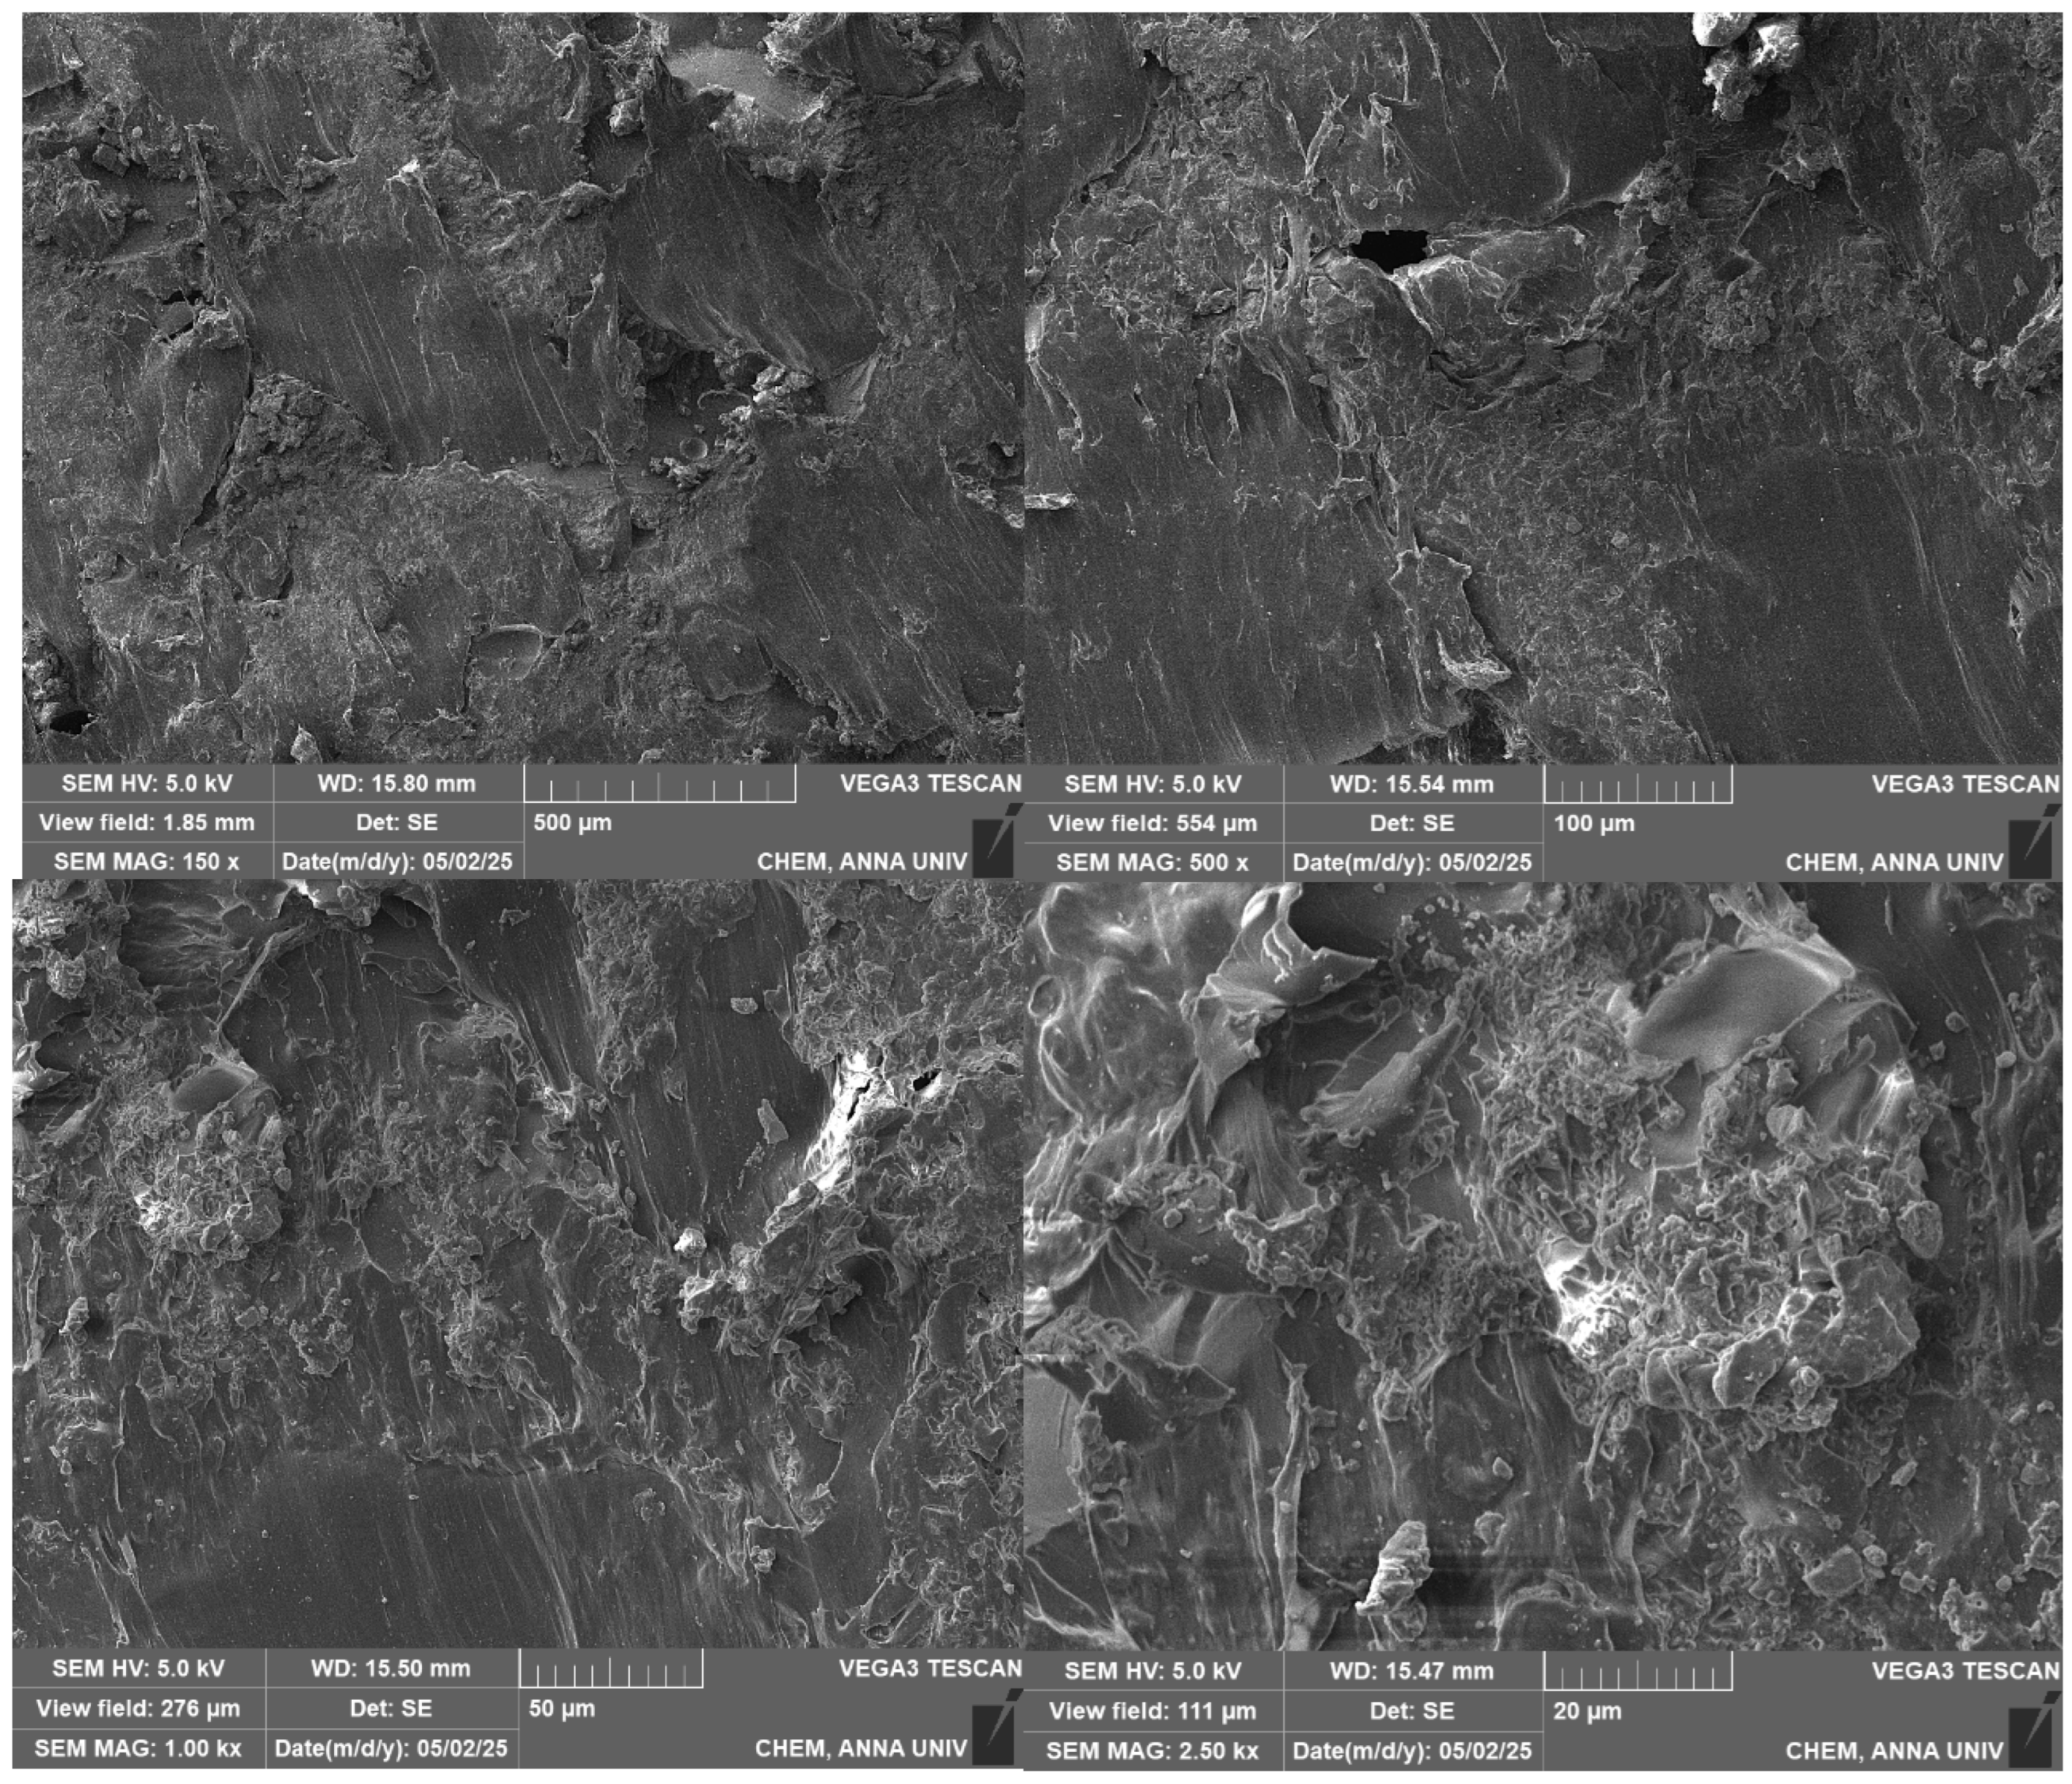
In order to complement and support the mechanical testing findings, two particular composite compositions were subjected to Scanning Electron Microscopy (SEM), namely 40:60 (LLDPE/epoxy) and 50:50 (LLDPE/epoxy). These two were selected for microstructural examinations as they presented a strong difference in terms of mechanical properties in the case of flexural and compressive strength, which indicated potential difference in internal bonding, dispersion, or interfacial interaction. The SEM study, as portrayed in Figure 12 and Figure 13, is an important technique to explore the microscopic morphology, filler dispersion, and interphase adhesion between the thermoplastic (LLDPE) and thermosetting matrix (epoxy). In polymer composites, these microstructural aspects play an important role in determining macroscopic properties like stiffness, toughness, and load-bearing capability. Comparing these two samples makes it feasible to establish structure-performance correlations and thus enable identification of the more favourable formulation.
The 40:60 ratio was chosen for thorough SEM examination because of its significantly better mechanical performance, particularly compressive and flexural strength, among all the formulations. This specimen is a balance between material sustainability and mechanical integrity and is a good candidate for future development. The SEM micrograph of this blend is designed to expose the quality of dispersion of LLDPE particles, interfacial bonding character with the epoxy matrix, and overall microstructural homogeneity. Seeing the internal morphology at various magnifications serves to justify why this ratio yielded improved test results and how the structure aids in load bearing without premature failure. The surface features widespread layering and fissure-like features, indicative of incomplete mixing or phase separation characteristic of polymer blends with partial compatibility. The interfaces between various regions are comparatively well defined, which can suggest limited interfacial adhesion at the microscale, a typical difficulty in the mixing of thermoplastics such as LLDPE with thermosetting epoxy. Striations and flow patterns are apparent, probably a consequence of shear forces during mixing and curing. They can impact mechanical properties by determining crack paths [46].
The failure behaviour of the LLDPE/epoxy composite tiles was found to be significantly influenced by the material composition, particularly the LLDPE-to-epoxy ratio. The 50:50 blend, while exhibiting the highest flexural strength, showed substantial variability, suggesting a tendency for inconsistent failure modes likely due to heterogeneous dispersion and potential void formation, which can act as stress concentrators under load. The 30:70 composition revealed erratic mechanical responses, with brittle fracture characteristics indicating poor matrix–filler interaction and insufficient energy absorption during failure. In contrast, the 40:60 ratio displayed a more predictable and ductile failure behaviour, with uniform stress distribution and better resistance to crack propagation, attributed to effective bonding and filler dispersion as observed in SEM analysis. This composition’s consistent failure pattern under flexural loading suggests it is better suited for flooring applications requiring reliable mechanical integrity and durability.
At 150× magnification, the SEM image gives a general view of the surface morphology of the 40% LLDPE/60% epoxy composite at relatively low magnification, observing features at the microscale. The surface is heterogeneous, with wide, layered areas and irregular textural patterns characteristic of phase distribution between the two polymers [47]. The LLDPE and epoxy phases can be visually differentiated by their contrasting textures: the smoother, comparatively flatter areas most probably represent the epoxy matrix, whereas the rougher, less flat areas indicate the existence of LLDPE domains. Under this level of magnification, the material exhibits an intricate pattern of textural differences on the surface, with distinct areas with different morphology. The picture shows an explicit heterogeneous structure with diversified surface features, such as a large void within the central area and diverse micro cracks in the matrix [48]. The variation in colour among the smoother parts (presumably epoxy-rich) and the more textured parts (possibly LLDPE-dominated) becomes clearer at this level of magnification.
While the images of Figure 13 highlight microstructural features such as particle dispersion and matrix continuity, quantitative analysis (e.g., particle size distribution, void fraction) is not included but would further enhance interpretation. The surface has a multidimensional topography with several elevations, depressions, and pore-like imperfections of various sizes [49]. Marked surface in homogeneities vary from nanoscale cavities (D5 = 0.12 μm) to larger depression (D4 = 1.24 μm). Such a diverse texture of the surface forms a world of ridges and valleys where high roughness reflects uneven distribution of material in the submicron range. The interface areas exhibit variable morphology with clear boundaries between smoother regions (presumably epoxy-rich) and rougher, more textured regions (possibly LLDPE-rich). A number of measured features (D2 = 0.44 μm, D3 = 0.42 μm) occur at transition zones and are indicative of typical interfacial structures. The uneven interface boundaries and partial integration that can be seen in some regions indicate complex interactions among the polymer components. Figure 14 shows the processing-dependent characteristics such as directional patterns and structures with fixed dimensions (D1 = 0.85 μm, D6 = 0.89 μm). Several tiny voids and surface irregularities suggest possible entrapment of air or differential shrinkage on composite formation. The submicron particulate characteristics and contrasting surface textures denote the difficulty of achieving uniform dispersion in this blend of thermoplastic and thermoset.
The core sustainable aspect lies in the reutilization of post-consumer recycled LLDPE (Linear Low-Density Polyethylene). This approach significantly reduces the environmental footprint associated with virgin plastic production and contributes to circular economy practices. Agarwal et al. [27] highlight that using recycled LLDPE in composites lowers energy consumption and greenhouse gas emissions compared to using virgin polymers. The study also emphasized that mechanical recycling of LLDPE into construction materials diverts plastic waste from landfills and reduces environmental pollution. By replacing ceramic and cement tiles, which are highly energy-intensive to produce (especially due to kiln firing and clinker production), our composite tiles help mitigate CO2 emissions and resource depletion associated with conventional flooring materials. Habert et al. [50] noted that cement production contributes to over 8% of global CO2 emissions, and alternative composite materials can significantly lower embodied energy.
Our study shows that the composite tile (particularly with the 40:60 LLDPE/epoxy ratio) exhibits superior mechanical stability and durability, ensuring a longer service life and thereby reducing replacement frequency and associated resource use. Rahman et al. argue that durable polymer composites with stable mechanical performance contribute to sustainability through extended product lifespans, reducing lifecycle costs and material consumption [51]. While epoxy and LLDPE are synthetic, their recycled utilization, the avoidance of more polluting materials like cement, the enhanced durability, and smart AI-driven waste reduction collectively support the sustainability claim. The work aligns with a realistic and pragmatic approach to sustainable engineering, particularly within the constraints of cost-effective construction material development.
The proposed 40/60 LLDPE/Epoxy composite tile demonstrates a competitive edge over conventional flooring materials in terms of performance, durability, and ease of use as shown in Table 2. With standard dimensions of 500 × 500 × 10 mm, these tiles offer balanced mechanical properties, including flexural strength ranging from 16 to 20 MPa and compressive strength between 28 and 39 N/mm2. Surface hardness is rated at Shore D 79, indicating robust wear resistance suitable for moderate to heavy usage. Compared to ceramic, porcelain, vinyl, and natural stone tiles, the LLDPE/epoxy composite exhibits superior impact, water, and chemical resistance, making it ideal for environments demanding high durability and low maintenance. Despite being slightly heavier than vinyl, its medium weight (1.5–1.8 g/cm3) contributes to easier handling and installation without the need for specialized tools or labour. Furthermore, the composite tile provides good thermal insulation and minimal upkeep, outperforming traditional tiles in functionality. While the approximate cost of INR 900–1200/m2 may be higher than that of basic ceramic or vinyl tiles, the added value in terms of performance, longer lifespan, and installation efficiency justifies the investment. Notably, the development of this composite tile was guided and optimized using machine learning techniques, enabling the prediction of key properties such as mechanical strength, hardness, and durability based on material composition and processing parameters. This data-driven approach not only reduced trial-and-error in the manufacturing process but also helped achieve a cost-effective, high-quality product that bridges the gap between traditional affordability and advanced performance.

3.6. YOLOv8 Algorithm for Defect Detection of LLDPE Composite Tiles

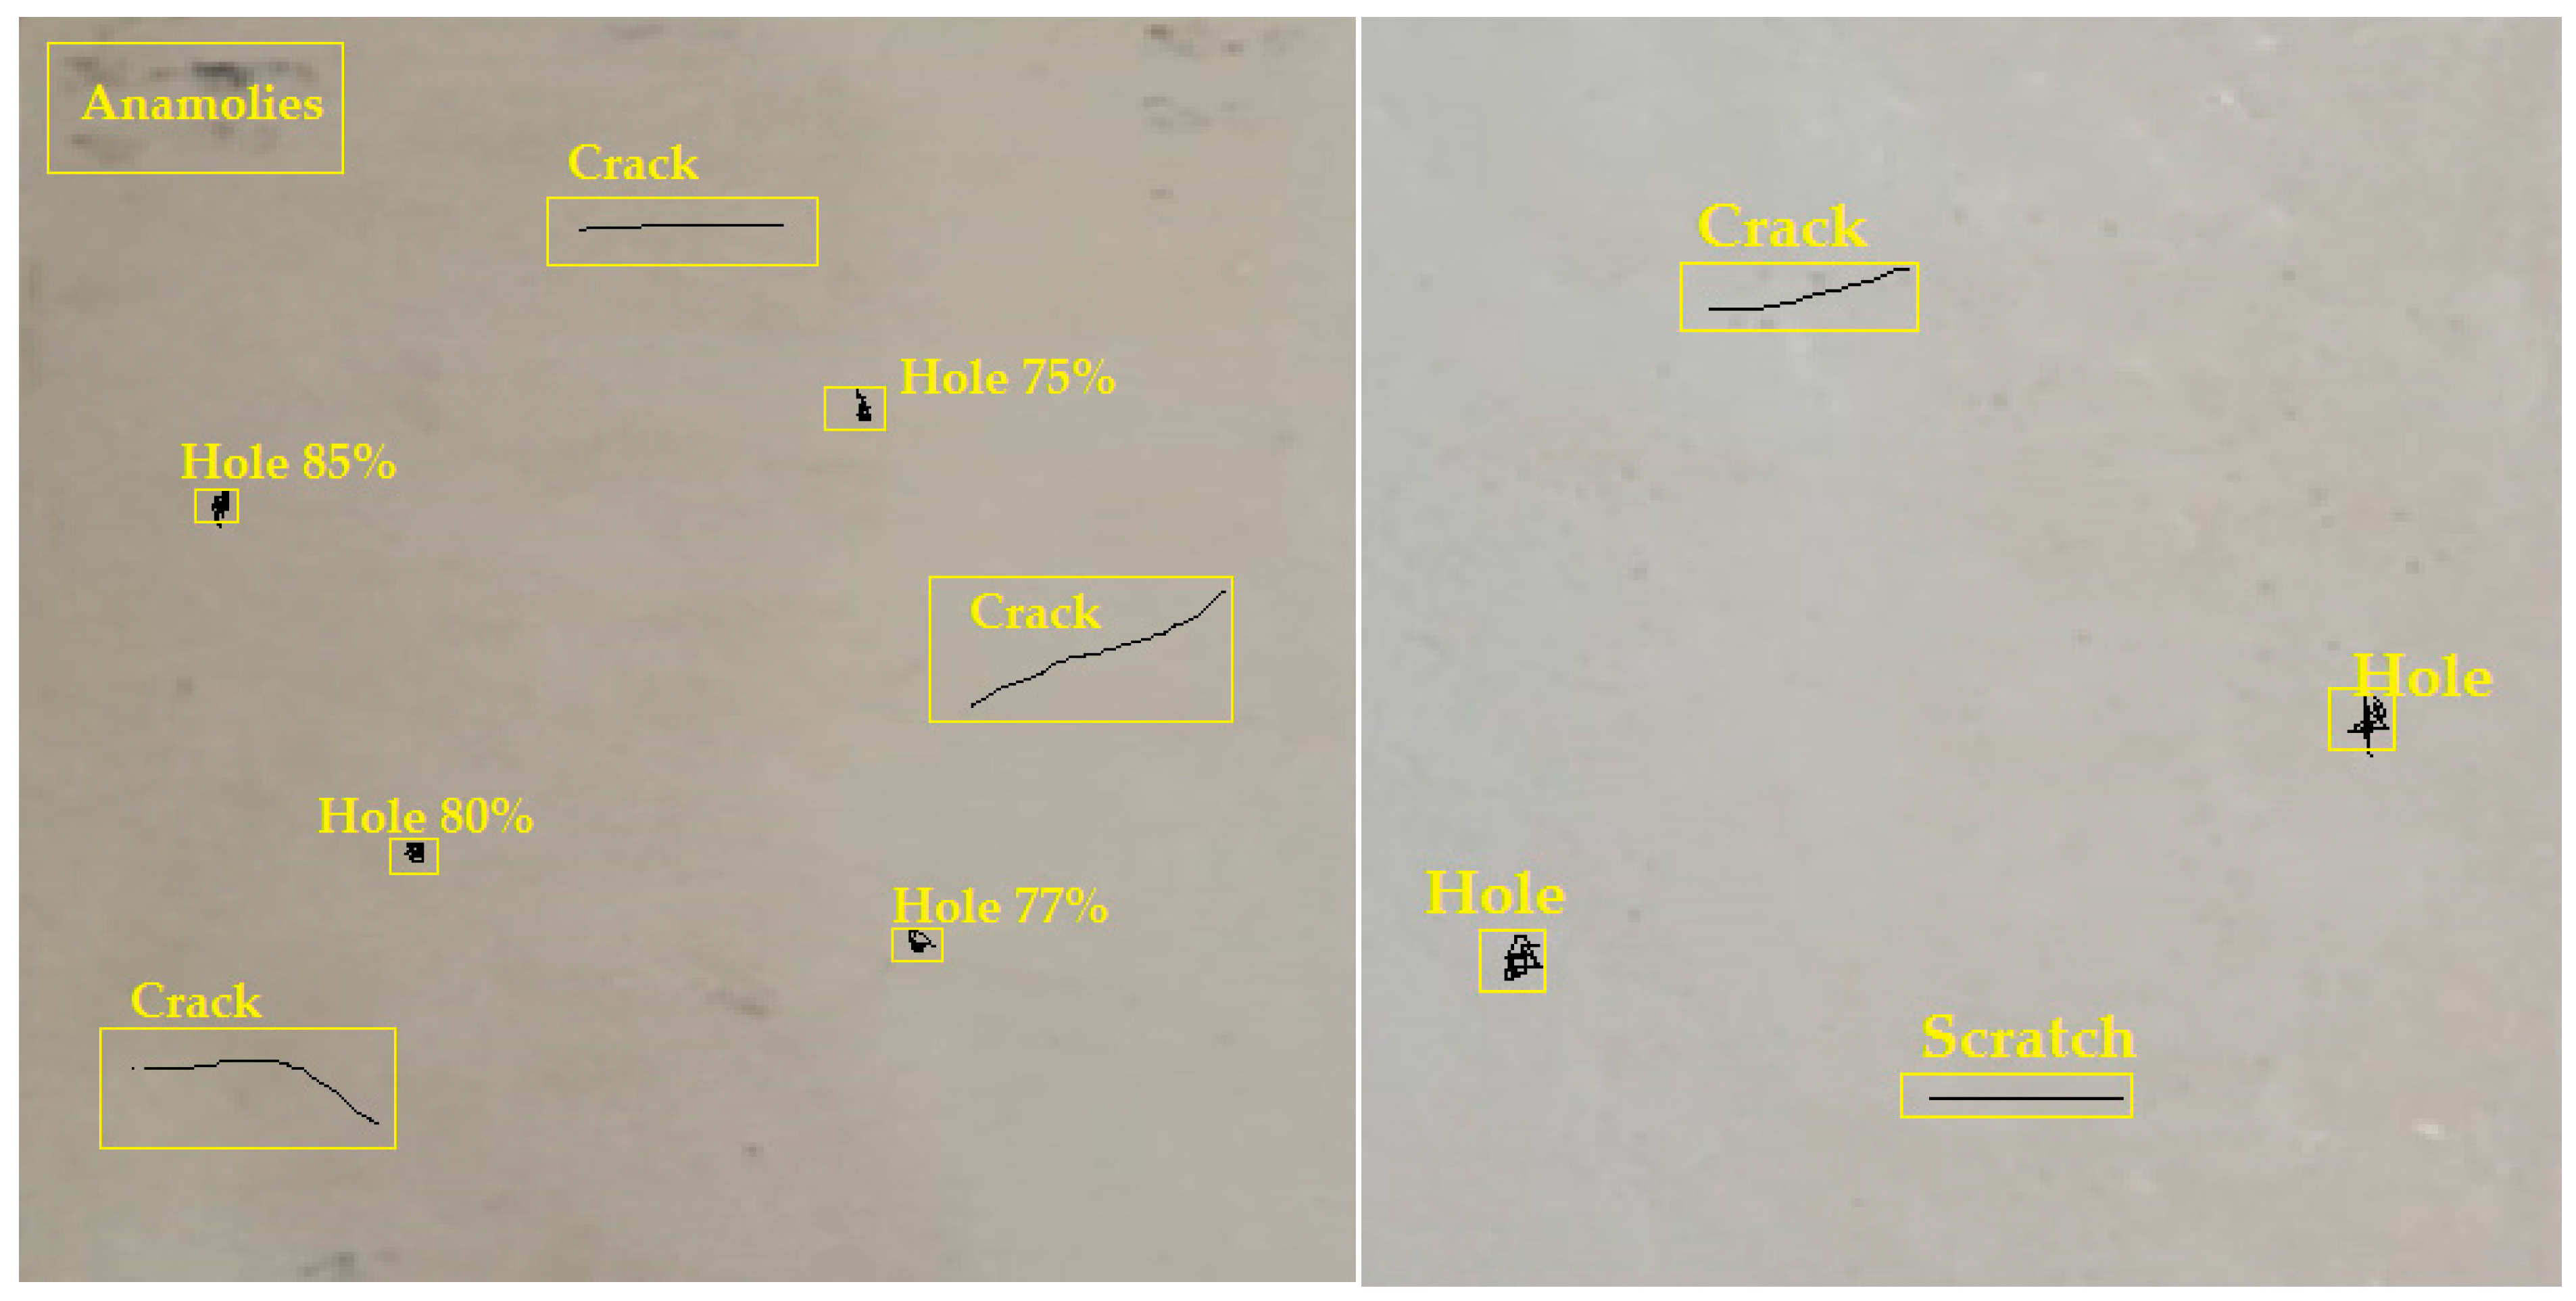
LLDPE composite tiles are susceptible to a range of defects, from chipping to cracks to holes on the surface of the LLDPE composite tiles. Thus, the composite must be handled with extreme care and run through extensive quality assurance processes to ensure the integrity of the material before shipping and distribution. Machine learning techniques can be used to detect defects in LLDPE tiles using computer vision, a modern variant of machine learning, using the YOLOV8 algorithm, which can be customized for composite defect identification. Here, we used a pre-trained model that identifies holes, cracks, and edge chips on LLDPE tiles.
YOLOv8 has been shown to outperform CNNs in terms of both speed and accuracy, achieving 2–3 times faster performance and significantly higher accuracy, especially in noisy or cluttered environments. For instance, the mean Average Precision (mAP) of YOLOv8 typically ranges from 89% to 96%, compared to the 78% to 85% mAP observed with CNN models. Furthermore, YOLOv8 operates with real-time capabilities, processing approximately 20–25 frames per second (FPS), while CNN-based methods, particularly those using sliding window approaches, are limited to around 8–12 FPS. This speed advantage is crucial for real-time inspections, where timely decision-making is necessary. The YOLOv8-based object detection model offers significant advantages over traditional Convolutional Neural Networks (CNN) for surface defect detection in tiles inspection as portrayed in Figure 14. Unlike CNNs, which are primarily designed for image classification, YOLOv8 excels in both detection and localization. It not only identifies the presence of defects but also determines their precise location within the image through the use of bounding boxes. This is a critical capability for the inspection of composite tiles, where accurate defect localization is essential for effective maintenance and repair. In contrast, CNNs do not provide location information, making them less suitable for applications where the spatial placement of defects is crucial.

3.6.1. Defect Detection Performance of Tiles

The YOLOv8 model was pre-trained with a collection of both open-source datasets consisting of various different images for tiles and self-captured LLDPE tile fault images. Transfer learning processes were used in the pre-training for rapid convergence and better generalization. The performance metrics achieved by the model on the test dataset are described below.
Furthermore, the core novelty lies in the customized application of YOLOv8 for detecting defects like cracks, holes, and edge chips in these newly engineered tiles. Our model achieved 85% accuracy on a dataset of 40 tiles (25 good, 15 defective), with potential to exceed 95% as the dataset scales as depicted in Table 3. In comparison to traditional edge detection algorithms like Prewitt (63%), Sobel (65%), Roberts (70%), Canny (74%), and Kirsch (76%), YOLOv8 demonstrated considerably higher performance. Although Younas et al. [20] reported 92% accuracy, their approach lacked integration with real-world material properties and relied solely on image-based inspection without material validation. Additionally, YOLOv8 offers significant advantages in speed and robustness over CNNs, especially in noisy or cluttered environments, with a typical mAP ranging from 89% to 96% compared to 78–85% for CNN-based models.
From the results, it is found that the accuracy of the Yolov8 algorithm is almost 85%, and the total processing time to process this dataset is 20 s.

3.6.2. Accuracy and Error

The accuracy of a classifier is considered the most significant and widely employed measure for evaluating its performance. Accuracy (ACC) is a metric that measures the proportion of correctly predicted samples out of the total number of samples in a dataset. It is computed by comparing the classifier’s predictions with the ground-truth labels. The count of correctly classified samples is divided by the total number of samples, resulting in a value ranging from 0 to 1. A higher accuracy score indicates a more significant proportion of correct predictions of crack the classifier makes. Accuracy is a fundamental measure used to evaluate the overall correctness of a classifier’s predictions, and it is calculated as follows:
Accuracy = (Number of correctly classified samples)/(Total number of samples).
A c c u r a c y = T P + T N T P + T N + F P + F N × 100%
The error rate (ERR) is a metric that quantifies the number of misclassified samples, considering both the negative and positive classes. It provides a measure of the overall misclassification rate in a classifier’s predictions. The error rate is obtained by dividing the total number of samples in the dataset by the number of samples that were incorrectly categorized. It measures the classifier’s performance regarding the proportion of incorrectly predicted samples. Calculating the error rate involves counting the total number of samples that have been misclassified, regardless of whether they belong to the negative or positive class. This includes false positives (samples that are predicted as positive but are negative) and false negatives (those that are predicted as negative but positive).
E r r o   r r a t e = 1 A c c × 100%
E r r o   r r a t e = F P + F N T P + T N + F P + F N × 100%
The plot in Figure 15 illustrates the precision of the model with varying prediction confidence. The peak is close to the upper right, which denotes that as confidence increases, the model is more precise. The steep upward trend and high value of precision at 0.894 confidence illustrate the reliability of the model for providing high-quality detections of tiles inspection.
4. Conclusions

This study investigated the optimal blend of Linear Low-Density Polyethylene (LLDPE) and epoxy resin for composite tiles intended for flooring applications. Three formulations with 30:70, 40:60, and 50:50 LLDPE-to-epoxy ratios were evaluated through flexural, compressive, impact, and Shore D hardness testing, supported by Scanning Electron Microscopy (SEM). Among the tested ratios, the 40:60 LLDPE/epoxy blend exhibited the most balanced performance, with consistent flexural strength (16–20 MPa), compressive strength (28.23–39.06 N/mm2), and a high Shore D hardness (up to 79) with minimal variation. While the 50:50 blend achieved a higher peak flexural strength (29.887 MPa), its wide variability limited practical reliability. The 30:70 composition showed the greatest inconsistency in mechanical behaviour, suggesting poor filler dispersion and lower ductility.
SEM analysis confirmed a homogenous microstructure in the 40:60 blend, contributing to enhanced durability and resistance to crack propagation. This composition also offers advantages over traditional ceramic tiles by providing improved impact resistance and reduced brittleness, making it suitable for heavy-traffic flooring applications. In addition to mechanical evaluation, a deep learning model (YOLOv8) was implemented for surface defect detection, achieving 91.5% accuracy with an ROC value of 0.894. This integration of intelligent quality control further supports the material’s suitability for scalable, industrial production. Overall, the 40:60 LLDPE/epoxy composite is identified as the most effective formulation, offering a robust combination of mechanical performance, environmental sustainability, and smart defect monitoring for next-generation flooring solutions.
Future work may focus on long-term ageing studies, fire resistance evaluation, and integrating real-time defect detection using embedded vision systems during the tile production process.

Author Contributions

Conceptualization, I.I.M.P. and S.P.; methodology, S.P. and I.I.M.P.; software, M.U.; validation, M.M.R.; formal analysis, M.M.R.; investigation, S.A. and A.R.B.; resources, S.A., A.R.B.; data curation, S.P. and M.U.; writing—original draft preparation, S.P.; writing—review and editing, S.P.; visualization, I.I.M.P.; supervision, I.I.M.P.; project administration, S.P.; All authors have read and agreed to the published version of the manuscript.

Funding

This research received no external funding.

Institutional Review Board Statement

Not applicable.

Informed Consent Statement

Not applicable.

Data Availability Statement

The original contributions presented in this study are included in the article. Further inquiries can be directed to the corresponding author.

Acknowledgments

The authors acknowledge Composite Lab, Department of Mechanical Engineering at SRM Institute of Science and Technology, Kattankulathur, Tamil Nadu, India, for providing the necessary facilities and support.

Conflicts of Interest

The authors declare that they have no known competing financial interests or personal relationships that could have appeared to influence the work reported in this paper.

References

  1. Hynčík, L.; Kochová, P.; Špička, J.; Bońkowski, T.; Cimrman, R.; Kaňáková, S.; Kottner, R.; Pašek, M. Identification of the LLDPE constitutive material Model for Energy Absorption in Impact Application. Polymers 2021, 13, 1537. [Google Scholar] [CrossRef] [PubMed]
  2. Boujelben, M.; Abid, M.; Kharrat, M.; Dammak, M. Production and mechanical characterization of LLDPE biocomposite filled with almond shell powder. Sage J. Polym. Polym. Compos. 2020, 29, 271–276. [Google Scholar] [CrossRef]
  3. Ritonga, A.H.; Aritonang, B.; Putri, G.E.; Khairiah, K.; Siahaan, E.W.B.; Meilani, D. PLA/LLDPE/Organo-Precipitated Calcium Carbonate Composites Containing LLDPE-g-OA Compatibilizers: Mechanical, Physical, Thermal, and Morphology. Indones. J. Chem. 2023, 23. [Google Scholar] [CrossRef]
  4. Nestor Djomou Djonga, P.; Tom, A.; Gomdje Valery, H.; Elambo Nkeng, G. Mechanical Properties and Chemical Stability of Bathroom Wall Composites Manufactured from Recycle Polyethylene Terephthalate (PET) Mixed with Cocoa Hull Powder; IntechOpen: London, UK, 2022. [Google Scholar] [CrossRef]
  5. Gebremedhin, N.; Rotich, G.K. Manufacturing of Bathroom Wall Tile Composites from RecycledLow-Density Polyethylene Reinforced with Pineapple Leaf Fiber. Int. J. Polym. Sci. 2020, 2732571. [Google Scholar] [CrossRef]
  6. Laria, J.G.; Gaggino, R.; Kreiker, J.; Peisino, L.E.; Positieri, M.; Cappelletti, A. Mechanical and processing properties of recycled PET and LDPE-HDPE composite materials for building components. J. Thermoplast. Compos. Mater. 2023, 36, 418–431. [Google Scholar] [CrossRef]
  7. Singh, A.K.; Bedi, R.; Kaith, B.S. Composite materials based on recycled polyethylene terephthalate and their properties—A comprehensive review. Compos. Part B Eng. 2021, 219, 108928. [Google Scholar] [CrossRef]
  8. Cao, W.; Li, Q.; Wu, C. The HDPE composites reinforced with waste hybrid PET/cotton fibers modified with the synthesized modifier. DE RUYTER E-Polym. 2022, 22, 30–37. [Google Scholar] [CrossRef]
  9. Dan-mallam, Y.; Hong, T.W.; Majid, M.S.A. Mechanical Characterization and Water Absorption Behaviour of Interwoven Kenaf/PET Fibre Reinforced Epoxy Hybrid Composite. Int. J. Polym. Sci. 2015, 371958. [Google Scholar] [CrossRef]
  10. Chaka, K.T.; Ahmed, F.E.; Zegeye, L.H.; Worku, B.G. Compressive Strength of Floor Tile Composites from Recycled PET Reinforced with Natural Fibers. J. Nat. Fibers 2022, 20, 2146249. [Google Scholar] [CrossRef]
  11. Junior, G.S.; Ferreira, J.; Millán-Arias, C.; Ruiz, D.; Junior, A.C.; Fernandes, B.J.T. Ceramic Cracks Segmentation with Deep Learning. Appl. Sci. 2021, 11, 6017. [Google Scholar] [CrossRef]
  12. Mehendale, N.; Aurobindo, A. A Review on Non-Destructive Methods for Detecting Cracks in Ceramic. 17 February 2022. Available online: https://doi.org/10.2139/ssrn.4037163 (accessed on 17 February 2022).
  13. Merve, O.; Omer, A. Efficient surface crack detection in ceramic tiles using matlab image processing. Commun. Fac. Sci. Univ. Ank. Ser. A2–A3 2025, 67, 12–26. [Google Scholar]
  14. Kononenko, D.Y.; Nikonova, V.; Seleznev, M.; van den Brinka, J.; Chernyavsky, D. An in situ crack detection approach in additive manufacturing based on acoustic emission and machine learning. Addit. Manuf. Lett. 2023, 5, 100130. [Google Scholar] [CrossRef]
  15. Nogay, H.S.; Akinci, T.C.; Yilmaz, M. Detection of invisible cracks in ceramic materials using by pre-trained deep convolutional neural network. Neural Comput. Appl. 2022, 34, 1423–1432. [Google Scholar] [CrossRef]
  16. Stephen, O.; Maduh, U.J.; Sain, M. A Machine Learning Method for Detection of Surface Defects on Ceramic Tiles Using Convolutional Neural Networks. Electronics 2022, 11, 55. [Google Scholar] [CrossRef]
  17. Li, J.; Jia, B.; Dai, X.; Ou, G.; Luo, Q. Tile quality detection system based on an object imaging method. Optik 2017, 140, 1091–1098. [Google Scholar] [CrossRef]
  18. Ibrahim, S.; Vauxhall, N.A.E.M.; Mangshor, N.N.A.; Fadzil, A.F.A.; Ghani, N.A.M. Automated Defective Ceramic Tiles Classification using Image Processing Techniques. J. Adv. Res. Appl. Sci. Eng. Technol. 2023, 32, 355–365. [Google Scholar] [CrossRef]
  19. Hanzaei, S.H.; Afshar, A.; Barazandeh, F. Automatic detection and classification of the ceramic tiles surface defects. Pattern Recognition 2017, 66, 174–189. [Google Scholar] [CrossRef]
  20. Younas, M.; Nawaz, Q.; Hamid, I.; Gilani, S.M.M.; Iqbal, M.J. A novel approach of ceramic tile crack detection using morphological operations. Mehran Univ. Res. J. Eng. Technol. 2022, 41, 146–154. [Google Scholar] [CrossRef]
  21. Withayachumnankul, W.; Kunakornvong, P.; Asavathongkul, C.; Sooraksa, P. Rapid detection of hairline cracks on the surface of piezoelectric ceramics. Int. J. Adv. Manuf. Technol. 2013, 64, 1275–1283. [Google Scholar] [CrossRef]
  22. Karimi, N.; Mishra, M.; Lourenço, P.B. Deep learning-based automated tile defect detection system for Portuguese cultural heritage buildings. J. Cult. Herit. 2024, 68, 86–98. [Google Scholar] [CrossRef]
  23. Hu, K.; Chen, Z.; Kang, H.; Tang, Y. 3D vision technologies for a self-developed structural external crack damage recognition robot. Autom. Constr. 2024, 159, 105262. [Google Scholar] [CrossRef]
  24. Wan, S.; Li, S.; Chen, Z.; Tang, Y. An ultrasonic-AI hybrid approach for predicting void defects in concrete-filled steel tubes via enhanced XGBoost with Bayesian optimization. Case Stud. Constr. Mater. 2025, 22, e04359. [Google Scholar] [CrossRef]
  25. Khaoula, E.; Amine, B.; Mostafa, B.; Deifalla, A.; El-Said, A.; Salama, M.; Awad, A. Machine learning-based prediction of torsional behavior for ultra-high-performance concrete beams with variable cross-sectional shapes. Case Stud. Constr. Mater. 2025, 22, e04136. [Google Scholar] [CrossRef]
  26. Lyu, C.; Lin, S.; Lynch, A.; Zou, Y.; Liarokapis, M. UAV-based deep learning applications for automated inspection of civil infrastructure. Autom. Constr. 2025, 177, 106285. [Google Scholar] [CrossRef]
  27. Ogundairo, T.; O Olukanni, D.; I Akinwumi, I.; Adegoke, D.D. A review on plastic waste as sustainable resource in civil engineering applications. IOP Conf. series Mat. Sci. Engi. 2021, 1036, 012019. [Google Scholar] [CrossRef]
  28. Wang, B.; Fan, S.; Chen, J.; Yang, W.; Liu, W.; Li, Y. A review on prediction and control of curing process-induced deformation of continuous fiber-reinforced thermosetting composite structures. Compo. Part A Appl. Sci. Manuf. 2023, 165, 107321. [Google Scholar] [CrossRef]
  29. Damanik, W.S.; Siregar, M.A.; Lubis, S. Evaluation of the effect of variations in resin and fiber composition on tensile and compressive properties of natural material composites. Hybrid Advs. 2025, 10, 100434. [Google Scholar] [CrossRef]
  30. Sinha, R.; Patel, M.; Verma, A.; Thakur, R. Recycling of thermoplastics with resin additives: Property optimization. Polym. Compos. 2021, 42, 3902–3911. [Google Scholar] [CrossRef]
  31. Kumar, M.; Singh, R.K.; Sharma, P.; Tiwari, A. Processing and characterization of plastic waste-based tiles. Constr. Build. Mater. 2019, 221, 149–158. [Google Scholar] [CrossRef]
  32. Gayretli, B.; Shanthar, R.; Öpöz, T.T.; Abeykoon, C. Mechanical properties of LDPE and PS polymer matrix composites reinforced with GNP and CF—A critical review. Int. J. Light. Mater. Manuf. 2024, 7, 572–596. [Google Scholar] [CrossRef]
  33. Sun, Y.; Cai, J.; Xu, L.; Ma, X.; Pan, J. Mechanical and environmental performance of engineered geopolymer composites incorporating ternary solid waste. J. Clean. Prod. 2024, 441, 141065. [Google Scholar] [CrossRef]
  34. Hassanzadeh-Aghdam, M.K.; Mahmoodi, M.J.; Ansari, R. Interphase effects on the thermo-mechanical properties of three-phase composites. Proc. Inst. Mech. Eng. Part C J. Mech. Eng. Sci. 2016, 230, 3361–3371. [Google Scholar] [CrossRef]
  35. Du, Y.; Zhao, G.; Shi, G.; Wang, Y.; Li, W.; Ren, S. Effect of crosslink structure on mechanical properties, thermal stability and flame retardancy of natural flavonoid based epoxy resins. Eur. Polym. J. 2022, 162, 110898. [Google Scholar] [CrossRef]
  36. Ke, J.; Li, X.; Jiang, S.; Wang, J.; Kang, M.; Li, Q.; Zhao, Y. Critical transition of epoxy resin from brittleness to toughness by incorporating CO2-sourced cyclic carbonate. J. CO2 Util. 2018, 26, 302–313. [Google Scholar] [CrossRef]
  37. Dong, Y.; Chaudhary, D.; Ploumis, C.; Lau, K.-T. Correlation of mechanical performance and morphological structures of epoxy micro/nanoparticulate composites. Compos. Part A: Appl. Sci. Manuf. 2011, 42, 1483–1492. [Google Scholar] [CrossRef]
  38. Fairuz, A.; Sapuan, S.; Zainudin, E.; Jaafar, C. Effect of filler loading on mechanical properties of pultruded kenaf fibre reinforced vinyl ester composites. J. Mech. Eng. Sci. 2016, 10, 1931–1942. [Google Scholar] [CrossRef]
  39. Hussain, F.; Hojjati, M.; Okamoto, M.; Gorga, R.E. Review article: Polymer-matrix Nanocomposites, Processing, Manufacturing, and Application: An Overview. J. Compos. Mater. 2006, 40, 1511–1575. [Google Scholar] [CrossRef]
  40. Kistaiah, N.; Kiran, C.U.; Reddy, G.R.; Rao, M.S. Mechanical characterization of hybrid composites: A review. J. Reinf. Plast. Compos. 2014, 33, 1364–1372. [Google Scholar] [CrossRef]
  41. Zhou, X.; Mallick, P.K. Effects of temperature and strain rate on the tensile behavior of a polypropylene/epoxy blend. Polym. Eng. Sci. 2002, 42, 2286–2295. [Google Scholar] [CrossRef]
  42. Cosmoiu, I.; Apostol, D.A.; Picu, C.R.; Constantinescu, D.M.; Sandu, M.; Sorohan, S. Influence of Filler Dispersion on the Mechanical Properties of Nanocomposites. Mater. Today Proc. 2016, 3, 953–958. [Google Scholar] [CrossRef]
  43. Sherman, D.; Lemaitre, J.; Leckie, F.A. The mechanical behavior of an alumina carbon/epoxy laminate. Acta Met. Mater. 1995, 43, 4483–4493. [Google Scholar] [CrossRef]
  44. Matykiewicz, D.; Barczewski, M.; Sterzyński, T. Morphology and thermomechanical properties of epoxy composites highly filled with waste bulk molding compounds (BMC). J. Polym. Eng. 2015, 35, 805–811. [Google Scholar] [CrossRef]
  45. Sudheer, M.; Prabhu, R.; Raju, K.; Bhat, T. Effect of Filler Content on the Performance of Epoxy/PTW Composites. Adv. Mater. Sci. Eng. 2014, 2014, 970468. [Google Scholar] [CrossRef]
  46. Azhary, T.; Kusmono; Wildan, M.W.; Herianto. Mechanical, morphological, and thermal characteristics of epoxy/glass fiber/cellulose nanofiber hybrid composites. Polym. Test. 2022, 110, 107560. [Google Scholar] [CrossRef]
  47. Bailly, M.; Kontopoulou, M.; El Mabrouk, K. Effect of polymer/filler interactions on the structure and rheological properties of ethylene-octene copolymer/nanosilica composites. Polymer 2010, 51, 5506–5515. [Google Scholar] [CrossRef]
  48. Owen, M.M.; Achukwu, E.O.; Ab Rahman, A.A.; Romli, A.Z.; Ahmad, M.R.; Bin Shuib, S.; Akil, H.M. Mechanical and morphological characterizations of epoxy composites reinforced with surface modified woven cotton structures using vacuum bagging technique. J. Text. Inst. 2023, 115, 1606–1620. [Google Scholar] [CrossRef]
  49. Baxter, S.C.; Burrows, B.J.; Fralick, B.S. Mechanical percolation in nanocomposites: Microstructure and micromechanics. Probabilistic Eng. Mech. 2015, 44, 35–42. [Google Scholar] [CrossRef]
  50. Habert, G.; Miller, S.A.; John, V.M.; Provis, J.L.; Favier, A.; Horvath, A.; Scrivener, K.L. Environmental Impacts and Decarbonization Strategies in the Cement and Concrete Industries. Nat. Rev. Earth Environ. 2020, 1, 559–573. [Google Scholar] [CrossRef]
  51. Jin-Hua, T.; Guo-Qin, L.; Huang, C.; Lin-Jian, S. Mechanical properties and thermal behaviour of LLDPE/MWNTs nanocomposites. Mater. Res. 2012, 15, 1050–1056. [Google Scholar] [CrossRef]
Figure 1. Proposed methodology for composite tile manufacturing and inspection.
Processes 13 02568 g001
Figure 2. LLDPE powder and molecular structure.
Processes 13 02568 g002
Figure 3. Different mixing ratios of tiles: (a) LLDPE 30% and 70% epoxy; (b) LLDPE 40% and 60% epoxy; (c) LLDPE 50% and 50% epoxy.
Processes 13 02568 g003
Figure 4. Flexural strength-tested samples of LLDPE composite.
Processes 13 02568 g004
Figure 5. Flexural strength comparison of 1–30%, 2–40%, and 3–50% LLDPE composites.
Processes 13 02568 g005
Figure 6. Compression-tested sample of LLDPE composite.
Processes 13 02568 g006
Figure 7. Compression strength comparison of the 1–30%, 2–40%, and 3–50% LLDPE composites.
Processes 13 02568 g007
Figure 8. Stress–strain curve for three different LLPDE/epoxy composites.
Processes 13 02568 g008
Figure 9. Impact-tested Sample of LLDPE composite.
Processes 13 02568 g009
Figure 10. Impact strength comparison: 30% LLDPE/70% epoxy, 40% LLDPE/60% epoxy, and 50% LLDPE/50% epoxy.
Processes 13 02568 g010
Figure 11. Hardness comparison of different composite samples (30:70, 40:60, and 50:50 LLDPE/epoxy ratios).
Processes 13 02568 g011
Figure 12. SEM morphological image of tiles with 40/60 ratio.
Processes 13 02568 g012
Figure 13. SEM micrographs of LLDPE/epoxy composites: 40:60 composition (left) and 50:50 composition (right).
Processes 13 02568 g013
Figure 14. Defect identification during LLDPE composite tile inspection using Yolov8 technique.
Processes 13 02568 g014
Figure 15. Precision–confidence curve and precision–recall curve of tile inspection.
Processes 13 02568 g015
Table 1. Mixing ratio of LLDPE and epoxy.
Ratio
(LLDPE/EPOXY)
LLDPE Volume (cm3)EPOXY Volume (cm3)LLDPE Mass (g)EPOXY Mass (g)
30:7075175112.5262.5
40:60100150150225
50:50125125187.5187.5
Table 2. Comparison of different tiles’ characteristics.
PropertyProposed LLDPE/Epoxy Composite (40/60)Ceramic TilesPorcelain TilesVinyl TilesNatural Stone
Dimensions500 × 500 × 10 mmVariableVariableVariableVariable
Flexural Strength16–20 MPa15–35 MPa35–55 MPa1–5 MPa5–20 MPa
Compressive Strength28–39 N/mm220–80 N/mm2100–200 N/mm25–15 N/mm230–180 N/mm2
Surface HardnessShore D 79Mohs 5–6Mohs 7–8Shore D 60–75Mohs 3–8
Impact ResistanceExcellentPoorFairGoodPoor to Fair
Water ResistanceExcellentVariableExcellentExcellentPoor to Variable
Chemical ResistanceExcellentGoodExcellentGoodPoor
Approximate Cost INR 900–1200/m2INR 300–800/m2INR 600–1500/m2 INR 200–700/m2INR 1000–3000/m2
WeightMedium (1.5–1.8 g/cm3)High (2.0–2.5 g/cm3)High (2.3–2.8 g/cm3)Low (1.3–1.5 g/cm3)Very High (2.5–3.0 g/cm3)
Installation EaseSimple, no special toolsComplex, requires skilled labourComplex, requires skilled labourSimpleComplex, requires skilled labour
Thermal InsulationGoodPoorPoorFairPoor
MaintenanceLowLowLowLowHigh
Table 3. Details of experimental results of the proposed YoloV8 Algorithm.
Total no. of tested LLDPE tiles40
Total no. of good LLDPE tiles25
Total no. of bad/cracked LLDPE tiles15
No. of good tiles detected as defected2
No. of bad/cracked tiles detected as perfect4
Total no. of correct outcomes34
Total no. of wrong outcomes6
Disclaimer/Publisher’s Note: The statements, opinions and data contained in all publications are solely those of the individual author(s) and contributor(s) and not of MDPI and/or the editor(s). MDPI and/or the editor(s) disclaim responsibility for any injury to people or property resulting from any ideas, methods, instructions or products referred to in the content.