Article

Super-Resolution Reconstruction of Part Images Using Adaptive Multi-Scale Object Tracking

School of Mechanical and Automotive Engineering, Guangxi University of Science and Technology, Liuzhou 545006, China
*
Authors to whom correspondence should be addressed.
Processes 2025, 13(8), 2563; https://doi.org/10.3390/pr13082563
Submission received: 4 March 2025 / Revised: 23 March 2025 / Accepted: 25 March 2025 / Published: 14 August 2025
(This article belongs to the Section Manufacturing Processes and Systems)

Abstract

Computer vision-based part surface inspection is widely used for quality evaluation. However, challenges such as low image quality, caused by factors like inadequate acquisition equipment, camera vibrations, and environmental conditions, often lead to reduced detection accuracy. Although super-resolution reconstruction can enhance image quality, existing methods face issues such as limited accuracy, information distortion, and high computational cost. To overcome these challenges, we propose a novel super-resolution reconstruction method for part images that incorporates adaptive multi-scale object tracking. Our approach first adaptively segments the input sequence of part images into blocks of varying scales, improving both reconstruction accuracy and computational efficiency. Optical flow is then applied to estimate the motion parameters between sequence images, followed by the construction of a feature tracking and sampling model to extract detailed features from all images, addressing information distortion caused by pixel misalignment. Finally, a non-linear reconstruction algorithm is employed to generate the high-resolution target image. Experimental results demonstrate that our method achieves superior performance in terms of both quantitative metrics and visual quality, outperforming existing methods. This contributes to a significant improvement in subsequent part detection accuracy and production efficiency.

1. Introduction

During the part manufacturing process, unstable operational procedures lead to a decline in surface quality, resulting in surface defects such as material shortages, scratches, and dents [1]. These defects not only affect the appearance and market value of the parts but may also cause safety incidents during subsequent use. Therefore, part surface defect detection has become a crucial aspect of the product manufacturing process [2]. Currently, part surface defect detection methods mainly include manual inspection and sensor-based detection. Manual inspection is a traditional method where operators visually observe the surface condition of the part to assess the appearance quality of the product [3]. However, this method is easily influenced by subjective factors, has low efficiency, and suffers from poor detection accuracy [4]. To address this issue, researchers have developed intelligent detection methods for identifying surface defects in parts, including techniques such as sensor-based detection and visual inspection. Sensor-based detection involves using smart sensors to collect data on the surface condition of parts, followed by computer analysis to determine the relationship between the acquired signals and surface defects, thereby assessing surface quality [5,6]. Although different types of signals can provide rich characterization information and offer a more comprehensive reflection of defect conditions, signal acquisition requires complex sensors, which not only increases detection costs but also results in lower efficiency. Moreover, the signals collected by sensors represent only an indirect characterization of defects, making it difficult to establish a precise relationship between the signals and specific defect types. Therefore, identifying an intelligent, intuitive, and universally applicable method for surface defect detection has become a key focus for researchers. In recent years, with the development of computer technology, machine vision detection based on image processing has shown significant advantages in industrial part surface defect detection. This method combines the human eye observation from manual inspection with the computer analysis characteristics of sensor detection. Compared to manual inspection, it is more intelligent and accurate; compared to sensor detection, it is more intuitive and has higher detection efficiency, making it widely used in the detection of industrial product surface defects [7,8]. The image processing-based surface defect detection process for parts mainly includes the following steps: image acquisition [9], image preprocessing [10,11], and image recognition [12,13]. However, due to the limitations of the hardware conditions of image acquisition devices and the complexity of the detection environment, the acquired images often have low resolution, resulting in significant differences between the acquired images and the actual part surfaces. This, in turn, affects the accuracy of defect detection and may even cause false detections [14]. Therefore, it is necessary to optimize the image quality before performing part surface defect detection.
To address the above problems, this paper proposes a part image super-resolution reconstruction method based on adaptive multi-scale object tracking. The method first selects the middle frame from the input sequence of part images as the reconstruction frame. By calculating the similarity, statistical properties, and local features of the image information, the method adaptively divides the reconstruction frame image into blocks based on a similarity threshold and the non-local similarity coefficients of image blocks. Then, the Lucas–Kanade (LK) optical flow method is used to estimate the motion parameters of the sequence images, obtaining displacement information between the images. Furthermore, an object tracking algorithm is introduced to construct a multi-frame image feature tracking sampling model. The sub-blocks of the reconstruction frame are sampled, and by combining the motion displacement information estimated by the optical flow method, the other sequence images are registered with the reconstruction frame image, tracking and sampling similar features from all images. Finally, the K-means algorithm is used to cluster the sampled features. A quadtree non-linear reconstruction algorithm is applied to overlay and reconstruct the features of the reconstruction frame image, thereby generating a high-quality target image. The flowchart of the proposed method is shown in Figure 1.
The main contributions of this study are as follows:
(1)
An adaptive image block strategy is proposed, which dynamically adjusts the block scale based on prior information analysis of image blocks. This addresses the limitations of traditional fixed block methods, improving the ability to capture features in detailed areas while optimizing the allocation of computational resources in smooth areas, thereby enhancing image reconstruction accuracy while ensuring efficient computation;
(2)
An improved optical flow method combined with a kernel correlation filter is adopted to achieve feature tracking sampling between sequential images while constructing an efficient feature tracking model that enhances feature similarity matching accuracy. This resolves the issue of image information distortion caused by pixel-level displacement between sequential part images;
(3)
A super-resolution reconstruction algorithm based on multi-frame feature aggregation is proposed. By introducing multi-scale feature fusion technology, it optimizes image edge clarity and texture details while reducing algorithmic complexity, providing a low-cost and efficient image optimization solution for industrial inspection.
The remainder of this manuscript is organized as follows: In Section 2, we present the Literature Review, discussing the most relevant works and methods in the field of part surface defect detection and image super-resolution reconstruction. Section 3 introduces the proposed method, including the details of the adaptive multi-scale object tracking approach for part image super-resolution reconstruction. Section 4 presents the experimental setup and results, including a comparison with existing methods and a detailed analysis of the performance. In Section 5, we discuss the findings, including the limitations of the proposed method and potential areas for future improvement. Finally, Section 6 concludes the study and highlights the contributions made by this research.

2. Literature Review

Part image quality optimization can be achieved through enhancing the hardware performance of image acquisition devices or using software algorithm processing. In terms of improving image quality through hardware performance, researchers [15,16] have proposed using high-resolution camera equipment to capture clear images to ensure the accuracy and reliability of the detection process, thereby optimizing the performance of the detection system. Additionally, Lins et al. [17,18] used the structural similarity index algorithm to calculate image similarity and select images that are similar to high-quality reference images, ensuring image quality during the detection process and achieving higher tool wear detection accuracy. Although improving hardware performance can directly enhance the quality of acquired images, in application scenarios with unstable lighting or complex production environments, the improvement of image quality through hardware performance alone is limited. Furthermore, high-resolution industrial cameras are expensive. For mechanical manufacturing scenarios that require large-scale deployment of visual inspection equipment, the economic cost of improving hardware performance is relatively high [19]. Therefore, to save costs and increase the flexibility of image optimization, using software algorithms for processing has become a more effective approach. Super-resolution reconstruction algorithms can effectively enhance image quality, obtain clear edge information, and improve the accuracy of subsequent image analysis.
Existing image super-resolution reconstruction methods are mainly divided into interpolation-based, reconstruction-based, and learning-based types. Interpolation-based super-resolution methods include bilinear interpolation, neighborhood interpolation, and tricubic interpolation, among others. These methods use known pixels from low-resolution images to compute and infer unknown pixels, achieving high-resolution image reconstruction [20]. However, these methods struggle to recover detailed information in images, often leading to blurred edges and jagged artifacts. To address the limitations of interpolation methods, Zhang et al. [21] proposed a single-frame super-resolution method based on rational fractal interpolation, combining rational interpolation and fractal properties. By calculating the local fractal dimension and adaptively adjusting the scaling factor, they improved the retention of edge and texture details. Building on this, Zhang et al. [22] further improved the method by proposing a super-resolution method based on progressive iterative approximation. By using a non-subsampled contourlet transform, the image was divided into different regions, and different interpolation methods were applied to each region, effectively enhancing edge clarity. However, both of these methods still have shortcomings in adaptive processing. To address this, Song et al. [23] proposed an adaptive interpolation enlargement method based on local fractal analysis. This method divides the image regions using fractal dimension calculation and selects the appropriate interpolation form for different regions. At the same time, it combines parameter optimization and sub-block adaptive selection strategies to further improve the quality of the enlarged image, making the interpolation process more adaptive and flexible, especially excelling in detail retention. In addition, to address the issue of poor reconstruction performance of interpolation methods on complex textured images, Xue et al. [24] proposed a structured sparse low-rank representation model, utilizing the structured sparse characteristics of image multi-channel data to maintain consistency in both spatial and frequency domains, thereby improving the fidelity of image details.
However, interpolation-based super-resolution reconstruction methods can only process single-frame images based on prior information, which, although theoretically capable of enlarging a single low-resolution image, often leads to suboptimal reconstruction accuracy in engineering applications. This is because a single frame contains limited image information, and with no new information to supplement, the reconstruction accuracy is typically not ideal in most cases [25]. In contrast, multi-frame super-resolution methods, by utilizing complementary information and prior knowledge from sequential images, can more effectively retain the image’s detailed features, becoming a key focus of image quality optimization research [26]. Among the reconstruction-based super-resolution methods, common approaches include convex set projection [27], iterative back-projection [28], and maximum a posteriori (MAP) estimation [29]. The convex set projection method projects the image onto a convex set that satisfies specific constraints, gradually obtaining higher-resolution images; the iterative back-projection method simulates the projection values of low-resolution images and compares them with the original image, gradually correcting the reconstructed image; the MAP estimation method combines prior information and observed data to obtain the optimal reconstructed image by maximizing the posterior probability. Although these methods improve the reconstruction effect to some extent, they suffer from performance degradation when the number of images is insufficient or the noise is high. Additionally, they have high computational complexity, which makes them unsuitable for real-time applications. To address these challenges, Zeng et al. [30] proposed a multi-frame super-resolution algorithm based on semi-quadratic estimation and improved bilateral total variation regularization. This method effectively reduces the computational complexity of the convex set projection method through robust estimation of adaptive norms, showing excellent performance in edge preservation. Lu et al. [31] introduced non-local similarity regularization and multi-edge filtering within the MAP framework, significantly improving tolerance to motion estimation errors and overcoming the artifact problem that occurs with iterative back-projection when motion estimation is inaccurate. Li et al. [32] further proposed an adaptive frame selection and multi-frame fusion method, which filters high-quality frames and fuses multiple frames. This method not only optimizes the MAP estimation in long-distance and distorted images but also reduces the impact of atmospheric distortion and noise on reconstruction quality. It enhances the robustness and applicability of the algorithm, making super-resolution reconstruction more efficient and accurate in different scenarios. Most existing multi-frame image super-resolution reconstruction methods are typically applicable to precise sub-pixel-level micro-displacement sequential images [33,34]. However, in part manufacturing environments, due to factors such as slight vibrations of the image acquisition devices, the displacement between the actual acquired sequential part images often exceeds one pixel and can even reach several dozen pixels, which contradicts the small displacement (sub-pixel-level) conditions assumed by most multi-frame super-resolution reconstruction methods [35]. Therefore, insufficient displacement accuracy between sequential images can lead to significant errors between the reconstructed images and the actual data, limiting the practical application of sub-pixel-level displacement methods in part image quality optimization and subsequently affecting the accuracy of surface quality detection of parts. To address these issues, many researchers have focused on improving the image acquisition process, using techniques such as active displacement imaging or high-precision image measurement to obtain sub-pixel-level displacement sequential images. For example, Chen et al. [36] used high-precision motion estimation technology to generate a series of video frames with precise micro-displacement; Cui et al. [37] generated panoramic images with sub-pixel-level displacements through rotational and scale-invariant adjustments; Gui et al. [38] used the large-angle deflection characteristics of a Risley prism to acquire sequential images; Liang et al. [39] achieved precise displacement between sequential images by controlling the variable aperture size. These studies effectively solved the displacement accuracy limitation in practical applications through rotation, motion estimation, optical deflection, and aperture adjustments, significantly improving the accuracy and applicability of super-resolution reconstruction. However, these methods typically face high equipment costs and operational complexity, making them not widely feasible for part surface detection applications.
In recent years, learning-based image super-resolution reconstruction algorithms have become the main focus of research in the super-resolution domain, such as Generative Adversarial Networks (GANs) [40], Multi-class GANs [41], and Multi-scale Convolutional Networks [42]. These methods effectively exploit the intrinsic structural relationships between images to complete the reconstruction process, learning richer high-frequency prior information, which helps solve the problems of insufficient reconstruction accuracy in single-frame image super-resolution methods and information distortion in multi-frame image super-resolution methods. However, these learning-based methods typically require large datasets for training and have enormous computational demands, making it challenging to meet the efficiency requirements for real-time processing [43]. To address this, Fang et al. [44] and Lu et al. [45] proposed different lightweight super-resolution networks that reduce the model’s computational load while improving image reconstruction quality. However, these methods face challenges such as a single-task focus and an imbalance between lightweight design and multi-task capabilities. To overcome these challenges, related researchers have improved these lightweight super-resolution networks using Transformer structures, addressing the shortcomings in task specificity, adaptability, and flexibility, enabling stable model operation in multi-task environments while significantly enhancing image reconstruction performance [46,47,48]. Additionally, Liu et al. [49] proposed a multi-scale residual aggregation network that combines features from different scales to enhance the edge information and detection accuracy of single-frame images while reducing network complexity. Li et al. [50] used dual-dictionary learning techniques to improve single-frame image reconstruction accuracy and reduce computational resource demands, thereby increasing the accuracy of tool wear monitoring. He et al. [51] designed a progressive video super-resolution network that alleviates multi-frame information distortion issues by hierarchical feature extraction, achieving high-precision displacement detection for rotating equipment. While these methods address issues of accuracy and information distortion in both single-frame and multi-frame reconstructions, they still significantly reduce computational load. However, learning-based super-resolution reconstruction methods still do not meet the application requirements for high-efficiency processing of part images.
In summary, how to enhance edge clarity while maintaining the detail features of the reconstructed image and reduce the algorithm’s structural complexity remains a challenging issue in the research on part image quality optimization.

3. Adaptive Multi-Scale Object Tracking-Based Part Image Super-Resolution Reconstruction Method

3.1. Image Adaptive Block Segmentation

Currently, common image partitioning methods mainly include global partitioning methods [52] and fixed block partitioning methods [53]. Although global partitioning methods can fully capture image information, they typically require large memory usage and long computation times, making them less efficient for processing large images. On the other hand, fixed block partitioning methods do not account for the distribution characteristics of image information across different regions, leading to over-segmentation in regions with fewer details and under-segmentation in regions with rich details. This issue reduces the flexibility of partitioning and ultimately impacts the efficiency of image reconstruction. Furthermore, many existing image segmentation methods do not consider varying levels of information across an image, resulting in segmentation outcomes that lack consistency.
To address the limitations of these methods, this paper proposes an adaptive similarity-based block segmentation method. This method compares the non-local similarity coefficients of the image with a set similarity threshold to adaptively select the block size, dividing the reconstruction frame image into blocks of different scales. This segmentation method not only resolves the issue of traditional methods being prone to interference from extreme information but also improves the non-local similarity model, enabling more accurate similarity calculations, which effectively enhances the flexibility and accuracy of feature sampling, laying a solid foundation for subsequent image reconstruction.

3.1.1. Non-Local Similarity Coefficient of Image Blocks

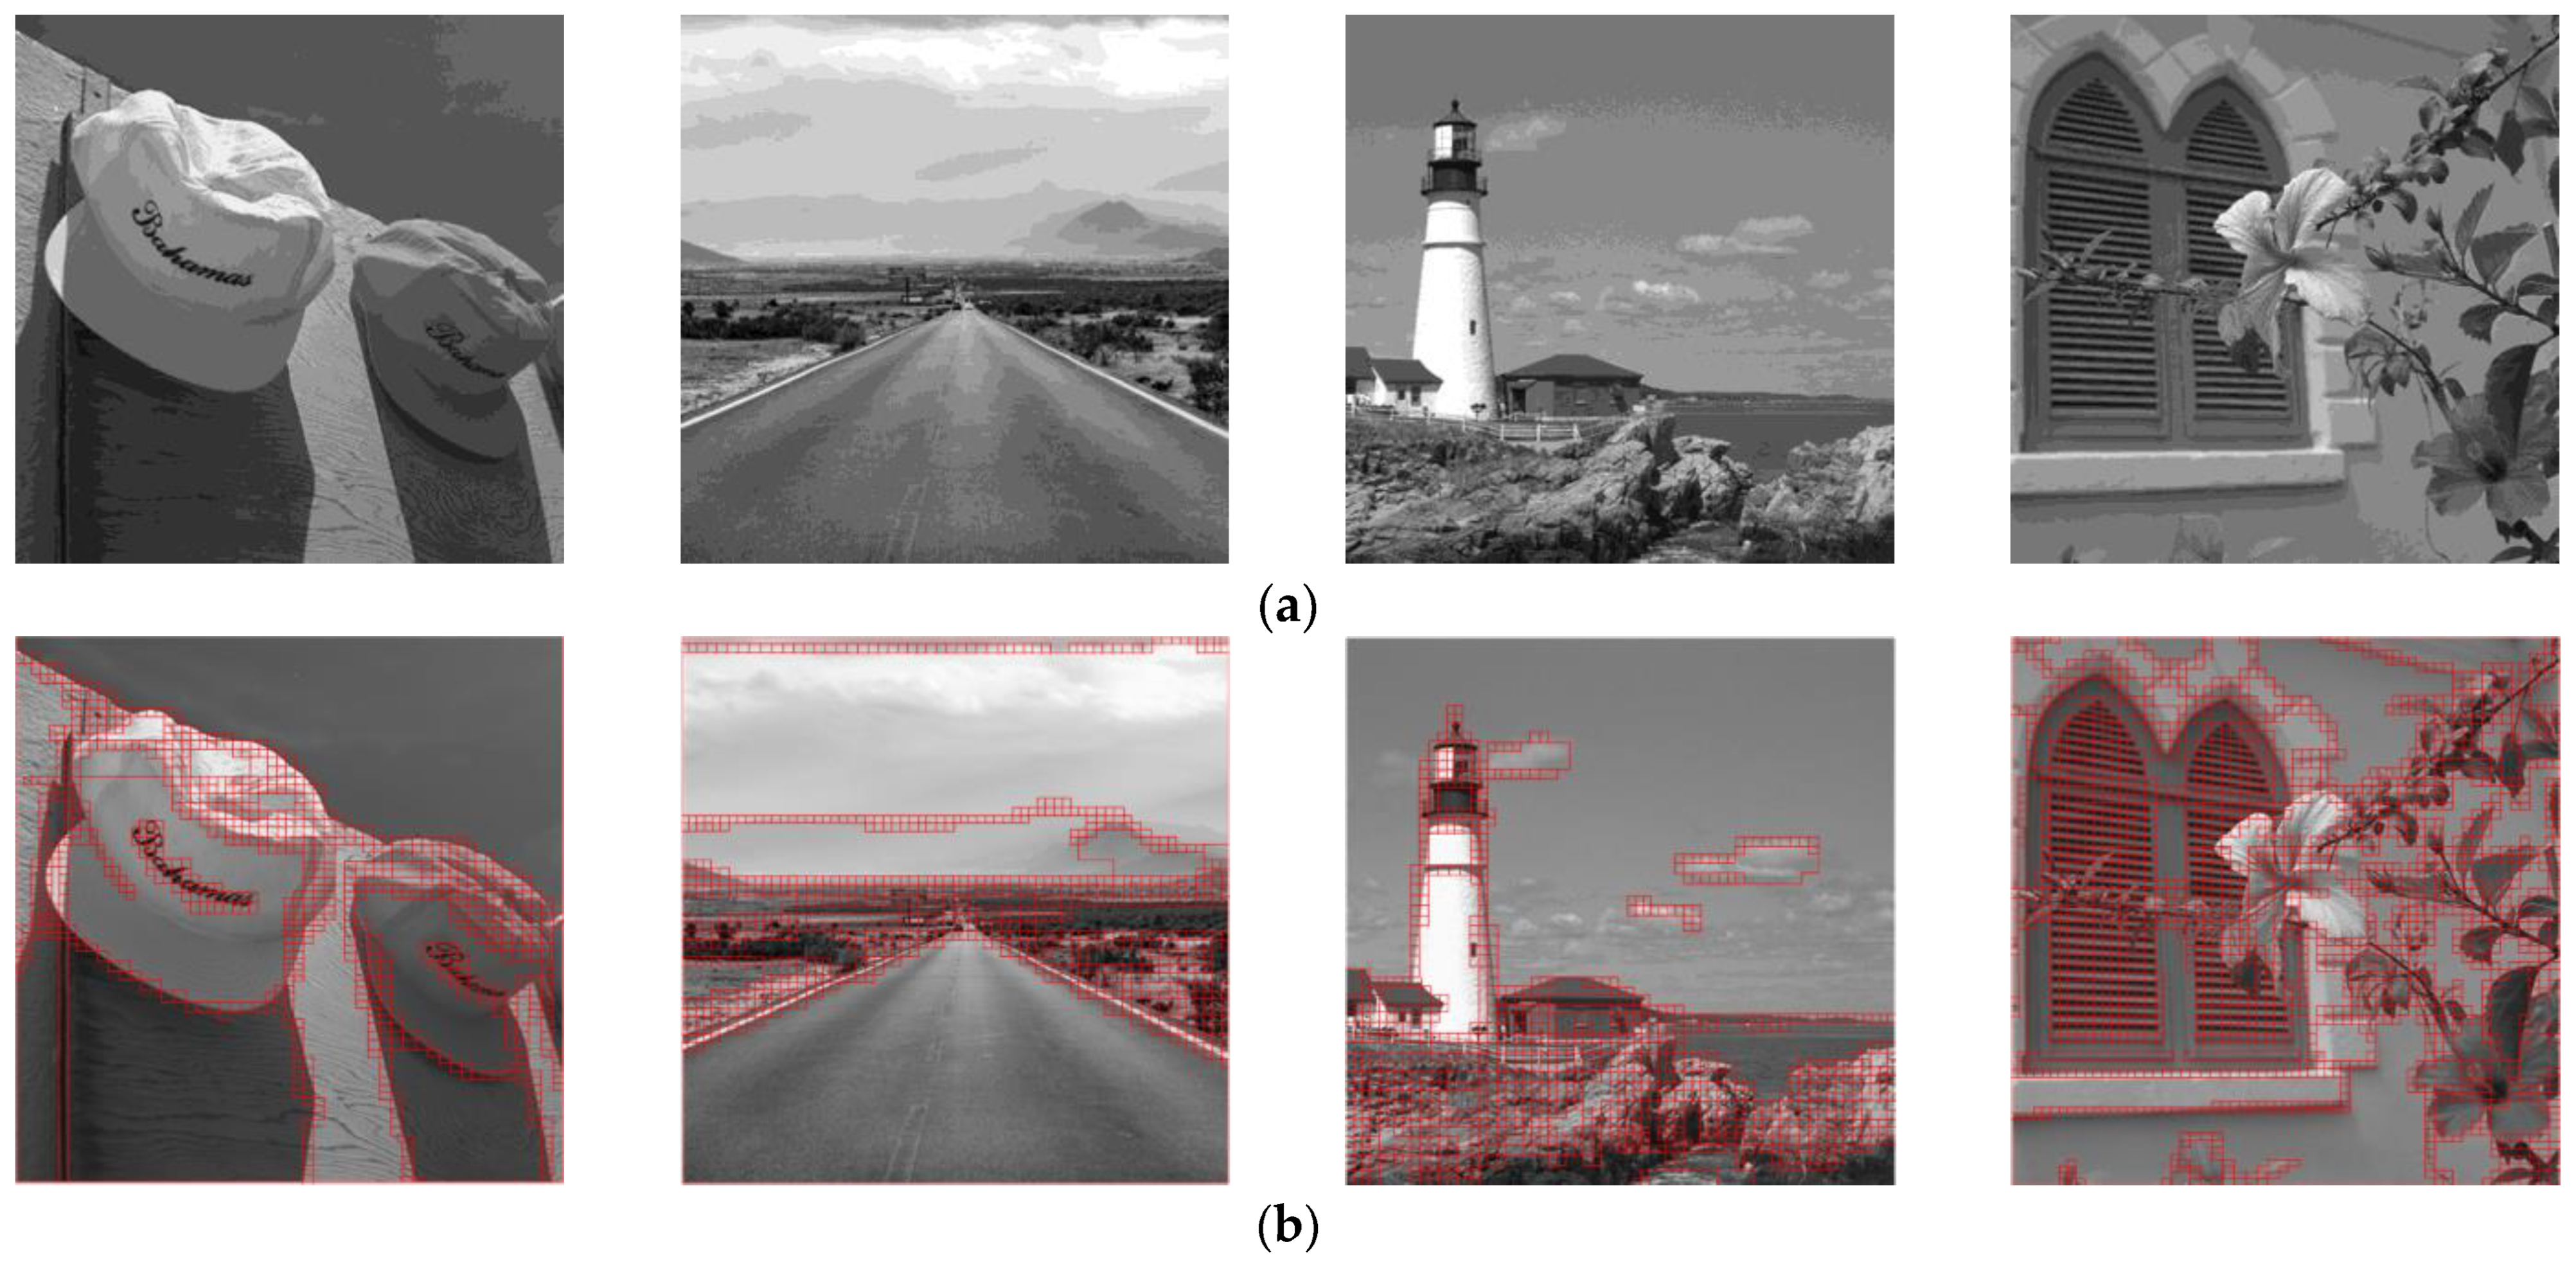
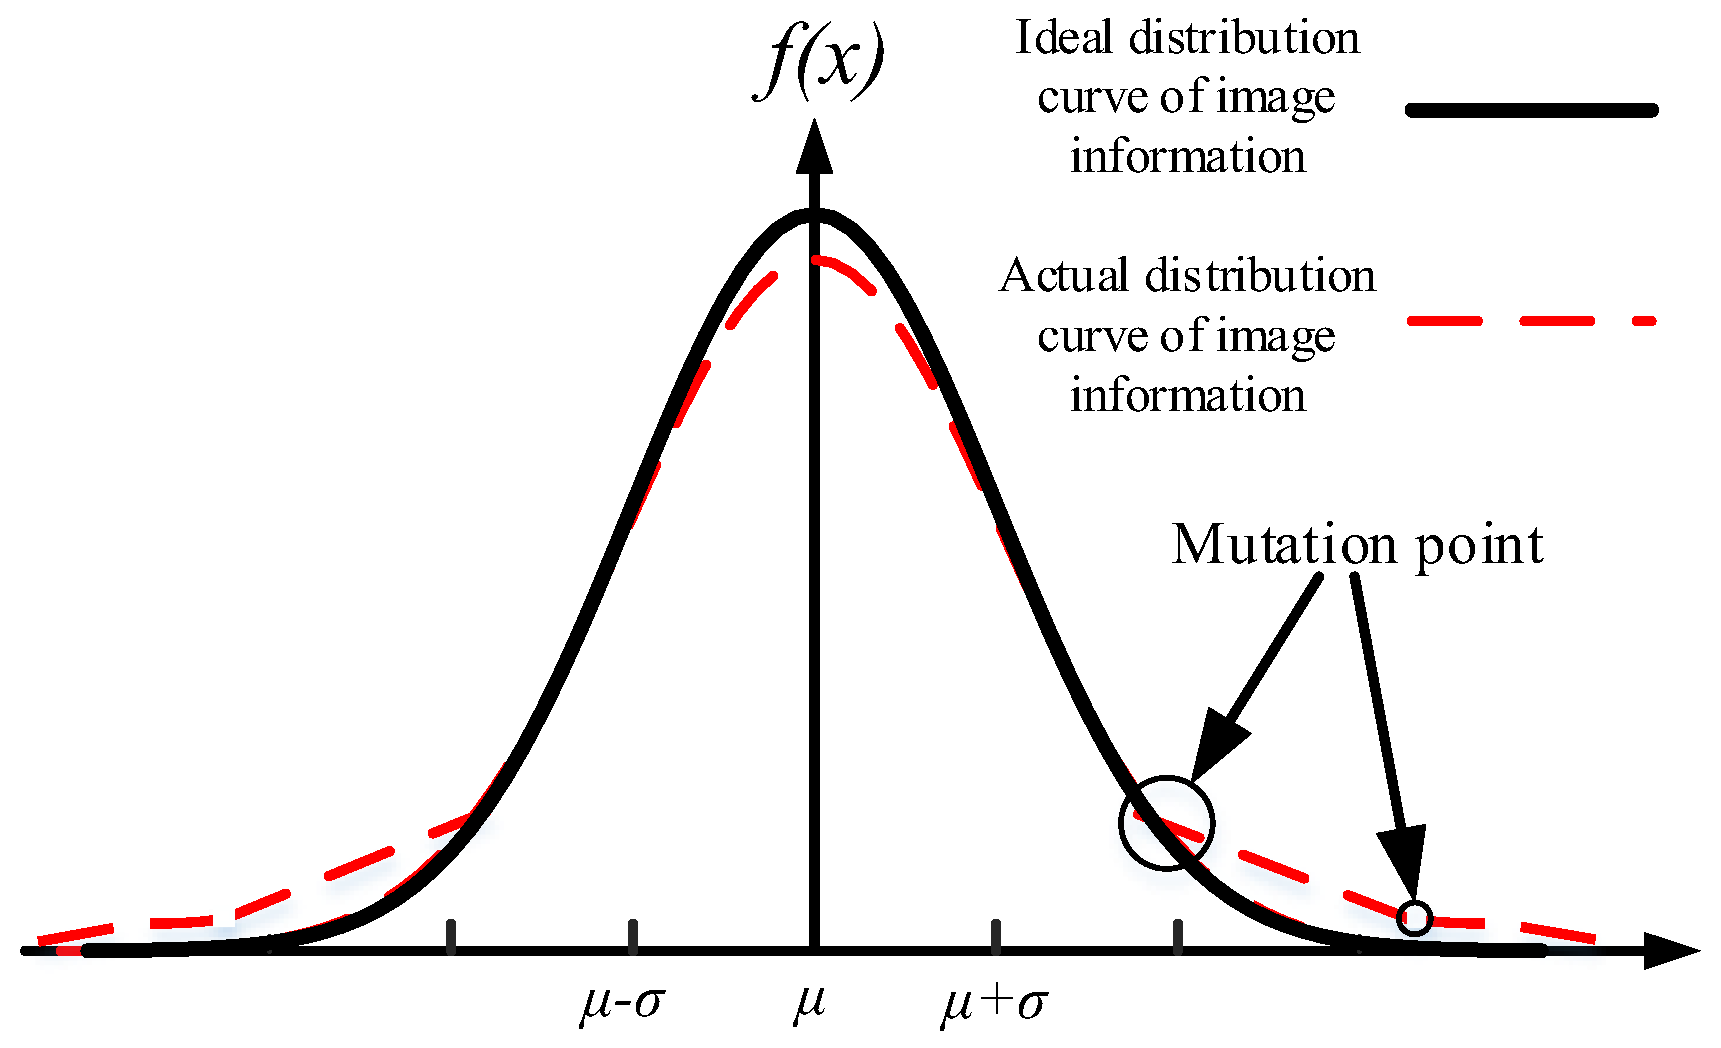
The grayscale difference between image pixels usually reflects the main distribution characteristics of the image information. However, for images containing complex feature information, relying solely on grayscale difference to analyze the distribution of information has low accuracy. Therefore, this paper proposes a non-local similarity coefficient based on image blocks to analyze the trend of grayscale variations in images. Although, in ideal cases, the image information distribution curve approximates a normal distribution [54], due to the interference of extreme information in actual images, the information distribution curve of the image often deviates significantly from the normal distribution curve, and there may be “jumps” between pixel grayscale values, leading to apparent mutations and inflection points in the distribution curve, as shown in Figure 2. To eliminate the influence of these extreme values before segmentation and make the actual image information distribution curve closer to the ideal distribution, this paper introduces a weighted median filtering model for image information processing. This method effectively smooths the image information distribution, reduces noise interference, and provides a more stable foundation for the subsequent segmentation process.
Before calculating the similarity of image blocks, a weighted median filter is applied to each image block to reduce the impact of noise interference. Specifically, a weighted median filter is applied to the neighborhood Z(Ni) of each image block:
Z N i = m e d i a n Z N i + Q m ( i )
Q m ( i ) = 1 e h 2 · ( Z N i min w )
In the equation, Qm(i) is the adaptive median filtering weight; Z(Ni)min is the minimum pixel value in the image block; and w is the modulation weight to prevent the influence of excessively high grayscale values, and its value is set to 1.
The abnormal pixels are further removed in the image block. It is assumed that there are abnormal pixels in the image block Z(Ni) whose grayscale values deviate significantly from the mean μ(Ni) and local standard deviation σ(Ni) of the block. The abnormal pixels are removed according to the following rule:
Z filtered N i = Z ( j ) Z ( j ) μ N i < k σ N i , j N i
In the equation, k is the parameter used to control the removal of abnormalities, and its value is set to 10.
After the preprocessing of weighted median filtering and abnormal pixel removal, the mean square error after abnormal pixel removal is used as the metric to calculate the similarity between image blocks. The formula for calculating the non-local similarity coefficient between two image blocks is as follows:
W ( i , j ) = 1 C ( i ) exp Z f i l t e r e d N i Z f i l t e r e d N j 2 2 h 2
In the equation, Zfiltered (Ni) and Zfiltered (Nj) represent the neighborhoods after removing the abnormal pixels; h controls the filtering strength; and C(i) is the normalization constant, with a value of 1.

3.1.2. The Image Block Similarity Threshold

The local feature similarity of an image reflects the degree of gray value differences between the pixels in an image block. A higher similarity indicates smaller differences in pixel values, while a greater difference suggests higher dissimilarity [55]. The image entropy value can reflect the pixel gray value distribution characteristics and spatial properties of an image block. Many image processing techniques use it to distinguish between low-frequency and high-frequency regions of the image. However, entropy does not account for the similarity of edge and texture information in high-frequency regions, which may lead to texture deformation and blurring in the reconstructed image. Therefore, this paper proposes a method that combines entropy values and uses inter-class variance, local average variance, and local mean square variance of image blocks to adaptively solve the similarity threshold. This threshold is then compared with the calculated similarity coefficients of each image block to measure the similarity degree between the pixel values. Furthermore, the high-frequency regions of the image are subdivided, making the image segmentation of the reconstructed image more reasonable and improving the texture detail quality of the reconstructed image. The specific threshold calculation process is as follows:
It is assumed that the grayscale level of the image is H, and the image size is M × N, f(i, j) represents the frequency of occurrence of a pixel with a grayscale value of i and a neighborhood grayscale mean of j in the image. Pij is the probability of the region’s grayscale mean occurring at (i, j), then
p i j = f ( i , j ) B 2
The definition of the information entropy value is as follows:
d = i = 0 H 1 j = 0 H 1 p i j log 2 p i j
In the formula, i, j = 1, 2, …, H − 1
Finally, the similarity threshold T is calculated as follows:
T = S ( i , j ) V ( i , j ) V ( i , j )
S ( i , j ) = 2 ( μ + d ) 2 + 7 × μ 2 a × b
V ( i , j ) = ( a × b ) μ + 2 T a × b
In the formula, S(i, j) represents the local mean square deviation coefficient; V(i, j) represents the local average variance coefficient; a and b represent the width and height of the image block, respectively; a × b is the total number of pixels in the block; and μ is the mean grayscale value within the image block, representing the brightness of the image block.
The threshold value for partitioning the image into blocks is selected based on the similarity between adjacent regions. A higher threshold results in fewer but larger blocks, leading to smoother reconstruction but potentially losing finer details in complex textures. A lower threshold results in more blocks, preserving finer details at the cost of higher computational complexity. The threshold of this paper is optimized based on image similarity, thereby improving block precision and enhancing the quality of the reconstructed image.

3.1.3. Image Information Analysis and Block Segmentation Experiment

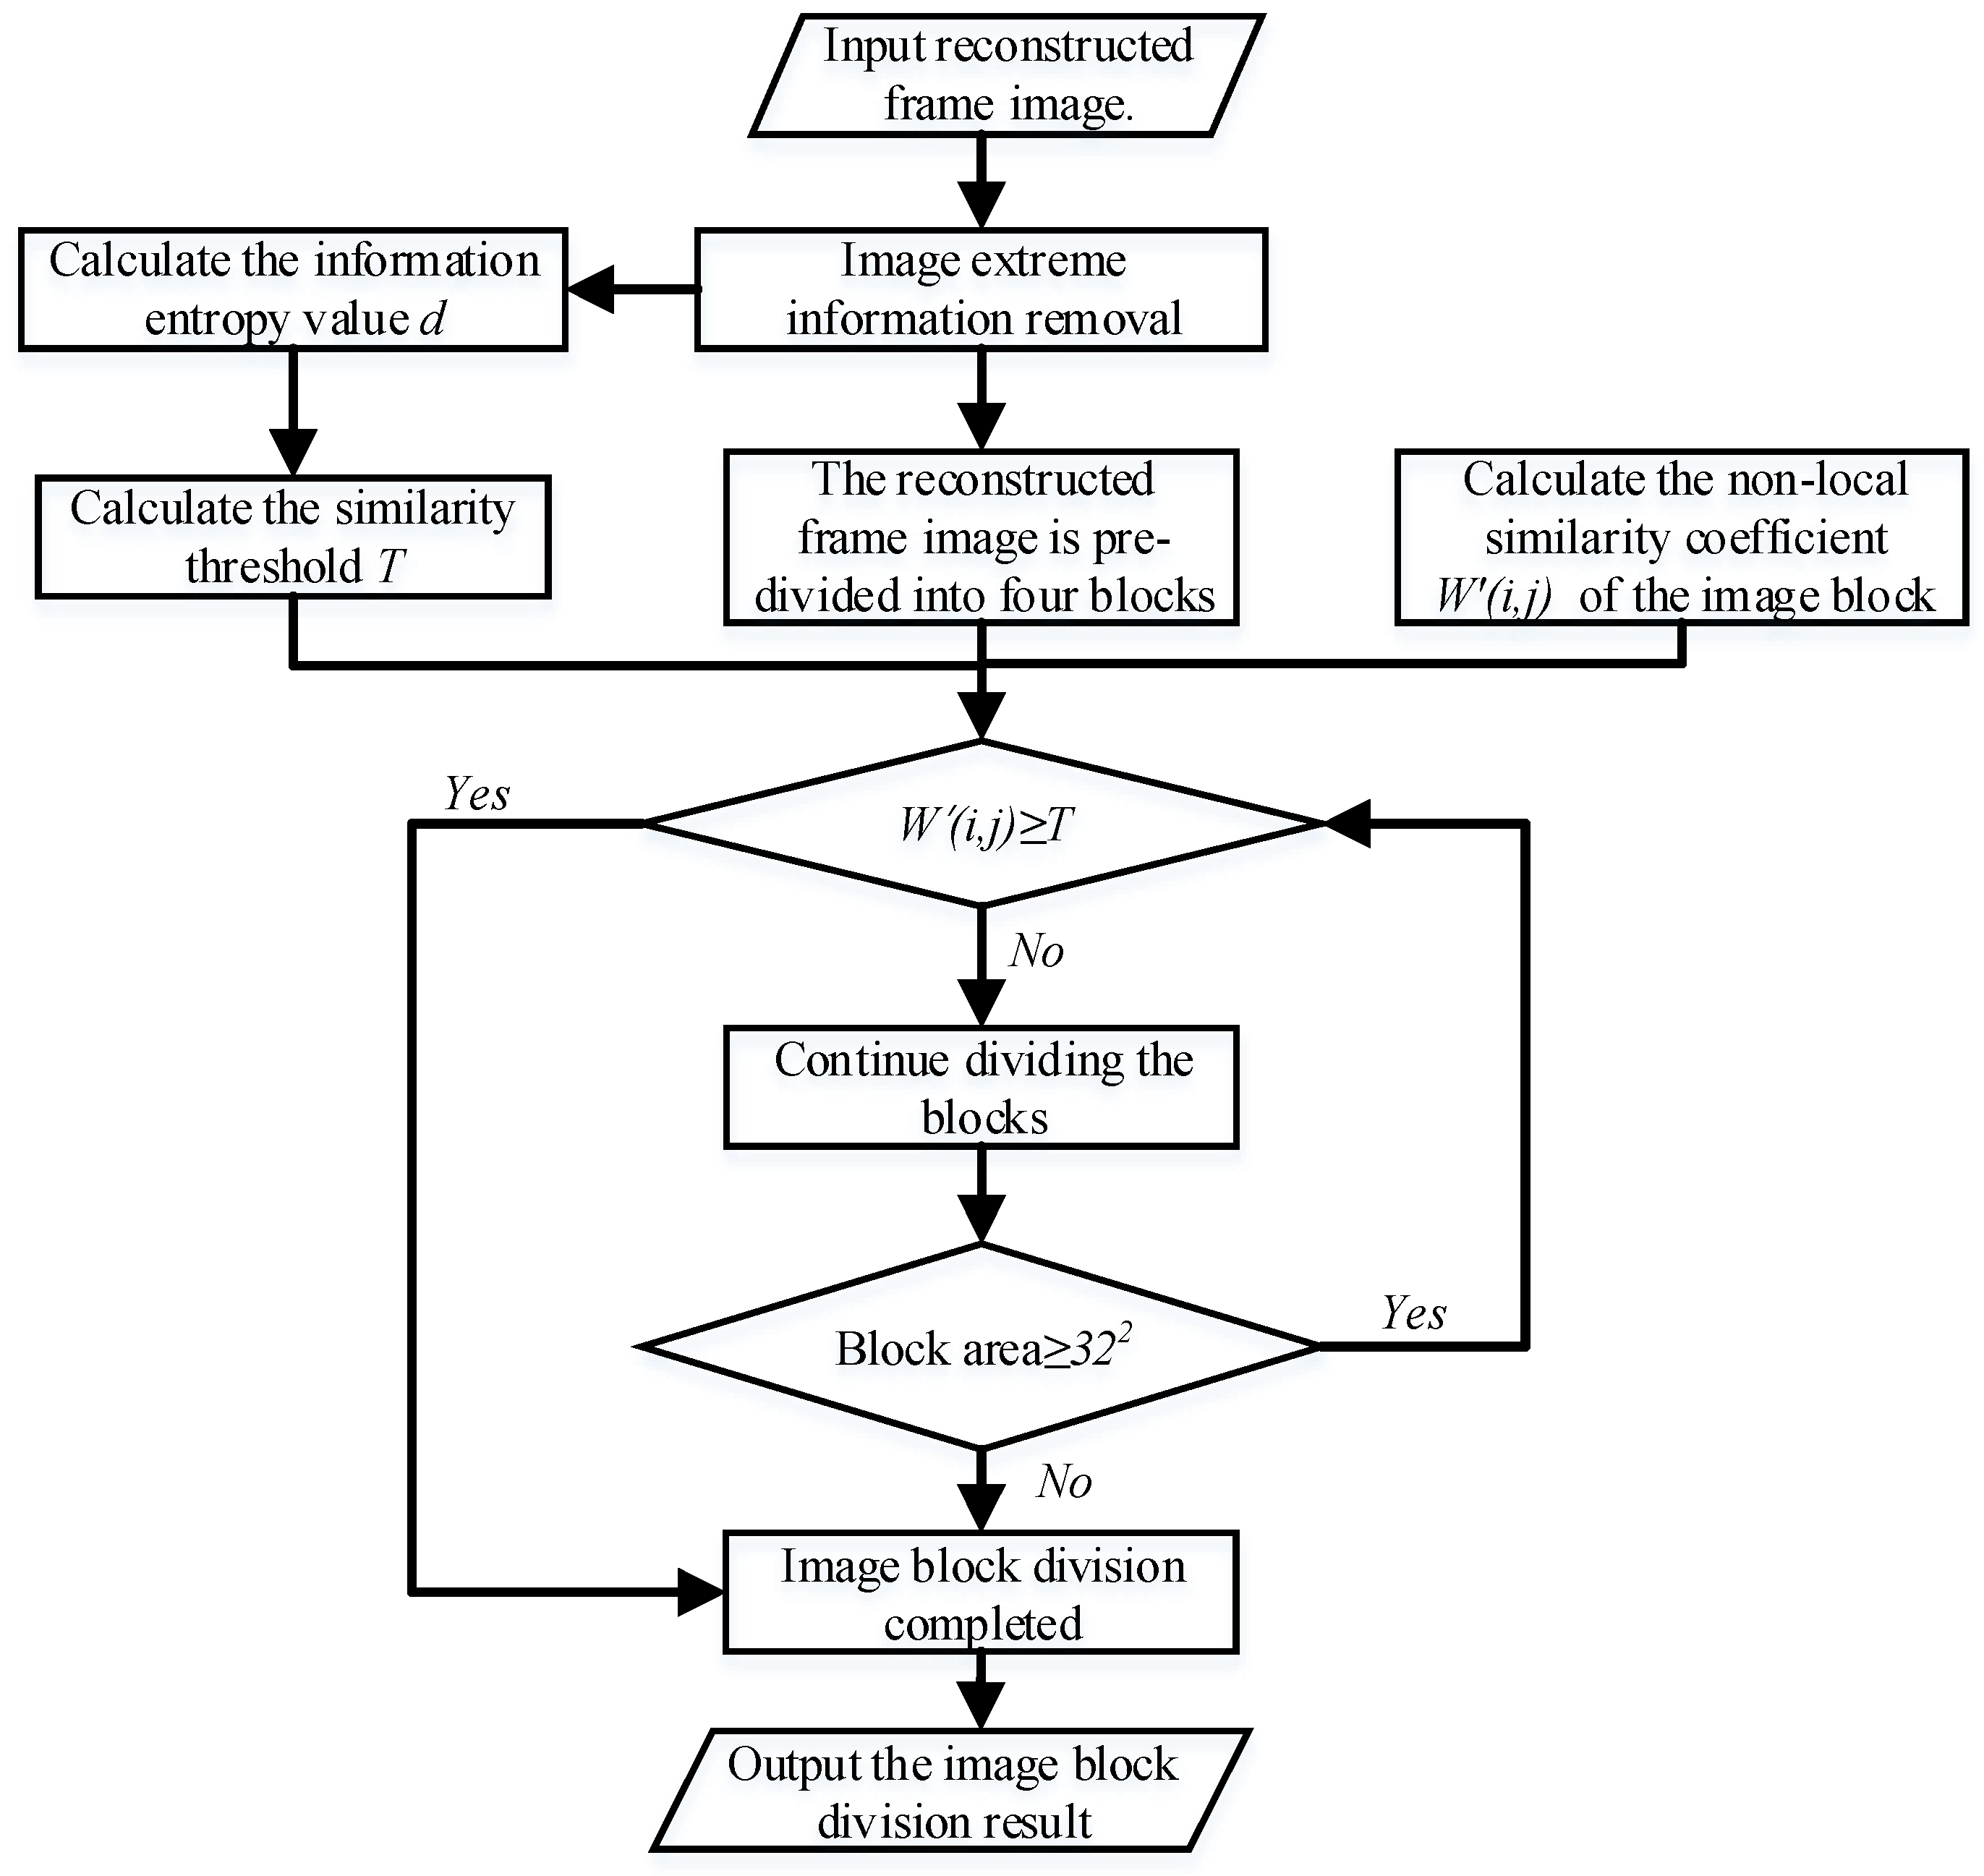
After the similarity threshold calculation is completed, the selected reconstruction frame image is recursively decomposed into four sub-blocks. The similarity threshold is compared with the similarity coefficients of each image block. When the image block similarity coefficient W′(i, j) is greater than the similarity threshold T, it indicates that the similarity of the image block is high, meaning the grayscale distribution is uniform, and the detail content is less, thus reducing the number of subdivisions or ending the segmentation. When the image block similarity coefficient N is less than the similarity threshold T, it indicates that the pixel value distribution of the image block is uneven, containing more information, and the image block needs to be further subdivided into four sub-blocks until each sub-block has the same or similar pixel values. The comparison results are converted into a binary first-order discriminant function Flag(i, j). If the image block is located in a high-similarity region, Flag(i, j) is set to 0. Otherwise, if the image block is located in a low-similarity region, Flag(i, j) is set to 1. It is defined as follows:
F l a g ( i , j ) = 1 W ( i , j ) T 0 W ( i , j ) < T
To further reduce the running time of the adaptive block segmentation algorithm for reconstruction frame images, the grayscale difference of image blocks is calculated before segmentation to distinguish between non-smooth and smooth regions of the image. This allows the algorithm to focus on processing non-smooth regions during segmentation, while smooth regions are either simply processed or ignored. The adaptive block segmentation process for the reconstruction frame image, derived from the above steps, is shown in Figure 3.
Finally, to validate the effectiveness of the proposed adaptive similarity block segmentation method, this paper selects multi-class experimental images with a resolution of 512 × 512, including typical scenes such as objects, landscapes, plants, and rocks. As shown in Figure 4, the block segmentation experiment analyzes the efficiency of the method in different feature regions and its impact on reconstruction performance. The experiment shows that, in detailed feature regions, the adaptive block segmentation method generates small-sized block units, accurately capturing edge and texture information in complex areas. In smooth regions, large-sized block units are used, effectively reducing the number of blocks and improving computational efficiency. For example, for object images, the method generates high-density small block units around the object contours while simplifying the background area into large blocks. For rock images, the method generates many small block units in regions with detailed changes on the rock surface while maintaining simplified divisions in the background area. The comprehensive experimental results show that the adaptive block segmentation method flexibly adjusts block sizes according to the complexity of the image content. It significantly improves detail retention while effectively optimizing computational resources, demonstrating its flexibility and practicality, and providing reliable technical support for further improving image feature sampling efficiency and algorithm running speed.
The block size determines the granularity of image processing during the reconstruction. A larger block size helps retain more global features but may blur fine details, while a smaller block size captures finer details but might introduce noise. In our approach, the block size is dynamically adjusted based on the image’s local characteristics, which improves both edge clarity and detail retention.

3.2. Multi-Scale Object Tracking in Images

Sequence image feature tracking and sampling is a key step in the image super-resolution reconstruction process. In the research on sequence image information extraction, Shao et al. [56] proposed an image information extraction method based on deep convolutional neural networks. However, this method has the drawback of a large training model and low image feature extraction efficiency. To address these issues, the related filter target tracking algorithm, which can efficiently extract multiple image features and complete tracking sampling at hundreds of frames per second, has been widely applied in dynamic scene feature tracking tasks [57,58]. In this paper, based on the kernel correlation filter function, a feature tracking sampling algorithm suitable for large displacement sequence images in the same scene is proposed. First, after completing the adaptive block processing, the LK optical flow method [59] is used to estimate the motion parameters between the sequence images. Then, a cyclic shift measurement matrix is used to perform feature sampling on each sub-block of the reconstruction frame to obtain the complete sample features of the frame image. Next, combined with the motion displacement information calculated by the optical flow method, the feature mapping relationship between the reconstruction frame and other frames is constructed to achieve feature tracking sampling for the entire sequence of images. Finally, the sampled features are trained using the correlation filter regression method to generate a response map for the tracking target model and extract the features that are most similar to the reconstruction frame image features and have the highest response values from other frames.

3.2.1. Image Motion Parameter Estimation

Motion parameter estimation extracts the motion displacement information of the target feature by solving the motion vector between sequence images, thereby predicting the possible position of the target feature in the previous or next frame. This estimation effectively narrows the range of feature tracking sampling, significantly improving the sampling efficiency. Given the excellent motion estimation performance of the LK optical flow method in target tracking, this paper adopts the LK optical flow method for motion estimation of sequence images. The method detects feature targets and matches feature information between images to infer the motion trend of the target. On this basis, using assumptions such as brightness constancy, motion continuity, and spatial consistency, the optical flow motion vector equation is constructed, and its solution is solved to obtain the optical flow motion information of the target. Its mathematical expression is as follows:
I x u + I y v + I t = 0
In the formula, Ix and Iy are the partial derivatives of the sequence image, and It represents the derivative of the sequence image with respect to time. u and v are the velocities in the x and y directions, respectively.
To make the optical flow method more suitable for motion parameter estimation of sequence images with large displacements, improvements are made based on the existing optical flow method. The tracking area of the optical flow method is recursively expanded, increasing the algorithm’s search range for target features while enhancing detection efficiency. Specifically, spatial consistency assumptions are used as constraints to ensure the consistency of pixel movement within a local area. During the process of tracking target features, the search matrix used by the algorithm is expanded sequentially from a 3 × 3 matrix to a 6 × 6, 9 × 9, …, n × n matrix until the target feature is detected. A system of contradictory equations, consisting of n2 equations, is established, and the least squares method is applied to solve the equation [19]. The equation can be expressed as follows:
A T A d = A T b
In the equation, A is the coefficient matrix containing Ix and Iy, AT is the transpose of A, d is the velocity matrix for u and v, and b is the matrix of the terms. When ATA is invertible, the system of equations has a solution, allowing the optical flow method to search a larger area.
Accurate motion estimation between frames is essential for reducing displacement errors during the reconstruction process. The Lucas–Kanade method provides a reliable way to estimate optical flow; however, its accuracy is influenced by factors such as image quality and motion magnitude. This step addresses the issue of image information distortion caused by pixel-level displacement between sequential part images, ensuring that motion estimates are as accurate as possible.

3.2.2. Image Target Feature Tracking and Sampling

The proposed feature sampling method performs dense sampling of the entire image with integer pixel cyclic displacement on any frame of the input sequence images, obtaining a large amount of image prior information training samples. This method does not strictly require the displacement amount between sequence images, solving issues such as limited complementary information extraction for large displacement sequence images. The image feature information search matrix is defined as follows:
X = 0 0 1 1 0 0 0 1 0
Set the movement distance of the search matrix as one unit of Euclidean geometric distance. When the cyclic movement occurs n times, the prior information training sample C can be obtained. This sample set can be represented by an n × n cyclic matrix u, that is,
C ( u ) = u 1 u 2 u 3 u n u n u 1 u 2 u n 1 u n 1 u n u 1 u n 2 u 2 u 3 u 4 u 1
In the frequency domain, the matrix C(u) is represented as follows:
C ( u ) = F d i a g ( u ) F H
In the equation, d i a g is the diagonal matrix function; F is the Fourier matrix; u is the Fourier transform of u; and FH is the transpose of F.
The tracking feature model requires establishing a mapping between the training samples and the tracked target. Using the target image feature displacement information obtained from the optimized optical flow motion estimation method, the prior information sample features on the reconstruction frame image are used to track similar features in other frame images. Here, the mapping parameter w describes the minimum square difference between the sample feature u and the target feature v, which is obtained through the minimum cost function f ( u i ) , and is defined as follows:
min w i f u i v i 2 + ξ w 2
In the equation, ui represents the reconstruction frame training sample set, i = 1, 2, …, n; vi represents the target tracking sample in other frames; w represents the mapping parameter; and ξ represents the displacement coefficient obtained from the optical flow motion estimation.
To further find the extremum,
w = u H u + ξ I 1 u H v
In the equation, I represent the motion estimation vector.
To reduce the complexity of the training model and improve the tracking sampling efficiency, the concept of kernel filtering function is introduced to establish the mapping between the sample and the target. The mathematical equation for solving the mapping parameter w is as follows:
w = i = 1 M τ i u i
τ = ( K + ξ I ) 1 y
K u u = exp 1 η 2 u 2 + u 2 2 F 1 u ^ * · u
τ ^ = y ^ K ^ u u + ξ δ
In the equation, M is the spatial dimension; τ i is the non-linear combination coefficient of u i ; K is the kernel matrix; K u u is the Gaussian kernel; u is the training sample of the reconstruction frame image; y ^ is the expected tracking feature target; and δ is the Gaussian spatial bandwidth.
For other frames, feature information is obtained using the cyclic shift measurement sampling method. The feature set of another image frame is denoted as z i . The kernel filter regression function H(u,z) is used to compute the similarity response values between all feature information and the reconstruction frame image block sample features. The response value with the maximum similarity represents a similar feature. The kernel filter regression function is defined as follows:
H ( u , z ) = i w i k ( u i , z )
In the equation, H is a vector of length 1 × n, and its elements correspond to the similarity between the tracked features and the sample features.
During the process of tracking similar features, the mapping parameter w is updated and corrected. Here, the mapping parameter w is corrected through the tracked similar features and tracking error parameters, that is,
w = ( 1 θ ) w p r e + θ w n e w
In the equation, θ is the adjustable tracking error parameter; w p r e represents the mapping parameters and sample feature set from the previous sampling; and w n e w represents the mapping parameters corrected from the subsequent sampling.

3.3. Image Super-Resolution Reconstruction

After inputting the low-resolution sequence part images, the target reconstruction frame image is selected and adaptively segmented into similar blocks. In the algorithm learning phase, image features obtained through block tracking sampling are extracted and clustered using the K-means algorithm [60], thereby constructing the input part of the multi-frame image reconstruction algorithm. Since the mapping relationship between the features of the reconstructed frame image and the features of other frames in the sequence has been established during the block tracking sampling phase, a quadtree super-resolution reconstruction model is introduced [61]. Taking the reconstructed frame image as the reference, a mapping model between the low-resolution image features and high-resolution image features is constructed. Specifically, the mean of the input low-resolution image blocks is accumulated to generate high-resolution image blocks, thus achieving the reconstruction of the high-resolution image. The specific derivation process is as follows:
For a given image block A, the prior information sample training set obtained by sampling is C. l i and g i represent the vectorized features of the low-resolution image block and the high-resolution image block, with dimensions p and q, respectively. Using L R p × n and G R q × n to represent the l i and g i matrices, the linear least squares equation for calculating the mapping parameter β a between the low-resolution image block and the high-resolution image block is as follows:
β a = arg min β a L w G D 2
In the equation, β a R p × q + 1 ; w represents the mapping parameters between features of other frame images and the reconstruction frame image features; and D is the unit vector of I × C.
By further solving the system of Equation (24), the mapping parameter β a is learned. Each category of low-resolution image features is based on the reconstruction frame image block, and the corresponding high-resolution image block is obtained by summing the mean values. Finally, the high-resolution image is reconstructed using the obtained high-resolution image blocks, as defined below:
G = β a L E

4. Experiments and Analysis of the Proposed Method

Remote-sensing images have characteristics such as high resolution, remote detection capability, and wide coverage, which are closely related to industrial application scenarios. These features make remote-sensing images an appropriate experimental subject to verify the effectiveness of the proposed method. Specifically, remote-sensing images share similarities with industrial part images, particularly in terms of lighting, texture, and geometric properties. Remote-sensing images, acquired at various times, can simulate the lighting conditions and regional monitoring of industrial production, as well as the detection of defects on industrial parts. Therefore, using remote-sensing images not only effectively demonstrates the validity of the proposed method but also provides theoretical support for its application in industrial part defect detection.
This paper first conducts super-resolution reconstruction experiments on remote-sensing images with a spatial resolution of 5.5 m. The comparison between this method and classical methods is analyzed in terms of image reconstruction performance. Secondly, to further explore the quantitative evaluation of image quality, this paper combines multiple objective evaluation metrics, including Peak Signal-to-Noise Ratio (PSNR), Structural Similarity Index (SSIM), Information Entropy (IE), and Mean Gradient (MG), to analyze the improvement effect of the algorithm on image reconstruction quality.
(1) PSNR is a commonly used image quality evaluation metric widely applied in image processing and computer vision fields. PSNR is calculated based on the Mean Squared Error (MSE) to assess the difference between the original image and the processed or distorted image. Its calculation formula is as follows:
P S N R = 10 log 10 ( M A X i ) 2 M S E
M S E = 1 m × n i = 0 m 1 j = 0 n 1 [ I ( i , j ) K ( i , j ) ] 2
In the equation, M A X i represents the maximum pixel value in the image used to compute the Peak Signal-to-Noise Ratio (PSNR); MSE represents the Mean Squared Error; and I(i, j) and K(i, j) represent the original image and the denoised image, respectively.
(2) The Structural Similarity Index (SSIM) is primarily used to measure the similarity between two images. Unlike PSNR, SSIM not only considers the global error of the image but also takes into account three aspects: luminance, contrast, and structure. Its value ranges from 0 to 1, with values closer to 1 indicating better preservation of the image structure. The calculation formula is as follows:
S S I M ( x , y ) = 2 μ x μ y + c 1 2 σ x y + c 2 μ x 2 + μ y 2 + c 1 σ x 2 + σ y 2 + c 2
In the equation, μ x , μ y represent the pixel mean values of the x, y images, respectively; σ x , σ y represents the variance of the x, y image; σ x y represents the covariance between the x, y images; and c 1 = 0.01 L , c 2 = 0.03 L , L = 2 B 1 . Typically, B is taken to be 1.
(3) Information Entropy (IE) is an image complexity evaluation metric widely used to measure the amount of detail information contained in an image and the randomness of its grayscale distribution. A higher entropy value indicates a more complex grayscale distribution and more information in the image, whereas images with lower entropy tend to be smoother or contain fewer details. The calculation formula for IE is as follows:
H ( x ) = x = 0 255 P x log 2 P x
In the equation, P x represents the probability of a certain grayscale value occurring, and H(x) represents the entropy value.
(4) MG is a metric used to measure the degree of image detail sharpening and the ability to preserve edge features. It is mainly calculated using the mean of pixel gradients. A higher MG value indicates that more edge and detail features are preserved, and the image clarity is higher. A low MG value indicates that the image is blurred or excessively smooth. The calculation formula for MG is as follows:
M G = x = 1 L 1 y = 1 W 1 ( f ( x , y ) f ( x + 1 , y ) ) 2 + ( f ( x , y ) f ( x , y + 1 ) ) 2 2
In the equation, L, W represent the image dimensions, and f(x,y) represents the grayscale value at (x,y).
In the experiment, all algorithms were implemented based on MATLAB 2019a. The computer operating system was Windows 11, with an Intel Core i7-1170 processor and 16.00 GB RAM.

4.1. Natural Image Super-Resolution Reconstruction Experiment

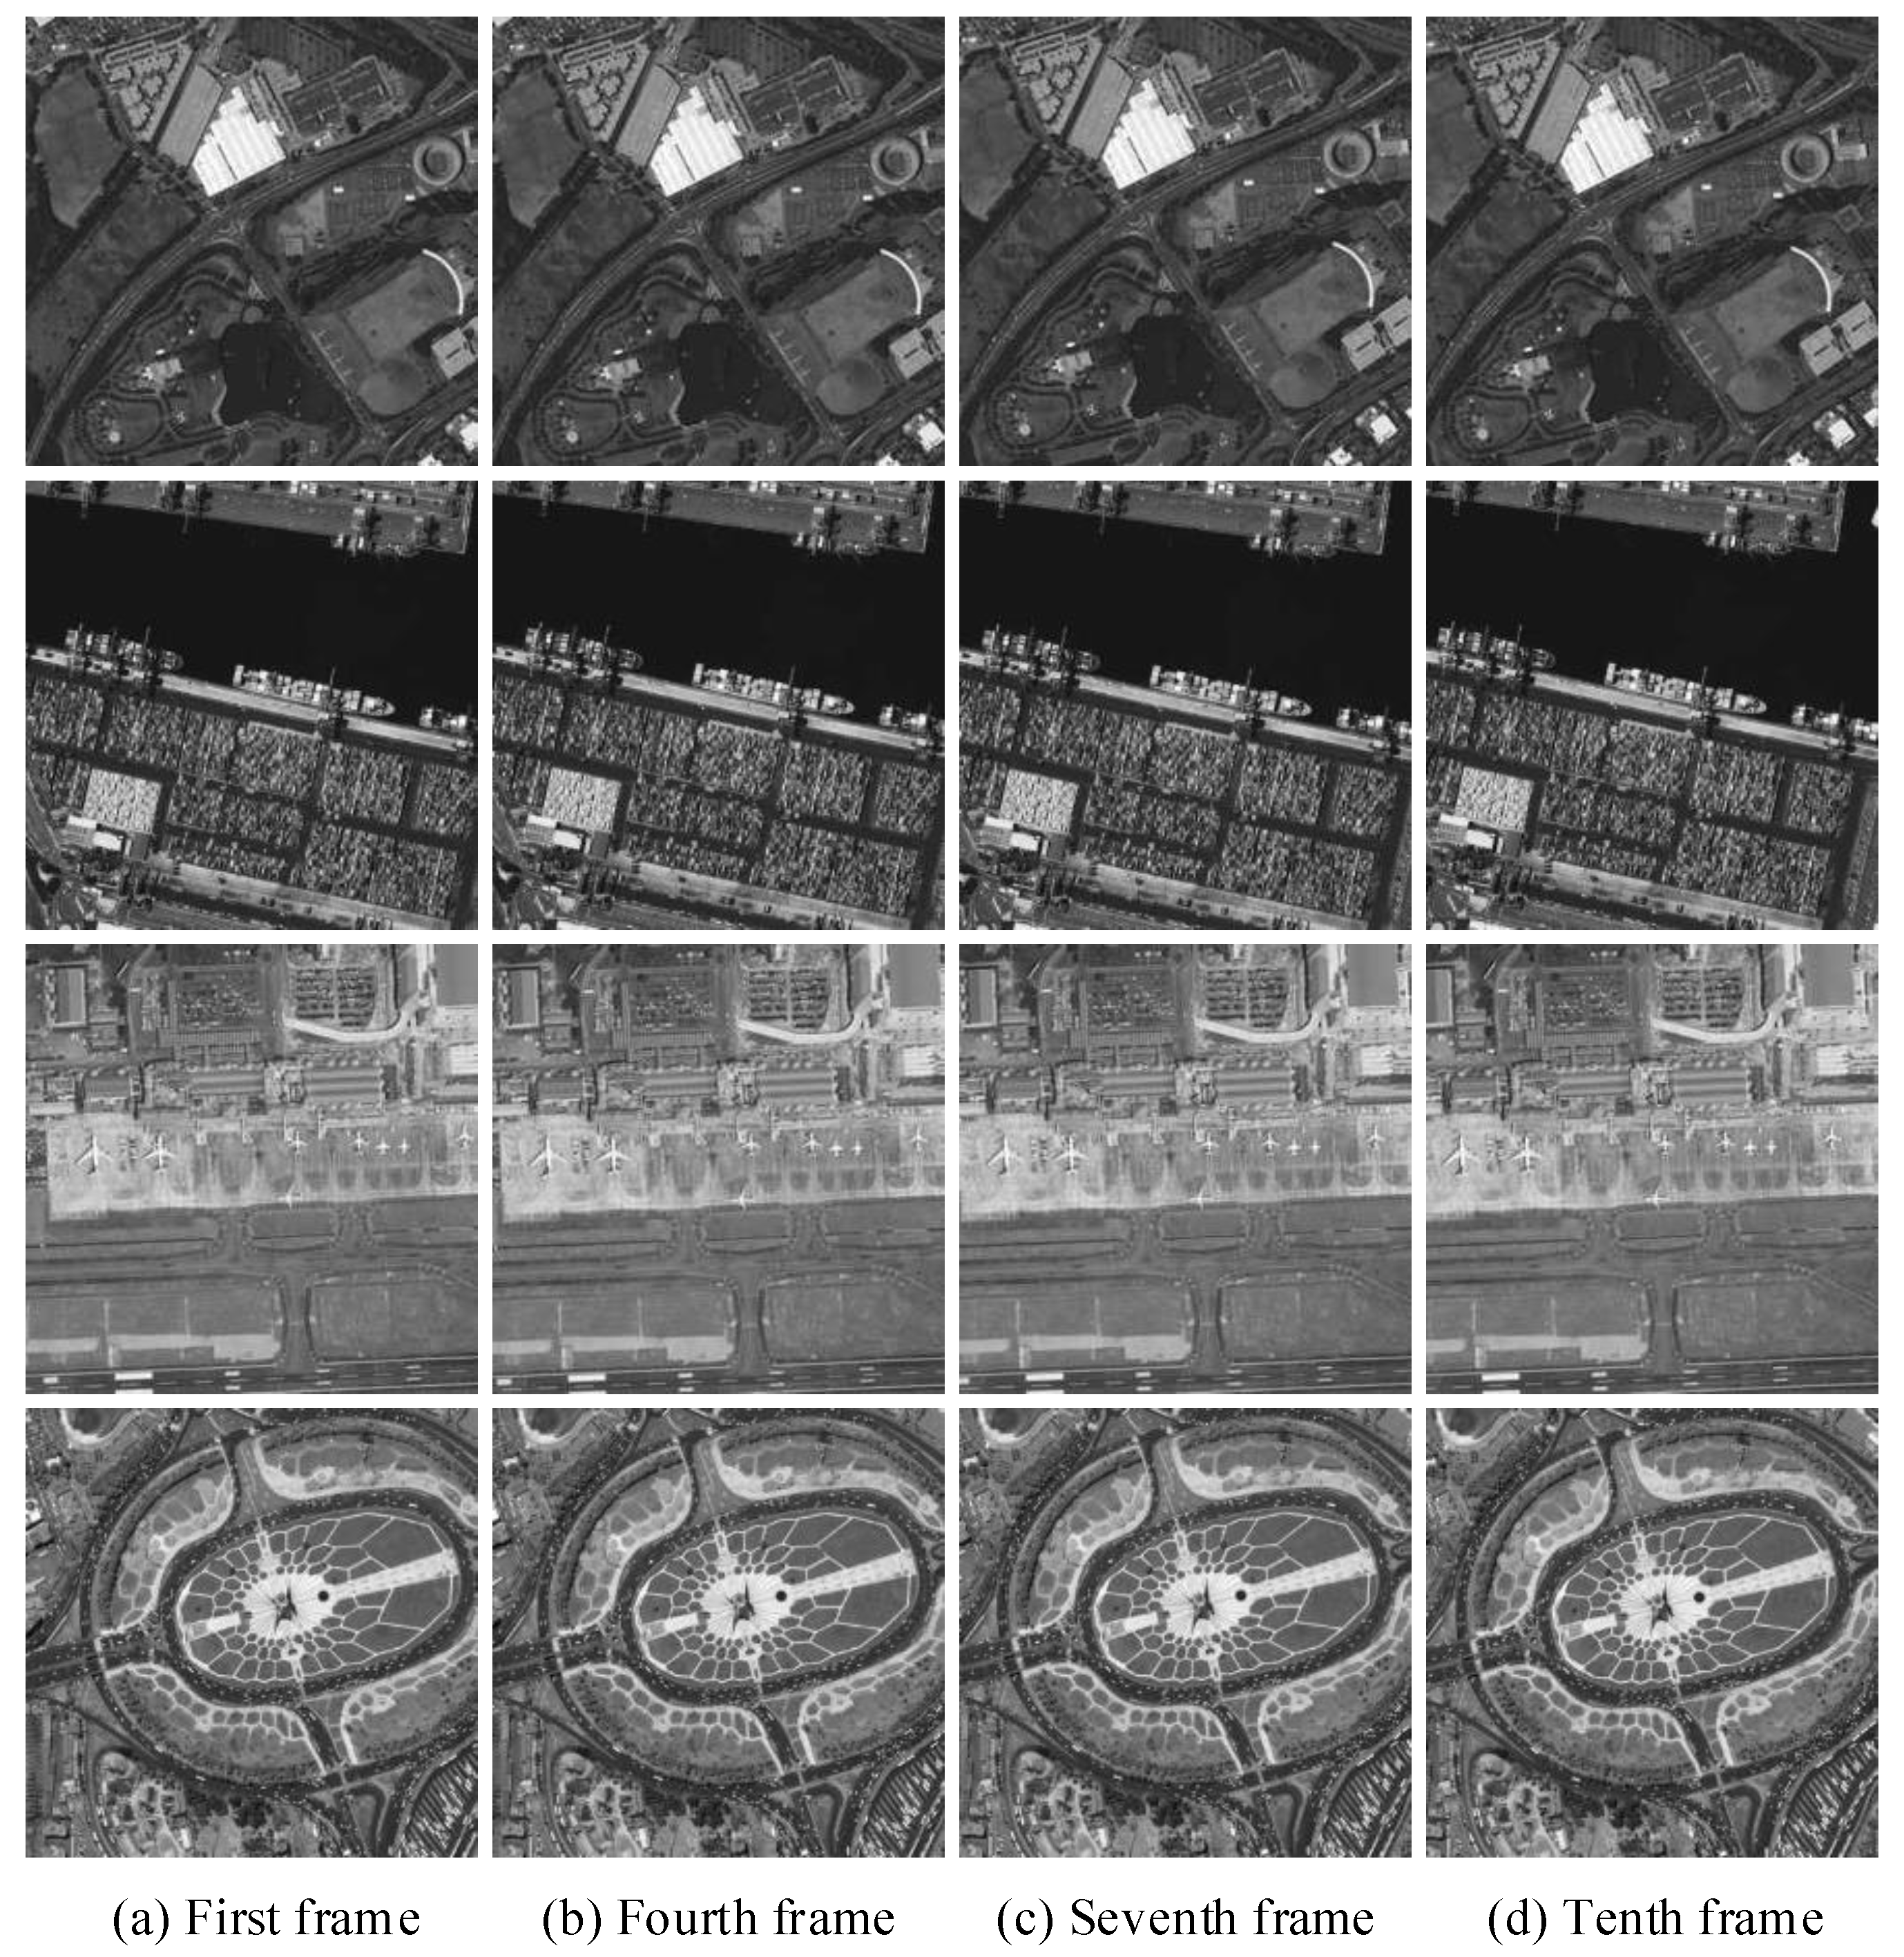
This paper takes a 5.5 m resolution image obtained by a remote-sensing satellite as the experimental object. The image content involves satellite observations of urban building distribution, port transportation, and airport shipping. As shown in Figure 5, ten frames of each image type are selected for four sets of reconstruction experiments. It can be observed from the figure that these sequence images have low quality, and there are significant pixel displacements between the images.
In addition, the proposed method is compared with Bicubic interpolation, Iterative Back-Projection (IBP), traditional convex set projection (POCS), SRGAN [14], Edge-Enhanced GAN (EEGAN) [13], and CCRN [49] in terms of subjective visual effects and objective experimental data. Furthermore, the image information calculation matrix size used in this algorithm is adaptively set based on the statistical characteristics of different image information. During the experiment, the sixth frame from the middle of the sequence images is chosen as the reconstruction frame. This selection is based on specific considerations of image quality, inter-frame similarity, and motion displacement error. The sixth frame was chosen because it exhibited higher similarity with both the preceding and succeeding frames while minimizing motion displacement errors. The comparison algorithm parameters are set according to the recommended values in the original literature.
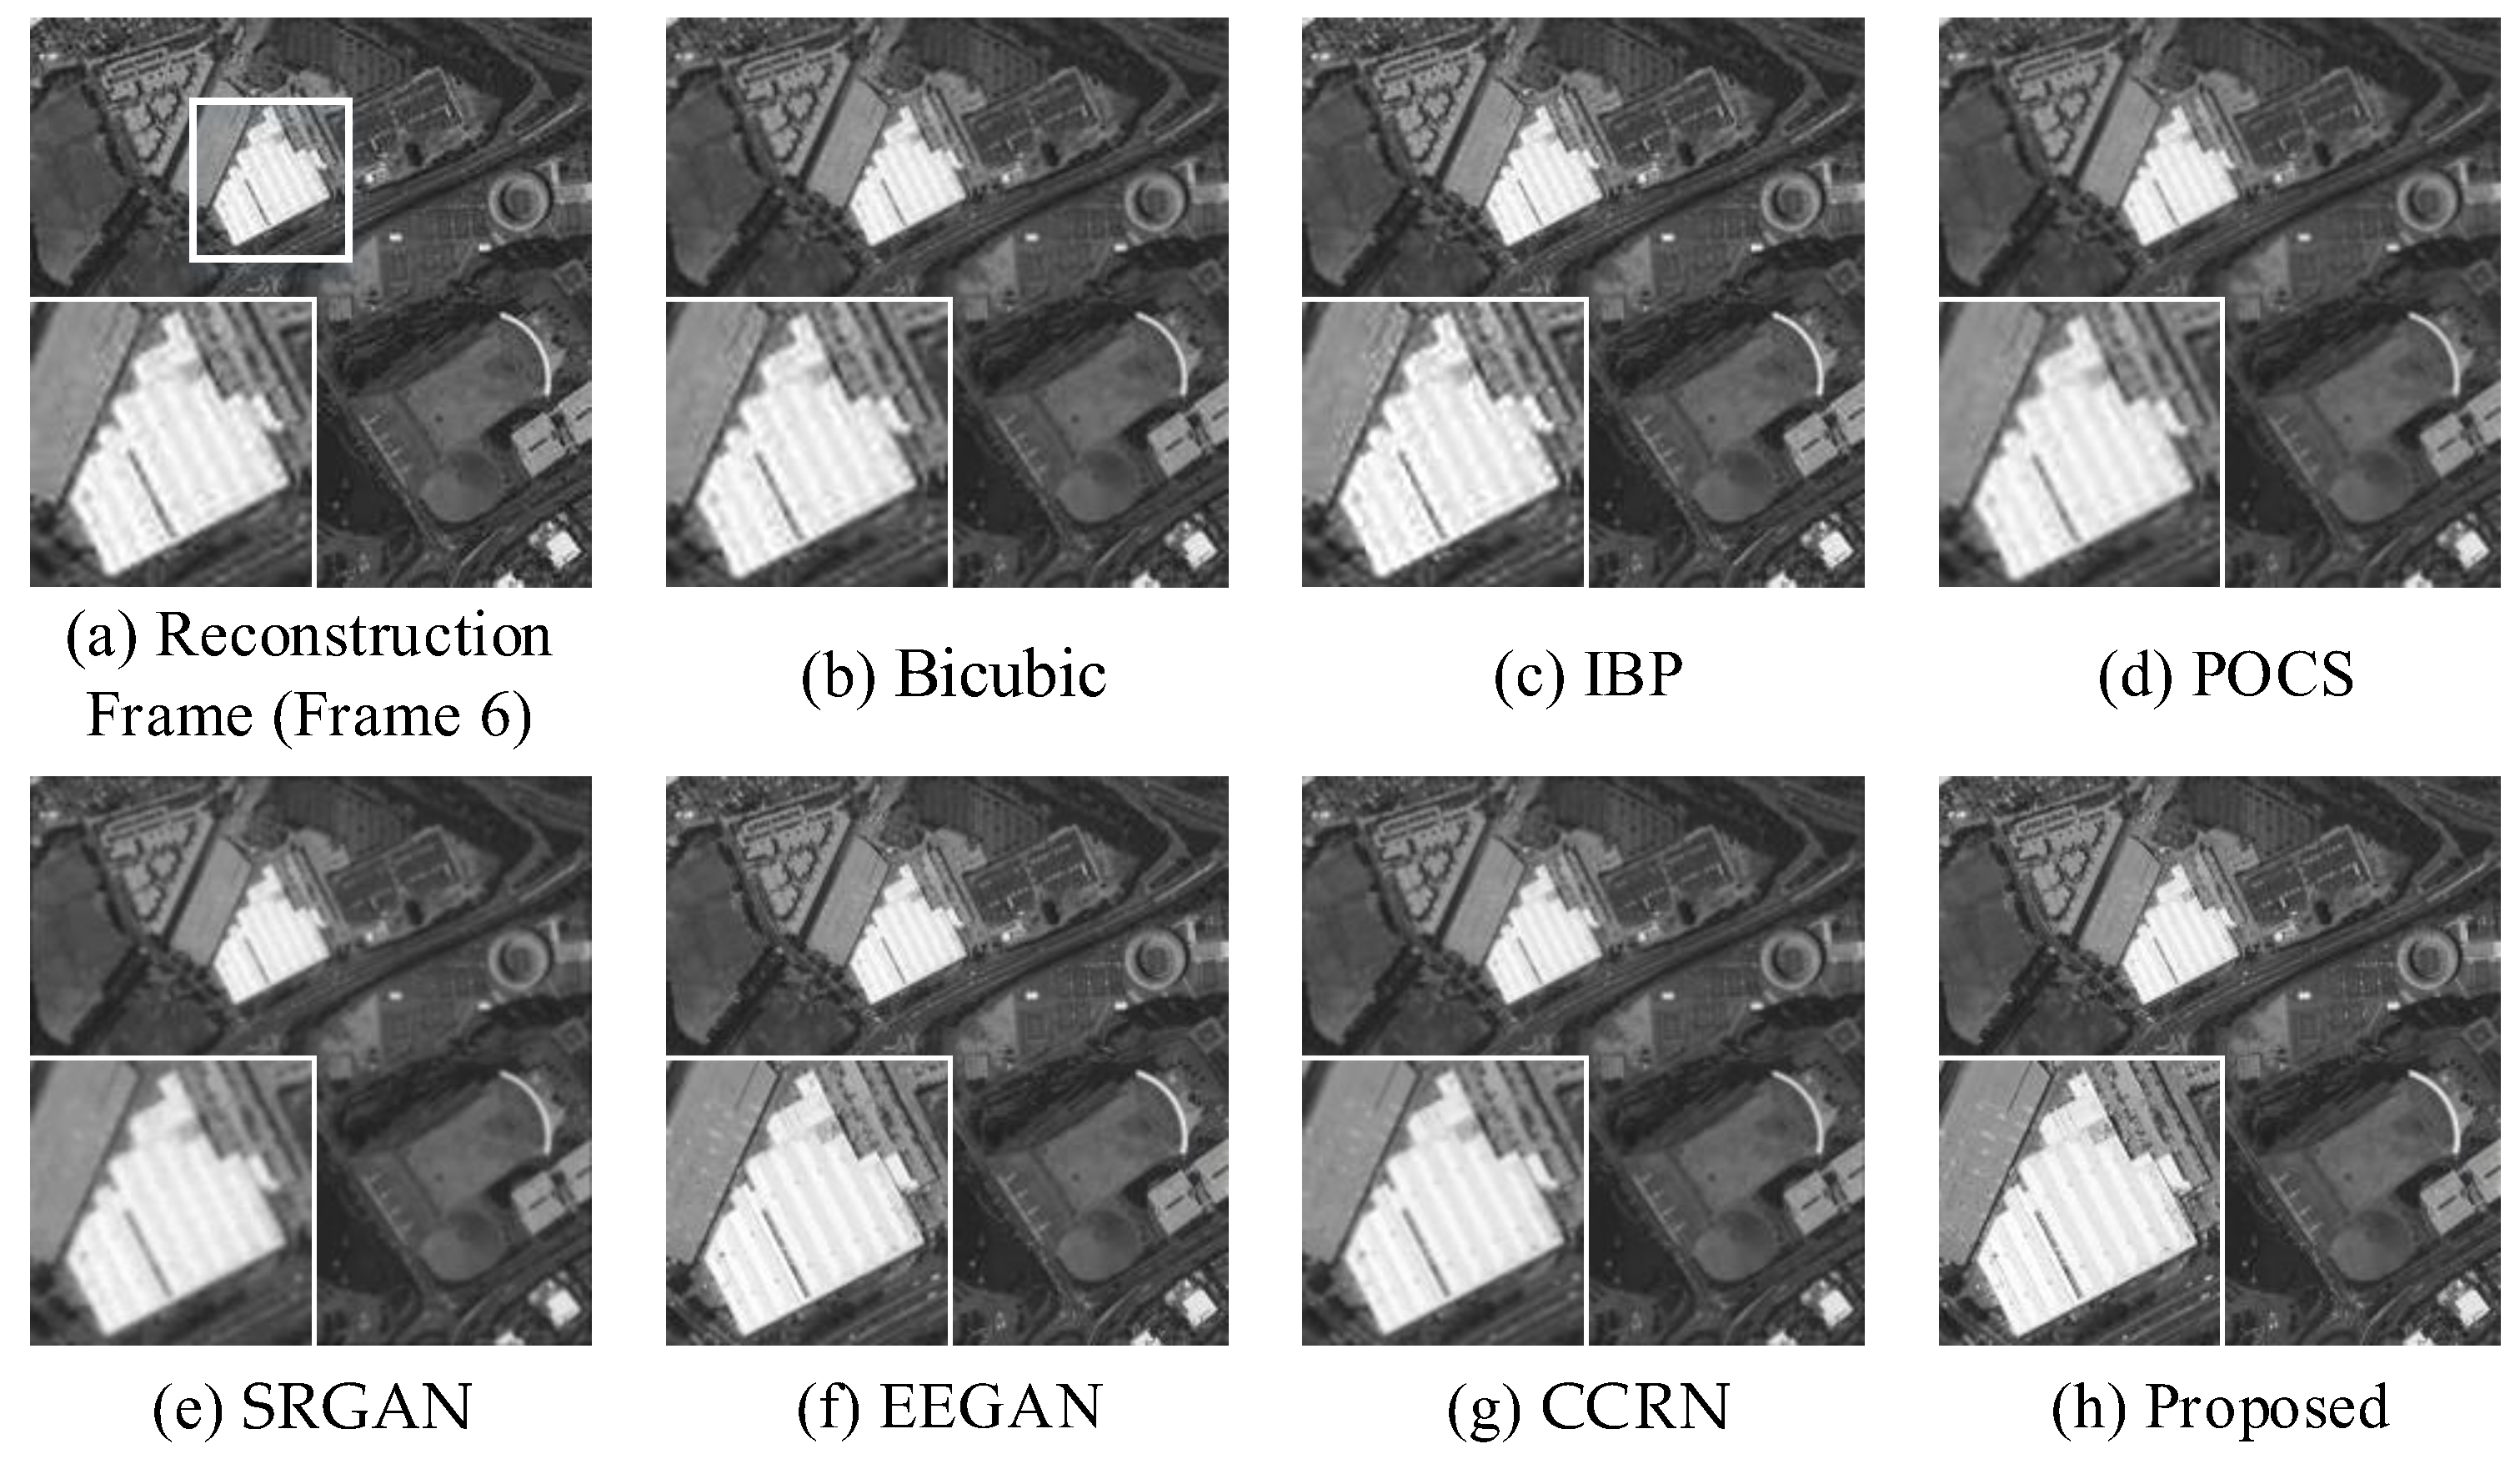
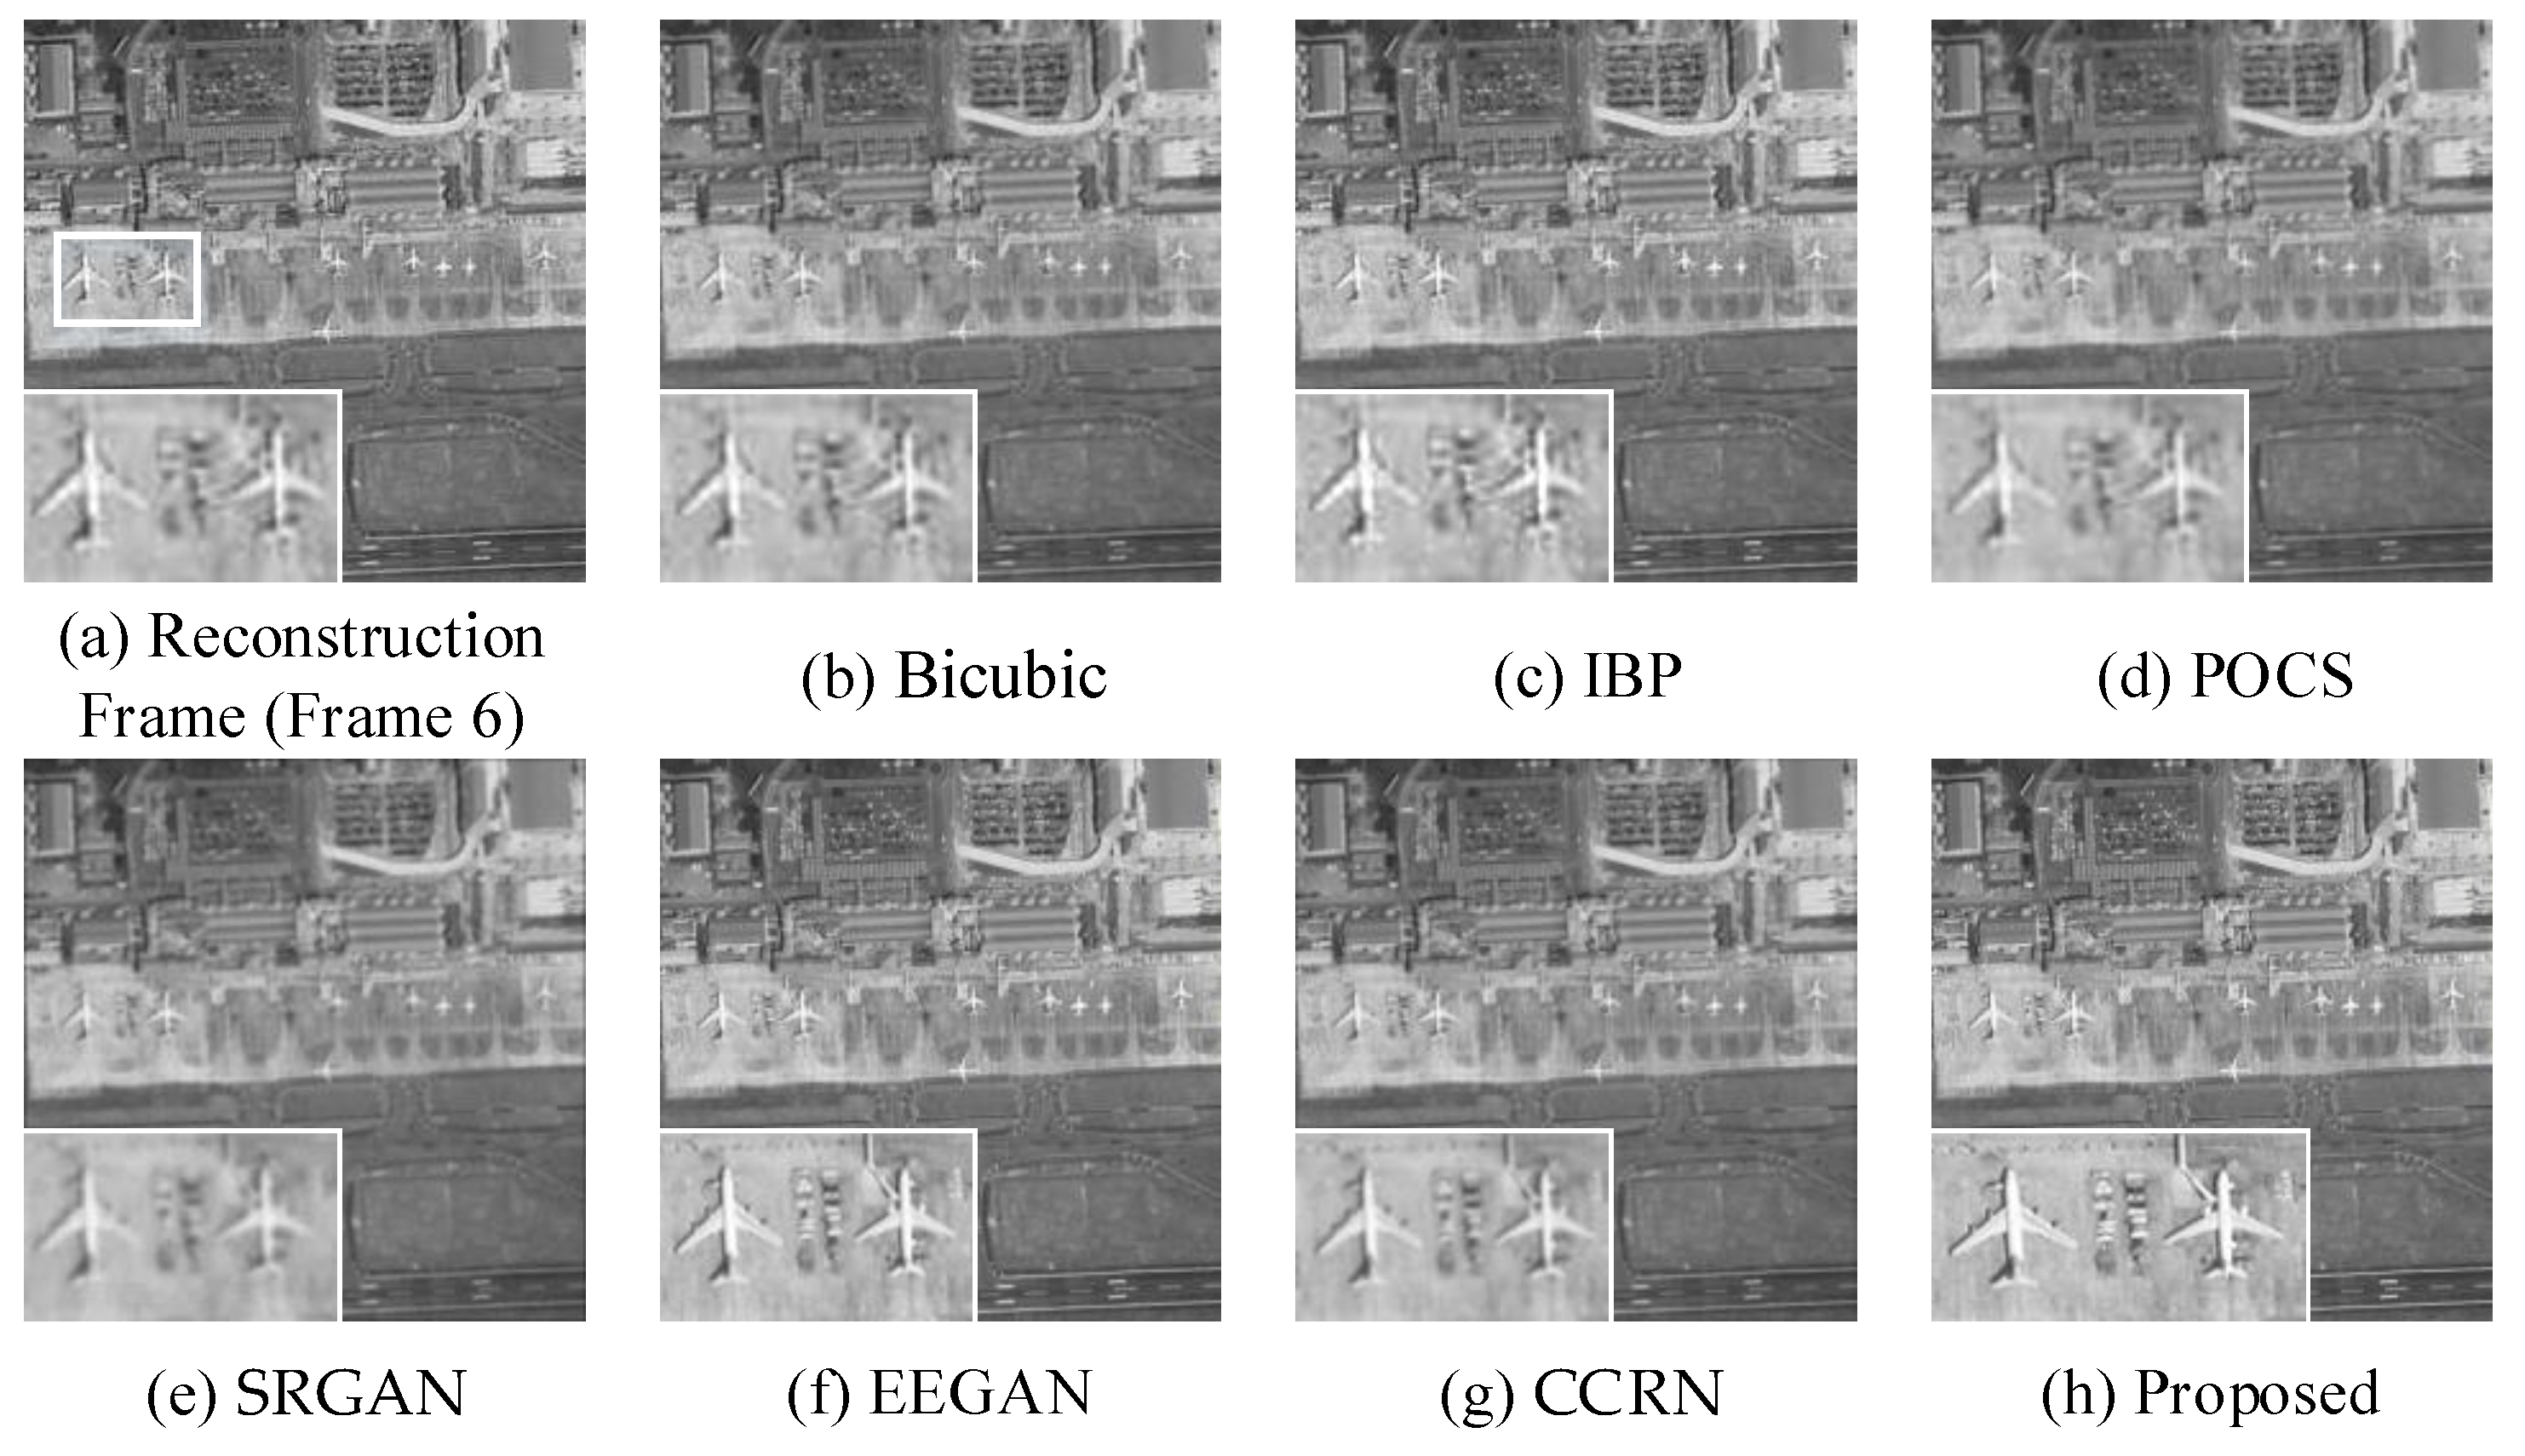
Table 1 and Table 2 show the objective experimental data comparison of reconstructed images using different methods, while Figure 6, Figure 7, Figure 8 and Figure 9 compare the overall and local subjective visual effects of the reconstructed images from each method. From the objective experimental data of each group, the Bicubic method produces the worst results, with the IBP and POCS methods yielding similar, suboptimal outcomes. The method proposed in this paper demonstrates overall superior performance in terms of Peak Signal-to-Noise Ratio (PSNR), Structural Similarity Index (SSIM), and the richness of reconstructed image detail features when compared to reference images. While EEGAN and CCRN show competitive results, the proposed method outperforms them in terms of comprehensive image quality. While SRGAN performs well in terms of Mean Gradient (MG) and Information Entropy (IE), it exhibits poor performance in terms of signal-to-noise ratio. Furthermore, since both the proposed method and EEEGAN apply image edge enhancement during the super-resolution reconstruction process, they show a significant difference in terms of average MG when compared to other methods.
In terms of subjective visual effect comparison, Figure 6 and Figure 8 show the reconstructed images of satellite observations of urban building distribution and airport transportation, mainly comparing the edge reconstruction effects of different algorithms. It is evident that the images reconstructed using the Bicubic algorithm have blurry edges and severe loss of high-frequency information. Particularly in the reconstructed images of airport transportation, the overall contours of airplanes are almost unrecognizable. The IBP algorithm produces clearer edge contours but introduces significant noise and jagged artifacts. The traditional POCS algorithm reduces jaggedness and noise compared to the previous two methods, but it still lacks sufficient edge information, resulting in unclear contours and poor visual quality. Overall, the first three algorithms fail to capture enough surface details. SRGAN and CCRN can reconstruct sufficient surface details, but from the perspective of local visual effects, the edges of buildings and airplanes exhibit varying degrees of blurriness, resulting in weak edge perception and inferior visual quality. The images reconstructed by the EEEGAN method and the proposed method are visually similar in both overall and local views, successfully restoring clear building and airplane edge contours, as well as rooftop textures. The airport transportation image reconstructed using the proposed method even reveals details such as the commuter vehicles beside the airplanes, providing abundant surface detail information. However, upon closer inspection, the EEEGAN method introduces slight artifacts along the edges, making the proposed method the best in terms of visual effect.
Figure 7 and Figure 9 depict the reconstructed images of satellite observations of port transportation and urban traffic, focusing on texture visual effects.
As shown in Figure 7, images reconstructed using Bicubic and IBP exhibit distorted textures with jagged artifacts, making it impossible to observe the distribution of transported goods. The IBP algorithm even introduces significant noise. The POCS algorithm produces less clear texture details, and in the local view, noticeable white edges appear, leading to suboptimal reconstruction quality. While SRGAN and CCRN reconstruct images with varying degrees of blurriness, they do allow for the observation of goods on ports and ships. The EEGAN method and the proposed method, however, ensure that texture details remain intact without blurring or breakage, achieving clear and reasonable texture details with enhanced edge sharpness.
Figure 9 shows the satellite observation of urban traffic in a certain area where image quality directly affects traffic flow monitoring. The images reconstructed using Bicubic, IBP, and traditional POCS algorithms suffer from severe texture distortion, deformation, and blurriness. The SRGAN method also results in blurry textures, making it impossible to observe vehicle movements with these four methods. CCRN reconstructs images with clearer textures compared to the previous methods, revealing distinguishable vehicle contours but failing to capture specific vehicle movement details. Both the EEEGAN method and the proposed method accurately display vehicle movement, but from the local view, the proposed method provides a sharper and clearer reconstruction.
Therefore, based on the above subjective and objective experimental data, the effectiveness of the proposed algorithm has been validated.

4.2. Part Image Super-Resolution Reconstruction Experiment

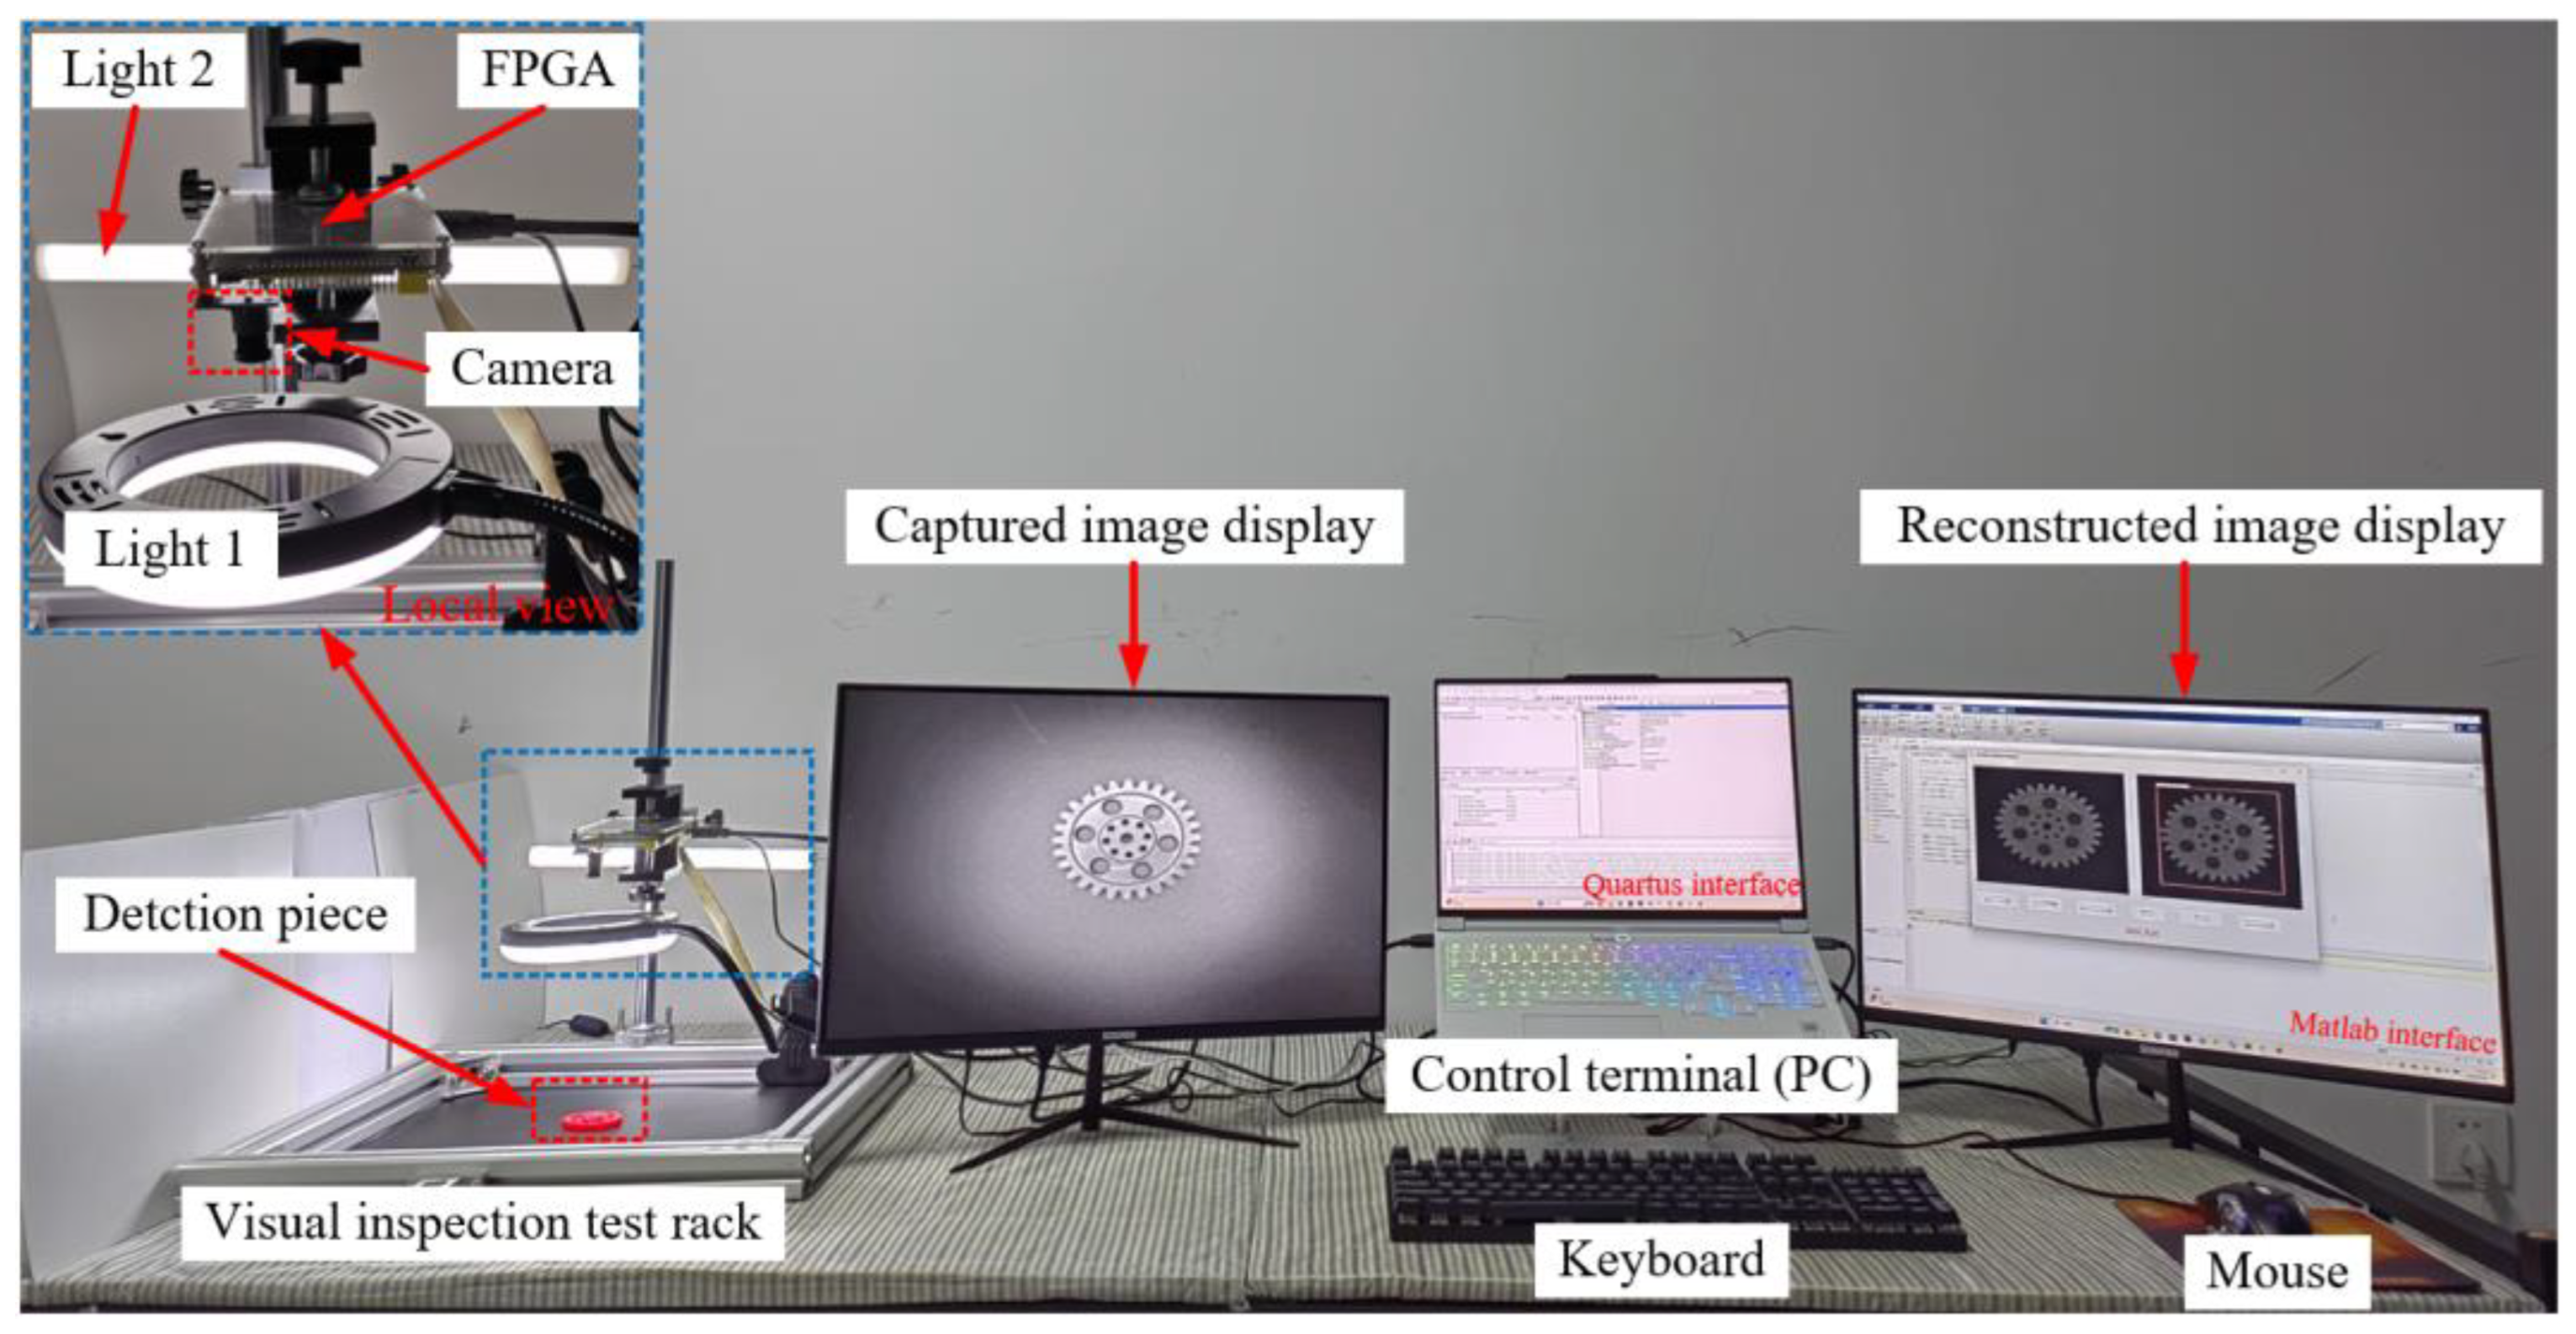
To further validate the practical application and stability of the proposed algorithm, the method is applied to the image preprocessing stage of industrial production workpiece detection. The experimental platform and related equipment are shown in Figure 10, consisting mainly of a control terminal (PC), monitor, Field-Programmable Gate Array (FPGA) development board, light source, and visual inspection frame. The FPGA development board is equipped with an OV5640 camera, which is responsible for capturing experimental images, while the visual inspection frame is used to secure the camera and place the test pieces. The experimental process is as follows: First, the FPGA captures test images and adds Poisson–Gaussian mixed noise, with the results displayed in real-time on the monitor on the left side of Figure 10. The experiment personnel can control the acquisition process through the Quartus software interface. After image acquisition, the data are transferred to MATLAB 2019a for image quality optimization, and the final optimized image is displayed on the monitor on the right side of Figure 10. The control terminal is a PC that manages the entire experiment’s operation and control, running the Windows 11 operating system and equipped with an Intel Core i9-14900HX processor and 32 GB of memory. The software platforms used in the experiment include Quartus and MATLAB.
In actual production, due to harsh production environments, uneven surface lighting, and limited imaging device resolution, the images captured by the imaging equipment have low resolution and blurry detail features, resulting in low accuracy in defect detection before the product is shipped, with occurrences of false positives and false negatives. Therefore, before defect detection, the issue of low image quality must be addressed by improving the image quality. Figure 11 shows the images of workpieces with three different materials and shapes collected during the experiment. It is evident that these images fail to clearly present the detailed features of the workpieces. Figure 12 shows the images obtained after processing the original images using the proposed method for product defect detection. Comparing the processed images with the original images in terms of overall and local visual effects, the buckle detection image after reconstruction exhibits clearer detail features and more prominent edges, effectively highlighting minor product surface defects. The gear detection image processed by the algorithm maintains good edge continuity, especially for small line cracks or burrs on the gear surface, where the algorithm sharpens the edges, aiding in feature localization for defect detection. The circular workpiece detection image shows significantly improved surface texture detail clarity after algorithmic preprocessing, with small pitting defects on the workpiece surface that are well defined, improving the accuracy of surface defect detection. Finally, the reconstructed bolt detection image shows clearer threads, which is beneficial for subsequent thread processing quality detection. Additionally, to verify the stability of the proposed method in processing workpiece detection images with different relative displacements, CCD cameras were used to capture detection images at different frame rates. The relative displacement between images in different frame rate sequences varied significantly, with smaller relative displacements for higher frame rates and larger relative displacements for lower frame rates.
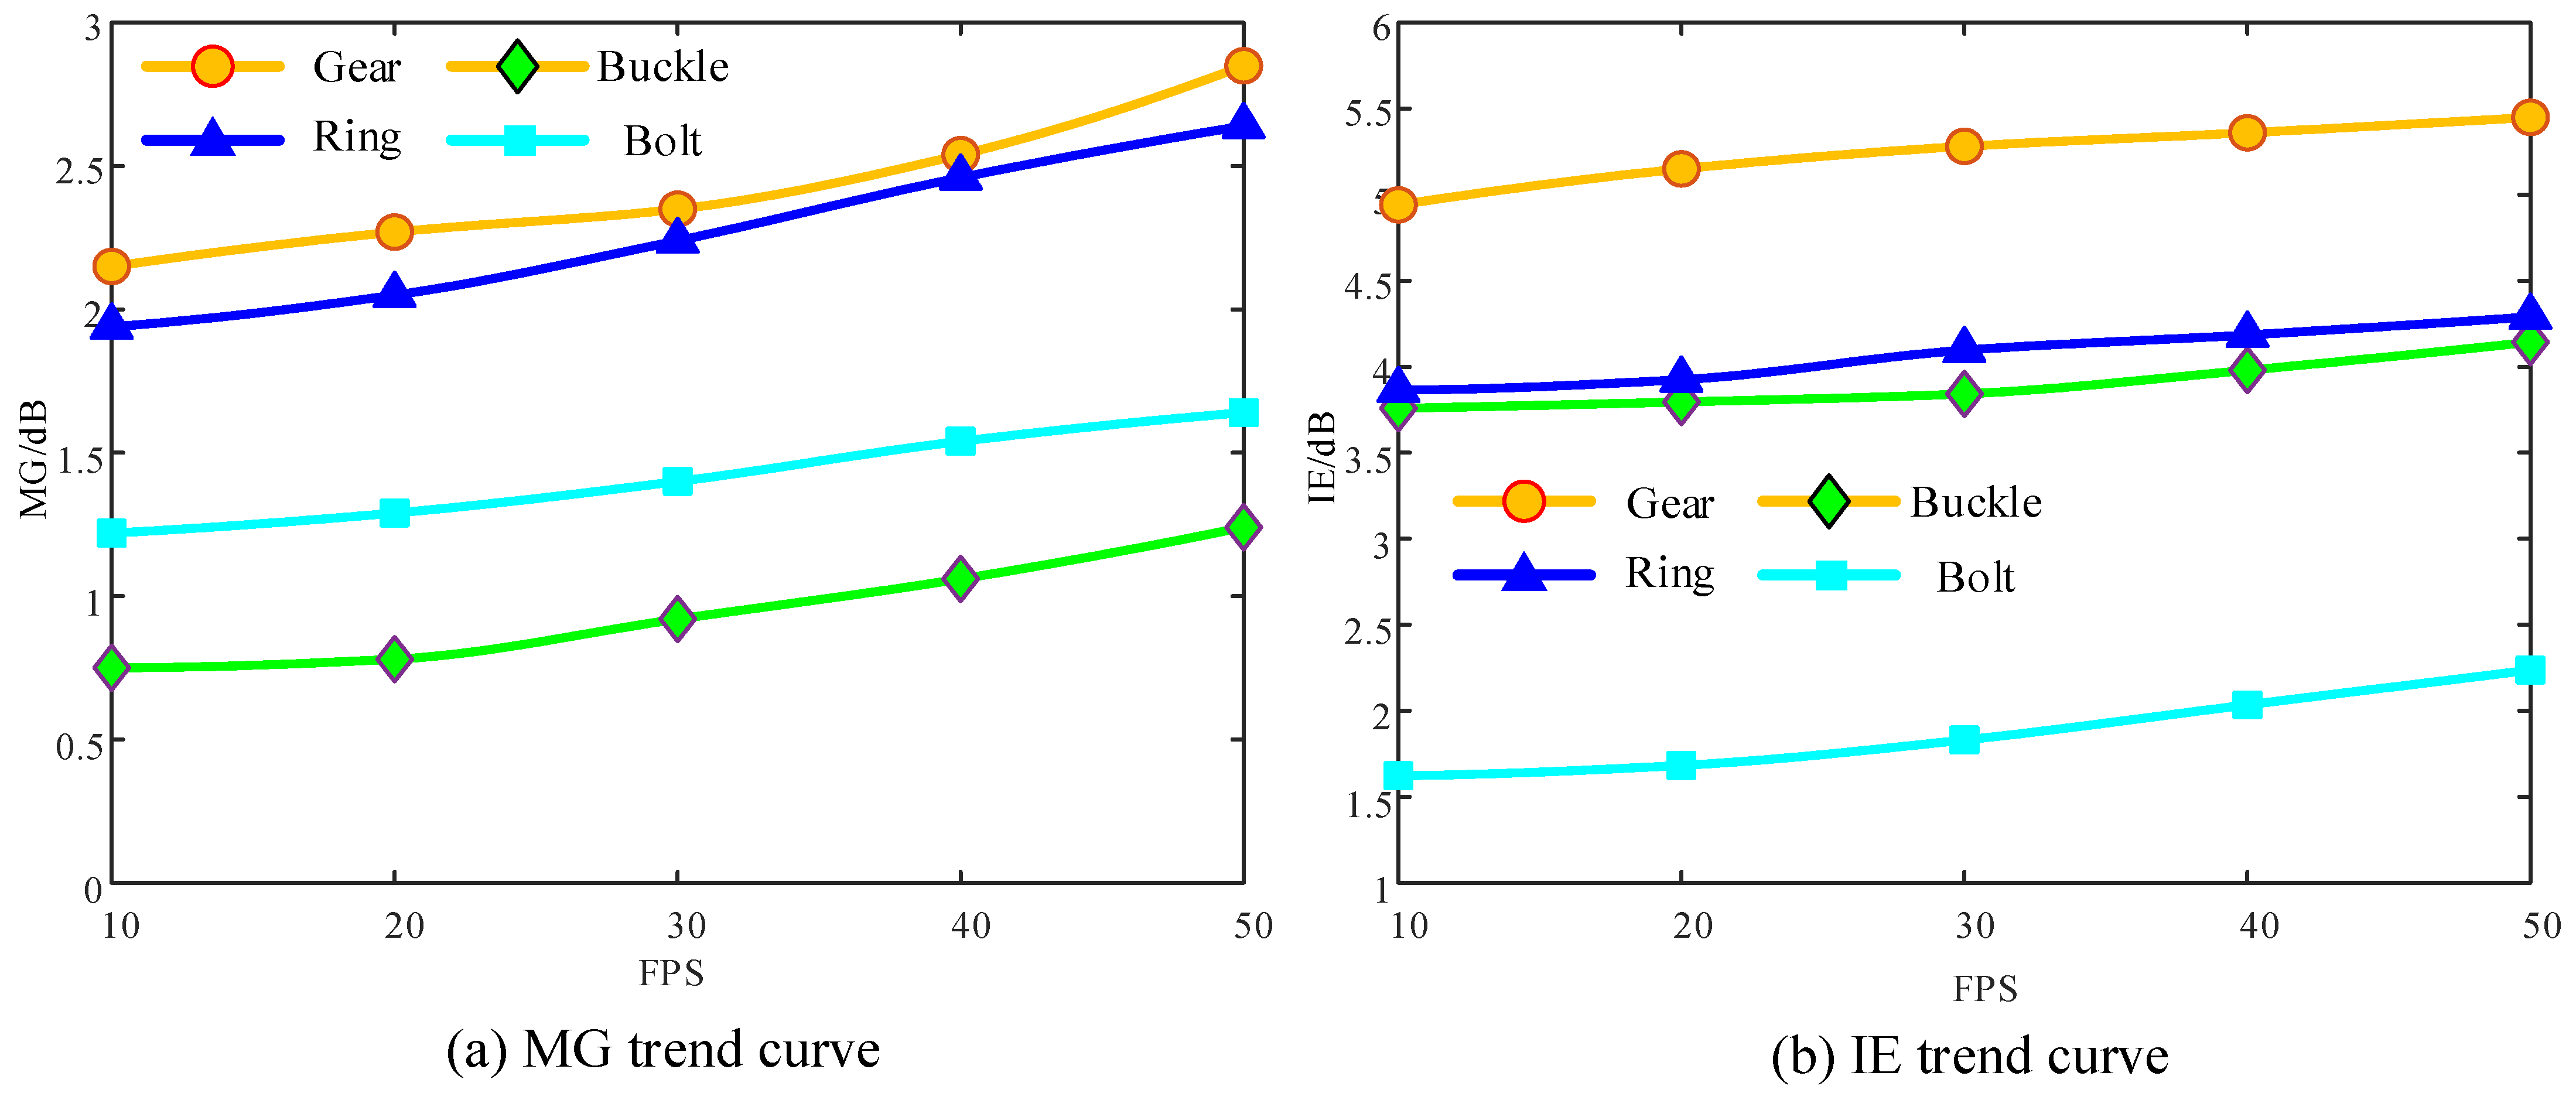
Figure 13 shows the IE and MG trend curve images for different workpiece detection images at frame rates between 10 and 50 FPS.
In terms of IE, the values for different frame rate sequences differ by no more than 0.5 dB. In terms of MG, the difference is no more than 1 dB. Overall, both IE and MG results show a relatively stable state for the images processed with the proposed method, regardless of the displacement. In summary, the application experiment results demonstrate that the proposed method, when applied in actual production, can optimize the quality of workpiece detection images and ensure good processing stability, which is beneficial for subsequent image processing and application.

5. Discussion of the Proposed Method

The adaptive multi-scale object tracking-based part image super-resolution reconstruction method proposed in this paper demonstrates significant advantages in edge detail preservation, feature restoration, and computational efficiency, showing superior performance in multiple experimental scenarios. The experimental results show that this method significantly outperforms existing methods in quantitative metrics such as PSNR and SSIM, with an average PSNR value of 32.03 dB and an average SSIM value of 0.9412. Additionally, in the comparison of IE and MG metrics, the proposed method also exhibits superior detail information extraction capability and gradient retention performance, achieving values of 8.0527 and 7.9444, respectively. These results confirm that the proposed method can achieve high-quality image reconstruction under different motion and displacement conditions, with high stability in processing edge and texture features.
From the analysis of natural image experiments, the method proposed in this paper demonstrates excellent performance in various remote-sensing image reconstruction scenarios. For instance, the proposed method can clearly restore the edge contours of buildings, the structure of airport runways, and the distribution details of port cargo. In contrast, traditional methods such as IBP and POCS encounter issues like artifacts and blurred edges when processing these complex images. Specifically, in the “airport transportation remote sensing image” experiment, the proposed method achieved better edge accuracy, making the reconstructed image visually clearer and more intuitive, providing important support for further analysis of remote-sensing images. Additionally, in the “urban building distribution” experiment, the method successfully restored the texture features of buildings, which is of significant importance for high-resolution image applications in complex environments. Moreover, in the industrial inspection scenario, the proposed method was practically applied and verified through a visual surface quality detection experimental platform. The experiment showed that under different frame rates (10–50 FPS), the fluctuations in the IE and MG indicators of the workpiece detection images processed by the proposed method remained within 0.5 dB and 1 dB, respectively, fully proving the stability and robustness of the method in real-time detection. Furthermore, the results of the workpiece detection experiment indicate that the proposed method effectively restores the fine structure of gear teeth, the details of screw threads, and the integrity of buckle edges, further improving the accuracy of industrial inspection and quality control capabilities.
At the same time, compared to existing methods, the proposed method demonstrates unique advantages and innovations. Consistent with the edge-enhanced network method proposed by EEGAN, the proposed method maintains high accuracy in edge feature extraction while further optimizing the detail restoration performance of edge information. Compared to the traditional edge interpolation method based on edge interpolation proposed by Liu et al. [49], the proposed method overcomes the problem of excessive smoothing in complex edge regions through an adaptive block strategy, achieving superior performance in detail preservation. Moreover, compared to the feature extraction model based on deep learning proposed by Shao et al. [56], the proposed method achieves more efficient reconstruction performance without requiring a learning framework, particularly excelling in resource-limited hardware environments.
Despite its advantages, the proposed method also has certain limitations. First, the experimental data are primarily focused on remote-sensing images and industrial inspection, which limits the method’s general applicability in other complex scenarios. Second, the adaptive block strategy may lead to the loss of local details when handling regions with high texture complexity due to the limitations of block precision. As shown in Table 1, the results for Experiment 3, involving “airport shipping” images, highlight the impact of texture complexity on performance. This type of image contains a significant amount of texture detail, with many regions exhibiting complex textures. In this case, the SSIM value of the proposed method is 0.9084, which is lower than CCRN’s 0.9254 and EEGAN’s 0.9194. This performance drop can be attributed to the adaptive block strategy used in the proposed method. When handling areas with high texture complexity, the block precision is limited, which leads to the loss of local details and a decrease in structural similarity, as measured by SSIM, particularly in complex texture regions. Additionally, compared to deep learning models, the proposed method still requires improvement in terms of speed optimization for large-scale data processing and adaptive capability for specific tasks. To address these limitations, future research could focus on the following optimizations:
(1)
Expanding the diversity of the experimental dataset by incorporating scenarios such as medical imaging and video surveillance to test the generalizability of the method;
(2)
Optimizing the adaptive block algorithm and integrating more feature dimensions to improve the handling capability for complex regions;
(3)
Exploring the combination of the proposed method with deep learning frameworks, such as using Convolutional Neural Networks (CNN) or Transformer models, to further exploit image prior information for achieving higher reconstruction performance and greater applicability.
In summary, the adaptive multi-scale object tracking-based part image super-resolution reconstruction method proposed in this paper has been experimentally validated, demonstrating dual advantages in detail restoration and computational efficiency. It provides an effective technical solution for practical industrial inspection and complex remote-sensing image scenarios. Future research will focus on further optimizing the algorithm structure and exploring its potential in a broader range of application fields.

6. Conclusions

This paper addresses the image quality issues in part image surface defect detection by proposing a part image super-resolution reconstruction method based on adaptive multi-scale object tracking. The method uses an image adaptive block strategy, dynamically segmenting the reconstruction frame based on the similarity, statistical characteristics, and local features of the image blocks. Meanwhile, the optical flow method is employed to accurately estimate the motion parameters between sequence images, effectively improving feature matching accuracy and computational efficiency. Furthermore, the method introduces the concept of correlation filtering target tracking, constructing a feature tracking sampling function algorithm model, successfully solving the information distortion caused by integer pixel-level displacement in sequence part images, and enhancing the accuracy of capturing similar feature information across multiple frames. This significantly improves the quality of part images, providing reliable data support for subsequent surface defect detection. The research results demonstrate that the proposed method exhibits significant advantages in edge detail preservation, texture feature restoration, and computational efficiency. In multiple experimental setups, the proposed method outperforms traditional methods in quantitative metrics such as PSNR and SSIM and demonstrates higher precision in detail evaluations like information entropy and Mean Gradient, further validating its robustness and applicability in complex scenarios. Additionally, in the preprocessing stage of actual industrial workpiece detection images, this method optimizes image quality, highlighting edge features while improving the accuracy and efficiency of subsequent defect detection. Through experimental analysis of detection images with relative displacement sequences under different frame rates, the results show that the method effectively verifies its stability and robustness in processing large displacement multi-frame images.
Despite its advantages, the proposed method still experiences some loss of local details when handling regions with complex textures, and its real-time processing capability for large-scale data needs further optimization. Future research directions include the following: (1) expanding the diversity of the experimental dataset by applying the method to more fields, such as medical imaging, video surveillance, etc., to validate its generalizability; (2) optimizing the adaptive block algorithm to enhance the processing capability for complex texture regions; and (3) combining with deep learning frameworks to further explore image prior information, improving the method’s reconstruction performance and computational efficiency.
In summary, the method proposed in this paper demonstrates significant advantages in edge feature extraction and detail restoration, providing an effective technical solution for part image quality optimization and high-quality reconstruction. It has been validated for its broad application potential in visual inspection and super-resolution reconstruction in complex scenarios.

Author Contributions

Writing—original draft, Formal analysis, Investigation, Y.L.; Data curation, Writing—review and editing, Project administration, L.J.; Formal analysis, Software, Funding acquisition, Supervision, Y.B.; Software, Funding acquisition, Supervision, Z.S.; Conceptualization, D.G. All authors have read and agreed to the published version of the manuscript.

Funding

This work was supported by the Middle-aged and Young Teachers’ (Scientific research) Basic Ability Promotion Project of Guangxi, China, under grant no. 2024KY0362; the Innovation Project of Guangxi Graduate education, China, under grant no. YCSW2024510; the National Natural Science Foundation of China under grant no. 51765007.

Data Availability Statement

Data will be made available upon reasonable request.

Conflicts of Interest

The authors declare no conflicts of interest, including specific financial interests and relationships relevant to the subject of this paper.

References

  1. Vipindas, K.; Mathew, J. Wear Behavior of TiAlN Coated WC Tool during Micro End Milling of Ti-6Al-4V and Analysis of Surface Roughness. Wear 2019, 424–425, 165–182. [Google Scholar]
  2. Sorgato, M.; Bertolini, R.; Bruschi, S. On the Correlation between Surface Quality and Tool Wear in Micro-Milling of Pure Copper. J. Manuf. Process. 2020, 50, 547–560. [Google Scholar] [CrossRef]
  3. Dai, Y.; Zhu, K. A Machine Vision System for Micro-Milling Tool Condition Monitoring. Precis. Eng. 2018, 52, 183–191. [Google Scholar] [CrossRef]
  4. Yuan-Fu, Y. A Deep Learning Model for Identification of Defect Patterns in Semiconductor Wafer Map. In Proceedings of the 2019 30th Annual SEMI Advanced Semiconductor Manufacturing Conference, Saratoga Springs, NY, USA, 6–9 May 2019; pp. 1–6. [Google Scholar]
  5. Li, S.; Zhu, K. In-Situ Tool Wear Area Evaluation in Micro Milling with Considering the Influence of Cutting Force. Mech. Syst. Signal Process. 2021, 161, 107971. [Google Scholar] [CrossRef]
  6. Wang, P.; Bai, Q.; Cheng, K.; Zhang, Y.; Zhao, L.; Ding, H. Investigation on an In-Process Chatter Detection Strategy for Micro-Milling Titanium Alloy Thin-Walled Parts and Its Implementation Perspectives. Mech. Syst. Signal Process. 2023, 183, 109617. [Google Scholar] [CrossRef]
  7. Wen, G.; Gao, Z.; Cai, Q.; Wang, Y.; Mei, S. A Novel Method Based on Deep Convolutional Neural Networks for Wafer Semiconductor Surface Defect Inspection. IEEE Trans. Instrum. Meas. 2020, 69, 9668–9680. [Google Scholar] [CrossRef]
  8. Nguyen, D.T.; Mun, S.; Park, H.; Jeong, U.; Kim, G.; Lee, S.; Jun, C.-S.; Sung, M.M.; Kim, D. Super-Resolution Fluorescence Imaging for Semiconductor Nanoscale Metrology and Inspection. Nano Lett. 2022, 22, 10080–10087. [Google Scholar] [CrossRef]
  9. Gui, J.; Cong, X.; Cao, Y.; Ren, W.; Zhang, J.; Zhang, J.; Cao, J.; Tao, D. A Comprehensive Survey and Taxonomy on Single Image Dehazing Based on Deep Learning. arXiv 2021, arXiv:2106.03323. [Google Scholar] [CrossRef]
  10. Zhang, K.; Ren, W.; Luo, W.; Lai, W.-S.; Stenger, B.; Yang, M.-H.; Li, H. Deep Image Deblurring: A Survey. Int. J. Comput. Vis. 2022, 130, 2103–2130. [Google Scholar] [CrossRef]
  11. Lepcha, D.C.; Goyal, B.; Dogra, A.; Goyal, V. Image Super-Resolution: A Comprehensive Review, Recent Trends, Challenges and Applications. Inf. Fusion 2023, 91, 230–260. [Google Scholar] [CrossRef]
  12. Yi, W.; Dong, L.; Liu, M.; Hui, M.; Kong, L.; Zhao, Y. Frequency-Guidance Collaborative Triple-Branch Network for Single Image Dehazing. Displays 2023, 80, 102577. [Google Scholar] [CrossRef]
  13. Xu, R.; Hao, R.; Huang, B. Efficient Surface Defect Detection Using Self-Supervised Learning Strategy and Segmentation Network. Adv. Eng. Inform. 2022, 52, 101566. [Google Scholar] [CrossRef]
  14. Jiang, K.; Liu, H.; Chang, Y. Small Modulus Injection Gear Size Inspection Method Based on Super Resolution. IEEE Sens. J. 2024, 24, 18646–18658. [Google Scholar] [CrossRef]
  15. Cuka, B.; Cho, M.; Kim, D.-W. Vision-Based Surface Roughness Evaluation System for End Milling. Int. J. Comput. Integr. Manuf. 2018, 31, 727–738. [Google Scholar] [CrossRef]
  16. Ambadekar, P.; Choudhari, C. Application of Gabor Filter for Monitoring Wear of Single Point Cutting Tool. In Communications in Computer and Information Science; Springer: Singapore, 2019; pp. 230–239. [Google Scholar]
  17. Lins, R.G.; de Araujo, P.R.M.; Corazzim, M. In-Process Machine Vision Monitoring of Tool Wear for Cyber-Physical Production Systems. Robot. Comput. Integr. Manuf. 2020, 61, 101859. [Google Scholar] [CrossRef]
  18. Lins, R.G.; Guerreiro, B.; Marques de Araujo, P.R.; Schmitt, R. In-Process Tool Wear Measurement System Based on Image Analysis for CNC Drilling Machines. IEEE Trans. Instrum. Meas. 2020, 69, 5579–5588. [Google Scholar] [CrossRef]
  19. Wang, G.; Chen, M.; Lin, Y.C.; Tan, X.; Zhang, C.; Yao, W.; Gao, B.; Li, K.; Li, Z.; Zeng, W. Efficient Multi-Branch Dynamic Fusion Network for Super-Resolution of Industrial Component Image. Displays 2024, 82, 102633. [Google Scholar] [CrossRef]
  20. Wang, P.; Bayram, B.; Sertel, E. A Comprehensive Review on Deep Learning Based Remote Sensing Image Super-Resolution Methods. Earth-Sci. Rev. 2022, 232, 104110. [Google Scholar] [CrossRef]
  21. Zhang, Y.; Fan, Q.; Bao, F.; Liu, Y.; Zhang, C. Single-Image Super-Resolution Based on Rational Fractal Interpolation. IEEE Trans. Image Process. 2018, 27, 3782–3797. [Google Scholar] [CrossRef]
  22. Zhang, Y.; Wang, P.; Bao, F.; Yao, X.; Zhang, C.; Lin, H. A Single-Image Super-Resolution Method Based on Progressive-Iterative Approximation. IEEE Trans. Multimed. 2020, 22, 1407–1422. [Google Scholar] [CrossRef]
  23. Song, G.; Qin, C.; Zhang, K.; Yao, X.; Bao, F.; Zhang, Y. Adaptive Interpolation Scheme for Image Magnification Based on Local Fractal Analysis. IEEE Access 2020, 8, 34326–34338. [Google Scholar] [CrossRef]
  24. Xue, J.; Zhao, Y.-Q.; Bu, Y.; Liao, W.; Chan, J.C.-W.; Philips, W. Spatial-Spectral Structured Sparse Low-Rank Representation for Hyperspectral Image Super-Resolution. IEEE Trans. Image Process. 2021, 30, 3084–3097. [Google Scholar] [CrossRef] [PubMed]
  25. Li, Z.; Liu, Y.; Chen, X.; Cai, H.; Gu, J.; Qiao, Y.; Dong, C. Blueprint Separable Residual Network for Efficient Image Super-Resolution. In Proceedings of the 2022 IEEE/CVF Conference on Computer Vision and Pattern Recognition Workshops, New Orleans, LA, USA, 21–24 June 2022; pp. 832–842. [Google Scholar]
  26. Park, S.H.; Moon, Y.S.; Cho, N.I. Perception-Oriented Single Image Super-Resolution Using Optimal Objective Estimation. In Proceedings of the 2023 IEEE/CVF Conference on Computer Vision and Pattern Recognition, Vancouver, ON, Canada, 18–22 June 2023; pp. 1725–1735. [Google Scholar]
  27. Li, Y.; Yang, H.; Xie, D.; Dreizin, D.; Zhou, F.; Wang, Z. POCS-Augmented CycleGAN for MR Image Reconstruction. Appl. Sci. 2021, 12, 114. [Google Scholar] [CrossRef]
  28. Chen, J.; Guo, S.; Deng, J.; Yang, M.; Shen, F. Video Super Resolution Based on Motion Compensation. In Proceedings of the 2021 International Conference on Computer Information Science and Artificial Intelligence, Beijing, China, 27–28 March 2021; pp. 704–707. [Google Scholar]
  29. Marti, G.; Ma, B.; Loeliger, H.-A. Why Maximum-A-Posteriori Blind Image Deblurring Works After All. In Proceedings of the 2021 29th European Signal Processing Conference, Dublin, Ireland, 13–27 August 2021; pp. 666–670. [Google Scholar]
  30. Zeng, X.; Yang, L. A Robust Multiframe Super-Resolution Algorithm Based on Half-Quadratic Estimation with Modified BTV Regularization. Digit. Signal Process. 2013, 23, 98–109. [Google Scholar] [CrossRef]
  31. Lu, J.; Zhang, H.; Sun, Y. Video Super Resolution Based on Non-Local Regularization and Reliable Motion Estimation. Signal Process. Image Commun. 2014, 29, 514–529. [Google Scholar] [CrossRef]
  32. Li, Y.; Ogawa, K.; Iwamoto, Y.; Chen, Y. Novel Image Restoration Method Based on Multi-frame Super-resolution for Atmospherically Distorted Images. IET Image Process. 2020, 14, 168–175. [Google Scholar] [CrossRef]
  33. Sun, Y.; Mao, X.; Hong, S.; Xu, W.; Gui, G. Template Matching-Based Method for Intelligent Invoice Information Identification. IEEE Access 2019, 7, 28392–28401. [Google Scholar] [CrossRef]
  34. Tubishat, M.; Idris, N.; Shuib, L.; Abushariah, M.A.M.; Mirjalili, S. Improved Salp Swarm Algorithm Based on Opposition Based Learning and Novel Local Search Algorithm for Feature Selection. Expert Syst. Appl. 2020, 145, 113122. [Google Scholar] [CrossRef]
  35. Wang, Q.; Wang, S.; Chen, M.; Zhu, Y. A Multiscale Aligned Video Super-Resolution Network for Improving Vibration Signal Measurement Accuracy. IEEE Trans. Instrum. Meas. 2023, 72, 1–12. [Google Scholar] [CrossRef]
  36. Chen, J.; Li, Y.; Cao, L. Research on Region Selection Super Resolution Restoration Algorithm Based on Infrared Micro-Scanning Optical Imaging Model. Sci. Rep. 2021, 11, 2852. [Google Scholar] [CrossRef]
  37. Cui, H.; Cao, J.; Hao, Q.; Zhou, D.; Zhang, H.; Lin, L.; Zhang, Y. Improving the Quality of Panoramic Ghost Imaging via Rotation and Scaling Invariances. Opt. Laser Technol. 2023, 160, 109102. [Google Scholar] [CrossRef]
  38. Gui, C.; Wang, D.; Huang, X.; Wu, C.; Chen, X.; Huang, H. Super-Resolution and Wide-Field-of-View Imaging Based on Large-Angle Deflection with Risley Prisms. Sensors 2023, 23, 1793. [Google Scholar] [CrossRef] [PubMed]
  39. Liang, K.; Wang, B.; Zuo, C. Super-Resolution Imaging Based on Circular Coded Aperture. In Computational Imaging VII; SPIE: Bellingham, WA, USA, 2023; Volume 12523, pp. 95–99. [Google Scholar]
  40. Jiang, K.; Wang, Z.; Yi, P.; Wang, G.; Lu, T.; Jiang, J. Edge-Enhanced GAN for Remote Sensing Image Super-resolution. IEEE Trans. Geosci. Remote Sens. 2019, 57, 5799–5812. [Google Scholar] [CrossRef]
  41. Wang, Y.; Bashir, S.M.A.; Khan, M.; Ullah, Q.; Wang, R.; Song, Y.; Guo, Z.; Niu, Y. Remote Sensing Image Super-Resolution and Object Detection: Benchmark and State of the Art. Expert Syst. Appl. 2022, 197, 116793. [Google Scholar] [CrossRef]
  42. Wang, Y.; Shao, Z.; Lu, T.; Wu, C.; Wang, J. Remote Sensing Image Super-Resolution via Multiscale Enhancement Network. IEEE Geosci. Remote Sens. Lett. 2023, 20, 1–5. [Google Scholar] [CrossRef]
  43. Zhang, Y.; Liu, P.; Zhao, X. Structural Displacement Monitoring Based on Mask Regions with Convolutional Neural Network. Constr. Build. Mater. 2021, 267, 120923. [Google Scholar] [CrossRef]
  44. Fang, J.; Lin, H.; Chen, X.; Zeng, K. A Hybrid Network of CNN and Transformer for Lightweight Image Super-Resolution. In Proceedings of the 2022 IEEE/CVF Conference on Computer Vision and Pattern Recognition Workshops, New Orleans, LA, USA, 21–24 June 2022; pp. 1102–1111. [Google Scholar]
  45. Lu, Z.; Li, J.; Liu, H.; Huang, C.; Zhang, L.; Zeng, T. Transformer for Single Image Super-Resolution. arXiv 2021, arXiv:2108.11084. [Google Scholar]
  46. Jiang, L.; Zhang, T.; Lei, W.; Zhuang, K.; Li, Y. A New Convolutional Dual-Channel Transformer Network with Time Window Concatenation for Remaining Useful Life Prediction of Rolling Bearings. Adv. Eng. Inform. 2023, 56, 101966. [Google Scholar] [CrossRef]
  47. Shang, H.; Sun, C.; Liu, J.; Chen, X.; Yan, R. Defect-Aware Transformer Network for Intelligent Visual Surface Defect Detection. Adv. Eng. Inform. 2023, 55, 101882. [Google Scholar] [CrossRef]
  48. Wang, H.; Li, J.; Wu, H.; Hovy, E.; Sun, Y. Pre-Trained Language Models and Their Applications. Engineering 2023, 25, 51–65. [Google Scholar] [CrossRef]
  49. Liu, Y.; Hu, L.; Sun, B.; Ma, C.; Shen, J.; Chen, C. A Novel Multiscale Residual Aggregation Network-Based Image Super-Resolution Algorithm for Semiconductor Defect Inspection. IEEE Trans. Semicond. Manuf. 2024, 37, 93–102. [Google Scholar] [CrossRef]
  50. Li, S.; Ling, Z.; Zhu, K. Image Super Resolution by Double Dictionary Learning and Its Application to Tool Wear Monitoring in Micro Milling. Mech. Syst. Signal Process. 2024, 206, 110917. [Google Scholar] [CrossRef]
  51. He, Q.; Wang, S.; Liu, T.; Liu, C.; Liu, X. Enhancing Measurement Precision for Rotor Vibration Displacement via a Progressive Video Super Resolution Network. IEEE Trans. Instrum. Meas. 2024, 73, 1–13. [Google Scholar] [CrossRef]
  52. Dai, G.; He, Z.; Sun, H. Ultrasonic Block Compressed Sensing Imaging Reconstruction Algorithm Based on Wavelet Sparse Representation. Curr. Med. Imaging Rev. 2020, 16, 262–272. [Google Scholar] [CrossRef]
  53. Zhang, Y.; Chen, X.; Zeng, C.; Gao, K.; Li, S. Compressed Imaging Reconstruction Based on Block Compressed Sensing with Conjugate Gradient Smoothed L0 Norm. Sensors 2023, 23, 4870. [Google Scholar] [CrossRef]
  54. Lee, S.; Lee, M.; Kang, M. Poisson–Gaussian Noise Analysis and Estimation for Low-Dose X-Ray Images in the NSCT Domain. Sensors 2020, 18, 1019. [Google Scholar] [CrossRef]
  55. Li, Y.; Liu, J.; Jiang, Y.; Liu, Y.; Lei, B. Virtual Adversarial Training-Based Deep Feature Aggregation Network from Dynamic Effective Connectivity for MCI Identification. IEEE Trans. Med. Imaging 2022, 41, 237–251. [Google Scholar] [CrossRef] [PubMed]
  56. Shao, Z.; Wang, L.; Wang, Z.; Deng, J. Remote Sensing Image Super-Resolution Using Sparse Representation and Coupled Sparse Autoencoder. IEEE J. Sel. Top. Appl. Earth Obs. Remote Sens. 2019, 12, 2663–2674. [Google Scholar] [CrossRef]
  57. Ma, S.; Zhao, Z.; Pu, L.; Hou, Z.; Zhang, L.; Zhao, X. Learning Discriminative Correlation Filters via Saliency-Aware Channel Selection for Robust Visual Object Tracking. J. Real-Time Image Process. 2023, 20, 51. [Google Scholar] [CrossRef]
  58. Hu, W.-M.; Wang, Q.; Gao, J.; Li, B.; Maybank, S. DCFNet: Discriminant Correlation Filters Network for Visual Tracking. J. Comput. Sci. Technol. 2024, 39, 691–714. [Google Scholar] [CrossRef]
  59. Al-Qudah, S.; Yang, M. Large Displacement Detection Using Improved Lucas–Kanade Optical Flow. Sensors 2023, 23, 3152. [Google Scholar] [CrossRef] [PubMed]
  60. Vardakas, G.; Likas, A. Global K-Means++: An Effective Relaxation of the Global k-Means Clustering Algorithm. Appl. Intell. 2024, 54, 8876–8888. [Google Scholar] [CrossRef]
  61. Song, J.; Liu, H.; Zhang, C. Medical Image Super Resolution Reconstruction Based on Adaptive Patch Clustering. Comput. Sci. 2016, 43, 210–214. [Google Scholar]
Figure 1. Basic flowchart of the part image super-resolution reconstruction method based on adaptive multi-scale object tracking.
Processes 13 02563 g001
Figure 2. Theoretical and actual distribution curves of image information.
Processes 13 02563 g002
Figure 3. The flowchart of the adaptive similarity block segmentation process for the reconstruction frame image.
Processes 13 02563 g003
Figure 4. Adaptive block segmentation results of the test image. (a) Original image, (b) results of block segmentation.
Processes 13 02563 g004
Figure 5. The sequence images used in the experiment, with a resolution of 5.5 m (from top to bottom, the image types are satellite observations of urban building distribution, port transportation, airport shipping, and urban traffic).
Processes 13 02563 g005
Figure 6. Experiment 1—Comparison of reconstruction results for urban building distribution type images using different algorithms.
Processes 13 02563 g006
Figure 7. Experiment 2—Comparison of reconstruction results for port transportation type images using different algorithms.
Processes 13 02563 g007
Figure 8. Experiment 3—Comparison of reconstruction results for airport shipping type images using different algorithms.
Processes 13 02563 g008
Figure 9. Experiment 4—Comparison of reconstruction results for urban traffic type images using different algorithms.
Processes 13 02563 g009
Figure 10. Visual inspection experimental platform utilizing FPGA for image acquisition.
Processes 13 02563 g010
Figure 11. Overall and local features of original images for detecting different workpieces.
Processes 13 02563 g011
Figure 12. Overall and local features of original images for detecting different workpieces.
Processes 13 02563 g012
Figure 13. MG and IE trend charts of reconstruction results of sequence component detection images at different frame rates.
Processes 13 02563 g013
Table 1. Comparison of PSNR and SSIM after image processing using different algorithms.
ExperimentPSNR and SSIMBicubicIBPPOCSSRGANEEGANCCRNProposed
Experiment 1PSNR25.9827.8927.3428.5432.0331.2231.35
SSIM0.71950.77810.75840.87680.92260.89020.9318
Experiment 2PSNR18.9220.6721.5419.9724.1022.6726.81
SSIM0.82980.83130.81190.92840.91130.90250.9563
Experiment 3PSNR27.1228.7629.8528.1631.7029.9233.02
SSIM0.77230.82130.87020.86470.91940.92540.9084
Experiment 4PSNR25.5226.8727.1126.5330.1328.8033.56
SSIM0.85140.84880.86790.88240.92910.88640.9682
AveragePSNR24.3626.0526.4625.8029.4928.1531.19
SSIM0.7933 0.8199 0.8271 0.8881 0.9206 0.9011 0.9412
Note: The bold font in the table indicates the algorithm that achieved the highest PSNR or SSIM value.
Table 2. Comparison of IE and MG after image processing using different algorithms.
ExperimentIE and MGBicubicIBPPOCSSRGANEEGANCCRNProposed
Experiment 1IE6.56596.80406.79936.81216.83436.81646.8575
MG2.33363.10682.84563.92614.23253.79054.9629
Experiment 2IE6.05076.33116.34446.20946.40836.23726.4697
MG4.62945.23164.91434.95007.97865.50688.2337
Experiment 3IE6.88397.12807.14337.31127.84277.56067.8944
MG3.03483.61313.63353.68394.81894.22175.1048
Experiment 4IE6.81007.25527.30347.66497.90897.82347.9448
MG4.55895.45454.97675.76176.53896.09327.1444
AverageIE6.57766.87966.89766.99947.24867.10947.2916
MG3.63924.35154.09254.58045.89224.90306.3615
Note: The bold font in the table indicates the algorithm that achieved the highest IE or MG value.
Disclaimer/Publisher’s Note: The statements, opinions and data contained in all publications are solely those of the individual author(s) and contributor(s) and not of MDPI and/or the editor(s). MDPI and/or the editor(s) disclaim responsibility for any injury to people or property resulting from any ideas, methods, instructions or products referred to in the content.