Abstract
This paper presents a novel risk-based maintenance (RBM) approach for the development of a structured maintenance strategy for the power-generating (PG) unit at the gas plant of the Sirte Oil Company (SOC). The proposed approach comprises three key aspects: estimated risk (ER), risk evaluation (RV), and maintenance planning (MP). To identify and prioritize critical components, the methodology integrates fault tree analysis (FTA) with Monte Carlo simulations, enabling the probabilistic modeling of failure scenarios and the accurate quantification of risk. High-pressure (HP) water systems were selected as a case study due to their significant role and failure consequences within the PG unit. Through this RBM methodology, risk levels—based on the probability of failure (PoF) and consequence of failure (CoF)—were quantified, and maintenance tasks were rescheduled to target the most vulnerable components. The results demonstrate that implementing the RBM strategy reduced unplanned shutdowns and optimized uptime, achieving 348 operational days per year, compared to the baseline 365-day mean time to failure (MTTF) cycle (reduction in downtime of around 4.65%). This translated into a measurable improvement in system reliability and operational efficiency. The approach is especially applicable to processing units operating under harsh conditions, offering a preventive tool for the reduction of risk exposure and improvements in asset performance.
1. Introduction
Over the past 50 years, maintenance strategies have undergone a radical change from a necessary evil into a total engagement system to achieve the organization’s main targets. All chemical processing facilities consist of complex systems due to multiple different pieces of equipment that run under harsh operational conditions. The risk of a processing plant can be mitigated via several approaches. The reliability of a system is one of the most important approaches used in determining the probability of risk. An increase in the reliability of equipment can be achieved through continuous inspection and scheduling maintenance activities in order to ensure oil and gas productivity, which faces high risks due to the handling of hazardous materials under harsh operating conditions. To achieve safety and effectiveness in any processing plant, it is necessary to reduce the possibility of unscheduled failures. This can be achieved through effective maintenance activities involving risk assessment and reliability aspects [1].
Recent years have witnessed vital progress in the development of maintenance strategies, from traditional breakdown maintenance to more sophisticated strategies such as maintenance based on condition monitoring and maintenance based on the reliability of the system.
The major challenge for a maintenance engineer is to implement a maintenance strategy that increases the availability and efficiency of the equipment, avoids equipment deterioration, ensures safe and environmentally friendly operation, and reduces the total cost of the operation. Thomas and Weiss [2] report that, according to an annual survey of manufacturers in 2016, United States manufacturers spent USD 50 billion on maintenance and repair for both machinery and building maintenance, representing a significant part of the total operation costs.
In the twentieth century, the American Society of Mechanical Engineers considered performance criteria to improve tool safety and minimize the frequency of unexpected failures. In addition, the repair of static equipment (vessels, safety valves, and piping pieces) is considered. Finally, the importance of risk estimation is associated with the probability (PoF) and consequence of failure (CoF). It focuses on using significant tools to measure and analyze system safety in order to determine the estimated risk. Risk analysis is performed according to three stages, namely design, normal operation (material defect, inspection, and maintenance), and the wear-out stage, as shown in Figure 1.
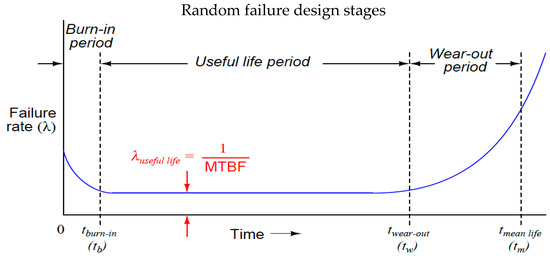
Figure 1.
The life cycle of equipment.
The risk is typically estimated in terms of economic and human losses resulting from the toxic effects of materials on humans and the environment and the effects of fire on equipment and structures per cycle. The estimation of the factor probability value is based on many influencing variables, including the availability, maintainability, and reliability of the system and human factors [3].
The American Society of Mechanical Engineers (ASME) standard considers the protection of equipment that runs continuously under harsh conditions. It presents a risk-based criterion reflecting a safety zone that prevents practitioners from incurring personal injuries related to toxic materials’ effects and the blast effects on equipment and the surrounding environment due to equipment failures [4]. Protection processes usually focus on two factors: the PoF and the CoF. The PoF and CoF can be used for any equipment based on the failure rate, seeking to protect practitioners when using complex equipment, especially when located in chemical zones or in the presence of suppression or other hazards. In addition, the ASME provides risk criteria to protect against hazards associated with personnel. However, API 691, related to risk-based machinery management, also provides criteria to estimate risks in terms of economic and environmental consequences due to facility failures [5]. Therefore, the occurrence probability of failure should be estimated either qualitatively or quantitatively. Similarly, the severity of the CoF should be considered in terms of each category of consequences. According to the standards of the American Petroleum Institute (API) and the ASME, the estimation of the probable risk can be broken down into six stages considering equipment/components that can present a threat to the assets and environment of the plant:
- (1)
- The identification of risk based on the pressure parameter;
- (2)
- The estimation of the risk level;
- (3)
- The identification of risk criteria for each component based on the severity index;
- (4)
- The application of risk assessment for N&O indicators without/with a safety system;
- (5)
- The selection of a safety system if the risk indicator is tolerable; and
- (6)
- Repeating the above stages.
Table 1 shows a 4 × 4 risk matrix that defines the risk level using a scale of one to four for the PoF (1, 2, 3, 4) and the severity of the CoF (N, O, C, D). A risk level ≥ L indicates a tolerable risk.

Table 1.
Risk matrix of PoF and CoF [4].
Most plants that run under harsh operating conditions are focused on risk-based inspection (RBI) techniques due to the complex processes associated with static equipment, since this type of equipment requires higher safety and reliability [2]. Therefore, the approach of RBI was developed to define risk criteria related to tolerable and estimated risks.
In the RBI approach, high-risk equipment is inspected with greater attention than equipment exposed to low risks. In addition, RBI is one of the most used approaches related to risk assessment programs for static equipment; however, it considers not only the assessment of static equipment risks but also takes rotating equipment into account. It also includes economic and environmental factors that may represent a threat to any unit or equipment. However, the application of the RBM approach to rotating equipment needs to be considered in terms of critical rotating equipment that uses the components as a series system. Any failure in any component or equipment can lead to the total breakdown of the processing plant [6].
Most previous studies have elaborated on the importance of applying RBI to solve problems associated with higher-risk static equipment. In addition, others have focused on RBM based on the maintenance schedule, according to the recommendations of the original equipment manufacturer, without taking critical equipment into consideration. Regarding the PG unit at the gas plant (SOC), maintenance management faces significant challenges due to the aging of the components of the PG unit. Reliance on manufacturer recommendations has proven ineffective in many cases, as these do not account for actual operational conditions or component wear caused by harsh environments or extended operating hours. Two questions often faced by maintenance management are (i) which critical components present a high risk? and (ii) what is the estimated MTTF?
Consequently, the novelty of this study consists of the integration of the RBM approach with FTA in order to determine and arrange critical equipment within the turnaround maintenance list and to schedule the maintenance intervals of their activities, as opposed to applying the intervals of the original equipment manufacturer.
The proposed RBM approach aims at improving maintenance functions and maintaining a high level of reliability among rotating machines. Based on the probable failure modes, it can estimate the risk level and schedule maintenance activities for each failure component in order to reduce threats to the operational condition and stability of the unit and avoid any failure that may represent a high risk when the unit operates under normal conditions. The study aims to determine the interval of maintenance based on the critical components of the PG unit. This is achieved via three steps:
- (i)
- The construction and description of the RBM approach;
- (ii)
- A case study according to the critical components of the gas plant at the Sirte Oil Company;
- (iii)
- The validation of the study based on the records of maintenance activities for critical components at the SOC and other facilities that run under harsh operational conditions.
2. The Risk-Based Maintenance (RBM) Approach
The RBM approach aims at mitigating the total risk that may pose catastrophic effects due to the unexpected failure of operating units [7]. Assessing the risk indicator of the unit resulting from the failure of each component enables one to prioritize critical maintenance activities for all components of the system. RBM can be defined as a strategy that aims to prioritize maintenance activities to mitigate probable risks to critical components and high-risk systems before they cause a failure, which may impact the environment and the safety of industrial operations. This means that high risk levels will be given greater emphasis than low risk levels based on the RBM approach. Moreover, RBM can be considered a tool to estimate the interval between two consecutive maintenance activities for any equipment or unit, seeking to mitigate the overall risk caused by the occurrence of a failure. RBM can also present a set of recommendations for a preventive maintenance strategy, as shown in the second stage in Figure 2. The quantitative assessment of risk is the basis for prioritizing maintenance activities. Based on the risk criteria, the estimated risk is compared against the acceptance risk for each failure scenario associated with the equipment or components. If the estimated risk exceeds the acceptable risk, this failure scenario can be considered an optimal maintenance interval, and it is necessary to minimize the exceeded risk to the acceptable zone. These scenarios can be repeated for each piece of equipment. The obtained results regarding the PG unit should be included to optimize maintenance events for the overall system. All details for each stage of the RBM approach are described below. A MATLAB software version (R2022b) (The MathWorks, Inc., Natick, MA, USA) is used to carry out the calculations procedure. The RBM approach can be broken down into three stages, as shown in Figure 2.
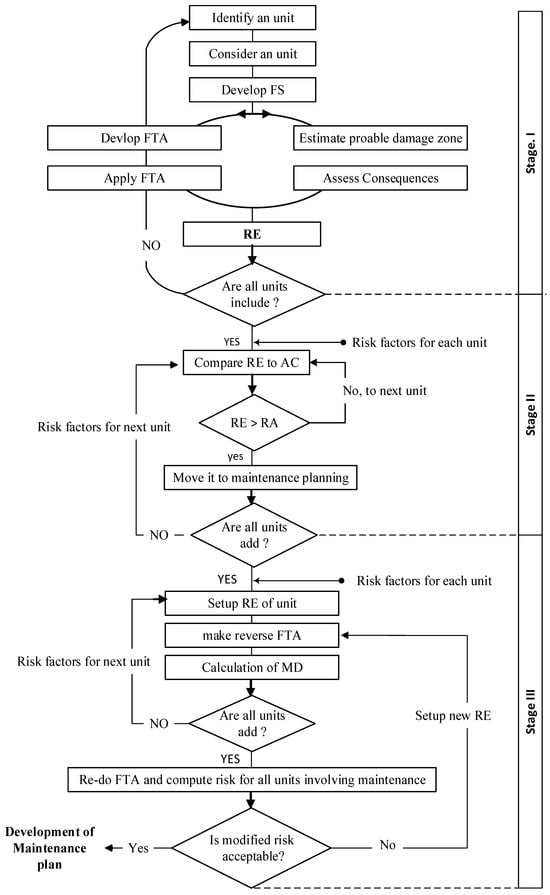
Figure 2.
Stages of the RBM approach.
- ▪
- Stage 1: Estimated Risk (ER)
This stage can be divided into four categories, as shown in Figure 2. Each category is described below, where the risk of the system is estimated according to Equation (1):
- -
- Category 1.1: Development of Failure Scenarios (FSs)
An FS is a series of events that cause a failure. These series may include a single event or a combination of sequential events. It is obvious from previous case studies that a failure appears as a result of an interactive sequence of events. Therefore, a scenario does not signify that a failure will occur, but it may indicate that there is a strong probability of occurrence. A scenario is also not represented by a specific status or event but is a description of a typical status that can be expressed by a set of potential events or statuses.
Risk assessment assists practitioners in indicating sources of failure in order to select the most critical approaches and appropriate means for preventing and mitigating the possibility of its occurrence. Failure scenarios are estimated based on the operational condition of the system, the characteristics of the process under which the operation takes place, the configuration of the process, and safety plans. The RBM approach focuses on the collection of failure data, which include the consequences and likelihoods of failures in maintenance activities. Thus, many probabilistic risk assessment techniques, such as fault tree analysis, event tree analysis, and reliability-centered maintenance, rely heavily on historical data, failure data, and probabilities [8]. RBM, along with reliability-centered maintenance approaches, is among the most well-known maintenance strategies, especially in critical sectors that operate under harsh conditions, such as oil and gas and aviation [9,10]. In addition, Esa and Muhammad [11] suggested an RBM framework for naval vessels based on prescriptive analytics. Abbassi et al. [12] also discussed how RBM and predictive maintenance can be integrated. Makua [13] used condition-based and predictive maintenance as new strategies in an RBM approach for wind turbine systems. Zhang et al. [14] presented a guideline to optimize reliability and maintenance for pipeline systems using reinforcement learning algorithms and the Markov modeling framework in order to demonstrate the utility of reinforcement learning in reliability and maintenance applications.
The applicability of the proposed methodology is demonstrated in a semi-automated cutting and crimping machine as a case study demonstrating the use of RBM. Masud et al. [15] studied the RBM approach based on the development of FTA. Their study covered critical subsystems in many sewerage pumping stations in Australia, seeking to mitigate the risk of failure and enhance the implementation of RBM. Mohammad and Pirouzmand [16] described the effectiveness of maintenance activities using RBM, considering aging effects using a Markov model of maintenance and then coupling this model to FTA in order to upgrade from the component level to the system level, focusing on two safety systems in the VVER-1000/V446 nuclear power plants. The results showed that the RBM tool was accurate in determining the technical specifications of real maintenance for a nuclear power plant from a risk point of view. Khan and Haddara [7] proposed a systematic model to determine the maximum credible unexpected failure scenario to assess FSs at any processing plant that runs under harsh conditions. According to the recommendations of the American Petroleum Institute and the American Society of Mechanical Engineers, the maximum credible scenarios should be considered, rather than the worst-case scenarios of risk. The development of FSs can be based on assessment indicators, serving to minimize undesired effects without impacting the reliability of the system. It may be advisable to take one or two of the most suitable FSs into consideration for each level to achieve the most credible risk scenario.
Table 2 presents a systematic review of some previous studies related to RBM approaches, highlighting gaps in order to provide a basis for the maintenance plan for the PG unit.
Table 2.
Summary of previous studies on RBM approach.
The majority of previous studies associated with applying RBM focus on the failure of equipment (system), without considering the critical components outside the shaded area, as shown in Figure 3. Therefore, this study focuses on critical components outside the shaded area, which may represent a threat to the system.
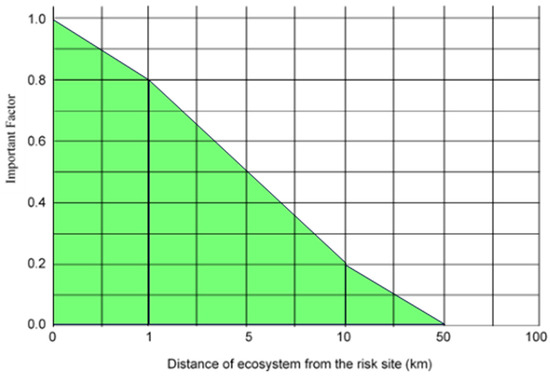
Figure 3.
Quantification of importance factor, adapted from [7].
- -
- Category 1.2. Consequence of Risk (CoR)
This category aims at prioritizing equipment/components based on their contributions, including risk factors resulting from pressure containment or a leak in any processing line, which may lead to partial production losses. Moreover, any failure in a relief valve may cause the total shutdown of the plant due to the need to replace the valves with a standby. CoR analysis involves the assessment of the probable consequences of the materialization of an FS. Firstly, the CoR measures the radius of the surrounding zone of the risk in which injuries and unit deterioration may occur. Secondly, it determines the likely damage to assets in terms of the effects on the buildings, structures, and units of the plant. Finally, the CoR also contributes to determining the toxic effects of materials on humans and is used to predict the human response to different levels of exposure to toxic chemicals. The damage area is calculated to estimate the risk effects on employees, profit margins, environmental deterioration, and fires and blasts on other assets. The calculation of the CoR involves a set of mathematical tools and analyses, such as WHAZAN and RISKIT [19], in order to predict hazardous materials and their evaporation rates, as well as the effects of explosions and fires on buildings and structures. The CoR can be classified into four major types, as given below.
- -
- System Damage (SD)
SD is associated with the failure of the system or compound. This can be estimated using the following equation:
- -
- Financial Loss (FL)
FL reflects the damage for each scenario associated with asset losses. This can be expressed with the following relation:
- -
- Human Loss (HL)
HL reflects the losses in terms of human health for each risk scenario using the following equation:
Note: The radius = 500 m. If the employees as a population are uniformly distributed in the risk zone, the factor is assigned a value of [0.2 of 1]; when the employees are situated away from the point that is affected by the risk, a different value is assigned. The value of human health differs from one site to another, according to the extent of the risk and the nature of the work.
- -
- Environmental Damage (ED)
ED reflects ecosystem damage and is calculated using the following equation:
Figure 3 shows that the importance factor value can be considered unity when the diagonal length of the damage zone is greater than the distance between the risk point and the ecosystem location. This means that any component outside the shaded area is considered a critical component in the red zone and should be taken under study.
- -
- Category 1.3: Probabilistic Failure Analysis(PFA)
PFA is conducted using fault tree analysis (FTA). FTA is one of the tools that is used in failure analysis, using deductive reasoning to identify undesired events at any component of a system based on the failure and success logic. In this category of RBM, FTA involves several basic events to construct the top event scenario. FTA is performed using analytical simulation in order achieve a PFA [19]. The main procedures are as follows.
- (a)
- Development of Fault Tree Analysis (FTA):
The top event is determined according to information related to the process sequences, control arrangement, and behavior of components for any equipment or unit, seeking to develop the logical dependency among the failure causes that can lead to the top event.
- (b)
- Creation of Boolean Matrix (BM):
In order to develop FTA, firstly, transformation into a BM is required. Secondly, if the size of the BM is too large, this indicates that the structural stage technique should be applied.
- (c)
- Identification and Optimization of Minimum Cut Sets (MCSs):
The MCSs are identified from the Boolean matrix [17]. In the first step, each stage is solved individually. In the second step, the results are combined. Then, the MCSs are optimized using the appropriate model in order to eliminate unimportant paths.
- (d)
- Probability Analysis (PA):
Many tools can be used to optimize minimum cut sets. The Monte Carlo simulation method is one of the tools used to estimate probabilities [18]. The fuzzy probability set is considered as one of the theories used in the analytical simulation [19].
- (e)
- Estimation of Improvement Index (MI):
The MI is a measure of the effect on the final failure event for each root cause. The improvement indicators can be estimated according to the simulation results. To determine the impact of the root cause, it is necessary to conduct the simulation twice, with and without the cause, to identify an appropriate scale that can change the probability of occurrence of the final event.
- -
- Category 1.4: Risk Estimation (RE)
Based on the results of the PoF and CoF analyses, the risk is determined for each unit. The CoF analysis covers the factors associated with fatalities, economic losses, environmental damage, and system performance unreliability. Therefore, the estimated risk can be evaluated against the acceptable risk in the next stage.
- ▪
- Stage II: Risk Evaluation (RV)
This RBM stage aims at evaluating the predetermined risk to determine whether the RE of each FS is accepted or not, as shown in Figure 2. This stage can be broken down into two categories, as detailed below.
- -
- Category 1. Acceptable Risk (RA)
This category aims to identify the acceptable risk (RA) to apply in the current criteria related to the indicator of acceptable risk based on the nature and type of the work.
- -
- Category 2. Risk Comparison to Acceptable Risk (RA)
This category aims to apply the RA to the RE for each component of the system. When the RE exceeds the RA of each component, this means that the RE of this component should be taken into account to reduce its risk and develop a maintenance plan.
- ▪
- Stage III: Maintenance Planning (MP)
The level of RE for components that exceed the RA is taken into consideration to schedule maintenance plans and mitigate the risk level. The details are given below.
- -
- Category 1. Estimation of Mean Time to Failure (MTTF)
This category is aimed at identifying failure causes in order to determine which ones may adversely affect the PoF. Then, a reverse fault analysis can be conducted in order to estimate the PoF for any root event and complete the maintenance plan (Figure 4).
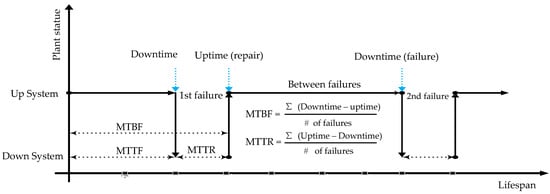
Figure 4.
Estimation of MTTF.
- -
- Category 2. Verification of the System Level (VSL)
This category aims at the verification of the maintenance plan, ensuring that it poses no threat to operational stability, based on the RA level of the system.
3. Case Study: Application of RBM to a Power-Generating (PG) Unit
A case study is presented to demonstrate the use of the abovementioned approach in scheduling maintenance plans. The case study focuses on a power-generating unit related to an operating steam power plant, which converts the potential chemical energy of fuel into electrical energy. In brief, this unit can be classified into a boiler and a turbine driving an electrical generator. The data used in this case were obtained from a power station at the Sirte Oil Company (SOC). The present case study deals with the analysis of a power-generating unit and develops a maintenance plan in order to provide efficient and failure-free operation. The RBM of the power-generating unit can be applied according to the following processes.
3.1. Failure Scenarios (FSs)
This study focuses on a shutdown analysis based on the failure scenarios of the PG unit, which has a rated capacity of 150 MW. The PG unit consists of equipment such as pumps, soot blowers, feed water heaters, and valves. Table 3 shows the units and equipment of the plant in terms of their logical classification. Failure data for equipment were obtained based on the maintenance records of the power plant. Failure models such as the Weibull and exponential distributions were applied based on the shape and scale parameters. Additional details of the names and types of equipment in the PG unit can be found in [20].
Table 3.
Classification of power-generating (PG) unit.
3.2. Estimated Risk (RE)
The RE is associated with the operational risk for any processing unit. It can be expressed as in the following mathematical equation [2]:
REunit = PoFunit × ∑CoF ($)
3.3. PoF Analysis
The PoF can be estimated based on the failure analysis of the PG unit, serving to determine the parameters required in order to identify the type of distribution that should be applied for the equipment/components. Each piece of equipment has two scenarios, and each scenario has success logic and failure logic. This study uses one parameter (λ) for the exponential distribution and two parameters (ϕ) and (δ) for the Weibull distribution, as given in Equation (7).
where i = 1, 2, …, n of equipment.
The three parameters, failure rate (λ), shape (ϕ) and scale (δ) are estimated for the different components as shown in Table 3.
3.4. CoF Analysis
CoF analysis is conducted to envisage failure scenarios for each equipment unit. This study focuses on system performance, financial and human losses, and environmental damage to determine the CoF using four factors, which are combined as given in Equation (8):
Table 4 shows the results associated with the analysis of the envisaged failure scenarios for several equipment pieces.
Table 4.
CoF analysis of the generator and HP water.
4. Development of Fault Tree Analysis (FTA) for PG Unit
The essential component of FTA is the translation of the failure behavior of a complex system into a structured logic diagram (a fault tree—FT) to determine specific causes that lead to undesired events. The FTA was constructed with many components. A total of 53 FTs were developed and analyzed [19]. Figure 5 describes the FT for an event associated with a direct failure in the power generator unit. Each basic event in the FT (with a total of 14 basic events) subsequently extends to one or more FTs and analyses. The results of the analysis indicate the probability of occurrence of basic failure events.
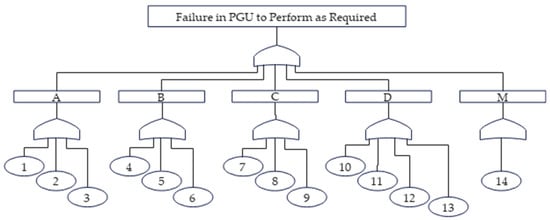
Figure 5.
FT of failures for PG unit.
Upon arriving at the top event probability using FTA, the failure probabilities for the basic events were determined based on the failure data obtained from the physical plant or estimated either from reliable data banks [21] or from the operating expert of the system. Moreover, the FT of the PG unit requires the estimation of the PoFs that occur in the equipment of the PG unit, as given in Figure 5.
The most common failures in the PG unit are illustrated in Table 3 according to four main causes:
- A.
- Starting boiler;
- B.
- Generating power;
- C.
- Supplying water; and
- D.
- Generating steam.
These failures may cause undesired events at the unit level. The FTA of a PG unit is an indispensable diagnostic tool that is used to reveal the probable reasons for these events resulting from undesirable failures and to describe possible paths due to extreme operating conditions in this unit. Based on OREDA 2002 [22] and the maintenance records, it was possible to determine the failure rate (Pi) based on the failure mode for each piece of equipment in the PG unit, as shown in Table 5.
Table 5.
Failure modes of PG unit [13].
Minimum Cut Set (MCS) of PG Unit
The fault tree analysis (FTA) is constructed using a top-down deductive approach, beginning with a defined top-level failure (e.g., equipment shutdown or catastrophic failure) (Figure 6). Contributing events are identified using historical data and expert judgment. Logical gates (AND/OR) are used to map dependencies. The MCS includes ten critical components of the PG unit.
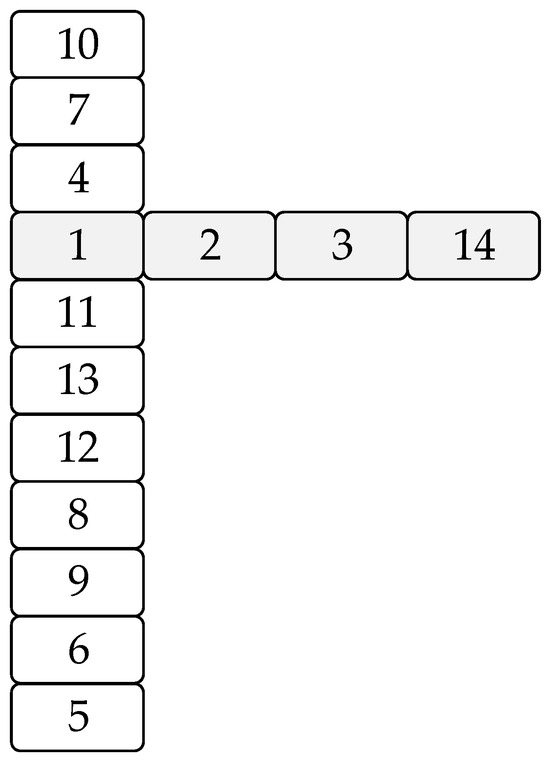
Figure 6.
Minimum cut set (MCS) priority.
Ten critical components of the PG unit were captured, and the main indicators to determine the mean time to failure (MTTF) of the unit are shown in Figure 7: 10/7/4/11/13/12/8/9/6/5.
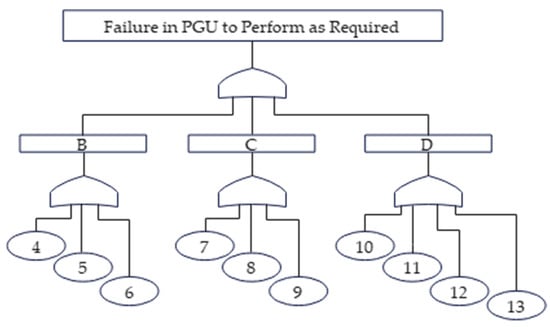
Figure 7.
Fault tree of critical failure for PG unit.
5. Results and Discussion
The failure rate (λ) associated with the exponential model, and the shape (ϕ) and scale (δ) parameters associated with the Weibull model of the PG unit, as shown in Equation (6), are estimated according to the failure behavior of the component (n). These parameters are identified according to failure data listed in maintenance records (PG unit—gas plant of SOC). Thus, these parameters are considered reasonable assumptions to identify the appropriate model in order to determine the PoF for each component of the PG unit, as shown in Table 6.
Table 6.
Parameters of the MCS components.
The RE criterion was determined according to the PoF and CoF for the PG unit (e.g., at 10 MCS, we found values of 0.3985 and USD 172,000 for the PoF and CoF, respectively) and compared against the acceptable risk criterion (RA) identified by the company. Note that all processing companies have their own RA criteria, which depend on several aspects, such as the operating conditions, geographical environment, and economic aspects.
The risk index (RI) should be taken into account to start shutdown for any unit in order to execute maintenance activities based on the critical components that present extreme risks. Therefore, harnessing RE/RA knowledge becomes a core competency to avoid any threat that may exceed 1.0.
For the Generator:
Therefore, the maintenance plan of the generator must be executed at 288 days to avoid any threat associated with the oil seal system.
For the HP water:
Thus, .
This means that maintenance for the HP water should be scheduled every 348 days. For this equipment, any operating period of more than 348 days may result in a threat to the boiler feed pumps, water pumps, or both. Therefore, the operating time of the HP water should not exceed 348 days in order to avoid any failure that may occur in the short term. Table 7 shows the PoF and CoF values used to identify the risk estimate (RE) and risk index (RI) for each component of the PG unit. Based on the RI, four components were found to violate the risk criterion: MCS numbers 8, 5, 4, and 6.
Table 7.
PoF and CoF results.
The RI of the PG unit was significant due to its value in terms of the insights that it provided. This reflected a broader trend toward components 4, 5, 6, and 8.
Failure data were obtained from the organization’s maintenance logs and the original equipment manufacturer (OEM) Guide. The data were cleaned to remove inconsistencies and normalized for analysis. The MTTF was calculated using exponential and Weibull distribution fitting for each MCS. Table 8 shows the results, listed as maintenance intervals and associated with the uptime of the unit. This can be expressed as the mean time to failure (MTTF). Any RI exceeding 1.0 would lead to serious consequences that may affect the assets of the company. Based on the RI, any component that presents a high risk should be included in the T/A program to avoid entering the red zone, as shown in Table 1. Therefore, MCS numbers 8, 5, 4, and 6 should undergo turnaround maintenance (T/A) every 8353, 6921, 1750, and 8050 h, respectively. Other components can undergo noncritical maintenance activities.
Table 8.
MTTF for critical equipment of PG unit.
In addition, the annual availability level of MCS 8 must be 95.3% in order to enhance the reliability of the component to 82.50% and reduce downtime, and maintenance should be performed every 17 days, as compared to the maintenance duration of the HP water system located in the gas plant at the SOC. This illustrates that any decrease in the duration of maintenance (MTTR) would reduce the cost of maintenance based on RBM. In addition, according to the real-world validation of the results of the PG unit of the SCO, RBM reduces the risk by 4.65%, 21%, 80%, and 8.1% annually for the HP water, generator, steam turbine, and turbine, respectively.
6. Conclusions
This paper presents an approach to developing a maintenance plan. The development of the maintenance plan reflects the broader trend toward RBM, where PG unit components are no longer maintained solely based on the recommendations of the manufacturer but according to the critical faults of components. Maintenance is prioritized based on critical components that are identified using FTA. In this approach, the MTTF is also considered, which includes the effects of failures and their consequences, seeking to reduce them. In order to determine the MTTF, data are collected for components that would be maintained at the same time, and the RI must be more than 1.0 to avoid any serious consequences that may occur due to a delay in maintenance activities for the whole plant/unit. This means that some pieces of equipment, such as MCSs 8, 5, and 6, are critical components and should be maintained at a certain time to reduce downtime and to justify the planned maintenance policy. In this study, the HP water was one of the critical components that had an unacceptable risk (the RI exceeded 1.0) due to failures that stemmed from seal damage and worn bearings. This causes clogged drains, reduced flow, and the overheating of the system. Thus, it should be subjected to T/A maintenance activities every 348 operating hours to avoid entering the high-risk zone, which may threaten the assets of the company. The use of RBM resulted in a risk decrease of 4.65% for the PG unit of the SOC based on the HP water.
With this approach, the T/A maintenance activities of the system can be executed according to the critical component that presents the highest RI. Moreover, the PG unit should undergo maintenance every 290 days to avoid the unanticipated consequences of failures between operation periods, especially when there is a high risk. The results of the development of the maintenance plan were validated against records of maintenance activities for the HP water in the gas plant at the SOC, which scheduled maintenance once every year based on the predetermined costs. Thus, the use of a suitable RBM approach can yield important results for decision making and ensure the safe and effective operation of the plant and enhance the reliability of the system. The presented risk-based maintenance approach demonstrated effectiveness in identifying critical components and optimizing the interval and duration of maintenance for the PG unit at the SOC, which operates in a high-risk industrial environment and under harsh conditions. However, several directions for future research and development are suggested.
- Integration with AI for dynamic PoF updates
The methodology should be tested across a wider range of industrial environments—particularly those operating under harsh or variable conditions, such as offshore platforms—to validate its generalizability and robustness.
- 2.
- Integration with real-time monitoring systems
Incorporating real-time sensor data and condition monitoring (e.g., vibration analysis, thermal imaging, or oil analysis) could enhance the accuracy of PoF and CoF estimates, enabling dynamic risk assessment and predictive maintenance scheduling.
- 3.
- Integration with multi-criteria optimization
It is necessary to incorporate cost–benefit analysis and multi-objective optimization (e.g., minimizing downtime, risk, and cost simultaneously) to better support strategic maintenance decision making under resource constraints.
By pursuing these directions, the RBM methodology can be strengthened and adapted for more comprehensive, cost-effective, and risk-aware maintenance planning in a variety of industrial settings.
Author Contributions
Methodology, A.E. and I.M.M.; validation, A.E.; formal analysis, S.A. and I.M.M.; investigation, A.E. and S.A.; resources, A.E.; writing—original draft, A.E. and S.A.; writing—review and editing, I.M.M. All authors have read and agreed to the published version of the manuscript.
Funding
This research received no external funding.
Data Availability Statement
The original contributions presented in this study are included in the article. Further inquiries can be directed to the corresponding author.
Conflicts of Interest
The authors declare no conflict of interest.
References
- Elwerfalli, A.; Khan, M.K.; Munive-Hernandez, J.E. Developing Turnaround Maintenance (TAM) Model to Optimise TAM scheduling for Gas Plants Based on Critical Static Equipment (CSE) of GAS plants. Int. J. Ind. Eng. Oper. Manag. 2019, 1, 12–31. [Google Scholar]
- Thomas, T.; Weiss, R. The Costs and Benefits of Advanced Maintenance in Manufacturing; NIST AMS 100-18; National Institute of Standards and Technology: Gaithersburg, MD, USA, 2018. [Google Scholar]
- Brown, S.; May, I. Risk-based hazardous release prevention by inspection and maintenance. J. Press. Vessel Technol. 2000, 122, 362–367. [Google Scholar] [CrossRef]
- American Society of Mechanical Engineers (ASME). American Society of Mechanical Engineers Code Committee SC6000. In Hazardous Release Protection; ASME: New York, NY, USA, 2000. [Google Scholar]
- American Petroleum Institute (API). Risk-Based Machinery Management, Recommended Practice 691, 1st ed.; NW: Washington, DC, USA, 2017. [Google Scholar]
- Apeland, S.; Aven, T. Risk based maintenance optimization: Foundation issues. Reliab. Eng. Syst. Saf. 2000, 67, 285–292. [Google Scholar] [CrossRef]
- Khan, F.; Haddara, M. Risk-Based Maintenance (RBM): A quantitative approach for maintenance/inspection scheduling and planning. J. Loss Prev. Process Ind. 2003, 16, 561–573. [Google Scholar] [CrossRef]
- Yazdi, M.; Nedjati, A.; Abbassi, R. Fuzzy dynamic risk-based maintenance investment optimization for offshore process facilities. J. Loss Prev. Process Ind. 2019, 57, 194–207. [Google Scholar] [CrossRef]
- Khalifa, M.; Khan, F.; Thorp, J. Risk-based maintenance and remaining life assessment for gas turbines. J. Qual. Maint. Eng. 2015, 21, 100–111. [Google Scholar] [CrossRef]
- Kim, D.; Lee, Y.; Jae Lee, M. Development of Risk-Based Bridge Maintenance Prioritization Methodology. KSCE J. Civ. Eng. 2018, 22, 3718–3725. [Google Scholar] [CrossRef]
- Esa, M.A.M.; Muhammad, M. Adoption of prescriptive analytics for naval vessels risk-based maintenance: A conceptual framework. Ocean. Eng. 2023, 278, 114409. [Google Scholar]
- Abbassi, R.; Arzaghi, E.; Yazdi, M.; Aryai, V.; Garaniya, V.; Rahnamayiezekavat, P. Risk-based and predictive maintenance planning of engineering infrastructure: Existing quantitative techniques and future directions. Process Saf. Environ. 2022, 165, 776–790. [Google Scholar] [CrossRef]
- Makua, U. Risk-based Maintenance and Smart Maintenance Concept for Offshore Wind Turbine: A Study of a Reference Wind Turbine Model. Master’s Thesis, University of Stavanger, Stavanger, Norway, 2021. [Google Scholar]
- Zhang, Q.; Liu, Y.; Xiang, Y.; Xiahou, T. Reinforcement Learning in Reliability and Maintenance Optimization: A Tutorial. Reliab. Eng. Syst. Saf. 2024, 251, 110401. [Google Scholar] [CrossRef]
- Masud, M.F.; Chattopadhyay, G.; Gunawan, I. Development of a Risk-Based Maintenance (RBM) Strategy for Sewerage Pumping Station Network. In Proceedings of the IEEE International Conference on Industrial Engineering and Engineering Management (IEEM), Macao, China, 15–18 December 2019; pp. 455–458. [Google Scholar]
- Mohammad, H.; Pirouzmand, A. Multi-state risk-based maintenance analysis of redundant safety systems using the Markov model and fault tree method. Front. Energy Res. 2021, 9, 685634. [Google Scholar]
- Shafaghi, A. Structure modelling of process systems for risk and reliability analysis. In Engineering Risk and Hazard Assessment; Kandel, A., Avni, E., Eds.; CRC Press Inc: Boca Raton, FL, USA, 1988; Volume 2, pp. 45–64. [Google Scholar]
- Rauzy, A. New algorithms for FTA. Reliab. Eng. Syst. Saf. 1993, 40, 203–211. [Google Scholar] [CrossRef]
- Khan, F.; Abbasi, S. Analytical simulation and PROFAT II: A new methodology and a computer automated tool for fault tree analysis in chemical process industries. J. Hazard. Mater. 2000, 75, 1–27. [Google Scholar] [CrossRef] [PubMed]
- Loganathan, K. The Implementation of a Risk Based Maintenance Policy to a Power Plant. Master’s Thesis, Memorial University, St John’s, NL, Canada, 2004. [Google Scholar]
- Reliability Analysis Center (RAC). Non-Electric Components Reliability Data; Centre for Reliability Assessment: New York, NY, USA, 2002. [Google Scholar]
- SINTEF Industrial Management. Offshore Reliability Data Handbook; OREDA Participants: Hovik, Norway, 2002. [Google Scholar]
Disclaimer/Publisher’s Note: The statements, opinions and data contained in all publications are solely those of the individual author(s) and contributor(s) and not of MDPI and/or the editor(s). MDPI and/or the editor(s) disclaim responsibility for any injury to people or property resulting from any ideas, methods, instructions or products referred to in the content. |
© 2025 by the authors. Licensee MDPI, Basel, Switzerland. This article is an open access article distributed under the terms and conditions of the Creative Commons Attribution (CC BY) license (https://creativecommons.org/licenses/by/4.0/).