Article

Ultrasound-Assisted Extraction Processes of Benzopyrans from Hypericum polyanthemum: COSMO-RS Prediction and Mass Transfer Modeling

by
Victor Mateus Juchem Salerno
1,
Gabriela de Carvalho Meirelles
2,
Henrique Martins Tavares
1,
Victor Hugo Silva Rodrigues
1,
Eduardo Cassel
1,
Gilsane Lino von Poser
2 and
Rubem Mário Figueiró Vargas
1,*
1
Laboratório de Operações Unitárias, Escola Politécnica, Pontifícia Universidade Católica do Rio Grande do Sul, Porto Alegre 90619-900, RS, Brazil
2
Programa de Pós-Graduação em Ciências Farmacêuticas, Universidade Federal do Rio Grande do Sul, Porto Alegre 90010-150, RS, Brazil
*
Author to whom correspondence should be addressed.
Processes 2025, 13(8), 2351; https://doi.org/10.3390/pr13082351
Submission received: 4 June 2025 / Revised: 3 July 2025 / Accepted: 21 July 2025 / Published: 24 July 2025
(This article belongs to the Special Issue Phase Equilibrium in Chemical Processes: Experiments and Modeling)

Abstract

Efficient and sustainable extraction of bioactive benzopyrans from Hypericum polyanthemum Klotzsch ex Reichardt (Hypericaceae) remains underexplored, despite their potential applications. The current study aimed to optimize this process by integrating computational simulation and experimental extraction with suitable solvents. The COSMO-RS model was employed to screen deep eutectic solvents (DESs), indicating lactic acid/glycine/water 3:1:3 (DES 1) as a highly promising candidate based on activity coefficients at infinite dilution for target benzopyrans (HP1, HP2, HP3). Ultrasound-assisted extraction (UAE) was then conducted using the proposed DES as well as hexane, and the extracts were analyzed via high-performance liquid chromatography (HPLC) and spectrophotometry for total phenolic content (TPC). The results for DES 1 showed yields for benzopyrans HP1 (1.43 ± 0.09 mg/g plant) and HP2 (0.55 ± 0.04 mg/g plant) close to those obtained in the hexane extract (1.65 and 0.78 mg/g plant, respectively), corroborating the use of COSMO-RS for solvent screening. Kinetic analysis using an adapted Crank diffusion model successfully described the mass transfer process for DES 1 (R2 > 0.98, mean average percent error < 9%), indicating diffusion control and allowing estimation of effective diffusion coefficients. This work confirms COSMO-RS as a valuable tool for solvent selection and demonstrates that UAE with the identified DES provides an efficient, greener approach for extracting valuable benzopyrans, offering a foundation for further process optimization.

1. Introduction

In recent years, several studies have been developed to analyze the biological properties of Brazilian Hypericum species. Previous investigations have highlighted the tendency of species within this genus to accumulate phenolic compounds. Among the most prominent bioactive metabolites identified in Hypericum species are naphthodianthrones [1], xanthones [2], flavonoids [3,4], and phloroglucinol derivatives [5,6,7], with benzopyrans [8,9,10] and benzophenones [11,12] being reported less frequently.
Benzopyrans are a group of natural products that occur in plants and have shown biological properties, such as antioxidant, insecticidal, and antimicrobial activities [13,14,15]. Benzopyrans are generally lipophilic compounds that can be extracted using solvents such as hexane, cyclohexane, dichloromethane, and chloroform, among others. The benzopyrans isolated from the aerial parts of H. polyanthemum have been extracted through maceration with the solvents mentioned above or with supercritical fluid [16,17,18,19]. Investigation carried out with the benzopyrans identified as 6-isobutyryl-5,7-dimethoxy-2,2-dimethylbenzopyran (HP1), 7-hydroxy-6-isobutyryl-5-methoxy2,2-dimethylbenzopyran (HP2), and 5-hydroxy6-isobutyryl-7-methoxy-2,2-dimethylbenzopyran (HP3) [20] revealed a series of bioactivities such as monoamine oxidase inhibition (MAOI), antibacterial, and antiproliferative activities [16]. Specifically, benzopyran HP1 exhibited antinociceptive activity in mice, an effect that appears to be mediated, at least in part, by an opioid-like mechanism [17].
The processes for recovering molecules of interest from plant material involve the use of appropriate extraction techniques and suitable solvents for the target compounds. Furthermore, the destination of the extract must be considered. Currently, there is also a demand in society for processes that meet the principles of green chemistry [21]. In this sense, extraction with deep eutectic solvents (DESs) has been explored because it allows extraction with suitable solvents for pharmaceutical and nutraceutical purposes [22]. In addition, environmental aspects, operation in low-temperature conditions, and safety are respected when extraction with a DES is performed [23].
Industrial processes for extracting compounds from plant raw materials depend on operating conditions such as temperature, pressure, particle size, and fluid flow rate, as well as the interaction between the solvent and the compounds to be extracted. Thus, predicting these molecular interactions, which can be performed based on knowledge of the activity coefficient and surface interactions of species [24], becomes an important step in designing the extraction process. To this end, the COSMO-RS, a quantum chemistry-based method model, has been successfully applied to determine the thermodynamic properties of various liquid mixtures, including deep eutectic solvents [25,26,27]. In this study, the extraction of benzopyrans from the aerial parts of H. polyanthemum was performed using the DES recommended from the evaluation of l n γ i determined via COSMO-RS. This approach has been explored before [27,28,29] and allows for selection of the best solvent (lowest l n γ i ) within a group of options to extract the target compounds, reducing experimental efforts and costs required by purely experimental extraction methodologies, without the aid of predictive tools. Examples of COSMO-RS solvent screening for extractions from plant material, such as hydroxytyrosol from olive leaves [29], fucoxanthin from the alga Tisochrysis lutea [30], and artemisinin from Artemisia annua L. [31], can be found elsewhere.
Another important aspect of process design is its mathematical simulation in order to represent its performance. Models involving mass transfer and thermodynamics are often necessary at this stage [32,33]. For DES extraction, the process consists of a batch solid–liquid extraction operation. Some models have been used to describe the mass transfer between the phases in this configuration for different types of extraction operations [34]. In a study to predict the kinetics of extraction using natural deep eutectic solvents, Lanjekar [35] applied a two-site kinetic model, which considers the extraction process as occurring in two distinct stages: an initial fast desorption phase, often referred to as the washing stage, characterized by the dissolution of easily accessible soluble compounds located on the surface of the plant matrix, followed by a slower desorption phase, associated with the diffusion-driven mass transfer of solutes or target compounds from within the intact plant particles into the solvent. Other authors have also employed models based on desorption kinetics concepts to improve existing models, such as the second-order kinetic model [36]. There are other models, such as first-order kinetics, second-order kinetics, power law, or Peleg’s model, which were also used to represent extraction with DESs [37,38].
The analysis of the proposed models, in summary, includes evaluating the resistance to mass transport in the solid and liquid phases in the mass transfer model and considering thermodynamic modeling at the interface. More recently, a mass transfer model based on Fick’s second law was applied to model ultrasound assisted extraction with natural deep eutectic solvents of flavonoids from Hippophae rhamnoides and estimated the effective diffusion coefficient at different temperatures of extraction [39].
For these substances of interest, extraction techniques aim to obtain high yields relative to them. The operating conditions and the type of extraction and solvent are decisive for this objective. In this context, the use of deep eutectic solvents and conventional organic solvents will be investigated in this work, based on the estimation of the solubility of HP1, HP2, and HP3 molecules in the different solvents via COSMO-RS. No computational prediction tools associated with these compounds have been published to date. For the best identified solvents, extraction experiments were performed, and the extraction curves were mathematically modeled from the fitting of the unknown parameters of the model. Considering the relevant activities demonstrated by these benzopyrans, studies evaluating different methods for their extraction are extremely necessary to ensure future applications.

2. Materials and Methods

2.1. Solubility Screening of Target Compounds in DES

The solubility screening of HP1, HP2, and HP3 in DESs was performed in the thermodynamic software COSMOThermX (v. 22.0), applying the σ-profiles of each component and the sum of the σ-profiles weighted with their mole fraction in the system to determine the thermodynamic properties of compounds or mixtures.
For this study, some DESs previously reported for bioactive compound extraction [24,30,31] were applied in solubility screening as follows: lactic acid/glycine/water (3:1:3), choline chloride/glycerol (1:2), choline chloride/ethylene glycol (1:2), betaine/glycerol (1:2), betaine/glycerol (1:3), betaine/lactic acid (1:2), proline/glycerol (1:2), proline/ethylene glycol (1:2), proline/lactic acid (1:2), and leucine/glycerol (1:2). The ratios are presented on a molar basis. These DESs also present variations in their physicochemical properties, a characteristic that is advantageous for solvent screening applications. Table 1 summarizes information about the hydrogen bond acceptor (HBA) and hydrogen bond donor (HBD) and adds numbering for the DESs tested.
DESs were represented using the electroneutral mixture approach [40] by applying the previously defined HBA and HBD ratios. Since the components constituting a DES are independent compounds and the ones tested are uncharged compounds, a mixture of HBA and HBD listed in Table 1 at any composition would be electroneutral. The σ-profiles of each component, when available in the software database, were utilized in this process. The best DES to extract the benzopyrans from H. polyanthemum was evaluated according to the activity coefficient ( γ i ) at infinite dilution of the compounds in the solvents predicted in the COSMOthermX (Equation (1)). This strategy elucidates the limit of the activity coefficient as the concentration of solute i approaches zero. According to the work of Zurob et al. [29], lower values of the activity coefficient at infinite dilution indicate a higher stability of the solute in the DES and, therefore, a higher solute solubility. This coefficient can be formulated as follows:
l n γ i = μ i S , μ i P R T
In Equation (1), the chemical potential of pure compounds ( μ i P ) and at infinite dilution ( μ i S , ) are determined from the σ-profiles, γ i is the activity coefficient at infinite dilution, R is the universal gas constant, and T is the absolute temperature. Additional calculation methodology and equations used can be found elsewhere [41,42]. All calculations were performed with parameterization BP_TZVP_22.ctd and at 50 °C since it was reported as the optimal temperature for benzopyran extraction [18].

Geometry Optimization of Molecules

For HP1, HP2, and HP3, the representation of the molecular structure (Figure 1) was performed using the Turbomole software (TmoleX v. 4.2), since they were not available in the COSMOthermX database.
The ground-state geometry optimization was performed using density functional theory (DFT), triple-zeta valence with polarization (def-TZVP) basis set, and the Becke–Perdew (BP86) generalized gradient approximation as the exchange correlation. Single-point calculations were carried out using the Turbomole software to generate files containing each optimized molecular structure, called σ-profiles. These files were subsequently imported into the COSMOThermX software for the prediction of thermodynamic properties and solubility estimation through the calculation of activity coefficients at infinite dilution.

2.2. Experimental Extraction

2.2.1. DES Preparation

The DES, namely lactic acid/glycine/water 3:1:3 (DES 1), was prepared according to the heating and stirring method [43]. Its forming compounds (HBA and HBD) were weighed on an analytical balance following their predetermined molar ratios and mixed under controlled temperature (50 °C) for at least 2 h. The formation of a clear and homogeneous solution without the generation of apparent crystals was observed. Before the extraction experiments, all DESs were stored at room temperature for a period of no less than 24 h to ensure stabilization. The specific components employed in the preparation of each DES are detailed in Table 2.

2.2.2. Plant Material

The aerial parts of H. polyanthemum, used in this study, were collected at Barão do Triunfo, a city in southern Brazil (30°23′ S 51°44′ W), in January 2025, and the voucher specimens were deposited in the herbarium of Federal University Rio Grande do Sul (ICN) (Bordignon et al., 3118). The plant material was dried in an oven at 40 °C for 24 h, and the final water content was determined using a Bel Engineering (Monza, Italy) thermogravimetric moisture analyzer (model i-Thermo 163 L). Subsequently, the plant material was milled and sieved. The mean particle diameter was evaluated using five sieves from the Tyler series (0 to 1.00 mm) under 10 min of agitation. Additionally, the density of the plant material was determined by a Quantachrome Multipycnometer (Boynton Beach, FL, USA) using the gas-pycnometry technique [44] and is 0.656 ± 0.012 g/cm3.

2.3. Ultrasound-Assisted Extraction from H. polyanthenum

Ultrasound-assisted extraction (UAE) coupled with the selected DES was used to obtain the benzopyrans, since this approach has been reported before to enhance extraction efficiency [45] and reduce process time compared to other methods [46]. UAE was performed using a digital ultrasonic bath (Ultronique, Indaiatuba, SP, Brazil, model Q 5.9/40A, 40 kHz, 200 W, standard uncertainty u(T) = 3.00 K), a recommended methodology for a large variety of samples under controlled temperature [47]. The extraction parameters were 50 °C, a solid/liquid (S/L) ratio of 1:10, and the time was analyzed from 0 to 75 min, aiming for exhaustion of HP1, HP2, and HP3 extraction. Once the extraction curves were performed, pure hexane was used as a traditional organic control solvent for comparison of results. Following extraction, samples were filtered, and the extracts obtained were analyzed by liquid chromatography and spectrophotometric methods.

2.4. Analysis of the Extracts

2.4.1. Total Phenolic Content

To determine the total phenolic content (TPC) of the extracts, the Folin–Ciocalteu colorimetric method was applied [48,49,50,51]. In summary, 20 μL of the samples (DES extracts), 1.58 mL of deionized water, 100 μL of Folin–Ciocalteu’s reagent, and 300 μL of an aqueous sodium carbonate solution (0.2 g/mL) reagent were added to glass test tubes, mixed through vortexing, and incubated at 40 °C for 30 min. The absorbance of the samples was measured in triplicate using UV–Vis spectrophotometry (BEL Photonics, M51: Osasco, SP, Brazil) at a wavelength of 750 nm. A calibration curve was constructed with gallic acid standard solutions with concentrations of 25, 50, 100, 250, 750, and 1000 mg/L. The results for the total phenolic content were expressed in milligrams of gallic acid equivalents (mg GAE) per gram of dry weight of H. polyanthemum.

2.4.2. Quantitative Analysis of Benzopyrans

The quantification of benzopyrans in the extracts was performed using a previously validated high-performance liquid chromatography (HPLC) method [52]. Analyses were conducted on a Shimadzu 600 pump (LC-6AD) and a Shimadzu SPD-10A dual absorbance detector (Kyoto, Japan). Chromatographic separation was achieved on a Waters Nova-Pack C18 column (Milford, MA, USA) (4 µm, 3.9 mm × 150 mm) adapted to a guard column Waters Nova-Pack C18 60 Å (3.9 mm × 20 mm), maintained at 25 °C, using a mobile phase consisting of acetonitrile and water (60:40, v/v). The flow rate was set at 1.0 mL/min, with an injection volume of 20 μL and UV detection at 230 nm.

2.5. Mathematical Modeling

The mass transfer model used to describe the extraction is derived from the second law of Fick for a symmetric spherical geometry, considering only radial transport, placed in a well-stirred solution, which leads to a time-dependent boundary condition. The diffusion coefficient is considered constant during the extraction process, and the solute is uniformly distributed in the solid matrix. The differential equation, initial, and boundary conditions for this situation are presented in Equations (2)–(4).
1 r 2 r r 2 c r = 1 D c t
c ( r , 0 ) = c 0
c 0 , t r = 0   a n d   D c R , t r = α V P A P c R , t t
where D is the diffusion coefficient (m2/s), Vp is the particle volume (m3), Ap is the surface area of particles (m2), and α is a coefficient relating the solid/liquid ratio and the partition coefficient (k), given by Equation (5).
α = V f k V s
where Vf is the fluid volume used in the extraction, which was 1.5 cm3 for all extractions; vs is the solid volume of raw material, calculated from the mass (20 g) of material used with V s = m s ρ s and found to be 30.5 cm3; and k is the partition coefficient, given by k = c’/c, with c’ as the fluid phase concentration.
The solution of the presented mathematical model with the shown boundary conditions was addressed by Crank [53] and is given by Equation (6).
M t M = 1 n = 1 6 α 1 + α 9 + 9 α + α 2 q n 2 e x p D q n 2 t R 2
where M is the extracted mass in a time t, M is the mass that would be extracted in an infinite time, which was considered as the mass in the end of the process, α is the constant related to the partition between the phases, and qn is the non-zero roots of Equation (7).
tan q n = 3 q n 3 + α q n 2
In this model, the effective diffusion coefficient of the solute in the matrix, D, as well as the parameter α, were determined through a least squares parameter adjustment technique. From the adjustment of the parameters, the partition coefficient k was calculated using Equation (5).

2.6. Statistical Analysis

Statistical analyses of results obtained in extraction curves were performed in the Minitab 19 software using one-way analysis of variance (ANOVA), followed by a Tukey test. Mean values were considered significantly different at p < 0.05 (95% confidence interval).

3. Results and Discussion

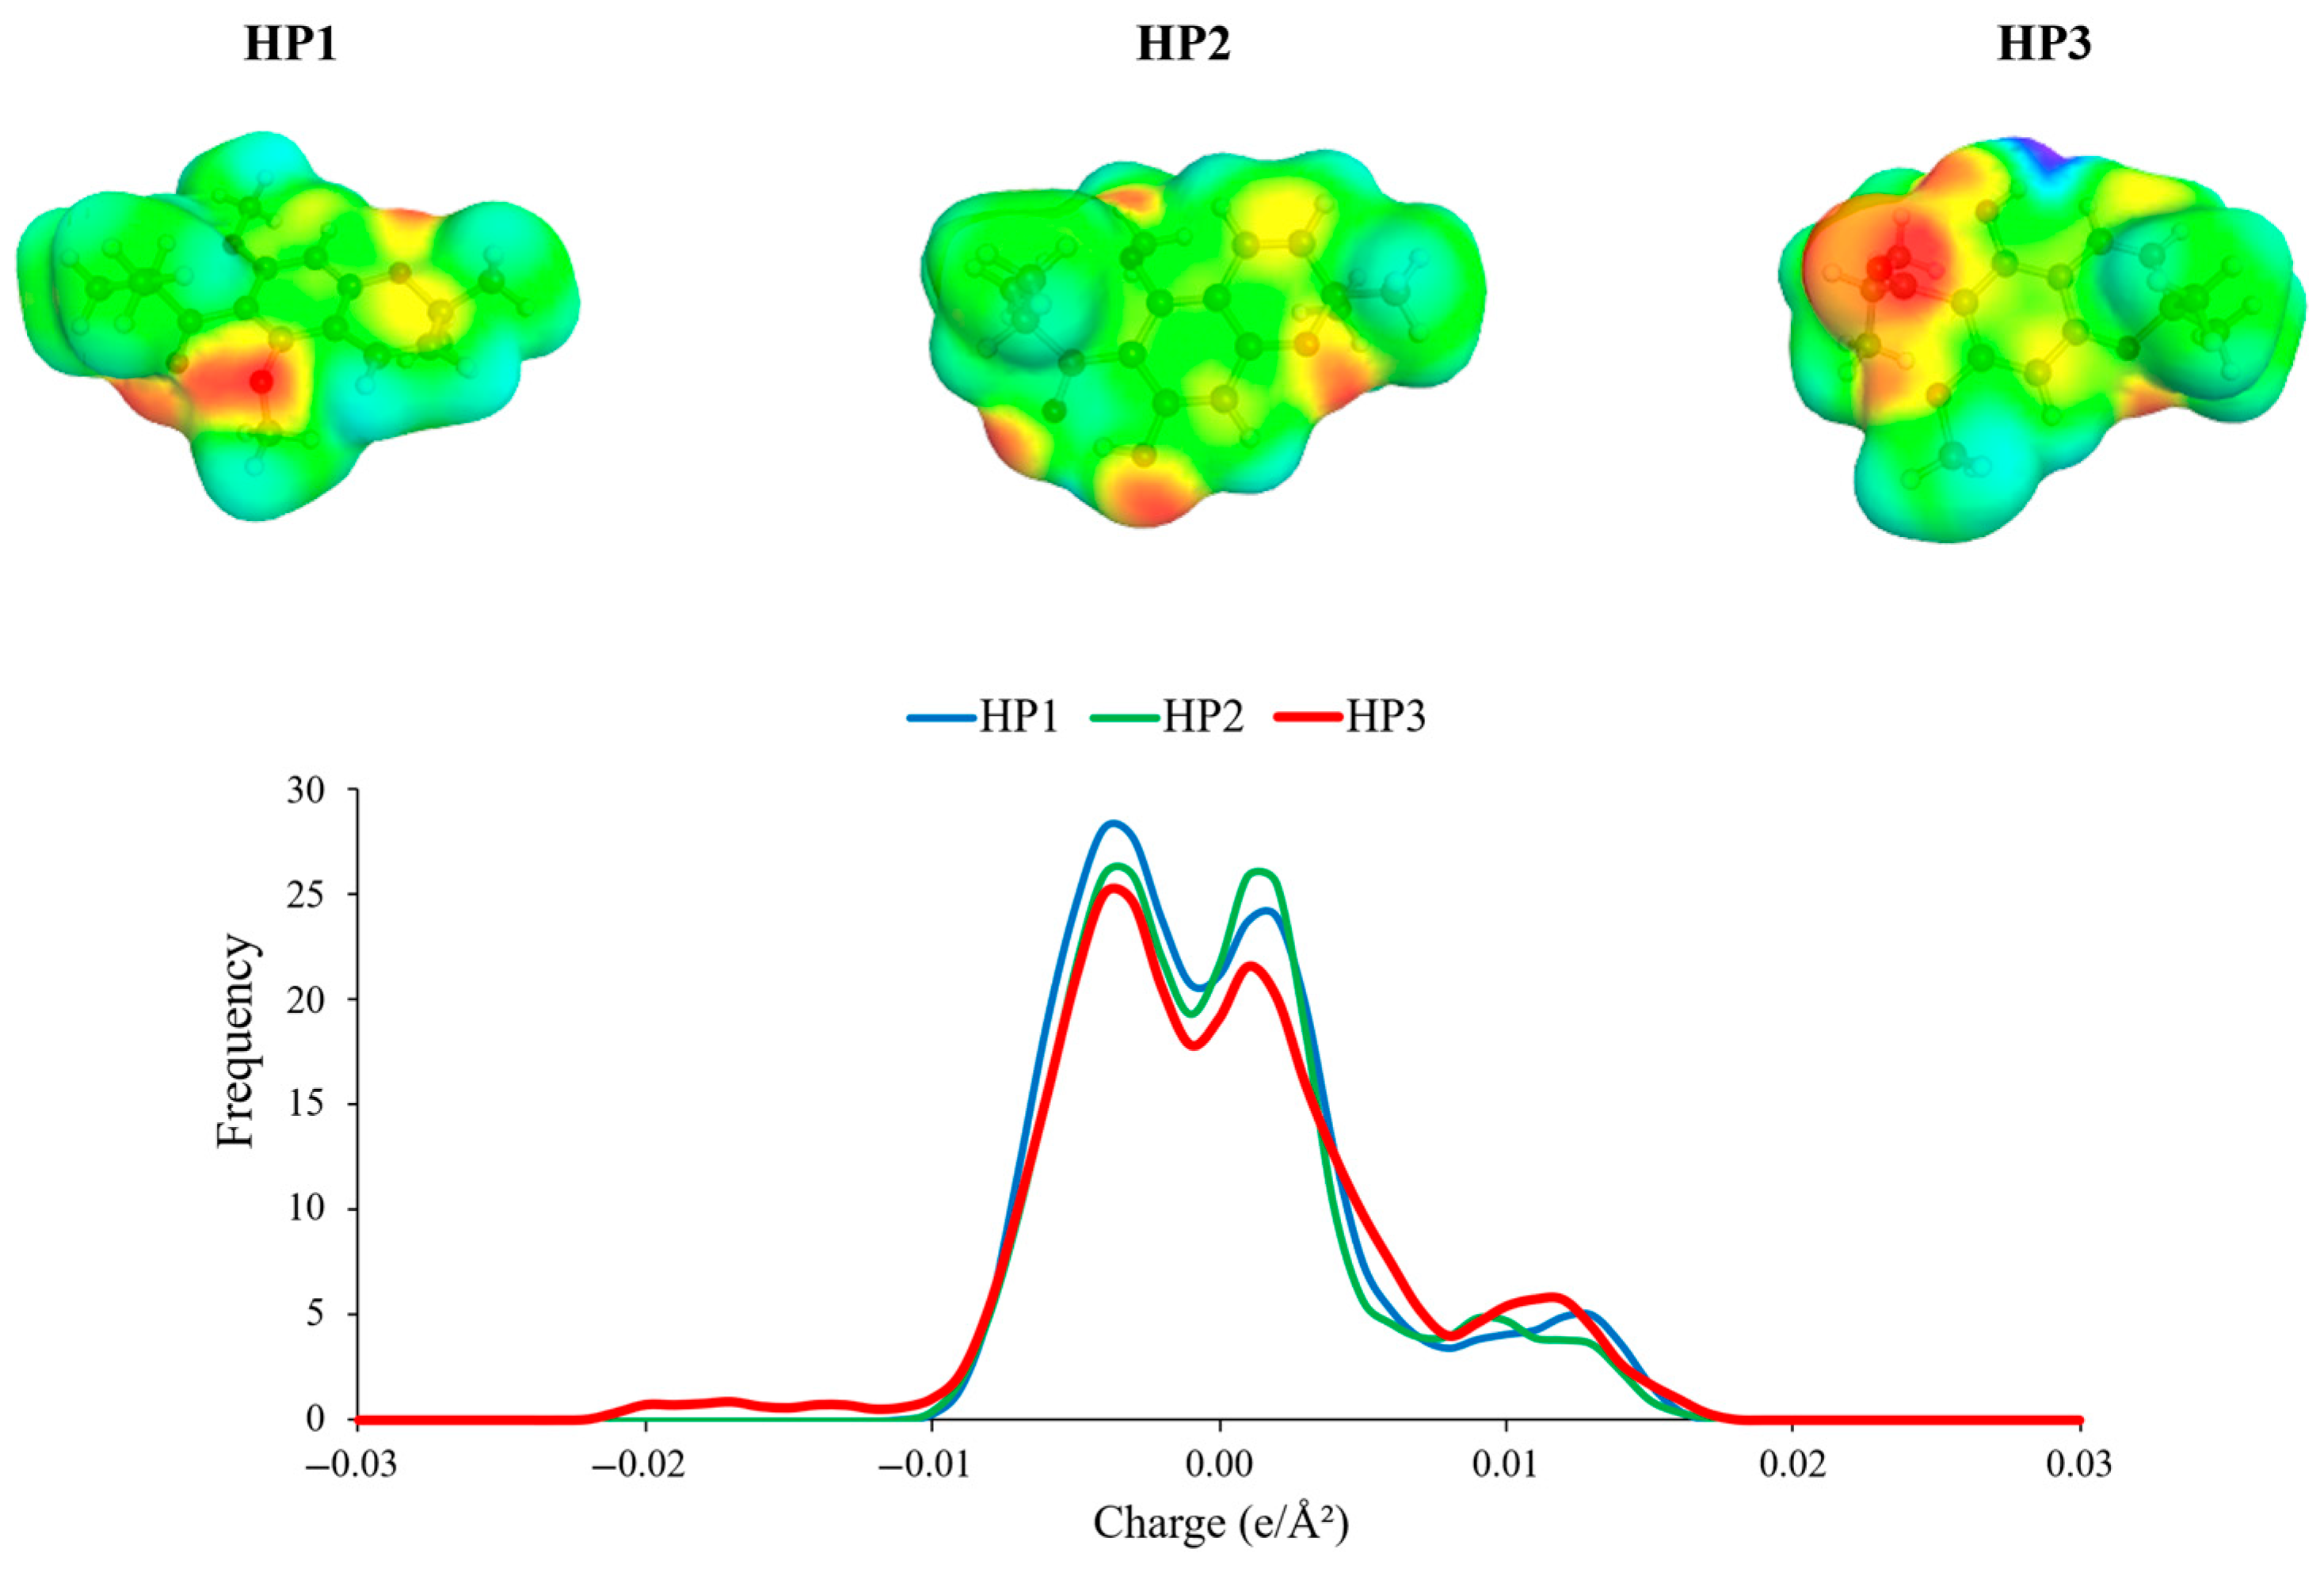
3.1. COSMO-RS Solubility Screening

The first step to perform solubility screening with COSMO-RS is to analyze the charge density surface and σ-profile of target compounds, either created or available in software databases, since they can provide information about the non-polar and polar regions of the molecules and can make predictions on how the intermolecular interaction between two or more chemical species occurs. Figure 2 presents the charge density surface and σ-profile of HP1, HP2, and HP3. For these benzopyrans, small polar regions with a strongly negative charge (red color) are observed in all molecular surface structures due to the presence of oxygen. These parts are translated into induced positive values in the σ-profiles. HP3 is the only structure to present strong positive charge zones (blue color), translated into induced negative values in its σ-profile, indicating possible selectivity extraction for the molecule, depending on the solvent used. Nonetheless, all the structures are characterized by non-polar regions (green color) of neutrally charged zones due to aromatic rings, which is also observed in the σ-profiles by two intense peaks in the non-polar region (0.00 e/Â2).
Solubility screening results performed in COSMOthermX are presented in Figure 3, in which ten different DESs were evaluated to find the best one to obtain benzopyrans from H. polyanthemum. Overall, DES 6, DES 7, DES 8, DES 9, and DES 10 presented the highest logarithmic activity coefficient values, regardless of the target molecule. For HP1 and HP2, the results in DES 1, DES 2, DES 3, DES 4, and DES 5 remain very close, between 3.00 and 4.00, with slightly lower values for DES 1. For HP3, a similar behavior is observed, except for DES 1, which presented the highest value in this group comparison. The HP3 molecule also presented the overall lowest logarithmic activity coefficient values compared to HP1 and HP2, which can be attributed to its more pronounced polar zones interacting directly with the screened DES.
The solubility of a target solute in a solvent is inversely proportional to its activity coefficient at infinite dilution in the mixture. Therefore, lower values estimated in COSMOtherm mean a greater probability of interactions between solvent and solute molecules, increasing the extraction capacity [27,29]. Therefore, the results presented in Figure 3 indicate DES 1 as one of the best to solubilize all benzopyrans, except for HP3. This molecule presented slightly more pronounced polar zones than HP1 and HP2 in its molecular surface, especially the positive ones, which can influence the interaction with DES 1. However, this DES has a great overall extraction efficiency of bioactive compounds, as reported in our previous studies [26,48], and could be a good option to obtain all the target benzopyrans, since our goal is not to selectively extract any compound. Additionally, this DES had its physicochemical properties reported before [26]. Hence, it was selected as the main solvent for further extraction experiments.

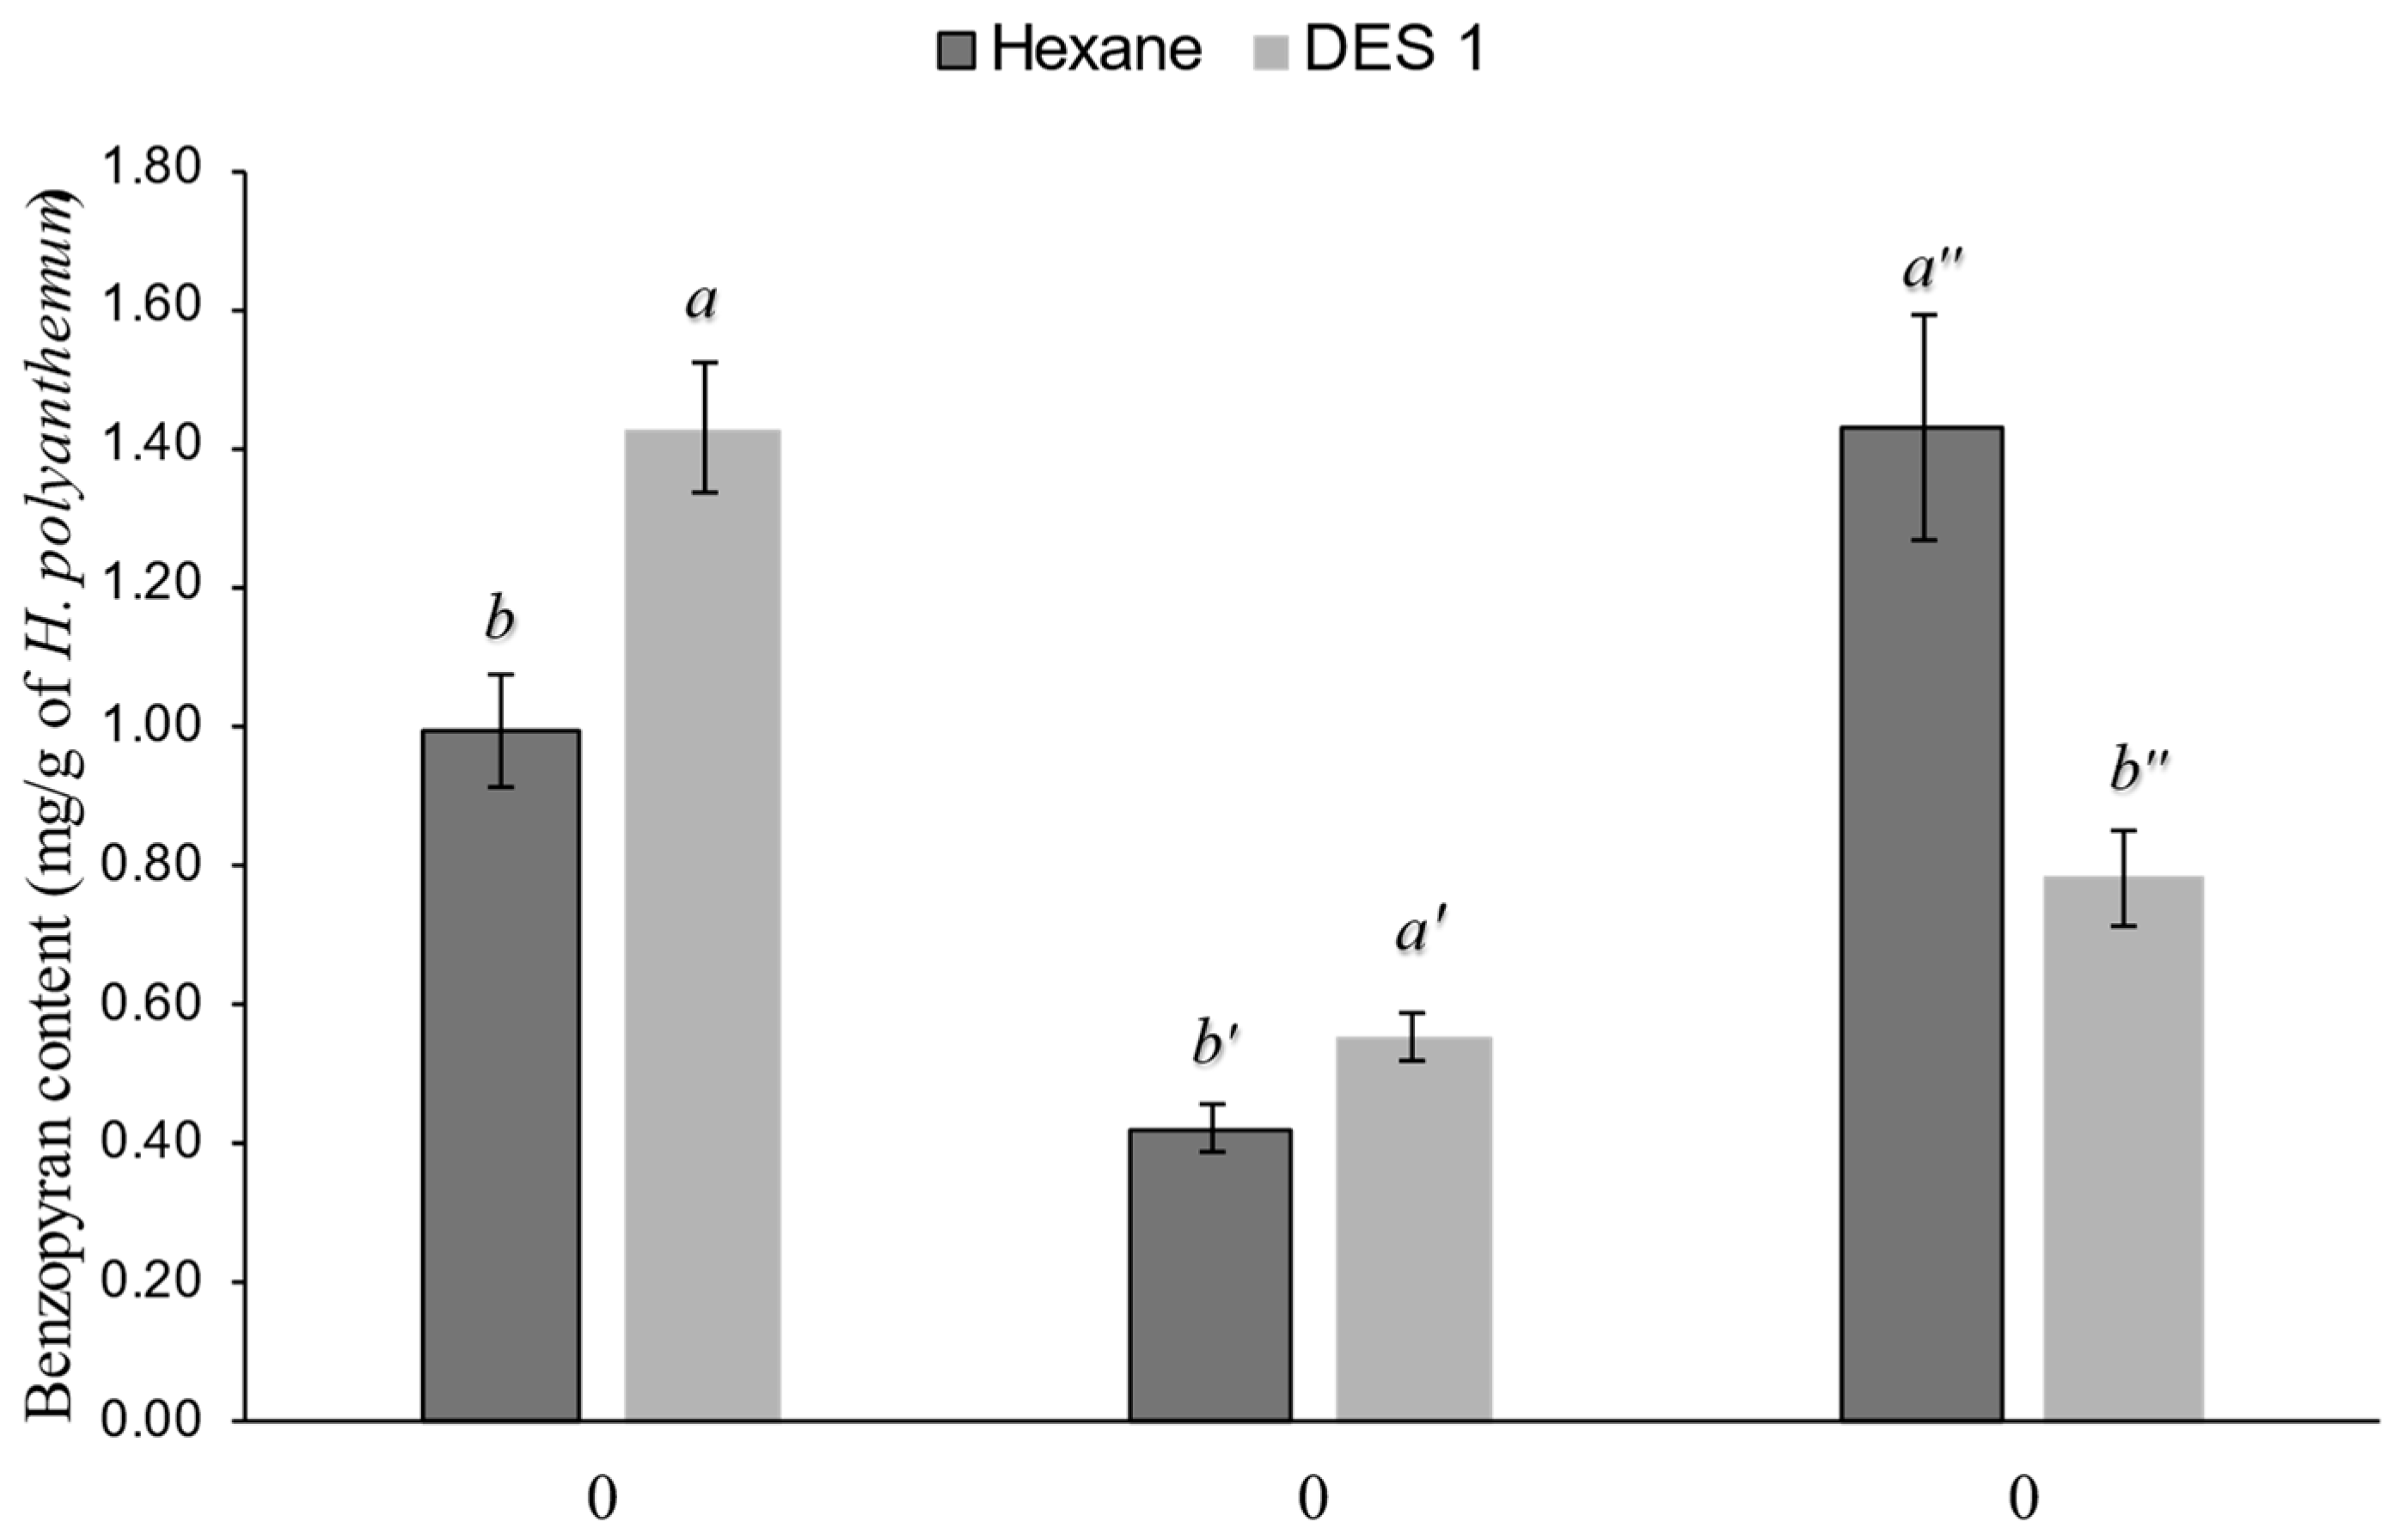
3.2. Extractions with Deep Eutectic Solvents

Before the extractions, the moisture content of the plant was determined after drying, with an obtained value of 5.21 ± 1.95%. Additionally, the plant material was processed and then sieved to determine the average particle diameter, calculated to be 0.605 mm.
Initially, a calibration curve was obtained using HPLC for the determination of HP1, HP2, and HP3, with concentration values ranging from 7.8 to 500 μg/mL. The correlation exhibited linear behavior, described by the equation y (area) = 27,420x (μg/mL) + 732.27, with R2 > 0.99. Subsequently, the extraction with DESs and all the following analyses were performed in triplicate, generating an extraction curve over a total time of 75 min.
The extraction curves are presented in Figure 4. For DES 1, the highest extraction values were observed at 75 min. All benzopyrans reached their maximum concentration yield at this time point, with HP1 showing the highest value (1.43 ± 0.09 mg/g), followed by HP3 (0.78 ± 0.07 mg/g), and HP2 (0.55 ± 0.04 mg/g). Additionally, a statistical analysis was performed between HP1, HP2, and HP3 values obtained for 50 and 75 min, showing there was no significant difference between the results, according to the Tukey test. This helps support the hypothesis that the extraction has reached exhaustion for these compounds or at least was very close to it.
The extracts obtained were also tested for total phenolic content (Figure 5), aiming for complementary analysis and characterization of the compounds obtained. The highest GAE content was obtained at 75 min (23.2 ± 1.96 mg GAE/g). An exponential increase in TPC results was noted as time increased in the first minutes, until the value became very similar, especially at 25, 50, and 75 min, confirmed by the Tukey test, which indicated no significant differences. This behavior is similar to the HP1, HP2, and HP3 extraction curves presented and was also explained before [54,55], where the authors indicated that, at the beginning of the extraction, there is low resistance to the diffusion of intracellular phenolic compounds, caused by the effective ultrasound disruption of cell structures and a larger concentration gradient.
Since only the benzopyrans HP2 (0.55 ± 0.04 mg/g) and HP3 (0.78 ± 0.07 mg/g) present phenolic hydroxyl groups, we can estimate that the minimum expected TPC value would be 1.34 mg/g. This suggests that the remaining phenolic content should be attributed to other compounds present in the plant, such as phloroglucinol derivatives and flavonoids.
With both benzopyrans and TPC presenting the highest yields at 75 min, a control extraction using pure hexane was performed, aiming to add one extra layer of comparison to this study. The results are presented in Figure 6, focusing on the HP1, HP2, and HP3 yields obtained with different solvents.
Extraction with DESs showed the best results, especially for HP1 and HP2, with statistical analysis indicating a significant difference regarding the type of solvent used to obtain benzopyrans. Thus, considering the green appeal brought by deep eutectic solvents, DES 1 presented the potential to be used for efficient and eco-friendly extraction methods. This also represents a reduction in both process waste and unit operations for the extraction process, since the extract obtained could be used without the need for purification. However, taking into account only HP3, the results were far surpassed by hexane, showing that improvement in obtaining this specific compound by DESs is still necessary. Future studies may aim for selective obtention of HP3 using predictive models such as COSMO-RS. Another key factor to mention is that no data regarding the toxicity of the DES was found. Therefore, it is recommended to perform assays with the solvent and the extracts obtained, aiming at future pharmaceutical and nutraceutical applications.

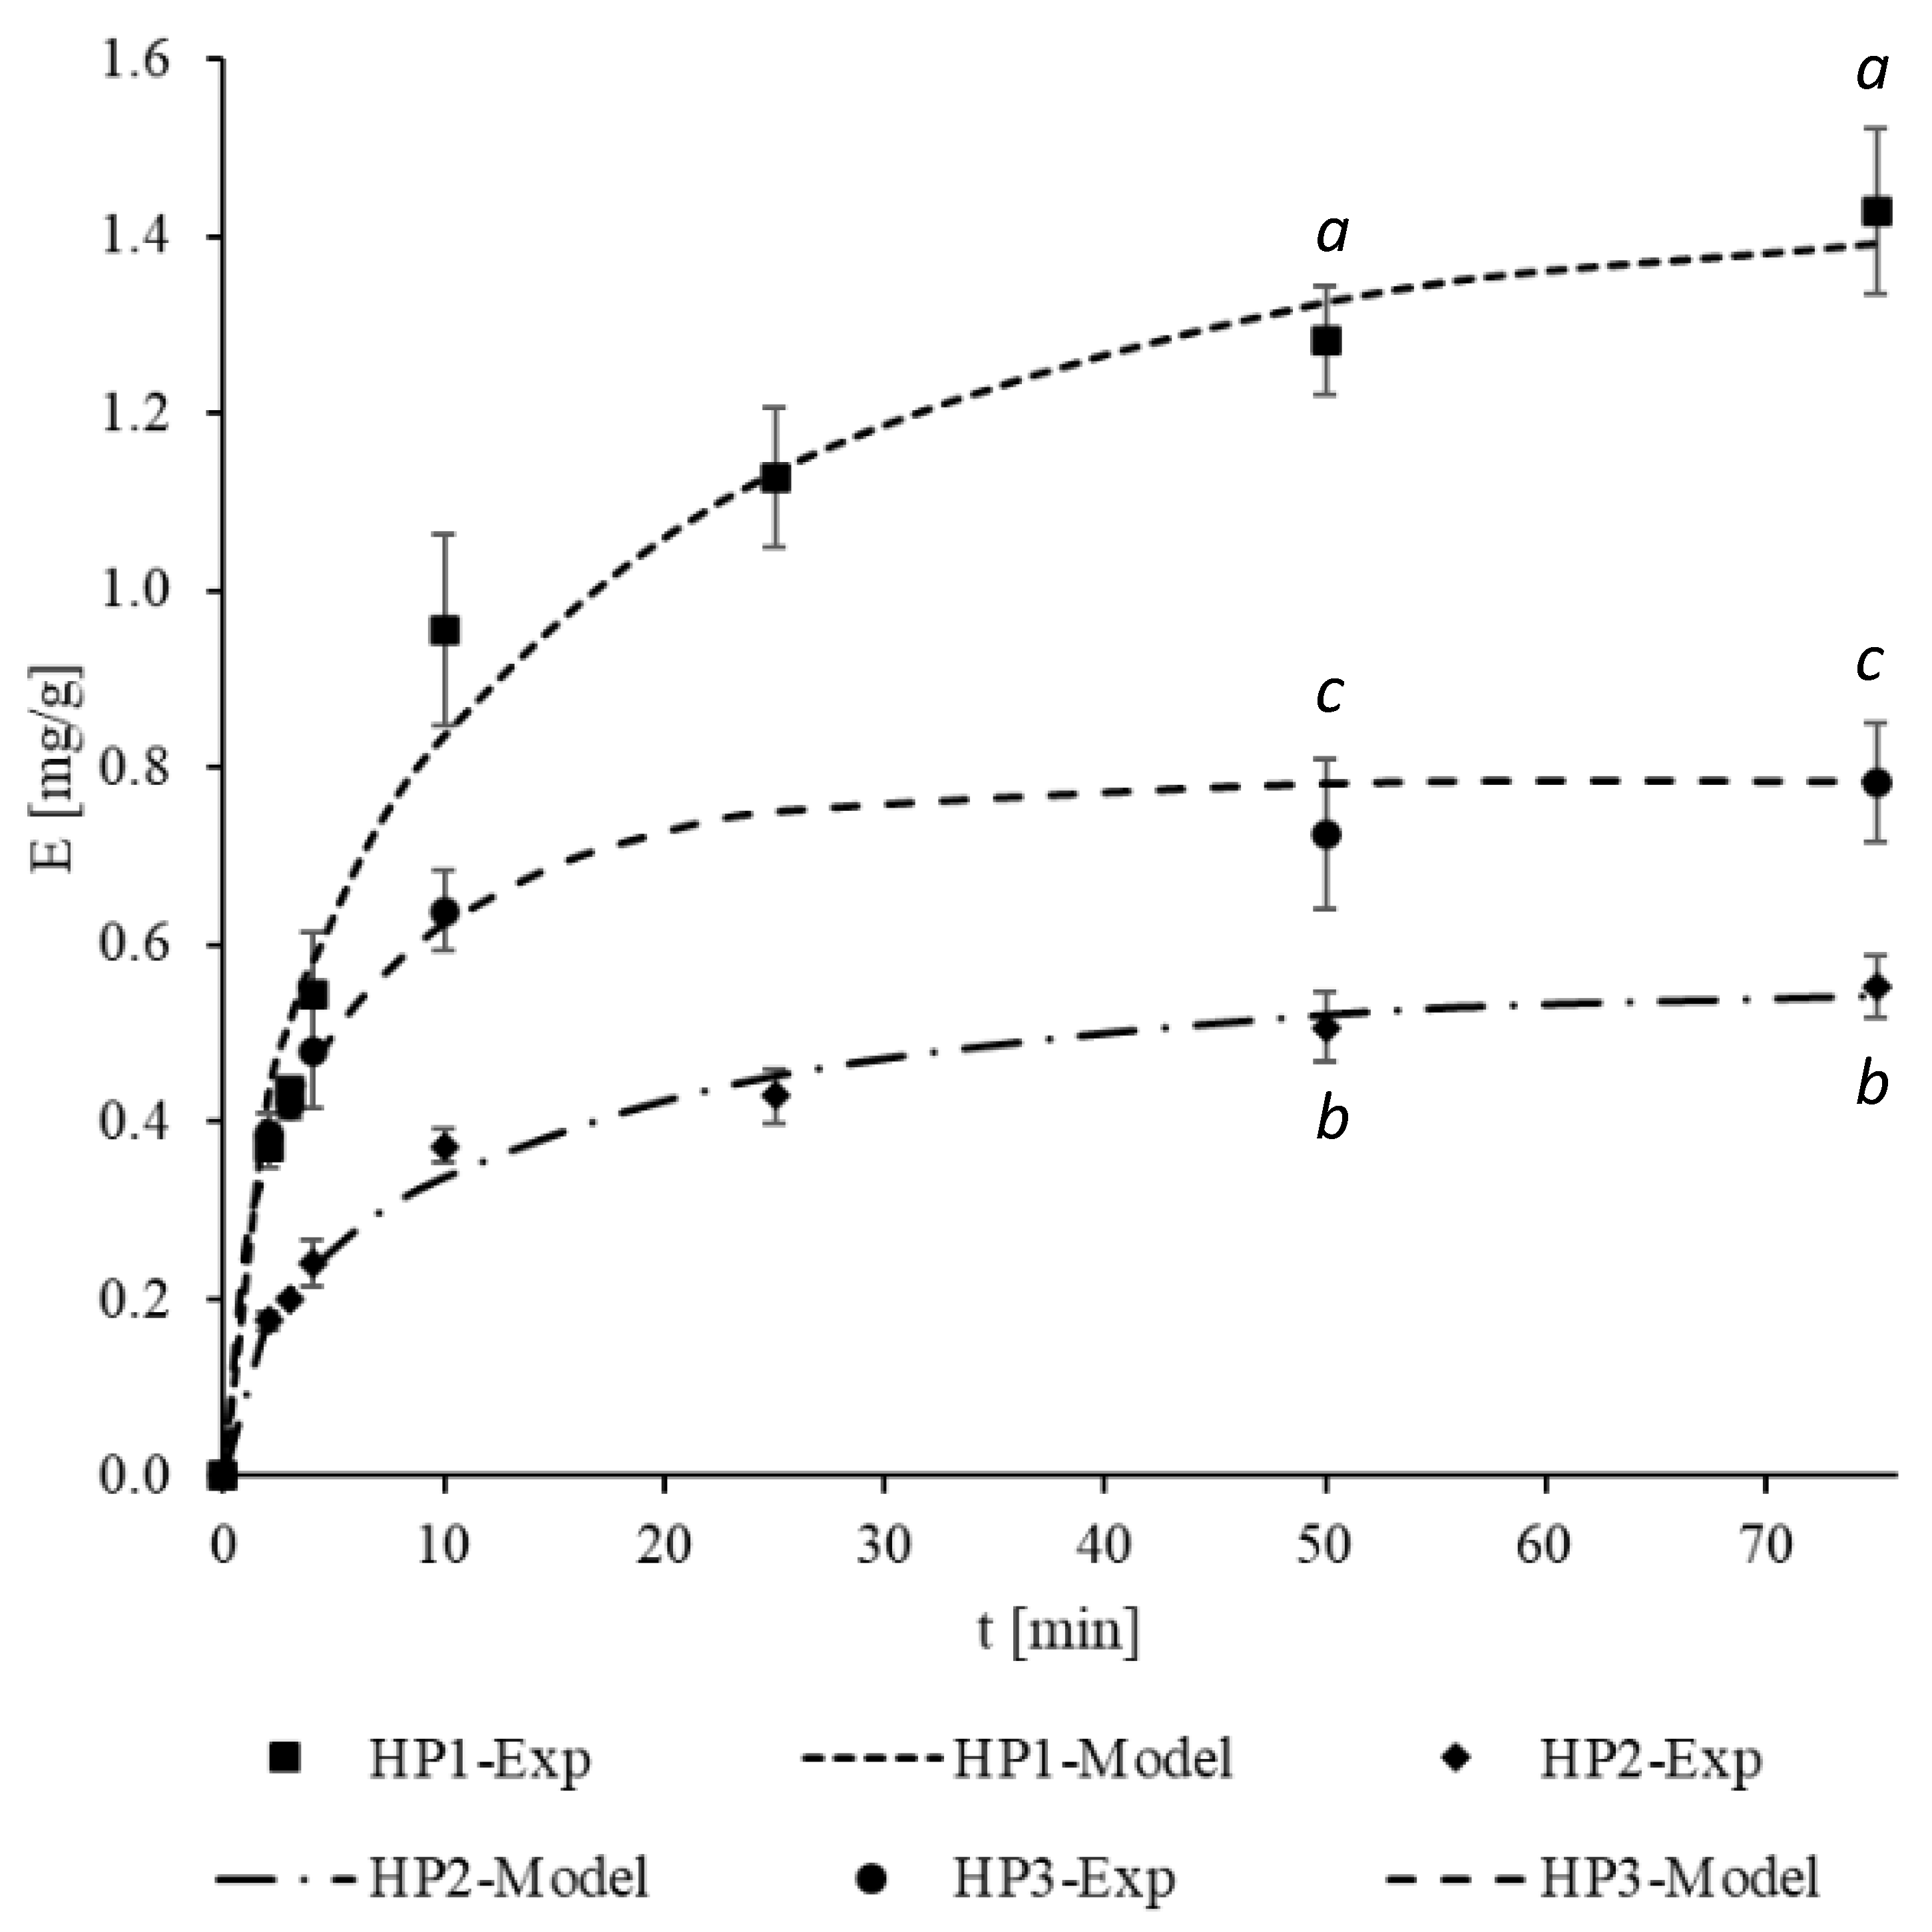
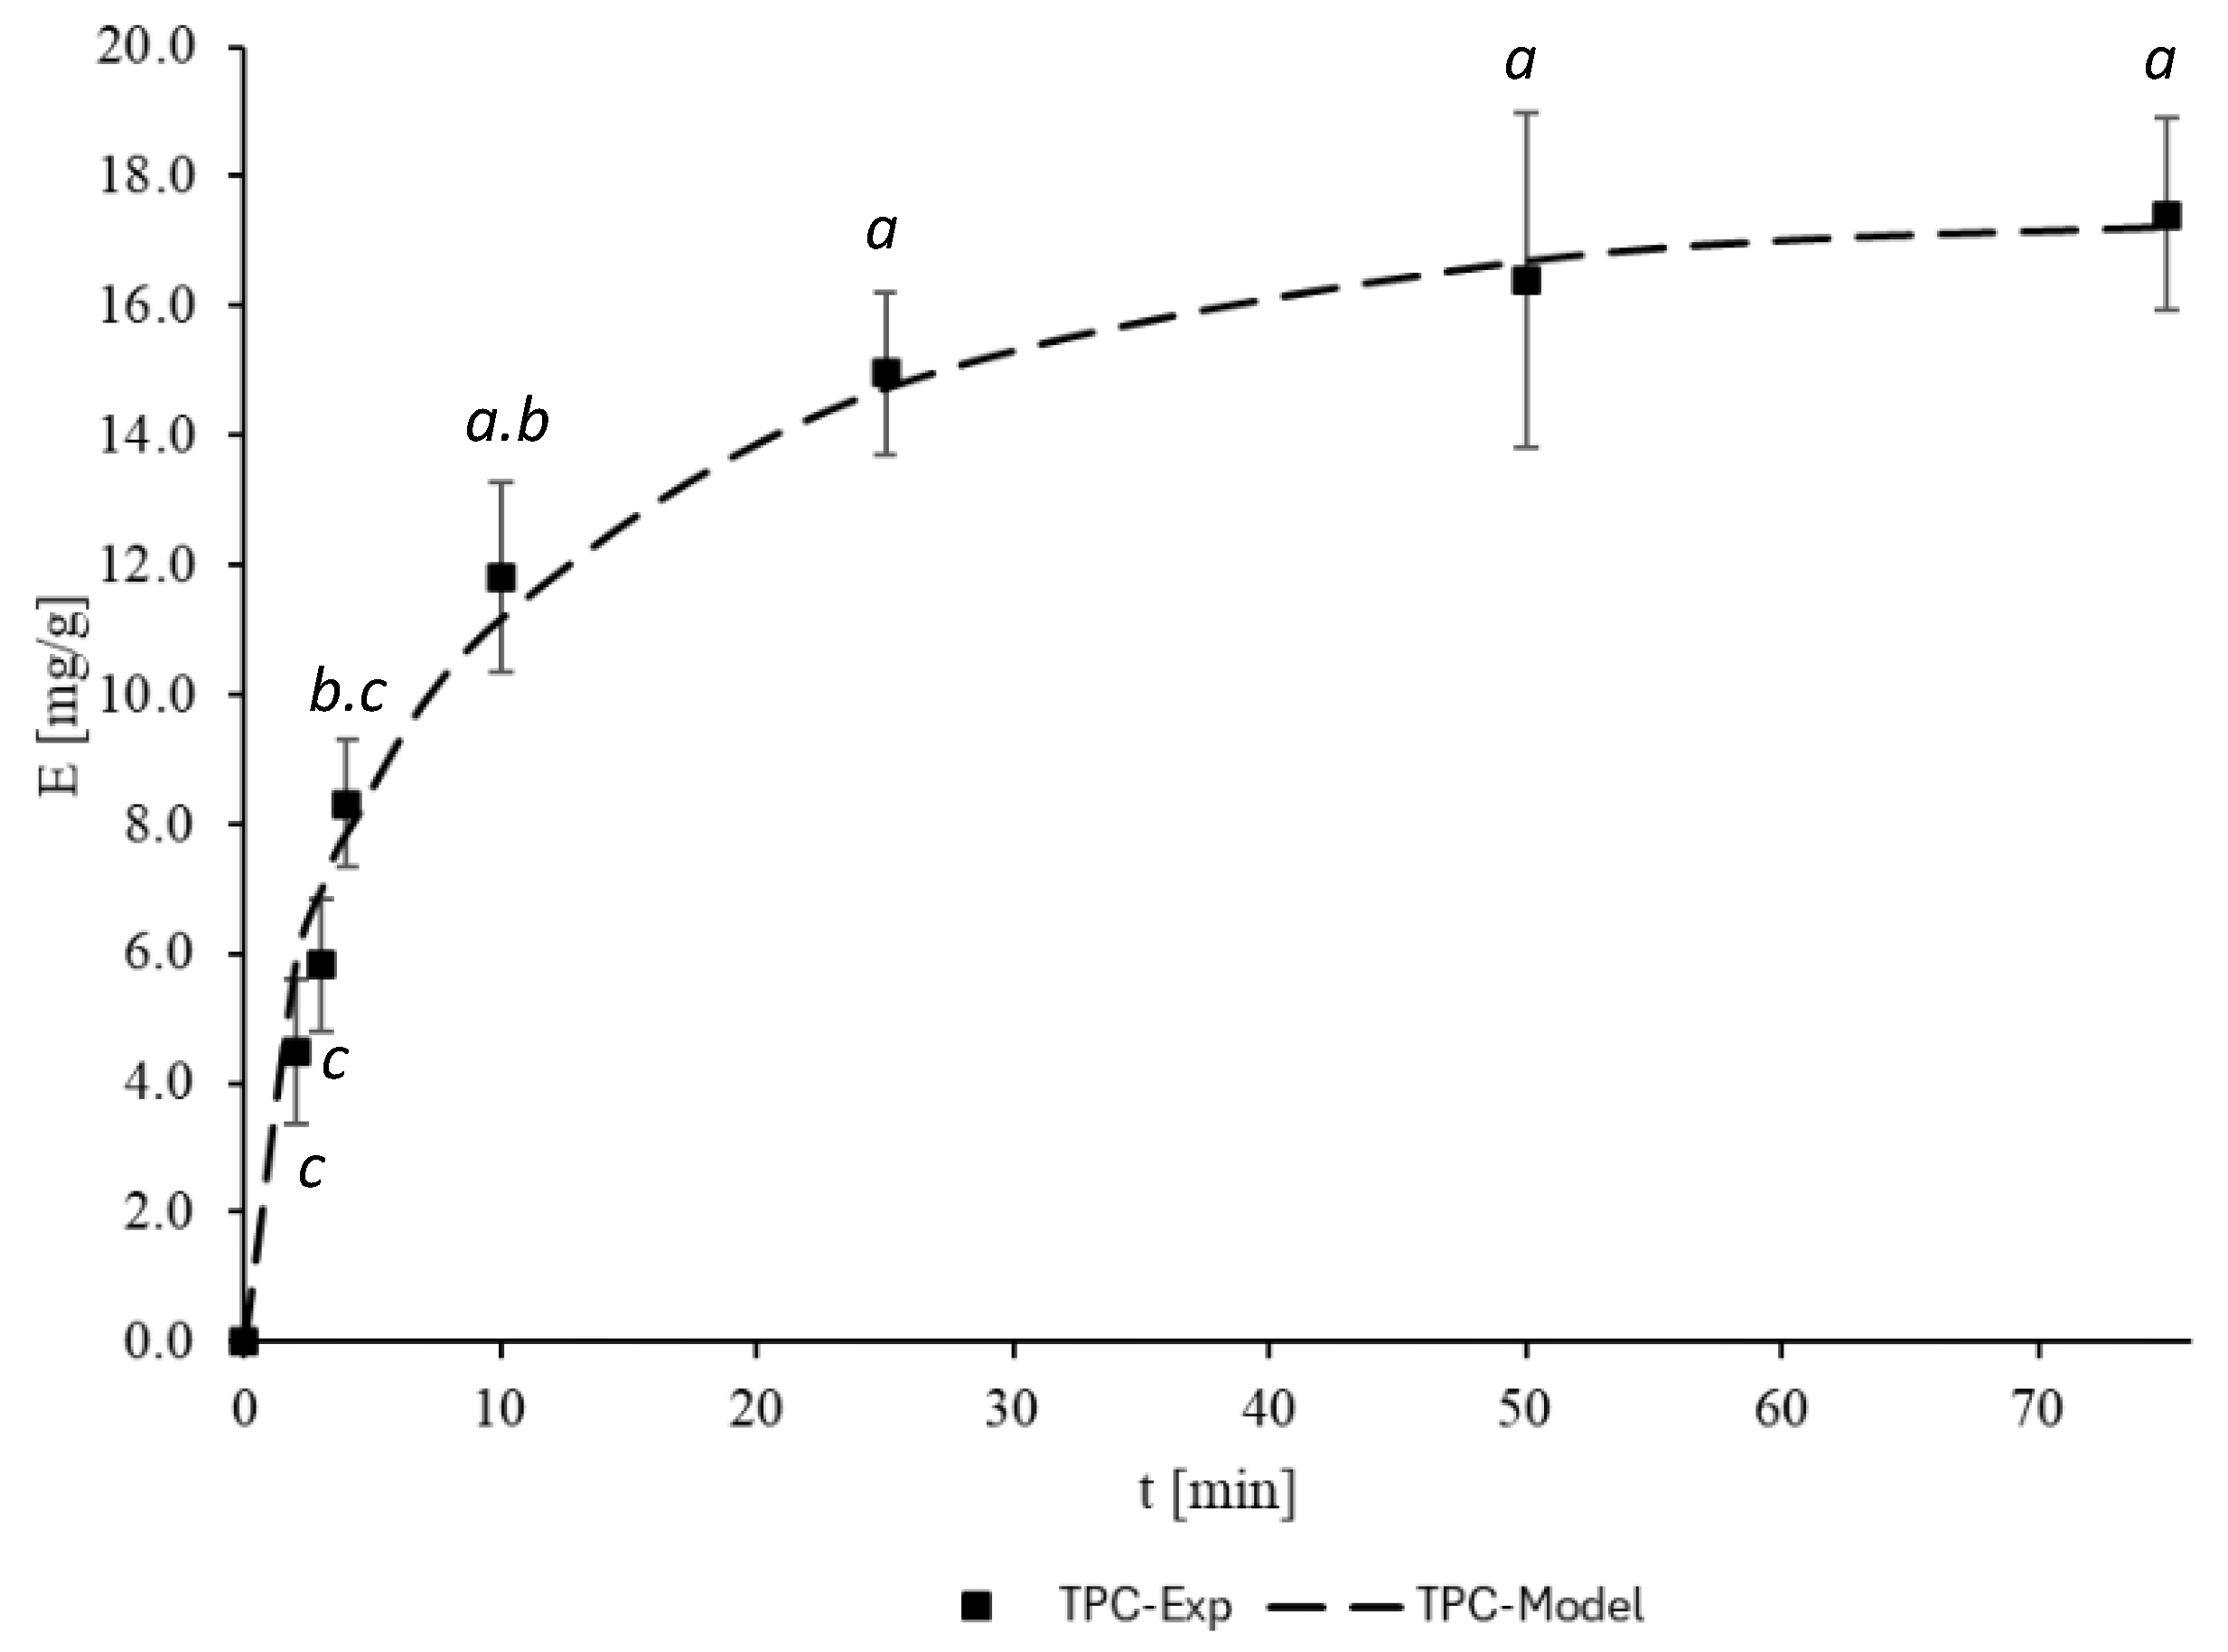
3.3. Mass Transfer Modeling

After the experimental determination of yield vs. time curves (Figure 4 and Figure 5) for the interest compounds, mathematical modeling was performed, and the model parameters were adjusted. The results for the model parameters of HP1, HP2, HP3, and TPC for the extraction of H. polyanthemum with DES 1 are presented in Table 3, alongside the determination coefficient (R2) and the mean absolute percentage error (MAPE).
The mathematical model demonstrated strong agreement with the experimental data, as evidenced by the low error values (<10%) and R2 values close to unity in all cases. The MAPE further confirms the model’s predictive performance by quantifying the discrepancy between the predicted and experimental results.
The diffusion coefficient of the compounds presented the same order of magnitude, except for HP3 extraction, which was one order higher. Similarly, the partition coefficient for all the compounds presented comparable orders of magnitude, likely due to the plant material’s structure and the fluid–solid interaction. The diffusion coefficients of HP2 and TPC were of the same order of magnitude found by other authors studying extraction with DES, which applied a diffusional model based on Fick’s law [39].
The extraction curves consist of two distinct stages: a fast extraction step (washing), lasting up to 5 min, followed by a slower step known as the diffusion stage. The initial fast extraction occurs at a constant rate, attributed to the rapid exposure of plant cells to the solvent. In contrast, the diffusion stage involves the gradual release of active compounds from the plant matrix into the solvent. The extraction yield during this second stage largely depends on the number of intact cells remaining after the washing step [56]. Additionally, some studies suggest that the proportion of broken versus intact cells after sample pretreatment determines the behavior of these two extraction stages [57].
The availability of mathematical models that adequately represent the extraction process allows the evaluation of changes in scale and the implementation of process projects without the need to carry out experiments, avoiding the expenditure of natural resources and inputs for extraction. Extraction with DESs was performed in batch mode. Mathematical models for extraction in this modality include models based on sorption principles [58] and mass transfer models [59,60]. In this work, the model proposed to represent the extraction with DESs is supported by the principles of mass transfer and considers the variation of the amount of extract in both the fluid and solid phases over time, which led to a time-varying boundary condition under the assumption of a lumped model for the fluid phase. This consideration makes the model effective for representing the physical phenomena that occur in batch extraction with DESs.
Other authors also reported the extraction with deep eutectic solvents and employed models based on extraction stages, including a diffusive step [35,37]. In addition, the diffusional model applied in the present work was also employed by da Silva et al. [60] to model enhanced extraction techniques from plant material, as mentioned before.

4. Conclusions

This study aimed to obtain valuable benzopyrans from H. polyanthemum through new routes, exploring the integration of computational prediction with experimental extraction. The selected solvent via COSMO-RS was able to solubilize the target compounds, HP1, HP2, and HP3, with promising results compared to the classical organic solvent hexane. The adapted Crank diffusion model accurately described the experimental extraction curves using the selected DES 1, with an R2 value higher than 0.98 and a mean percentage error of less than 9%. Notably, the diffusion coefficient for HP3 was found to be an order of magnitude higher than for HP1 and HP2 in the DES system, suggesting potential differences in molecular interactions or transport within the plant matrix that warrant further investigation. The application of COSMO-RS for DES selection highlights its utility in reducing experimental effort and resources in the early stages of process development for natural product extraction. Furthermore, the efficiency of the UAE, coupled with the environmentally friendly DES, offers a greener alternative to traditional solvent extraction methods, aligning with the principles of sustainable chemistry. Mathematical modeling was able to represent the experimental extraction curves and generate values for the diffusion and partition coefficients, which may be useful for scale-up stages and process design involving systems like those investigated in this article.

Supplementary Materials

The following supporting information can be downloaded at: https://www.mdpi.com/article/10.3390/pr13082351/s1, Figure S1: Particle size distribution for average between the openings of two sieves (sieve stage); Figure S2: Calibration curve for benzopyrans performed with HPLC.

Author Contributions

Conceptualization, V.H.S.R., E.C., G.L.v.P. and R.M.F.V.; Methodology, V.M.J.S., G.d.C.M., H.M.T., G.L.v.P. and R.M.F.V.; Software, H.M.T.; Validation, V.M.J.S., G.d.C.M., H.M.T., V.H.S.R. and G.L.v.P.; Formal analysis, G.d.C.M., H.M.T., V.H.S.R. and G.L.v.P.; Investigation, V.M.J.S., G.d.C.M. and R.M.F.V.; Resources, E.C. and R.M.F.V.; Writing—original draft, V.H.S.R., G.L.v.P. and R.M.F.V.; Writing—review & editing, V.M.J.S., G.d.C.M., V.H.S.R., G.L.v.P. and R.M.F.V.; Visualization, G.L.v.P.; Supervision, R.M.F.V.; Funding acquisition, E.C. and R.M.F.V. All authors have read and agreed to the published version of the manuscript.

Funding

This study was partly financed by FAPERGS and CNPq. This study was additionally supported in part by the Coordenação de Aperfeiçoamento de Pessoal de Nível Superior—Brasil (CAPES)—Finance Code 001.

Data Availability Statement

The original contributions presented in this study are included in the article/Supplementary Materials. Further inquiries can be directed to the corresponding author.

Conflicts of Interest

The authors declare no conflicts of interest.

References

  1. Kartnig, T.; Göbel, I.; Heydel, B. Production of Hypericin, Pseudohypericin and Flavonoids in Cell Cultures of Various Hypericum Species and Their Chemotypes. Planta Med. 1996, 62, 51–53. [Google Scholar] [CrossRef] [PubMed]
  2. Bennett, G.J.; Lee, H.H. Xanthones from Guttiferae. Phytochemistry 1989, 28, 967–998. [Google Scholar] [CrossRef]
  3. Rocha, L.; Marston, A.; Potterat, O.; Kaplan, M.A.C.; Stoeckli-Evans, H.; Hostettmann, K. Antibacterial Phloroglucinols and Flavonoids from Hypericum brasiliense. Phytochemistry 1995, 40, 1447–1452. [Google Scholar] [CrossRef] [PubMed]
  4. Bernardi, A.P.M.; López-Alarcón, C.; Aspee, A.; Rech, S.; von Poser, G.L.; Bride, R.; Lissp, E. Antioxidant activity of flavonoids isolated from Hypericum ternum. J. Chil. Chem. Soc. 2007, 52, 1326–1329. [Google Scholar] [CrossRef]
  5. Ccana-Ccapatinta, G.V.; von Poser, G.L. Acylphloroglucinol Derivatives from Hypericum laricifolium Juss. Phytochem. Lett. 2015, 12, 63–68. [Google Scholar] [CrossRef]
  6. Bhattacharya, S.K. Activity Profiles of Two Hyperforin-Containing Hypericum Extracts in Behavioral Models. Pharmacopsychiatry 1998, 31, 22–29. [Google Scholar] [CrossRef] [PubMed]
  7. Verotta, L.; Appendino, G.; Belloro, E.; Jakupovic, J.; Bombardelli, E. Furohyperforin, a Prenylated Phloroglucinol from St. John’s Wort (Hypericum perforatum). J. Nat. Prod. 1999, 62, 770–772. [Google Scholar] [CrossRef] [PubMed]
  8. Décosterd, L.; Stoeckli-Evans, H.; Msonthi, J.D.; Hostettmann, K. A New Antifungal Chromene and a Related Di-Chromene from Hypericum revolutum. Planta Med. 1986, 52, 429. [Google Scholar] [CrossRef] [PubMed]
  9. Ishiguro, K.; Yamaki, M.; Kashihara, M.; Takagi, S.; Isoi, K. A Chromene from Hypericum japonicum. Phytochemistry 1990, 29, 1010–1011. [Google Scholar] [CrossRef]
  10. Bridi, H.; Meirelles, G.D.C.; Bordignon, S.A.D.L.; Rates, S.M.K.; von Poser, G.L. Denudatin A, a Dimeric Acylphloroglucinol from Hypericum denudatum Presents an Antinociceptive Effect in Mice. Planta Med. 2017, 83, 1329–1334. [Google Scholar] [CrossRef] [PubMed]
  11. Kitanov, G.M.; Nedialkov, P.T. Benzophenone O-Glucoside, a Biogenic Precursor of 1,3,7-Trioxygenated Xanthones in Hypericum annulatum. Phytochemistry 2001, 57, 1237–1243. [Google Scholar] [CrossRef] [PubMed]
  12. Bernardi, A.P.M.; Ferraz, A.B.F.; Albring, D.V.; Bordignon, S.A.L.; Schripsema, J.; Bridi, R.; Dutra-Filho, C.S.; Henriques, A.T.; von Poser, G.L. Benzophenones from Hypericum carinatum. J. Nat. Prod. 2005, 68, 784–786. [Google Scholar] [CrossRef] [PubMed]
  13. Bernardi, A.P.M.; López-Alarcón, C.; Aspée, A.; Rech, S.B.; von Poser, G.L.; Bridi, R.; Dutrafilho, C.S.; Lissi, E. Antioxidant activityin southern brazil Hypericum species. J. Chil. Chem. Soc. 2008, 53, 1658–1662. [Google Scholar] [CrossRef]
  14. Proksch, P.; Proksch, M.; Towers, G.H.N.; Rodriguez, E. Phototoxic and Insecticidal Activities of Chromenes and Benzofurans from Encelia. J. Nat. Prod. 1983, 46, 331–334. [Google Scholar] [CrossRef]
  15. Uth, J.F.; Börgel, F.; Lehmkuhl, K.; Schepmann, D.; Kaiser, M.; Jabor, V.A.P.; Nonato, M.C.; Krauth-Siegel, R.L.; Schmidt, T.J.; Wünsch, B. Synthesis and Biological Evaluation of Natural-Product-Inspired, Aminoalkyl-Substituted 1-Benzopyrans as Novel Antiplasmodial Agents. J. Med. Chem. 2021, 64, 6397–6409. [Google Scholar] [CrossRef] [PubMed]
  16. Ferraz, A.B.F.; Bordignon, S.A.L.; Staats, C.; Schripsema, J.; von Poser, G.L. Benzopyrans from Hypericum polyanthemum. Phytochemistry 2001, 57, 1227–1230. [Google Scholar] [CrossRef] [PubMed]
  17. Haas, J.S.; Viana, A.F.; MacHado Heckler, A.P.; von Poser, G.L.; Kuze Rates, S.M. The Antinociceptive Effect of a Benzopyran (HP1) Isolated from Hypericum polyanthemum in Mice Hot-Plate Test Is Blocked by Naloxone. Planta Med. 2010, 76, 1419–1423. [Google Scholar] [CrossRef] [PubMed]
  18. Cargnin, S.T.; de Matos Nunes, J.; Haas, J.S.; Baladão, L.F.; Cassel, E.; Vargas, R.F.; Rech, S.B.; von Poser, G.L. Supercritical Fluid Extraction and High Performance Liquid Chromatographic Determination of Benzopyrans and Phloroglucinol Derivative in Hypericum polyanthemum. J. Chromatogr. B 2010, 878, 83–87. [Google Scholar] [CrossRef] [PubMed]
  19. Meirelles, G.C.; Mendes, C.; Caon, T.; Teixeira, H.F.; von Poser, G.; Ponchel, G. Intestinal Permeability Enhancement of Benzopyran HP1-Loaded Nanoemulsions. Eur. J. Pharm. Sci. 2019, 127, 115–120. [Google Scholar] [CrossRef] [PubMed]
  20. Gnerre, C.; von Poser, G.L.; Ferraz, A.; Viana, A.; Testa, B.; Rates, S.M.K. Monoamine Oxidase Inhibitory Activity of Some Hypericum Species Native to South Brazil. J. Pharm. Pharmacol. 2001, 53, 1273–1279. [Google Scholar] [CrossRef] [PubMed]
  21. Ivanković, A.; Dronjić, A.; Bevanda, A.M.; Talić, S. Review of 12 Principles of Green Chemistry in Practice. Int. J. Sustain. Green Energy 2017, 6, 39–48. [Google Scholar] [CrossRef]
  22. Shah, P.A.; Chavda, V.; Hirpara, D.; Sharma, V.S.; Shrivastav, P.S.; Kumar, S. Exploring the Potential of Deep Eutectic Solvents in Pharmaceuticals: Challenges and Opportunities. J. Mol. Liq. 2023, 390, 123171. [Google Scholar] [CrossRef]
  23. Lu, W.; Liu, S. Choline Chloride–Based Deep Eutectic Solvents (Ch-DESs) as Promising Green Solvents for Phenolic Compounds Extraction from Bioresources: State-of-the-Art, Prospects, and Challenges. Biomass Convers. Biorefin. 2020, 12, 2949–2962. [Google Scholar] [CrossRef]
  24. Al-Maari, M.A.; Hizaddin, H.F.; Hayyan, A. COSMO-RS-Based Screening of Organic Solvents for Efficient Extraction of Rubber Seed Oil: Computational Prediction and Experimental Verification. Chem. Eng. Trans. 2023, 106, 1147–1152. [Google Scholar] [CrossRef]
  25. Panić, M.; Gunjević, V.; Radošević, K.; Bubalo, M.C.; Ganić, K.K.; Redovniković, I.R. COSMOtherm as an Effective Tool for Selection of Deep Eutectic Solvents Based Ready-To-Use Extracts from Graševina Grape Pomace. Molecules 2021, 26, 4722. [Google Scholar] [CrossRef] [PubMed]
  26. Rodrigues, V.H.S.; Vladic, J.; Pereira, J.; Monteiro, H.; Paiva, A.; Vargas, R.M.F.; Cassel, E.; Duarte, A.R.C. Green Approach for Obtaining Bioactive Compounds from Pterocaulon Polystachyum through Ultrasound-Assisted Deep Eutectic Solvent Extraction. Clean. Chem. Eng. 2025, 11, 100166. [Google Scholar] [CrossRef]
  27. Al-Maari, M.A.; Hizaddin, H.F.; Hayyan, A.; Hadj-Kali, M.K. Screening Deep Eutectic Solvents as Green Extractants for Oil from Plant Seeds Based on COSMO-RS Model. J. Mol. Liq. 2024, 393, 123520. [Google Scholar] [CrossRef]
  28. Wojeicchowski, J.P.; Ferreira, A.M.; Abranches, D.O.; Mafra, M.R.; Coutinho, J.A.P. Using COSMO-RS in the Design of Deep Eutectic Solvents for the Extraction of Antioxidants from Rosemary. ACS Sustain. Chem. Eng. 2020, 8, 12132–12141. [Google Scholar] [CrossRef]
  29. Zurob, E.; Cabezas, R.; Villarroel, E.; Rosas, N.; Merlet, G.; Quijada-Maldonado, E.; Romero, J.; Plaza, A. Design of Natural Deep Eutectic Solvents for the Ultrasound-Assisted Extraction of Hydroxytyrosol from Olive Leaves Supported by COSMO-RS. Sep. Purif. Technol. 2020, 248, 117054. [Google Scholar] [CrossRef]
  30. Xu, D.; Chow, J.; Weber, C.; Packer, M.; Baroutian, A.; Shahbaz, K. Evaluation of Deep Eutectic Solvents for the Extraction of Fucoxanthin from the Alga Tisochrysis lutea—COSMO-RS Screening and Experimental Validation. J. Environ. Chem. Eng. 2022, 10, 108370. [Google Scholar] [CrossRef]
  31. Fan, C.; Shan, Y.; Wen, L.; Cao, X. Extraction of Artemisinin Using Natural Deep Eutectic Solvent Selected by COSMO-RS. Sustain. Chem. Pharm. 2023, 33, 101096. [Google Scholar] [CrossRef]
  32. Melreles, M.A.A.; Zahedi, G.; Hatami, T. Mathematical Modeling of Supercritical Fluid Extraction for Obtaining Extracts from Vetiver Root. J. Supercrit. Fluids 2009, 49, 23–31. [Google Scholar] [CrossRef]
  33. Garcez, J.J.; Barros, F.; Lucas, A.M.; Xavier, V.B.; Fianco, A.L.; Cassel, E.; Vargas, R.M.F. Evaluation and Mathematical Modeling of Processing Variables for a Supercritical Fluid Extraction of Aromatic Compounds from Anethum graveolens. Ind. Crops Prod. 2017, 95, 733–741. [Google Scholar] [CrossRef]
  34. Bonfigli, M.; Godoy, E.; Reinheimer, M.A.; Scenna, N.J. Comparison between Conventional and Ultrasound-Assisted Techniques for Extraction of Anthocyanins from Grape Pomace. Experimental Results and Mathematical Modeling. J. Food Eng. 2017, 207, 56–72. [Google Scholar] [CrossRef]
  35. Lanjekar, K.J.; Rathod, V.K. Application of Ultrasound and Natural Deep Eutectic Solvent for the Extraction of Glycyrrhizic Acid from Glycyrrhiza glabra: Optimization and Kinetic Evaluation. Ind. Eng. Chem. Res. 2021, 60, 9532–9538. [Google Scholar] [CrossRef]
  36. Bassani, A.; García-Roldán, A.; Spigno, G.; Jauregi, P. Extraction of Phenolic Compounds from Spent Coffee Ground Using Natural Deep Eutectic Solvents: New Modeling Approach. J. Food Process Eng. 2024, 47, e14584. [Google Scholar] [CrossRef]
  37. Benítez-Correa, E.; Bastías-Montes, J.M.; Acuña-Nelson, S.; Quevedo-León, R. Deep Eutectic Solvent-Based Cocoa (Theobroma cacao L.) Bean Shell Flavonoid Release: A Comparative Study of Extraction Kinetic Models. J. Food Process Eng. 2025, 48, e70054. [Google Scholar] [CrossRef]
  38. Faisal, T.F.A.; Tun, H.; Ismail, F.; Amil, M.; Benjamin, Z.; Awang, M.A. Morinda citrifolia L. (Noni) Fruits: Optimising Extraction Kinetics of Yield and Flavonoids for Enhanced Antioxidant Activity at Different Temperatures. Eng. Appl. Sci. Res. 2024, 51, 626–638. [Google Scholar] [CrossRef]
  39. Han, C.; Yang, Z.; Chen, X.; Yan, L.; Zhang, Y. Ultrasound-Assisted Natural Deep Eutectic Solvents Extraction of Flavonoids from Hippophae rhamnoides: Optimization and Kinetics Studies. Chem. Eng. Process. Process Intensif. 2025, 211, 110244. [Google Scholar] [CrossRef]
  40. Wang, J.; Guo, Y.; Liu, F.; Zhang, X.; Wang, W.; Peng, Q. COSMO-RS Prediction and Experimental Verification of Deep Eutectic Solvents for Water Insoluble Pesticides with High Solubility. J. Mol. Liq. 2022, 349, 118139. [Google Scholar] [CrossRef]
  41. Klamt, A.; Eckert, F. COSMO-RS: A Novel and Efficient Method for the a Priori Prediction of Thermophysical Data of Liquids. Fluid Phase Equilib. 2000, 172, 43–72. [Google Scholar] [CrossRef]
  42. Paduszyn’ski, K.; Paduszyn’ski, P. An Overview of the Performance of the COSMO-RS Approach in Predicting the Activity Coefficients of Molecular Solutes in Ionic Liquids and Derived Properties at Infinite Dilution. Phys. Chem. Chem. Phys. 2017, 19, 11835–11850. [Google Scholar] [CrossRef] [PubMed]
  43. Dai, Y.; van Spronsen, J.; Witkamp, G.J.; Verpoorte, R.; Choi, Y.H. Natural Deep Eutectic Solvents as New Potential Media for Green Technology. Anal. Chim. Acta 2013, 766, 61–68. [Google Scholar] [CrossRef] [PubMed]
  44. Ruggieri, L.; Gea, T.; Artola, A.; Sánchez, A. Air Filled Porosity Measurements by Air Pycnometry in the Composting Process: A Review and a Correlation Analysis. Bioresour. Technol. 2009, 100, 2655–2666. [Google Scholar] [CrossRef] [PubMed]
  45. Rente, D.; Cvjetko Bubalo, M.; Panić, M.; Paiva, A.; Caprin, B.; Radojčić Redovniković, I.; Duarte, A.R.C. Review of Deep Eutectic Systems from Laboratory to Industry, Taking the Application in the Cosmetics Industry as an Example. J. Clean Prod. 2022, 380, 135147. [Google Scholar] [CrossRef]
  46. Mohammadpour, H.; Sadrameli, S.M.; Eslami, F.; Asoodeh, A. Optimization of Ultrasound-Assisted Extraction of Moringa Peregrina Oil with Response Surface Methodology and Comparison with Soxhlet Method. Ind. Crops Prod. 2019, 131, 106–116. [Google Scholar] [CrossRef]
  47. Shen, L.; Pang, S.; Zhong, M.; Sun, Y.; Qayum, A.; Liu, Y.; Rashid, A.; Xu, B.; Liang, Q.; Ma, H.; et al. A Comprehensive Review of Ultrasonic Assisted Extraction (UAE) for Bioactive Components: Principles, Advantages, Equipment, and Combined Technologies. Ultrason. Sonochem. 2023, 101, 106646. [Google Scholar] [CrossRef] [PubMed]
  48. Rebocho, S.; Mano, F.; Cassel, E.; Anacleto, B.; Bronze, M.d.R.; Paiva, A.; Duarte, A.R.C. Fractionated Extraction of Polyphenols from Mate Tea Leaves Using a Combination of Hydrophobic/ Hydrophilic NADES. Curr. Res. Food Sci. 2022, 5, 571–580. [Google Scholar] [CrossRef] [PubMed]
  49. Singleton, V.L.; Rossi, J.A. Colorimetry of Total Phenolics with Phosphomolybdic-Phosphotungstic Acid Reagents. Am. J. Enol. Vitic. 1965, 16, 144–158. [Google Scholar] [CrossRef]
  50. Everette, J.D.; Bryant, Q.M.; Green, A.M.; Abbey, Y.A.; Wangila, G.W.; Walker, R.B. Thorough Study of Reactivity of Various Compound Classes toward the Folin-Ciocalteu Reagent. J. Agric. Food Chem. 2010, 58, 8139–8144. [Google Scholar] [CrossRef] [PubMed]
  51. Pedras, B.; Salema-Oom, M.; Sá-Nogueira, I.; Simões, P.; Paiva, A.; Barreiros, S. Valorization of White Wine Grape Pomace through Application of Subcritical Water: Analysis of Extraction, Hydrolysis, and Biological Activity of the Extracts Obtained. J. Supercrit. Fluids 2017, 128, 138–144. [Google Scholar] [CrossRef]
  52. Meirelles, G.; Bridi, H.; Stolz, E.D.; Teixeira, H.F.; von Poser, G.L.; Rates, S.M.K. Nanoemulsion Improves Antinociceptive Activity of HP1, a Benzopyran from Hypericum polyanthemum. Planta Med. Int. Open 2017, 4, e82–e88. [Google Scholar] [CrossRef]
  53. Crank, J. The Mathematics of Diffusion; Oxford University Press: New York, NY, USA, 1975. [Google Scholar]
  54. Wang, Y.; Hu, Y.; Wang, H.; Tong, M.; Gong, Y. Green and Enhanced Extraction of Coumarins from Cortex Fraxini by Ultrasound-Assisted Deep Eutectic Solvent Extraction. J. Sep. Sci. 2020, 43, 3441–3448. [Google Scholar] [CrossRef] [PubMed]
  55. Xue, H.; Tan, J.; Li, Q.; Tang, J.; Cai, X. Optimization Ultrasound-Assisted Deep Eutectic Solvent Extraction of Anthocyanins from Raspberry Using Response Surface Methodology Coupled with Genetic Algorithm. Foods 2020, 9, 1409. [Google Scholar] [CrossRef] [PubMed]
  56. Chan, C.H.; Yusoff, R.; Ngoh, G.C. Modeling and Kinetics Study of Conventional and Assisted Batch Solvent Extraction. Chem. Eng. Res. Des. 2014, 92, 1169–1186. [Google Scholar] [CrossRef]
  57. So, G.C.; Macdonald, D.G. Kinetics of Oil Extraction from Canola (Rapeseed). Can. J. Chem. Eng. 1986, 64, 80–86. [Google Scholar] [CrossRef]
  58. Xavier, L.; Freire, M.S.; González-Álvarez, J. Modeling and Optimizing the Solid–Liquid Extraction of Phenolic Compounds from Lignocellulosic Subproducts. Biomass Convers. Biorefin. 2019, 9, 737–747. [Google Scholar] [CrossRef]
  59. Reche, C.; Rosselló, C.; Umaña, M.M.; Eim, V.; Simal, S. Mathematical Modelling of Ultrasound-Assisted Extraction Kinetics of Bioactive Compounds from Artichoke by-Products. Foods 2021, 10, 931. [Google Scholar] [CrossRef] [PubMed]
  60. da Silva, C.G.F.; Cassel, E.; Vargas, R.M.F.; Marczak, L.D.F. Selective Extraction of Saponins from Ilex paraguariensis St.-Hil. Unripe Fruits. Food Bioprod. Process. 2018, 111, 72–82. [Google Scholar] [CrossRef]
Figure 1. Molecular structure representation of the benzopyrans 6-isobutyryl-5,7-dimethoxy-2,2-dimethylbenzopyran (HP1), 7-hydroxy-6-isobutyryl-5-methoxy2,2-dimethylbenzopyran (HP2), and 5-hydroxy6-isobutyryl-7-methoxy-2,2-dimethylbenzopyran (HP3).
Processes 13 02351 g001
Figure 2. Charge density surface and the σ-profiles generated of the benzopyrans HP1, HP2, and HP3.
Processes 13 02351 g002
Figure 3. Absolute logarithmic activity coefficient at infinite dilution of HP1, HP2, and HP3 in 10 different DESs at 50 °C.
Processes 13 02351 g003
Figure 4. Chart displaying the sampling points quantified for HP1, HP2, and HP3, along with the curves generated by the mathematical model. Equal lowercase letters indicate no statistically significant differences (p < 0.05) in different benzopyran extraction times.
Processes 13 02351 g004
Figure 5. Chart displaying the quantified sampling points for TPC and the curve generated by the mathematical model. Different lowercase letters indicate statistically significant differences (p < 0.05) in TPC results using DES 1.
Processes 13 02351 g005
Figure 6. Comparative chart of the extraction yield difference between DES 1 and hexane. Different lowercase letters indicate statistically significant differences (p < 0.05) in benzopyran content using different solvents.
Processes 13 02351 g006
Table 1. Summary of DESs used for solubility screening in COSMOtherm.
DESNo.
HBAHBDMolar Ratio
Lactic AcidGlycine/Water3:1:31
Choline ChlorideGlycerol1:22
Choline ChlorideEthylene glycol1:23
BetaineGlycerol1:24
BetaineGlycerol1:35
BetaineLactic Acid1:26
ProlineGlycerol1:27
ProlineEthylene glycol1:28
ProlineLactic Acid1:29
LeucineGlycerol1:210
Table 2. CAS number, source, supplier purity, and molar mass of the compounds used in DES formation.
CompoundCAS NumberSourceSupplier Purity aMolar Mass (g/mol)
Lactic acid50-21-5Sigma-Aldrich (St. Louis, MO, USA)≥85.0%90.1
Glycine56-40-6Sigma-Aldrich (St. Louis, MO, USA)≥98.5%75.1
a Purity informed by the supplier. The reagents were used without further purification.
Table 3. Estimated parameters for DES extraction of specific compounds from H. polyanthemum.
HP1HP2HP3TPC
D [m2/s]6.09 × 10−126.67 × 10−121.46 × 10−117.40 × 10⁻¹²
k0.610.720.880.88
R20.980.990.990.98
MAPE [%]7.41%3.09%2.96%8.37%
Disclaimer/Publisher’s Note: The statements, opinions and data contained in all publications are solely those of the individual author(s) and contributor(s) and not of MDPI and/or the editor(s). MDPI and/or the editor(s) disclaim responsibility for any injury to people or property resulting from any ideas, methods, instructions or products referred to in the content.

