The density and viscosity data obtained from the experimental study were analyzed using machine learning techniques in Regression Learner, a toolbox of MATLAB R2024a. In this process, the dataset is partitioned into 85% training and 15% testing subsets using holdout validation. Subsequently, cross-validation combined with hyperparameter optimization is employed to enhance the reliability and generalizability of the predictive outcomes. Various statistical indicators and graphical outputs were generated during the regression analysis, enabling a comprehensive evaluation of model performance and predictive capability.
3.5.1. Machine Learning Modeling for Viscosity
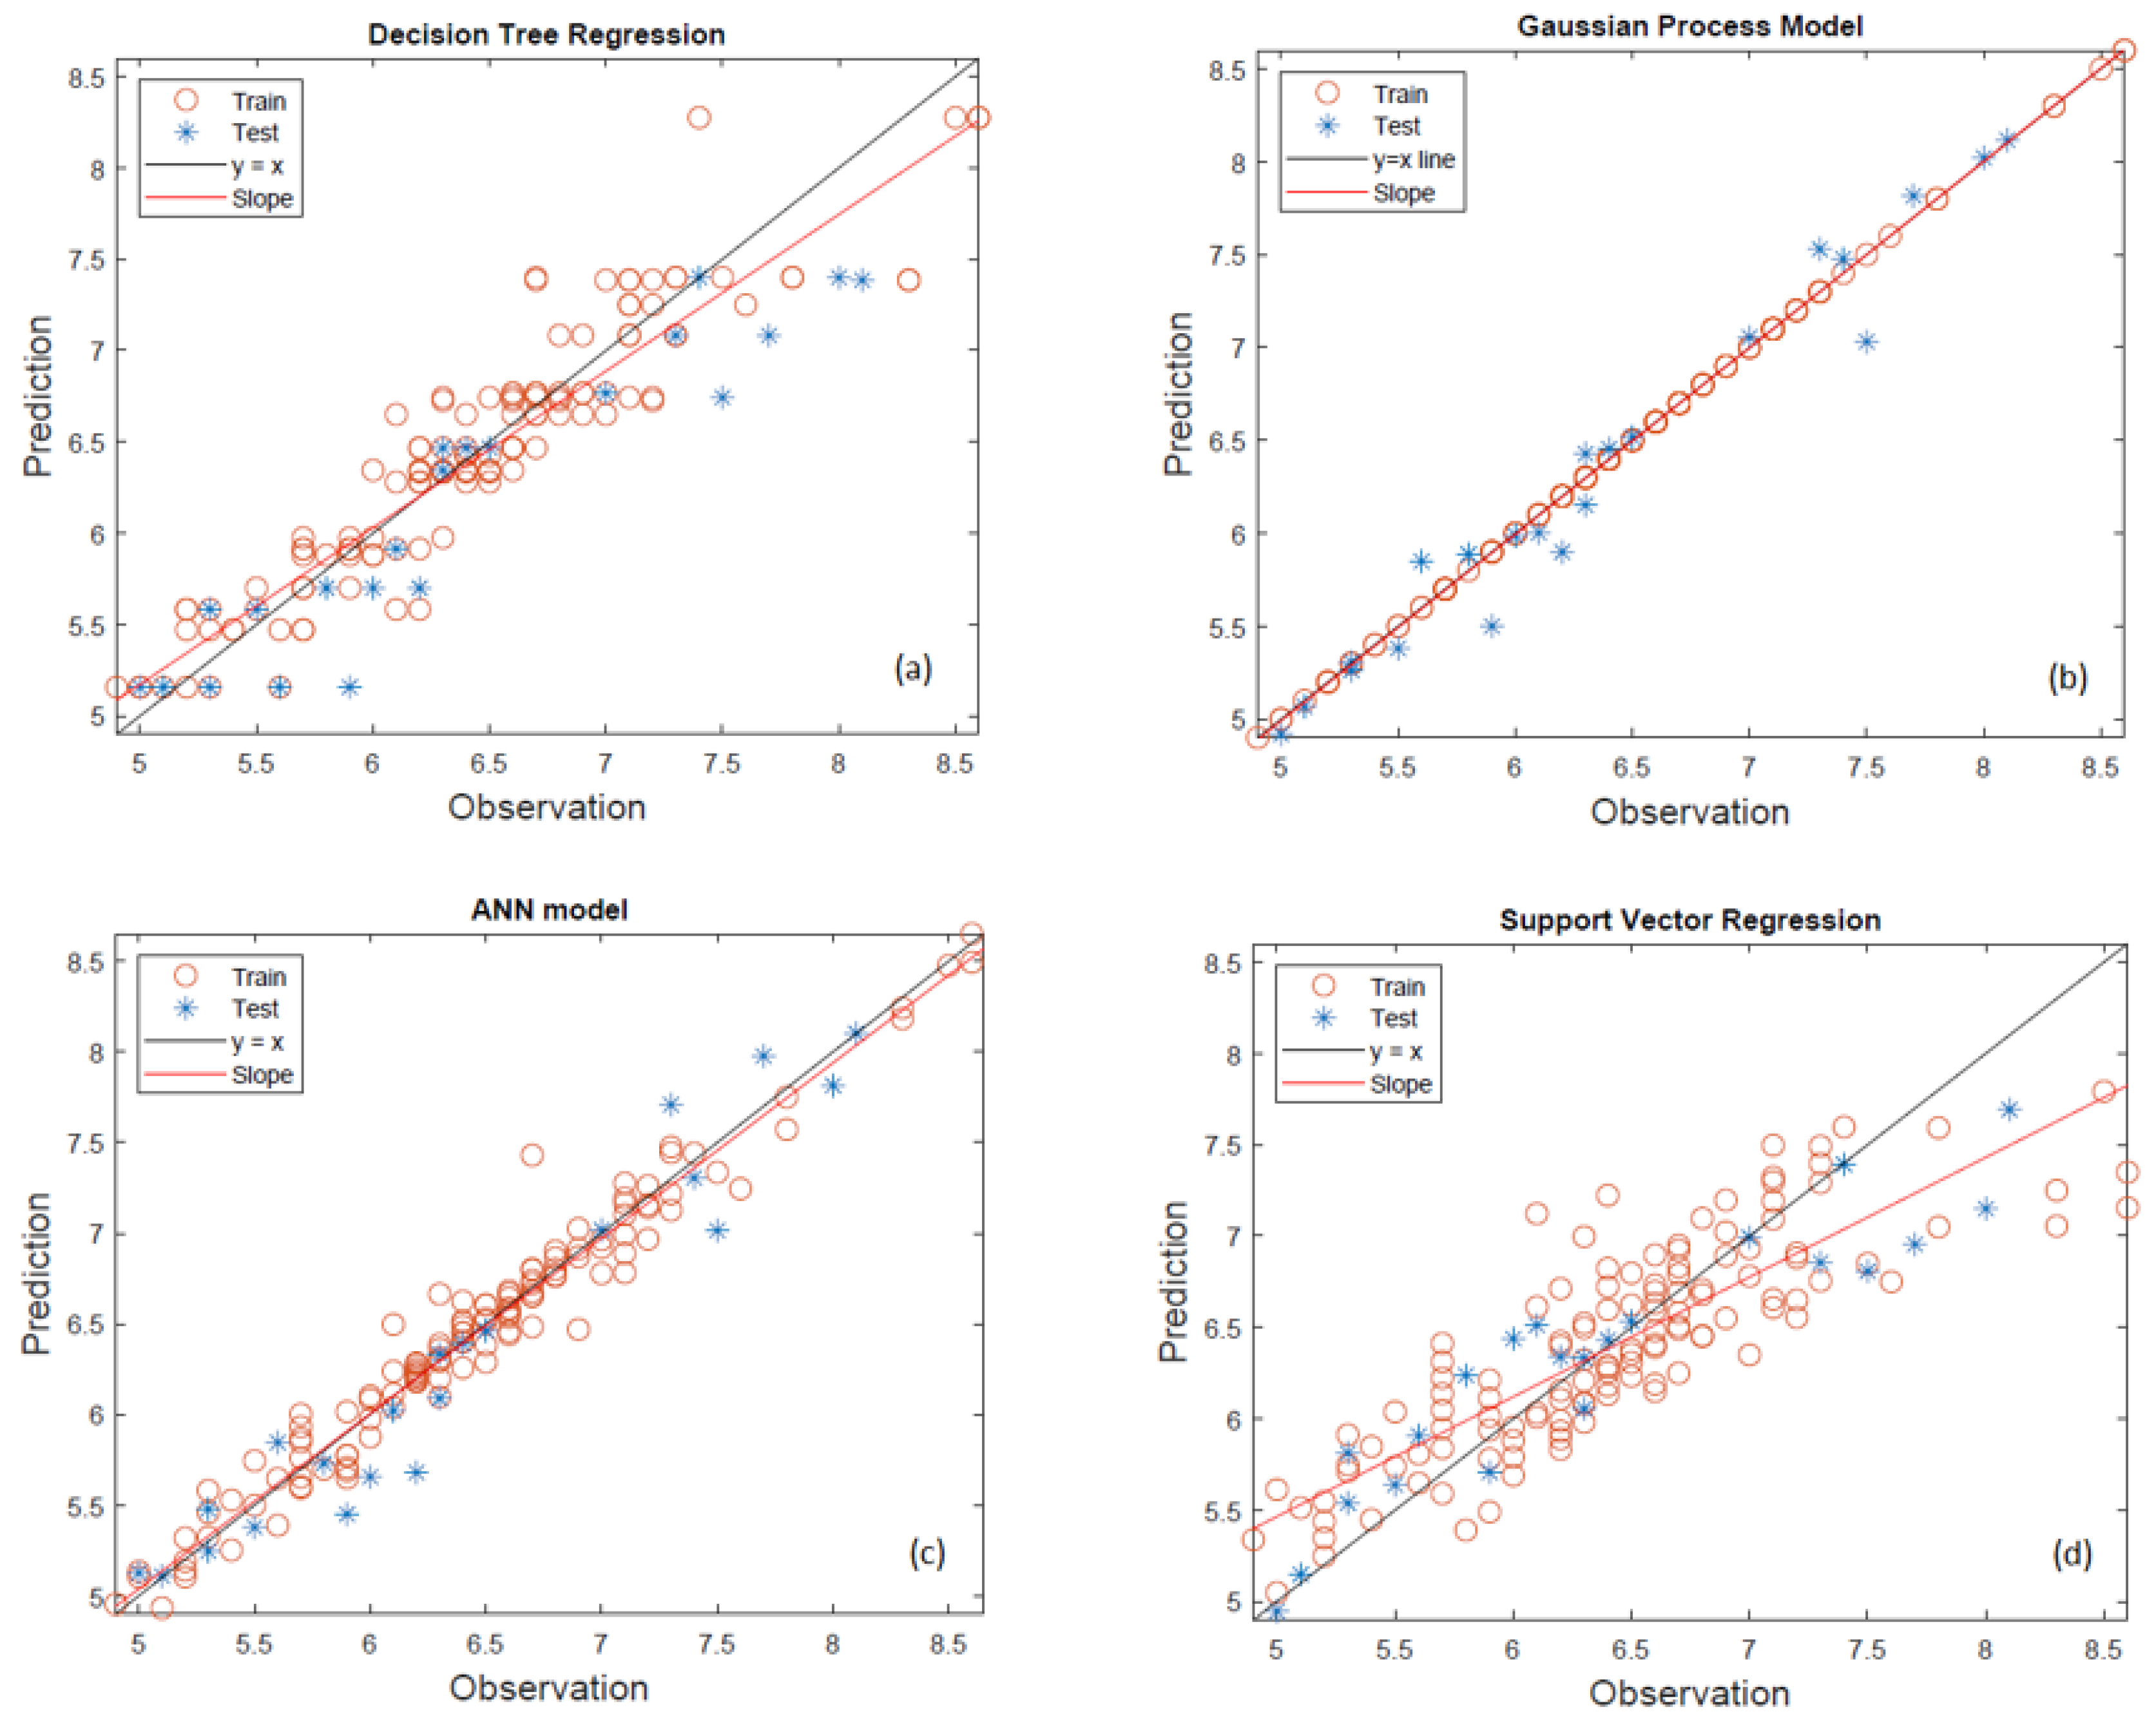
In the machine learning study conducted for viscosity, the viscosity values of 50 fuel blends measured at three different temperatures were modeled. The performances of the decision tree regression (DTR), Gaussian process regression (GPR), artificial neural network (ANN) and support vector regression (SVR) models for predicting the viscosity of the studied blends were evaluated through a comparison of predicted and observed values, as illustrated in
Figure 2 for the machine learning models.
In the DTR model given in
Figure 2a, the model demonstrates relatively poor generalization capacity, especially in the mid-to-high viscosity range. Although the training data show a clustering along the diagonal, the test data are scattered and deviate noticeably from the ideal line. This inconsistency is particularly pronounced for viscosities above 7.0 cP, where the model tends to underestimate the values. The slope of the regression line differs significantly from the unity line, indicating a lack of predictive robustness. The performance suggests that DTR may be prone to over-fitting, capturing local variations within the training set but failing to extrapolate effectively to unseen cases.
The Gaussian process regression (GPR) model given in
Figure 2b displays the most accurate and consistent predictions across the full viscosity range (5.0–8.5 cP). Both training and testing data points align very closely with the y = x line, and the slope of the regression line is nearly identical to the ideal. This reflects strong agreement between predicted and observed values and highlights the model’s ability to handle both linear and non-linear relationships effectively. The GPR model’s probabilistic framework and ability to provide smooth, continuous predictions make it particularly well-suited for modeling the relatively narrow yet nonlinear viscosity interval in this study. As shown in
Figure 2c, the ANN model also performs well, capturing the general trend of the viscosity data across both training and testing sets. The predictions are reasonably close to the ideal line, though slight deviations are observed, especially in the lower and upper ends of the viscosity range. While the model tends to slightly underestimate some high-viscosity values, the regression slope remains close to unity, suggesting overall reliability. These results indicate that the ANN model effectively learns the underlying patterns in the dataset, although its performance could potentially be further improved with additional optimization or regularization. The support vector regression model given in
Figure 2d exhibits the weakest performance across the studied viscosity interval. The predicted values, particularly for the testing dataset, are widely dispersed and fail to align with the observed values. The regression line deviates substantially from the y = x line, indicating a consistent bias in the model’s predictions. SVR struggles particularly in capturing the non-linear variation in the mid-to-high viscosity range (6.5–8.5 cP), which may be due to limitations in kernel selection or insufficient tuning of the model parameters. Four machine learning models (DTR, GPR, SVR, and ANN) were evaluated for their ability to predict viscosity based on the available dataset. The performance metrics, including coefficient of determination (R
2), adjusted R
2 (adjR
2), root mean square error (RMSE), normalized RMSE (NRMSE), and average absolute error (AAE), are summarized in
Table 6.
The GPR model consistently outperforms all others, achieving the highest R2 value (0.9636), lowest RMSE (0.17709), and lowest AAE (0.01968), confirming its ability to pro-duce highly accurate and reliable predictions across the full viscosity range. The ANN model also performs well, with an R2 of 0.9315 and a relatively low RMSE (0.24286), demonstrating that it is capable of capturing non-linear relationships in the data while maintaining good generalization.
By contrast, the DTR and SVR models yield almost identical performance metrics (R2 ≈ 0.83, RMSE ≈ 0.38, AAE ≈ 0.044), suggesting limited capability in accurately modeling viscosity behavior. Both models tend to show larger deviations from actual values, particularly in the mid-to-high viscosity region (6.5–8.5 cP), which is critical in fuel performance applications. The relatively high normalized RMSE values (≈0.056) further indicate that both DTR and SVR may be sensitive to outliers or insufficiently tuned to the dataset’s complexity.
When combining both statistical metrics and visual insights, Gaussian process regression (GPR) emerges as the most effective model for predicting viscosity in the range of 5.0–8.5 cP. Its superior accuracy, low error margins, and strong generalization across unseen data make it highly suitable for modeling complex physicochemical properties. The artificial neural network (ANN) model also shows strong performance and may be considered a practical alternative when computational efficiency or data scaling flexibility is desired.
In contrast, decision tree regression and support vector regression, while producing moderately acceptable results, fall short in predictive precision and should be used with caution or after further optimization. These findings emphasize the importance of selecting machine learning algorithms not only based on training accuracy but also on their ability to generalize across critical operational ranges; a key requirement in material property prediction and process modeling.
In summary, the findings of this study highlight the importance of choosing machine learning algorithms that are appropriate for the structure of the dataset and the complexity of the target variable. In applications where precise viscosity prediction is required, for example, for fuel formulation and engineering design, the Gaussian process regression model demonstrated the most consistent and effective performance.
3.5.2. Machine Learning Modeling for Density
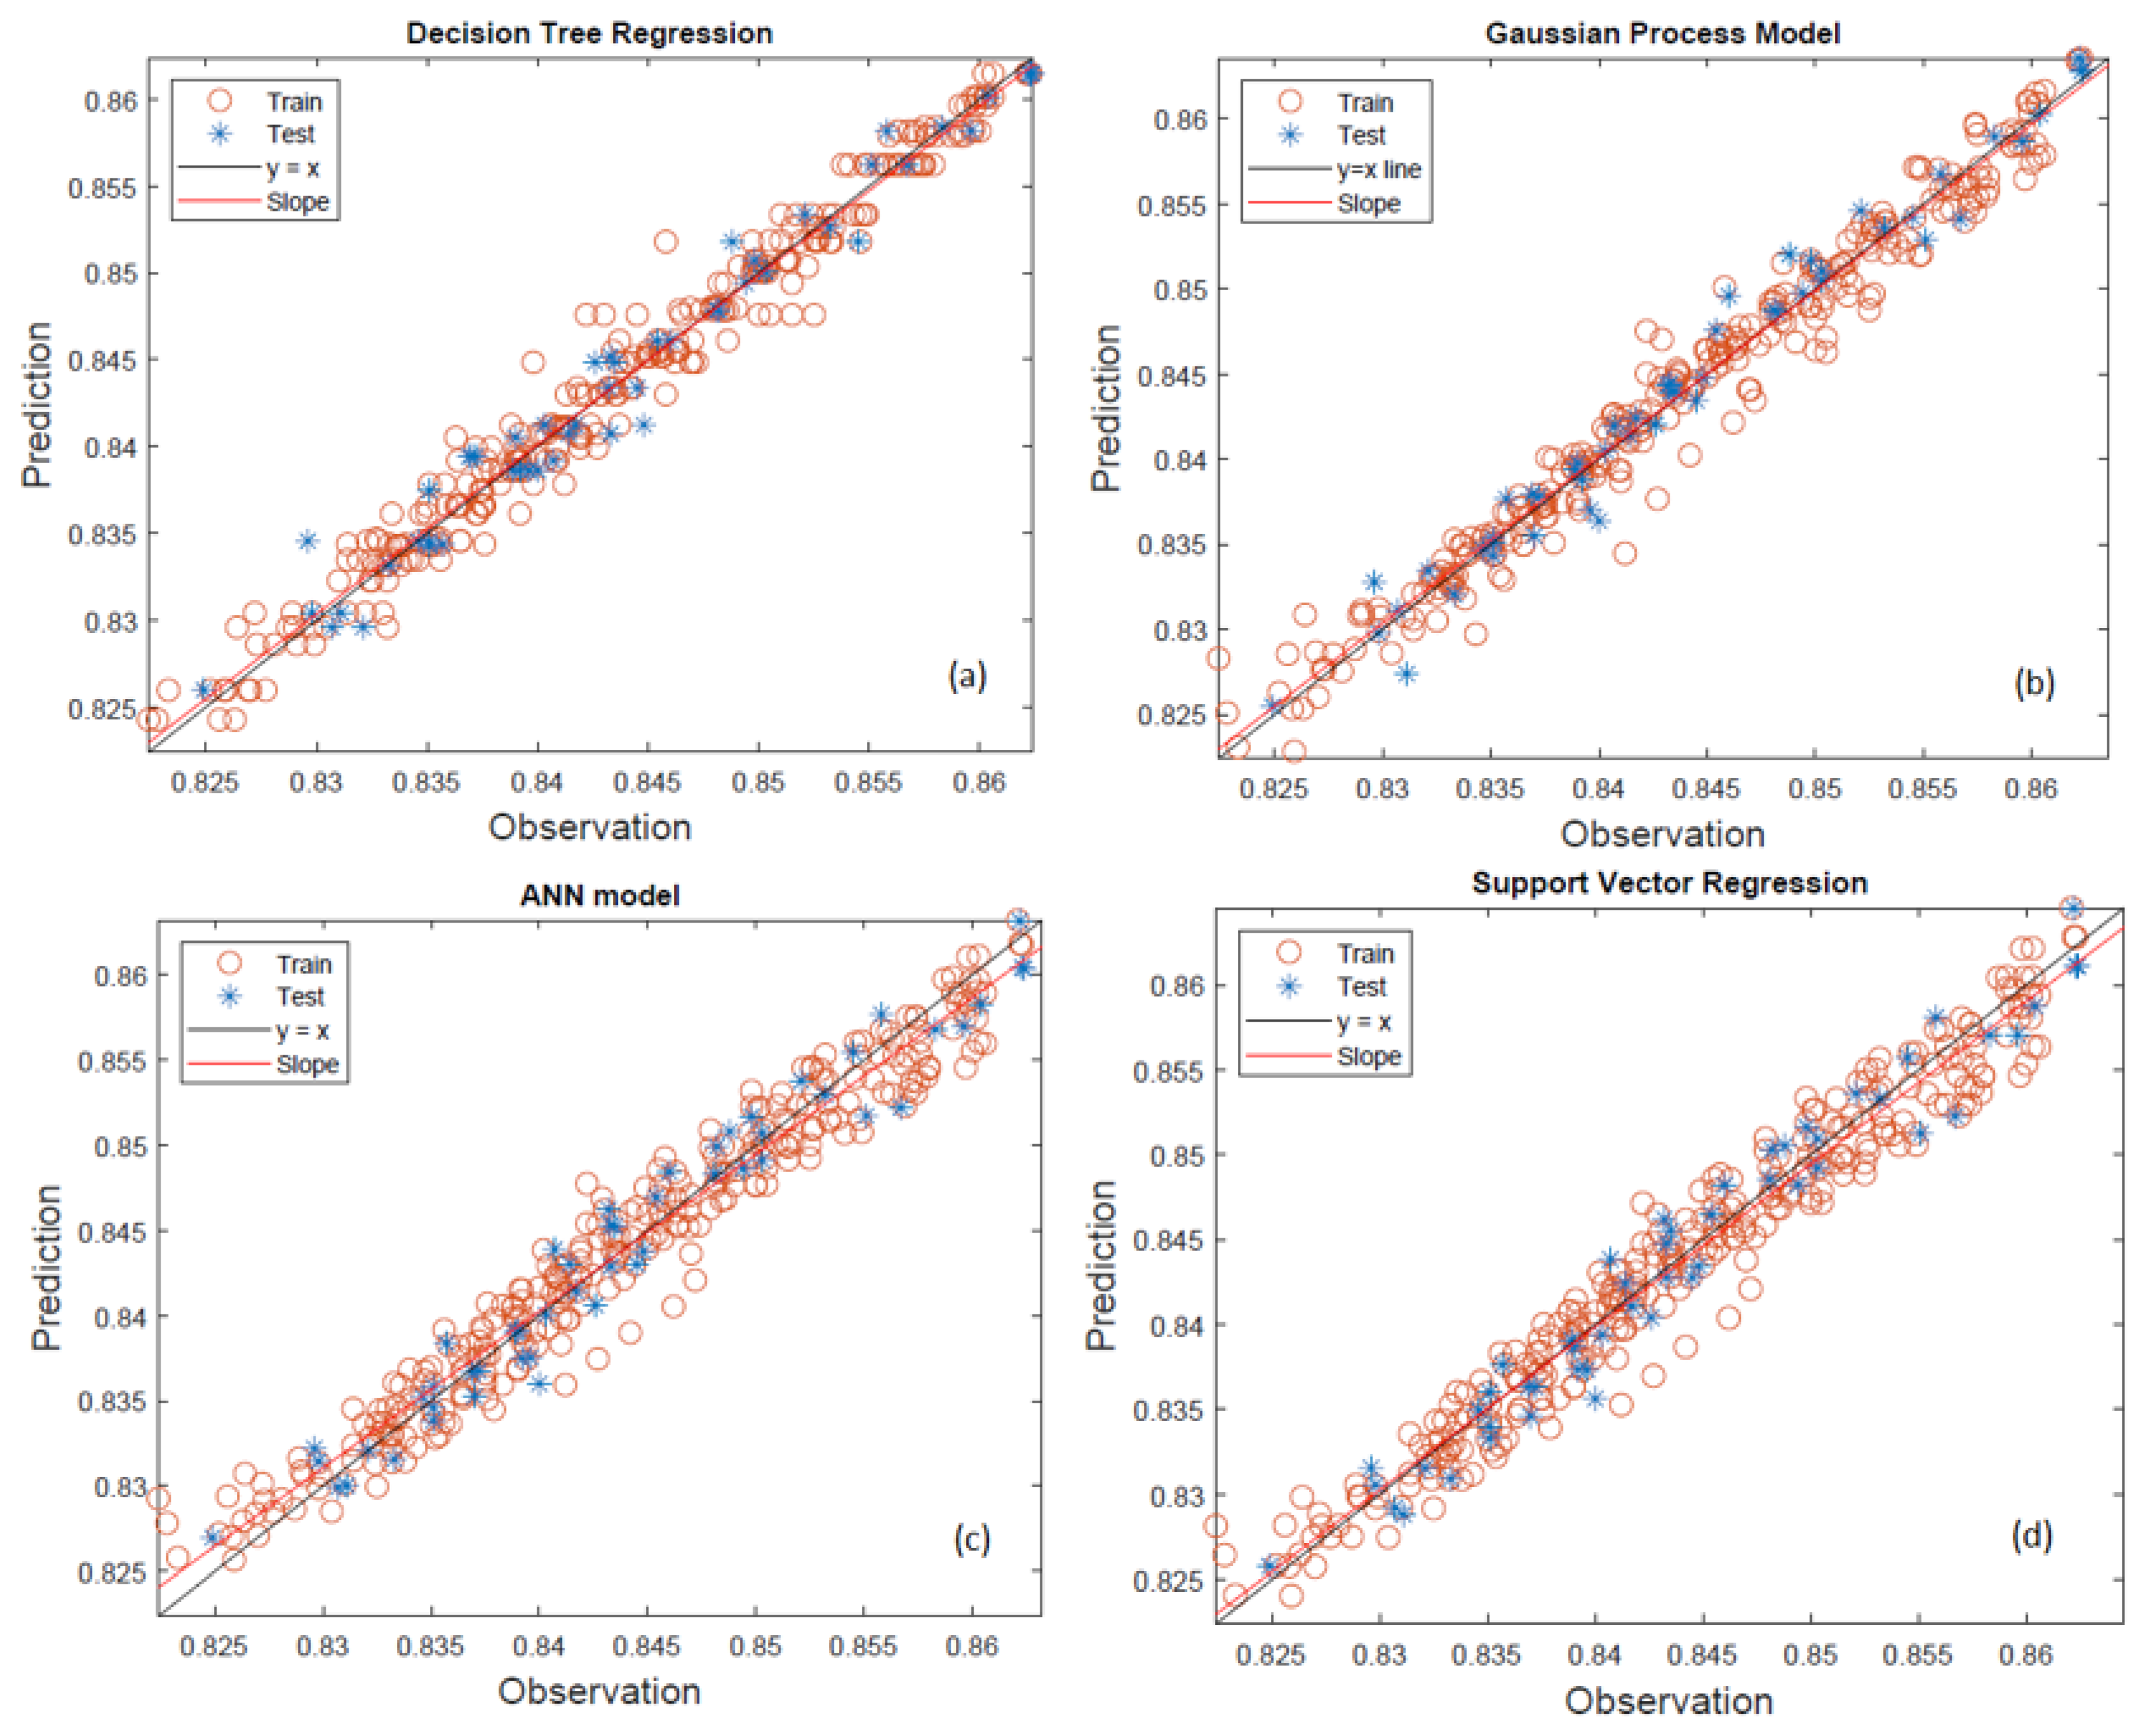
In the machine learning study conducted for viscosity, the viscosity values of 50 fuel blends measured at seven different temperatures (10 °C to 40 °C) were modeled. The same machine learning models (DTR, GPR, ANN, SVR) were applied to predict the density values of the studied blends, as illustrated in
Figure 3 for the machine learning models.
The decision tree regression model shows a moderate predictive performance, with noticeable scatter around the ideal line of equality (y = x), especially among the training data in
Figure 3a. The red circles (training) tend to deviate more than the blue stars (test), suggesting that the model may be overfitting specific patterns in the training set rather than learning the underlying relationship. While many data points lie close to the reference line, a systematic underestimation and overestimation can be seen at both lower (<0.835 g/cm
3) and upper (>0.855 g/cm
3) ends of the density spectrum. The fitted slope line deviates slightly from the ideal 45° line, indicating that the regression is not capturing the trend perfectly across the entire range. Additionally, there is a lack of homogeneity of variance, as the variance of the residuals seems to change across the density values, lower density predictions are more accurate, while higher densities show increasing deviation. This non-uniform spread may stem from the model’s inability to capture complex nonlinear relationships due to its inherently piecewise-constant structure. In the context of fuel property modeling, where small deviations can impact formulation decisions, this limitation reduces DTR’s reliability. DTR is interpretable and easy to implement, but in this study, it displays insufficient generalization capability, potentially due to the narrow range and high precision required for density predictions. Its performance suggests it may be better suited as a benchmarking or supplementary model rather than a primary predictor in such regression tasks. Gaussian process regression demonstrates the most accurate and reliable performance of the four models shown in
Figure 3b. Both training and test data points show a tight clustering along the y = x line, with very few deviations. The blue test stars closely follow the distribution of the training points, which indicates excellent model generalization and robustness to unseen data. The slope line overlaps almost perfectly with the identity line, reflecting near-ideal regression behavior with negligible bias. The spread of data points is also homogeneous across the entire observed range (0.8250–0.8600 g/cm
3), meaning that the model performs consistently regardless of the density value. This uniformity is particularly important in precision-sensitive applications like fuel blending, where a 0.001 g/cm
3 deviation could lead to real-world performance issues. GPR’s Bayesian non-parametric nature allows it to model complex, nonlinear dependencies while providing predictive uncertainty, which makes it highly advantageous in experimental modeling. GPR provides superior predictive accuracy, minimal residual error, and consistent behavior across all data segments. It is the most suitable model for high-resolution regression problems like predicting the density of ternary fuel blends in this study. The artificial neural network model also shows strong predictive capability, closely rivaling GPR in visual alignment between predictions and actual observations in
Figure 3c. The training data and test data exhibit minimal spread and follow the y = x reference line closely. However, compared to GPR, a slightly higher dispersion is observed, especially at the boundaries of the density range (near 0.8250 and 0.8600 g/cm
3). This suggests that while the model learns general trends well, it may struggle slightly in edge cases or regions with sparse data representation. ANN is known for its ability to model complex nonlinear relationships, and this is reflected in its close-fitting slope line. However, the variability in prediction accuracy across the density range indicates that additional hyperparameter tuning (e.g., learning rate, hidden layers) or data preprocessing might further enhance performance. There is also a possibility that the training dataset, though narrow in density range, has a non-uniform sample distribution, which could affect ANN’s interpolation ability. The ANN model performs robustly with high correlation to observed data, but small improvements are needed for edge case precision. It is a strong candidate for primary modeling, especially when paired with careful optimization and regularization techniques. Support vector regression presents a reasonably good fit to the data but with noticeably more scatter compared to the GPR and ANN models in
Figure 3d. The training points show alignment with the y = x line but with wider variance, particularly in the mid-to-upper range of the density spectrum (e.g., 0.845–0.855 g/cm
3). The test data follow the general trend but include several outliers, indicating that the model may be sensitive to the kernel choice or hyperparameter settings like the regularization parameter (C) and epsilon (ε) tube. Although the slope line lies close to the ideal 45° reference, the asymmetrical spread suggests that the model exhibits bias in certain subregions, possibly due to an underfitting effect in localized areas. This may be due to the margin-based learning mechanism in SVR, which prioritizes fitting within a defined tolerance rather than minimizing absolute errors. SVR captures the overall relationship but with less precision and greater variability, especially under limited or unevenly distributed datasets. Its performance in this study indicates that parameter optimization is essential for SVR to be competitive with ANN and GPR in density prediction tasks. Four machine learning models (DTR, GPR, SVR, and ANN) were applied to predict density within the studied formulation intervals (0.825–0.86 g/cm
3). The key performance metrics, including the coefficient of determination (R
2), adjusted R
2 (adjR
2), root mean square error (RMSE), normalized RMSE (NRMSE), and average absolute error (AAE), are summarized in
Table 7.
In examining the plots, all models display a strong linear correlation between predicted and observed density values, with predictions clustering around the ideal y = x reference line. However, this apparent uniformity masks subtle deviations in alignment and distribution that become more evident when contrasted with the numerical metrics in
Table 7. For instance, the model showing the most visually coherent clustering and minimal scatter, particularly in the central region of the density range, is the one that also scores the highest across all metrics: Gaussian process regression (GPR), with an R
2 of 0.9743, RMSE of 0.00151, and AAE of 0.00132. These values reflect not only a high degree of fit but also an exceptionally low prediction error, which is visually supported by the minimal deviation of both training and test data from the ideal prediction line.
Yet, the 0.0025 difference in R2 between GPR and the second-best model decision tree regression (DTR), which achieved an R2 of 0.9718, RMSE of 0.00158, and AAE of 0.00144, is not trivial within such a constrained density range. While DTR’s metrics suggest near-identical predictive performance, the scatter plot tells a slightly different story: data points, particularly in the test set, show visibly more variance and drift from the ideal line, especially at the upper and lower ends of the density spectrum. This inconsistency suggests that although DTR can approximate global trends effectively, its segmented, hierarchical structure may limit its local smoothness, resulting in slight overfitting to the training data patterns and reduced generalization outside high-density clusters.
Similarly, artificial neural networks (ANN) and support vector regression (SVR) yield slightly lower performance metrics (R2 values of 0.9628 and 0.9609, respectively), which correspond closely to what is observed in the parity plots: both models produce predictions aligned with the target trend but exhibit more pronounced dispersion around the y = x line, especially under conditions where data density is low. While their RMSE and AAE values (ANN: 0.00182 and 0.00179; SVR: 0.00187 and 0.00189) remain within an acceptable range for practical modeling, the greater spread of residuals in both models hints at less precise calibration to the subtle nonlinearity of the dataset. In summary, the integration of graphical and statistical evaluations confirms that GPR stands out as the most robust and precise modeling approach for density prediction in this study, while the overall model performances emphasize the critical role of both algorithm selection and data structure in high-resolution regression tasks.
Table 8 presents a comparative overview of existing research focused on ternary bio-diesel blends and their modeling approaches. When analyzed in relation to the presented literature, the current study demonstrates several distinguishing strengths in both methodological scope and predictive performance. First, while prior works have often focused on limited blend compositions such as single biodiesel–diesel–alcohol ratios or specific temperature points, this study investigates a broader matrix of 50 ternary blends, encompassing varied biodiesel concentrations and alcohol types (ethanol and propanol) across a temperature range of 10 °C to 40 °C. This provides a richer dataset and allows for more generalizable conclusions regarding fluid properties under operationally relevant conditions. Second, in contrast to earlier studies where the sample size ranged from 8 to approximately 60, the present study incorporates 100 samples (2 × 50 measurements for density and viscosity), thus enhancing the statistical robustness of the machine learning models employed. Furthermore, regarding modeling accuracy, the current study achieves R
2 values of 0.974 for density and 0.963 for viscosity using GPR, outperforming or matching the performance metrics reported in other studies. For example, the study using artificial neural networks with over 1000 samples reported high accuracy (R
2 = 0.998), but it does not simultaneously model both density and viscosity within a ternary fuel system context, nor does it explore blend-level variations as comprehensively. On the other hand, the present work adopts a multi-model comparative approach (DTR, GPR, SVR, ANN), offering insights into the relative performance and generalization ability of different algorithms, in contrast to most previous works that utilized only a single model type, limiting comparative interpretability. Finally, the comprehensive blend coverage, balanced dataset size, dual-property modeling (density and viscosity), and superior predictive performance position this study as a significant contribution to the field of biodiesel blend optimization and machine learning-based property estimation.


