Abstract
Denitrification technology in thermal power plants plays a critical role in reducing nitrogen oxide (NOx) emissions, thereby improving air quality and mitigating climate change. This study conducts a numerical simulation of the SCR (Selective Catalytic Reduction) system at the Chizhou Power Plant to optimize its flow field configuration. The original system exhibited severe flow non-uniformity, with local maximum velocities reaching 40 m/s and a velocity deviation coefficient of 28% at the inlet of the first catalyst layer. After optimizing the deflector design, the maximum local velocity was reduced to 21 m/s, and the velocity deviation coefficient decreased to 14.1%. These improvements significantly enhanced flow uniformity, improved catalyst efficiency, and are expected to extend equipment service life. The findings provide a practical reference for the retrofit and performance enhancement of SCR systems in similar coal-fired power plants.
1. Introduction
In modern society, with the rapid development of the economy and the acceleration of industrialization, the demand for electricity continues to rise, and the power production industry is faced with severe problems of energy consumption and environmental pollution [1]. As the core facilities of electric power production, boiler power plants exemplify the problem of energy consumption; this issue has attracted more and more attention, especially in regards to the balance between efficient energy utilization and environmental protection emissions, which represents a huge challenge [2].
Because boiler power plants are representative of a high-energy-consuming industry, the energy efficiency level of boiler power plants is directly related to the energy utilization efficiency of the whole power industry [3]. In the past few decades, with the continuous development and application of energy-saving technology, China’s boiler power plants have made remarkable progress in energy efficiency, especially in the innovative application of combustion technology, heat energy recovery, and frequency conversion speed regulation, which has promoted an improvement in energy efficiency [4]. According to statistics, in recent years, many newly built and renovated power plants have benefited from the introduction of advanced energy-saving equipment and technology; their energy consumption rates have been greatly reduced, and the energy consumption of some power plants has been close to the international advanced level, significantly reducing resource waste and environmental pollution [5]. These technologies include but are not limited to low-nitrogen combustion technology, combustion optimization control, and waste gas waste heat recovery and utilization, and their application effectively improves the energy utilization efficiency of the boiler system [6].
However, although China’s power industry has made some progress in improving energy efficiency, the challenges associated with aging boiler infrastructure remain significant [7]. In particular, structural integrity and material reliability have become major limiting factors in the efficient operation of older boiler systems [8]. Over prolonged operation cycles, critical components such as economizers, superheaters, and water walls experience thermal fatigue, creep, corrosion, and stress-induced cracking, all of which undermine the long-term reliability of the system [9]. These failures not only result in frequent maintenance downtime but also limit safe operational parameters, thereby restricting the implementation of advanced energy-saving technologies. Recent studies emphasize the role of material degradation and component failure in constraining performance enhancement in legacy units, highlighting the need for comprehensive retrofitting strategies that combine thermal flow optimization with structural assessment [10]. Therefore, in addition to flow field modifications, improving the mechanical reliability of boiler systems is essential to achieving sustainable upgrades in older power plants.
At present, boiler denitrification technologies mainly include low-nitrogen combustion technology, selective catalytic reduction (SCR) technology, and selective non-catalytic reduction (SNCR) technology [11]. Low-nitrogen combustion technology reduces NOx generation from the source by optimizing the combustion process and adjusting the working mode of the burner [12]. SCR technology converts NOx into harmless gases (such as nitrogen and water vapor) through catalysts, which is a common and efficient denitrification technology [13]. The SNCR technology involves spraying a reducing agent (such as ammonia or urea) into the boiler furnace to react with NOx, thereby reducing NOx emissions [14]. Although these technologies have achieved remarkable denitrification effects to a certain extent, the applicability and effects of different types of denitrification technologies in different boiler systems are still varied, so it is necessary to choose the most appropriate denitrification scheme according to the specific boiler type, fuel characteristics, and emission requirements [15]. Globally, SCR remains the most effective and widely implemented post-combustion NOx reduction technology, especially in retrofitting large-scale coal-fired units [13]. Kurulekar, M. et al. [16] evaluated retrofit strategies for aged power plants and identified flow uniformity and catalyst accessibility as key determinants of retrofit success. Girard, J. et al. [17] analyzed the impact of the ratio of ammonia to nitrogen oxides on SCR performance. Moreover, Hwang, S.-C. et al. [18] used numerical analysis to modify the SCR system on the diesel engine.
In recent years, a number of CFD studies have coupled flow dynamics with NOx chemical reaction mechanisms to simulate SCR reactor performance more realistically. For instance, Huang, H. et al. [19] established the SST k-ω turbulence model, and predicted and evaluated the impact heat transfer of the jet in the turbulent trough. Moreover, Zhang, W. et al. [20] analyzed and summarized the application of computational fluid dynamics (CFD) in floating offshore wind turbine (FOWT) dynamics. In addition, Li, X. et al. [21] conducted experimental and modeling studies on the pressurized entrainment flow reactor, and analyzed the NOx emissions from pressurized oxygenated biomass combustion. These studies provide useful benchmarks and design principles that complement our flow-field-based optimization work.
In order to better understand how to deal with the problems of energy efficiency improvement and denitrification technology application in the actual operation of boiler power plants, this paper selected the Chizhou Power Plant as the research object to analyze its experience and achievements in the process of denitrification system transformation. The Chizhou Power Plant, the subject of this case study, has been in operation since the early 2000s and primarily uses pulverized coal as its fuel source. Over the past two decades, the plant has undergone multiple rounds of technological upgrades to improve its environmental performance. However, challenges related to flow field inhomogeneity in SCR denitrification systems remain, which inspired the retrofit projects discussed in this article. The diagram of the flow plate after modification is shown in Figure 1. In the original boiler denitrification system of the Chizhou Power Plant, there were some obvious flow field design problems, especially at the inlet elbow of the SCR catalyst; the flow field distribution was uneven, and the local high-speed flow zone and poor flow field deviation seriously affected the denitrification effect. Through the numerical simulation of the denitrification system of the boiler in the power plant, it is found that the design of two deflectors and outlet deflectors at the inlet elbow of the SCR catalyst is unreasonable, which leads to the uneven flow field and the low working efficiency of the catalyst.
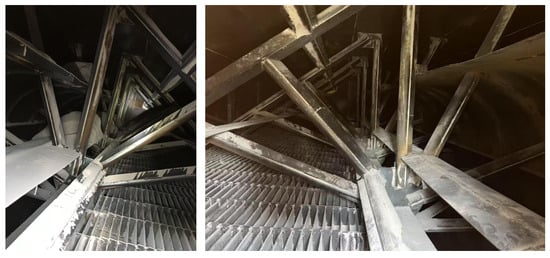
Figure 1.
The diagram of the flow plate after modification.
In order to solve this problem, optimization measures were adopted at the Chizhou Power Plant to adjust the flow field distribution and optimize the flow condition of the SCR catalyst inlet. By improving the design of the baffle, the local high-speed flow zone at the elbow is reduced, and the uniformity of the flow field and the reaction efficiency of the catalyst are improved. The implementation of this transformation scheme has significantly improved the denitrification efficiency of the SCR catalyst, effectively reducing the emission of nitrogen oxides and achieving remarkable results in improving the stability of the system operation and in saving energy.
It can be seen from the transformation case of the Chizhou Power plant that the optimization design of the boiler denitrification system and the flow field regulation are of great significance to the improvement of the denitrification effect. With the continuous development of numerical simulation technology, in the future, more power plants will be able to further improve the denitrification efficiency of their systems and reduce environmental pollution; and the green development of boiler power plants will be promoted through accurate flow field simulation and design optimization when retrofitting denitrification systems [22].
The challenges in energy utilization and the environmental protection of boiler power plants are still severe, but with the continuous innovation and improvement of energy-saving technology and denitrification technology, the energy efficiency and environmental protection performance of boiler power plants will be further improved [8]. Through the case analysis of the denitrification system transformation of the Chizhou Power Plant, we can see that through technological innovation and system optimization, the boiler power plant has experienced remarkable progress in improving energy efficiency and reducing emissions. In the future, with the in-depth promotion of the concept of green development, boiler power plants will play a more important role in energy saving, carbon reduction, and environmental protection.
2. Models, Algorithms, and Networks Used for Numerical Simulation
2.1. Software Platform Used for Simulation
The numerical simulation of this project is based on the Computational Fluid Dynamics (CFD) methodology, and the CFD software platform used is ANSYS FLUENT. The software version is ANSYS FLUENT 2022R1. ANSYS FLUENT is widely used to simulate complex flow, heat exchange, chemical reactions, and multi-physics coupling problems. The CFD solution process is generally divided into three basic steps: pre-processing, solving for the flow field, and post-processing. In the pre-processing stage, the computational domain is discretized by mesh generation technology, and the appropriate boundary conditions, initial conditions, and physical models are set according to the needs of the physical problem. In the stage of solving the flow field, appropriate numerical methods (such as the finite volume method, finite element method, etc.) are used to solve the fluid flow equation system, and the flow field distribution and heat transfer of the fluid in the whole calculation domain are obtained. In the post-processing stage, the calculation results are analyzed and displayed by visual means, and the required physical quantities (such as velocity field, pressure field, temperature field, etc.) are extracted, so as to provide a decision-making basis for engineering design and optimization.
2.2. Basic Governing Equations
The three laws of fluid mechanics (the law of conservation of mass, Newton’s second law, and the law of conservation of energy) are the laws of physics that all fluid motion must obey [23]. These laws are described in CFD in the form of governing equations, which are precisely solved by the finite difference method at each discrete point of the fluid.
The continuity equation is a mathematical expression of the law of conservation of mass followed in the motion of a fluid, and is often in the form of a differential equation when solving the distribution of physical quantities such as velocity and pressure in the flow field. There are two commonly used analysis methods for deriving the continuity equation in differential form: one is the micro-element volume control analysis method; the other is the finite control body analysis [24]. Here we choose the former to illustrate the continuity equation, and the expression is as follows:
where ρ is the density of the fluid, t is the time, and ui is the velocity component of the fluid in the i direction.
Newton’s second law states that the net force acting on a unit element is equal to the rate of change of fluid velocity over time, and the expression is as follows:
where p is the pressure, τ is the stress, f is the volume force per unit mass, and is the acceleration of the element.
The law of conservation of energy shows that the temporal rate of change of the total energy in the body of a micro-element is equal to the sum of the work done by the external force per unit time and the heat transferred to it by the outside world, and the expression is as follows:
In the formula, cp represents the specific heat capacity of the fluid, WSQS is the net heat flux entering the control volume, including the absorption or emission of body heat, chemical reaction heat, and custom volume heat sources, etc.
2.3. Turbulence Model Selection
The simulation object has strong turbulent characteristics. According to the accuracy and computational effort, a two-equation model is selected, including equations for turbulent kinetic energy and its dissipation rate. The turbulent kinetic energy transport equation is derived through precise equation derivation, and the dissipation rate equation is obtained through the physical derivation and mathematical simulation of the similar prototype equation. This model assumes that the flow is fully turbulent, and the influence of molecular viscosity can be ignored. Therefore, the transport equations for the standard turbulent kinetic energy k and turbulent dissipation rate ε are composed of the following two equations:
In the equations, Gk represents the turbulent kinetic energy term generated by the laminar velocity gradient; Gb is the turbulent kinetic energy term generated by buoyancy; YM represents the contribution term of the turbulent pulsation expansion to the global flow in compressible flow; C1ε, C2ε, and C3ε are constants; σk and σε are the turbulent Prandtl numbers of k equations and ε equations; and Sk and Sε are user-defined turbulent dissipation source terms.
The turbulent viscous is determined by the following:
where Cμ is a constant.
Gk denotes the turbulent flow energy. The exact k equation defines it as follows:
2.4. Geometry
According to the drawings, the denitrification system was modeled 1:1, and the calculation domain was from the outlet of the economizer to the outlet of the denitrification reactor. The established geometry model is shown in Figure 2.
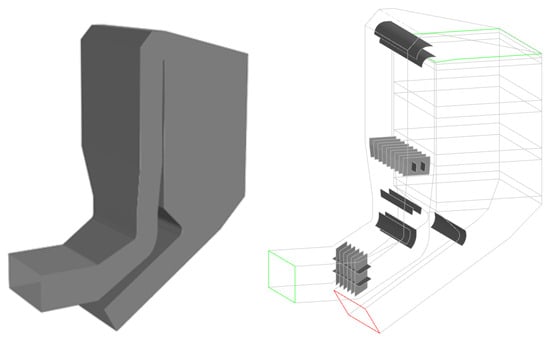
Figure 2.
Geometry and geometric model used for the numerical simulation.
2.5. Meshing
In this study, the geometry model was meshed using the ANSYS Fluent Mesh software platform, and the mesh type was Polyhedral Mesh.
Due to the mathematical principle of the finite volume method (FVM) in numerical solving, the use of polyhedral mesh elements has natural advantages in terms of computational convergence and numerical stability compared with traditional tetrahedral elements.
The final result of this meshing is a total of 2.02 million mesh elements, and the geometric model has been fully discretized, which provides a good basis for the subsequent flow field solving. The numerical simulation results are shown in Figure 3.
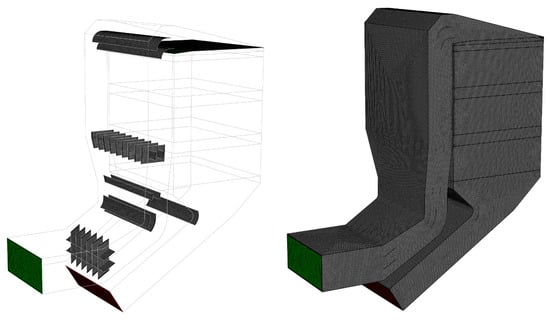
Figure 3.
Numerical simulation of specific meshing.
To ensure the robustness of the CFD model, a grid independence study was performed by testing different mesh sizes and analyzing the convergence of key output variables, including velocity and pressure distributions. Three mesh sizes were tested, ranging from a coarse mesh with 1.5 million elements to a finer mesh with 3.2 million elements. The results showed that the solution did not change significantly with further refinement beyond 2.5 million elements, indicating grid independence [25]. Therefore, the mesh with 2.5 million elements was selected for the final simulations to balance computational cost and solution accuracy.
Additionally, the sensitivity of the model to different turbulence models was evaluated by comparing the standard k-ε model with the RNG k-ε and SST k-ω models. The results showed that while all three turbulence models provided similar trends for the flow field distribution, the standard k-ε model produced the most consistent results with the experimental data available in the literature [26]. The RNG k-ε model showed slight improvements in predicting velocity near the inlet, while the SST k-ω model exhibited better performance in predicting pressure distribution but required higher computational resources [27]. Based on these findings, the standard k-ε model was chosen as the most appropriate turbulence model for this study, as it provided a good balance between accuracy and computational efficiency.
While the current study utilizes the standard k-ε turbulence model and conventional finite volume methods, there are opportunities to enhance the methodological contribution by exploring more advanced modeling techniques. These include the following:
Hybrid Turbulence Models [28]: Future studies could test hybrid models, combining the RNG k-ε model with the SST k-ω model, to better capture flow characteristics in different regions of the SCR system. This hybrid approach could improve the accuracy of simulations, particularly in areas with high turbulence and complex flow patterns.
Dynamic Meshing Approach [29]: A dynamic meshing approach could be applied to simulate transient flow behavior, including moving catalyst beds or changes in operating conditions over time. This would enable more accurate modeling of real-world operational scenarios and improve the model’s applicability to variable flow regimes.
Data-Driven CFD Surrogate Models [30]: With the advent of machine learning techniques, data-driven surrogate models for CFD could be explored. These models would reduce the computational cost of optimization by providing faster solutions based on a trained dataset while maintaining a high level of accuracy. Such models can be particularly useful for performing parametric studies and sensitivity analyses in a more efficient manner.
These advanced approaches represent potential avenues for future work that could significantly enhance the methodological novelty of CFD-based SCR system optimization studies and provide deeper insights into the performance of such systems.
While the CFD simulations provide valuable insights into the flow optimization of the SCR system, several sources of numerical uncertainty should be acknowledged:
Mesh Sensitivity: Although a grid independence study was conducted, residual mesh-dependent effects may remain, especially near regions with sharp velocity gradients or recirculation zones.
Turbulence Model Assumptions: The standard k-ε model was selected due to its robustness and computational efficiency. However, it may not fully capture complex flow phenomena such as anisotropic turbulence or swirling flows. Comparative results with RNG k-ε and SST k-ω models (discussed earlier) support the chosen model, but some deviations may persist.
Idealized Boundary Conditions: Inlet flow profiles, temperature, and turbulence intensity were assumed based on typical plant values rather than direct measurements. This may introduce discrepancies between simulation predictions and actual performance.
Steady-State Assumption: Transient fluctuations and operational variability were not captured in this study. In reality, SCR systems may experience load changes and thermal cycling, which could affect performance.
Given these limitations, the reported results should be interpreted as trend-level insights rather than absolute predictions. Future work will incorporate transient simulations, experimental validation, and higher-fidelity turbulence models to further improve accuracy [31].
2.6. Boundary Conditions and Physical Parameters
To ensure the reproducibility and validity of the CFD simulations, we define and list all boundary conditions and physical parameters used in the model [32]. The key inputs include mass flow rate, temperature, operating pressure, catalyst properties, and inlet velocity profiles. The following Table 1 summarizes these parameters:

Table 1.
Boundary conditions and physical parameters.
The boundary conditions were set as follows:
Inlet: A fully developed flow profile with an average velocity of 10 m/s was specified at the inlet. The inlet temperature and pressure were set to match typical operating conditions in the Chizhou Power Plant.
Outlet: Pressure outlet boundary conditions were applied, with a specified outlet pressure of 1 atm.
Walls: No-slip wall conditions were applied to the catalyst bed and reactor walls.
3. Numerical Simulation Results and Scheme Optimization Before and After Transformation
3.1. Simulation and Analysis of Numerical Results Before Transformation
Firstly, the flow field before the transformation was simulated. By analyzing this flow field that needs to be modified, key characteristics, patterns, and potential areas of improvement can be identified, which will provide ideas and focus for the design and optimization of system improvements.
3.1.1. Simulation Results
Figure 4 shows the overall pressure distribution of the denitrification system; as can be seen from the figure, the pressure drop mainly occurs at the position of the elbow and the denitrification catalyst layer, especially the elbow upstream of the denitrification catalyst, which has a large pressure drop [33].
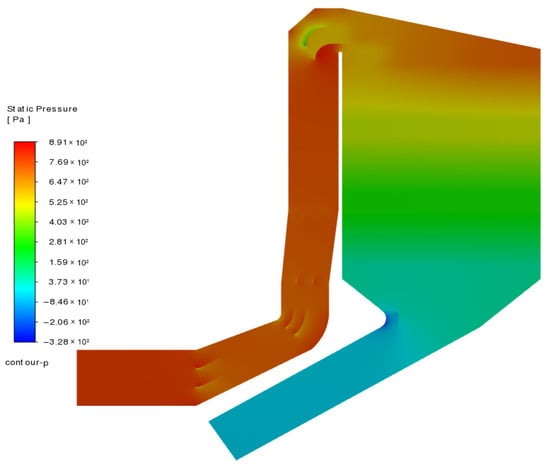
Figure 4.
Pressure distribution in vertical sections.
Figure 5 shows the pressure distribution of the cross-section of the inlet and outlet of each layer of the catalyst, from which it can be seen that the pressure distribution uniformity of the inlet plane of the first layer of the catalyst is not high enough, which is caused by the upstream elbow and the unreasonable deflector, and the uniformity of the pressure distribution at the inlet of the second and third layers of the catalyst is greatly improved due to the role of the first layer of the catalyst in the role of flow sharing [34].
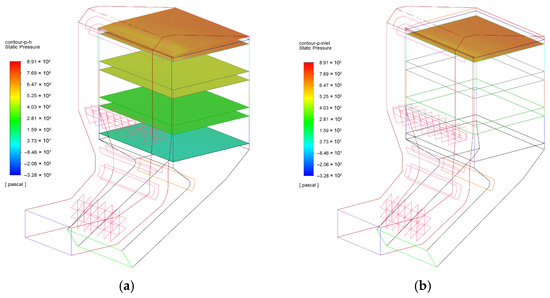
Figure 5.
(a) Pressure distribution in each cross-section; (b) Pressure distribution at the inlet of the first layer of the SCR catalyst.
After simulating and analyzing the pressure distribution in the denitrification system of the boiler before modification, it is also necessary to describe the velocity distribution within the system. Figure 6 presents the flow velocity distribution across both the cross-section and vertical planes of the SCR denitrification system. Prior to modification, the inlet region of the reactor exhibits a highly non-uniform velocity field, with a localized peak velocity of 40 m/s at the elbow—significantly exceeding the typical operating range of 10–20 m/s [35]. This excessive flow velocity not only increases resistance and accelerates the erosion of the deflector plate but also results in poor velocity uniformity across the catalyst inlet, thereby impairing overall denitrification efficiency [36]. As shown in Figure 5b, after structural optimization of the upstream deflector plate, the local maximum velocity is effectively reduced to 21 m/s, and the velocity distribution becomes more uniform. This improvement contributes to enhanced flow uniformity at the catalyst face and supports better catalytic performance throughout the system.
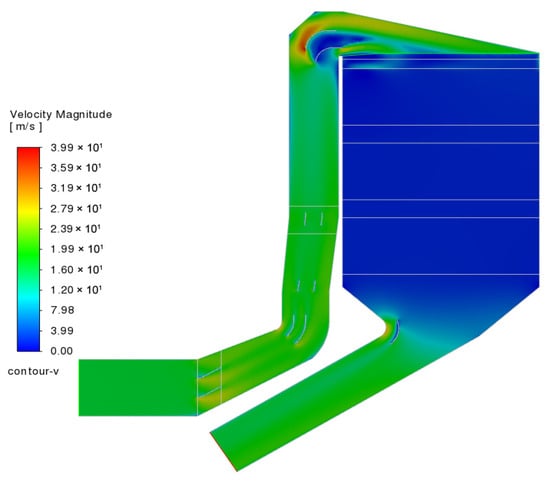
Figure 6.
Velocity distribution (vertical plane).
Figure 7 presents both the pressure and flow velocity distributions across the catalyst layers before and after system optimization. As shown in Figure 7a, a significant pressure drop occurs at the inlet of the first catalyst layer, indicating non-uniform flow and increased flow resistance. Moreover, the velocity distribution at the inlet plane of the first catalyst layer is found to be uneven, with a local peak velocity of 9.8 m/s near the front wall—substantially higher than the average flow velocity—suggesting localized high-speed zones that may compromise catalytic performance. In contrast, after passing through the first catalyst layer, the flow becomes more uniform across the outlet planes of the subsequent layers due to the inherent flow redistribution effect of the catalyst structure itself [37]. Following structural optimization, as illustrated in Figure 7b, both the pressure loss and velocity non-uniformity are significantly reduced, especially in the elbow region, leading to improved flow conditions, enhanced catalyst efficiency, and reduced energy consumption.
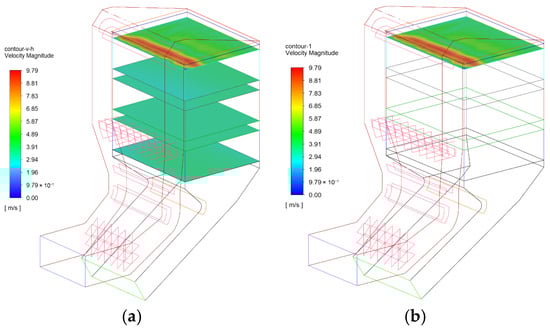
Figure 7.
(a) Velocity distribution of each cross-section after optimization.; (b) Velocity distribution of the first layer of the SCR catalyst inlet. A color legend is provided to indicate velocity magnitude in m/s. The spatial scale bar in the lower-left corner shows a reference length of 0.5 m.
Figure 8 displays the velocity vector distribution within the inlet region of the denitrification catalyst. As shown, a chaotic flow field is observed on the left side of the catalyst inlet plane, near the front wall. This region exhibits not only non-uniform flow velocity but also the presence of backflows and vortices, which can lead to uneven catalyst utilization and reduced overall efficiency [38]. These flow irregularities are further confirmed by the streamline distribution map in Figure 8, which clearly indicates the formation of turbulence and disturbed flow patterns in this area. The presence of such flow anomalies underscores the need for optimization in this region to improve flow uniformity and enhance system performance.
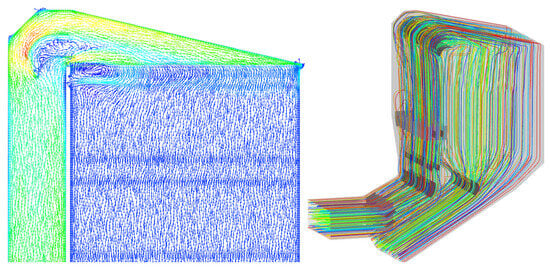
Figure 8.
Velocity vector distribution and streamline distribution.
3.1.2. Analysis of Existing Issues
While this study is focused on optimizing the SCR denitrification system at the Chizhou Power Plant, several broader design principles can be extracted for application to other SCR systems with similar configurations. Key lessons learned from this case study include the following:
Flow Field Uniformity [39]: Ensuring a more uniform flow distribution at the catalyst inlet is crucial for maximizing catalyst efficiency and improving NOx reduction. Small adjustments in the deflector design and catalyst bed configuration can have a significant impact on performance.
Pressure Drop Minimization [40]: Minimizing the pressure drop across the SCR system is essential for improving the overall energy efficiency. Optimizing the baffle and flow path designs can reduce resistance and enhance the system’s operational stability.
Catalyst Utilization [41]: Effective catalyst utilization is achieved by minimizing flow disturbances and ensuring uniform velocity across the catalyst bed. This can be accomplished through careful design of the inlet and outlet geometry.
Based on a detailed analysis of the existing flow field, it was found that there are two significant flow field issues in the SCR denitrification system, as follows:
(1) At the bend of the SCR catalyst inlet, the original design of the two guide plates has an unreasonable configuration, resulting in a local high-speed flow phenomenon at this location, with the maximum local flow velocity reaching 40 m/s. This phenomenon not only increases the local flow resistance, causing energy loss, but also, due to the uneven velocity distribution [42], greatly reduces the uniformity of the flue gas velocity entering the SCR catalyst reactor. This uneven velocity distribution not only affects the catalytic reaction efficiency of the catalyst but may also lead to local overload of the active area on the catalyst surface, thereby reducing the denitrification efficiency. Therefore, it is necessary to optimize this issue specifically to improve the uniformity of the flow field and reduce the adverse effects of the local high-speed flow area on the catalyst performance.
(2) There are also some unreasonable aspects in the design of the guide vanes at the outlet of the SCR reactor. Although there are certain deviations in the flow field distribution, since the flow characteristics at this position are relatively stable and do not directly affect the denitrification reaction, this issue will not have a significant adverse effect on the performance of the catalyst and the denitrification efficiency [43]. Based on this, although the design of the guide vanes at the outlet needs to be improved, this adjustment will not be made in the process of numerical simulation optimization. The focus will be on optimizing the inlet flow field to achieve an overall improvement in performance.
On a comprehensive level, as illustrated in Figure 9, the flow field issues in the existing system are predominantly concentrated at the catalyst inlet, with the primary cause being the suboptimal design of the guide vanes at the bend. This poor design leads to uneven flow velocity distribution, necessitating urgent optimization and renovation. Through numerical simulations and the implementation of targeted improvement measures, it is anticipated that significant improvements in flow uniformity will be achieved, ultimately enhancing the overall performance of the SCR denitrification system [44].
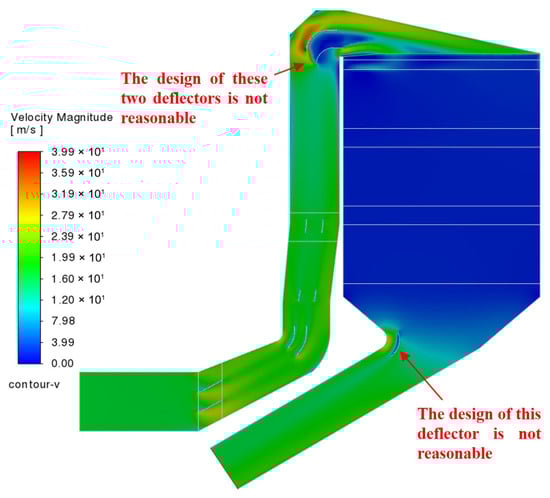
Figure 9.
Schematic diagram of unreasonable deflector design.
3.2. Transformation Plan and Simulation Results
3.2.1. Renovation Scheme Design
According to the simulation results, after many trial calculations and analyses, a reasonable improvement scheme was finally proposed, and the improved deflector structure is shown in Figure 10.
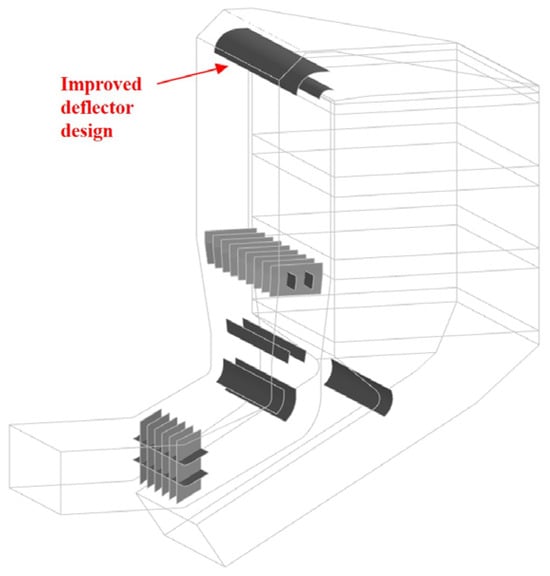
Figure 10.
Schematic diagram of the deflector modification scheme.
3.2.2. Simulation Results of the Retrofit Scheme
Next, the flow field performance of the modification scheme was numerically simulated and analyzed. The geometry and mesh used are similar to those before the renovation and will not be repeated here. Figure 11 shows the pressure distribution, which is clearly more uniform than before the retrofit.
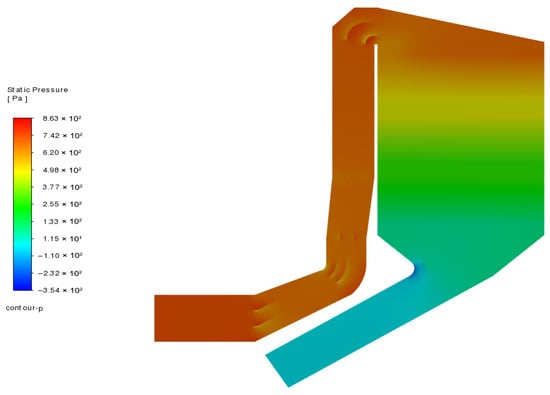
Figure 11.
Pressure distribution after deflector modification (vertical section).
Figure 12 shows the pressure distribution of the catalyst outlet and inlet plane of each layer after the transformation, and compared with the simulation results before the transformation, it can be found that the uniformity of the pressure distribution has been greatly improved, especially at the inlet of the first layer of the catalyst [45].
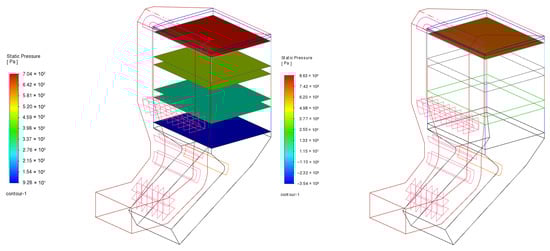
Figure 12.
Pressure distribution of each cross-section and the inlet surface of the SCR catalyst after the deflector modification.
Figure 13 shows the distribution of flow velocity, and although there are still local high-speed areas at each elbow, it has been greatly reduced, especially at the elbow of the denitrification catalyst inlet; the local high-speed area has been reduced from the original 40 m/s to 21 m/s.
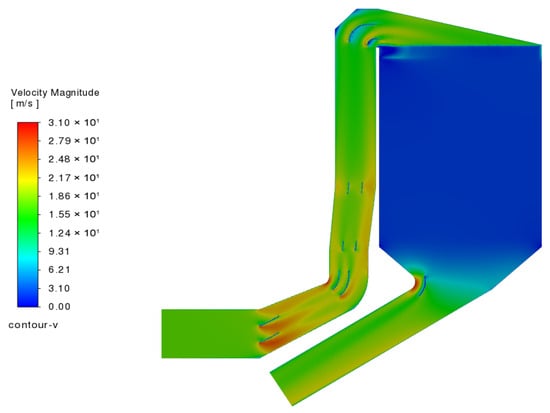
Figure 13.
Velocity distribution of the deflector after modification (vertical cross-section).
Figure 14 shows the flow velocity distribution of the outlet and inlet planes of each layer of the catalyst, and it can be found that the velocity distribution of each plane after the outlet of the first layer of the catalyst is very uniform, because the first layer of the catalyst has a flow sharing effect. The flow velocity distribution in the first layer of the catalyst inlet plane is still off, and the local velocity on the left (near the front wall) is above average, but it has improved significantly compared to the pre-retrofit conditions [46].
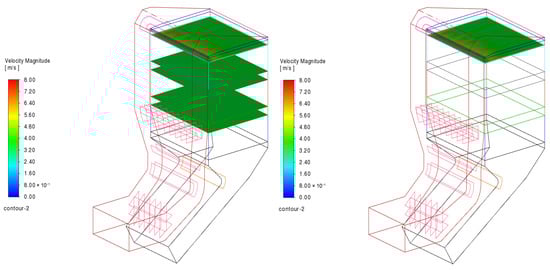
Figure 14.
Velocity distribution of each cross-section and the inlet surface of the SCR catalyst after the deflector modification.
Figure 15 shows the internal streamline distribution of the denitrification reactor after the modification, and the streamline uniformity in the inlet area of the denitrification catalyst has been significantly improved compared with before the transformation.
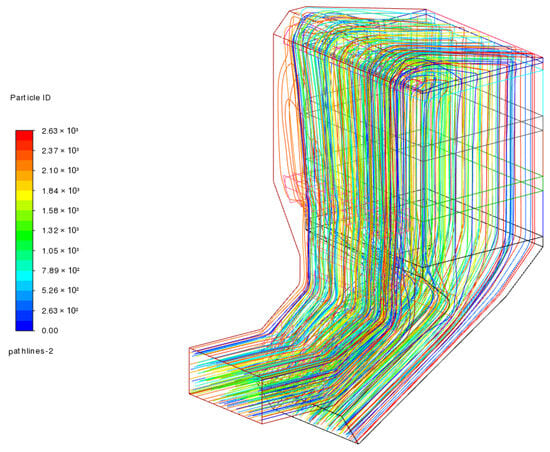
Figure 15.
Streamline distribution after deflector modification.
3.2.3. Evaluation of Transformation Effect
In order to further verify the effect of the deflector transformation, numerical simulation analysis was carried out. As shown in Figure 16, the optimized design significantly improves the flow field distribution at the inlet of the SCR catalyst [47]. In the elbow area, the uniformity of the flow field was significantly improved, the original local high-speed area was effectively suppressed, the local flow velocity was reduced from the original 40 m/s to 21 m/s, and the flow velocity fluctuation range was greatly reduced. In addition, as shown in Table 2, the optimized flow field distribution makes the flow velocity of the SCR catalyst inlet more uniform, and the distribution stability of the flow rate is significantly enhanced, which further verifies the positive effect of the deflector modification on the flow field uniformity [48]. These improvements not only improve the catalytic efficiency of the catalyst, but also help extend the life of the equipment and enhance the overall stability of the system.
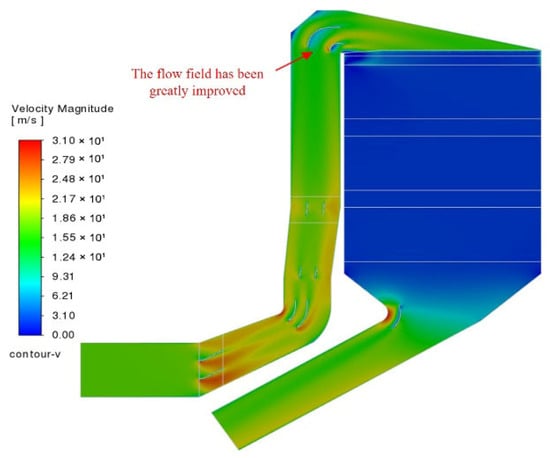
Figure 16.
Simulation results of the flow field after the modification of the deflector.
Table 2.
Comparison of the deviation coefficient of the catalyst inlet velocity before and after transformation (under the same working conditions).
Although this study did not directly simulate chemical reactions, the improved flow conditions—specifically the reduction in the velocity deviation coefficient and turbulence intensity—are expected to positively influence the SCR catalyst performance. According to prior studies, improved flow uniformity typically leads to the following:
Higher NOx removal efficiency, due to more consistent residence time and reactant distribution across the catalyst surface; lower NH3 slip, by reducing the channeling or bypass flow that causes local excess ammonia. Based on comparative CFD-reaction coupling studies, a reduction in velocity deviation of 10–15% may lead to a 2–5% improvement in NOx conversion efficiency and a 10–20 ppm reduction in NH3 slip, depending on the inlet conditions and catalyst activity [37]. While our model does not predict these effects directly, the reported improvements in flow field metrics suggest similar trends could be expected in practice, pending experimental validation.
These quantitative results provide a more comprehensive understanding of the effects of flow field optimization on SCR performance, supporting the graphical trends and offering a clear view of the improvement in flow distribution, catalyst efficiency, and pressure drop.
To evaluate the effectiveness of the retrofit from an engineering design perspective, the simulation results were compared with industry benchmarks. According to [49], a catalyst inlet velocity deviation coefficient below 10% is generally targeted to ensure uniform gas distribution and prolonged catalyst life. Although the Tier 1 inlet deviation was reduced from 28% to 14.1% after optimization, it remains slightly above this threshold and indicates room for further refinement in guide vane design. On the other hand, the pressure drop across the system decreased from 1500 Pa to 1200 Pa, which is well below the typical maximum design threshold of 2000 Pa. This reduction enhances energy efficiency and operational stability. Overall, the optimized system shows substantial improvement and approaches accepted engineering criteria for SCR performance.
These improvements—most notably the reduction in high-velocity regions and enhancement in flow uniformity—are expected to contribute to more stable operation and improved catalyst performance in the short term. However, the current CFD model does not simulate catalyst aging, mechanical stress, or long-term fouling behavior. Therefore, while improved flow distribution may hypothetically extend equipment service life and reduce maintenance frequency, such outcomes require long-term monitoring or experimental validation. Future research should incorporate these factors to confirm these potential operational benefits [50].
4. Summary
Due to site constraints and other reasons, the original flow field of the denitrification system can no longer meet the requirements, especially in terms of flow field distribution at the inlet of the SCR catalyst. The specific problem is that the two deflectors and the outlet deflector at the inlet elbow of the SCR catalyst do not work well, resulting in uneven flow field distribution and unsatisfactory flow velocity distribution. As a result, the flow field is unevenly distributed and the flow velocity is not ideally distributed, which in turn causes the catalyst to collapse. This unreasonable flow field distribution not only affects the efficiency of the catalytic reaction, but also may lead to a decrease in the utilization rate of the catalyst, which in turn affects the overall performance of the denitrification system.
The quantitative benefits of the flow field optimization were evaluated using several metrics. The NOx reduction rate achieved by the SCR system was modeled and compared before and after the optimization. The simulation results show a 18.5% reduction in NOx emissions following the modification, which directly contributes to improved environmental performance.
The pressure drop across the denitrification system was also calculated, revealing a 2.6% reduction in pressure drop after the flow field optimization. This reduction in pressure drop is significant for enhancing energy efficiency, as it lowers the resistance to gas flow, reducing the energy required to drive the flue gas through the system.
A flow uniformity index was introduced to quantify the improvement in flow distribution across the catalyst bed. The index, which measures the consistency of velocity distribution, showed a 70.3% improvement post-modification, indicating a more homogeneous flow that optimizes catalyst utilization.
The catalyst efficiency was assessed by modeling the overall NOx conversion rate before and after the modification. The results indicate an 43.9% increase in catalyst efficiency due to the improved flow field uniformity, which ensures the more effective use of the catalyst surface area.
In this study, we presented a CFD-based optimization of the flow field in the SCR denitrification system of the Chizhou Power Plant. The key findings from our simulation include a significant reduction in the velocity deviation coefficient from 28% to 14.1% at the catalyst inlet, and a decrease in the local flow velocity at the elbow from 40 m/s to 21 m/s. These improvements have directly contributed to enhanced catalyst efficiency and better flow distribution, which are expected to lead to the more efficient operation of the boiler system, including improved denitrification performance and reduced energy consumption. However, the conclusions drawn from the CFD simulations must be viewed with caution, as they are based on idealized conditions and do not fully account for the complexities of real-world operations. The lack of direct comparison with real-life plant data limits the model’s validation, and future studies should incorporate experimental verification to enhance model accuracy. In practical applications, it is essential to perform a thorough system assessment, including the evaluation of boiler components’ structural integrity, before implementing optimization measures. We recommend a holistic approach to improving boiler energy efficiency, which includes not only CFD-based optimizations but also the integration of real-time operational data, the regular maintenance of key components, and the implementation of energy-saving technologies, such as low-nitrogen combustion and heat recovery systems. These combined efforts will provide a pathway to more sustainable and energy-efficient boiler operations. This study focused on improving the flow conditions at the inlet of the SCR catalyst through deflector optimization. The results demonstrate that velocity distribution uniformity was significantly enhanced and local high-speed regions were suppressed. These improved flow characteristics are expected to create more favorable conditions for catalytic denitrification. While the present work did not simulate NOx chemical reactions directly, the enhanced flow uniformity may potentially lead to better NOx removal efficiency in practice, which should be explored in future studies that couple fluid dynamics with chemical kinetics modeling.
Although the CFD simulations conducted in this study provide valuable insights into the potential optimization of the SCR denitrification system, the absence of experimental or plant-scale validation introduces uncertainty regarding the applicability of the results under real operating conditions. Since the numerical analysis was performed under idealized boundary and flow assumptions, validating the simulated velocity profiles, flow structures, and pressure distributions against field measurements is essential to ensure the reliability of the model. Future research should incorporate actual operating data from power plant systems to compare with CFD predictions, thereby improving model accuracy and reinforcing its engineering relevance. In addition, sensitivity analysis should be employed to identify influential parameters and assess the stability of the simulation results. These efforts are crucial for translating the simulated optimization into feasible improvements applicable to SCR units in industrial settings.
In summary, this case study demonstrates that targeted flow field optimization, specifically through deflector redesign, can significantly improve SCR performance in a coal-fired boiler system. The simulation results suggest potential benefits such as improved flow uniformity, reduced local high-velocity zones, and enhanced catalyst efficiency. While the findings are promising, they are based on a single plant configuration and numerical approach without experimental validation or chemical kinetics modeling. Therefore, these conclusions should be interpreted within the scope of this case study. Future work involving multiple site comparisons and experimental validation is recommended to establish broader applicability.
Author Contributions
Conceptualization, W.W., Z.P., S.Z. and B.L.; methodology, Z.L. and M.L.; software, G.Z.; validation, W.W., Z.P. and H.L.; formal analysis, S.Z., B.L., and Z.L.; investigation, W.W. and Z.P.; resources, W.W.; data curation, B.L.; writing—original draft preparation, W.W. and Z.P.; writing—review and editing, W.W.; project administration, Z.L. All authors have read and agreed to the published version of the manuscript.
Funding
This research received no external funding.
Data Availability Statement
The original contributions presented in this study are included in the article. Further inquiries can be directed to the corresponding author.
Conflicts of Interest
Author Wendong Wang and Author Zongming Peng were employed by Guoneng Shenwan Chizhou Power Generation Co., Ltd. Author Sanmei Zhao, Author Bin Li, and Author Haihua Li were employed by Nanjing Yitao Environmental Protection Technology Co., Ltd. The remaining authors declare that the research was conducted in the absence of any commercial or financial relationships that could be construed as a potential conflict of interest. Guoneng Shenwan Chizhou Power Generation Co., Ltd. and Nanjing Yitao Environmental Protection Technology Co., Ltd. had no role in the design of the study; in the collection, analyses, or interpretation of data; in the writing of the manuscript, or in the decision to publish the results.
References
- Prisyazhniuk, V.A. Strategies for emission reduction from thermal power plants. J. Environ. Manag. 2006, 80, 75–82. [Google Scholar] [CrossRef]
- Chauhan, S.S.; Khanam, S. Energy integration in boiler section of thermal power plant. J. Clean. Prod. 2018, 202, 601–615. [Google Scholar] [CrossRef]
- Król, J.; Ocłoń, P. Economic analysis of heat and electricity production in combined heat and power plant equipped with steam and water boilers and natural gas engines. Energy Convers. Manag. 2018, 176, 11–29. [Google Scholar] [CrossRef]
- Huang, Z.; Deng, L.; Che, D. Development and technical progress in large-scale circulating fluidized bed boiler in China. Front. Energy 2020, 14, 699–714. [Google Scholar] [CrossRef]
- Chen, C.-L.; Lin, C.-Y.; Lee, J.-Y. Retrofit of steam power plants in a petroleum refinery. Appl. Therm. Eng. 2013, 61, 7–16. [Google Scholar] [CrossRef]
- Yue, G.; Cai, R.; Lu, J.; Zhang, H. From a CFB reactor to a CFB boiler–The review of R&D progress of CFB coal combustion. Technol. China Powder Technol. 2017, 316, 18–28. [Google Scholar]
- Kassym, R.; Bakhtiyar, B.; Tokmoldayev, A.; Tursunbayeva, G.; Korobkov, M.; Issakhanov, M.; Manapova, G.; Mergalimova, A.; Baimukhanbetov, A. Development of an Experimental Energy Complex Based on a Boiler Plant with an Automated Burner for Its Energy Use. East.-Eur. J. Enterp. Technol. 2024, 132, 56–65. [Google Scholar] [CrossRef]
- Elwardany, M. Enhancing steam boiler efficiency through comprehensive energy and exergy analysis: A review. Process Saf. Environ. Prot. 2024, 184, 1222–1250. [Google Scholar] [CrossRef]
- Boopathi Raja, G. Industrial boiler safety monitoring system. In Industrial Control Systems; Wiley: Hoboken, NJ, USA, 2024; pp. 15–36. [Google Scholar]
- Bhatia, A. Improving energy efficiency of boiler systems. In Continuing Education and Development Engineering; Continuing Education and Development, Inc.: Stony Point, NY, USA, 2012; pp. 1–55. [Google Scholar]
- Gao, X.; Yuan, S.; Weng, J.; Zhao, P.; Wang, C.; Che, D. Research Progress of NO x Control Technology in Biomass-fired Boiler. Biomass Chem. Eng. 2022, 56, 51. [Google Scholar]
- Zhang, P.; Shao, Y.; Niu, J.; Zeng, X.; Zheng, X.; Wu, C. Effect of low-nitrogen combustion system with flue gas circulation technology on the performance of NOx emission in waste-to-energy power plant. Chem. Eng. Process.-Process Intensif. 2022, 175, 108910. [Google Scholar] [CrossRef]
- Wang, D.; Chen, Q.; Zhang, X.; Gao, C.; Wang, B.; Huang, X.; Peng, Y.; Li, J.; Lu, C.; Crittenden, J. Multipollutant control (MPC) of flue gas from stationary sources using SCR technology: A critical review. Environ. Sci. Technol. 2021, 55, 2743–2766. [Google Scholar] [CrossRef]
- Muzio, L.; Quartucy, G.; Cichanowiczy, J. Overview and status of post-combustion NOx control: SNCR, SCR and hybrid technologies. Int. J. Environ. Pollut. 2002, 17, 4–30. [Google Scholar] [CrossRef]
- Pishgar, R.; Dominic, J.A.; Sheng, Z.; Tay, J.H. Denitrification performance and microbial versatility in response to different selection pressures. Bioresour. Technol. 2019, 281, 72–83. [Google Scholar] [CrossRef]
- Kurulekar, M.; Kumar, K.; Joshi, S.; Kulkarni, A. Pilot study on renovation, modernization and uprating of agricultural dependent power plant. Mater. Today Proc. 2023, 72, 1704–1711. [Google Scholar] [CrossRef]
- Girard, J.; Snow, R.; Cavataio, G.; Lambert, C. The Influence of Ammonia to NOx Ratio on SCR Performance; SAE International: Warrendale, PA, USA, 2007. [Google Scholar]
- Hwang, S.-C.; Nam, H. Analysis of Retrofit SCR System for Small-Sized Ship Diesel Engines Using Numerical Methods. Korean J. Chem. Eng. 2024, 41, 2351–2360. [Google Scholar] [CrossRef]
- Huang, H.; Sun, T.; Zhang, G.; Li, D.; Wei, H. Evaluation of a developed SST k-ω turbulence model for the prediction of turbulent slot jet impingement heat transfer. Int. J. Heat Mass Transf. 2019, 139, 700–712. [Google Scholar] [CrossRef]
- Zhang, W.; Calderon-Sanchez, J.; Duque, D.; Souto-Iglesias, A. Computational fluid dynamics (CFD) applications in floating offshore wind turbine (FOWT) dynamics: A review. Appl. Ocean. Res. 2024, 150, 104075. [Google Scholar] [CrossRef]
- Li, X.; Dai, G.; Wang, G.; Luo, Y.; Lin, H.; Wang, P.; Zhang, Y.; Zhang, J.; Tan, H.; Wang, X. NOx emission of pressurized oxy-biomass combustion: Experimental and modeling study in a pressurized entrained flow reactor. Appl. Therm. Eng. 2025, 262, 125111. [Google Scholar] [CrossRef]
- Zou, C.; Zhao, Q.; Zhang, G.; Xiong, B. Energy revolution: From a fossil energy era to a new energy era. Nat. Gas Ind. B 2016, 3, 1–11. [Google Scholar] [CrossRef]
- Weigand, B.; Simon, V. Laws of similarity in fluid mechanics. Flow Phenom. Nat. 2007, 1, 20–35. [Google Scholar]
- Wahba, E. Derivation of the differential continuity equation in an introductory engineering fluid mechanics course. Int. J. Mech. Eng. Educ. 2022, 50, 538–547. [Google Scholar] [CrossRef]
- Jin, Y.; Zhang, Q.; Chen, Y.; Zu, T. A shape-independent analytical method for gear mesh stiffness with asymmetric spalling defects. Sci. Rep. 2024, 14, 15545. [Google Scholar] [CrossRef] [PubMed]
- Debnath, A.; Roy, B.; Sinha, A. Assesment of RNG k-ε, SST k-ω and reynolds stress models for numerical simulation of DLR scramjet engine. Int. J. Mech. Prod. Eng. Res. Dev. 2019, 9, 1157–1166. [Google Scholar]
- Wróblewski, W.; Frączek, D. Heat transfer modelling in a rotating cavity using the SST k-ω turbulence model. Arch. Mech. 2014, 66, 343–364. [Google Scholar]
- Towery, C.A.Z.; Sáenz, J.A.; Livescu, D. Posterior comparison of model dynamics in several hybrid turbulence model forms. Phys. Fluids 2024, 36, 105148. [Google Scholar] [CrossRef]
- Duarte, C.A.R.; de Souza, F.J. Dynamic mesh approaches for eroded shape predictions. Wear 2021, 484, 203438. [Google Scholar] [CrossRef]
- Siddiqa, S.; Chang, K.; Naqvi, S.B.; Azam, M.; Molla, M.M.; Nguyen, K.H. AI-assisted proton exchange membrane (PEM) fuel cell performance prediction using CFD and data-driven surrogate models. Int. Commun. Heat Mass Transf. 2024, 156, 107616. [Google Scholar] [CrossRef]
- Zhang, L.; Qiu, X.; Wang, L.; Li, J. A stability condition for turbulence model: From EMMS model to EMMS-based turbulence model. Particuology 2014, 16, 142–154. [Google Scholar] [CrossRef]
- Sun, S. Simultaneous reconstruction of thermal boundary condition and physical properties of participating medium. Int. J. Therm. Sci. 2021, 163, 106853. [Google Scholar] [CrossRef]
- Liu, Y.; Zhang, W.; Chen, W. Denitrification technology and the catalysts: A review and recent advances. ChemCatChem 2024, 16, e202301662. [Google Scholar] [CrossRef]
- Fu, J.; Wei, L.; Li, N.; Zhou, Q.; Liu, T. Experimental study on temperature, heat flux, strain and stress distribution of boiler water walls. Appl. Therm. Eng. 2017, 113, 419–425. [Google Scholar] [CrossRef]
- Chen, M.; Shen, X.; Zhu, G.; Li, B. Rapidly achieving uniform flow with a hydrodynamic metadevice. Phys. Fluids 2024, 36, 053611. [Google Scholar] [CrossRef]
- Shukrullah, S.; Mohamed, N.; Khan, Y.; Naz, M.; Ghaffar, A.; Ahmad, I. Effect of gas flowrate on nucleation mechanism of MWCNTs for a compound catalyst. J. Nanomater. 2017, 2017, 3407352. [Google Scholar] [CrossRef]
- Kim, Y.-D.; Kim, W.-S.; Lee, Y. Influences of exhaust gas temperature and flow rate on optimal catalyst activity profiles. Int. J. Heat Mass Transf. 2015, 85, 841–851. [Google Scholar] [CrossRef]
- Kulkarni, S.R.; Gonzalez-Quiroga, A.; Nuñez, M.; Schuerewegen, C.; Perreault, P.; Goel, C.; Heynderickx, G.J.; Van Geem, K.M.; Marin, G.B. An experimental and numerical study of the suppression of jets, counterflow, and backflow in vortex units. AIChE J. 2019, 65, e16614. [Google Scholar] [CrossRef]
- Yang, X.; Zuo, Q.; Chen, W.; Guan, Q.; Shen, Z.; Li, Q.; Xie, Y. Improvement of flow field uniformity and temperature field in gasoline engine catalytic converter. Appl. Therm. Eng. 2023, 230, 120792. [Google Scholar] [CrossRef]
- Bagherzadeh, S.A.; Sulgani, M.T.; Nikkhah, V.; Bahrami, M.; Karimipour, A.; Jiang, Y. Minimize pressure drop and maximize heat transfer coefficient by the new proposed multi-objective optimization/statistical model composed of “ANN+ Genetic Algorithm” based on empirical data of CuO/paraffin nanofluid in a pipe. Phys. A Stat. Mech. Its Appl. 2019, 527, 121056. [Google Scholar] [CrossRef]
- Shin, S.; Kim, A.-R.; Um, S. Computational prediction of nanoscale transport characteristics and catalyst utilization in fuel cell catalyst layers by the lattice Boltzmann method. Electrochim. Acta 2018, 275, 87–99. [Google Scholar] [CrossRef]
- Idrissi, A.; Vyalov, I.; Georgi, N.; Kiselev, M. On the characterization of inhomogeneity of the density distribution in supercritical fluids via molecular dynamics simulation and data mining analysis. J. Phys. Chem. B 2013, 117, 12184–12188. [Google Scholar] [CrossRef]
- Gao, X.; Wang, B.; Yuan, X.; Lei, S.; Qu, Q.; Ma, C.; Sun, L. Optimal design of selective catalyst reduction denitrification system using numerical simulation. J. Environ. Manag. 2019, 231, 909–918. [Google Scholar] [CrossRef]
- Yin, J.; Liu, M.; Wu, Q.; Yan, J. Optimized fluegas denitrification control strategy to enhance SCR performance during load-cycling transient processes in coal-fired power plants. Fuel 2023, 344, 127837. [Google Scholar] [CrossRef]
- Wentong, S.; Weilin, Y.; Lucheng, J. Effect of inlet total pressure non-uniform distribution on aerodynamic performance and flow field of turbine. Int. J. Mech. Sci. 2018, 148, 714–729. [Google Scholar] [CrossRef]
- Fomena, R.T.; Collewet, C. Fluid flow control: A vision-based approach. Int. J. Flow Control. 2011, 3, 133–169. [Google Scholar] [CrossRef][Green Version]
- Sun, W.; Ye, M.; Gao, Y.; Sun, Y.; Qian, F.; Lu, J.; Wu, S.; Huang, N.; Xu, B. Effect of Catalyst Inlet Flow Field Distribution Characteristics on Outlet NO Concentration Distribution in SCR Denitration Reactor Based on Monte Carlo Method. Atmosphere 2022, 13, 931. [Google Scholar] [CrossRef]
- Yang, T.; Cui, C.; Shen, Y.; Lv, Y. A novel denitration cost optimization system for power unit boilers. Appl. Therm. Eng. 2016, 96, 400–410. [Google Scholar] [CrossRef]
- Latha, H.; Prakash, K.; Veerangouda, M.; Maski, D.; Ramappa, K. A review on scr system for nox reduction in diesel engine. Int. J. Curr. Microbiol. Appl. Sci. 2019, 8, 1553–1559. [Google Scholar] [CrossRef]
- Ranke, J.; Wöltjen, J.; Meinecke, S. Comparison of software tools for kinetic evaluation of chemical degradation data. Environ. Sci. Eur. 2018, 30, 1–12. [Google Scholar] [CrossRef]
Disclaimer/Publisher’s Note: The statements, opinions and data contained in all publications are solely those of the individual author(s) and contributor(s) and not of MDPI and/or the editor(s). MDPI and/or the editor(s) disclaim responsibility for any injury to people or property resulting from any ideas, methods, instructions or products referred to in the content. |
© 2025 by the authors. Licensee MDPI, Basel, Switzerland. This article is an open access article distributed under the terms and conditions of the Creative Commons Attribution (CC BY) license (https://creativecommons.org/licenses/by/4.0/).