Article

Dynamic Multi-Path Airflow Analysis and Dispersion Coefficient Correction for Enhanced Air Leakage Detection in Complex Mine Ventilation Systems

1
Shanxi Jiexiu Yitang Qingyun Coal Industry Co., Ltd., Jiexiu 032000, China
2
State-Owned Assets and Laboratory Management Office, Liaoning Technical University, Fuxin 123000, China
3
College of Safety Science and Engineering, Liaoning Technical University, Huludao 125105, China
4
Institute of Engineering and Environment, Liaoning Technical University, Huludao 125105, China
5
Key Laboratory of Mine Thermodynamic Disasters and Control of the Ministry of Education, Huludao 125105, China
*
Authors to whom correspondence should be addressed.
Processes 2025, 13(7), 2214; https://doi.org/10.3390/pr13072214
Submission received: 19 May 2025 / Revised: 23 June 2025 / Accepted: 8 July 2025 / Published: 10 July 2025
(This article belongs to the Section Process Control and Monitoring)

Abstract

Mine ventilation systems are critical for ensuring operational safety, yet air leakage remains a pervasive challenge, leading to energy inefficiency and heightened safety risks. Traditional tracer gas methods, while effective in simple networks, exhibit significant errors in complex multi-entry systems due to static empirical parameters and environmental interference. This study proposes an integrated methodology that combines multi-path airflow analysis with dynamic longitudinal dispersion coefficient correction to enhance the accuracy of air leakage detection. Utilizing sulfur hexafluoride (SF6) as the tracer gas, a phased release protocol with temporal isolation was implemented across five strategic points in a coal mine ventilation network. High-precision detectors (Bruel & Kiaer 1302) and the MIVENA system enabled synchronized data acquisition and 3D network modeling. Theoretical models were dynamically calibrated using field-measured airflow velocities and dispersion coefficients. The results revealed three deviation patterns between simulated and measured tracer peaks: Class A deviation showed 98.5% alignment in single-path scenarios, Class B deviation highlighted localized velocity anomalies from Venturi effects, and Class C deviation identified recirculation vortices due to abrupt cross-sectional changes. Simulation accuracy improved from 70% to over 95% after introducing wind speed and dispersion adjustment coefficients, resolving concealed leakage pathways between critical nodes and key nodes. The study demonstrates that the dynamic correction of dispersion coefficients and multi-path decomposition effectively mitigates errors caused by turbulence and geometric irregularities. This approach provides a robust framework for optimizing ventilation systems, reducing invalid airflow losses, and advancing intelligent ventilation management through real-time monitoring integration.

1. Introduction

Mine ventilation systems constitute the critical lifeline for safe and efficient mining operations, functioning to regulate airflow direction and volume to maintain adequate oxygen levels, control hazardous gas concentrations (e.g., methane, carbon monoxide) below safety thresholds, disperse dust, expel harmful gases, and moderate the thermal-humidity microclimate, thereby establishing the fundamental framework for personnel health and operational safety. As a primary energy consumer (often 30–50% of total mine energy), optimized ventilation operation is economically imperative, directly reducing per-ton production costs, while its stable performance is a prerequisite for continuous mining. However, air leakage, a prevalent phenomenon in underground mines due to practical constraints inherent to shaft mining operations [1,2], severely compromises this safety–economy balance. The resultant impacts manifest through critical mechanisms: Leakage causes significant air volumes to bypass designated areas, forcing main fans to increase pressure and flow to compensate for effective airflow loss, significantly increasing ventilation energy consumption. Simultaneously, leakage disrupts the planned ventilation circuit (network), potentially creating preferential pathways that generate localized recirculation patterns or causing insufficient airflow in critical zones (e.g., goafs, corners). This drastically impairs gas dilution and removal, significantly escalating the risk of hazardous localized gas accumulations and fire propagation [3,4] while amplifying operational safety management complexities. Consequently, rigorously controlling leakage and improving effective airflow efficiency constitute a dual technical and managerial challenge essential for preventing catastrophic incidents, reducing operational costs, and achieving sustainable mine safety.
To mitigate these challenges, the tracer gas method has gained prominence as a non-invasive monitoring technique for mine airflow characterization, owing to its superior sensitivity and adaptability to complex network configurations. Through the controlled release of tracer gases (e.g., sulfur hexafluoride, SF6) and subsequent tracking of their dispersion profiles, this approach enables precise identification of leakage pathways, quantitative determination of airflow velocities, and calculation of dispersion coefficients. However, practical implementation constraints persist, including substantial operational costs, susceptibility to environmental interference, and oversimplified theoretical modeling assumptions. Conventional tracer methods exhibit >30% errors in multi-entry networks due to static dispersion coefficients and humidity interference [5,6,7,8,9]. Unlike building ventilation targeting thermal comfort, mine air leakage refers to unintended airflow through concealed pathways (e.g., sealed goafs, fractured strata), causing gas accumulation and energy loss. This study focuses on leakage detection under high-turbulence conditions unique to underground mines.
Traditional optimization of mine ventilation systems predominantly employs single-objective models focused on minimizing ventilation energy consumption. However, mine ventilation systems are inherently complex multi-objective systems, rendering single-objective optimization insufficient to address practical requirements comprehensively. In recent years, multi-objective optimization models have emerged as a research focal point. Si et al. [10] innovatively applied Tikhonov regularization theory to airflow resistance determination models in ventilation networks, establishing a regularized solution framework for ill-posed equations that confines airflow resistance coefficient errors within engineering tolerance thresholds. Yu [11] developed a multi-objective optimization model incorporating ventilation energy consumption, fan shaft power, and fan efficiency. By introducing an R2-index hybrid multi-objective equilibrium optimization algorithm, the study enhanced computational performance, reduced ventilation energy consumption, and improved fan shaft power and efficiency, thereby providing a holistic solution for ventilation system optimization. Li et al. [12] proposed a nodal pressure potential resolution method based on airflow inversion. Through formulating nodal pressure potential discriminant equations and utilizing airflow data from two distinct operating conditions combined with partial nodal pressure potential information, the method achieved dynamic inversion of airflow resistance values in complex ventilation networks. Liu [13] proposed a time-dependent disturbance model rooted in Navier–Stokes equations to identify stochastic disturbance sources at mine ventilation air doors. Particle Image Velocimetry (PIV) experiments analyzed disturbance impacts on airflow, revealing logarithmic/linear relationships between wind speeds and contraction coefficients. A novel approach using air volume and pressure time-series signals was developed, with LSTM networks achieving 90.28% accuracy via air volume alone. Integrating air pressure improved accuracy by 9.66% and 9.16% in T-type and complex systems. Geng [14] analyzed the relationship among balanced pressure window area, face air volume, and equalizing pressure. A local resistance calculation formula for the balanced pressure window was derived, and the combined regulation of the equalizing pressure local fan and window enabled remote intelligent pressure control. Shao et al. [15] integrated Simulated Annealing (SA) with a modified Particle Swarm Optimization (PSO) algorithm, leveraging SA jumping characteristics to evade local optima while exploiting PSO rapid convergence. In hybrid optimization algorithms, Chen et al. [16] transcended conventional single-algorithm limitations by proposing a collaborative framework combining improved differential evolution with the Critical Path Method (CPM). Liu [17] constructed a WAFs diagnosis model (WAFs-BODQN) based on a Bayesian optimized deep Q-network, incorporating a KMeans-SDF reward function to address dataset imbalance. By introducing this hybrid framework, the study achieved fault location accuracies of 98.75%, 97.50%, and 95.00% for imbalanced datasets, outperforming traditional models and demonstrating high intelligence and generalization, thereby providing a universal architecture for intelligent mine ventilation fault diagnosis. Wang [18] proposed a fast intelligent measurement method for the mine ventilation resistance coefficient (MVRC) based on an artificial intelligence differential evolution algorithm and sparse measurement points, addressing the time-consuming issue of traditional methods. Experimental verification showed an observation point air volume relative error <6%, and application in the Longshou Mine enabled an emergency plan for ventilation collapse, with field practice verifying a 3.23% relative error in air return volume prediction. Wu et al. [19] introduced the Elite Opposition-Based Learning Fireworks Algorithm (EOFWA). It demonstrated exceptional performance in multi-peak, high-dimensional ventilation optimization problems, though parameter sensitivity requires further refinement. Collectively, these advancements confirm that intelligent algorithms excel in addressing complex nonlinear challenges in ventilation systems, significantly improving optimization outcomes.
Currently, when confronted with complex working conditions, there exist certain bottlenecks in optimization schemes. For instance, a single model may lack the dynamic simulation capability to capture the spatio-temporal evolution of ventilation parameters, or conventional algorithms may struggle to strike a balance between calculation efficiency and economy in air volume distribution and network optimization.
To address the aforementioned challenges, this study proposes an integrated methodology combining multi-path analytical theory with high-precision monitoring technology, aiming to overcome bottlenecks inherent in conventional approaches. The ventilation network is systematically decomposed into independent pathways through a multi-path airflow flux model, while nodal mass conservation equations are employed to quantify tracer gas transport efficiency across individual paths. High-sensitivity detectors enable synchronous data acquisition from multiple release points, facilitating dynamic correction of longitudinal dispersion coefficients to reduce air leakage calculation errors. These frameworks allow precise identification of abnormal leakage pathways, guiding targeted measures such as seal wall reinforcement or fan regulation.
This research not only provides theoretical innovations and technical support for mine ventilation safety but also establishes the foundational infrastructure for intelligent ventilation management. Its engineering significance lies in substantially mitigating mining safety risks and enhancing economic efficiency, demonstrating critical value for industrial applications.

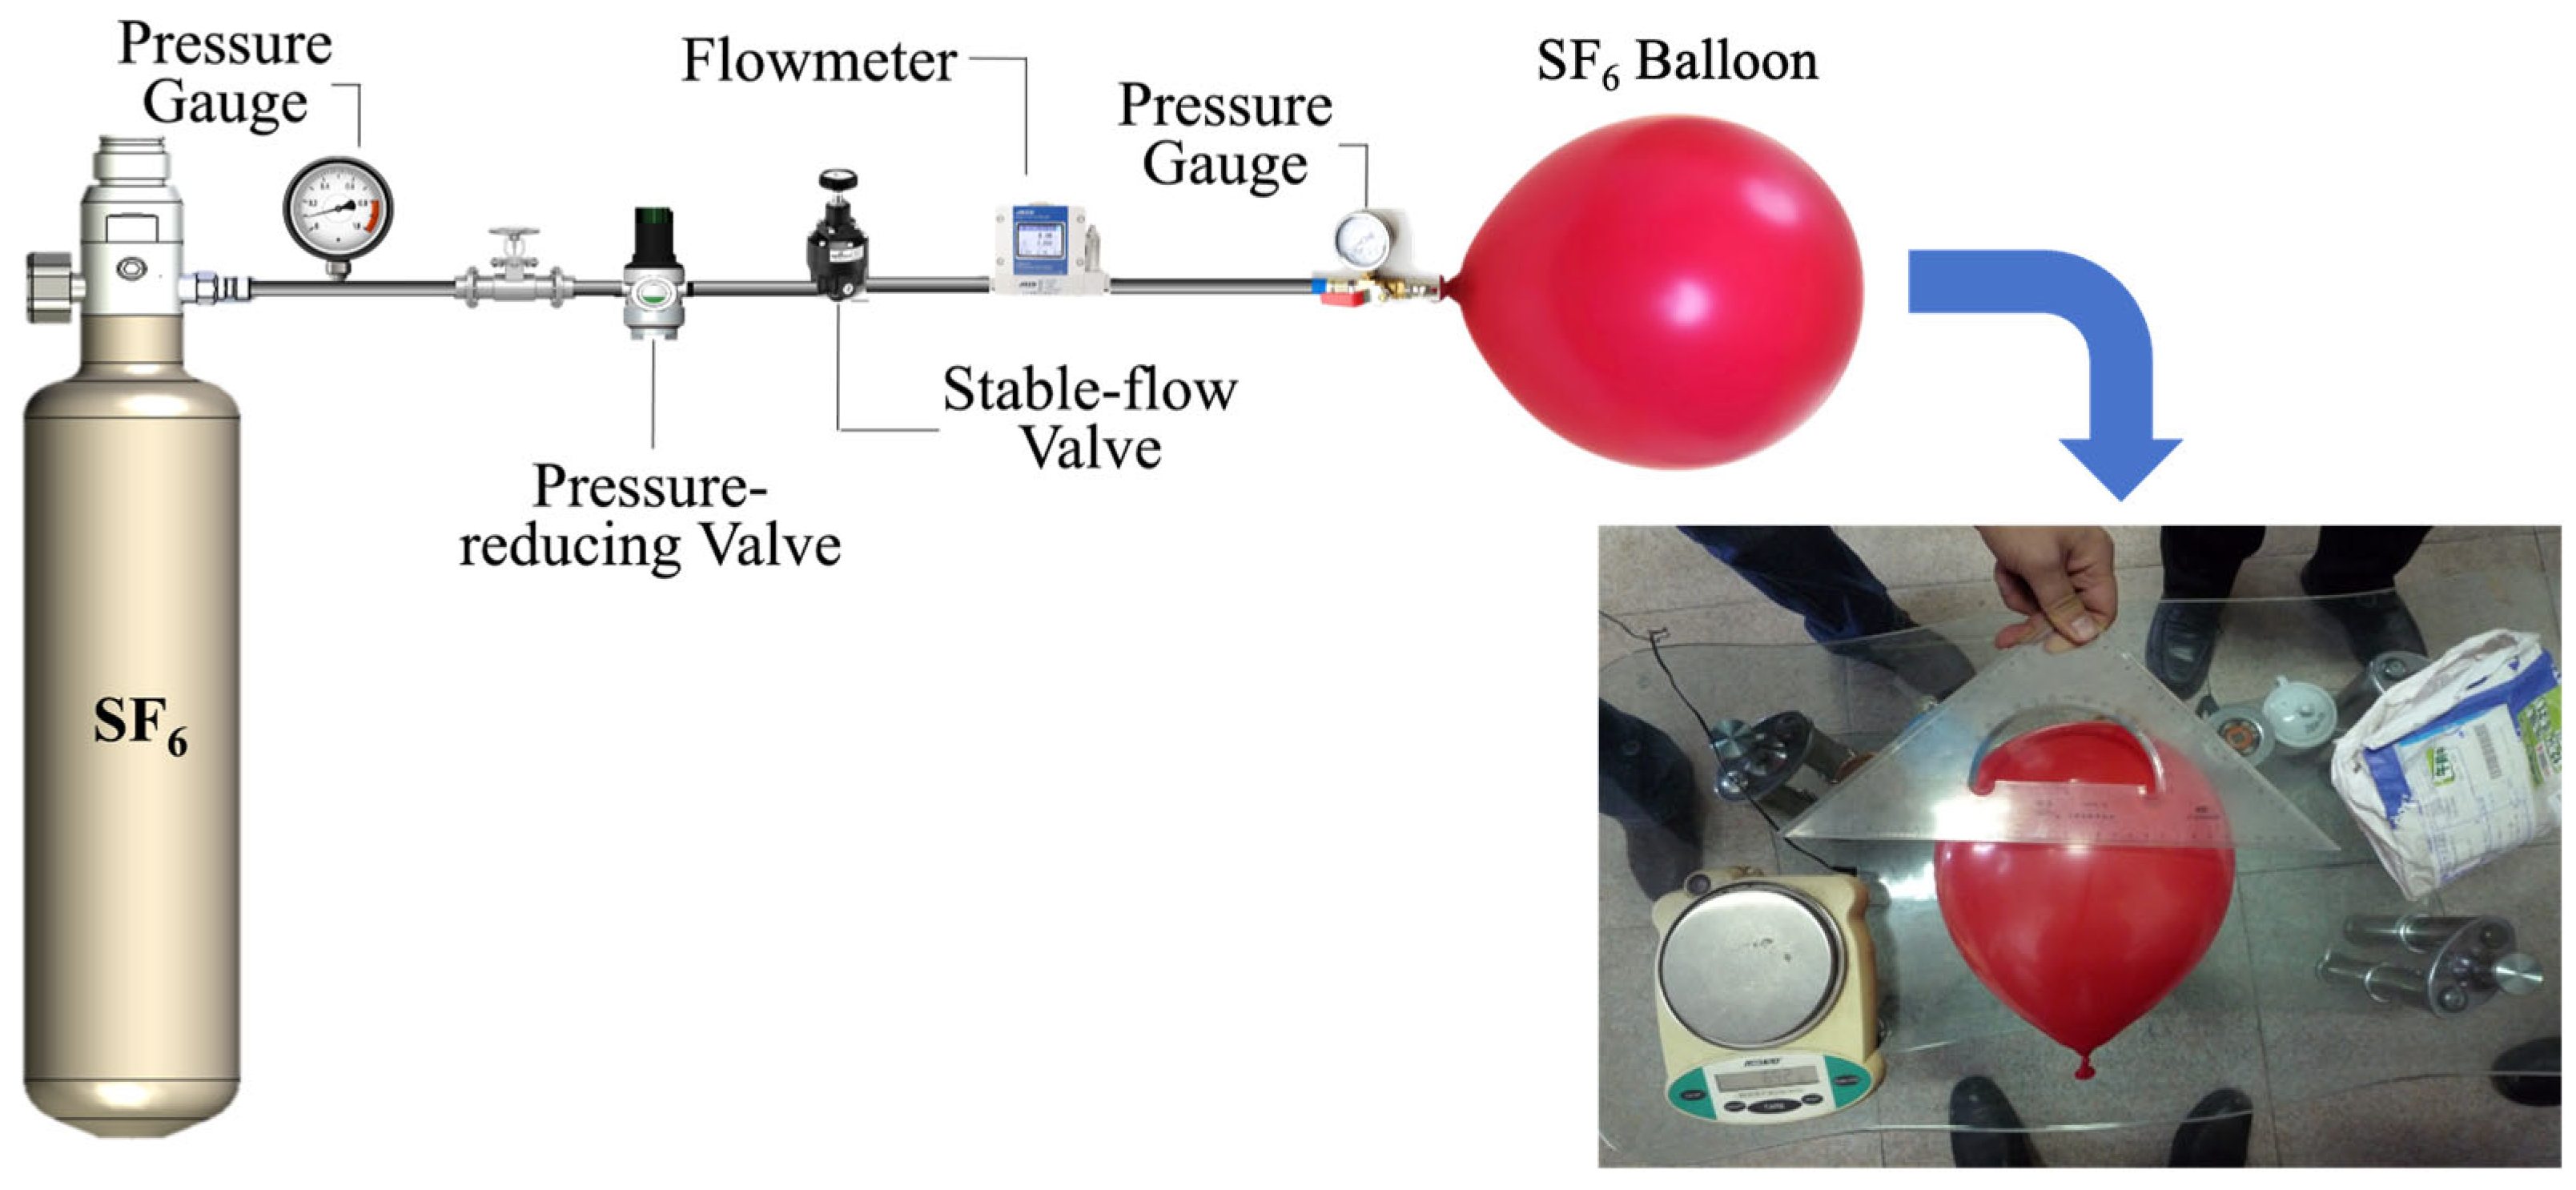
2. Materials and Methods

Accurate determination of mine ventilation parameters and optimization of ventilation networks constitute fundamental prerequisites for ventilation system design, where measurement precision directly governs the reliability of network resolution and regulatory effectiveness. Conventional measurement methods have been plagued by prolonged testing cycles and inherent sensitivity to elevation errors at measurement points. However, recent advancements have achieved substantial improvements in measurement accuracy and operational efficiency through the systematic integration of modern mathematical methodologies and novel sensing technologies.
Jia et al. [20] addressed the limitations of conventional static models by developing a dynamic thermo-flow coupling model incorporating airflow fluctuation factors, which achieves over 93% agreement with field measurements in capturing spatiotemporal variations of ventilation parameters during mining face advancement. Zhang [21] integrated an Improved Whale Optimization Algorithm (IWOA) with adaptive inertia weights and Lévy flight strategies, achieving an 18% reduction in ventilation energy consumption in the Huainan mining area, thereby establishing a novel intelligent pathway for energy-efficient optimization. Zhang et al. [22] enhanced computational efficiency for large-scale networks through an augmented artificial bee colony algorithm featuring chaotic initialization and a dynamic neighborhood search, reducing optimization time for 100-node ventilation networks to one-quarter of that required by conventional genetic algorithms. Wu et al. [23] developed an intelligent regulation system that employs a 37-feature fuzzy decision model to compress optimization calculations for 150-node networks to 30 s, achieving ±5% airflow fluctuation control at working faces with sixfold efficiency improvement over traditional methods, thereby establishing a technical framework for real-time dynamic regulation.
Geological conditions exert significant influences on mine ventilation systems. Andrzej et al. [24] investigated the effects of roadway convergence in longwall mining panels on ventilation networks, revealing that such convergence increases ventilation resistance, reduces ventilation efficiency, and disrupts normal ventilation system operations. Wu et al. [25] developed a coupled model and solution technique for integrating mine ventilation networks with gob area flow field boundaries, aiming to accurately characterize airflow exchange between gob areas and ventilation networks. This advancement provides more precise foundations for optimizing ventilation systems. Lei et al. [26] proposed a method utilizing tracer gas technology to remotely determine fire locations and severity levels, offering critical support for formulating effective fire rescue strategies.
Substantial advancements have been achieved in mine ventilation research, encompassing extensive exploration of optimization models, intelligent algorithm applications, gas monitoring, interactions between ventilation systems and external factors, as well as safety/emergency management and energy efficiency. However, with the evolution of the mining industry, mine ventilation now confronts emerging challenges such as increasing mining depths and complex geological conditions [27,28]. These developments necessitate further intensified research efforts to optimize ventilation systems under intricate geological constraints.
Tracer gas leakage detection technology has achieved significant advancements globally in recent years. Experts predominantly utilize sulfur hexafluoride (SF6) as the core tracer agent, coupled with high-precision detection devices and multi-source data fusion technologies, to achieve precise tracking of airflow pathways and leakage localization in mine ventilation systems [29]. Current tracer gas methodologies primarily include instantaneous tracer gas release, continuous quantitative release, and multi-tracer gas detection [30].
The instantaneous release method, the most widely adopted approach, offers simplicity and operational feasibility. However, its reliance on intermittent sampling introduces challenges in determining optimal gas concentration sampling intervals, compromising experimental accuracy [31]. In contrast, the continuous quantitative release method involves stable and controlled tracer gas emission within monitored roadways, with downstream sampling points detecting concentration variations. Leakage influx along airflow directions induces detectable concentration declines, whereas intact pathways maintain constant tracer levels [32].
Theoretical advancements centered on longitudinal dispersion coefficient models have progressively reduced computational errors [33,34,35]. Nevertheless, insufficient accuracy in multi-path airflow quantification within complex ventilation networks remains a critical limitation. Current longitudinal dispersion coefficient calculations rely on static empirical parameters (e.g., friction coefficients), neglecting real-time velocity fluctuations and dynamic roadway condition impacts [36,37], which necessitate manual correction due to significant deviations. Furthermore, high humidity and dust-laden environments degrade instrument sensitivity, causing underestimated SF6 concentrations and compromised monitoring precision [38,39].
Addressing these limitations, this study systematically investigates spatiotemporal evolution patterns of mine airflow and air leakage quantification by integrating instantaneous tracer gas release, multi-path airflow flux analysis, and high-precision dynamic monitoring. Using SF6 as the tracer agent, a synchronized multi-release-point monitoring network is established, combined with a dynamic correction model for longitudinal dispersion coefficients, to quantitatively characterize leakage behaviors across partitioned airflow paths in complex ventilation networks.

3. Theoretical Model

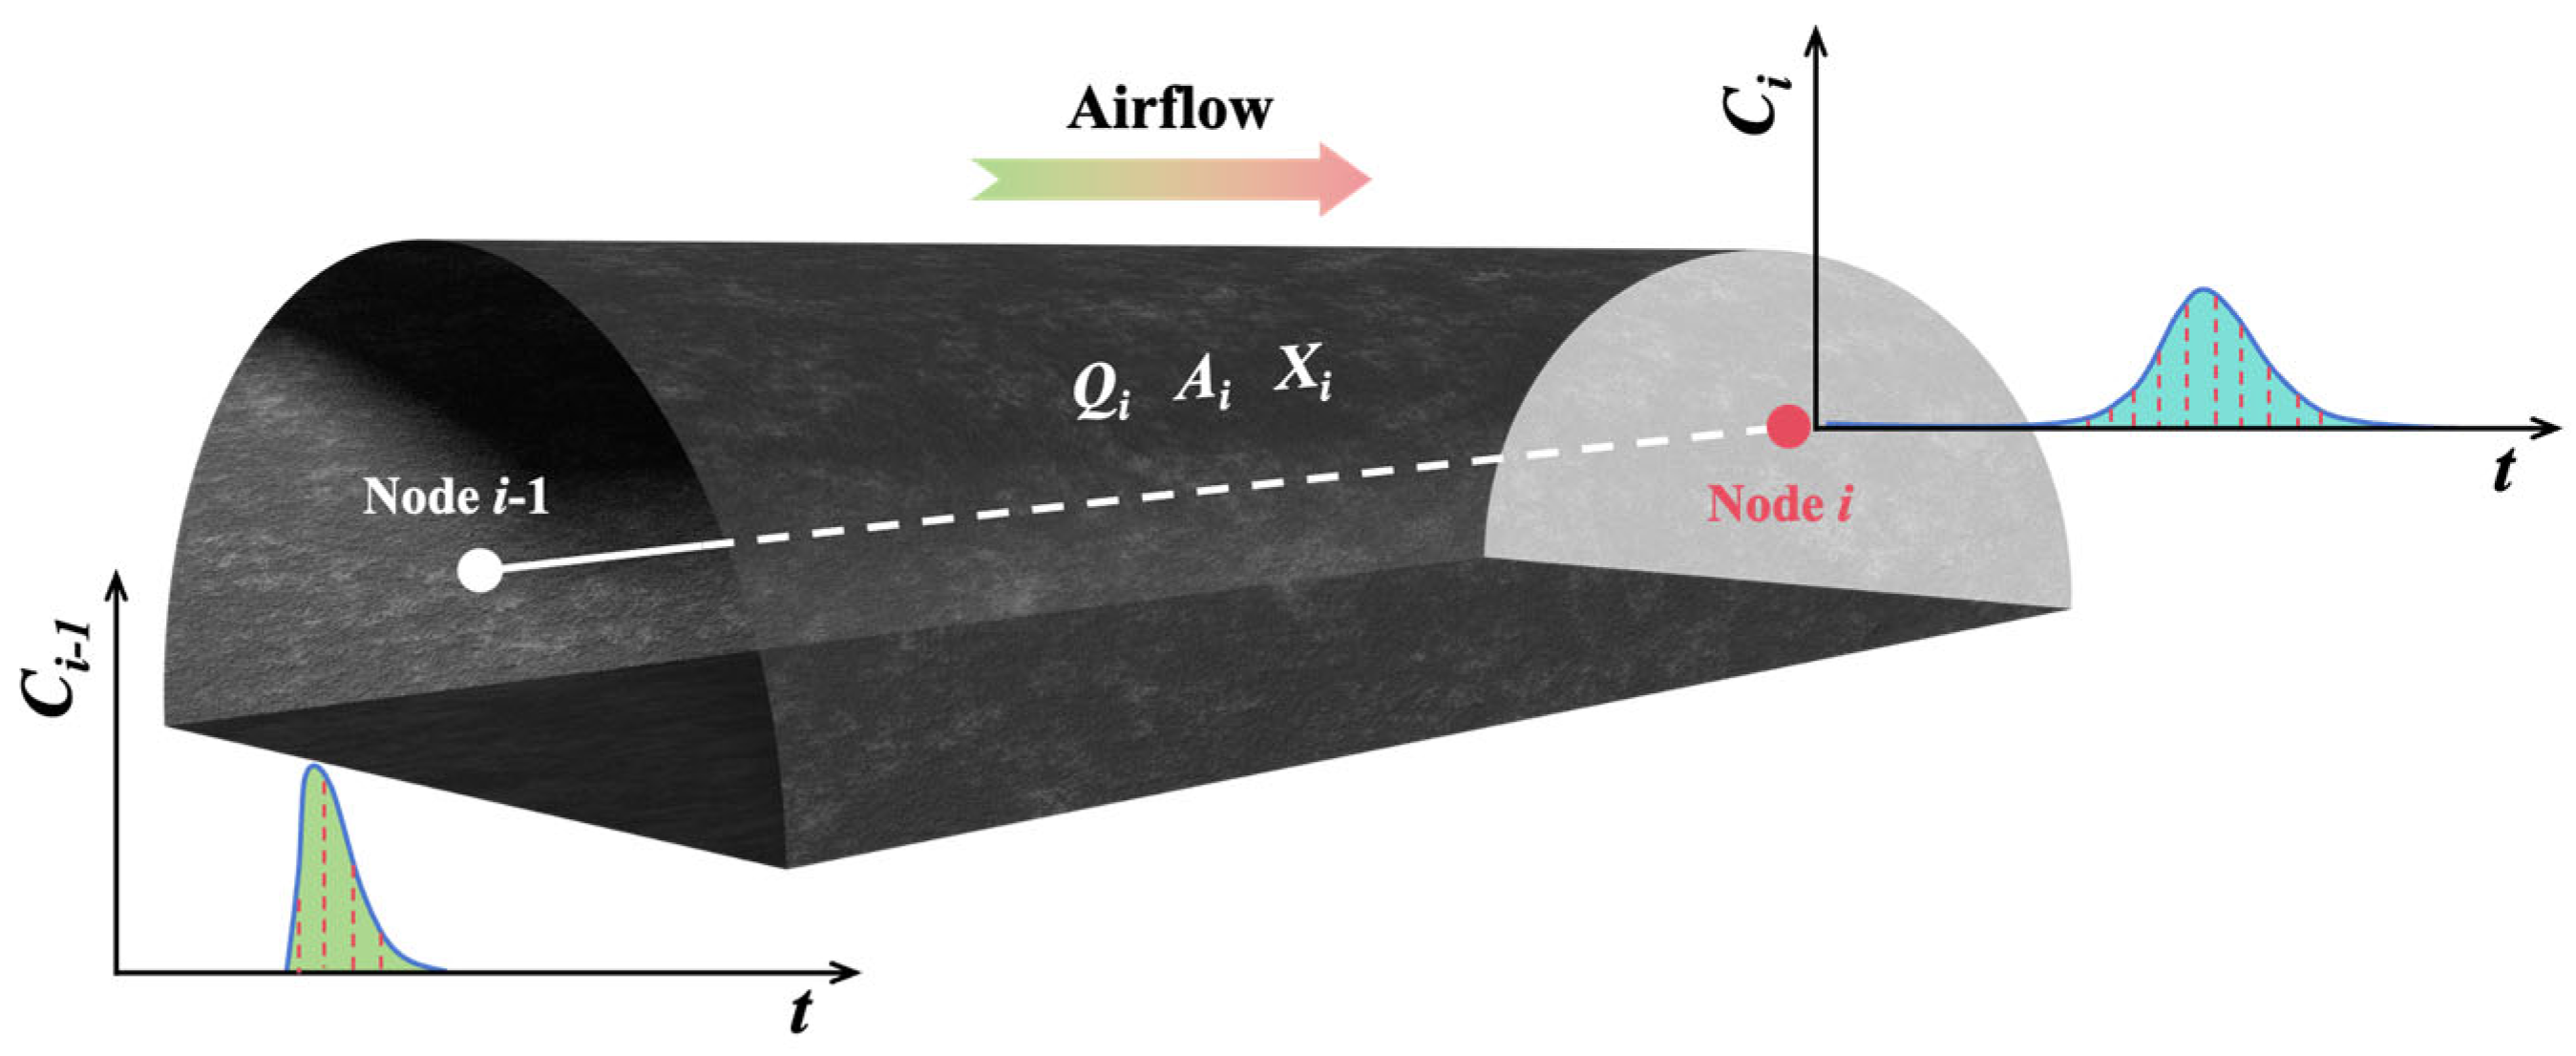
3.1. Mass Transfer Theory of Tracer Gas in Single Airway

Due to the narrow geometry and rough surfaces of underground roadways, airflow during mine ventilation typically exhibits turbulent flow regimes [40,41,42,43]. Following instantaneous tracer gas release, the gas is advectively transported by the turbulent airflow. This transport mechanism in the primary flow direction arises from the superposition of advective mass transfer and diffusive mass transfer driven by concentration gradients and fluid pulsations [44]. Turbulent pulsations induce cross-sectional tracer exchange through interlayer mixing and vortex interactions, leading to progressive homogenization of tracer concentrations across the roadway cross-section while simultaneously promoting axial dispersion [45,46,47]. Consequently, the mass transfer process of tracer gases in turbulent mine airflow represents a coupled phenomenon of turbulent advection, dispersion, and diffusion.
The tracer gas transport mechanism adheres to fundamental physical principles, including the law of mass conservation, the Fick law of diffusion, and the Boussinesq hypothesis for turbulent closure [46,48]. By defining a differential control volume in the tracer-laden airflow (Figure 1) and analyzing the relationships among instantaneous, fluctuating, and time-averaged tracer quantities under these principles, the governing equations are derived to characterize the temporal evolution of tracer concentration.
When establishing the mathematical model for turbulent mass transfer of tracer gases, let differential control volume A be defined with local tracer gas concentration c. A three-dimensional Cartesian coordinate system is established at A, with infinitesimal elements dx, dy, and dz along the x, y, and z axes, respectively. The corresponding airflow velocity components in these directions are u, v, and w.
Based on the law of mass conservation, the governing equation is derived as
J t = J d + J i + J c
where
Jt—temporal variation of tracer gas mass per unit time within the differential control volume, J t = c t d x d y d z .
Jd—net mass flux of tracer gas through the control volume per unit time, J d = u c x + F x x + v c y + F y y + w c z + F z z d x d y d z (Fx, Fy, Fz: diffusion fluxes along x, y, z axes).
Ji—source/sink term from physicochemical reactions altering tracer mass per unit volume-time, J i = λ c d x d y d z . The tracer gas change coefficient λ has three cases (λ < 0, λ = 0, λ > 0). For SF6 (selected for its chemical inertness), λ = 0.
Jc—mass variation per unit volume-time from adsorption/leakage effects. While SF6 minimizes adsorption impacts, leakage effects remain experimentally dependent.
Incorporating these terms, Equation (1) simplifies to
c t = u c x v c y w c z F x x F y y F z z + γ c
Per Fick’s law,
F x = D x c x ,   F y = D y c y ,   F z = D z c z
where Dx, Dy, and Dz are molecular diffusion coefficients.
Substituting Equation (3) into (2),
c t + u c x + v c y + w c z = x D x c x + y D y c y + z D z c z + γ c
Turbulent quantities are decomposed into mean (“—”) and fluctuating (“′”) components:
c = c ¯ + c ,   u = u ¯ + u ,   v = v ¯ + v ,   w = w ¯ + w c ¯ = u ¯ = v ¯ = w ¯ = 0 u c ¯ = u ¯ c ¯ + u c ¯ ,   v c ¯ = v c ¯ + v c ¯ ,   w c ¯ = w ¯ c ¯ + w c ¯
Applying Boussinesq eddy viscosity hypothesis,
u c ¯ = k x c ¯ x ,   v c ¯ = k y c ¯ y ,   w c ¯ = k z c ¯ z
where kx, ky, and kz are turbulent diffusion coefficients.
Based on the Boussinesq hypothesis and decomposition of turbulent quantities, the governing equation of tracer gas transport in turbulent mine airflow can be expressed as
C t + u ¯ C x = x ( k x C x ) + y ( k y C y ) + z ( k z C z )
Assumptions: the velocity and concentration fields are decomposed into mean and fluctuating components, turbulent diffusion prevails over molecular diffusion, and the Boussinesq approximation is adopted for turbulent closure.
Given the narrow and elongated geometry of mine roadways, radial velocity components are negligible ( v ¯ = w ¯ = 0), and the turbulent diffusion in transverse directions is much smaller than in the axial direction (kx >> ky, and kz) [29]. Therefore, the equation simplifies as
C t + u ¯ C x x k x C x
Defining E = kx as the longitudinal dispersion coefficient, we then obtain
C t + u ¯ C x = x ( E C x )
Assuming both u ¯ and E are constants along the x-direction, the equation reduces to the classical one-dimensional advection-dispersion model:
C t + u ¯ C x = E 2 C x 2
Assuming the flow is steady and fully developed, there are no source or sink terms, and the dispersion and velocity coefficients are spatially uniform.
Considering the conservation of mass of the tracer gas in underground tunnels and not taking into account the presence of air leakage, Equation (10) can be simplified as
C t = x ( E C x ) u C x
where
C—tracer concentration, ppm;
E—longitudinal dispersion coefficient, m2/s;
u—average axial velocity, m/s.
Assuming the initial release point condition is t = 0, x = 0 in the semi-infinite airway (0 ≤ x < +∞):
c x , 0 = 0 0 + c x , t d x = V c + , t = 0 0 x + t 0 t > 0
Then,
C ( x , t ) = V 2 A π E   t exp [ ( x u t ) 2 4 E   t ]
Adopting the Chen Kaiyan model [9],
E = 65.47 u r f
where
f—empirical friction coefficient, kg/m3;
r—hydraulic radius, m.
The concentration profile follows N (u, σ2) normal distribution, where μ = ut and σ2 = 2Et.

3.2. Tracer Gas Concentration Resolution in Complex Airway Networks

The tracer gas experiments were conducted across multiple interconnected airways at an underground coal mine, with concentration measurements spanning these continuous passageways. Consequently, the single-airway concentration solution (Equation (13)) becomes insufficient for predicting results in such complex configurations. Figure 2 illustrates the tracer concentration distribution between two adjacent nodes.
To resolve this, the upstream node (i − 1) concentration-time curve is discretized into n equal segments, each corresponding to a time interval Δ τ . The tracer gas volume Δ M within Δ τ is calculated as
Δ M = C i 1 ( τ ) Q i Δ τ   ( m 3 )
Per numerical integration principles, finer discretization ( Δ τ → 0) minimizes truncation errors, thereby reducing experimental simulation uncertainties. Substituting Equation (13) yields
C i = 0 t c i 1 ( τ ) Q i 2 A i ( π E i ( t τ ) ) 1 / 2 exp ( ( L i u i ( t τ ) ) 2 4 E i ( t τ ) ) d τ
where
Ci−1—tracer concentration at upstream node, ppm;
Ci—tracer concentration at downstream node, ppm;
Qi—airflow rate, m3/s.

4. Field Measurements

This study utilizes tracer gas with specific properties. Released from high-pressure air sources within the ventilation network, the tracer gas is carried by the airflow. At network nodes, the gas separates or converges with the airflow. Simultaneously, the tracer gas undergoes dispersion throughout the roadway. Over time, the concentration of the tracer gas in the airflow is continuously monitored and recorded in real time at the return air shaft outlet. The mine ventilation system employs a central boundary configuration, with the main fan operating under an exhaust mode.
To address the complex airway topology and multi-fan coordinated ventilation network characteristics of coal mines, this study employs the self-developed Mine Ventilation Network Analysis (MIVENA) system for systematic modeling and numerical simulations. The MIVENA system enables analytical studies of airflow volume, ventilation resistance, air temperature, and humidity during active mining operations. Beyond analyzing mine airflow pressure and underground climate conditions, MIVENA integrates a dedicated data management system with 3D visualization and CAD imaging capabilities. Innovatively, the system employs a Contour Correction Decomposition Method to resolve nodal airflow stability issues. The study utilized the MIVENA system to resolve critical parameters, including roadway-specific aerodynamic characteristics, airflow rates, and ventilation pathways, thereby generating a three-dimensional ventilation network model. Guided by the fundamental principles of fluid mechanics and tailored to site-specific conditions, sulfur hexafluoride (SF6) was deployed as the tracer gas for air leakage quantification. Figure 3 illustrates the schematic of the proprietary continuous tracer gas release apparatus, which achieves a stable release rate of 10–100 mL/min through precision-regulated valves.
Leveraging the dynamic equilibrium characteristics of the mine ventilation system and pressure gradient distributions across critical nodes (intake roadways, panel connecting tunnels, main return airways), five strategic tracer release points were scientifically designated: −400 Belt Roadway 331 Panel West-side Track Decline (Point 1), 2433 Transport Roadway (Point 2), 2433 Return Airway (Point 3), 331 Track Rise (Point 4), and Main Return Airway Measurement Station (Point 5).
Release volumes per location are detailed in Table 1.
To address underground coal mine air leakage diagnostic requirements while accounting for ventilation network dynamics, this study implemented a time-sequenced multi-source localization protocol using SF6 tracer gas. The staggered instantaneous release strategy (Figure 4) employed temporal isolation windows (3–12 min intervals) to ensure independent signal discrimination. Release sequencing followed fluid transport, temporal separation maximization principles:
  • Initial release: 18,841 mL SF6 at Point 5 as baseline signal;
  • +3 min: 17,657 mL at point 3;
  • +3 min: 21,098 mL at Point 2;
  • +12 min: 20,265 mL at Point 1;
  • Final release: 19,641 mL at Point 4.
This phased protocol generated discrete concentration wave packets within the return airflow system, effectively mitigating multi-source signal superposition interference through controlled spatiotemporal decoupling.
The monitoring system employed a Bruel & Kiaer 1302 multi-functional SF6 detector (Figure 5 and Figure 6), positioned at the return shaft portal, with a sampling frequency of 60 s for continuous monitoring.

5. Results and Discussion

5.1. Dynamic Tracer Response and Ventilation Pathway Coupling

Given the staggered release timings across five designated locations, the Bruel & Kiaer 1302 detector initiated continuous monitoring immediately following the first release event (Point 5). Table 2 summarizes the acquired monitoring dataset, correlating temporal concentration profiles with ventilation pathway dynamics.
Based on field conditions and MIVENA calculation results, the number of airflow pathways from each tracer release point to the monitoring station is summarized in Table 3.
To further clarify airflow branch variations and precisely identify air leakage, airflow velocities across distinct pathways were measured using anemometers after determining tracer transport routes. To ensure the accuracy and universality of single-path velocity measurements, 12–15 sampling points were selected per airflow branch, with mean values calculated to represent branch-averaged velocities.
Given the multi-path connectivity between release points and the monitoring station, tracer gas arrival times vary depending on pathway-specific airflow velocities and airway lengths. The calculated travel times for five release points via different pathways are tabulated in Table 4, Table 5, Table 6, Table 7 and Table 8, derived from mean airflow velocities and geometric distances.
Assume that following instantaneous release, the tracer gas exhibits uniform concentration distribution across the cross-sections of all pathway airways it traverses, while undergoing advective diffusion along the axial direction. Under turbulent flow conditions within the airway, the mass transfer process of the tracer gas can be characterized as a superposition of turbulent advection and longitudinal dispersion. Longitudinal dispersion refers to the axial propagation of the tracer gas from the release source, driven by turbulent mixing. Critically, while longitudinal dispersion governs the spatial extent of concentration distribution and peak magnitude, it does not affect the peak arrival timing at the monitoring point. The temporal positioning of concentration peaks remains exclusively dependent on the mean airflow velocity within the airway.

5.2. Analysis of Deviation Between Theoretical and Measured Peak Arrival Times

As shown in Table 4, Table 5, Table 6, Table 7 and Table 8, the theoretical peak appearance time ranges of the tracer gas are as follows:
  • Release Point 1: 19.3 min to 33.7 min;
  • Release Point 2: 6.6 min to 14.1 min;
  • Release Point 3: 4.8 min to 12.2 min;
  • Release Point 4: 4.6 min to 7.7 min;
  • Release Point 5: 1.3 min.
As illustrated in Figure 7, the measured peak concentrations of tracer gas occur at the following times: 6.37 min, 8.93 min, 10.98 min, 40.65–50.20 min, and 61.65 min. Based on the distances and airflow pathways from release points to the monitoring station, the observed peaks are attributed as follows:
  • First peak (6.37 min): corresponds to Release Point 5, consistent with its theoretical arrival time (1.3 min), with minor temporal deviations attributable to turbulence-induced dispersion effects.
  • Second peak (8.93 min): aligns with Release Point 3, falling within its calculated arrival time range (4.8–12.2 min).
  • Third peak (10.98 min): matches the theoretical arrival time of Release Point 2, demonstrating close agreement with upper-bound predictions.
  • Fourth peak interval (40.65–50.20 min): overlaps partially with the theoretical range of Release Point 1 (19.3–33.7 min), suggesting the presence of unmodeled leakage pathways or dynamic ventilation network interactions. Notably, Release Point 4’s predicted arrival time (4.6–7.7 min) precedes this interval, excluding it as a contributor.
  • Fifth peak (61.65 min): exhibits no correspondence to any release point’s theoretical arrival window, potentially arising from unaccounted leakage sources, sensor noise, or secondary airflow recirculation.
By integrating empirical longitudinal dispersion coefficients into the MIVENA computational framework, the simulated tracer concentration profiles (Figure 8) demonstrate moderate alignment with field measurements.
The dominant factor governing peak arrival timing is airflow velocity. As evidenced in Figure 8, discrepancies exist between theoretical and measured airflow velocities.
To systematically evaluate the consistency between theoretical simulations and experimental measurements, this study established a multi-dimensional quantitative analysis framework comprising four core modules: data matching, discrepancy quantification, comprehensive scoring, and outlier identification.
A nearest neighbor matching algorithm based on temporal Euclidean distance was implemented for temporal misalignment between simulated and experimental time series. For each simulated data point (xsim, ysim), its corresponding experimental counterpart (Xclo, Yclo) in the measured dataset (Xtrue, Ytrue) was determined by minimizing temporal Euclidean distance.
x clo = arg min x j X true | | x sim x j | |
This matching strategy effectively eliminates temporal offset interference and ensures data comparability.
To eliminate dimensional differences, relative errors between simulated and experimental values were calculated in both temporal and concentration dimensions:
Δ x r e l = | x s i m x c l o | max ( X t r u e ) min ( X t r u e )
Δ y r e l = | y s i m y c l o | max ( Y t r u e ) min ( Y t r u e )
A comprehensive discrepancy score (Dscore) was developed using the two-dimensional Euclidean distance to assess overall differences in temporal-concentration space:
D s c o r e = ( Δ x r e l ) 2 + ( Δ y r e l ) 2
Lower Dscore values indicate better agreement between simulation and experimental data.
Outlier detection was performed through Z-score standardization of discrepancy scores:
Z i = D s c o r e , i μ D s c o r e σ D s c o r e
where μDscore and σDscore represent the mean and standard deviation of all Dscore. Data points with |Zi| > 3 were identified as outliers and excluded from subsequent calculations to prevent biased model evaluation.
As shown in Figure 9a, the temporal-concentration distribution demonstrates good agreement between simulated and experimental data. During the stable phase (>40 min), high consistency (Dscore < 0.2) validates model reliability in steady-state conditions. Local deviations (Dscore ∈ [0.5, 1.5]) observed in initial (0–10 min) and peak response (~30 min) phases may relate to initial condition settings or dynamic response mechanisms, requiring parameter optimization.
Figure 9b presents the frequency distribution and probability density curve of Dscore. The right-skewed distribution reveals 92% of data points concentrated in Dscore ∈ [0, 0.5], confirming satisfactory model predictive capability. Z-score analysis identified one extreme outlier (xsim =0.9013, ysim =6.06063) with Dscore =5.777996 (Δxrel =0.004671, Δyrel =5.777994) significantly exceeding normal variation ranges. Exclusion of this outlier ensures the evaluation system objectively reflects overall model performance without undue influence from singular anomalies.
The proposed methodology provides a robust framework for quantitative model validation, combining dimensional normalization, multi-criteria assessment, and statistical outlier management to ensure evaluation rigor and reliability. The relative error between simulated (Csim) and measured (Cmeas) concentrations was quantified by
Relative   concentration   error :   Δ C rel = C s i m C m e a s / C m e a s
Integrated   deviation   score :   D score = Δ t rel 2 + Δ C rel 2
Outliers (Dscore > 3σ) were excluded during fitting (Figure 9b).
Peak concentration magnitude is primarily governed by longitudinal dispersion coefficients, with empirical values failing to reflect actual dispersion dynamics in roadways. By analyzing the difference between the actual wind speed in the airway and the theoretically calculated wind speed, a wind speed correction coefficient v is introduced.
v = Uc/U
where
v—wind speed adjustment coefficient;
U—measured airflow velocity, m/s;
Uc—theoretical airflow velocity, m/s.
For the longitudinal dispersion coefficient, import the correction factor k based on the measured and simulated values.
E = k × Ec
where
k—dispersion adjustment coefficient;
E—calibrated longitudinal dispersion coefficient, m2/s;
Ec—computed dispersion coefficient, m2/s.
Post-calibration concentration profiles (Figure 10) demonstrate enhanced alignment between simulations and measurements.
The average roadway air velocity can be calculated based on the roadway air volume and average roadway area. On this basis, the wind velocity correction coefficient is obtained through comparative analysis of experiments and simulations. After fully understanding the airflow characteristics in the roadway, the dispersion adjustment coefficient k at each release point in the simulation calculation can be further derived, and the values of k are listed in Table 9.
As indicated by Table 9, the dispersion coefficients of the roadways at release points 5, 3, and 2 show little difference from the theoretically calculated values. However, the release points 1 and 4 are significantly different, where the value at Release Point 1 is 2.4 times the initial value, and that at Release Point 4 is 4 times the initial value. Combined with field conditions, it is known that a local ventilator is installed along the airflow path of Release Point 1, which increases the longitudinal dispersion coefficient of the tracer gas under the action of the local ventilator. For Release Point 4, there are multiple factors causing the increase in the dispersion coefficient along the tracer gas flow path, with the main factors including changes in roadway cross-section and bends.
Using the refined longitudinal dispersion model within the MIVENA framework, theoretical arrival times (Tp) were computed via
T p = 0 L 1 u ( x ) d x + L 2 2 E ln C max C 0
where u(x) is the segmented airflow velocity function and L is roadway length. Comparative analysis with field data (Table 2) revealed three deviation patterns:
(1)
Class A Deviation (ΔT ≤ 1.5 min)
Observed at Release Point 5 (single pathway). Theoretical Tp = 1.3 min aligns with measured 1.28 min (98.5% accuracy). This result validates hydrodynamic parameters in the main return airway (L = 632 m), where E = 0.31 m2/s (measured) deviates only 6.9% from empirical E = 0.29 m2/s at Re = 3.2 × 10⁵ (fully turbulent).
(2)
Class B Deviation (1.5 min < ΔT ≤ 4 min)
Among the 12 paths from Release Point 2 to the monitoring point, there is a deviation of ΔT = 0.23 min between the theoretical arrival time of path 11 (Tp = 6.6 min) and the measured peak value at 6.37 min. After on-site testing and investigation, it was found that there was a local wind speed acceleration phenomenon (caused by the contraction rate of the tunnel section leading to the Venturi effect) in the 2433 Transport Roadway that the path passed through, resulting in a shortened actual transportation time.
(3)
Class C Deviation (ΔT > 4 min)
Significant deviation occurred in the path 1~2 of Release Point 1, with a discrepancy of up to 7 min between the theoretical value of 33.5–33.7 min and the measured peak value of 40.65 min. Through on-site investigation, it was found that there was an abrupt cross-sectional change in the west track decline of the 331 mining area (the cross-sectional area was reduced from the original 12.3 m2 to 8.7 m2), triggering local recirculating vortices. This turbulent flow structure increased the residence time of the tracer gas in the mutation zone by 23%, leading to peak delay.
Based on the concentration distribution characteristics of the tracer gas at each release point when it reaches the return air shaft, it can be determined that Release Point 5 is located within a single airflow path in the return air roadway and has the characteristics of a short flow path and high wind speed. The tracer gas path of Release Point 2 is longer by one working face length than that of Release Point 3, leading to an overlap in the concentration distributions of the two points. This results in a higher concentration peak for the tracer gas from Release Point 2. Meanwhile, the difference between the simulated and measured curves within the 15~35 min range represents delayed tracer gas caused by local air leakage in the working face. Between the concentration peaks of Release Points 4 and 5, almost no trough occurs, and a subsequent concentration peak appears immediately after 60 min. In the simulation, this peak does not correspond to the path of any release point’s tracer gas, so it is determined to be a concentration outlier formed through an air leakage path. There are four paths from Release Point 4 to the return air shaft. The paths of Release Points 1, 2, and 3 overlap primarily with the main path of Release Point 4. Since the concentration curves of Release Points 2 and 3 exhibit normal distribution characteristics, it can be concluded that no air leakage exists in the main path of Release Point 4. The other two paths of Release Point 4 have smaller air volumes; even if there are low wind speeds or retention phenomena, high-concentration peaks would not be detected. Therefore, it is inferred that an air leakage path exists between Release Points 1 and 4.

6. Conclusions

The study takes underground coal mine as an engineering background. Based on the tracer gas method (SF6) combined with multipath air flow flux analysis and dynamic correction technology, it systematically explores the characteristics of mine air flow states and methods for determining air leakage volumes, proposing innovative theories and technical means that significantly improve the accuracy of air leakage localization and the reliability of air volume calculations in complex ventilation networks. Through theoretical modeling, field measurements, and data analysis, the research achievements are as follows:
(1)
The study developed a ventilation model with dynamic dispersion correction to resolve >30% errors in conventional approaches. By decomposing networks into independent pathways and integrating real-time monitoring data, it corrects deviations from cross-sectional changes (12.3 m2 to 8.7 m2), velocity fluctuations, and localized turbulence.
(2)
Temporally isolated tracer releases at five points identified critical anomalies: a 23% residence time increase and a 7 min delay in Pathways 1–2 (Release Point 1), a 0.23 min transport reduction in Pathway 11 (Release Point 2), and concealed leakage between Nodes 1–4 detected at 61.65 min.
(3)
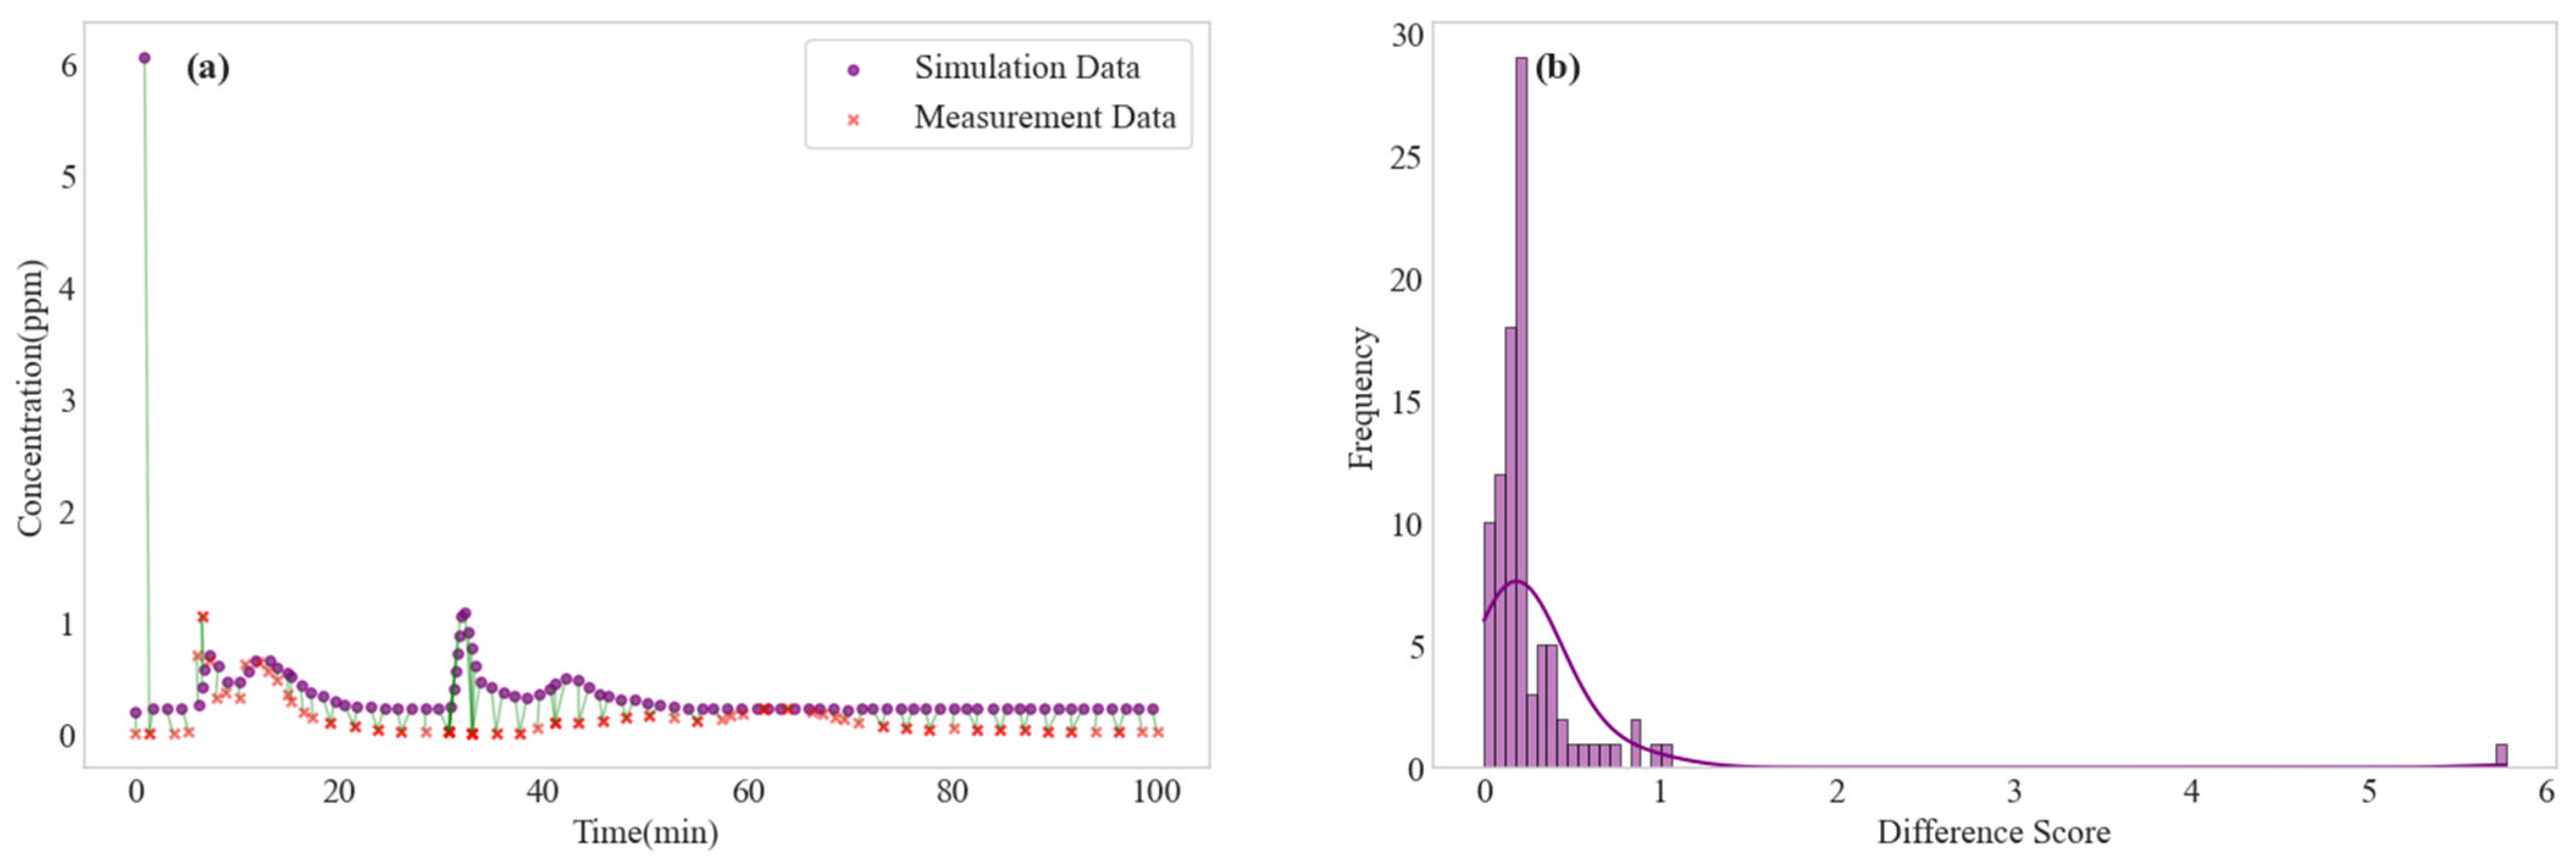
Wind speed deviation dominates peak timing errors; dispersion coefficient deviation governs peak amplitudes. Correction coefficients (v and k) improved simulation-measurement fit to >95%.
(4)
The method enables targeted leakage sealing (e.g., Nodes 1–4), reduces invalid airflow, and integrates with MIVENA for intelligent ventilation management.
Future research will include further optimizing the dynamic correction model with real-time humidity/dust factors and enhancing MIVENA with high-frequency sensing for precise leakage tracking. It may also validate extreme geological impacts and integrate machine learning for autonomous ventilation management.

Author Contributions

Y.W. (Yadong Wang): conceptualization, methodology, investigation, formal analysis, Project administration, resources, writing—original draft; S.J.: methodology, investigation, formal analysis; M.G.: data curation, formal analysis, software, writing—original draft; Y.Z.: conceptualization, software, validation; Y.W. (Yongjun Wang): supervision, software, writing—review and editing, funding acquisition. All authors have read and agreed to the published version of the manuscript.

Funding

Scientific Research Project of the Education Department of Liaoning Province, China (Grant No. LJKMZ20220667).

Data Availability Statement

Data will be made available on request.

Acknowledgments

This study was supported by the Liaoning Technical University Institute of Engineering and Environment. The authors also gratefully acknowledge the support of Shanxi Jiexiu Yitang Qingyun Coal Industry Co., Ltd.

Conflicts of Interest

Author Yadong Wang was employed by the company Shanxi Jiexiu Yitang Qingyun Coal Industry Co., Ltd. The remaining authors declare that the research was conducted in the absence of any commercial or financial relationships that could be construed as a potential conflict of interest.

References

  1. Wang, Y.; Zheng, Q.; Zhang, H.; Zhang, X.; Dong, W.; Sugai, Y.; Sasaki, K. Dynamic Correlation between Surface Carbon Response and Underlying Emissions from Spontaneous Combustion Goaf: Field Study of an Abandoned Coal Mine. Geomech. Geophys. Geo-Energy Geo-Resour. 2024, 10, 148. [Google Scholar] [CrossRef]
  2. Zhang, H.; Wang, P.; Wang, Y.; Vo Thanh, H.; Ngo, I.; Lu, X.; Yang, X.; Zhang, X.; Sasaki, K. Investigate on Spontaneous Combustion Characteristics of Lignite Stockpiles Considering Moisture and Particle Size Effects. Energy 2024, 309, 133193. [Google Scholar] [CrossRef]
  3. Zhang, X.; Sun, R.; Lu, B.; Huang, G.; Qiao, L.; Liang, H. Study on the Characteristics of Secondary Oxidation and the Key Reactive Groups of Fire Area Coal by Different Cooling Rates. Case Stud. Therm. Eng. 2025, 69, 106014. [Google Scholar] [CrossRef]
  4. Zhang, X.; Sun, R.; Lu, B.; Huang, G.; Fan, N.; Zou, J. Characterization of Oxidation Kinetics of Coals with Different Cooling Rates Based on FTIR and TG Experiments. J. Therm. Anal. Calorim. 2025, 150, 4305–4324. [Google Scholar] [CrossRef]
  5. Zhang, P.; Chen, X. Multi-Physical Field Coupling Model for Thermal Evolution Analysis in Coal Mine Goaf: A Numerical Investigation. Appl. Therm. Eng. 2025, 273, 126551. [Google Scholar] [CrossRef]
  6. Sadeghi, S.; Aminossadati, S.M.; Kizil, M.; Leonardi, C. Numerical Analysis of Shearer Motion Impact on Longwall Ventilation Performance. J. Ind. Saf. 2025, 2, 99–116. [Google Scholar] [CrossRef]
  7. Bhukya, P.; Bhukya, K.N. An Advanced Approach for Cloud Enabled Energy Efficient Ventilation Control of Multiple Main Fans in Underground Coal Mines. Comput. Electr. Eng. 2025, 124, 110330. [Google Scholar] [CrossRef]
  8. Akram, M.W.; Guo, H.; Hu, W. Underground Plant Factory in a Mine Tunnel—Part 2: Passive Ventilation Integration and Economic Feasibility. Energy Built Environ. 2025, in press. [Google Scholar] [CrossRef]
  9. Amoah, N.A.; Xu, G.; Kumar, A.R.; Wang, Y. Calibration of Low-Cost Particulate Matter Sensors for Coal Dust Monitoring. Sci. Total Environ. 2023, 859, 160336. [Google Scholar] [CrossRef]
  10. Si, J. Dynamic Monitoring of Airflow Parameters and Air Quantity Regulation Optimization for Mine Ventilation System. Ph.D. Thesis, China University of Mining and Technology, Xuzhou, China, 2012. [Google Scholar]
  11. Yu, B. Research on Optimization and Control Methods for Complex Dynamic System; Liaoning Technical University: Fuxin, China, 2023. [Google Scholar]
  12. Li, Y.; Li, J.; Deng, C.; Liu, R. Improved Algorithm of Air Quantity Calculating Resistance Based on Diagonal Subnetwork. J. China Coal Soc. 2019, 4, 1147–1153. [Google Scholar]
  13. Liu, Y.; Wang, Z.; Huang, D. Identification of Stochastic Disturbance Sources of Air Doors in Mine Ventilation Systems. Adv. Eng. Inform. 2025, 65, 103356. [Google Scholar] [CrossRef]
  14. Geng, F.; Li, W.; Liu, Y.; Peng, R.; Li, Z.; Liu, H. Intelligent Equalizing Pressure Ventilation System for Coal Mine: A Case Study of the 104 Coal Mining Face in Shige Tai Mine. Energy Rep. 2025, 13, 4998–5005. [Google Scholar] [CrossRef]
  15. Shao, L.; Wang, Z.; Li, C. Optimization Algorithm of Mine Ventilation Based on SA-IPSO. Xitong Fangzhen Xuebao/J. Syst. Simul. 2021, 33, 2085–2094. [Google Scholar] [CrossRef]
  16. Chen, K.; Si, J.; Zhou, F.; Zhang, R.; Shao, H.; Zhao, H. Optimization of Air Quantity Regulation in Mine Ventilation Networks Using the Improved Differential Evolution Algorithm and Critical Path Method. Int. J. Min. Sci. Technol. 2015, 25, 79–84. [Google Scholar] [CrossRef]
  17. Liu, L.; Zhou, Q.; Liu, J.; Deng, L.; Wang, D.; Li, G. Bayesian Optimized Deep Q-Network for Diagnosing Mine Ventilation Systems Windage Alteration Fault Targeting Imbalanced Data. Process. Saf. Environ. Prot. 2024, 191, 2543–2558. [Google Scholar] [CrossRef]
  18. Wang, D.; Liu, J.; Deng, L.; Cao, P.; Liu, L. Fast and Intelligent Measurement of the Ventilation Resistance Coefficient for the Whole Mine Based on Sparse Measurement Points. Eng. Appl. Artif. Intell. 2025, 151, 110713. [Google Scholar] [CrossRef]
  19. Wu, X.; Zhang, Z.; Wang, K.; Han, Z.; Wei, L. Method for Adjusting Air Volume of Mine Ventilation Network Based on DE-GWO Algorithm. Zhongnan Daxue Xuebao (Ziran Kexue Ban)/J. Cent. South Univ. (Sci. Technol.) 2021, 52, 3981–3989. [Google Scholar] [CrossRef]
  20. Jia, T.; Ma, H.; Gao, K. Dynamic Calculation of the Heat-Flow Coupled Mine Ventilation Network with the Introduction of Air Volume Fluctuation Factor. J. China Coal Soc. 2024, 50, 2527–2539. [Google Scholar] [CrossRef]
  21. Zhang, J.; He, X.; Lin, G. Research on Intelligent Optimization of Air Quantity in Mine Based on IWOA Algorithm. Min. Saf. Environ. Protication 2024, 51, 177–184. [Google Scholar]
  22. Zhang, L.; Shuang, L.; Li, W.; Yanqing, L. Intelligent Decision-Making for Mine Airflow on Demand Based on the Improved Artificial Bee Colony Algorithm. J. Mine Autom. 2025, 51, 131–137. [Google Scholar] [CrossRef]
  23. Wu, X.; Han, Z.; Wei, L.; Zuo, Y.; Xu, J.; Li, A. Intelligent On-Demand Adjustment Algorithm and Key Technology of Mine Air Flow. J. China Univ. Min. Technol. 2021, 4, 725–734. [Google Scholar] [CrossRef]
  24. Walentek, A.; Janoszek, T.; Prusek, S.; Wrana, A. Influence of Longwall Gateroad Convergence on the Process of Mine Ventilation Network-Model Tests. Int. J. Min. Sci. Technol. 2019, 29, 585–590. [Google Scholar] [CrossRef]
  25. Wu, F.; Gao, Y.; Chang, X. Boundary Coupling Model and Solution Technology of Mine Ventilation Network and Gob Flow Field. Zhongnan Daxue Xuebao (Ziran Kexue Ban)/J. Cent. South Univ. (Sci. Technol.) 2020, 51, 2333–2342. [Google Scholar] [CrossRef]
  26. Lei, B.; He, B.; Zhao, Z.; Xu, G.; Wu, B. A Method for Identifying the Fire Status through Ventilation Systems Using Tracer Gas for Improved Rescue Effectiveness in Roadway Drivage of Coal Mines. Process. Saf. Environ. Prot. 2021, 151, 151–157. [Google Scholar] [CrossRef]
  27. Wang, Y.; Vo Thanh, H.; Zhang, H.; Rahimi, M.; Dai, Z.; Abualigah, L. Low-Carbon Advancement through Cleaner Production: A Machine Learning Approach for Enhanced Hydrogen Storage Predictions in Coal Seams. Renew. Energy 2025, 241, 122342. [Google Scholar] [CrossRef]
  28. Zhang, X.; Li, J.; Liang, H.; Bai, G.; Gao, F.; Lu, B.; Yu, C. Mechanistic Study on the Effect of Acid Leaching Treatment on the Microstructure Evolution of Different Coal Species and Their Macro-Oxidative Exothermic Properties. Thermochim Acta 2025, 747, 179975. [Google Scholar] [CrossRef]
  29. Xu, G.; Jong, E.C.; Luxbacher, K.D.; McNair, H.M. Effective Utilization of Tracer Gas in Characterization of Underground Mine Ventilation Networks. Process Saf. Environ. Prot. 2016, 99, 1–10. [Google Scholar] [CrossRef]
  30. Jensen, C.R.; Genereux, D.P.; Gilmore, T.E.; Solomon, D.K. Modified Tracer Gas Injection for Measuring Stream Gas Exchange Velocity in the Presence of Significant Temperature Variation. Water Resour. Res. 2023, 59, e2023WR034495. [Google Scholar] [CrossRef]
  31. Remion, G.; Moujalled, B.; El Mankibi, M. Review of Tracer Gas-Based Methods for the Characterization of Natural Ventilation Performance: Comparative Analysis of Their Accuracy. Build. Environ. 2019, 160, 106180. [Google Scholar] [CrossRef]
  32. Gao, N.; Wang, R.; Wu, Y.; Wu, Z. Study on Impact Factors of Tracer Gas Method in Investigations of Gaseous Pollutant Transport and Building Ventilation. Build Simul 2023, 16, 413–426. [Google Scholar] [CrossRef]
  33. Jia, K.; Zhou, L.; Gao, H.; Sun, Q. A Theoretical Framework for Identifying Ventilation Corridors in Megacity Building Clusters Using Coupled Least-Cost Path and A* Algorithms. Build. Environ. 2025, 276, 112890. [Google Scholar] [CrossRef]
  34. Johnson, M.H.; Zhai, Z.J.; Krarti, M. Performance Evaluation of Network Airflow Models for Natural Ventilation. HVAC R Res. 2012, 18, 349–365. [Google Scholar] [CrossRef]
  35. Wang, J.; Jia, M.; Bin, L.; Wang, L.; Zhong, D. Regulation and Optimization of Air Quantity in a Mine Ventilation Network with Multiple Fans. Arch. Min. Sci. 2022, 67, 179–193. [Google Scholar] [CrossRef]
  36. Wang, Q.; Fang, W.; de Richter, R.; Peng, C.; Ming, T. Effect of Moving Vehicles on Pollutant Dispersion in Street Canyon by Using Dynamic Mesh Updating Method. J. Wind. Eng. Ind. Aerodyn. 2019, 187, 15–25. [Google Scholar] [CrossRef]
  37. Chen, Z.; Zhao, S.; Dong, C.; Wang, S.; Guo, Y.; Gao, X.; Sun, B.; Chen, W.; Guo, C. Three-Stage Numerical Simulation of Tunnel Blasting Dust Diffusion Based on Field Monitoring and CFD. Tunn. Undergr. Space Technol. 2024, 150, 105830. [Google Scholar] [CrossRef]
  38. Zhang, X.; Zhang, Y.; Tang, J.; Cui, Z.; Li, Y.; Zhou, H.; Zhang, G.; Yang, J. Optical Technology for Detecting the Decomposition Products of SF6: A Review. Opt. Eng. 2018, 57, 110901. [Google Scholar] [CrossRef]
  39. Huang, W.; Wang, W.; Chen, C.; Li, Y.; Wang, Z.; Li, Q.; Li, M.; Hou, K. Real-Time Monitoring Traces of SF6 in near-Source Ambient Air by Ion Mobility Spectrometry. Int. J. Environ. Anal. Chem. 2019, 99, 868–877. [Google Scholar] [CrossRef]
  40. Yang, B.; Yao, H.; Wang, F. A Review of Ventilation and Environmental Control of Underground Spaces. Energies 2022, 15, 409. [Google Scholar] [CrossRef]
  41. Diego, I.; Torno, S.; Toraño, J.; Menéndez, M.; Gent, M. A Practical Use of CFD for Ventilation of Underground Works. Tunn. Undergr. Space Technol. 2011, 26, 189–200. [Google Scholar] [CrossRef]
  42. Guo, J.; Li, A.; Zhang, C.; Li, J.; Che, J.; Xiong, J.; Jiao, X. Modeling Effective Heat Transfer and Ventilation in Deeply Buried Underground Tunnels. Int. J. Therm. Sci. 2023, 184, 107949. [Google Scholar] [CrossRef]
  43. Zhao, J.; Dong, J.; Gao, H.; Wang, Z.; Na, Y.; Jiang, C.; Liu, J. Study on Airflow Characteristics of Underground Transportation Buildings with Sunken Squares Using Particle Image Velocimetry Experiments in a Wind Tunnel. Build. Environ. 2023, 242, 110469. [Google Scholar] [CrossRef]
  44. Zhao, C.; Wu, B.; Wang, J.; Cao, H. Calculation Method of Roadway Ventilation Resistance Based on Fractal Characterization of Wall Roughness. Phys. Fluids 2025, 37, 035137. [Google Scholar] [CrossRef]
  45. Wang, Y.; Guo, M.; Vo Thanh, H.; Zhang, H.; Liu, X.; Zheng, Q.; Zhang, X.; Daoud, M.S.; Abualigah, L. Advanced Machine Learning Schemes for Prediction CO2 Flux Based Experimental Approach in Underground Coal Fire Areas. J. Adv. Res. 2024, 70, 587–601. [Google Scholar] [CrossRef] [PubMed]
  46. Widiatmojo, A.; Sasaki, K.; Widodo, N.P.; Sugai, Y.; Sahzabi, A.Y.; Nguele, R. Predicting Gas Dispersion in Large Scale Underground Ventilation: A Particle Tracking Approach. Build. Environ. 2016, 95, 171–181. [Google Scholar] [CrossRef]
  47. Zhang, H.; Wang, P.; Rahimi, M.; Vo Thanh, H.; Wang, Y.; Dai, Z.; Zheng, Q.; Cao, Y. Catalyzing Net-Zero Carbon Strategies: Enhancing CO2 Flux Prediction from Underground Coal Fires Using Optimized Machine Learning Models. J. Clean. Prod. 2024, 441, 141043. [Google Scholar] [CrossRef]
  48. Zhang, H.; Thanh, H.V.; Rahimi, M.; Al-Mudhafar, W.J.; Tangparitkul, S.; Zhang, T.; Dai, Z.; Ashraf, U. Improving Predictions of Shale Wettability Using Advanced Machine Learning Techniques and Nature-Inspired Methods: Implications for Carbon Capture Utilization and Storage. Sci. Total Environ. 2023, 877, 162944. [Google Scholar] [CrossRef]
Figure 1. Tracer gas identification element.
Processes 13 02214 g001
Figure 2. Schematic figure of concentration distribution between adjacent nodes.
Processes 13 02214 g002
Figure 3. Schematic figure of continuous tracer gas release apparatus.
Processes 13 02214 g003
Figure 4. Tracer gas release locations.
Processes 13 02214 g004
Figure 5. Bruel & Kiaer 1302 multi-functional SF6 detector.
Processes 13 02214 g005
Figure 6. Monitoring point location.
Processes 13 02214 g006
Figure 7. SF6 tracer gas concentration profile (shows measured concentration-time curves from five release points, with peaks corresponding to: (1) Release Point 5 (6.37 min, single-path flow), (2) Release Point 3 (8.93 min), (3) Release Point 2 (10.98 min), and delayed peaks (40.65–61.65 min) indicating unmodeled leakage/recirculation).
Processes 13 02214 g007
Figure 8. Comparison of simulated and measured tracer gas concentrations at the monitoring station (compares initial model predictions with field data, highlighting deviations: Class A (ΔT ≤ 1.5 min, e.g., Release Point 5), Class B (1.5–4 min, velocity anomalies), and Class C (ΔT > 4 min, recirculation vortices)).
Processes 13 02214 g008
Figure 9. Data selection. (a) Comparison of simulation and measurement data; (b) distribution of difference scores (shows improved alignment after applying wind speed correction factor (v) and dispersion coefficient (k), with >95% accuracy).
Processes 13 02214 g009
Figure 10. Pathway decomposition and deviation classification (multi-path airflow decomposition (e.g., Release Points 1–4 have 8–12 branches) and deviation patterns (Classes A–C)).
Processes 13 02214 g010
Table 1. Underground release details.
PositionTimeVolume/mL
110:0820,265
209:5621,098
309:5317,657
410:2019,641
509:5018,841
Table 2. Monitoring data.
Recorded TimeConcentration (ppm)Elapsed Time (min)
09:50:160.000.27
09:51:170.021.28
09:52:180.022.30
09:53:190.033.32
09:54:200.044.33
09:55:210.075.35
09:56:221.086.37
Table 3. Pathways.
Table 3. Pathways.
Release Point No.Number of Airway Branches
18
212
312
44
51
Table 4. No. 1 Release Point.
Airway No.Release TimeAirway Length
(m)
Airflow Speed
(m/s)
Time
(min)
110:0832861.63 33.5
210:0832811.62 33.7
310:0833412.04 27.3
410:0833362.03 27.4
510:0821271.58 22.5
610:0821221.56 22.6
710:0820591.78 19.3
810:0820631.77 19.4
Table 5. No. 2 Release Point.
Airway No.Release TimeAirway Length
(m)
Airflow Speed
(m/s)
Time
(min)
109:5618722.86 10.9
209:5618682.86 10.9
309:5617602.08 14.1
409:5617562.08 14.1
509:5618223.13 9.7
609:5618183.12 9.7
709:5617102.24 12.7
809:5617142.23 12.8
909:5615123.15 8
1009:5615083.14 8
1109:5614623.69 6.6
1209:5614583.57 6.8
Table 6. No. 3 Release Point.
Airway No.Release TimeAirway Length
(m)
Airflow Speed
(m/s)
Time
(min)
109:5317863.27 9.1
209:5317823.26 9.1
309:5316742.29 12.2
409:5316702.28 12.2
509:5317363.71 7.8
609:5317323.70 7.8
709:5316242.51 10.8
809:5316282.47 11
909:5314263.83 6.2
1009:5314223.82 6.2
1109:5313764.78 4.8
1209:5313724.67 4.9
Table 7. No. 4 Release Point.
Airway No.Release TimeAirway Length
(m)
Airflow Speed
(m/s)
Time
(min)
110:2013684.96 4.6
210:2013634.94 4.6
310:2012512.71 7.7
410:2012562.72 7.7
Table 8. No. 5 Release Point.
Airway No.Release TimeAirway Length
(m)
Airflow Speed
(m/s)
Time
(min)
109:506328.10 1.3
Table 9. Dispersion adjustment coefficient.
Release Point12345
k2.401.101.05 4.001.10
Disclaimer/Publisher’s Note: The statements, opinions and data contained in all publications are solely those of the individual author(s) and contributor(s) and not of MDPI and/or the editor(s). MDPI and/or the editor(s) disclaim responsibility for any injury to people or property resulting from any ideas, methods, instructions or products referred to in the content.

