1. Introduction
The depletion of conventional oil reservoirs necessitates a greater emphasis on developing unconventional oil resources to meet the world’s growing energy demands.
Cold Heavy Oil Production with Sand (CHOPS) is a fundamental oil recovery method that has been successfully applied in unconsolidated reservoirs across Saskatchewan and Alberta. During Cold Heavy Oil Production with Sands (CHOPS), a significant amount of the original oil-in-place (OOIP) remains in the reservoir because the recovery factor typically ranges between 5% and 20% [
1,
2,
3,
4]. After CHOPS production, sand production forms high permeable channels known as wormholes [
5,
6,
7]. Wormhole growth patterns in CHOPS reservoirs are influenced by local conditions, including sand failure thresholds, pressure depletion rates, and heterogeneity in pore structure. These factors can lead to either symmetric (radial) or asymmetric (preferential) wormhole development [
8]. Oil production from unconsolidated reservoirs is particularly challenging due to their geological structure, which includes wormhole formation leading to a quick breakthroughs and thicknesses of less than 10 m [
9,
10]. Solvent-based techniques, including Cyclic Solvent Injection (CSI), Vapor Extraction (VAPEX), and Solvent Vapor Extraction (SVX), are popular conventional enhanced oil recovery strategies. Due to early solvent breakthroughs driven by wormholes, the first method, SVX, has been determined to be ineffective as a post-CHOPS recovery procedure. Additionally, VAPEX, a gravity drainage technique, does not apply to unconventional reservoirs due to their shallow pay zones, which cannot provide sufficient driving energy. CSI, on the other hand, has been proven to be beneficial for post-CHOPS reservoirs. The network of created wormholes proves effective in the CSI process by increasing the contact area between the solvent and the crude oil [
11,
12].
Recent experimental and numerical studies have greatly improved the understanding of foamy oil flow during Cyclic Solvent Injection (CSI). Wang et al. conducted an experimental study in which they developed a high-pressure micro-visualization system. They demonstrated that foamy oil formation follows a non-equilibrium phase behavior, where gas evolves gradually rather than instantly. Notably, bubble nucleation begins before the bubble point and continues well below it, leading to the formation of a stable dispersion of gas bubbles within the oil. The delayed gas exsolution phase enhances oil mobility and mitigates early gas breakthrough [
13]. Complementing this, Jia et al. performed numerical simulations that successfully replicated the multi-wave behavior of foamy oil during CSI. Their model included short-term gas dissolution, bubble formation, and viscosity alterations, effectively capturing intermittent oil surges caused by local instability in the transition zone between the solvent and heavy oil. The modeling results replicated the multi-wave characteristics of foamy oil flow, aligning with the incremental improvements in oil and gas output noted during CSI studies. This wave-like behavior reflects the dynamic shift in equilibrium conditions across the transition zone as pressure depletes. Their sensitivity analysis showed the importance of gas diffusivity, solvent concentration, and phase change rates in increasing recovery performance [
14].
Various studies have conducted experimental and numerical research to investigate the parameters affecting the CSI process, with focus on the kind of solvent being one of the primary factors considered. The effects of carbon dioxide (CO
2), propane (C
3H
8), and methane (CH
4) on reducing oil viscosity and increasing the oil recovery factor in heavy oil production have been the subject of several experimental investigations. Luo et al. investigated the effects of CO
2 and a combination of 19% C
3H
8 and 81% CO
2 on core flooding, finding that adding propane to CO
2 increased oil swelling and, consequently, the recovery factor [
15]. Arash Ahadi and Farshid Torabi conducted another experimental study investigating the effect of light hydrocarbons on CO
2 Cyclic Solvent Injection (CSI) for heavy oil. The performances of pure CO
2, a CH
4-CO
2 mixture, and a C
3H
8-CO
2 mixture were all compared. The findings demonstrated that higher recovery factors were achieved with a lower methane concentration in the CH
4-CO
2 mixture and a greater propane concentration in the C
3H
8-CO
2 mixture [
16]. Moreover, there is a controversial discussion regarding the impact of N
2 on both oil recovery efficiency and CO
2 storage. Lin et al. conducted an experimental study using a 1D sandpack model during the CSI process to investigate this effect. Their results showed that incorporating low concentrations of N
2 into pure CO
2 had little impact on the recovery factor. However, exceeding the N
2 content of 17.2% resulted in a substantial decline in oil recovery. This reduction was attributed to the low solubility of N
2 in oil, which also led to a decrease in the overall CO
2 storage capacity due to reduced CO
2 diffusion [
17]. In contrast, Zhang et al. showed that the inclusion of N
2 as an impurity in CO
2 streams can provide considerable benefits under certain conditions. Research on CO
2/N
2 gas mixtures containing a minimum of 50% CO
2 enrichment has demonstrated that N
2 can reduce carbon capture expenses and improve the safety of long-term CO
2 storage. It was found that incorporating the N
2 content could enhance the additional dissolution pits on calcite surfaces and improve water-wettability, which could play a beneficial role in CO
2 sequestration processes [
18].
In addition to the solvent type, the function of pressure depletion rates in the CSI process has been thoroughly investigated. The impact of pressure decline rates on the behavior of foamy oil has been a focus of numerous investigations. Jia et al. presented a novel method for examining the effect of the pressure depletion rate in the Cyclic Solvent Injection (CSI) process. Three steps make up this approach, known as pressure pulsing CSI (pp-CSI): (1) lowering the pressure to start foaming oil, (2) raising the pressure again, and (3) keeping the pressure between the injector and producer at a certain level. According to the findings, the output rate was 4.37 times greater than traditional CSI, and the recovery factor rose by 17% [
19]. Du et al. conducted laboratory tests using a cylindrical sandpack with a mimic wormhole, applying different pressure decline rates during the CSI post-CHOPS process. The results showed that a higher depletion rate led to increased oil production. However, when considering the overall run time, the recovery factor was higher with a slower pressure decline [
20]. Sabeti et al. conducted a visual experimental study using a Hele-Shaw cell to investigate the impact of CO
2 percentage in the solvent and pressure depletion rate on the behavior of foamy oil. According to their findings, the stability and volumetric expansion of foamy oil were enhanced by higher CO
2 concentration and a faster pressure depletion rate, which also facilitated the production of microbubbles [
21].
Regarding the number of cycles, Ivory et al. examined the impact of cyclic solvent injection on heavy oil production. The primary recovery achieved was only 6.8%. They used a mixture of 28% C
3H
8 and 72% CO
2 as the solvent in a post-CHOPS scenario with a long soaking time of at least 62 days. The cumulative recovery factor was 50.4%, with the recovery factor changing from 5% to 11.9% for each cycle [
22]. Likewise, Alshmakhy et al. performed an experimental study to investigate the effects of cyclic CO
2 injection following CHOPS. They found that after a maximum of two cycles, the recovery factor rose to 30% using a sandpack model. Their research indicated that this follow-up procedure could re-energize the reservoir after primary production, thereby allowing for further oil recovery. While parameters such as the number of cycles and pressure depletion rates significantly impact the effectiveness of CSI, the structural characteristics of the reservoir, particularly wormhole configurations, also play a crucial role in determining recovery efficiency [
23]. Du et al. investigated the wormholes’ effect on the CSI process’s performance using three distinct sandpack models. According to their testing results, using a cylinder with a larger wormhole resulted in the CSI procedure performing better. Furthermore, it was noted that the solvent chamber rising phase and the solvent chamber spreading phase were two separate stages of oil production. David and Torabi examined various wormhole configurations in the CSI process, including single-linear, single-branched, and double-branched setups [
24]. They investigated several wormhole configurations in the CSI process, such as single-linear, single-branched, and double-branched settings. A 2D rectangular sandpacked model and a solvent mixture consisting of 15% C
3H
8 and 85% CO
2 were used in their studies. The findings showed that the recovery factor (Rf) rose as the wormhole area expanded by adding a branch or creating a second wormhole. The increased oil–solvent contact area was associated with this improvement [
25]. Zhao and Yang conducted a simulation study to evaluate the impact of wormholes on hybrid steam–solvent injection in post-CHOPS reservoirs. A dual-permeability model was developed to investigate the wormhole network. Their results showed that the presence of wormholes significantly increased solvent injectivity and enabled deeper penetration into the reservoir. This, in turn, enhanced the recovery factor by expanding the solvent–oil contact area and amplifying the oil-swelling effect [
26].
Numerous studies have been conducted on the generation of foamy oil during the Cyclic Solvent Injection (CSI) process; however, the majority of these studies have concentrated on specific factors such as the solvent type, pressure depletion rate, soaking time, system porosity, and surfactant addition. The understanding of how these variables affect the stability and behavior of foamy oil has dramatically increased as a result of these investigations. Nonetheless, a significant gap remains in the interaction between operational parameters and various reservoir geometries, particularly regarding the role of wormhole structures. The effect of wormholes, which are important characteristics created during Cold Heavy Oil Production with Sand (CHOPS), on oil recovery in post-CHOPS reservoirs has been investigated experimentally. These experiments, which focused on the impacts of wormhole existence and geometry on foamy oil formation and recovery factors, frequently used sandpacks to imitate reservoir conditions, and mostly focused on using the symmetric design. Despite these improvements, the literature does not sufficiently explore the interaction between operational factors and wormhole configurations, particularly the relative impacts of symmetrical and asymmetrical wormhole designs.
In this project, the influence of key operational variables on the behavior of foamy oil in systems with different wormhole configurations was investigated. To achieve this, four advanced microfluidic systems incorporating both symmetrical and asymmetrical wormhole networks were designed and constructed. This provides a unique platform to examine how geometry affects the CSI process in post-CHOPS reservoirs. This experimental study aims to bridge the knowledge gap from two essential perspectives: first, by providing macroscopic evaluations of oil recovery under various operational scenarios, and second, by offering microscopic analyses of the mechanisms involved, particularly from a chemical perspective. Additionally, this study addresses a specific challenge: the limited understanding of how complex wormhole structures, especially in asymmetrical designs, interact with operational parameters such as solvent type, pressure depletion rate, and number of cycles, and how these interactions influence foamy oil behavior and recovery efficiency. Therefore, the main objective of this study is to systematically evaluate the combined impact of wormhole geometry and key operational variables on foamy oil formation and oil recovery performance during CO2-based CSI in post-CHOPS reservoirs. This comprehensive approach enhances our understanding of how wormhole structure influences recovery strategies and provides valuable insights into the fundamental mechanisms governing foamy oil flow.
2. Methods
2.1. Materials
A heavy oil sample from Plover Lake, Canada, with an initial viscosity exceeding 100,000 cP, was diluted using kerosene at a 1:5 ratio to achieve a viscosity of 1600 cP at 21 °C. This dilution was primarily intended to reduce the extremely high viscosity of the crude oil, which would otherwise make micromodel saturation impractical. To improve the mobility ratio and enable more efficient displacement and flow visualization within the microfluidic system, the oil was diluted with kerosene. A Brookfield viscometer (Brookfield Engineering Laboratory, Inc., Middleborough, MA, USA) was used to measure the viscosity, continuously mixing and monitoring the diluted heavy oil until the desired viscosity was achieved. The prepared sample was subjected to gas chromatography analysis to determine its composition. The oil sample had a molecular weight of 374 g/mol at 21 °C and a density of 0.974 g/cm
3 [
27].
The solvents used in this study include 100% CO2, a mixture of 70% CO2 + 30% CH4 and 70% CO2 + 30% C3H8 which were purchased from Praxair Canada. According to the part of focus of this study on CO2-based CSI, all solvent systems were designed to retain CO2 as the dominant component. In addition to using pure CO2 (100%) as a reference case, 70/30 CO2–CH4 and CO2–C3H8 mixtures were prepared.
2.2. Experimental Apparatus
A 2D micromodel, providing a transparent porous medium, was used to represent a small-scale model of a 2D reservoir. This system enabled a microscopic investigation of the mechanisms occurring within the model. Additionally, it facilitated the visualization and study of the effects of wormholes on oil production behavior, foamy oil generation, and the mechanism of solvent–oil interactions. In this regard, four microfluidic systems with different wormhole configurations were constructed to investigate the specific role of wormholes. The designs encompassed variations such as branched wormholes, the impact of wormhole length, and configurations featuring one-sided versus two-sided wormholes, with the purpose of creating symmetrical and asymmetrical designs.
Figure 1 illustrates the designed micromodels. In addition, their characteristic details are presented in
Table 1.
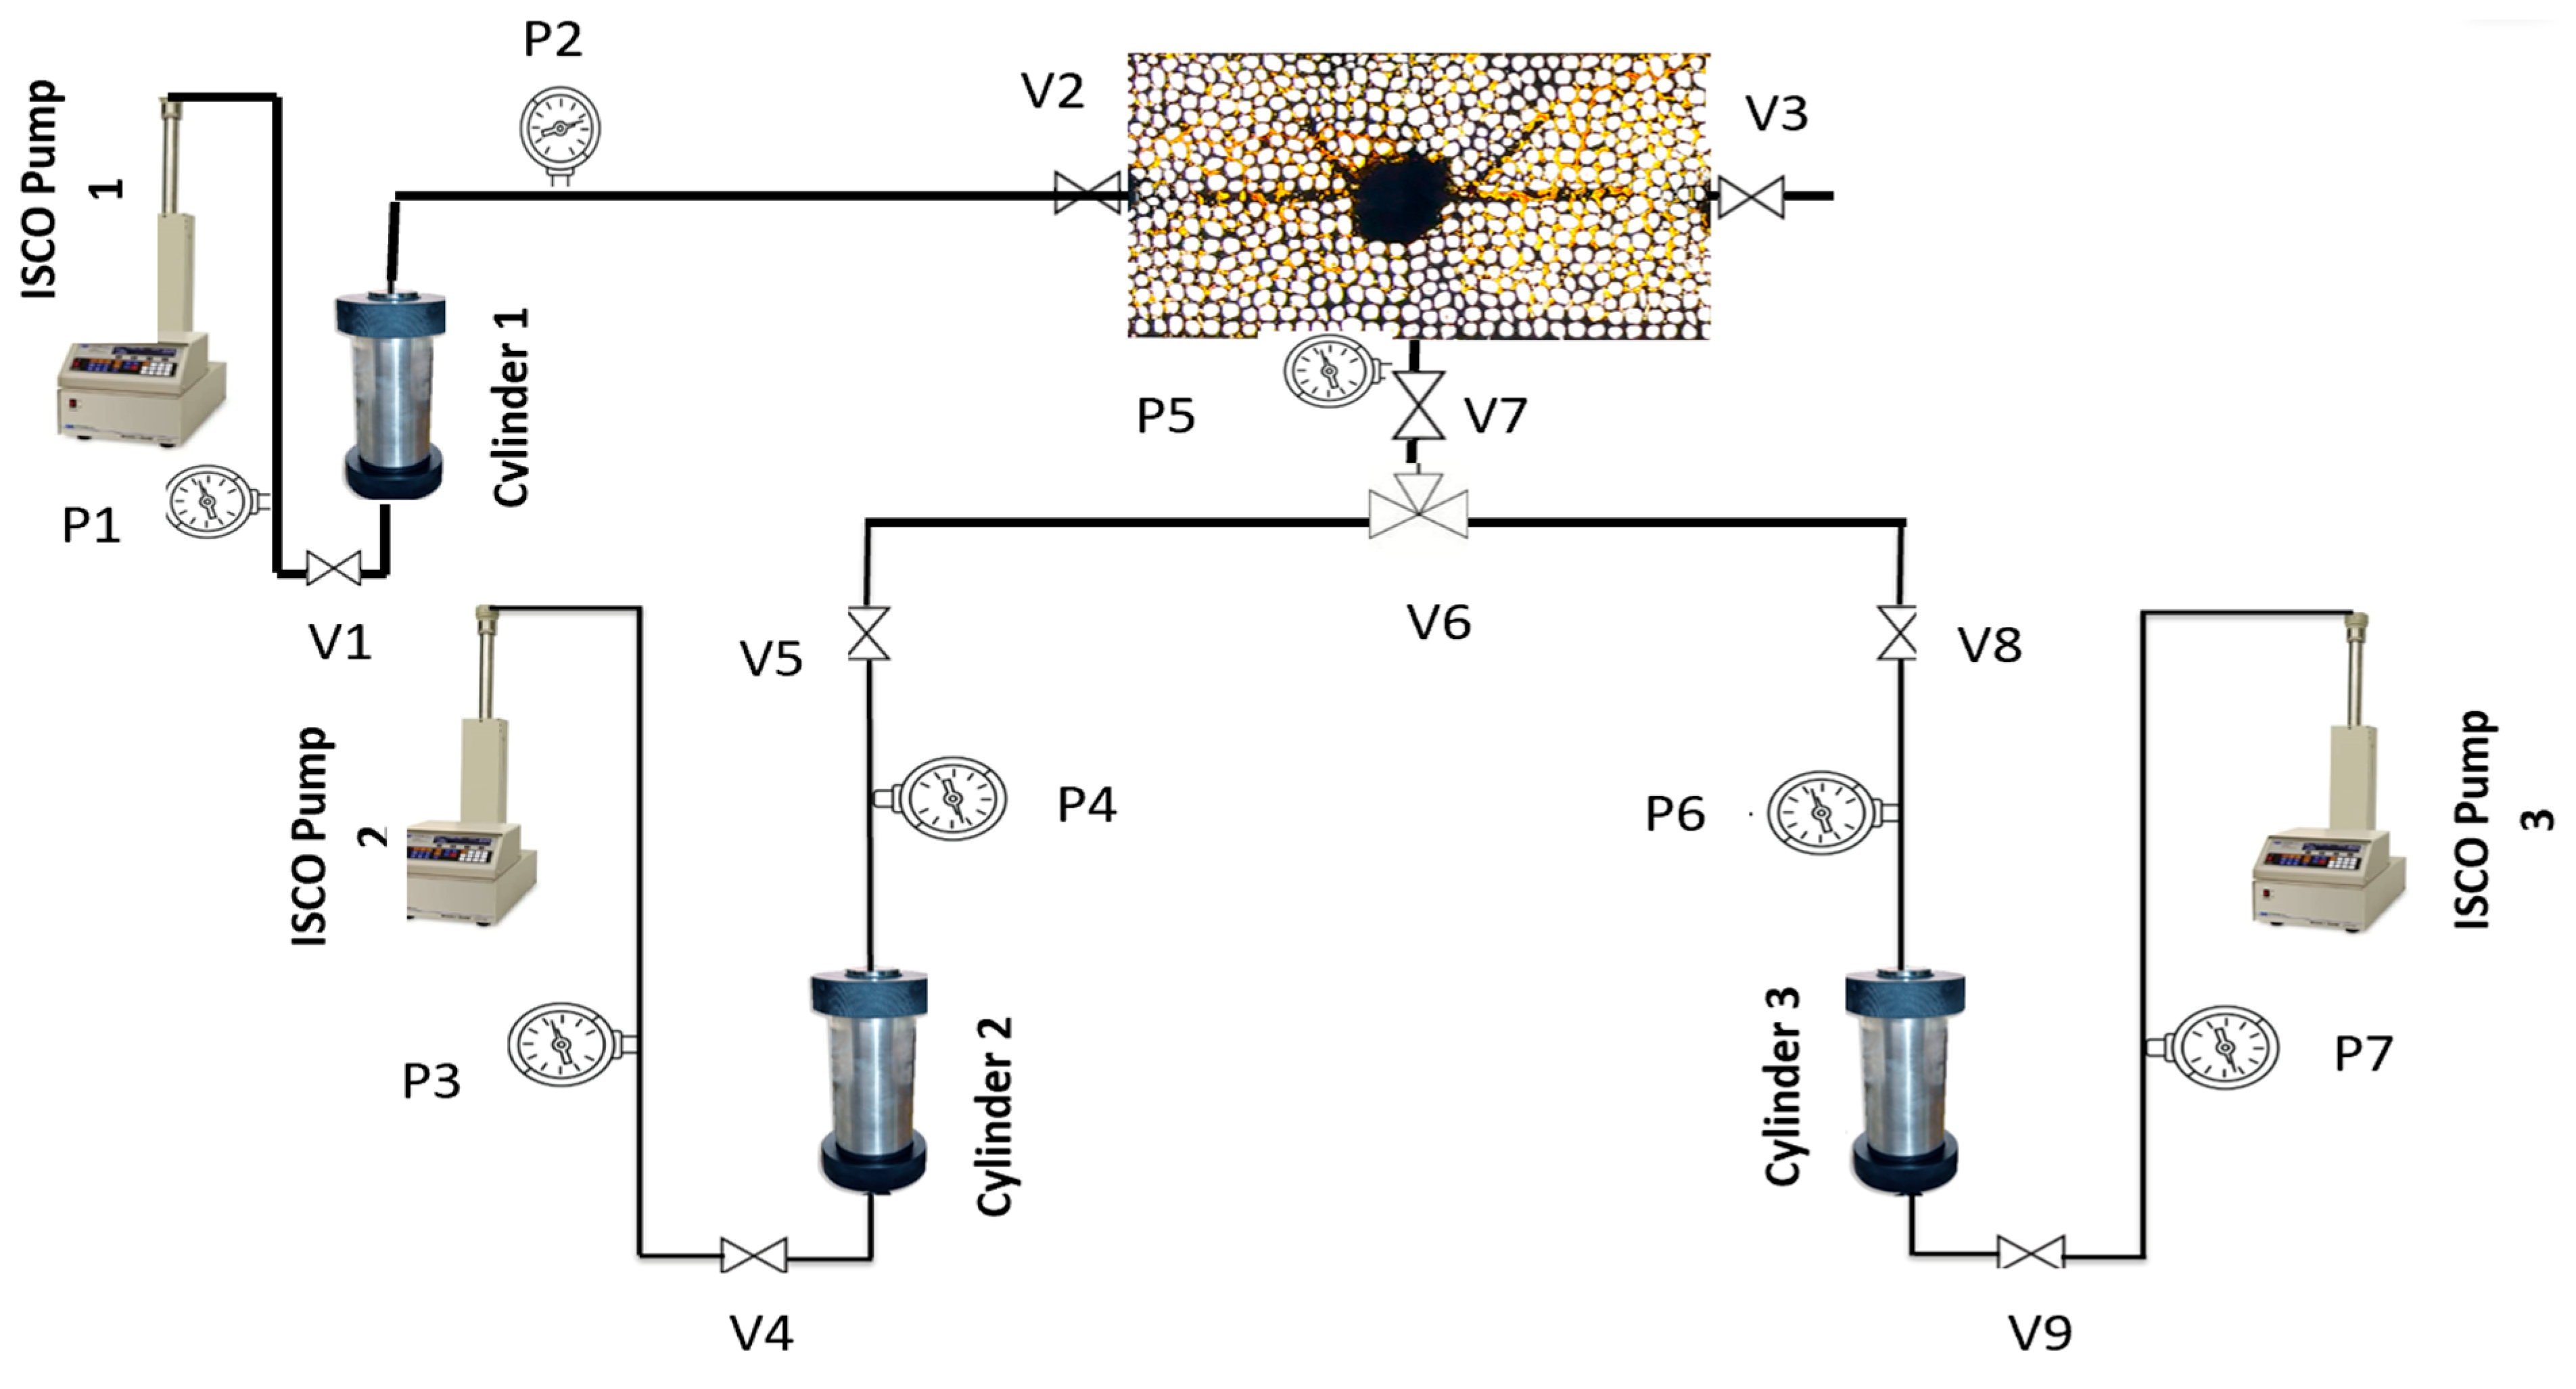
The experimental setup shown in
Figure 2 was utilized to perform the CSI tests.
2.3. Experimental Procedure
Before conducting the CSI test, the microfluidic system was tested for leakage using nitrogen at a pressure of 1200 kPa. After the leakage test, the micromodel was saturated with dead oil using ISCO Pump 1 (500 mL capacity) (Teledyne ISCO Inc., Lincoln, NE, USA), and Cylinder 1 (500 mL capacity). The dead oil was injected at a rate of 0.25 mL/min while valves V2 and V3 were open and valve V7 was closed. The injection continued until the micromodel was thoroughly saturated with oil and valves V2 and V3 were closed. ISCO Pump 2 (500 mL capacity) and Cylinder 2 (1000 mL capacity) were used to inject the solvent. After opening valves V4 and V5, valve V6 was adjusted to link valves V7 and V5. The pump injected the solvent at a rate of 2 mL/min. The P5 pressure gauge was used to monitor the system’s pressure. The injection continued until the pressure gauge read 1200 kPa, at which point it paused. After that, the pump was set to maintain the pressure at 1200 kPa, and the system was left for 24 h for soaking time.
The pressure in Cylinder No. 3 increased to 1200 kPa to prepare the setup, initiating the production process. The pressure gauge P6 was utilized to track the pressure. The system was connected to the production line by opening the V6 valve, which initiated production. After that, the ISCO pump was programmed to lower the pressure at a steady depletion rate. The applied depletion rates used in this investigation were 4 kPa/min, 8 kPa/min, and 12 kPa/min.
After the first cycle, the following cycles began with solvent injection, followed by the oil production procedure. The pressure in Cylinder No. 3 was again increased to 1200 kPa using the ISCO pump. The system pressure was monitored, and valve V6 was opened to connect to the production line. As in the first cycle, the ISCO pump reduced the pressure at a constant depletion rate to initiate production. The pressure was decreased to 200 kPa. This process was repeated for each subsequent cycle. The design of the micromodel has a significant impact on the number of experimental cycles. Experiments were terminated when the change in recovery factor (RF) between the last two cycles was less than 2%, indicating diminishing incremental recovery. Five cycles were conducted for the basic model without wormholes, whereas models with wormholes required only three cycles due to faster RF stabilization. Additionally, some tests were restricted to a single cycle to highlight the immediate impact of wormhole presence or configuration on oil recovery behavior.
Table 2 presents the 11 CSI experiments, including the detailed conditions of each test.
2.4. GOR Measurement
After the injection step, valve V6 was adjusted to connect with valve V7 and the injection. The pressure of ISCO pump 2 was set to 1200 kPa, and the volume of solvent available for injection from the pump was recorded. All valves along the injection line were checked to ensure they were open. After the soaking period, the volume reading from the ISCO pump was retaken. During the soaking time, some amount of the injected solvent during the injection phase would be dissolved within the oil in the microfluidic system, causing a drop in the pressure of the system. To compensate, the ISCO pump 2 injected the needed amount of solvent to maintain the system’s pressure at 1200 kPa. The difference between the initial and final volume readings over the 24 h represents the solvent dissolved in the oil at 1200 kPa. According to the Ideal Gas Law, P1V1 = P2V2, which assumes ideal gas behavior, this relationship was used to determine the changes in volume and pressure during solvent injection. Since the injected gases in this study were at moderate pressure and near-ambient temperatures, where they approximately behave as near-ideal gases, this assumption provides a reasonable and practical estimate of the gas phase behavior in the microfluidic system.
P1 = The initial pressure: 1200 kPa.
V1 = the amount of gas injected to the system to maintain the pressure.
P2 = Pressure of the standard condition: 1 atm.
Therefore, V2 could be calculated, and the gas–oil ratio (GOR) would be obtained by dividing the V2 by the Original Oil in Place (OOIP). For the subsequent cycles, the OOIP would be calculated based on the residual oil saturation after the previous cycle.
2.5. Measurement Techniques
In this study, Python (3.9.15, Python Software Foundation, Wilmington, DE, USA) was employed to analyze the images using modules such as OpenCV (4.7.0.68) for image preprocessing and enhancement, NumPy (1.24.1) for numerical operations, and Matplotlib (3.6.3) for visualization. Initially, denoising techniques, contrast enhancement, and blur reduction were used to enhance image quality. Next, the following actions were taken:
Images were read and converted to grayscale to simplify the analysis.
Pixel intensity thresholding was applied to divide the images into two sections. Due to the differences in brightness and quality, the code employed a variable thresholding technique, resulting in varying intensity values for each photo. In general, pixels with intensity values below 120 were categorized as black, while pixels above 120 were classified as white. The black pixels showed the oil remaining within the system, and the white area represented recovered oil or dispersion bubbles.
The number of white and black pixels in each segmented image was determined through analysis. The area represented by the dispersed phase was measured by the ratio of white pixels to all pixels in each image.
A recovery factor was calculated by comparing the ratio of white pixels before and after solvent injection. The formula for the recovery factor normalized this change by the initial proportion of black pixels.
3. Results and Discussion
This section presents a macroscopic and microscopic investigation of the results from CSI experiments, focusing on parameters such as the number of cycles, solvent types, pressure depletion rate, and wormhole configurations.
3.1. Effect of Solvent Type on CSI Using the Basic Micromodel
This section studies the impact of solvent type on foamy oil using Micromodel 1 as the basic micromodel with no wormholes. Two types of solvents, including a mixture of 70% CO
2 + 30% CH
4 and 100% CO
2, were selected to study their performance and the mechanisms contributing to oil recovery improvement (Tests 1 and 2). The results are compared to evaluate their effectiveness regarding the oil recovery factor and foamy oil flow quality.
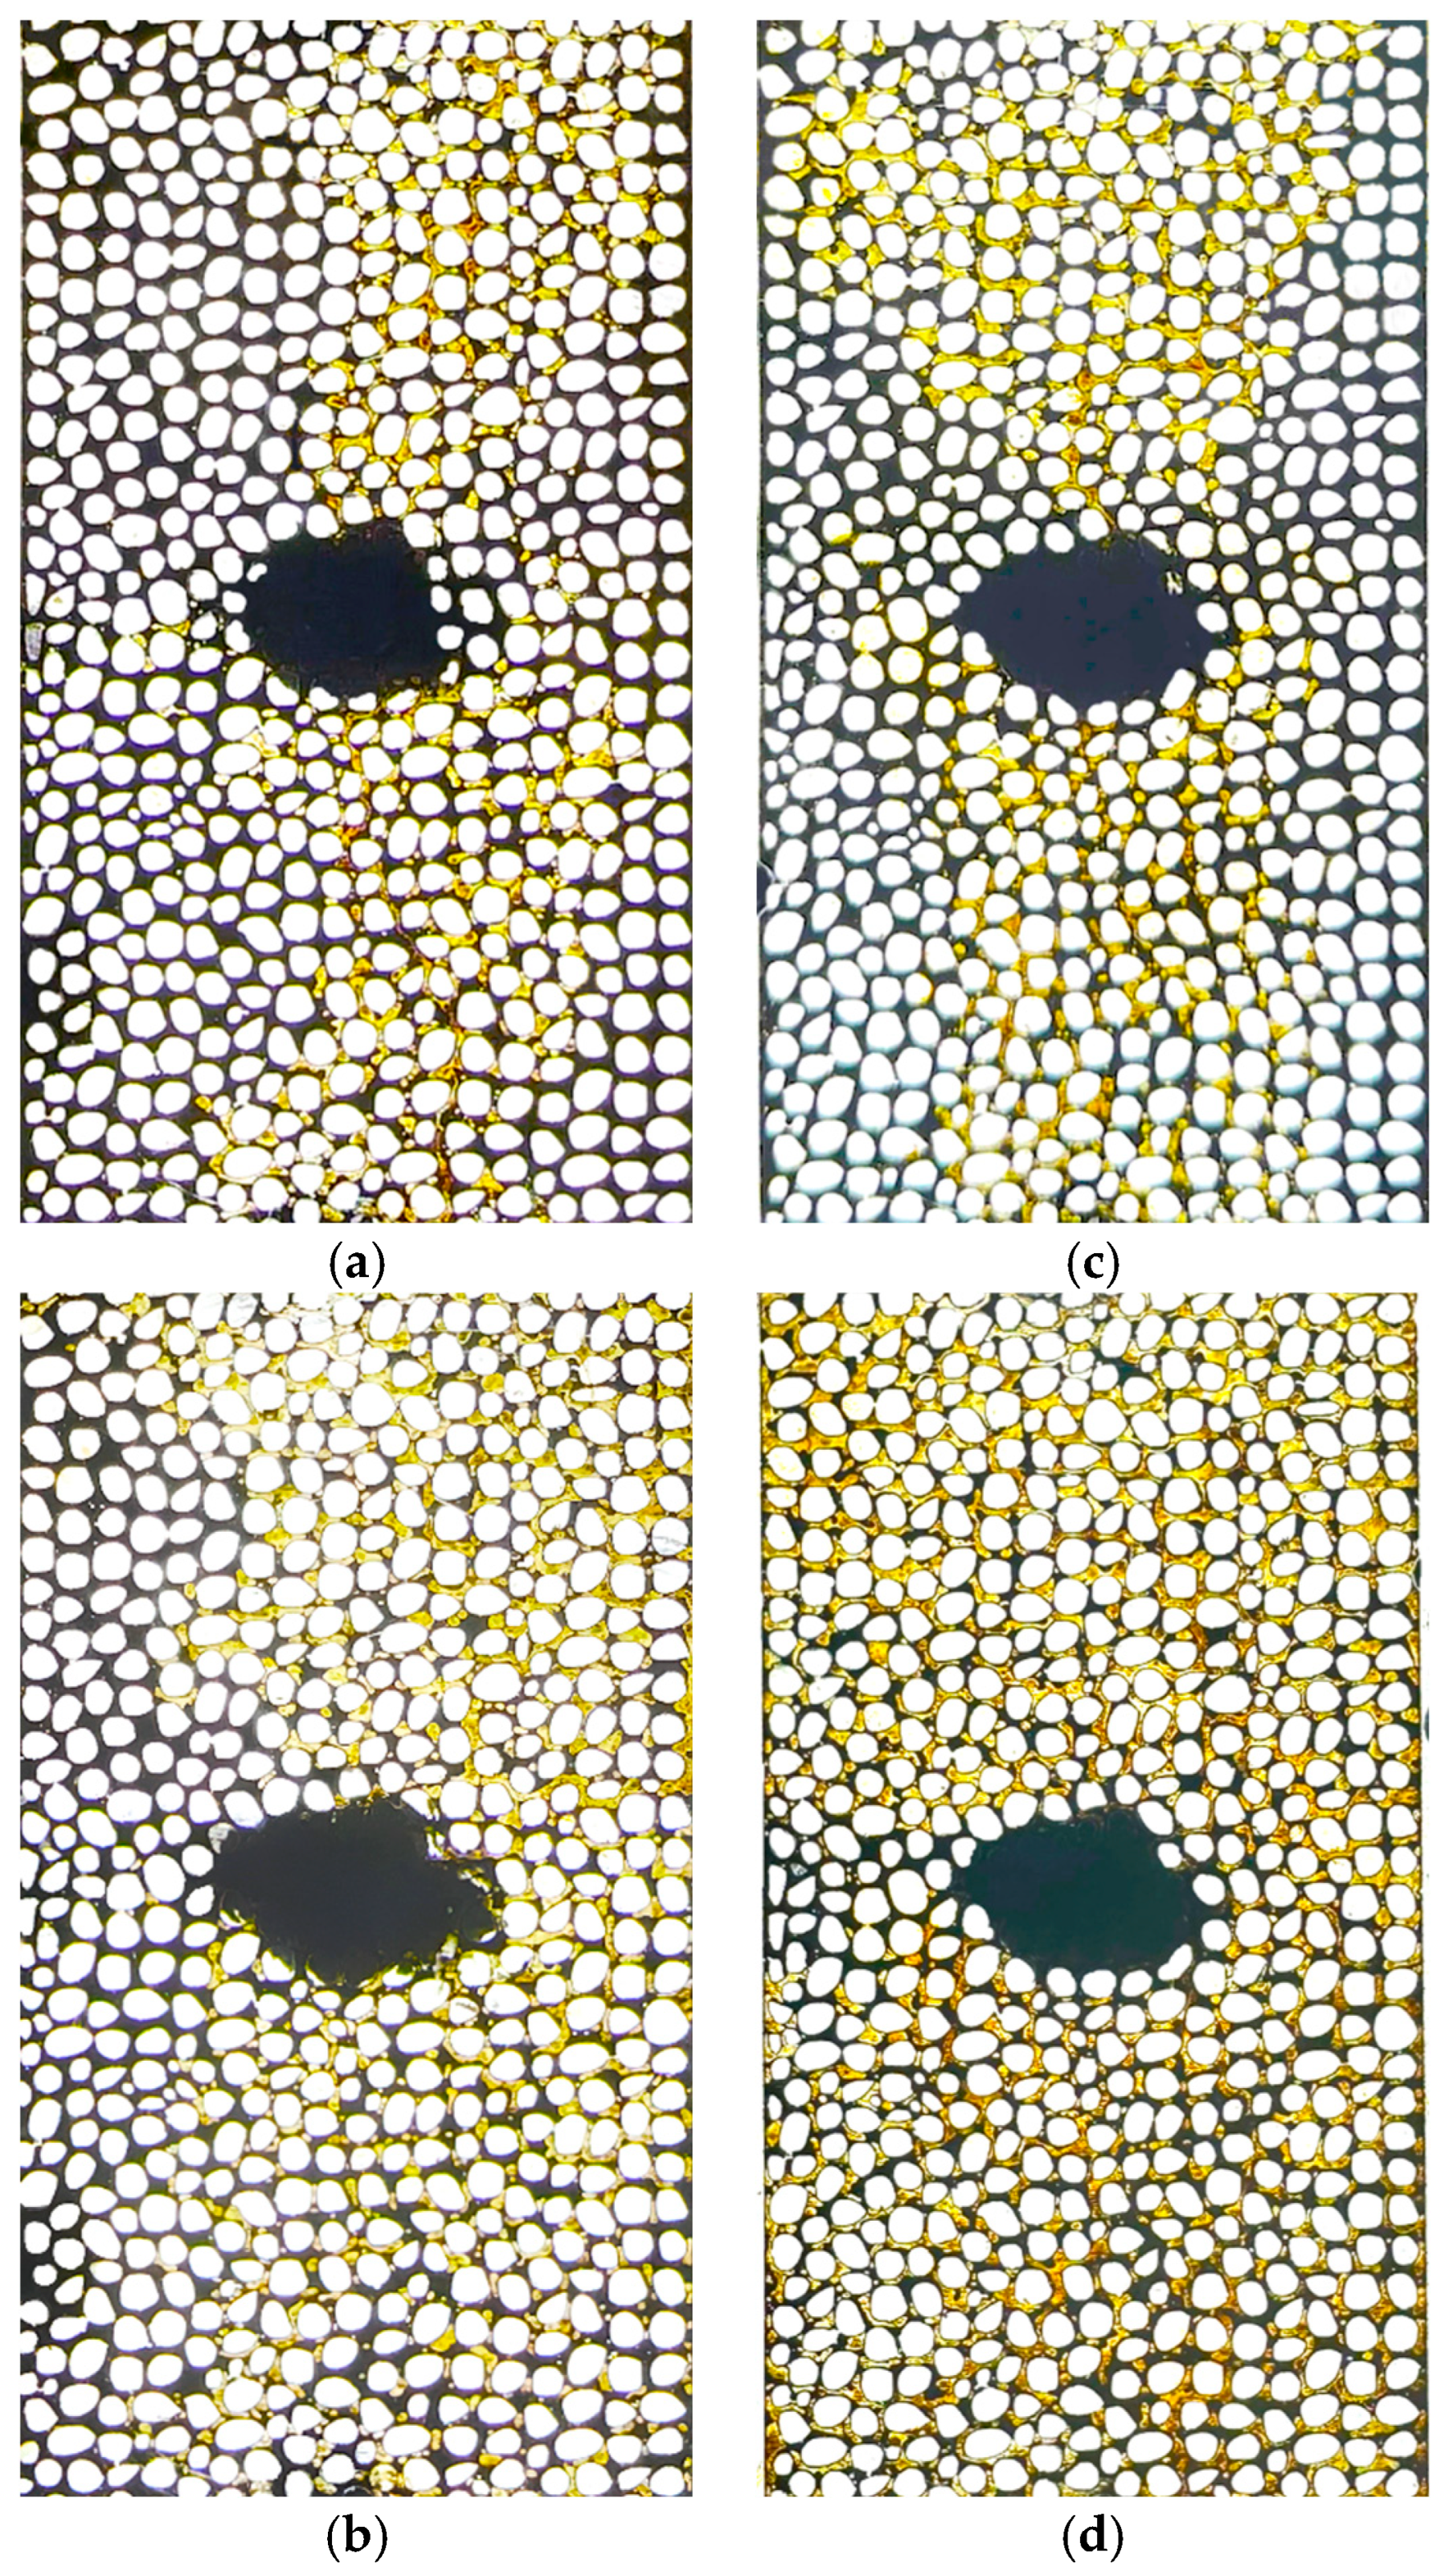
Figure 3 illustrates the effect of Solvents 1 and 2 on oil production after the first and the fifth cycles. It can be observed that the recovery factor was increased by increasing the number of cycles from 1 to 5 in
Figure 3a,b using 70% CO
2 + 30% CH
4 and in
Figure 3c,d using 100% CO
2. Comparing the recovery factor after the first cycle in
Figure 3a,c, it is shown that a higher oil production can be obtained when 100% CO
2 was utilized. Additionally, the visual result presented in
Figure 3d (Test 2) indicates a noticeable increase in oil recovery after the fifth cycle when pure CO
2 was injected, compared to the lower performance observed in Test 1, which used a mixture of solvents (70% CO
2 + 30% CH
4) (
Figure 3c).
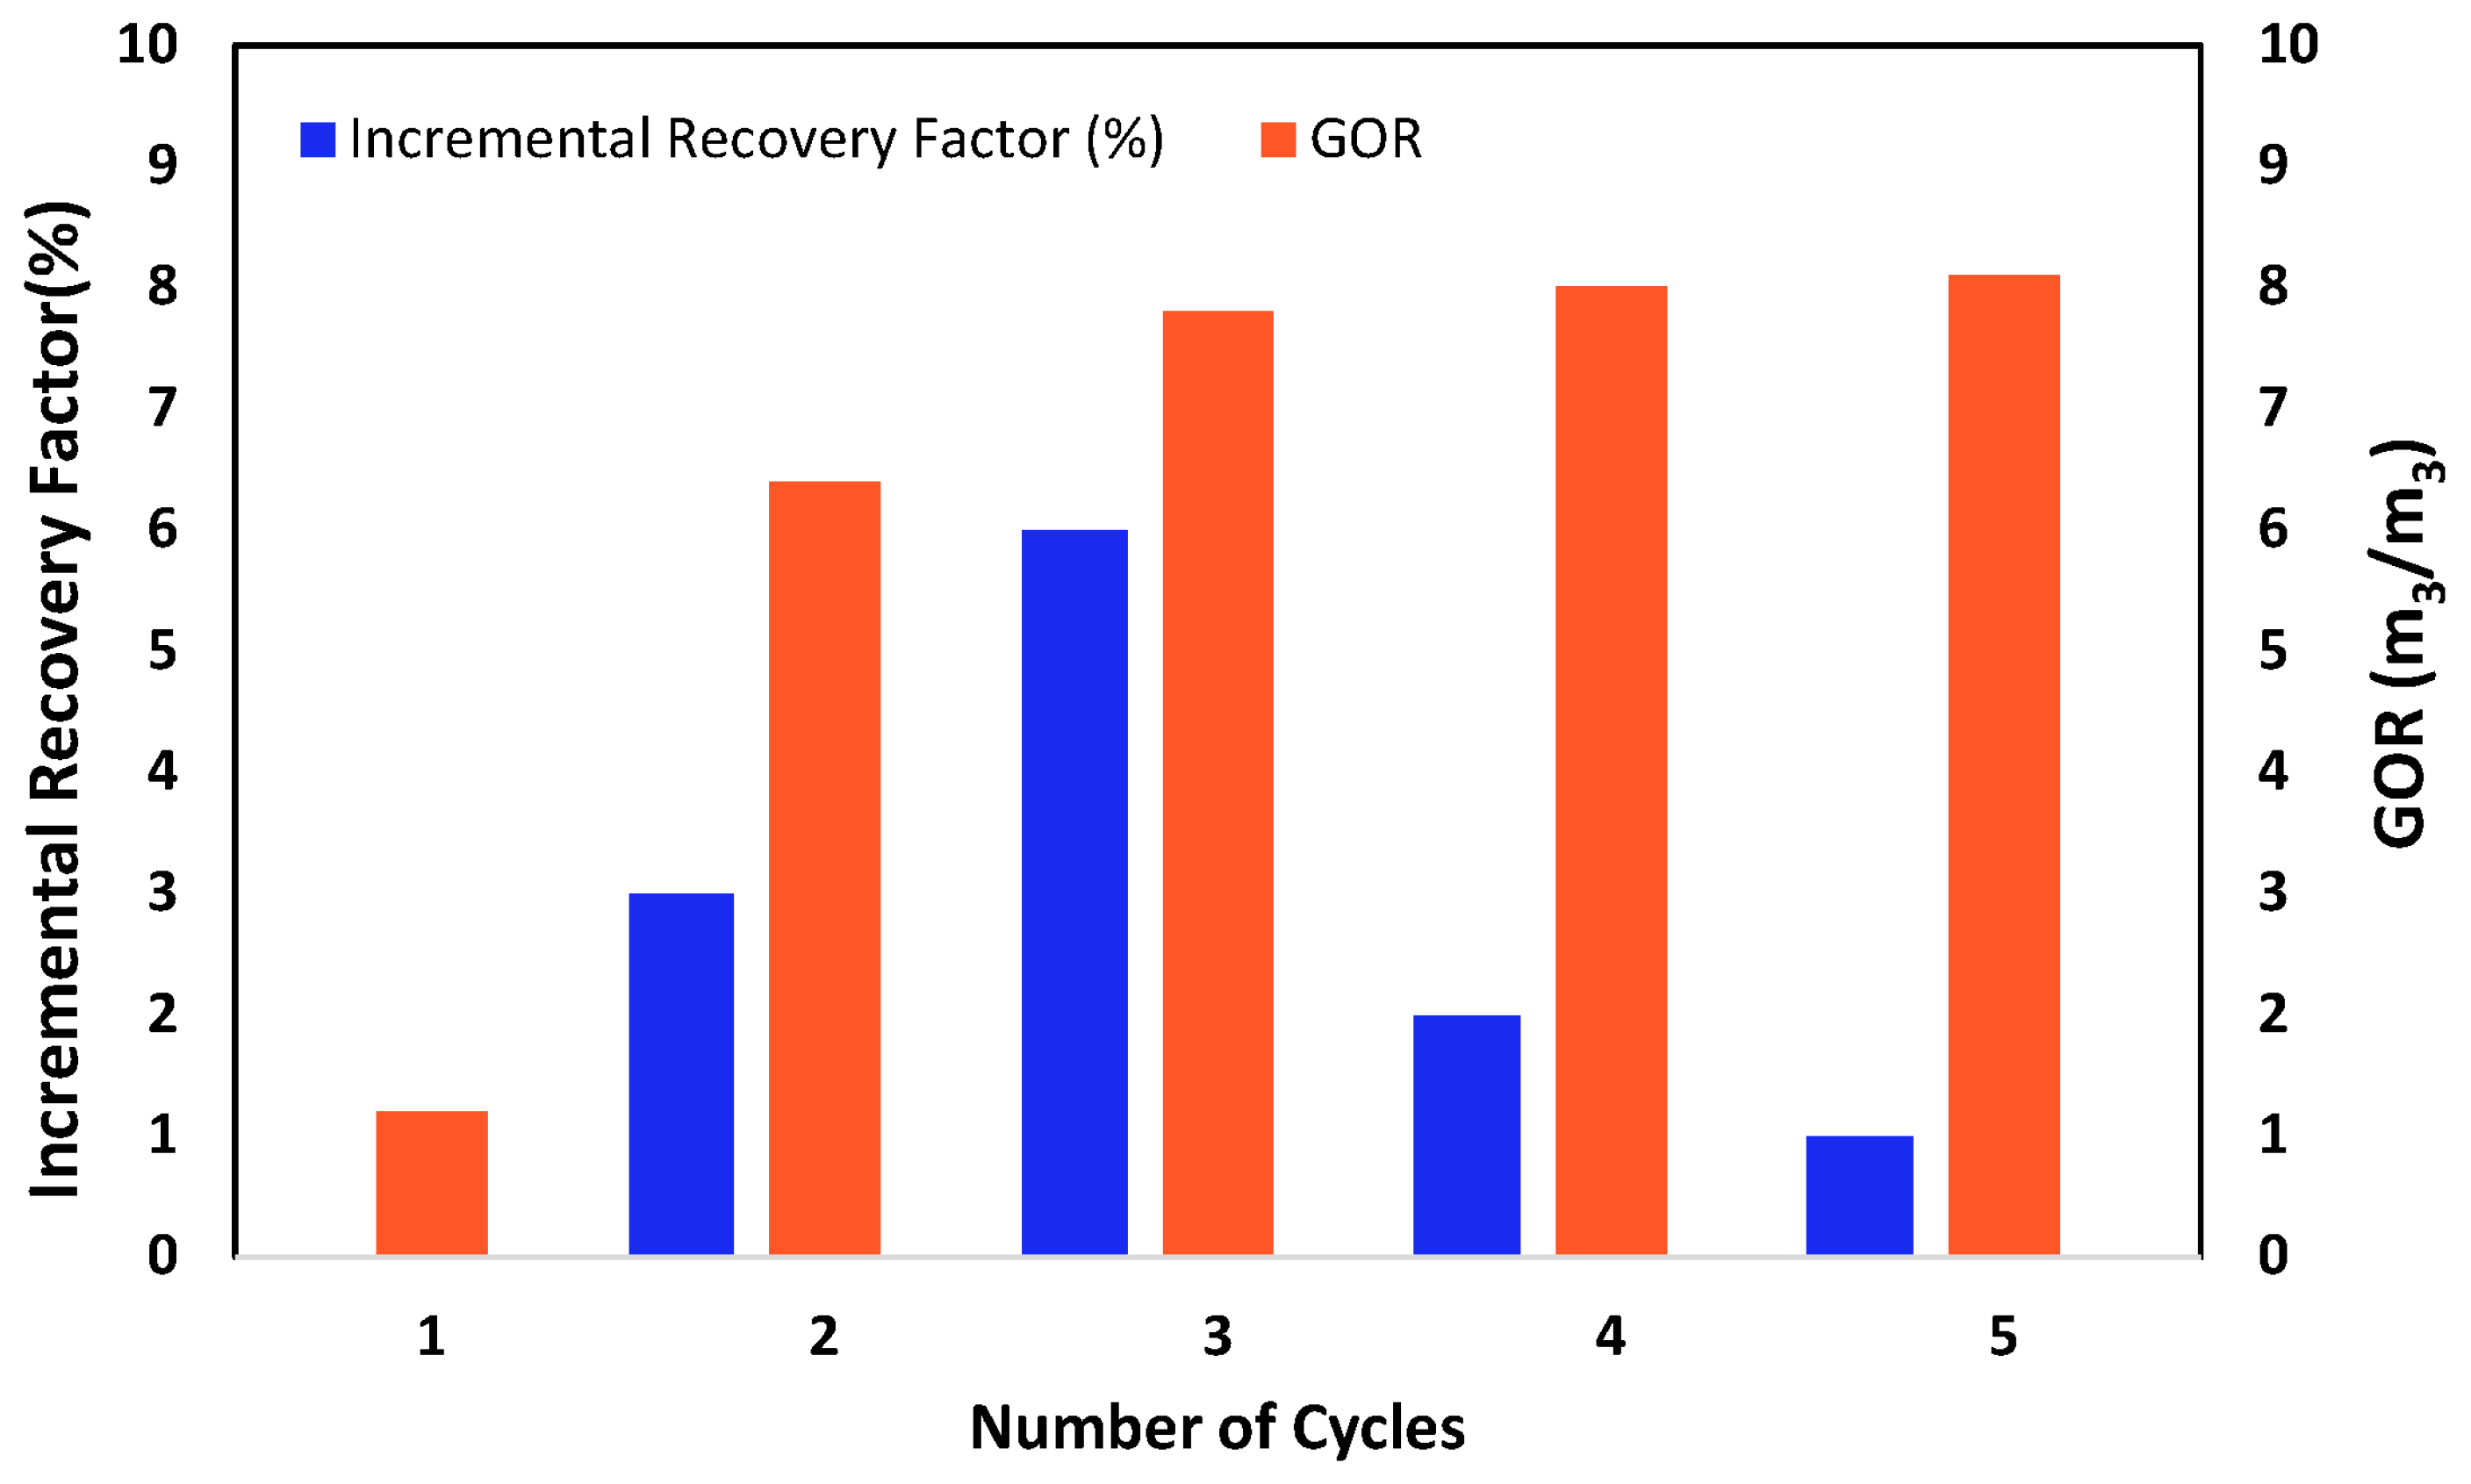
After completing oil production in the first cycle, the microfluidic system was prepared for the next cycle by initiating the solvent injection process for this cycle. During the second cycle, the oil production from the initial phase created additional room within the micromodel. This allowed a larger volume of solvent to be injected throughout the porous medium, resulting in a higher gas–oil ratio (GOR) in the system.
Figure 4 shows the GOR for Test 2 using pure CO
2. Accordingly, the GOR was increased from 1.2 for the first cycle to 6.4 for the second cycle, as shown in
Figure 4. As a matter of fact, a higher amount of gas molecules in the system can substantially enhance the oil and solvent interaction, which in turn can extend the generation of foamy oil flow. The microfluidic system was again allowed to soak for 24 h, allowing the solvent to diffuse into the oil. This soaking time can enhance gas solubility and mass transfer, thereby reducing oil viscosity and improving oil mobilization within the system. The cyclic solvent injection process was continued to conduct the third cycle, which resulted in further improvements in the incremental oil recovery factor compared to the second cycle, improving 6% compared to 3% for the previous cycle (cycle 2). The results highlight the effectiveness of improving the total recovery factor in the CO
2-based CSI method, as each successive cycle could recover additional amounts of residual oil. The experiment proceeded through five complete cycles, each enhancing oil recovery. Although the GOR for the fifth cycle reached its highest amount at 8.1, the incremental recovery factor experienced a declining trend and exhibited no substantial improvement compared to the recovery factor obtained after the fourth cycle, below 1%. It could be due to the bypass area and some of the oil remaining trapped in the small pore-throat zones. This observation suggested that the process had likely reached its maximum recovery efficiency under the specific experimental conditions. Consequently, the experiment was discontinued. This explanation highlights the mechanism by which the recovery factor improves as the number of cycles increases.
The higher effectiveness of pure CO
2 (Solvent 2) compared to the mixture of solvent containing CO
2-CH
4 (Solvent 1) could be discussed from a chemistry perspective in which the fundamental concept of the dissolution of two substances is often summarized by the phrase “like dissolves like”. It means that when two substances have the same polarity or are in the same phase, they can dissolve into each other [
28]. The solvent’s phase conditions are examined in the initial step, considering the experimental pressure and temperature. In this study, the first solvent is a mixture of CH
4 and CO
2. According to the phase diagram of methane, it typically exists as a gas under standard conditions. Still, it can transition into a liquid state at very low temperatures (below −80 degrees Celsius) and very high pressures (greater than 5000 KPa). Therefore, according to this study’s experimental conditions, methane is unlikely to exist in a liquid phase [
29]. The phase diagram for CO
2 indicates that it can transform into a liquid phase under specific temperature and pressure ranges between approximately 56.57 °C and 30.98 °C. At pressures ranging from 517 KPa to 7375 KPa, CO
2 remains a gas under these conditions. Therefore, it appears that the presence of methane as a component in the solvent mixture does not significantly enhance the solubility of the solvent in the oil due to its gaseous state and limited intermolecular interaction [
30]. Furthermore, the dissolution of gases can be analyzed from the perspective of molecular motion. From the chemistry point of view, molecular motion and kinetic energy are higher in gases than in liquids. This high kinetic energy can hinder gas molecules from being captured and dissolved by the liquid. However, the solubility of a gas in a liquid can be improved by increasing the pressure or decreasing the temperature. If the pressure is raised to 1200 kPa, CO
2 remains as a gas, but the molecular motion decreases, making it more comparable to the molecular motion of oil. As a result, CO
2 may be more likely to dissolve into the oil under higher pressure, to some extent. In contrast, the mixture of solvents containing methane has weaker interaction with the oil due to its higher kinetic energy. Consequently, it may be argued that pure CO
2 has higher solubility in the oil. On the other hand, the mixture of solvents containing methane is less effective in enhancing solubility due to the higher kinetic energy of methane, resulting in weaker interactions with the oil. Thus, it may be concluded that pure CO
2 is more soluble in oil than the mixture that includes methane [
31].
In addition to phase behavior, molecular polarity is critical in solvent–oil interactions. Methane is an entirely nonpolar molecule. The primary factor influencing its interactions with other molecules is the weak Van der Waals force. Therefore, methane has minimal interaction with the oil phase, especially with heavy oil that contains significant polar components, such as asphaltenes, which are mostly responsible for the high viscosity of heavy oil [
32,
33]. On the other hand, although carbon dioxide is frequently regarded as a nonpolar molecule, it can still interact to some extent with polar substances. CO
2 can form weak dipole interactions with certain polar oil components, such as asphaltenes. This makes CO
2 more effective than methane in interacting with the polar components of heavy oil, including asphaltene. These interactions may significantly reduce the high viscosity, which is primarily attributed to the presence of asphaltenes in the crude oil. On the other hand, as methane lacks both polarity and strong intermolecular forces, it seems it cannot break down these structures [
34].
Thus, due to these differences in solubility and molecular interactions, it can be concluded that pure CO2 has a greater capacity to reduce oil viscosity compared to Solvent 2. Furthermore, the foamy oil mechanism is likely to occur at a higher level due to its swelling effect, which would increase the oil’s efficiency.
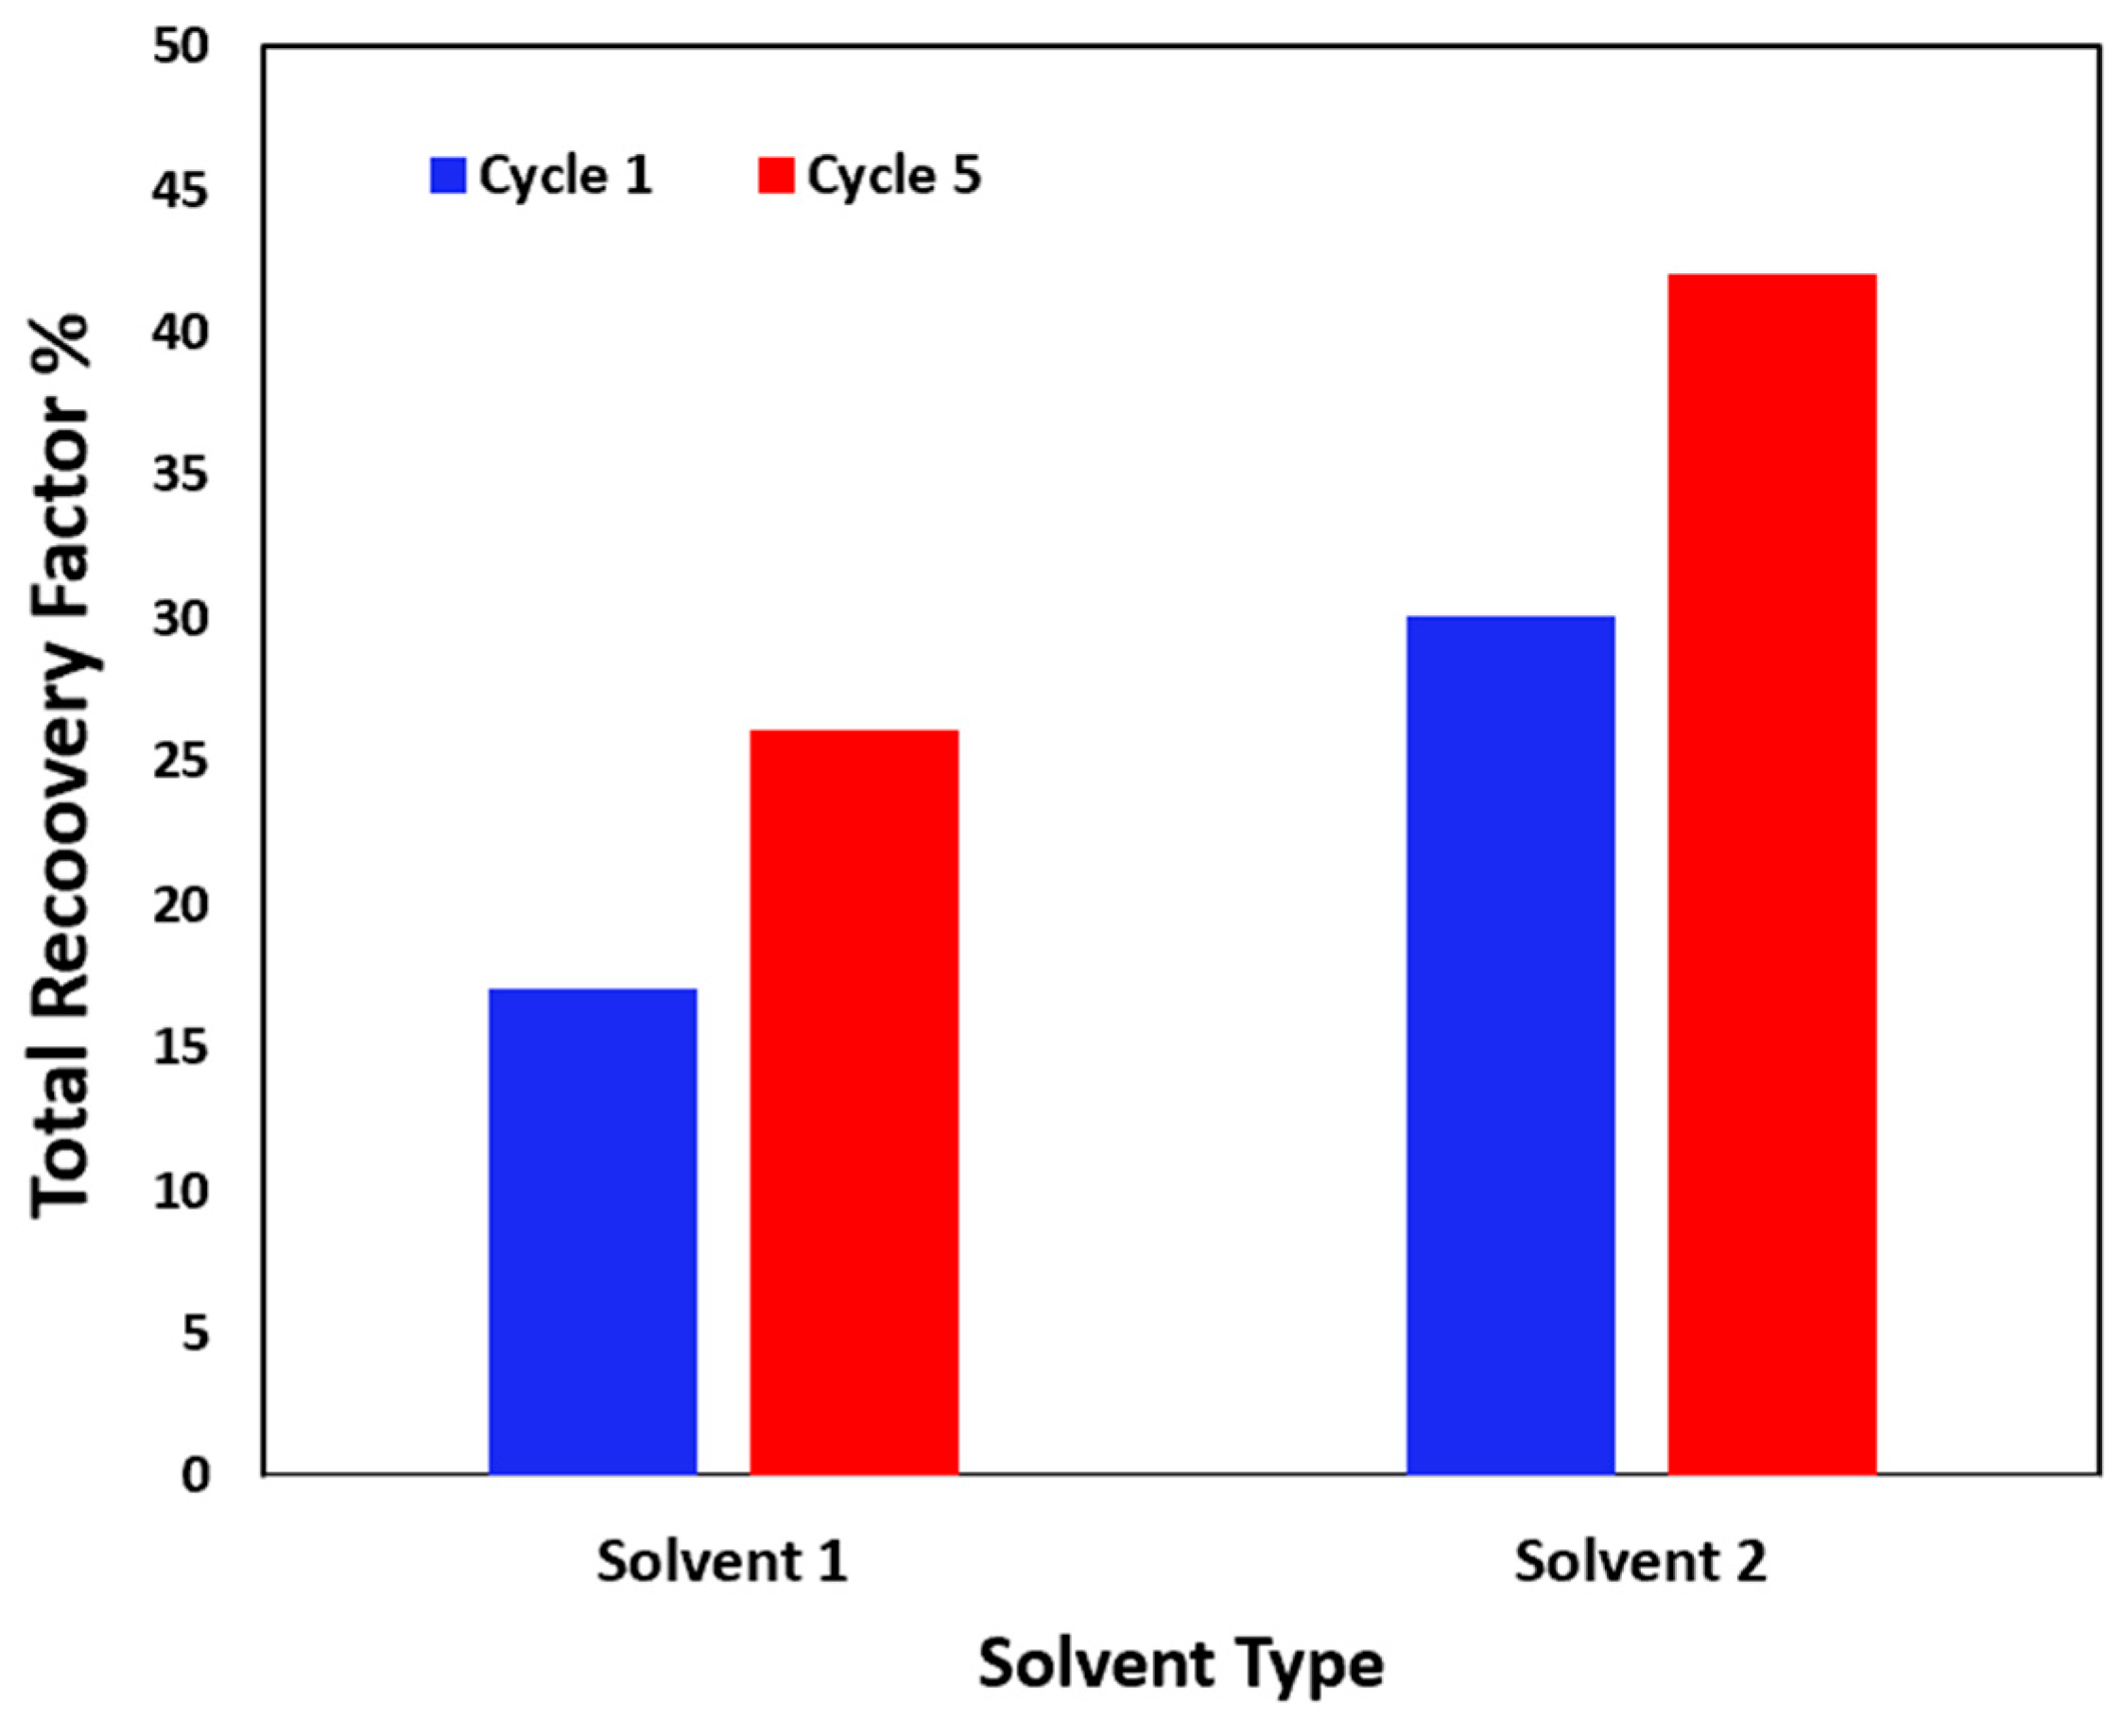
Figure 5 compares the total recovery factor for two solvents after the first and fifth cycles. While the total recovery factor using Solvent 1 after the first cycle is only 17%, it increases to 30% when Solvent 2 is used in the CSI tests. Interestingly, the incremental recovery factor during the CSI experiments shows an increase of 9% for Solvent 1 after the fifth cycle compared to the first cycle. In contrast, this value rises to 18% for Solvent 2, with the recovery factor increasing from 30% to 42%.
The results from the bar chart support the conclusion that pure CO
2 can dissolve more effectively into the oil due to stronger interactions with heavy oil components, resulting in improved recovery over multiple cycles.
Table 3 presents the total recovery factor after each cycle, allowing for the observation of incremental recovery trends across type of solvents.
3.2. Impact of Pressure Depletion Rate on CSI Using Basic Micromodel
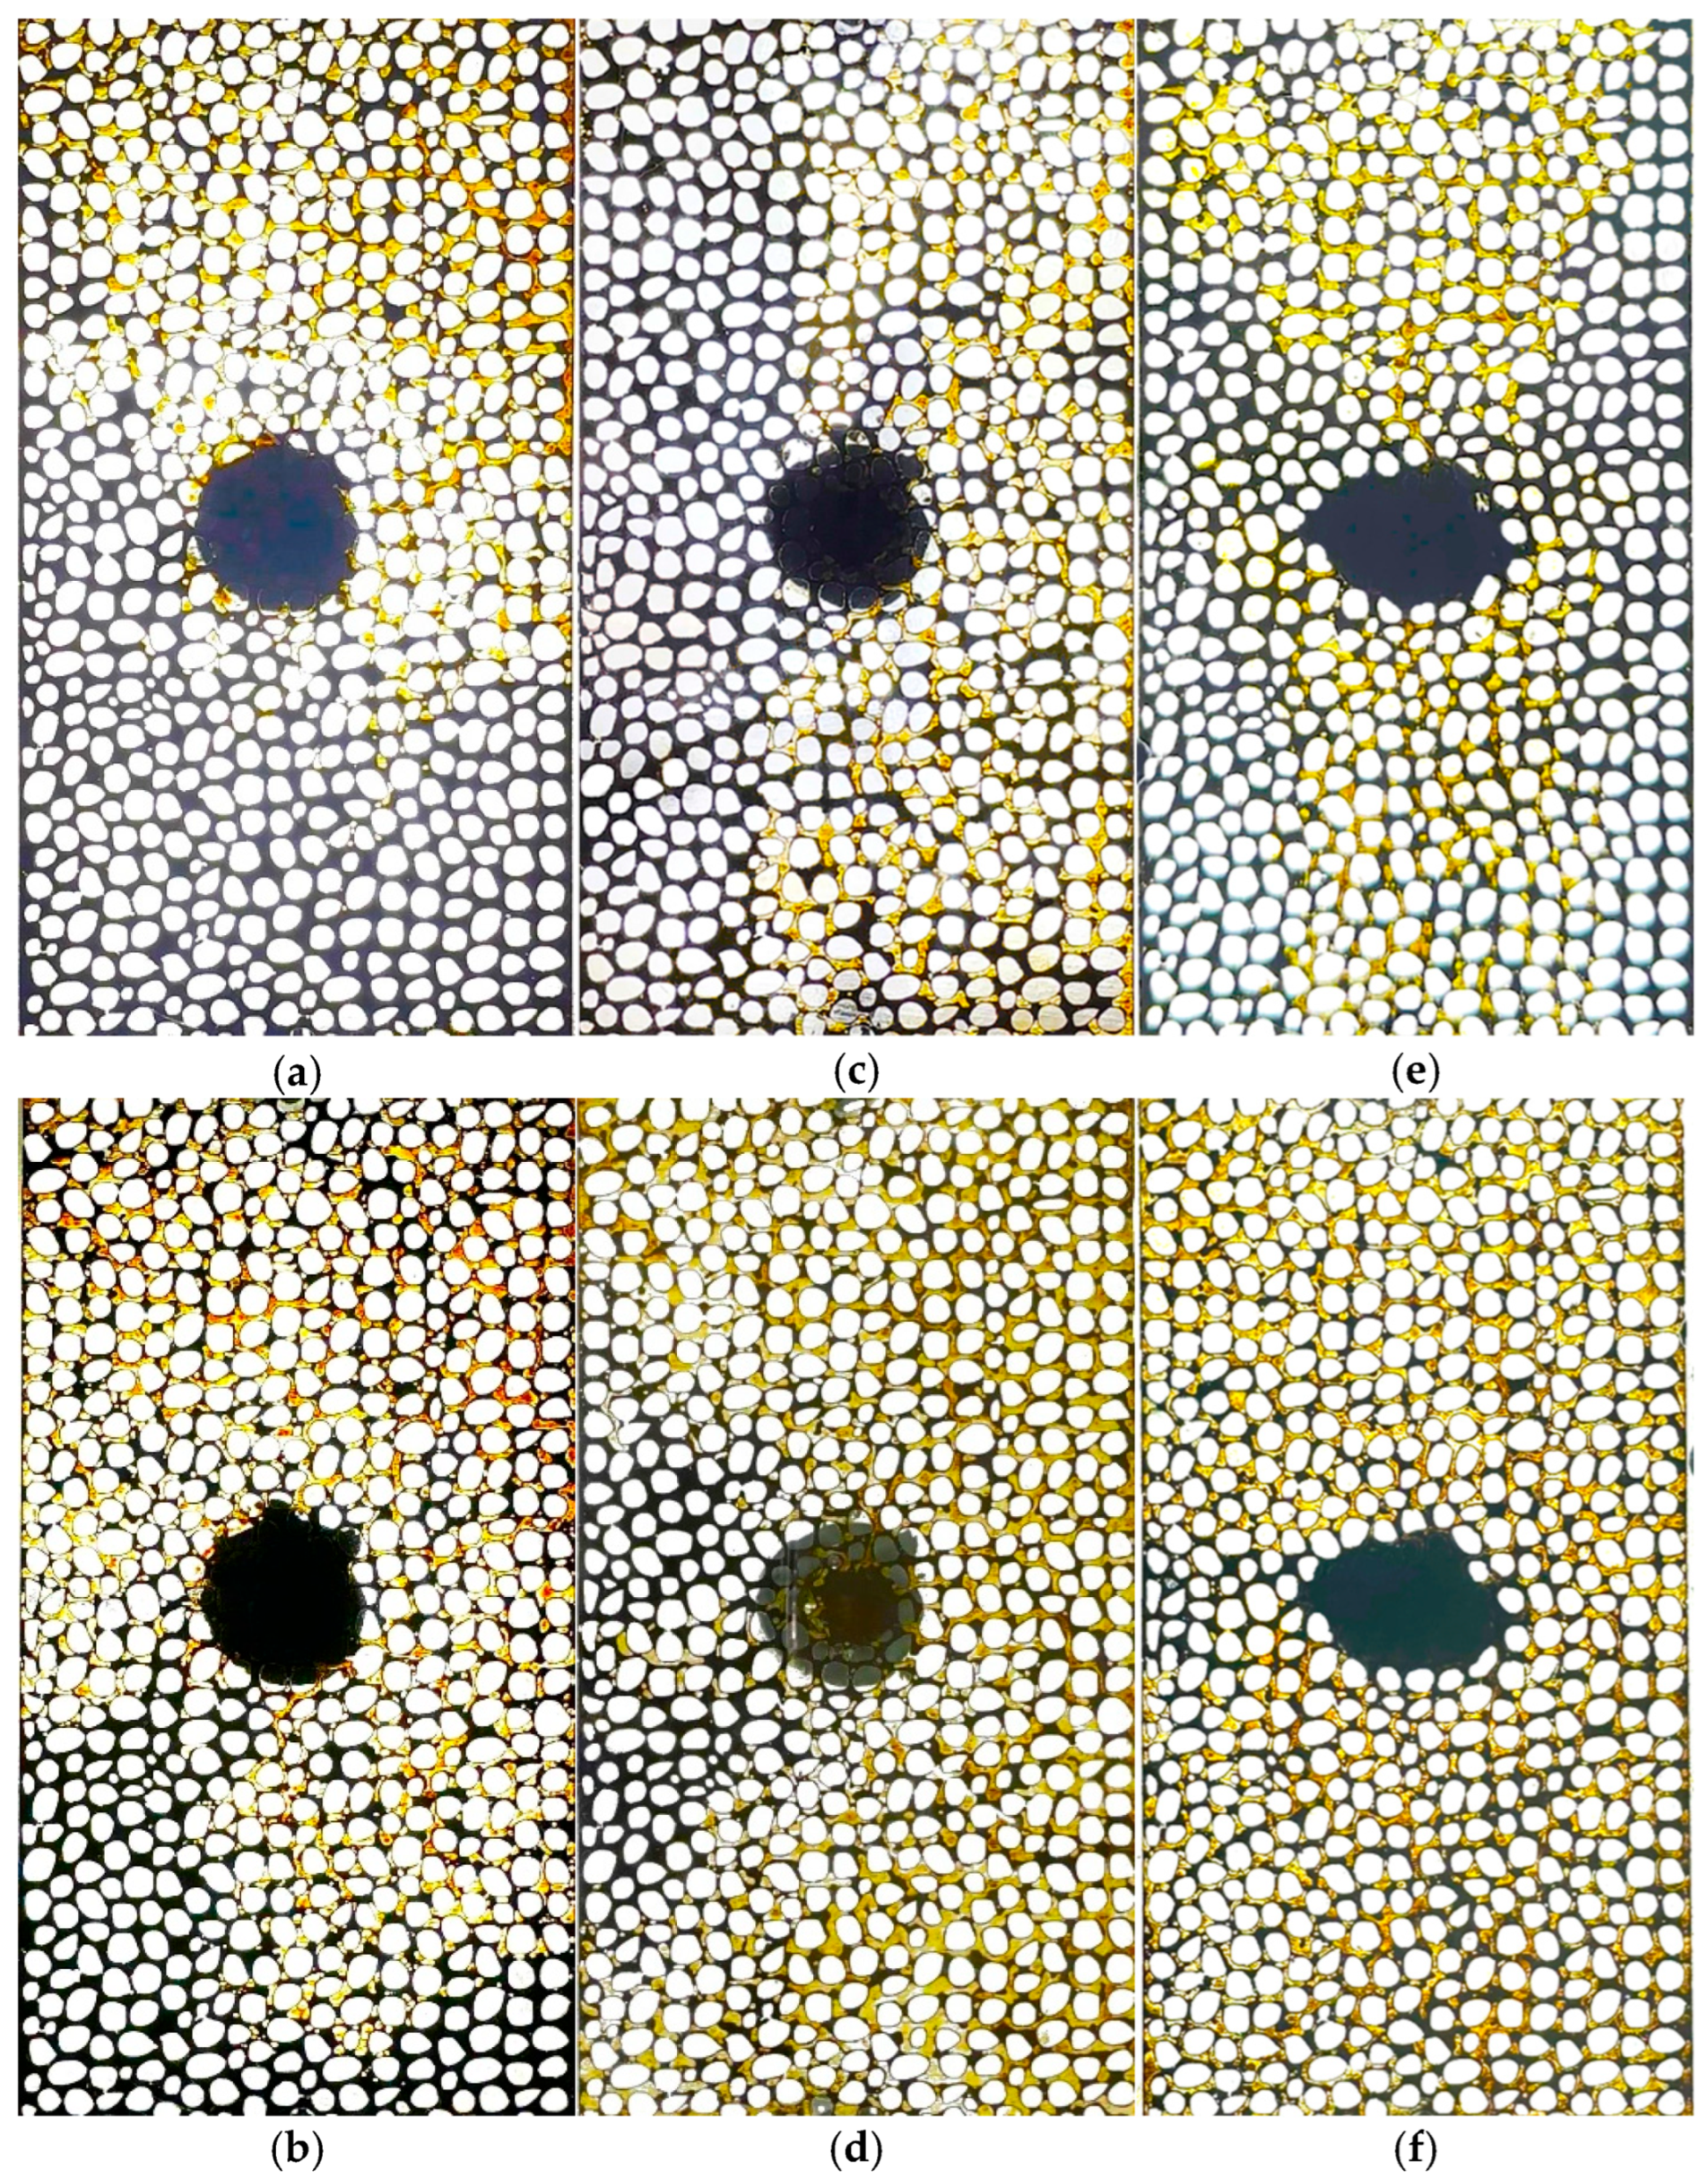
Three tests were conducted to investigate the effect of different pressure depletion rates on foamy oil flow and oil recovery. The basic microfluidic system was utilized for this purpose, applying three distinct pressure depletion rates: 4 kPa/min (
Figure 6a,b), 8 kPa/min (
Figure 6c,d), and 12 kPa/min (
Figure 6e,f), with Tests 3, 4, and 2, respectively. Each test was continued over five cycles. When comparing the recovery factors (RF) following the first cycle, it was found that the test with the lower pressure depletion rate at 4 kPa/min produced a slightly higher amount of oil (
Figure 6a), by 0.5% and 1.5%, compared to the higher pressure depletion rate at 8 kPa/min and 12 kPa/min (Figures
6c and
6e, respectively).
However, when comparing the total recovery factors after the fifth cycle, the higher pressure depletion rate (12 kPa/min) demonstrated better performance in improving oil production, as shown in
Figure 6f. This behavior can be attributed to the initial condition of the oil. As mentioned in the Materials section, the dead oil used in this study did not contain gas. Moreover, for the first cycle, as the microfluidic system was fully saturated with the dead oil, there was no room for the solvent to be injected. Therefore, during the first cycle, due to the low gas–oil ratio (GOR) in the system, there was insufficient gas available to facilitate the formation of foamy oil. Consequently, production primarily occurred through the pressure differential mechanism. At this stage, all tests were conducted under the same operating conditions, producing pressures ranging from 1200 kPa to 200 kPa. Therefore, a lower pressure depletion rate resulted in a longer cycle in terms of time duration, thereby increasing the time available for oil production. Thus, Test 3, which operated at a lower pressure depletion rate of 4 kPa/min, could produce a slightly higher amount of oil, 0.5% and 1.5% more than the tests at 8 kPa/min and 12 kPa/min, as more time was given to the system.
However, over multiple cycles, with repeated solvent injection and soaking periods, more gas molecules accumulated within the system, a crucial factor for the foamy oil mechanism, which enabled more substantial foamy oil generation. Under these conditions, a higher pressure depletion rate became more effective as it could provide sufficient force for bubble nucleation, thereby improving the production of foamy oil and enhancing oil recovery in subsequent cycles. Therefore, as shown in
Figure 6d, the recovery factor after the fifth cycle for Test 4, under a higher pressure depletion rate of 8 kPa/min, is higher than that of Test 2, which was produced under a pressure depletion rate of 4 kPa/min. Increasing the pressure depletion rate to 12 kPa produced the maximum force (in comparison to Tests 3 and 4), and for the foamy oil generation, led to the highest oil recovery factor at 42%.
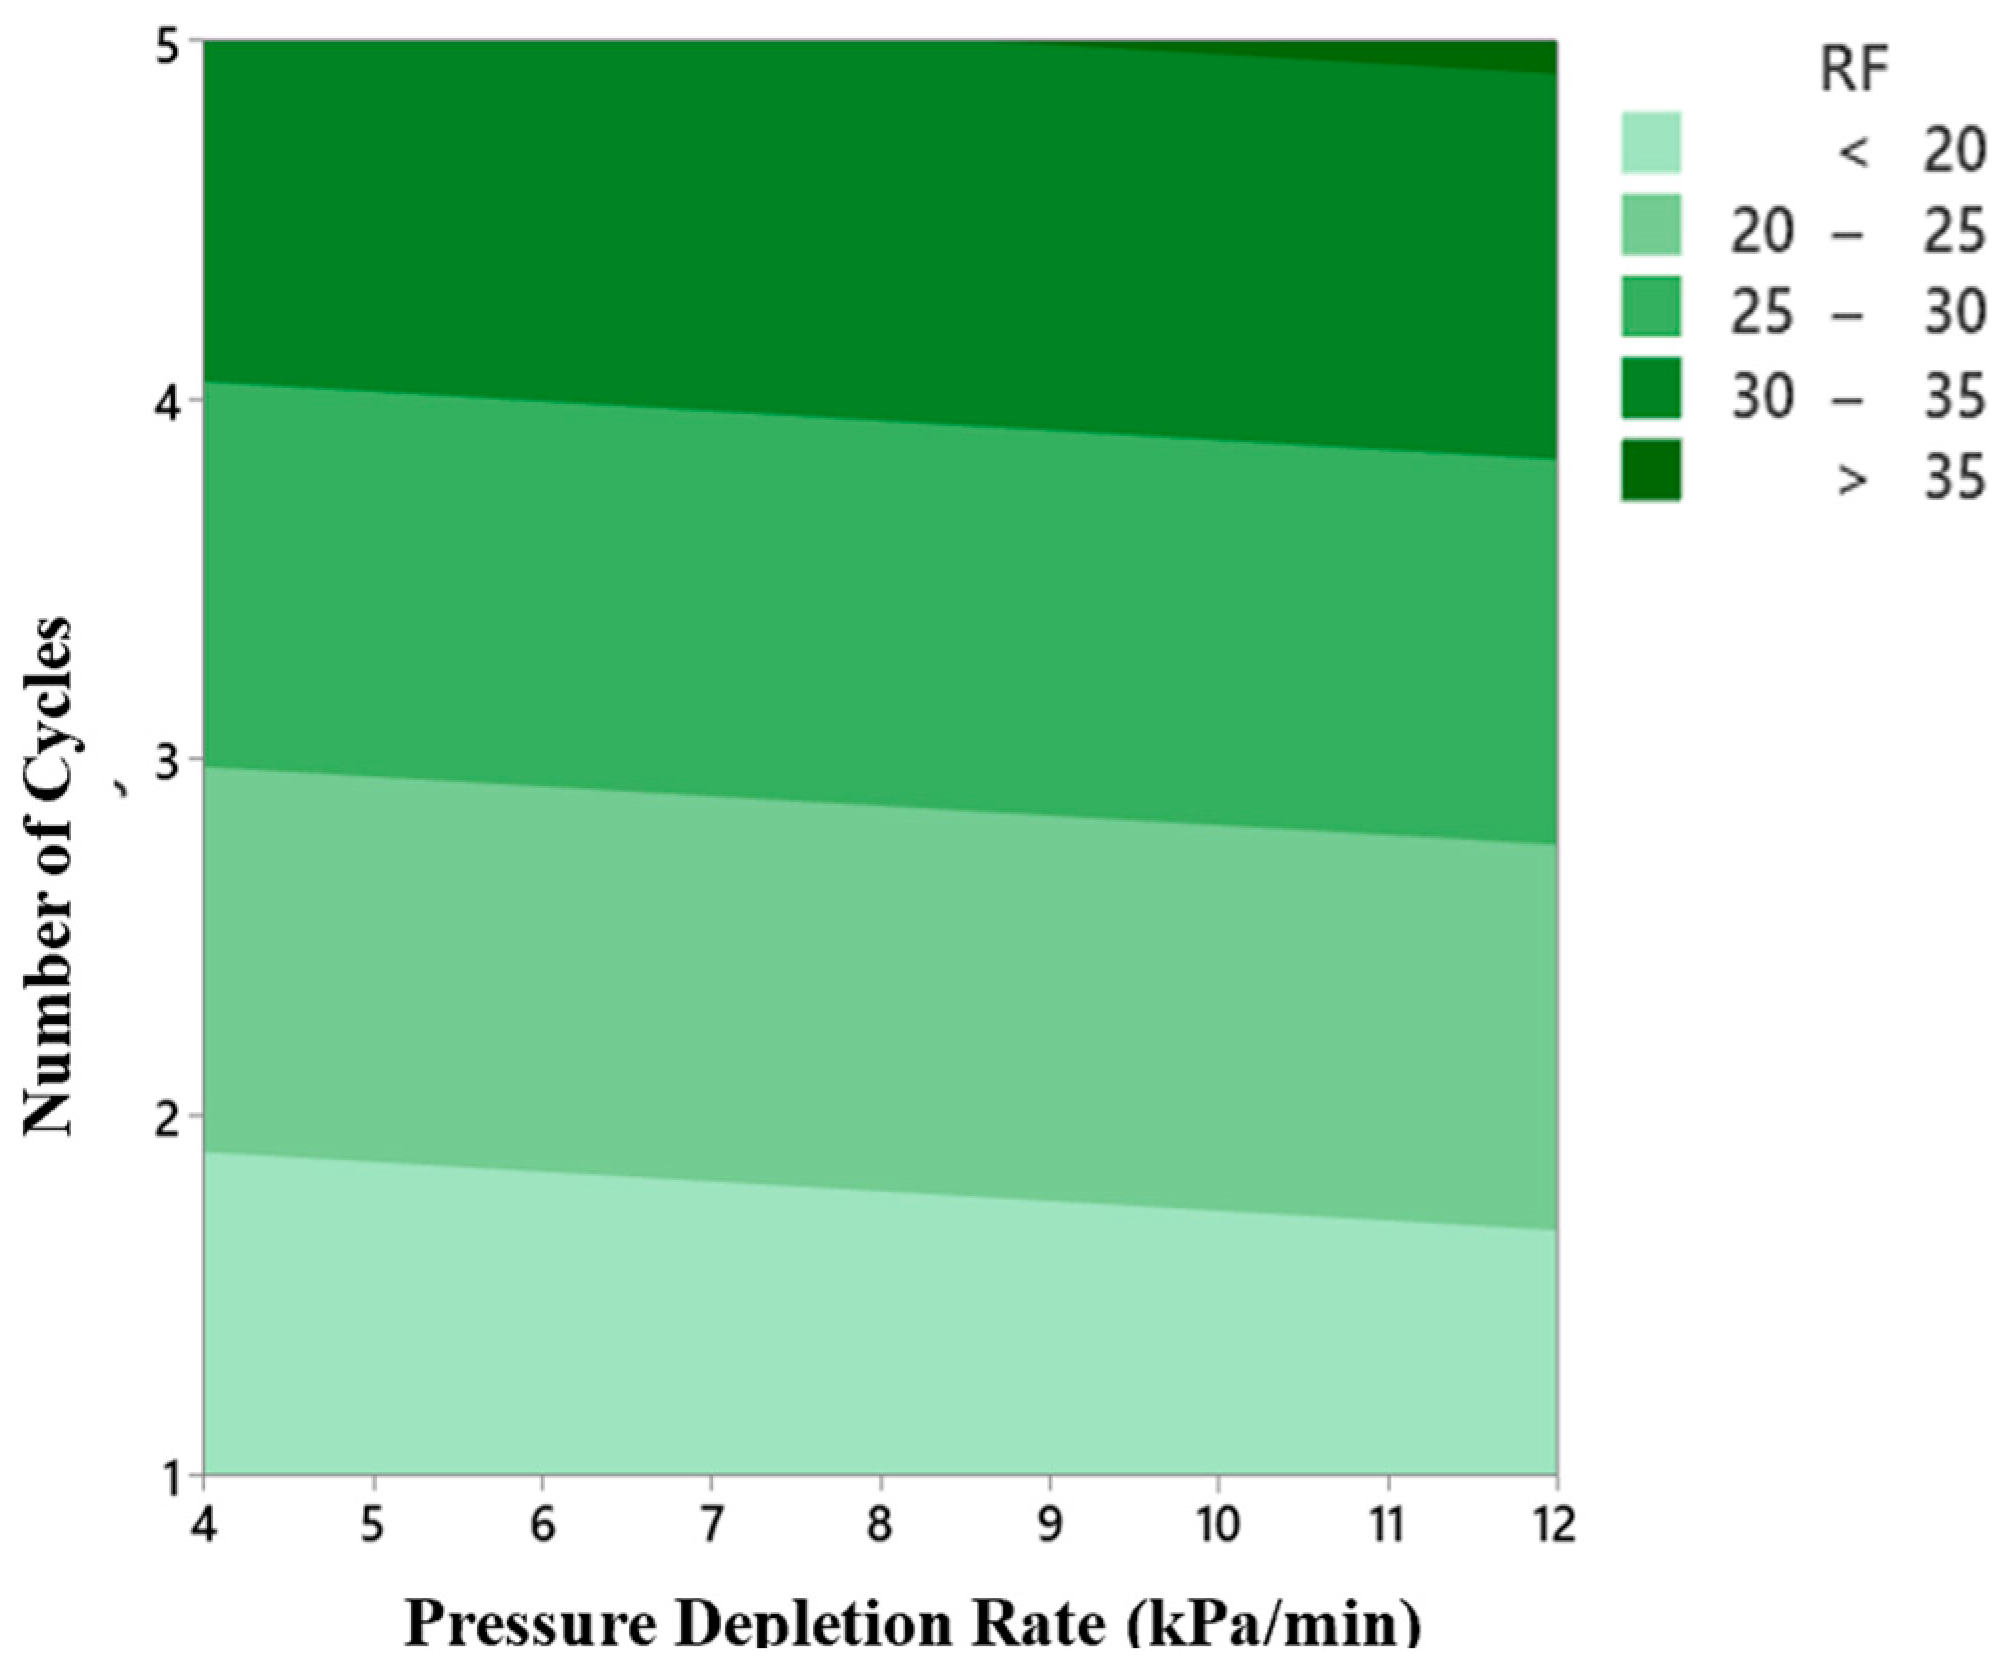
Figure 7 depicts the recovery factor as a function of two parameters: (1) the pressure depletion rate and (2) the number of cycles. Increasing recovery factors are indicated by the change from light green to dark green. The graph shows that increasing both parameters, the number of cycles and the pressure depletion rate, results in higher recovery factors.
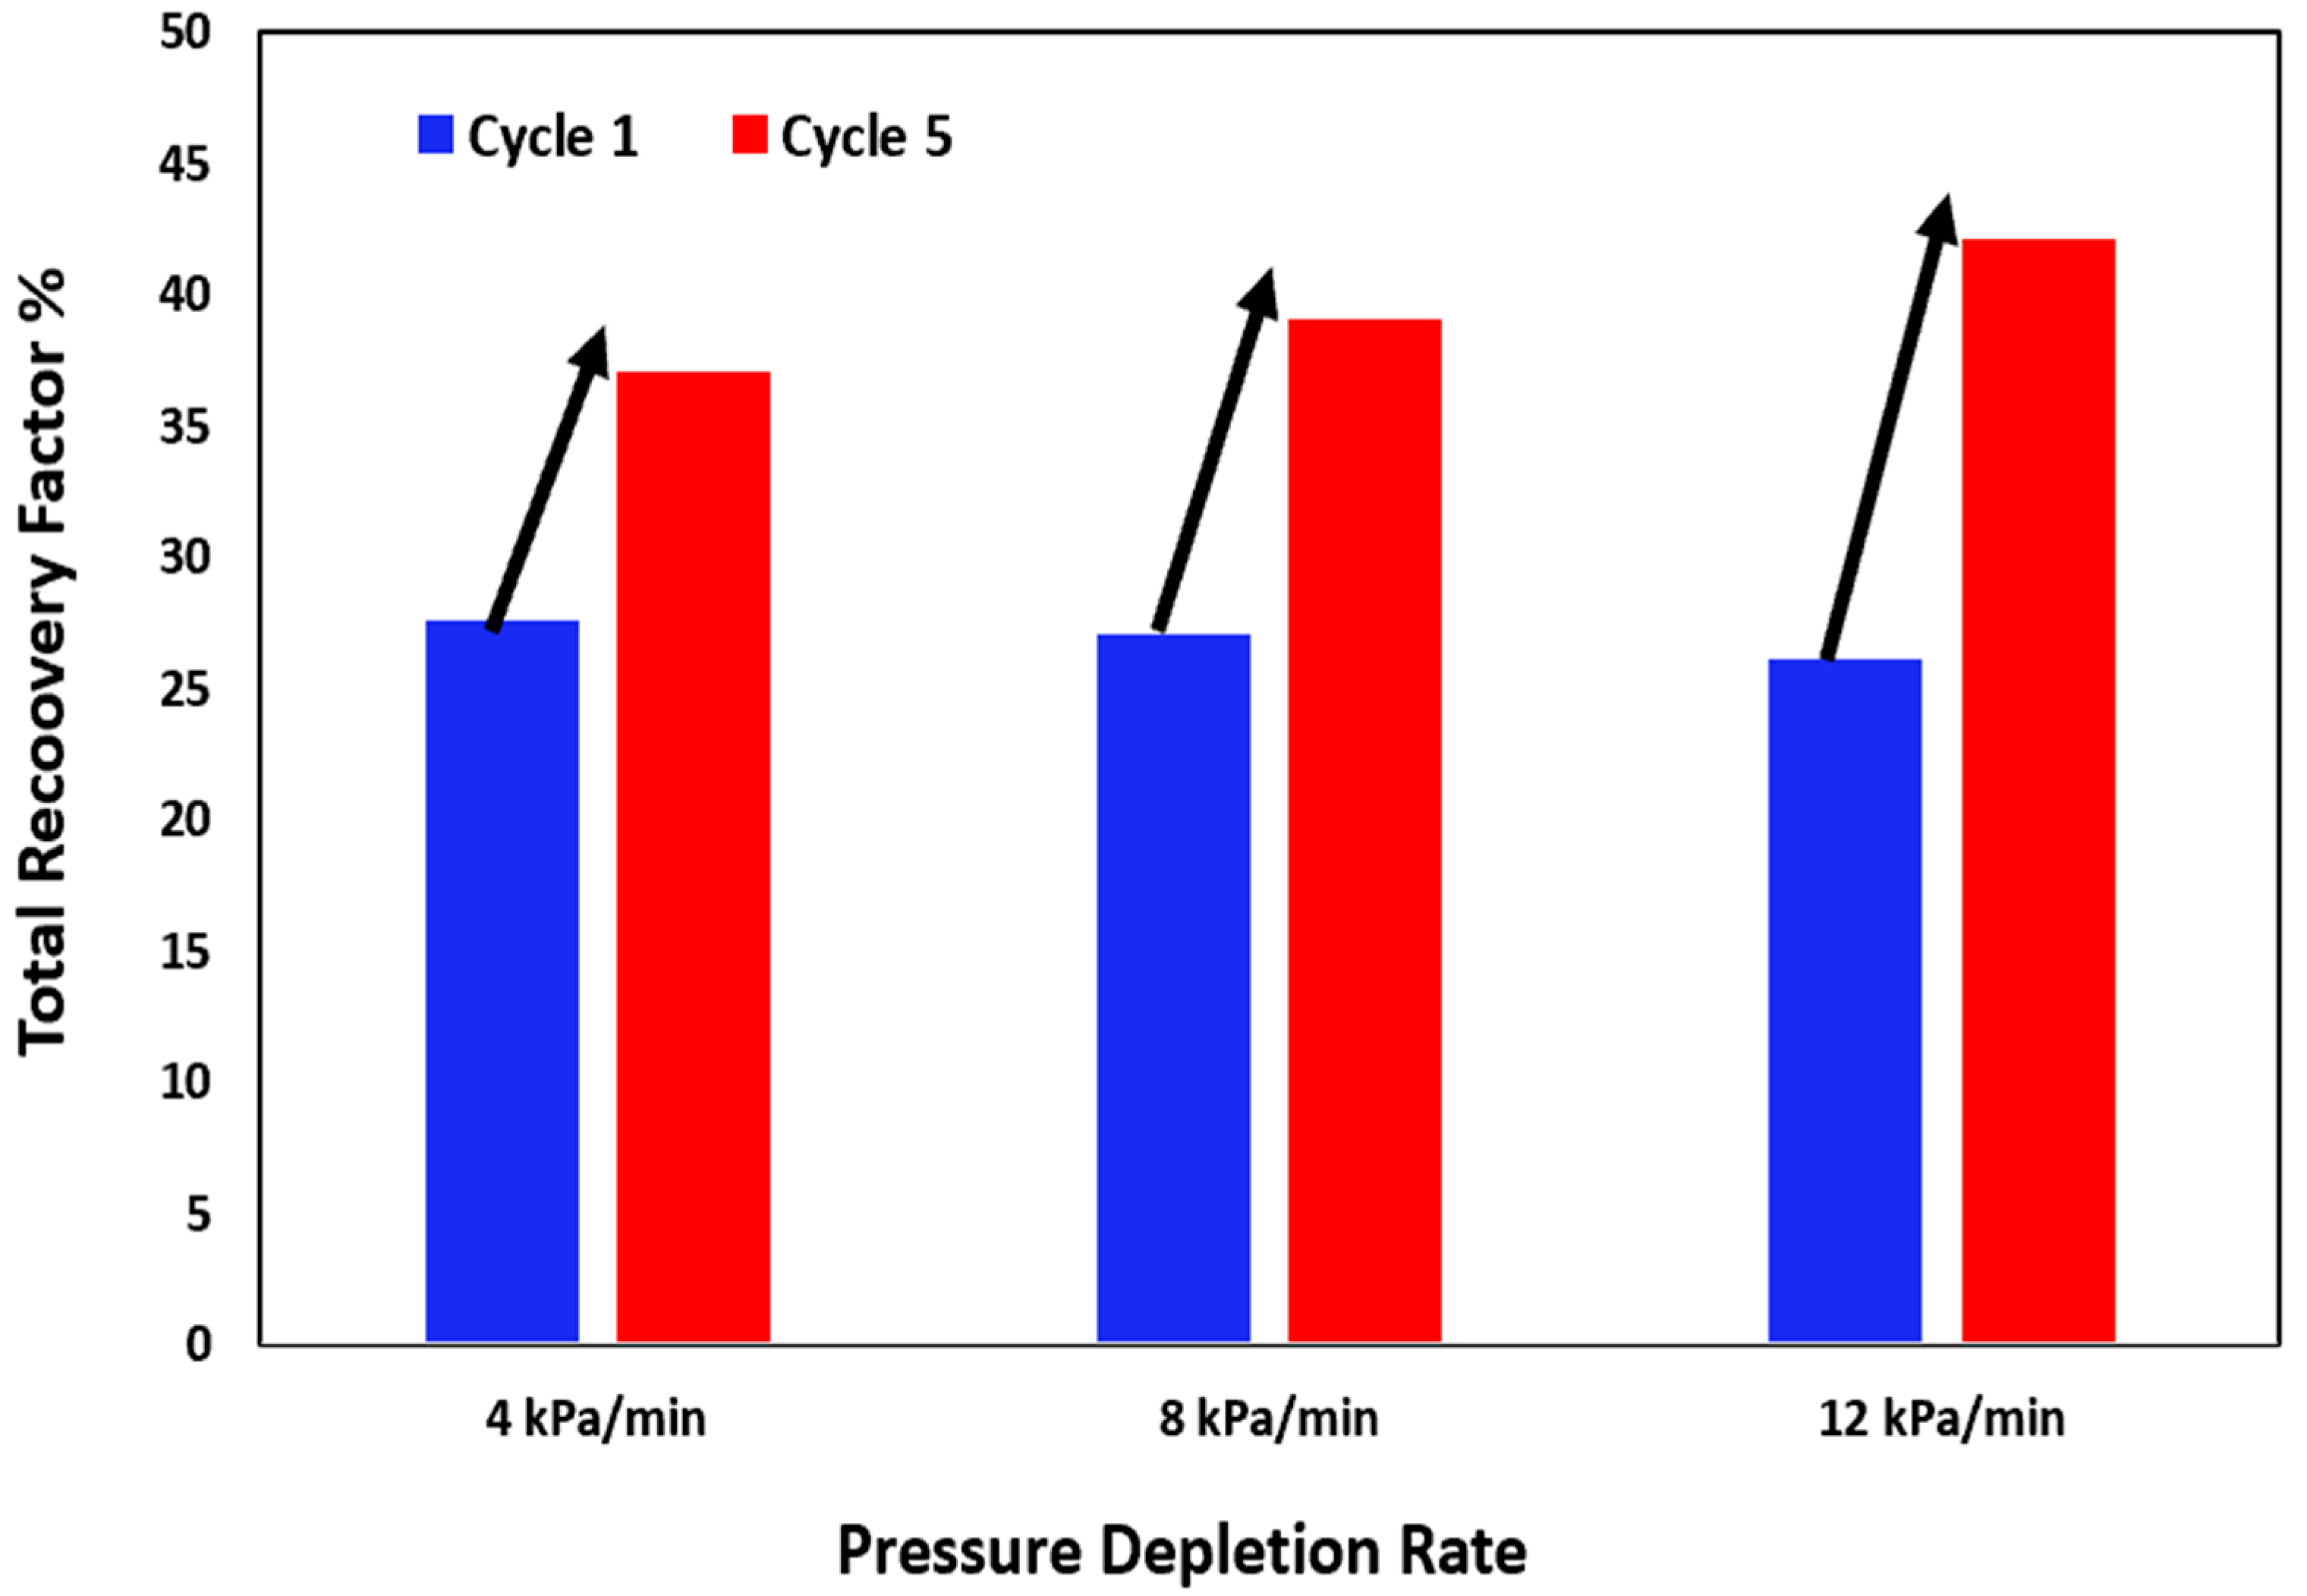
The bar chart in
Figure 8 compares the recovery factor against the pressure depletion rate after the first and fifth cycles. The arrows show that the incremental recovery factor increases from cycle 1 to cycle 5 as the pressure depletion rate rises. It could be suggested that the foamy oil mechanism performs better in enhancing the recovery factor at higher pressure depletion rates.
Three different microfluidic devices were used in the design of Tests 5–11 to properly investigate the impact of wormhole geometries on foamy oil behavior during CSI. Micromodel 2 (asymmetrical single branch) was used in Tests 5 and 6, Micromodel 3 (asymmetrical dual-wormhole) in Tests 7–10, and Micromodel 4 (symmetrical wormhole network) in Test 11. The following subsections discuss the results, focusing on how these different wormhole designs influence oil production.
3.3. Effect of Adding a Branch-Wormhole on Oil Production Behavior
A branched wormhole was designed and incorporated on one side of the central well in the basic microfluidic system to investigate the effect of an asymmetrical wormhole design on oil production behavior. Tests 2 and 5 were conducted in this regard. It was found that for Test 2, while oil production in the basic microfluidic system (depicted in
Figure 9) occurred from both sides of the well, in the microfluidic system with the branch wormhole (Test 5), oil production predominantly took place in the same direction as the wormhole’s presence.
During solvent injection in the basic micromodel, the uniform pattern of the system allowed the solvent to diffuse randomly, leading to production from either or both sides of the well. In contrast, in the micromodel with the branched wormhole, the solvent preferentially diffused into the high-permeable channel that the branched wormhole supplied in the micromodel. According to the capillary pressure formula Pc = , r represents the radius of the wormhole, the larger radius in the wormhole model compared to the basic micromodel without a wormhole, which led to lower capillary pressure. This behavior was, therefore, attributed to reduced flow resistance and diminished capillary forces in the wormhole pathway. Consequently, oil production primarily started from the wormhole side. This suggests that while oil production in the basic micromodel exhibits erratic behavior due to solvent diffusion and production occurring from different directions, the branched wormhole micromodel consistently follows a similar pattern in the same direction as the wormhole.
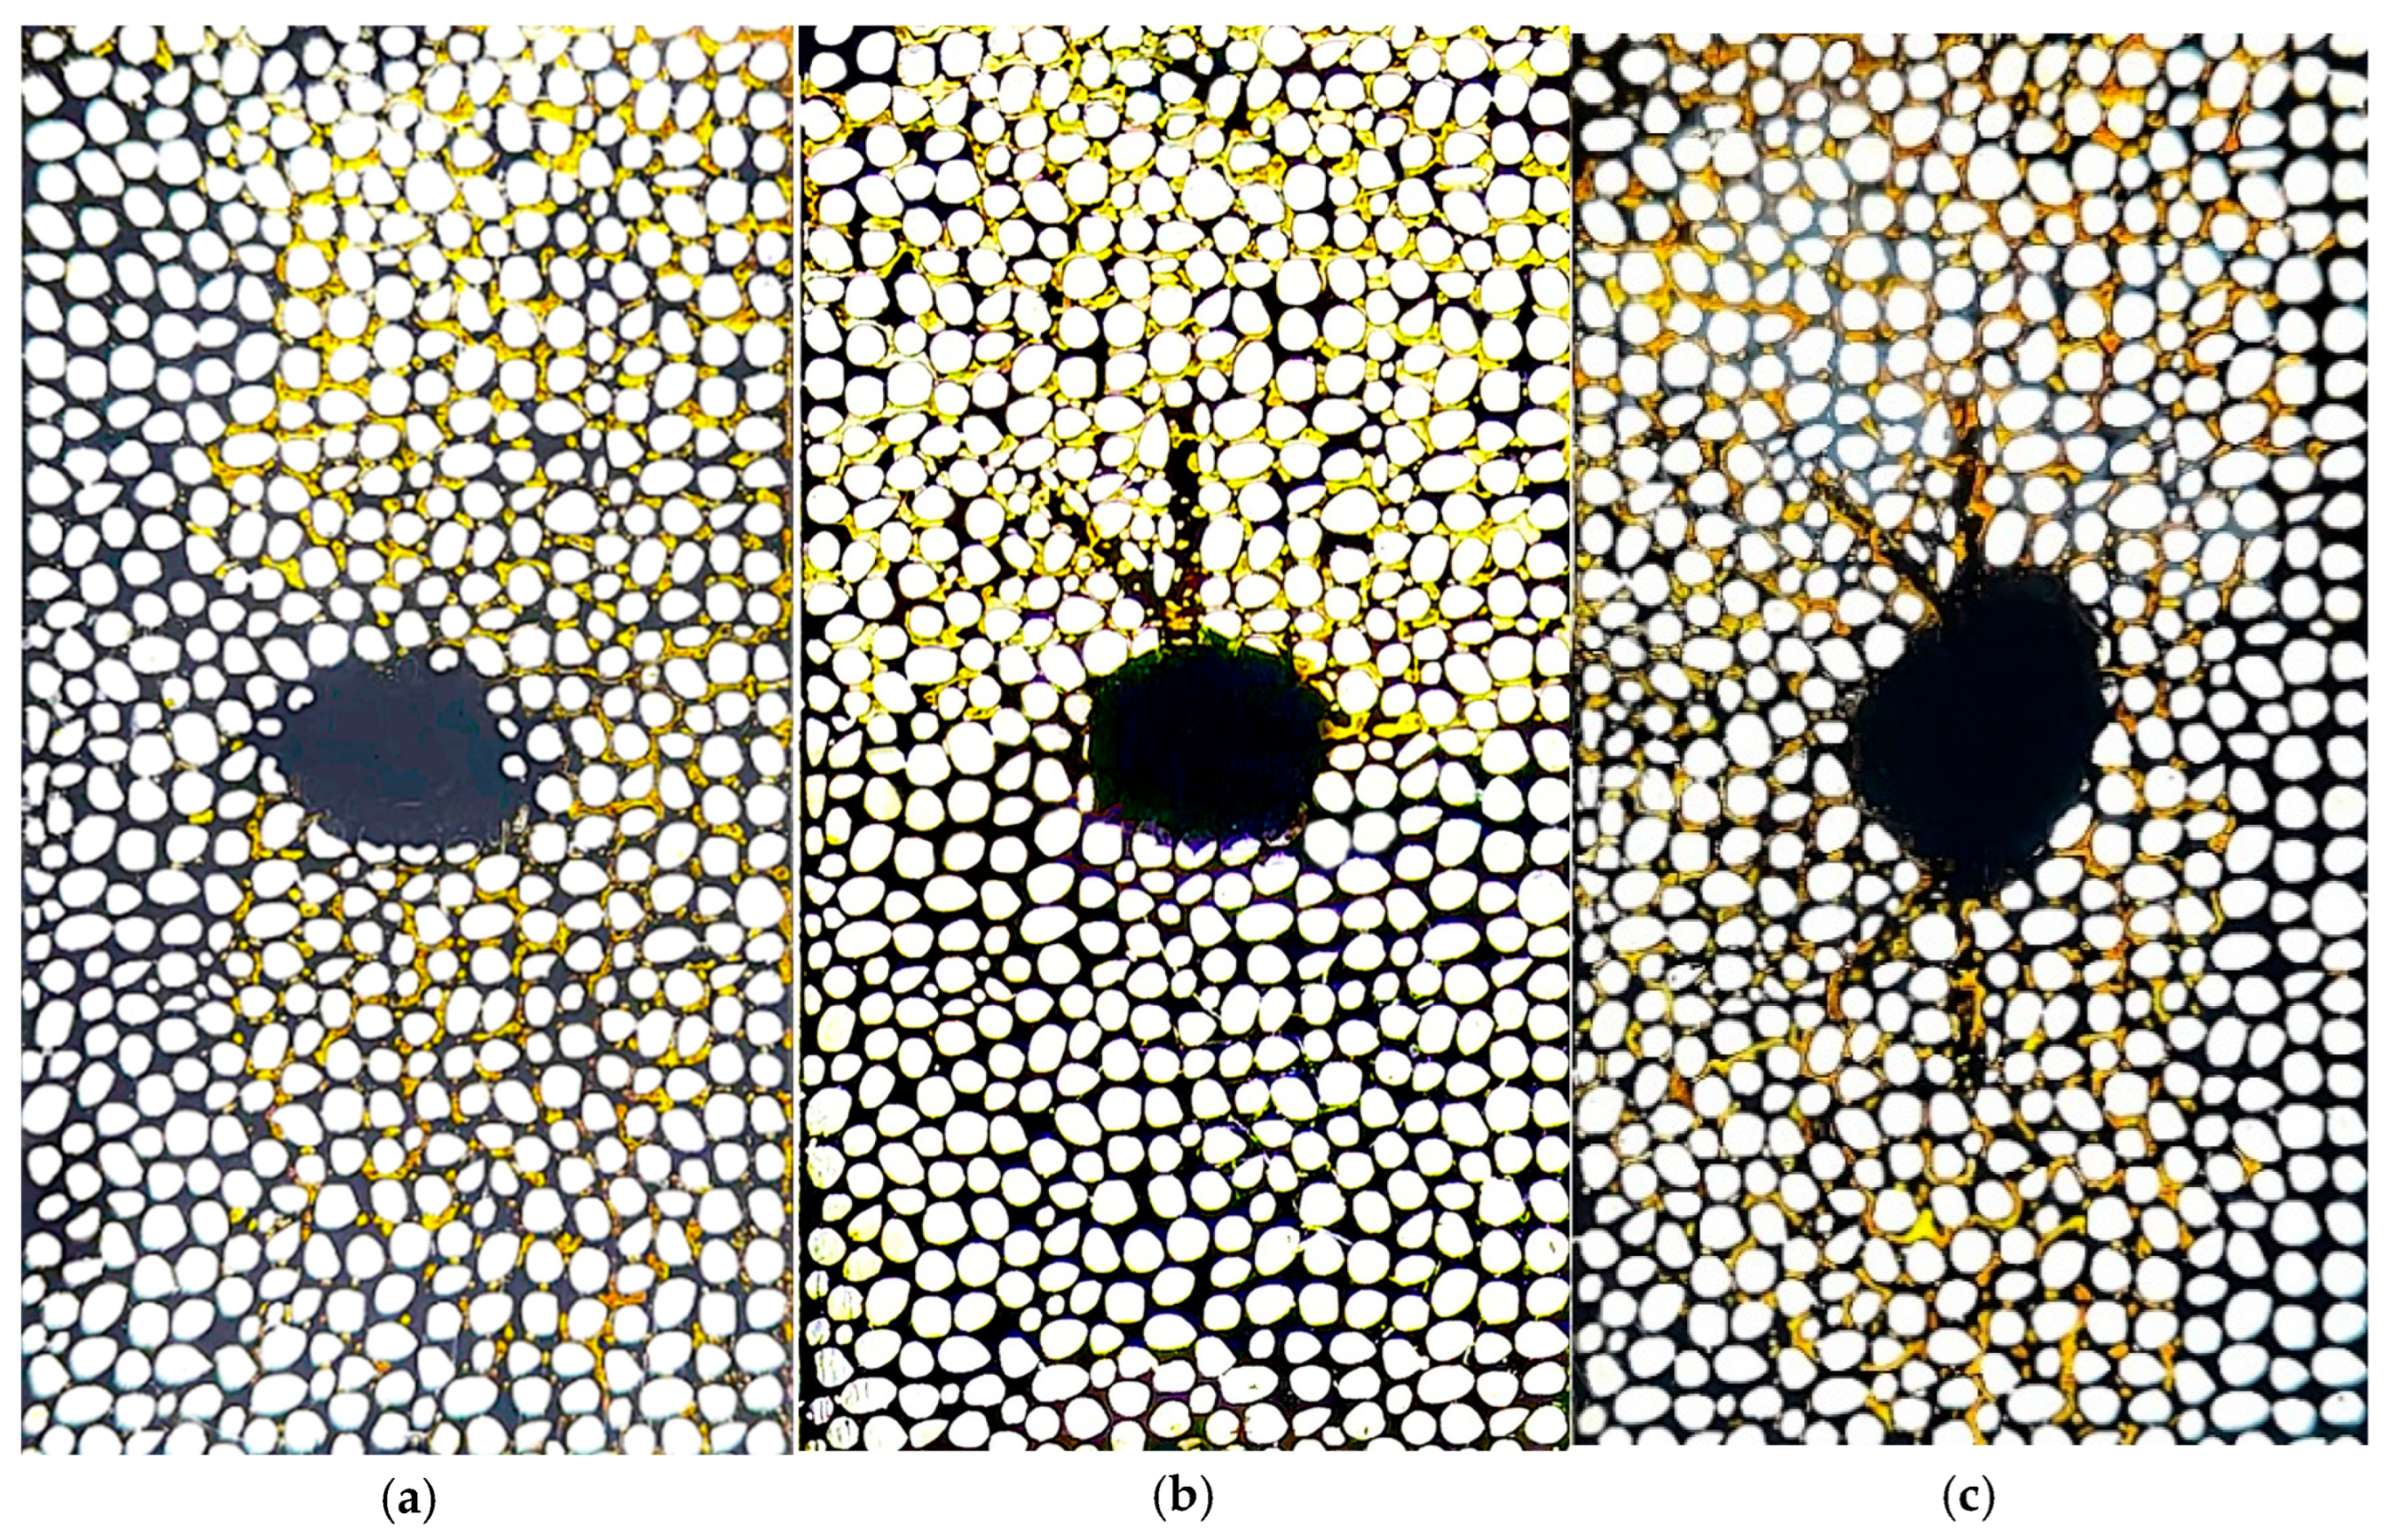
3.4. Effect of Dual-Wormhole with Asymmetrical Design on Oil Production Behavior
Figure 10 compares oil production patterns thoroughly when a second wormhole is introduced into the microfluidic system and examined at 20, 60, and 120 min during the first cycle. Micromodel 2, featured with branch wormholes, is shown in Figures
10a,
10b and
10c at 20, 60, and 120 min, respectively, and Micromodel 3 with an additional wormhole (dual-wormhole) is shown in
Figure 10d–f for the same time intervals. This comparison aims to assess the second wormhole’s supplementary contribution to the overall oil recovery process. Initially, the single and dual-wormhole micromodels show similar production trends (depicted in Figures
10a and
10d, respectively).
In the early stages of oil recovery, the process was primarily driven by the branched wormhole, which efficiently mobilized oil nearby. As time passed, it became evident, as shown in
Figure 10e, that a second wormhole began to play a key role in oil production, extracting oil from previously untouched areas by the first wormhole. This additional production increased oil extraction from regions outside the primary wormhole’s flow patterns. By 120 min, as illustrated in
Figure 10f, the second wormhole significantly impacted the overall recovery efficiency, enhancing total oil recovery compared to a system with only a single wormhole. This improvement underscores the synergistic effect of existing multiple wormholes with different directions within the porous media.
3.5. Impact of Pressure Depletion Rate on CSI Using Dual-Wormhole Micromodel
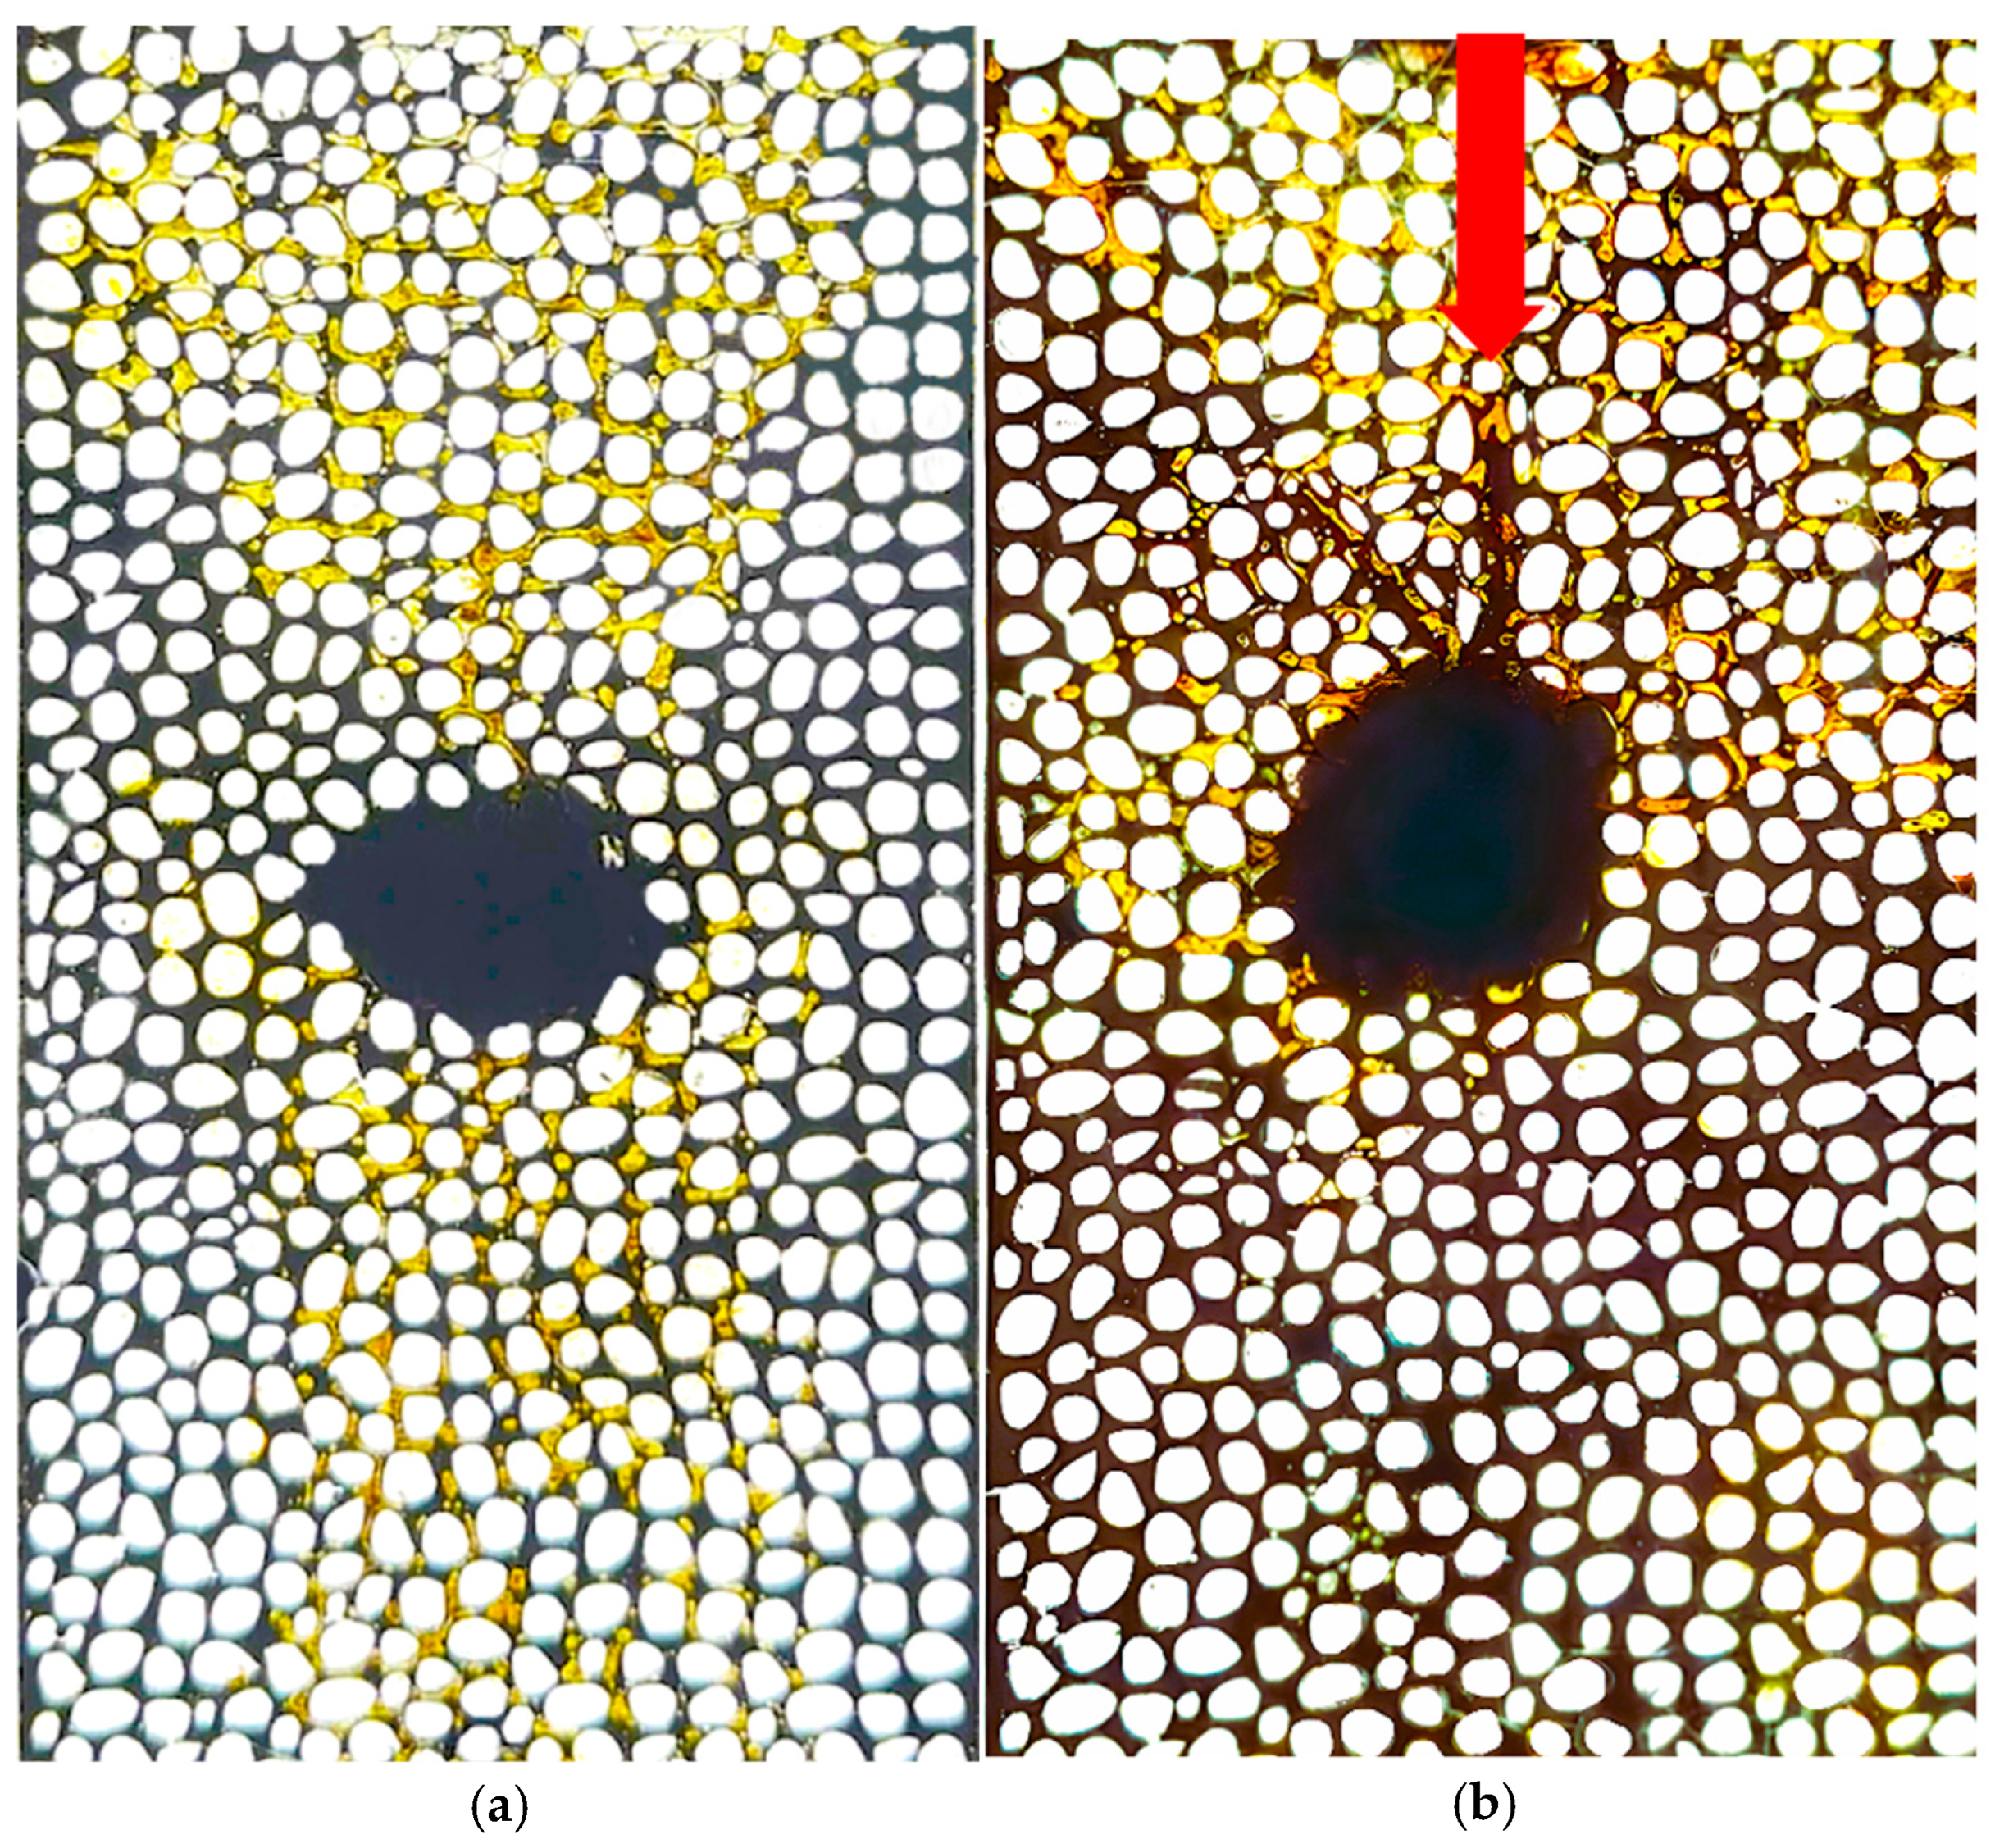
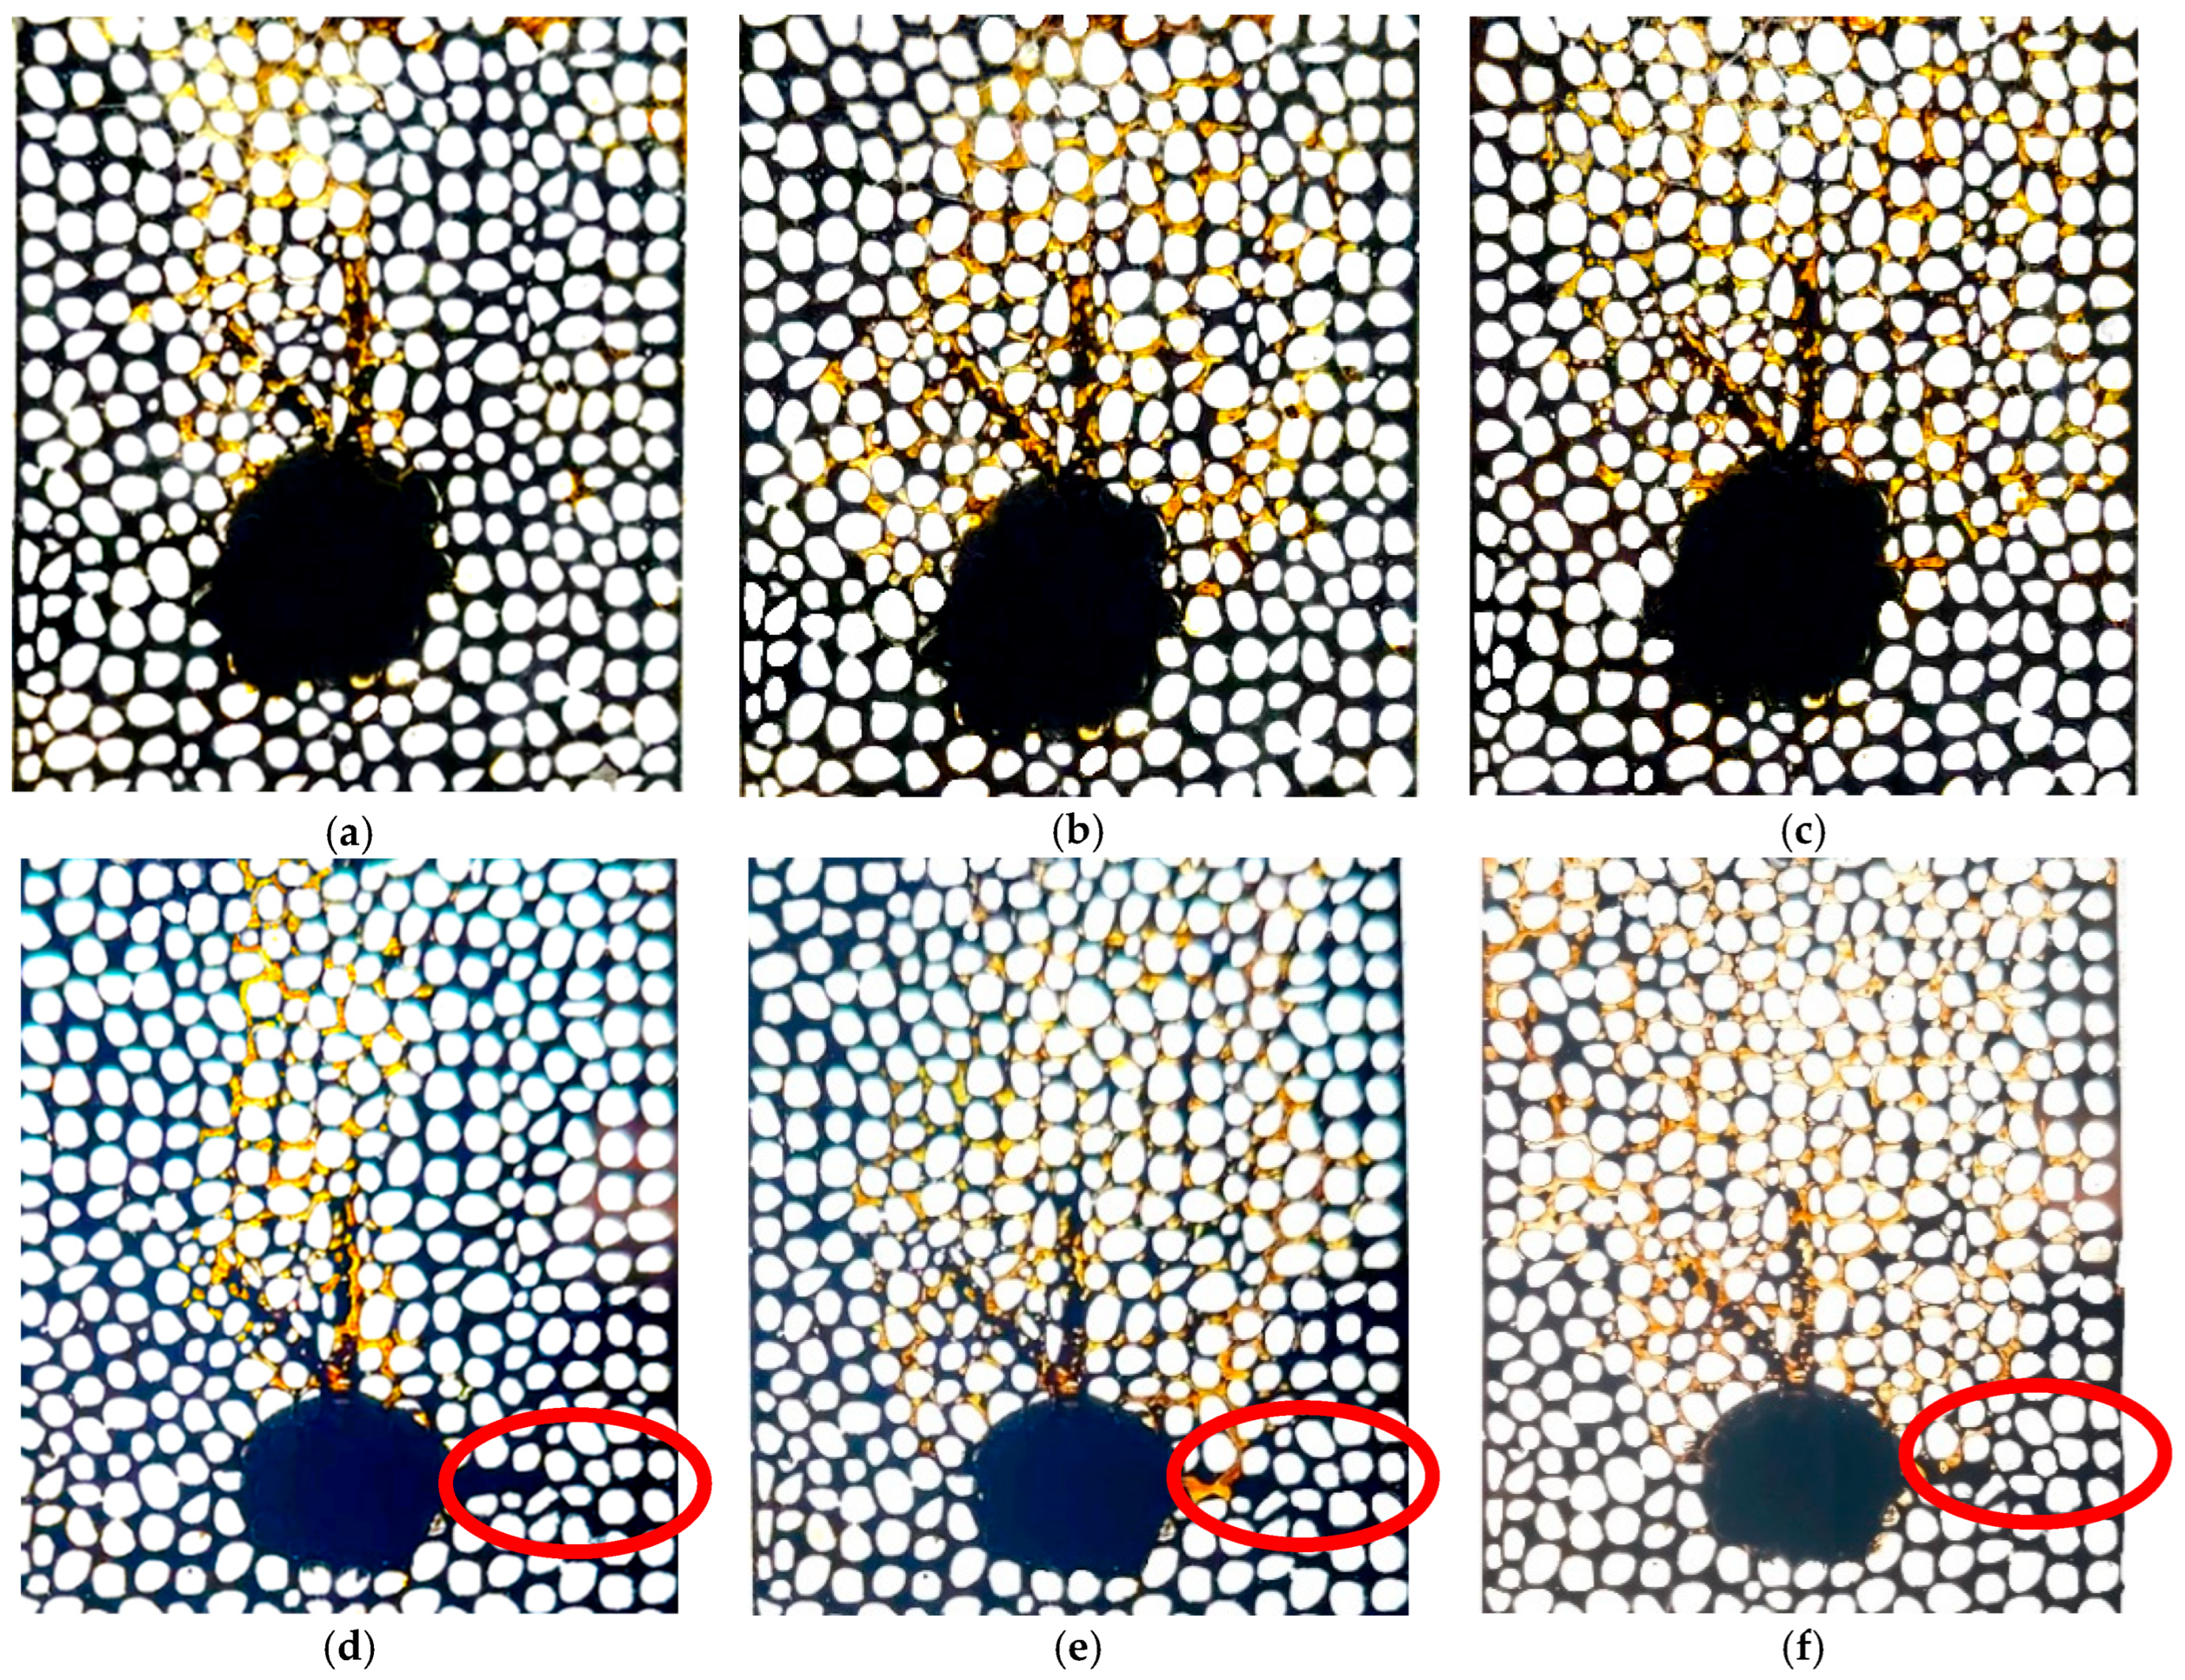
In this part, Tests 7 and 8 were conducted utilizing a dual-wormhole micromodel with an asymmetrical design to investigate the effect of pressure depletion rate on oil production after the first and third cycles.
Figure 11 shows oil production at two distinct pressure depletion rates, 4 kPa/min and 8 kPa/min.
Figure 11a displays the oil production after the first cycle using Solvent 2 (pure CO
2), where production predominantly occurs from the wormhole side. As shown in
Figure 11b, continuing the experiment over three cycles reveals no significant change in the oil production trend. In Test 8, the pressure depletion rate was doubled to 8 kPa/min, enabling the system to operate at a higher depletion rate. Following the first cycle with Solvent 2 (pure CO
2),
Figure 11a shows that oil production is primarily from the wormhole side. The trend in oil output remains unchanged when the experiment is extended over three cycles, as shown in
Figure 11b. The system could function at a greater depletion rate in Test 8 when the pressure depletion rate was doubled to 8 kPa/min.
Figure 11c shows that oil production around the wormholes exhibits a similar trend. Although the number of cycles did not significantly affect the oil production trend, the total recovery factor after the third cycle in Test 8 was higher than in Test 7. In the asymmetrical design, the wormhole configuration has been demonstrated to be the primary factor controlling oil production behavior. This behavior is likely attributed to the preferential pathways created by the wormholes during the injection process, which resulted in uneven solvent distribution.
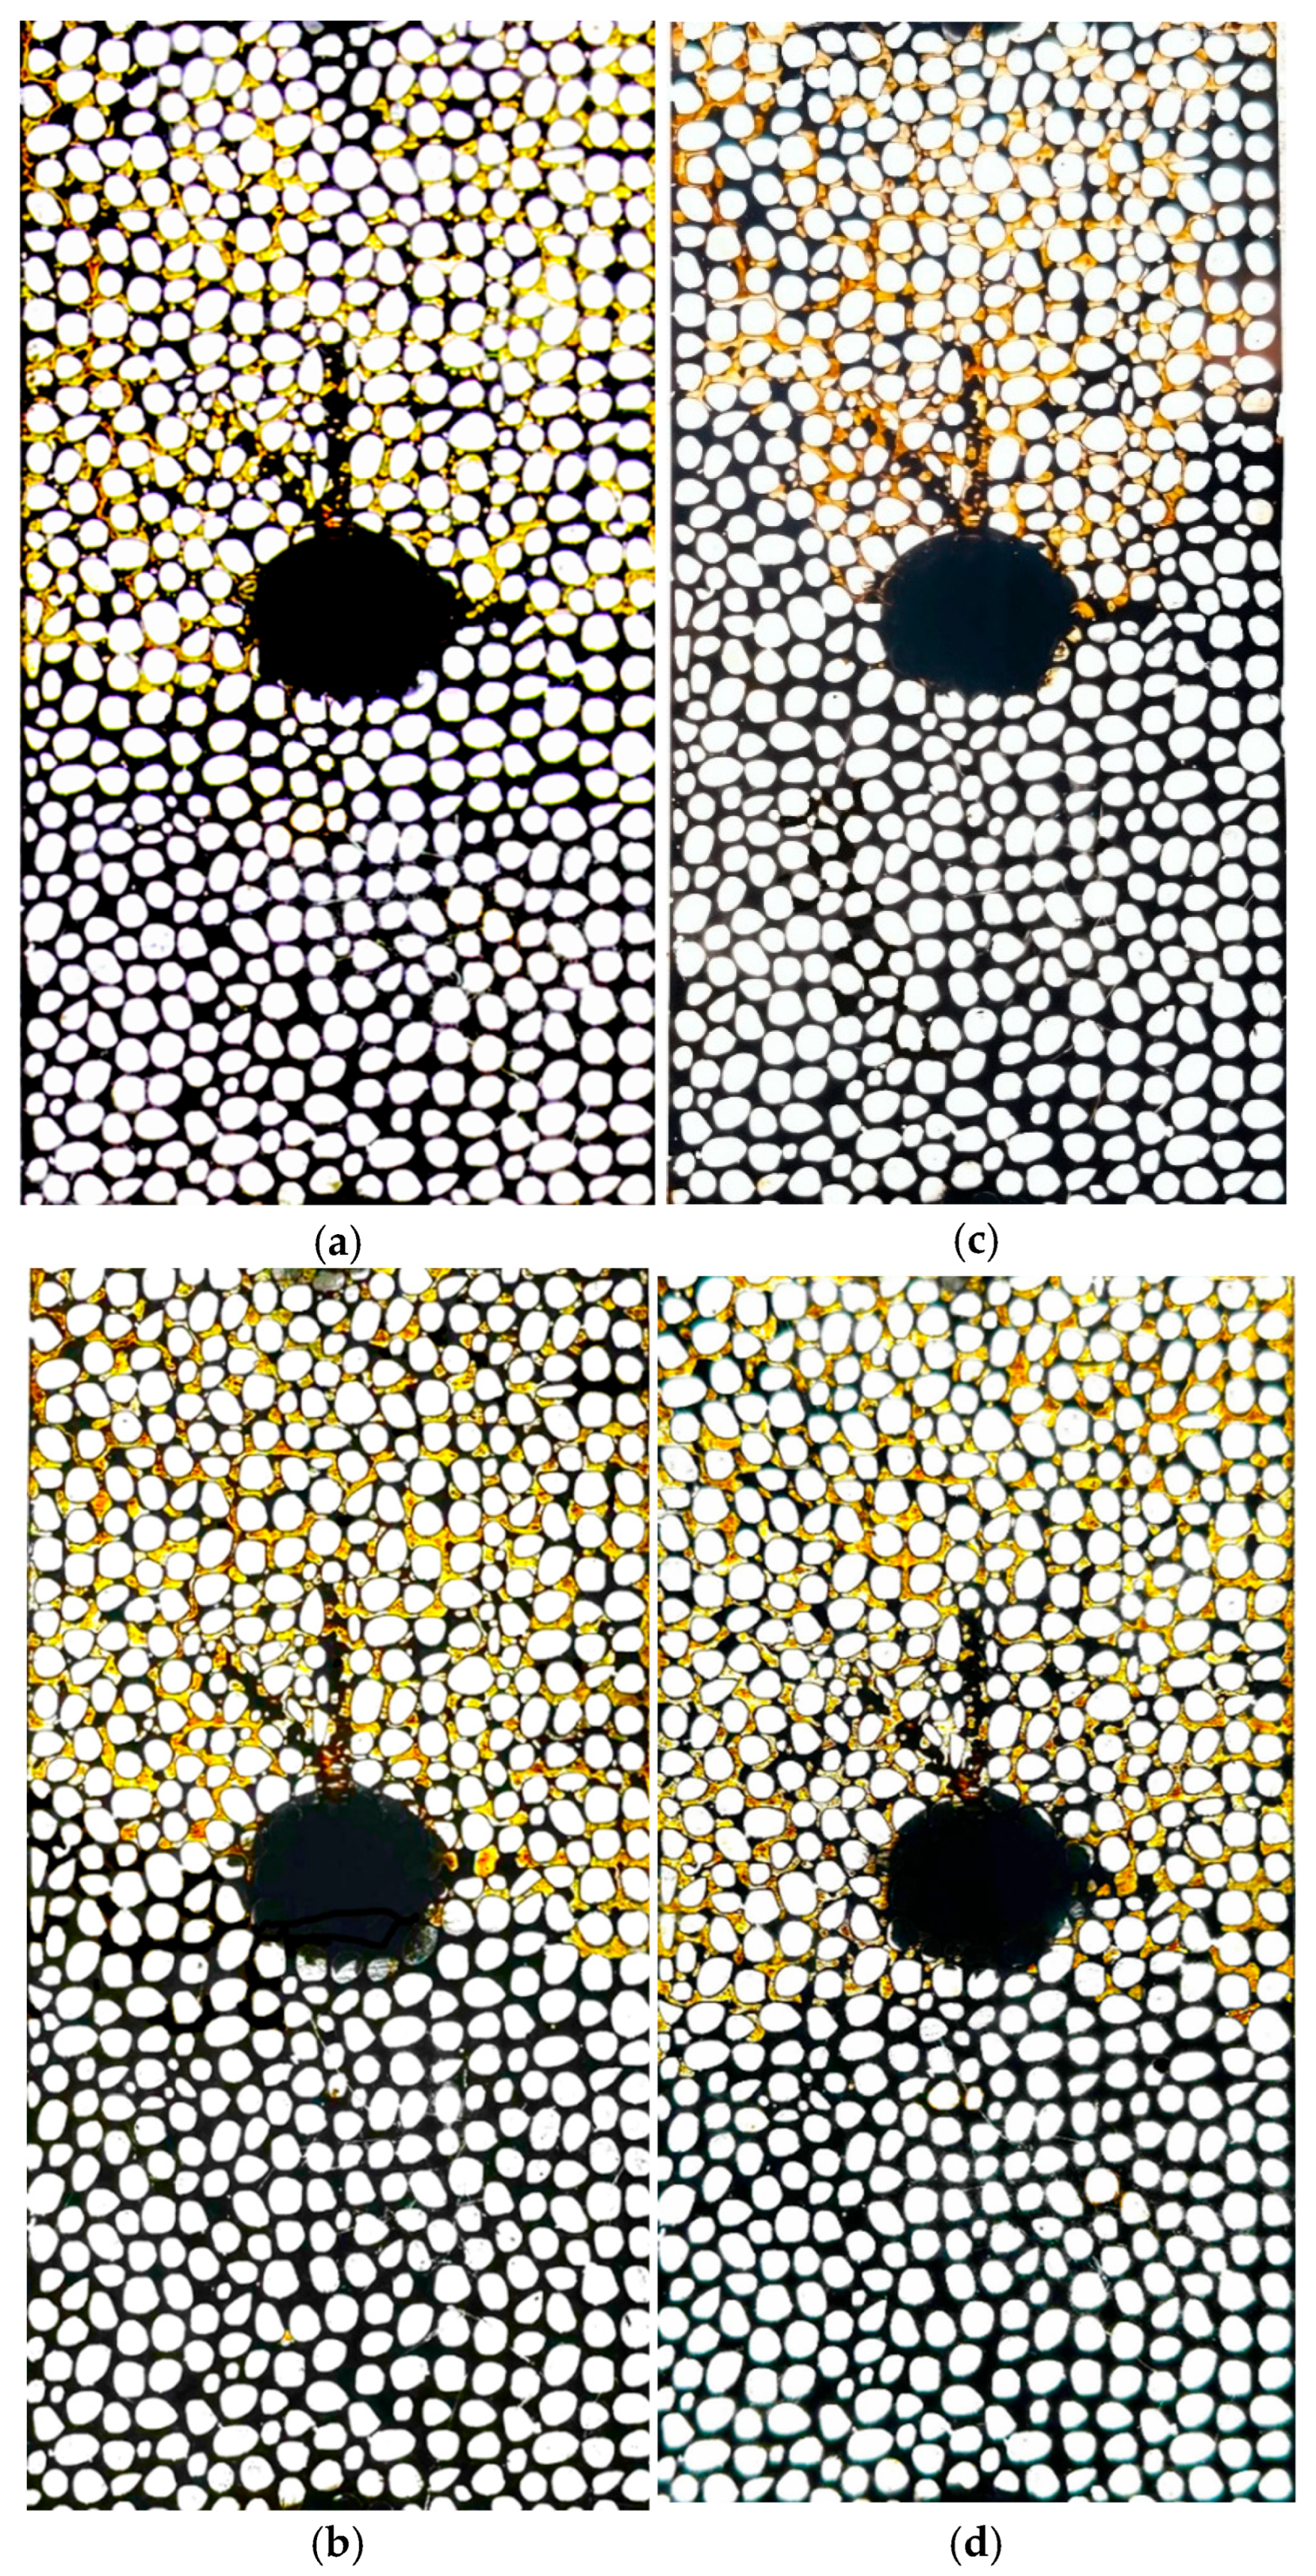
3.6. Impact of the Presence of C3H8 in Solvent on CSI Using Dual-Wormhole Micromodel
Although wormholes could improve the recovery factor by increasing the contact area between the solvent and crude oil, they could also cause some challenges in oil production, such as quick breakthroughs [
9]. As seen in the previous section, neither the pressure depletion rate nor the number of cycles could overcome the influence of the wormhole configuration to recover oil in the absence of the wormhole in an asymmetrical design. To address this, the author designed Test 9 and used another carbon-based solvent containing C
3H
8 to evaluate the impact of propene as a solution for oil production from an asymmetrical wormhole design.
The injection of the third solvent in Test 9 demonstrated a different oil production behavior. As shown in
Figure 12c, oil was produced from the side with wormholes, but the solvent also propagated to recover oil from the opposite side of the center well, even in the absence of wormholes. By the third cycle, the mixture of solvents, including 70% CO
2 + 30% C
3H
8, further enhanced oil production, significantly improving the total recovery factor (see
Figure 12d).
During the injection process, the solvent preferentially diffused into the high-permeability channel provided by the wormhole. This is due to the lower resistance and reduced capillary pressure in the wormhole, which restricts solvent distribution on the side of the wormholes. In Test 7, using Solvent 2, the solvent dissolved primarily in the direction of the wormhole over the soaking time. Oil production occurred exclusively from the wormhole side, and subsequent cycles did not significantly improve the oil recovery factor, as the production behavior remained unchanged despite increasing the number of cycles (
Figure 12b). In Test 9, however, the higher solubility of propane (C
3H
8) [
35] enabled the solvent to dissolve into the crude oil on the opposite side of the wormhole. Oil was recovered from the wormhole and the opposite sides during the production phase. In the subsequent cycles, oil recovery improved as more solvent could be injected, resulting in an increased GOR. This enhanced the dissolving process, making it more effective and significantly improving oil recovery.
Section 2.1 discussed the fundamental rule of the dissolution of two substances. According to the phase diagram of propene, propene could exist in the liquid phase under the experimental conditions used in this study (T = 22 °C and P = 1200 kPa). Therefore, it can be inferred that Solvent 3, which contains 30% propene, exhibits high solubility in the oil. This high solubility contributes to both oil swelling and viscosity reduction, which in turn enhance oil mobilization.
It can be concluded that interfacial tension, IFT, plays an important role in foamy oil generation. In cases where the IFT is significantly reduced, such as when using Solvent 3 (70% CO2 + 30% C3H8, as in Test 9), the influence of wormhole geometry on recovery becomes less pronounced. This observation suggests that the dominant mechanism may shift from flow-path dependence to interfacial interactions under certain solvent conditions.
The line graph in
Figure 13 illustrates the total recovery factor as a function of the type of solvent and the number of cycles. The first notable observation is that Solvent 3, containing 30% propene, can enhance the recovery factor, achieving a total recovery of 36% after the third cycle, compared to the total recovery factor achieved using pure CO
2 at 22%. Interestingly, the amount of oil recovered after the first cycle using Solvent 3, which contains propene, is higher than the total recovery factor obtained using Solvent 2, pure CO
2, after the third cycle. This significant improvement in the recovery factor is a testament to the effectiveness of Solvent 3 in enhancing oil recovery.
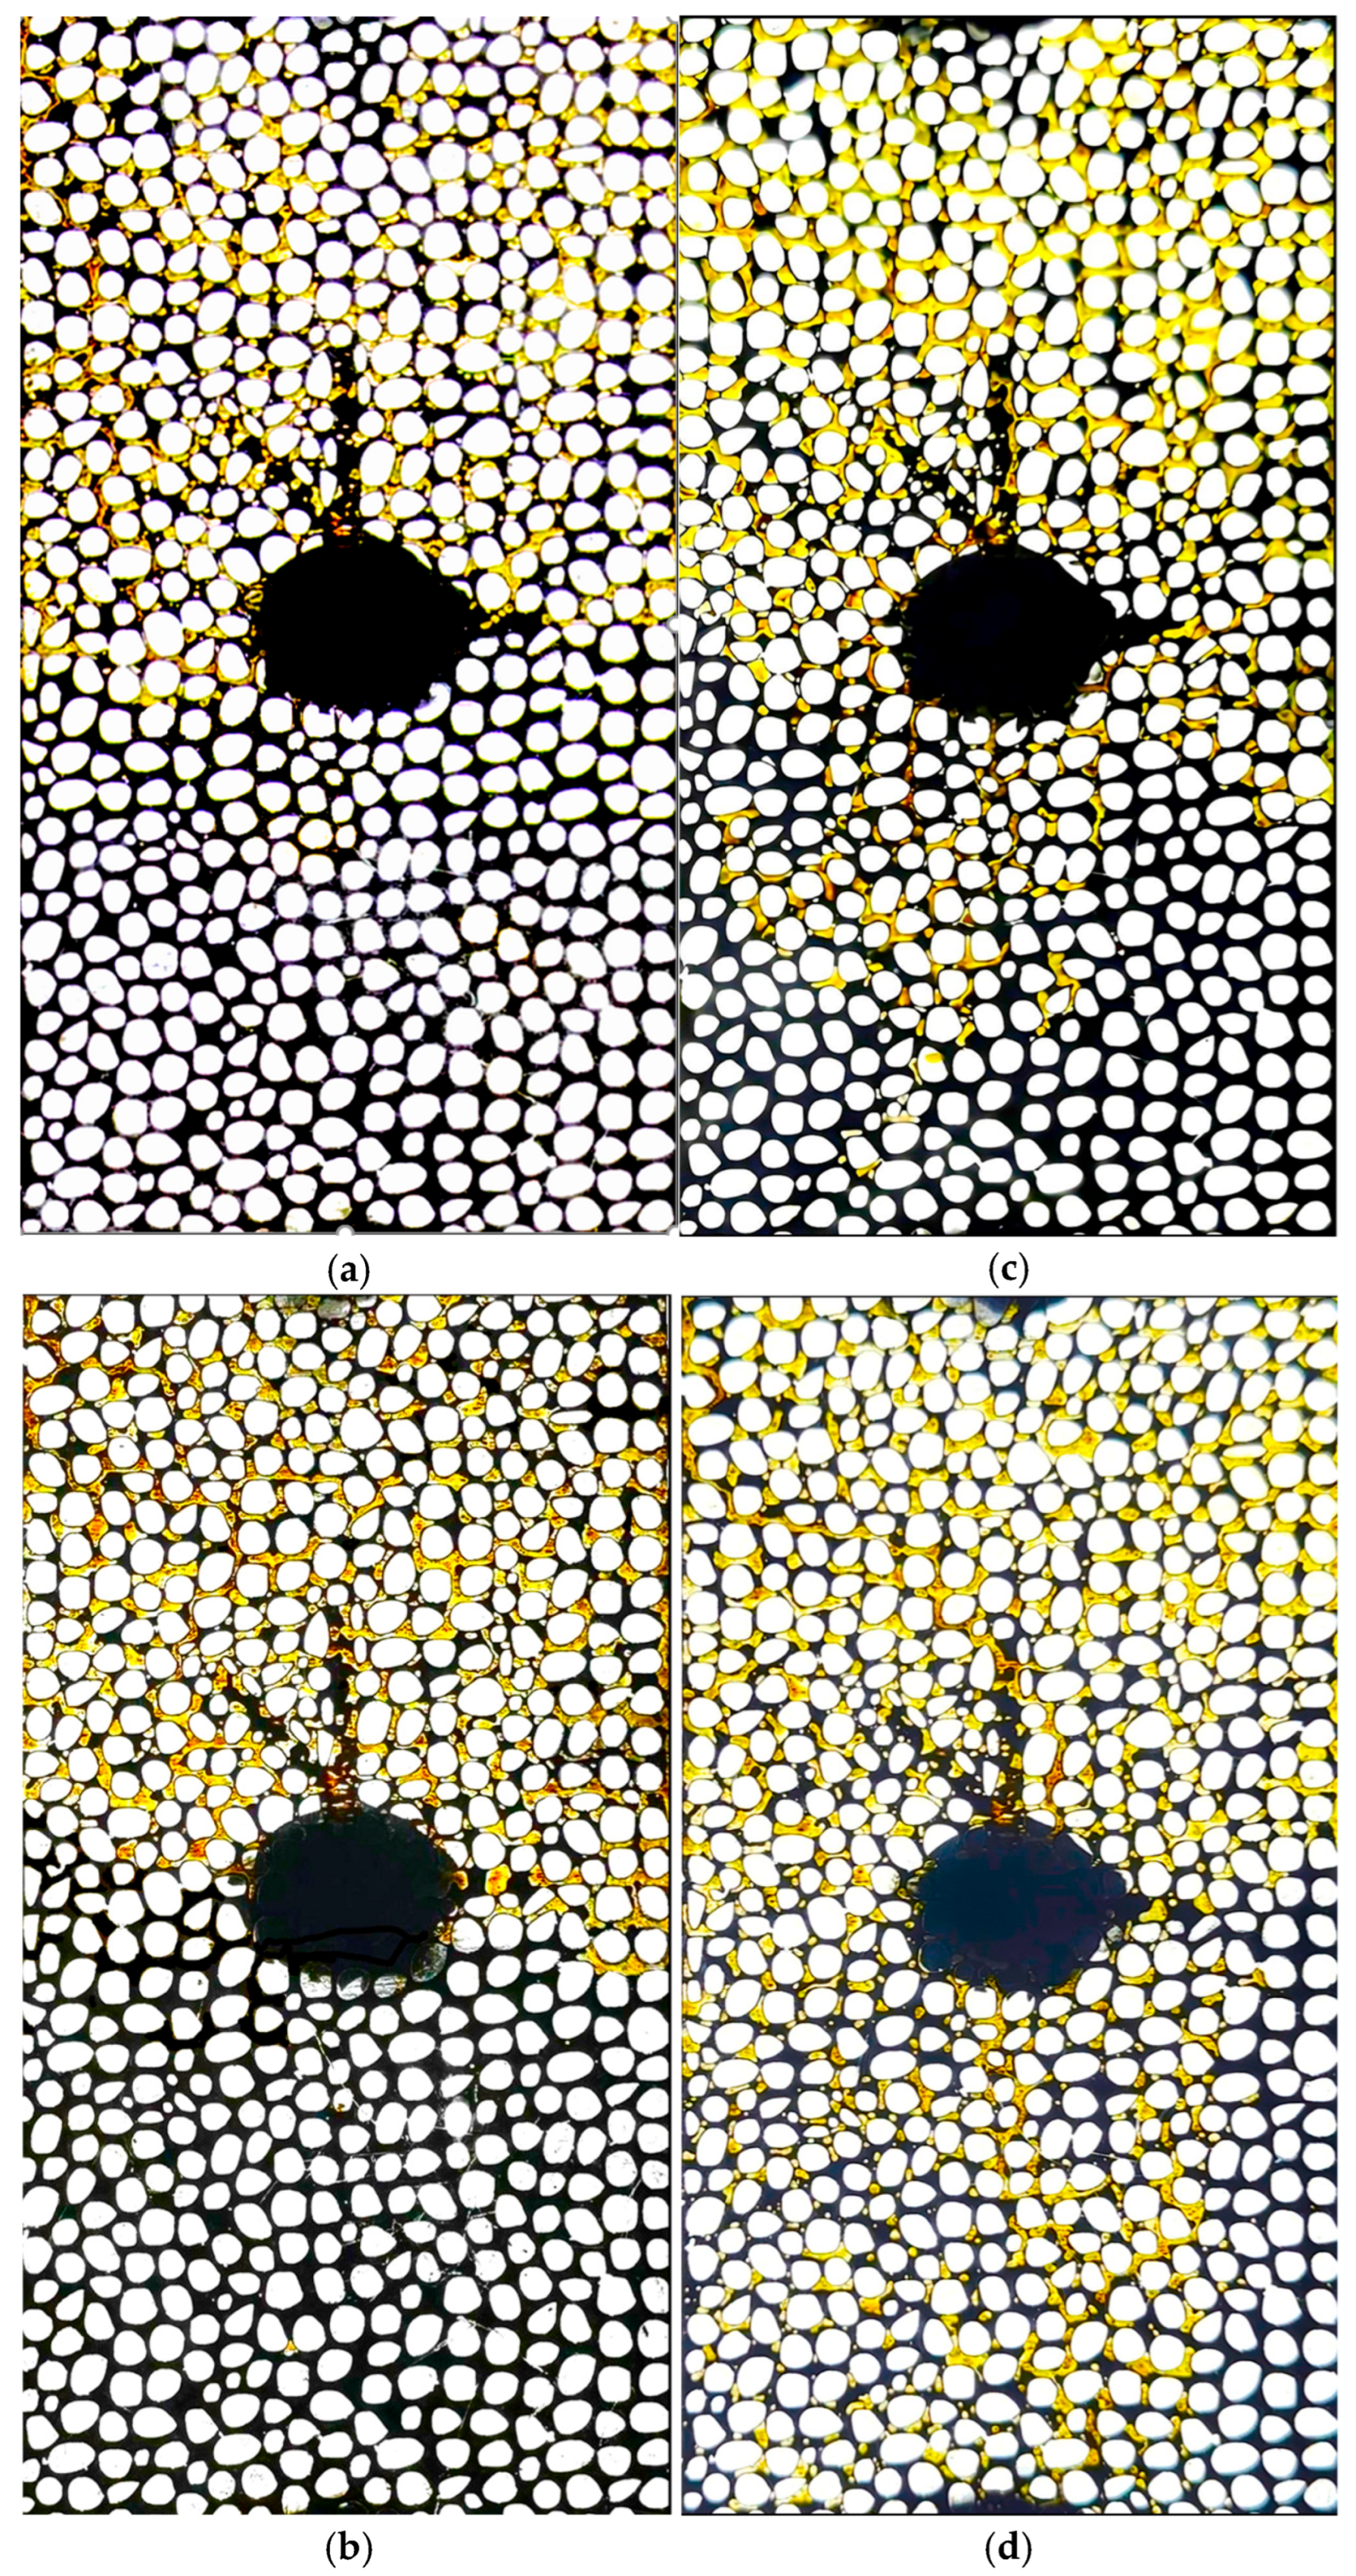
3.7. Impact of Wormhole Orientation on CSI Process
To gain a deeper understanding of the impact of wormhole network orientations on oil production during the CSI process, Test 11 was designed. In this specific test, the micromodel with the symmetrical design (
Figure 1d) was used. The results of this test were then compared with those of Test 1, which used a basic micromodel with no wormhole, and Test 10, which used a dual-wormhole micromodel with an asymmetrical configuration.
Figure 14 illustrates the impact of various wormhole designs on oil production compared to the basic micromodel. In
Figure 14a, in the basic micromodel where no wormholes are present, the solvent is distributed randomly throughout the porous media due to the uniform pattern, indicating that there are no preferential pathways. In this experiment, the oil was produced from both sides without any specific direction. Introducing two wormholes to the basic design in the asymmetrical arrangement (
Figure 14b) reveals that the production behavior changed completely. The solvent preferentially diffuses through the wormhole network, significantly limiting oil production to the side of the wormhole, as discussed in
Section 3.3. This indicates that while wormholes can provide a low-resistance pathway for solvent penetration, they may also cause early breakthrough and reduced sweep efficiency on the opposite side, restricting contact with unswept oil regions. In contrast, the symmetrical branched-wormhole design (
Figure 14c) demonstrates superior performance. The branch wormholes on both sides facilitate more balanced solvent distribution, increasing the contact area between the solvent and the trapped oil. A closer inspection of
Figure 14c reveals that the role of small branches in enhancing solvent distribution not only through the main channels but also widely into adjacent porous regions leads to the activation of additional areas for production. This result underscores the importance of wormhole networks, particularly in facilitating multidirectional solvent distribution and improving overall displacement efficiency.
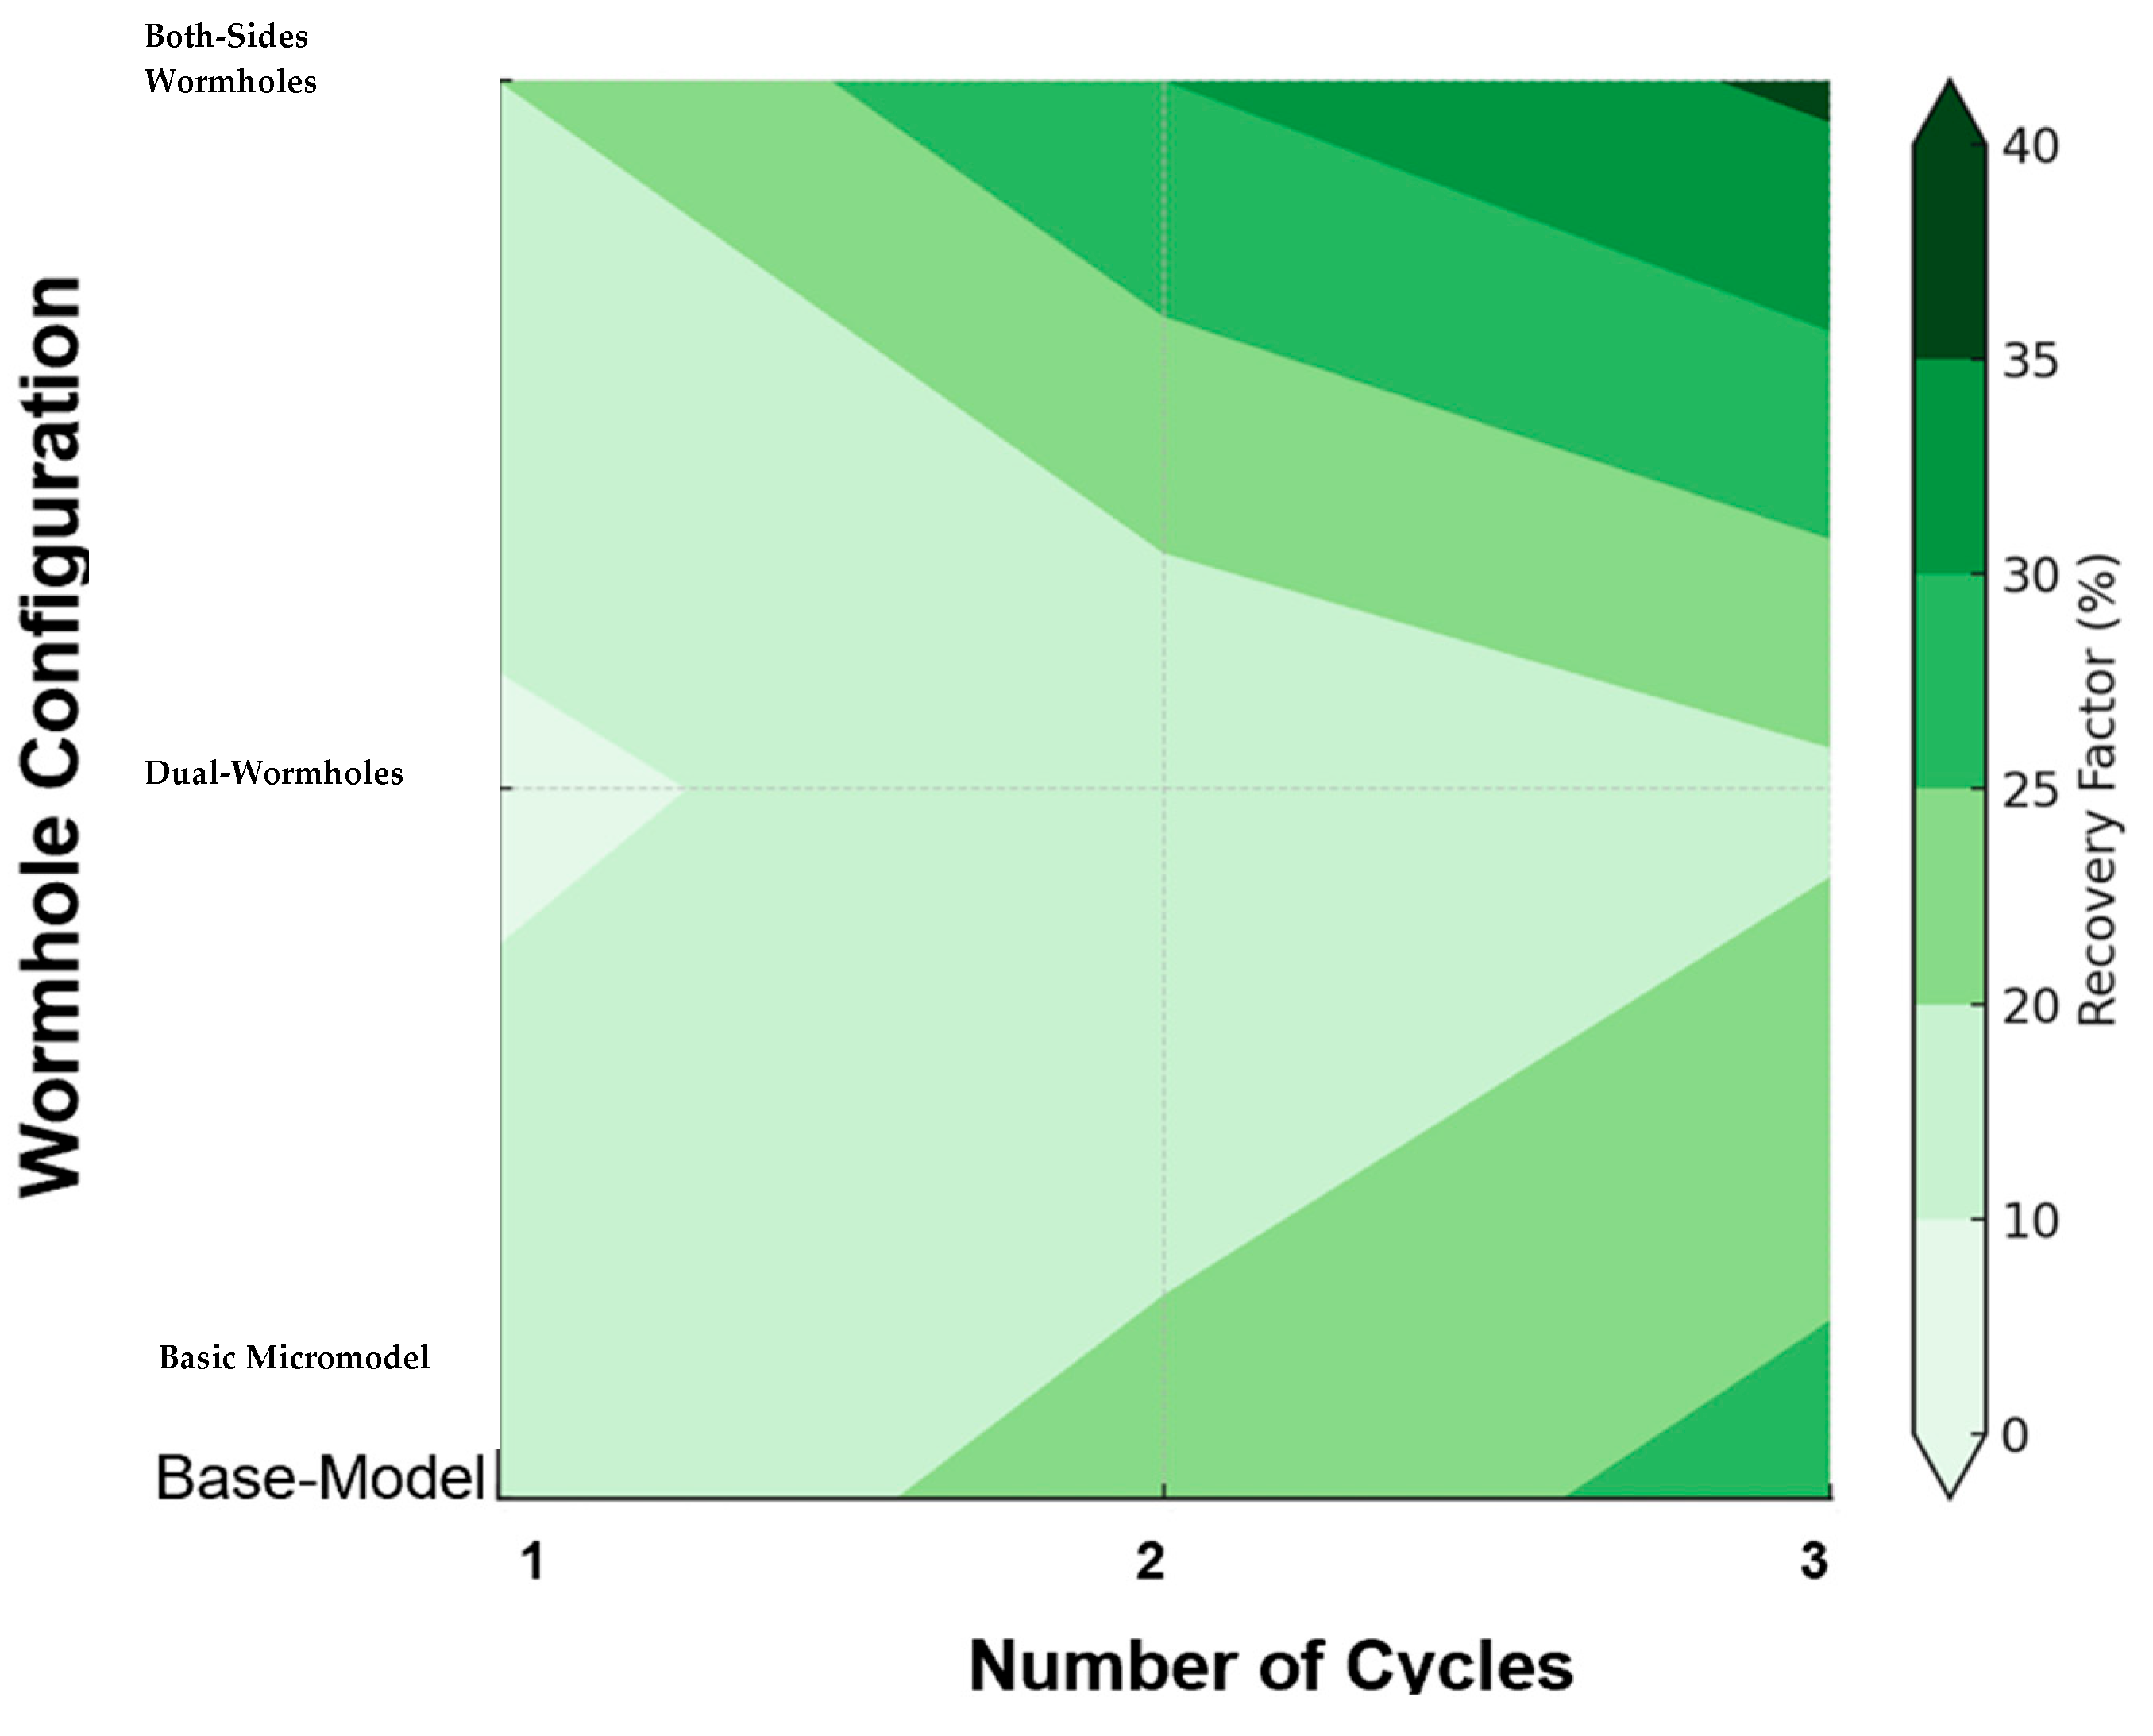
Figure 15 provides the color gradient graph depicting the recovery factor as a function of two critical parameters: (1) wormhole configuration and (2) the number of cycles for a better understanding. Darker green areas represent higher recovery percentages, while lighter green regions indicate lower recovery percentages, as indicated by the gradient color scale. The graph compares the results for different designs, including a symmetrical design using both-sides, an asymmetrical design using dual-wormhole micromodel, and a basic micromodel, which does not include any wormhole. Analyzing the graph based on the number of cycles reveals that this parameter has the most significant effect on the symmetrical design of the microfluidic system, as indicated by the concentration of a darker green color. The basic micromodel, featuring slightly darker green tones, was followed in later cycles. In contrast, the number of cycles had a minimal impact when the micromodel with the asymmetrical wormhole design was used with the lighter green shades.
From the wormhole configuration perspective, the symmetrical design contributed the most to oil production with its both-sides wormhole network. The basic micromodel also demonstrated a positive effect on oil recovery. On the other hand, the dual-wormhole micromodel (asymmetrical design) was ineffective and seemed to restrict oil production. These results indicate the crucial role that wormhole configuration plays in oil production. While the symmetrical design positively contributes to oil production by enhancing solvent distribution across the micromodel, the asymmetrical design could restrict solvent distribution to the same side as the wormhole, thereby impeding oil recovery. Comparing these two configurations to the basic micromodel highlights how different wormhole orientations can affect oil production behavior.


