Abstract
With the increasing complexity of mine ventilation networks, the difficulty of regulating ventilation systems has significantly increased. Lagging regulatory responses are prone to causing problems such as airflow turbulence and insufficient air supply in air-required areas, which seriously threaten the safety of underground operations. To address this challenge, this paper introduces the MOBWO algorithm into the field of ventilation system air volume optimization and proposes a mine air volume optimization and regulation method based on MOBWO. This paper constructs a multi-objective air volume optimization model with the total power of ventilators and the complexity of air pressure regulation as the optimization objectives. Using indicators such as GD and IGD, it compares the performance of the MOBWO algorithm with mainstream optimization algorithms such as NSGA-II and MOPSO and verifies the practicality of the optimization method with the case of the Jinhua Palace Mine. The results show that the MOBWO algorithm has significant advantages over other algorithms in terms of convergence and distribution performance. When applied to the Jinhua Palace Mine, the air volume optimization and regulation using MOBWO can reduce the power of ventilators by 10.3–21.1% compared with that before optimization while reducing the complexity of air volume regulation and the time loss during air volume regulation. This method not only reduces the energy consumption of ventilators but also shortens the regulation timeliness of the ventilation system, which is of great significance for reducing the probability of accidents and ensuring the safety of personnel’s lives and property.
1. Introduction
Failure of ventilation systems triggers wind flow instability and inadequate air supply in critical zones, directly leading to gas, dust, and other accidents. The number of deaths due to gas accidents and the number of deaths in coal mine accidents decreased from 33% from 2008 to 2020 [1] to 13.56% in 2021 [2] to 8.57% in 2022 [3]. Although this mortality rate has decreased annually, it remains a critical factor endangering coal mine safety. With the increasing number of coal mine roadways and the escalating complexity of ventilation networks, research on optimization algorithms for ventilation system airflow allocation is of great significance. This aims to mitigate accidents caused by insufficient airflow in air-required areas, which often results from changes in ventilation facilities and air network structures [4,5].
A large number of studies have been carried out on ventilation system airflow allocation, and a method for optimizing the air volume in a ventilation system is shown in Figure 1. Traditional methods used for ventilation network analysis include the graphical method [5,6,7], power simulation calculation method [8], and mathematical analysis method [9]. D. R. Scott and F. B. Hinsley proposed the Scott–Hinsley method based on an iterative algorithm of a water pipe network, which enables computer-aided analysis to analyze ventilation networks. Li Xiaofeng and Guo Hongtao et al. [10,11] enhanced the Scott–Hinsley method to accelerate optimizing ventilation networks, yet its inherent limitations still render it inadequate for complex network scenarios; Zhong Deyun et al. [12] further optimized the method by integrating loop airflow theory, aiming to improve the solving efficiency for complex networks, but its global performance still falls short of practical requirements. With the advancement of intelligent technology, intelligent algorithms have been gradually incorporated into airflow allocation research.
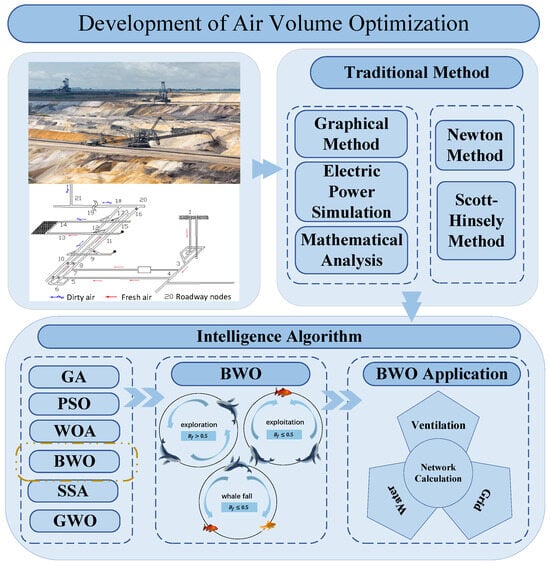
Figure 1.
Optimization method of ventilation system airflow.
Genetic algorithms (GAs) were first applied to the optimization of ventilation system airflows. I. S. Lowndes [13], Ku Xiangyang [14], and Zhao [15] utilized GAs to optimize mine ventilation network performance, aiming to regulate fan operation parameters and minimize energy costs; these studies achieved approximately a 3% reduction in total ventilation power, yet the algorithm’s low efficiency and slow convergence rendered it inadequate for real-time safety-critical applications; particle swarm algorithms were used in the optimization of mine ventilation networks, but the overall efficiency of this algorithm still cannot meet the needs of safe production demands; the particle swarm algorithm (PSO) is widely used in mine air volume allocation, and Guo [16] and Zhang [17] addressed PSO’s tendency to converge to local optima by introducing modified variants, demonstrating superiority over traditional PSO in nonlinear airflow allocation. However, convergence speed remained a bottleneck; Chen [18] proposed a neighborhood mobility strategy based on small habitat theory, achieving performance gains through comprehensive curve fitting and time complexity analysis. Nevertheless, excessive parameter tuning requirements limited practicality. Zhang [19], Ge [20], Song J [21], and Liang [22] improved the PSO; the total ventilation power was reduced compared with the pre-optimization power requirements, but the shortcomings of the PSO with more input parameters and setup methods were improved.
The development of meta-heuristic algorithms brings more possibilities for airflow distribution optimization algorithms. Gao [23] introduced the colony optimization (ACO) to solve the optimization problem of ventilation systems and verified its feasibility by using examples; however, the ACO algorithm is not suitable for increasingly complex ventilation systems. Zhang et al. [24,25] improved the grey wolf optimization algorithm for the shortcomings in the solution process to obtain an airflow optimization scheme, but a better improvement strategy is needed for the optimization of complex problems. Wang [26] improved the shortcomings of the Wu Tern optimization algorithm, and the total energy consumption of the ventilation system was finally reduced by 35.06%, but a better improvement strategy is still needed to improve the optimization effect further. Recent efforts by Xu, Liu [27,28], Yu [29], and Han [30] to enhance the whale, pigeon flock, and sparrow optimization algorithms showed marginal improvements, but these methods still struggle to meet the demands of modern, intricate ventilation networks. In summary, the genetic algorithm suffers from low global search efficiency, particle swarm optimization is prone to local optimal solutions and has complex parameter settings, the ant colony algorithm has insufficient adaptability, and the grey wolf algorithm exhibits poor robustness. These defects all negatively impact the air volume optimization efficiency of ventilation systems, failing to meet the practical needs of complex ventilation networks. Therefore, there is an urgent need to explore optimization algorithms with better algorithm efficiency and stronger dynamic adaptability to effectively address this issue.
Traditional airflow optimization often relies on single-objective frameworks, overlooking interdisciplinary impacts. Single-objective approaches primarily focus on two conflicting goals: minimizing ventilator energy consumption or maximizing airflow regulation in critical branches. Guo [16], Zhang Zhaolong [19], and Song J [22] used an improved PSO algorithm, and Wang [26] used the improved Wu Tern algorithm to carry out airflow optimization with the minimization of the ventilator’s energy consumption as the optimization objective, and although the energy consumption of the ventilation fan had a more obvious effect, the effect of the air demand on the airflow optimization was not considered. Zhang Zhichao et al. [24,25] used the improved grey wolf algorithm, Xu [27] used the improved whale algorithm, and Yu [29] used the improved pigeon flock algorithm to maximize the regulation of air-demanding branches as the optimization objective for airflow optimization, yet this approach caused energy waste due to overlooked power consumption. To address these trade-offs, research has shifted toward multi-objective optimization. Ge [20] integrated ventilation costs, equipment adjustment expenses, and downtime losses, but this economics-focused model ignored operational complexity. Li et al. [31] set the total ventilation power as the optimization objective while considering the maximum air demand, although this approach introduced safety considerations, but the impact of air-demanding branches was not considered.
Despite extensive research on airflow optimization, existing studies exhibit two critical limitations: (1) multi-objective optimization algorithms require further performance enhancement; and (2) the optimization objectives remain insufficiently comprehensive to derive optimal regulation schemes. In this paper, the following work is carried out to address the above shortcomings: (1) an algorithm is chosen and improved for multi-objective optimization; (2) the total energy consumption of the ventilation and the complexity of the air pressure regulation are taken as the air volume optimization objectives to construct the air volume optimization model; and (3) the air volume optimization model is combined with the multi-objective optimization algorithm to obtain a more comprehensive air volume optimization mediation scheme.
Based on the assumption that the natural pressure effect is ignored and that steady-state airflow is ignored, this manuscript proposes a mine airflow optimization mediation method based on the MOBWO algorithm, and the structure of this article is arranged as follows. First, the data sources are introduced and analyzed to establish the research foundation. Again, the most suitable multi-objective optimization algorithm is selected by comparing the optimization performance of five multi-objective optimization algorithms, including NSGA-II, MOPSO, MOALO, MOGOA, and MOGWO, and the airflow optimization model is used as the objective function to carry out the optimization process of airflow regulation. Finally, the feasibility of the mine airflow optimization and regulation method in this paper is verified.
2. Data Preparation with Air Volume Regulation
2.1. Data Source
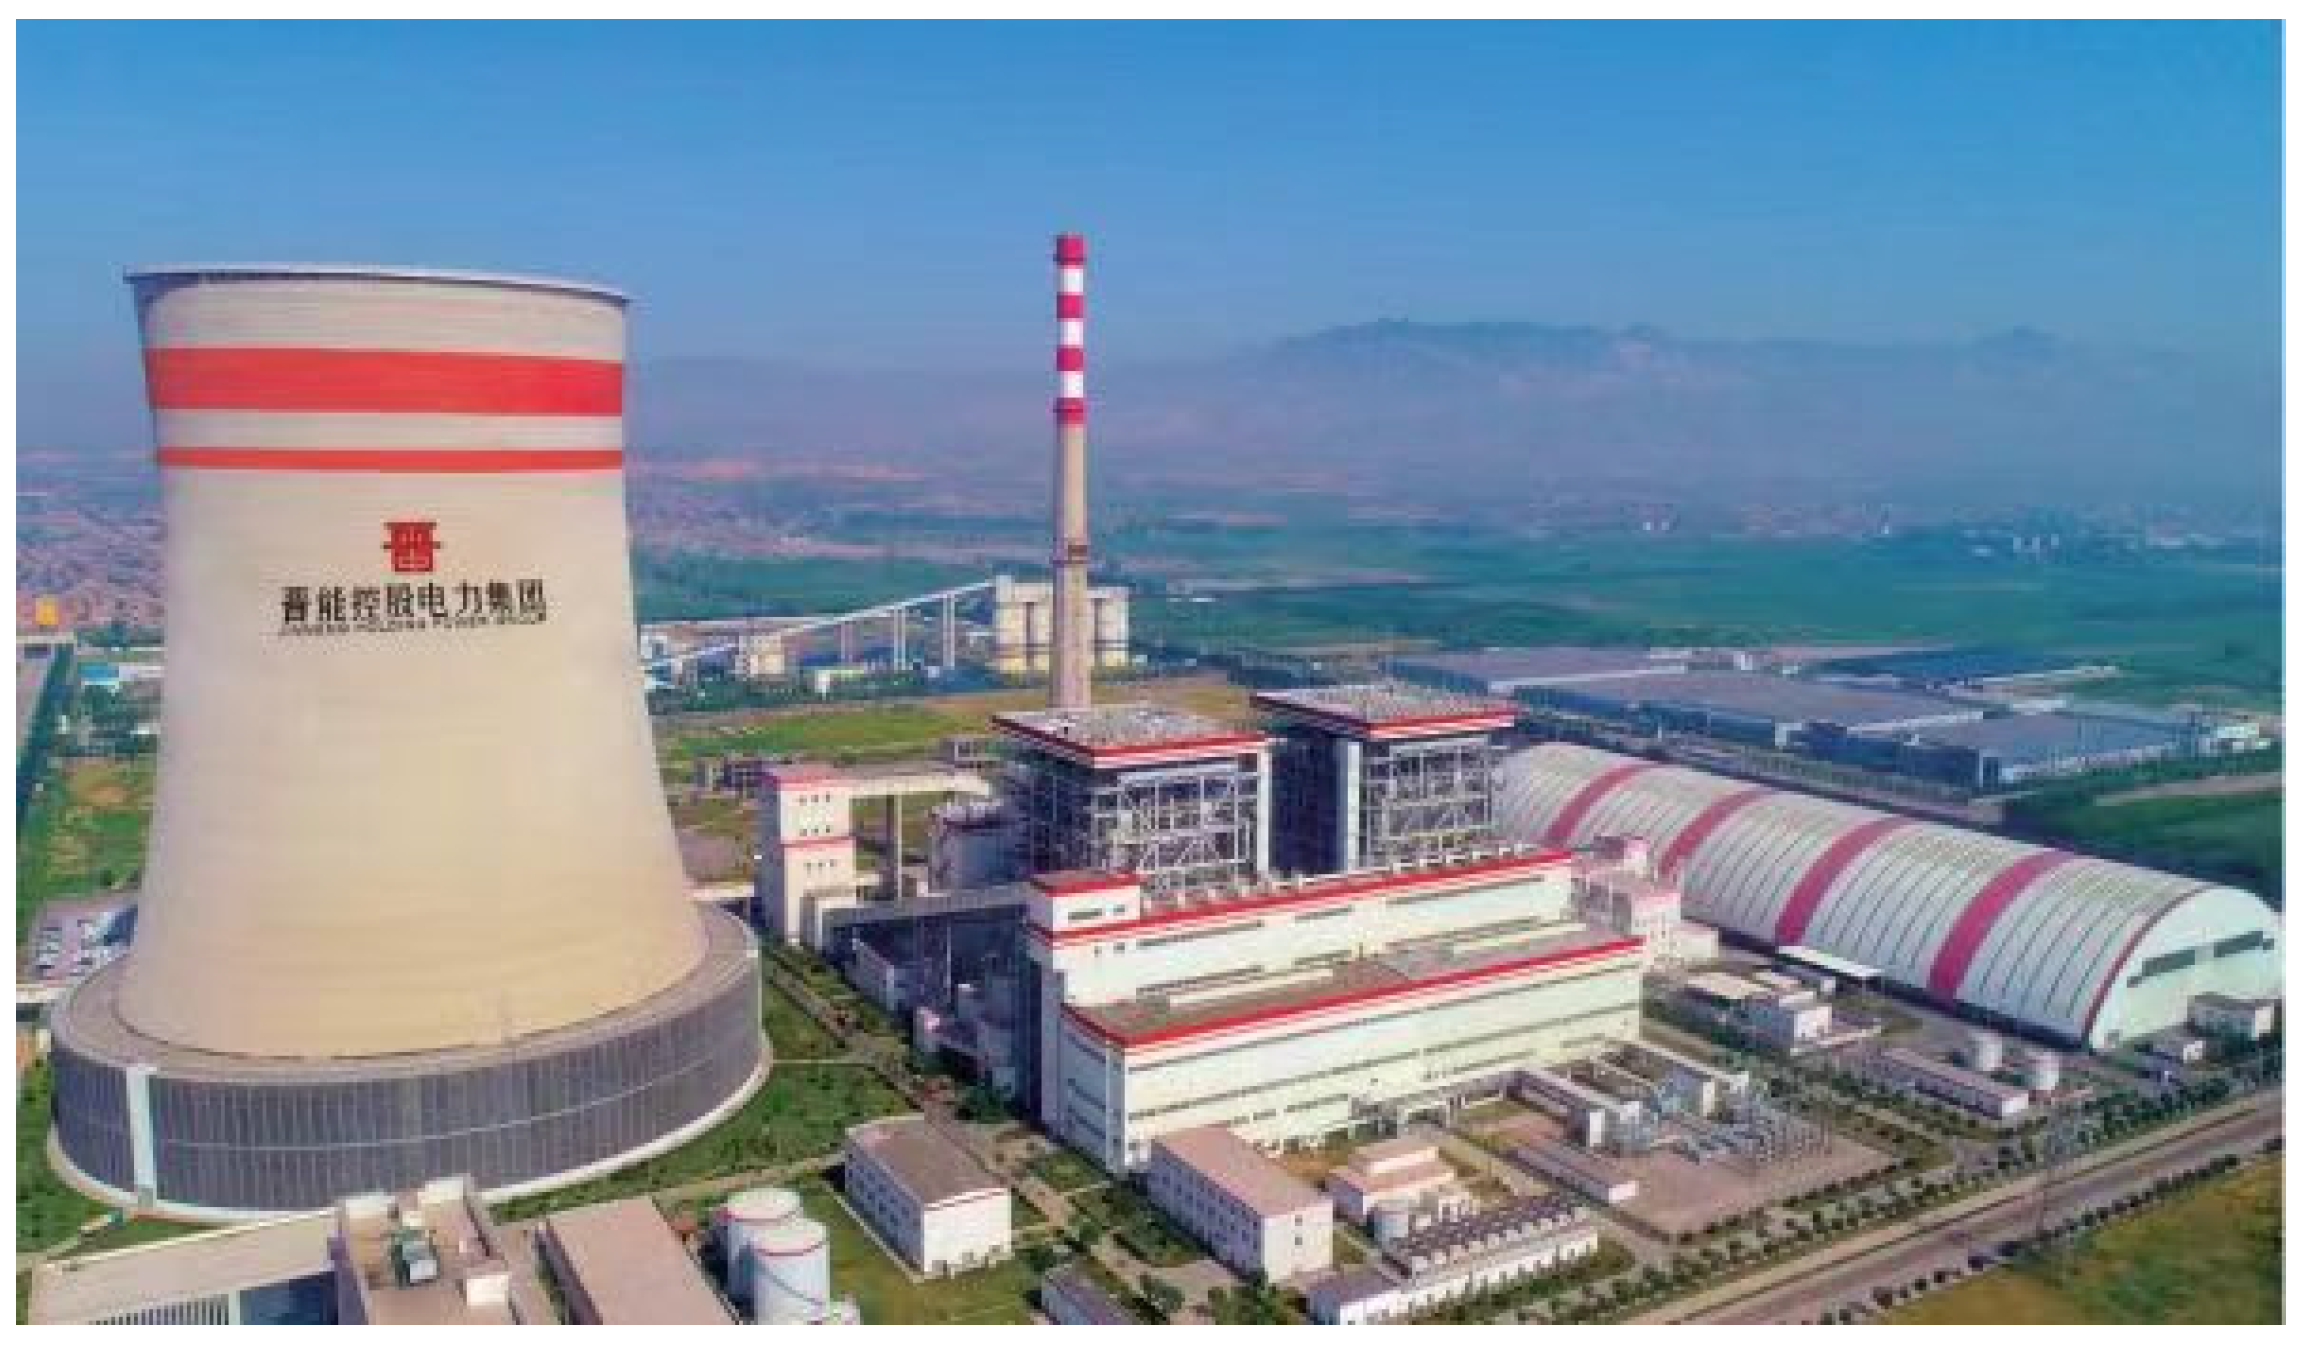
This paper adopts the Mayinggou air shaft of the Jinhuagong Mine as the research case. The mine is located 12.5 km west of Datong City, Shanxi Province, at the northeastern margin of the Datong Coal Field and under the jurisdiction of Datong’s southern suburb. The actual layout of the Jinhuagong Mine is shown in Figure 2. The mine employs a hybrid development system combining the main inclined shafts and auxiliary vertical shafts, with the method of longwall sub-inclined fully mechanized mining under caving as the coal extraction technique. As a high-gas mine, it adopts mixed zonal exhaust ventilation. The shaft is equipped with two identical ventilators (one in operation, one on standby) serving two working faces (8202 and 8206) and one shaft yard, comprising 32 roadway junctions and 46 roadways in total. To obtain the validation data, comprehensive resistance measurements were conducted for the Mayinggou air shaft.

Figure 2.
Site map of Tongxin Coal Mine.
When measuring the ventilation resistance, the measurement route was divided into the 8202 route and 8206 route. The 8202 route is as follows: Mayinggou air inlet sub-shaft → air inlet sub-shaft → sub-shaft and dispatching station connecting lane → 9# layer 402 disk area railroad track lane air inlet lane → 9# layer 402 disk area railroad track lane → liaison lane → 8202 working face air inlet trench → 8202 working face → 8202 working face return air trench → 8202 working face wind back roundabout → wind back lane → Mayinggou wind back inclined shaft → Mayinggou wind back inclined shaft.
The 8206 route is as follows: Mayinggou wind inlet main shaft → shaft bottom car park → 12# layer 402 disk area railroad track → 12# layer 402 disk area railroad track → 12# layer 402 disk area railroad track → 12# layer 402 disk area railroad track → 12# layer 402 disk area railroad track → 12# layer 402 disk area railroad track → liaison lane → 8206 working face wind inlet tunnels → 8206 working face → 8206 working face return wind trench→8206 working face return wind bypass→12# layer 402 disk area return wind alley → Mayinggou return wind inclined shaft → Mayinggou return wind inclined shaft → Mayinggou return wind inclined shaft → Mayinggou return wind inclined shaft.
2.2. Data Analysis
The ventilation resistance of the Mayinggou air shaft was measured using the barometer base-point method, which involves testing parameters such as the atmospheric pressure variation at the shaft base point, absolute static pressure, point wind speed, dry and wet bulb temperature at measuring points, wind speed of each roadway branch, and geometric dimensions of roadway sections along the measurement line. The ventilation resistance of each roadway is calculated as per Equation (1).
where , —determination of barometer correction coefficient; , —the basis point correction barometer is used to determine the barometer reading, and the measured value of the readings is , , ; , —on the upper and lower wind measurement point readings, ; , —measurement section before and after the measurement point air density, ; , —wind speed before and after the measurement point, ; —acceleration of gravity, ; and , —measurement of the section before and after the measurement point elevation, m.
The analytical results show that the mine’s intake–return airway ratio is optimally balanced, with the ventilation resistance distribution demonstrating uniformity and rationality. The Mayinggou air shaft has a total air intake of 3867 , a total return air volume of 3950 , and effective air volume rate of 3480 , and an effective air volume rate of 90%. The mine zoning isotropic holes are calculated as per Equation (2).
where —isometric holes, ; —the total return air volume of the mine, ; and —the total wind pressure of the mine, .
The Mayinggou air shaft isometric hole is 4.6 , which is greater than 2 , and the degree of ventilation difficulty is “easy”.
3. Air Volume Optimization Model Based on MOBWO
3.1. MOBWO Algorithm
3.1.1. Principle of BWO
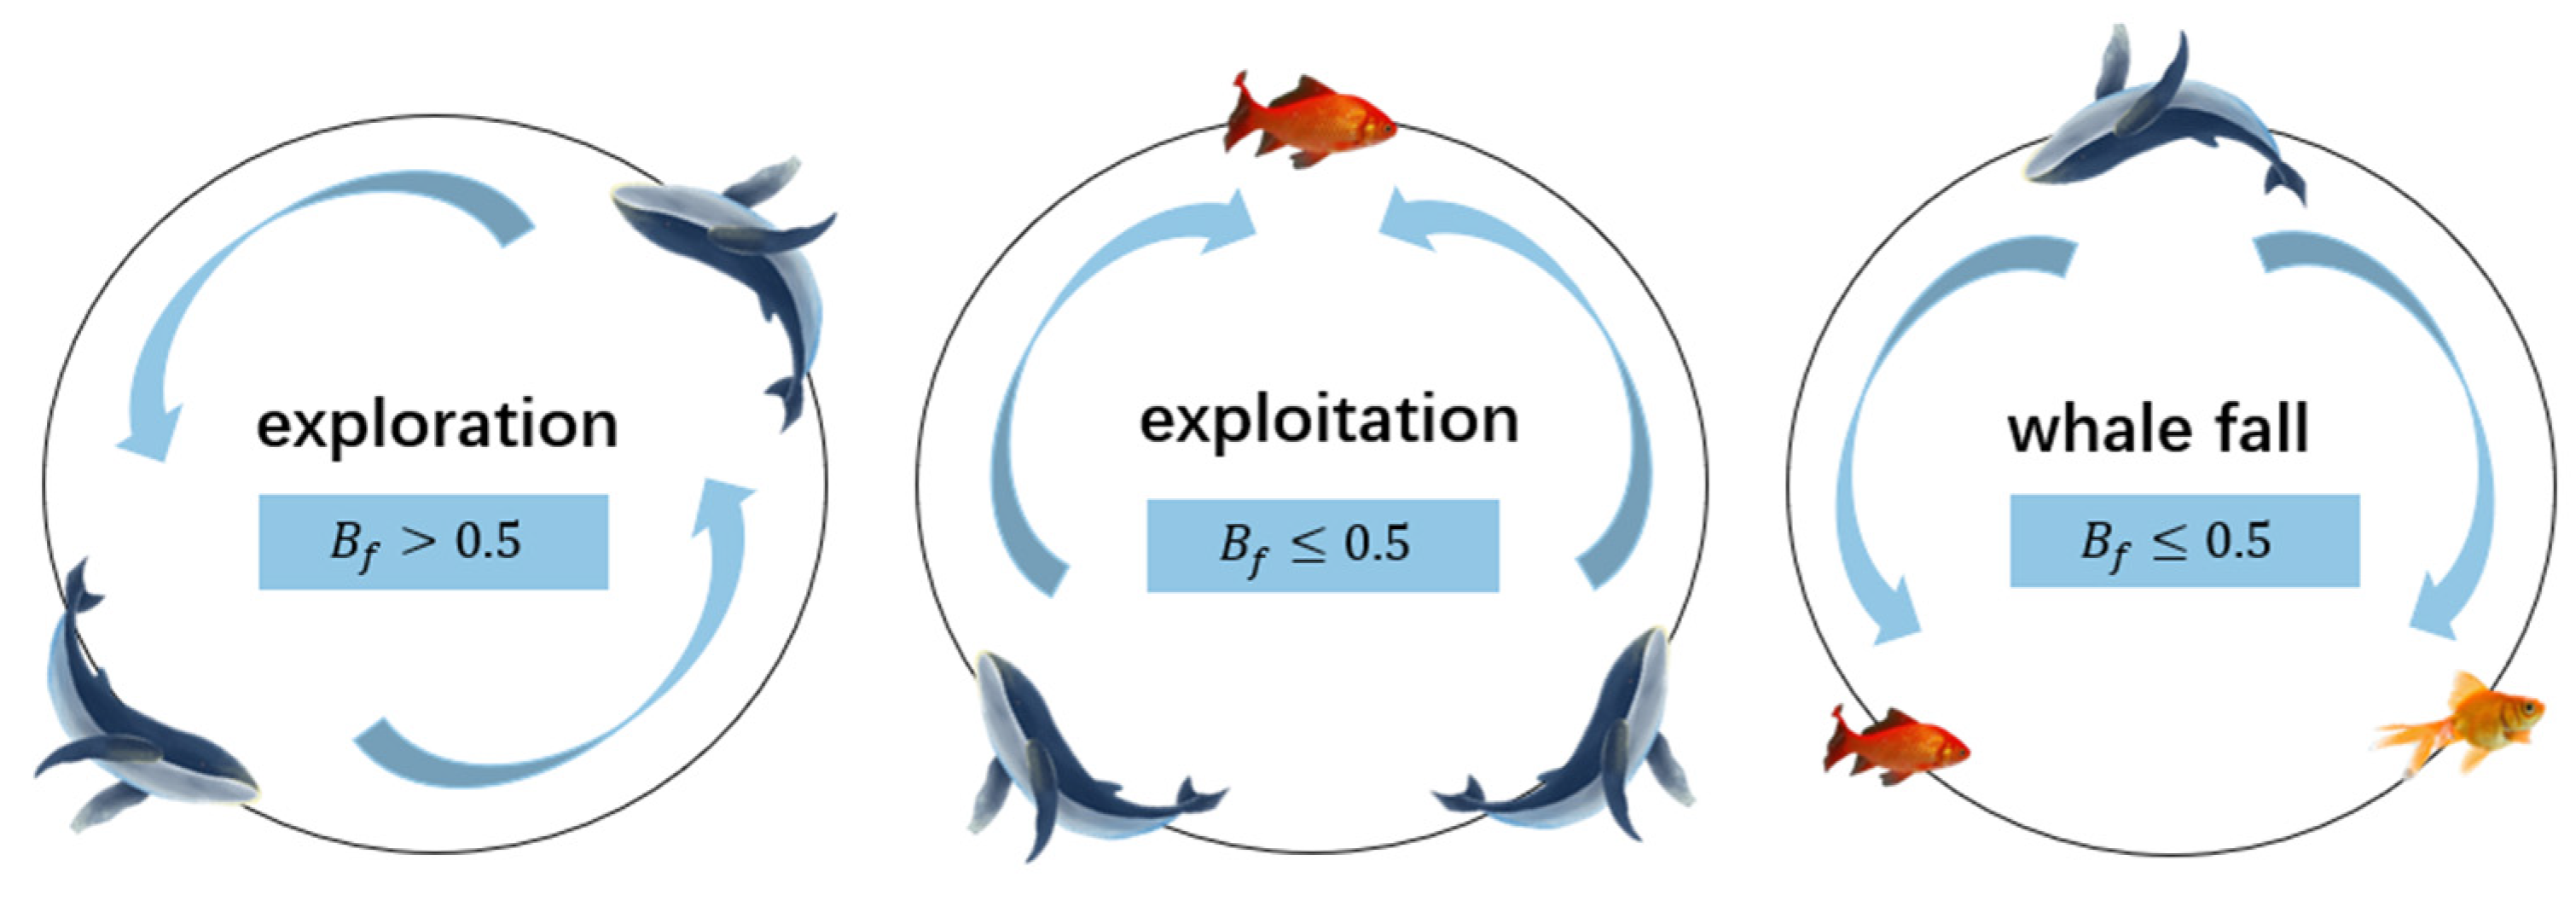
Beluga whale optimization (BWO) is a meta-heuristic algorithm proposed in 2022 to mimic the lifestyle of beluga whales [32]. The algorithm includes an exploration phase, a development phase, and a whale fall phase, as shown in Figure 3.
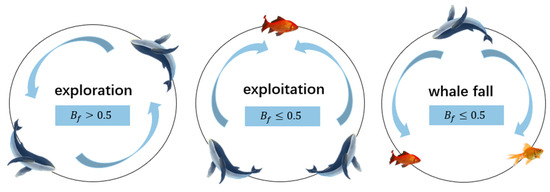
Figure 3.
Schematic diagram of BWO.
(1) Exploration phase
The position of the search agent in the exploration phase is determined by the swimming of a pair of beluga whales, and the position of the beluga whales is updated as per Equation (3):
where t—current number of iterations; —new position of the ith beluga whale in dimension ; —randomly selected from dimension ; , —current positions of the i-th beluga whale and the r-th beluga whale; , —generated random numbers for augmenting the stochastic operator in the exploration phase; and , —random numbers for averaging in the fins based on odd–even dimension selection; the updated positions emulate the synchronized or mirrored behaviors of beluga whales during swimming and diving maneuvers.
(2) Exploitation phase
The exploitation phase of BWO incorporates a Levy flight strategy to enhance convergence performance, with its mathematical model expressed as:
where , —the current position of the ith beluga whale and a random beluga whale; —the new position of the beluga whale; —the best position of the beluga whale; , — random numbers from 0 to 1; and —measurement of the random jump intensity of the Levy flight intensity.
is the Levy flight function, which is calculated as follows:
where μ, ϑ—normally distributed random numbers; and β—default constant equal to 1.5.
(3) Whale fall stage
To maintain a constant population size, the BWO algorithm establishes updated positions by integrating beluga whale positions and whale fall step sizes. The corresponding mathematical model is expressed as per Equation (7):
where , , —random numbers between 0 and 1; and —the step size of the whale fall, determined as:
where —step size factor () related to the probability of a whale fall and the population size; and , —upper and lower bounds for the variables. The step size is affected by the bounds on the design variables, the number of iterations, and the maximum number of iterations.
The probability of a whale fall () is calculated as a linear function:
As the number of iterations increases, the whale fall probability monotonically decreases from 0.05 to 0.1, reflecting the biological analogy that beluga whales face lower risks when approaching food sources during optimization searches.
3.1.2. Principle of MOBWO
Given the BWO algorithm’s fast convergence speed and strong global search capability, it was enhanced into a multi-objective beluga whale optimization (MOBWO) algorithm to address multi-objective optimization problems [33,34].
The MOBWO algorithm enhances the BWO algorithm by integrating non-dominated sorting and crowding sorting mechanisms. After the fitness value computation, non-dominated sorting is first applied to the solution set to derive the Pareto-optimal front, which is continuously maintained as the elite non-dominated archive. To ensure archive size constraints, when the non-dominated solutions exceed the specified limit, crowding sorting is performed to evaluate the solution distribution. Solutions with lower crowding distances are pruned, forming a new diverse non-dominated set. The pseudocode run by the MOBWO algorithm is shown in Table 1.

Table 1.
The pseudocode run by the MOBWO algorithm.
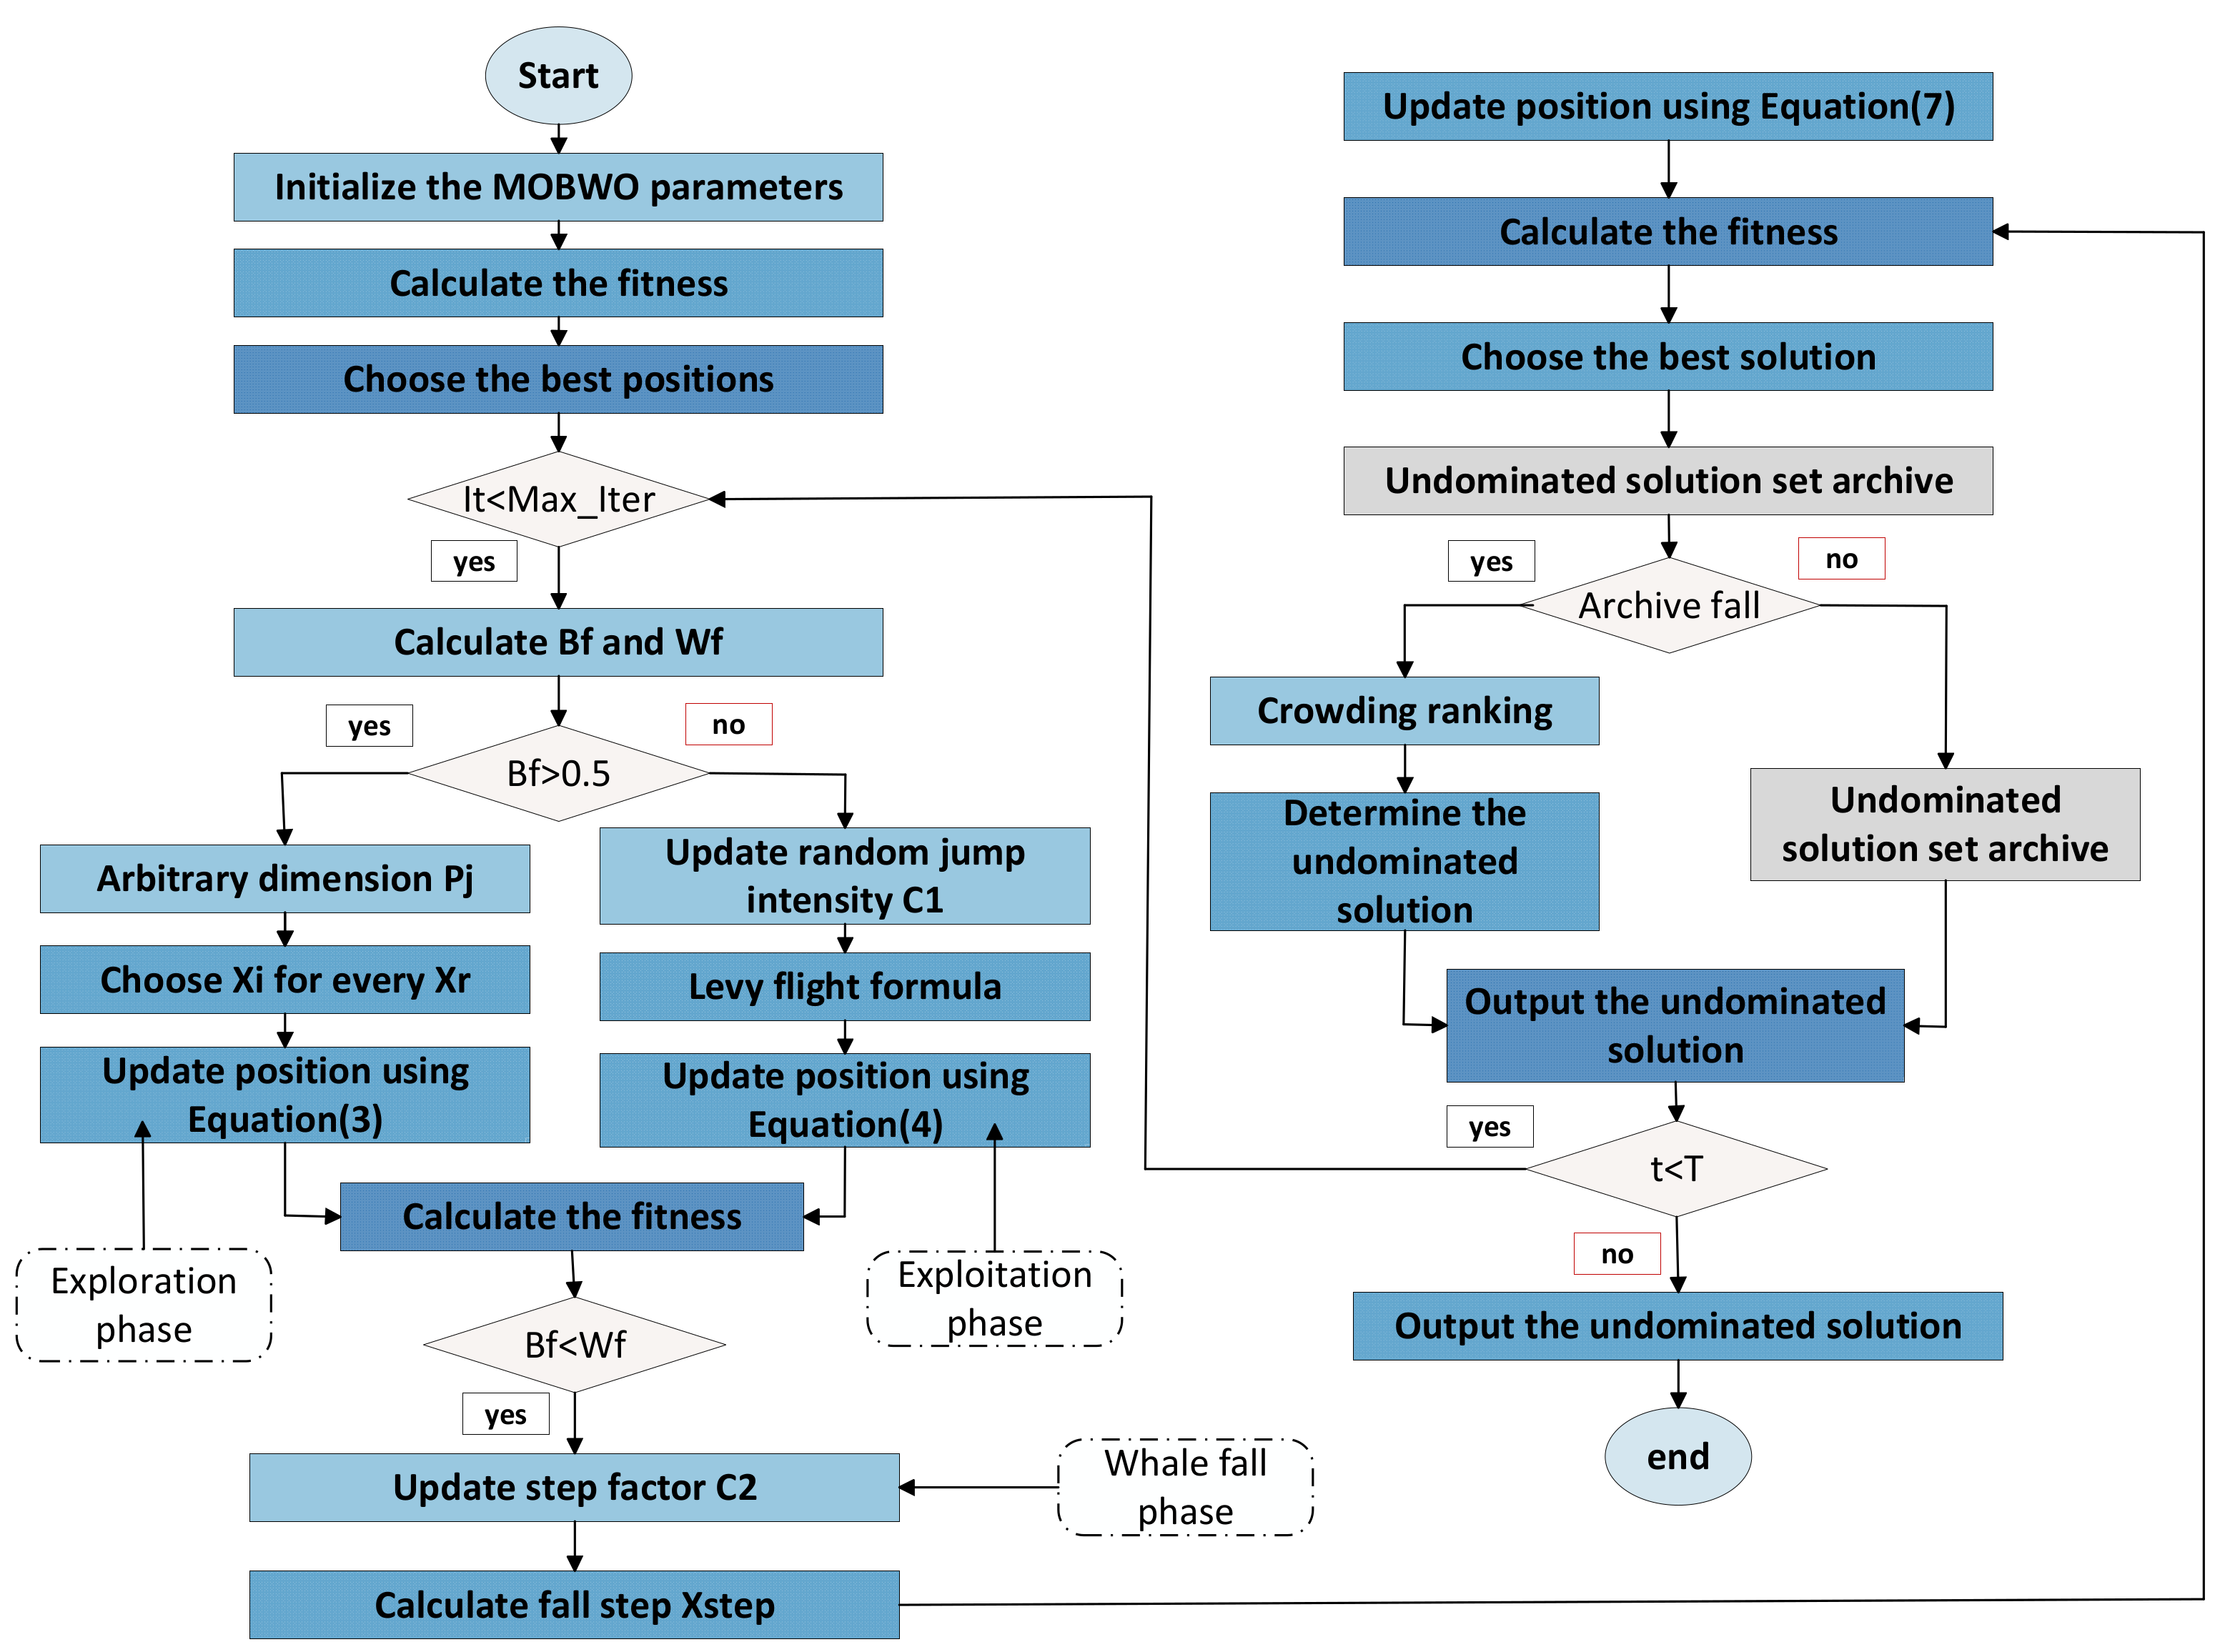
The specific steps of the solution flow of the MOBWO algorithm are shown in Figure 4.

Figure 4.
MOBWO optimization flow chart.
Step 1: The size of the beluga whale population N and the maximum number of iterations T are set, the population, is initialized, and the fitness value is calculated according to the population.
Step 2: The adaptability results are sorted by non-dominated ordering, and the best non-dominated solution is selected as the optimal position of the beluga whales.
Step 3: The algorithm enters the main loop and calculates the parameters and . If > 0.5, the algorithm proceeds to the exploration phase and uses Equation (3) for the beluga whale position update; otherwise, the algorithm proceeds to the exploitation phase and uses Equation (4) for the beluga whale position update. The fitness is recalculated after performing the position update.
Step 4: The algorithm determines whether is less than ; if it is valid, then the algorithm proceeds to the whale fall phase and uses Equation (7) to perform the update of beluga whale position, and it then recalculates the fitness.
Step 5: After obtaining the value of the fitness, non-dominated sorting is performed, and the non-dominated solution is archived.
Step 6: The algorithm determines whether the archive reaches the maximum capacity; if not, then the non-dominated solutions are directly archived; if the maximum capacity is reached, the non-dominated solutions are sorted by the degree of crowding, and the set of non-dominated solutions in the archive is updated.
Step 7: The algorithm determines whether the maximum number of iterations is reached; if it is reached, then the set of non-dominated solutions is directly output to complete the optimization process; if it is not reached yet, then the algorithm enters the next iteration and proceeds to Step (3).
3.2. Air Volume Optimization Model
3.2.1. Mathematical Expression of Ventilation Network
Matrix representations are widely employed in mine ventilation network analysis to model node–branch relationships, leveraging matrix properties and operations to explore graph-theoretical structural characteristics [35,36]. Commonly used matrix types include the basic incidence matrix, the independent loop matrix, and the cut-set matrix.
(1) Basic association matrix
The ventilation network has m nodes and n branches. The basic correlation matrix represents the relationship between points and branches, where the matrix is an order matrix where the following is applied:
(2) Independent circuit matrix
The number of independent loops of the ventilation network is , and the independent loop matrix is an order matrix where the following is applied:
(3) Cut-set matrix
The number of cut-sets of the ventilation network is , and the cut-set matrix is a order matrix where the following is applied:
3.2.2. Basic Laws of Ventilation
(1) Law of ventilation resistance
The ventilation resistance of any branch in a ventilation network is defined as the product of the branch’s air resistance and the square of its airflow volume. Concurrently, the ventilation pressure of the branch equals the ventilation resistance in magnitude but acts in the opposite direction.
where —branch wind pressure, Pa; —branch wind resistance, ; and —branch wind resistance, .
(2) Nodal wind balance law
In a ventilation network at any instant, the total airflow volume entering any node is equal to the total airflow volume exiting that node. Its formula expression is as follows:
where —neighborhood matrix of the ventilation network.
(3) Loop air pressure balance law
In any circuit of a ventilation network at any instant, after defining the positive direction of circulation, the algebraic sum of the ventilation pressures within the circuit equals zero. This is mathematically expressed as follows:
where —natural wind pressure in the circuit, Pa; and —ventilator wind pressure in the circuit, Pa. Since the influence of natural wind pressure is small, it is ignored.
3.2.3. Optimization Target of Air Volume
To ensure sufficient airflow at air-demanding locations, minimize ventilation costs, and simplify airflow optimization complexity, the optimization model incorporates branch air pressure adjustments as a critical factor while prioritizing ventilator cost considerations.
(1) Ventilator operation cost
The economic efficiency of a ventilation system is primarily reflected in the ventilator’s operating power, which constitutes a significant proportion of the system’s total operational costs. In this study, the ventilator’s operating power is designated as a core objective in the airflow optimization framework, and the mathematical model is shown in Equation (16):
where —the number of ventilators in the ventilation network; —the operating air pressure of the fan, Pa; and —the air volume of the fan branch, .
(2) Air volume optimization complexity
The complexity of airflow optimization is embodied in the branch air pressure adjustments. Traditionally, the optimization objective is defined as the sum of the absolute values of the adjustments for all adjustable branches, but this approach inherently increases the optimization complexity. To address this, the airflow optimization framework incorporates the air pressure equilibrium law and pathway regulator method to simplify the objectives. According to the principle of the pathway method [37], in each pathway, if containing a ventilator, the algebraic sum of the branch ventilation pressures equals the ventilator pressure; if ventilator-free, the sum of the branch ventilation pressures is zero. The air pressure regulation expression for each remaining branch is shown in Equation (17):
where —the amount of air pressure regulation in the remaining branches in the i-th pathway, Pa; —the matrix of independent circuits of the ventilation network; —the branch air resistance, ; —the branch air volume, ; the number of ventilators in the pathway; and —ventilator air pressure, Pa.
In this paper, the airflow optimization takes the sum of the air pressure regulation in the remaining branches as one of the optimization objectives of the airflow optimization, and its mathematical model is as follows:
3.2.4. Air Volume Optimization Constraints
The adjustable constraint ranges for the airflow volume and air pressure of each ventilation network branch are specified by the following equations:
To ensure the ventilator’s normal operation, its operating pressure must not exceed 90% of the maximum rated pressure, and the operating power must not be lower than 60% of the rated power, which is expressed as:
3.3. Model Foundation
The mathematical model of the airflow optimization consists of the total ventilator energy consumption and the air pressure balance law, and the solution space is a high-latitude nonlinear planning problem in the dimensional space composed of the branch airflow and ventilator air pressure. If the ventilation network is complex, the solution is more difficult [25].
From the knowledge of graph theory, the ventilation network with nodes and branches can be divided into residual branches . In the residual branches, there are residual branches with a known air capacity (, , ……, ) and residual branches with an unknown air capacity (, , ……, ); the air volume of any branch in the ventilation network can be expressed by Equation (23):
Since the (, , ……, ) air volume is known, then is constant. At this time, the unknown quantity in the mathematical model is only the (, , ……, ) air volume, so the unknown quantity in the optimization model is reduced from to , which greatly reduces the complexity of the air volume optimization.
This study formulates a multi-objective optimization model by designating the ventilator operating cost and pressure regulation complexity as dual objectives, with constraints encompassing branch airflow pressure limits and ventilator operating pressure efficiency bounds. The optimization model is mathematically expressed in Equation (24):
In summary, the steps of the optimization and regulation method of the mine’s airflow based on MOBWO are as follows:
(1) Data collection
This study takes the Mayinggou air shaft as the research object. The ventilation system of this coal mine is a complex network comprising 32 roadway nodes and 46 roadway branches, conforming to the graph theory representation of ventilation networks. The key air-demanding branches are located in the 8202 and 8206 working faces, with required air volumes of 23 m3/s and 35 m3/s, respectively, which meet the safety standards for gas dilution and heat dissipation.
(2) Ventilation network drawing
By leveraging the principles of graph theory, the ventilation system layout is abstracted into a topological ventilation network graph, thereby enabling systematic modeling for subsequent research analyses.
(3) Optimization model foundation
In this paper, the law of the air volume balance, the law of the nodal air pressure balance, and the law of the ventilation resistance are used as the optimization model foundations. On the basis of taking the energy consumption of the ventilator as the optimization objective, the air pressure regulation complexity is considered too, and the air volume optimization model is constructed with the constraints of the branch air pressure, air volume limitation, and air pressure and energy consumption of the ventilator.
(4) Multi-objective algorithm comparison
The ZDT test function suite is adopted as the benchmark problem, with the optimization performance evaluated by metrics including GD, IGD, Spacing, and Spread. The MOBWO algorithm is compared with normal methods, including MOALO, MOGOA, MOGWO, NSGA-II, and MOPSO. Comprehensive comparative analyses reveal that MOBWO outperformed the other algorithms in the multi-objective optimization scenarios, demonstrating superior convergence accuracy and solution diversity.
(5) Real-life example
The collected field data serve as a case study for validating the MOBWO-based optimization method proposed in this paper.
4. Performance Comparison of MOBWO
4.1. Evaluation Index
4.1.1. Benchmark Test Function
Multi-objective optimization algorithms necessitate benchmark test functions to systematically evaluate their performance. These functions are designed to encapsulate the fundamental characteristics of real-world multi-objective problems, including solution diversity, decision space dimensionality, and the non-convexity of the Pareto front [38,39].
In 2000, Zitzler proposed the ZDT test function set [40], which is one of the most widely used sets for multi-objective test functions. The ZDT test function set is an important tool for evaluating the performance of a multi-objective optimization function. Comprising dual-objective problems with known optimal Pareto fronts, this suite offers flexible decision variable dimensions, making it suitable for diverse algorithmic evaluations. The ZDT1-4 functions are specifically shown in Equations (25)–(28):
4.1.2. Optimization Performance Evaluation Index
Evaluating the effectiveness of multi-objective optimization is inherently more complex than single-objective problems. To systematically quantify optimization performance, this study employs three benchmark metrics: Generational Distance (GD), Spacing, and Inverted Generational Distance (IGD) [41,42,43,44].
Spacing and Spread are metrics used to measure the distribution of the set of solutions generated by an algorithm. Spacing measures the minimum Euclidean distance between all solutions, while Spread measures the maximum Euclidean distance between all solutions.
where —the distance from the point to the solution set ; and —the average distance from the point to the solution set .
GD and IGD are metrics used to measure the distance between the set of solutions generated by the algorithm and the true frontier solutions; GD measures the average Euclidean distance between all generated solutions and the true frontier solutions, as per Equation (30), while IGD measures the average Euclidean distance between all true frontier solutions and the generated solutions, as per Equation (31).
where —the solution set obtained by the algorithm; and —the Euclidean distance between point y in the solution set and point in the reference set .
where —the number of non-dominated solutions in a subset of the true Pareto front solution set of the multi-objective optimization problem; —the minimum Euclidean distance between the non-dominated solution in a subset of the true Pareto front solution set and the non-dominated solution in .
4.2. Comparison Result
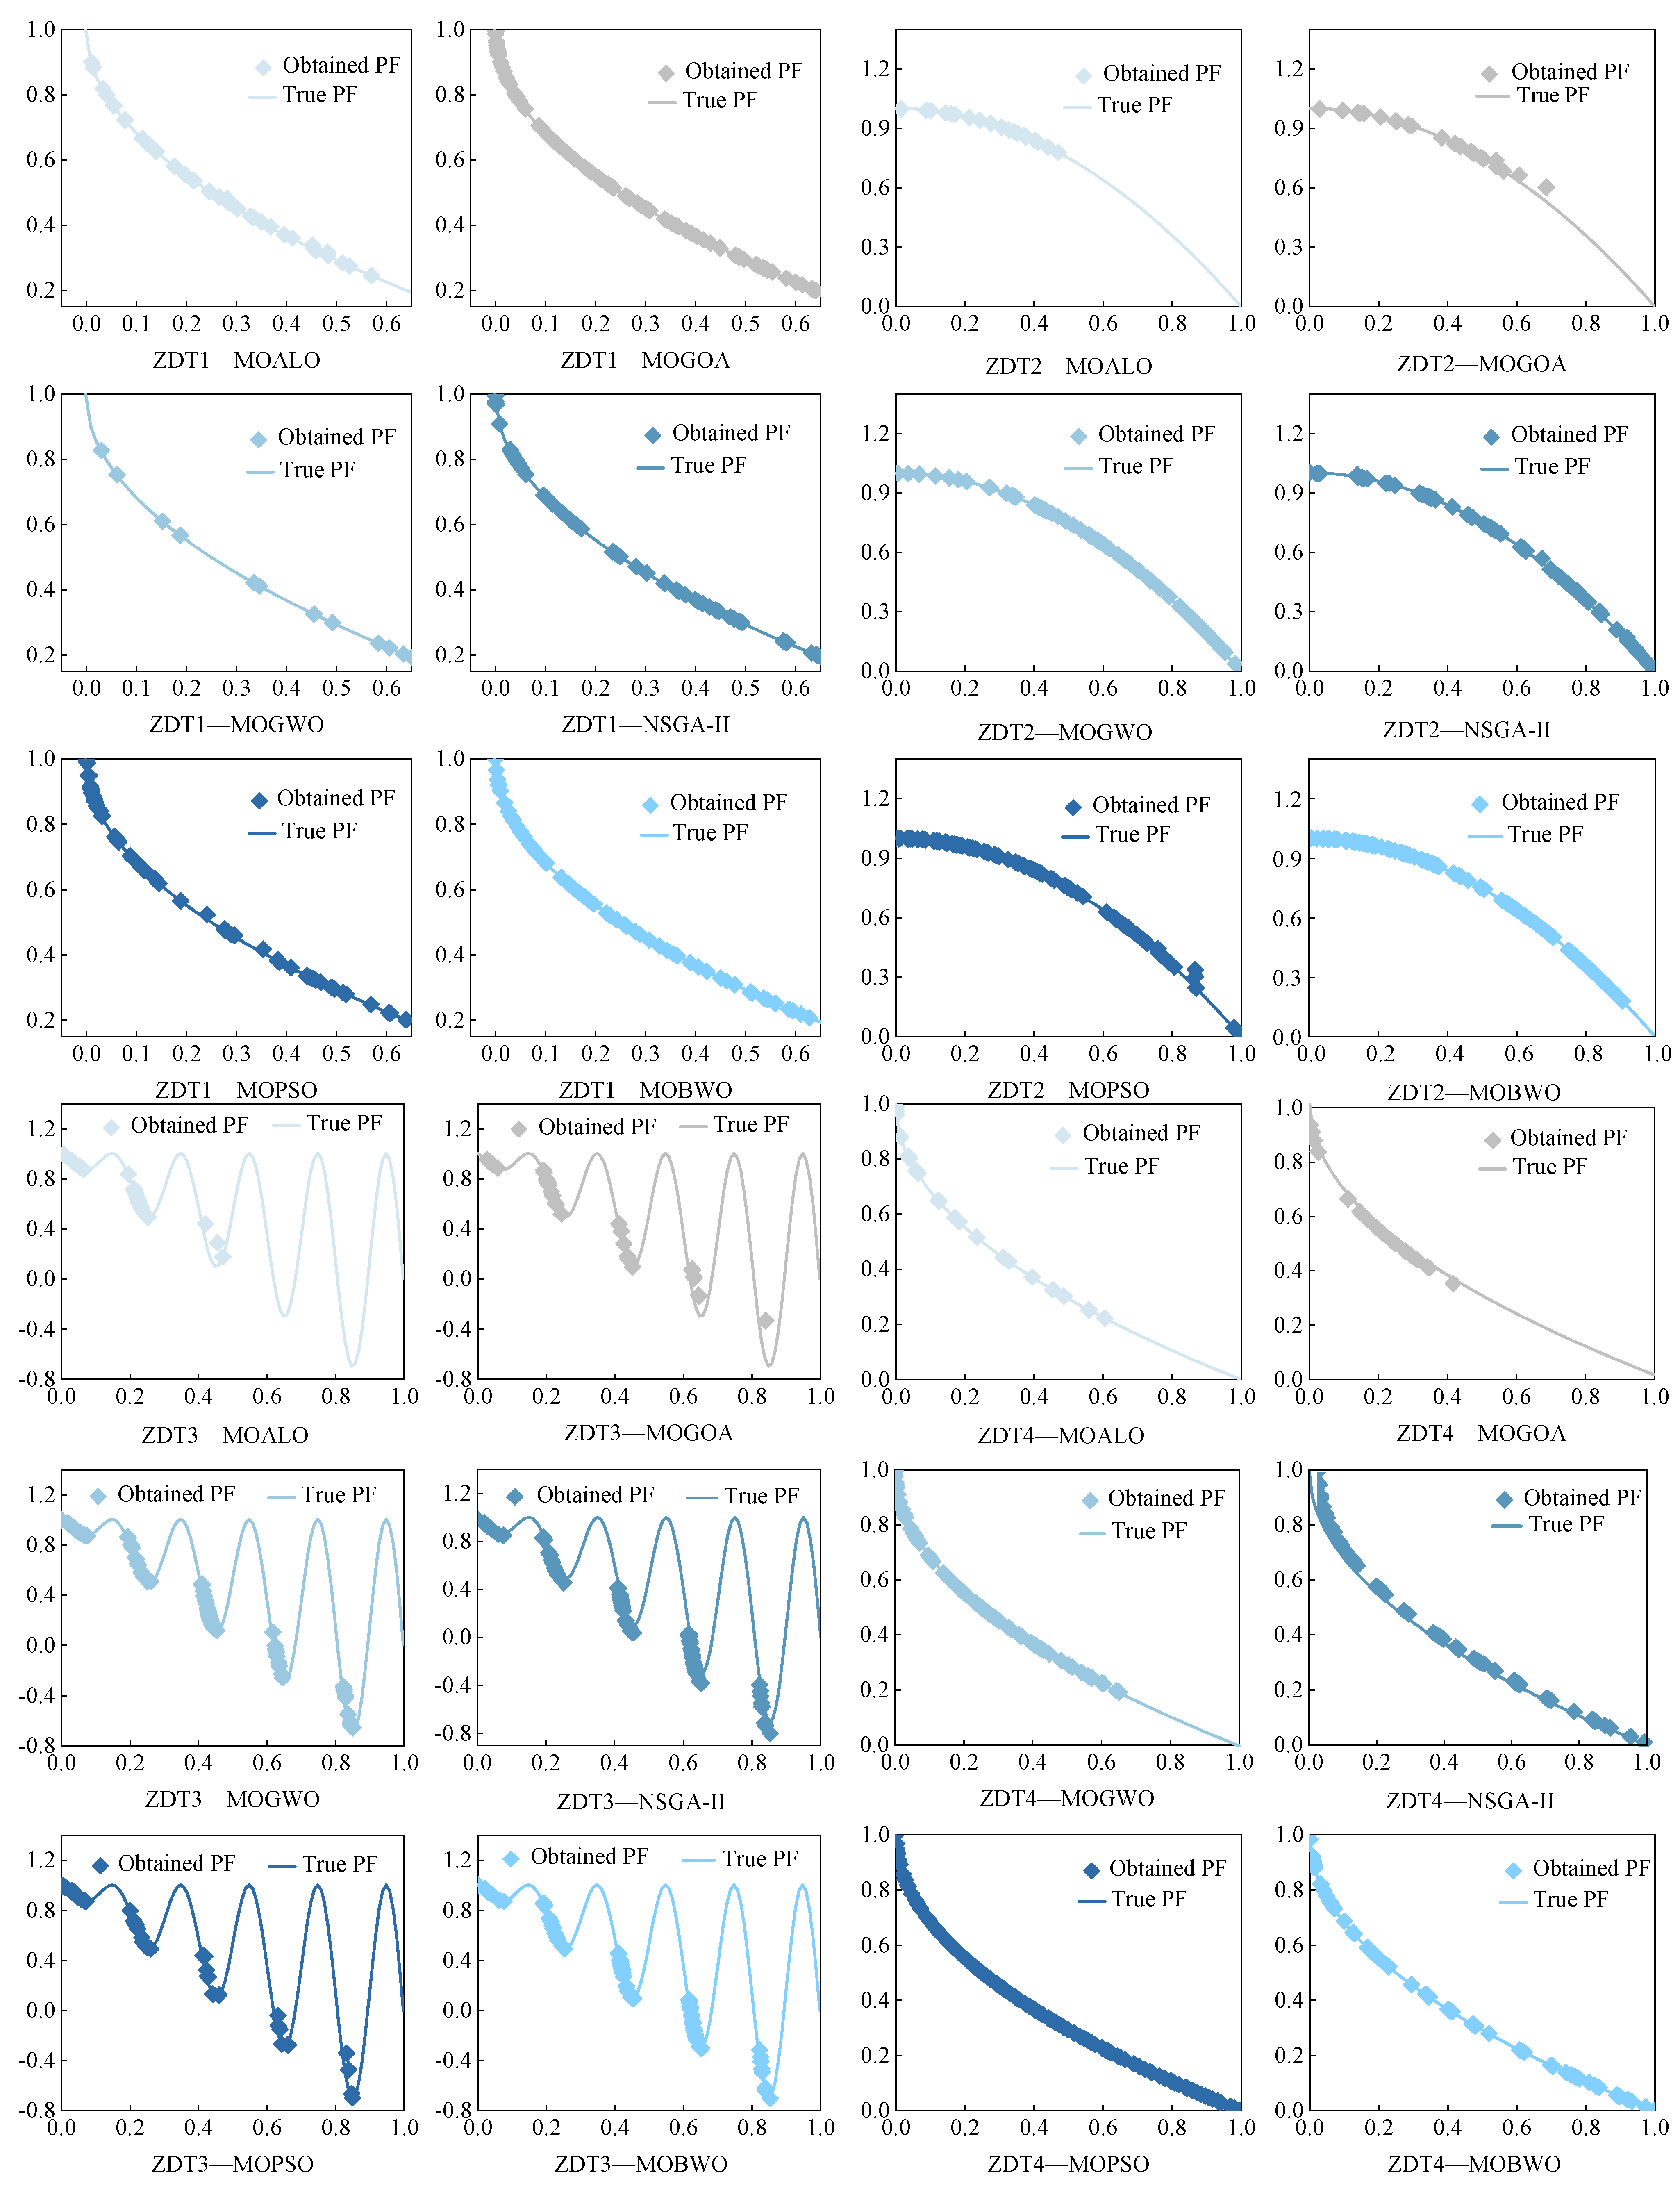
In order to verify the optimization performance of the MOBWO optimization algorithm in multi-objective optimization problems, the performance of the MOBWO algorithm was compared with NSGA-II, MOPSO, MOALO, MOGOA, and MOGWO, which have been widely acclaimed. The optimization performance was evaluated by using ZDT1-4 as the test function and selecting the IGD, GD, Spacing, and Spread indexes as the evaluation indexes. The ZDT1-4 optimization results are shown in Figure 5. Obviously, the MOBWO optimization effects were better than those of the other algorithms. For the ZDT-1 test function, the convergence of MOPSO and MOALO was not as good as the other optimization algorithms, and the coverage of MOBWO was greater and had a more uniform distribution than MOGOA, MOGWO, and NSGA-II; for the ZDT-2 test function, MOPSO and MOGOA converged worse than the other optimization algorithms, and the optimization results of MOGWO and MOBWO were more evenly distributed than the other algorithms; for the ZDT-3 test function, MOBWO converged better than the other optimization algorithms; for the ZDT-4 test functions, MOALO, MOGOA, MOGWO, and NSDA-II converged poorly, and MOBWO converged better than MOPSO but its coverage was worse.
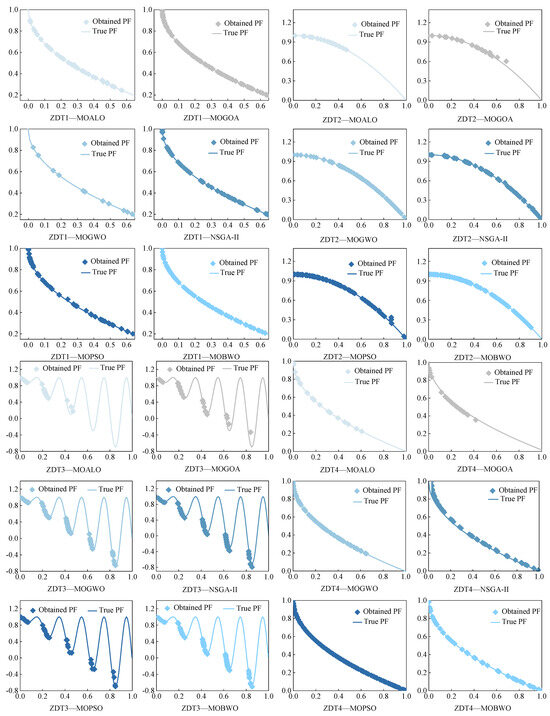
Figure 5.
Multi-objective optimization algorithm: ZDT1–4 non-dominated solution.
The comparative analysis employed two groups: test functions for the first group and multi-objective metrics for the second. This study utilized four metrics—GD, IGD, Spread, and Spacing—to facilitate quantitative assessments of the convergence and solution coverage, with the results summarized in Table 2 and Figure 6. The quantitative results in Table 2 and Figure 6 reveal that MOBWO demonstrated dominant performance across most test functions, with the evaluation metrics minimized significantly. Specifically, GD and IGD validate the algorithm’s superior convergence, while Spacing and Spread confirm its optimal solution distribution. MOBWO achieved the best optimization effect (value: 0.004601), whereas MOALO showed the worst performance (0.081122), indicating a 17-fold improvement of MOBWO over MOALO.
Table 2.
Comparison of multi-objective evaluation indexes.
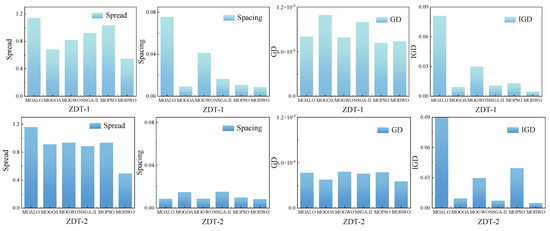
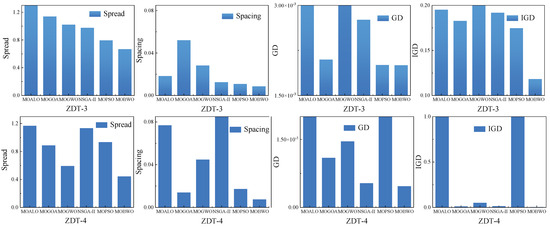
Figure 6.
Evaluation index of multi-objective optimization algorithm.
5. Result and Discussion
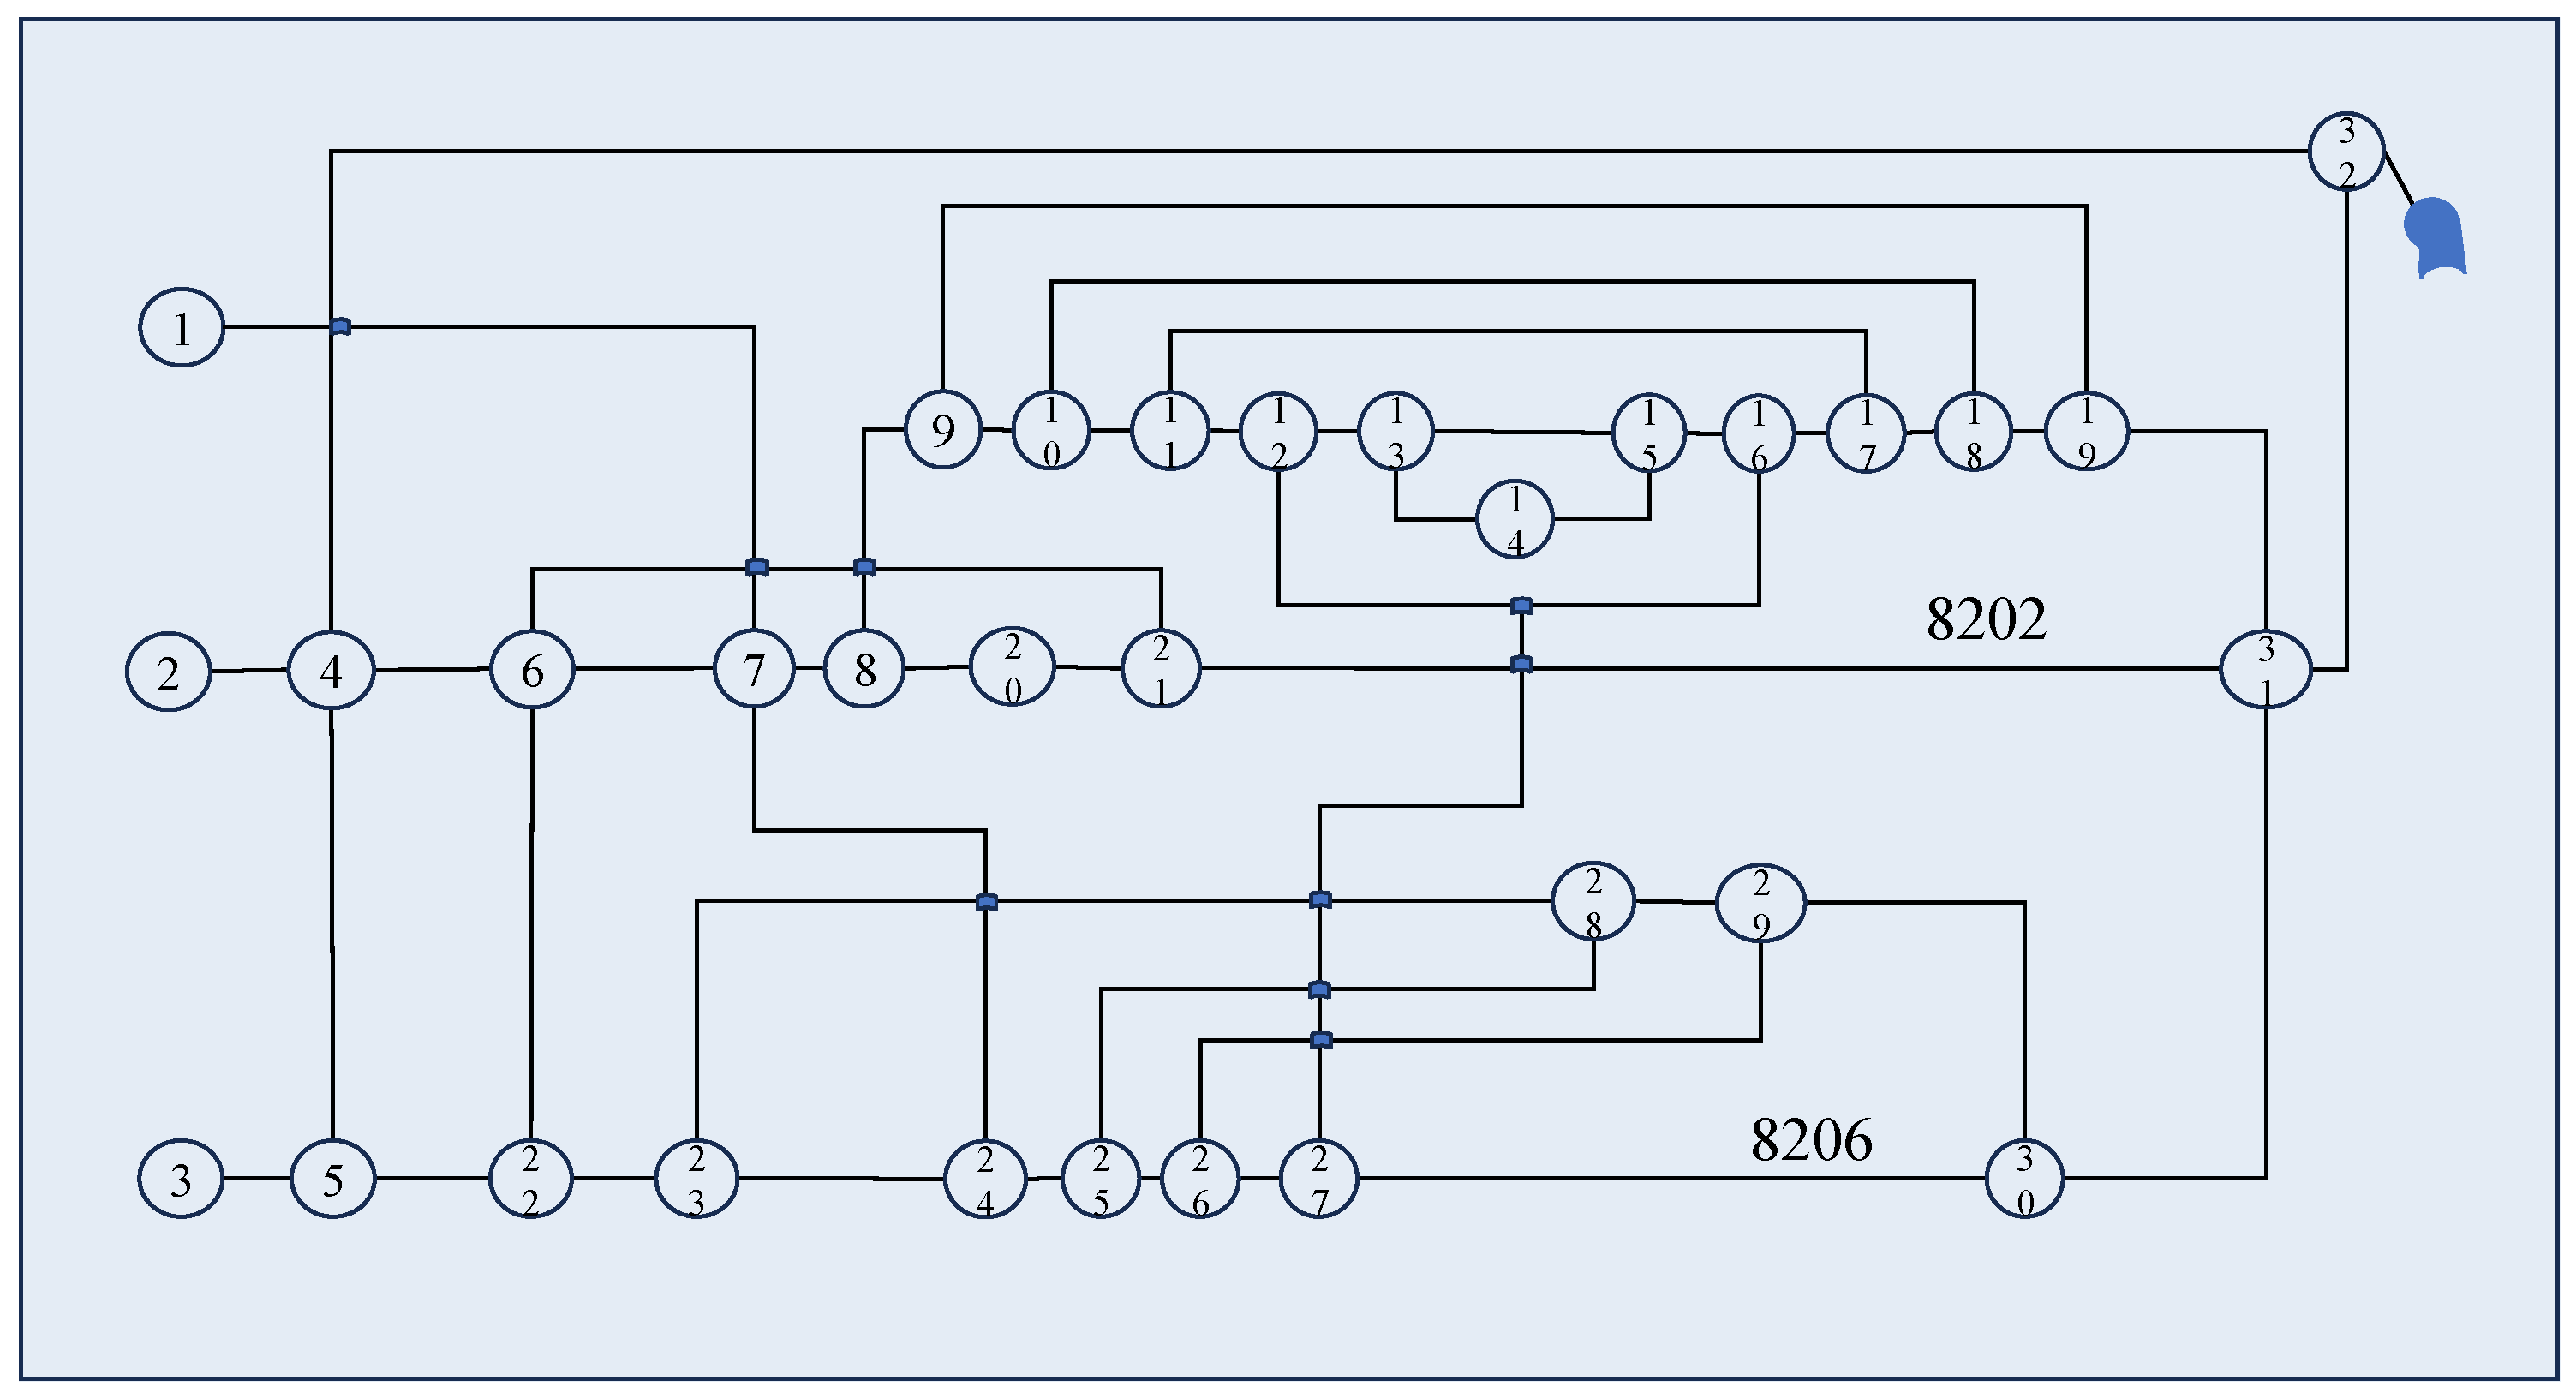
For the systematic computational analysis, the ventilation system diagram of the Mayinggou air shaft in Jinhuagong Mine was abstracted into a topological ventilation network graph, as illustrated in Figure 7. Mine data is shown in Table 3. The physical system—comprising 32 roadway intersections and 46 roadways—was mapped to a graph model with 32 nodes and 49 branches (including 3 pseudo-branches for modeling auxiliary paths). The ventilator is located at the entrance of the return air shaft, and each of the return air shafts is equipped with two main ventilators with the same capacity, with one in operation and one on standby.
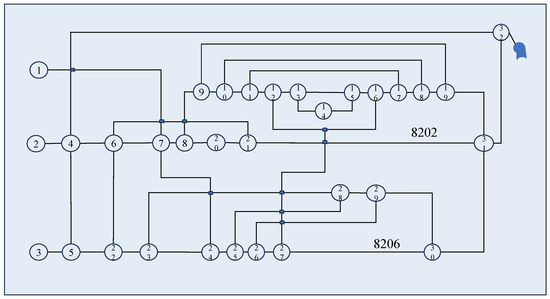
Figure 7.
Schematic diagram of the ventilation network.
Table 3.
Measurement results of the air resistance of the roadway.
The MOBWO algorithm was used to optimize the airflow in the mine. The MOBWO algorithm mainly imitates the lifestyle of beluga whales in order to realize the optimization process of the algorithm. The key parameters of the algorithm were determined via systematic sensitivity analysis, ensuring optimal convergence performance in complex ventilation networks.
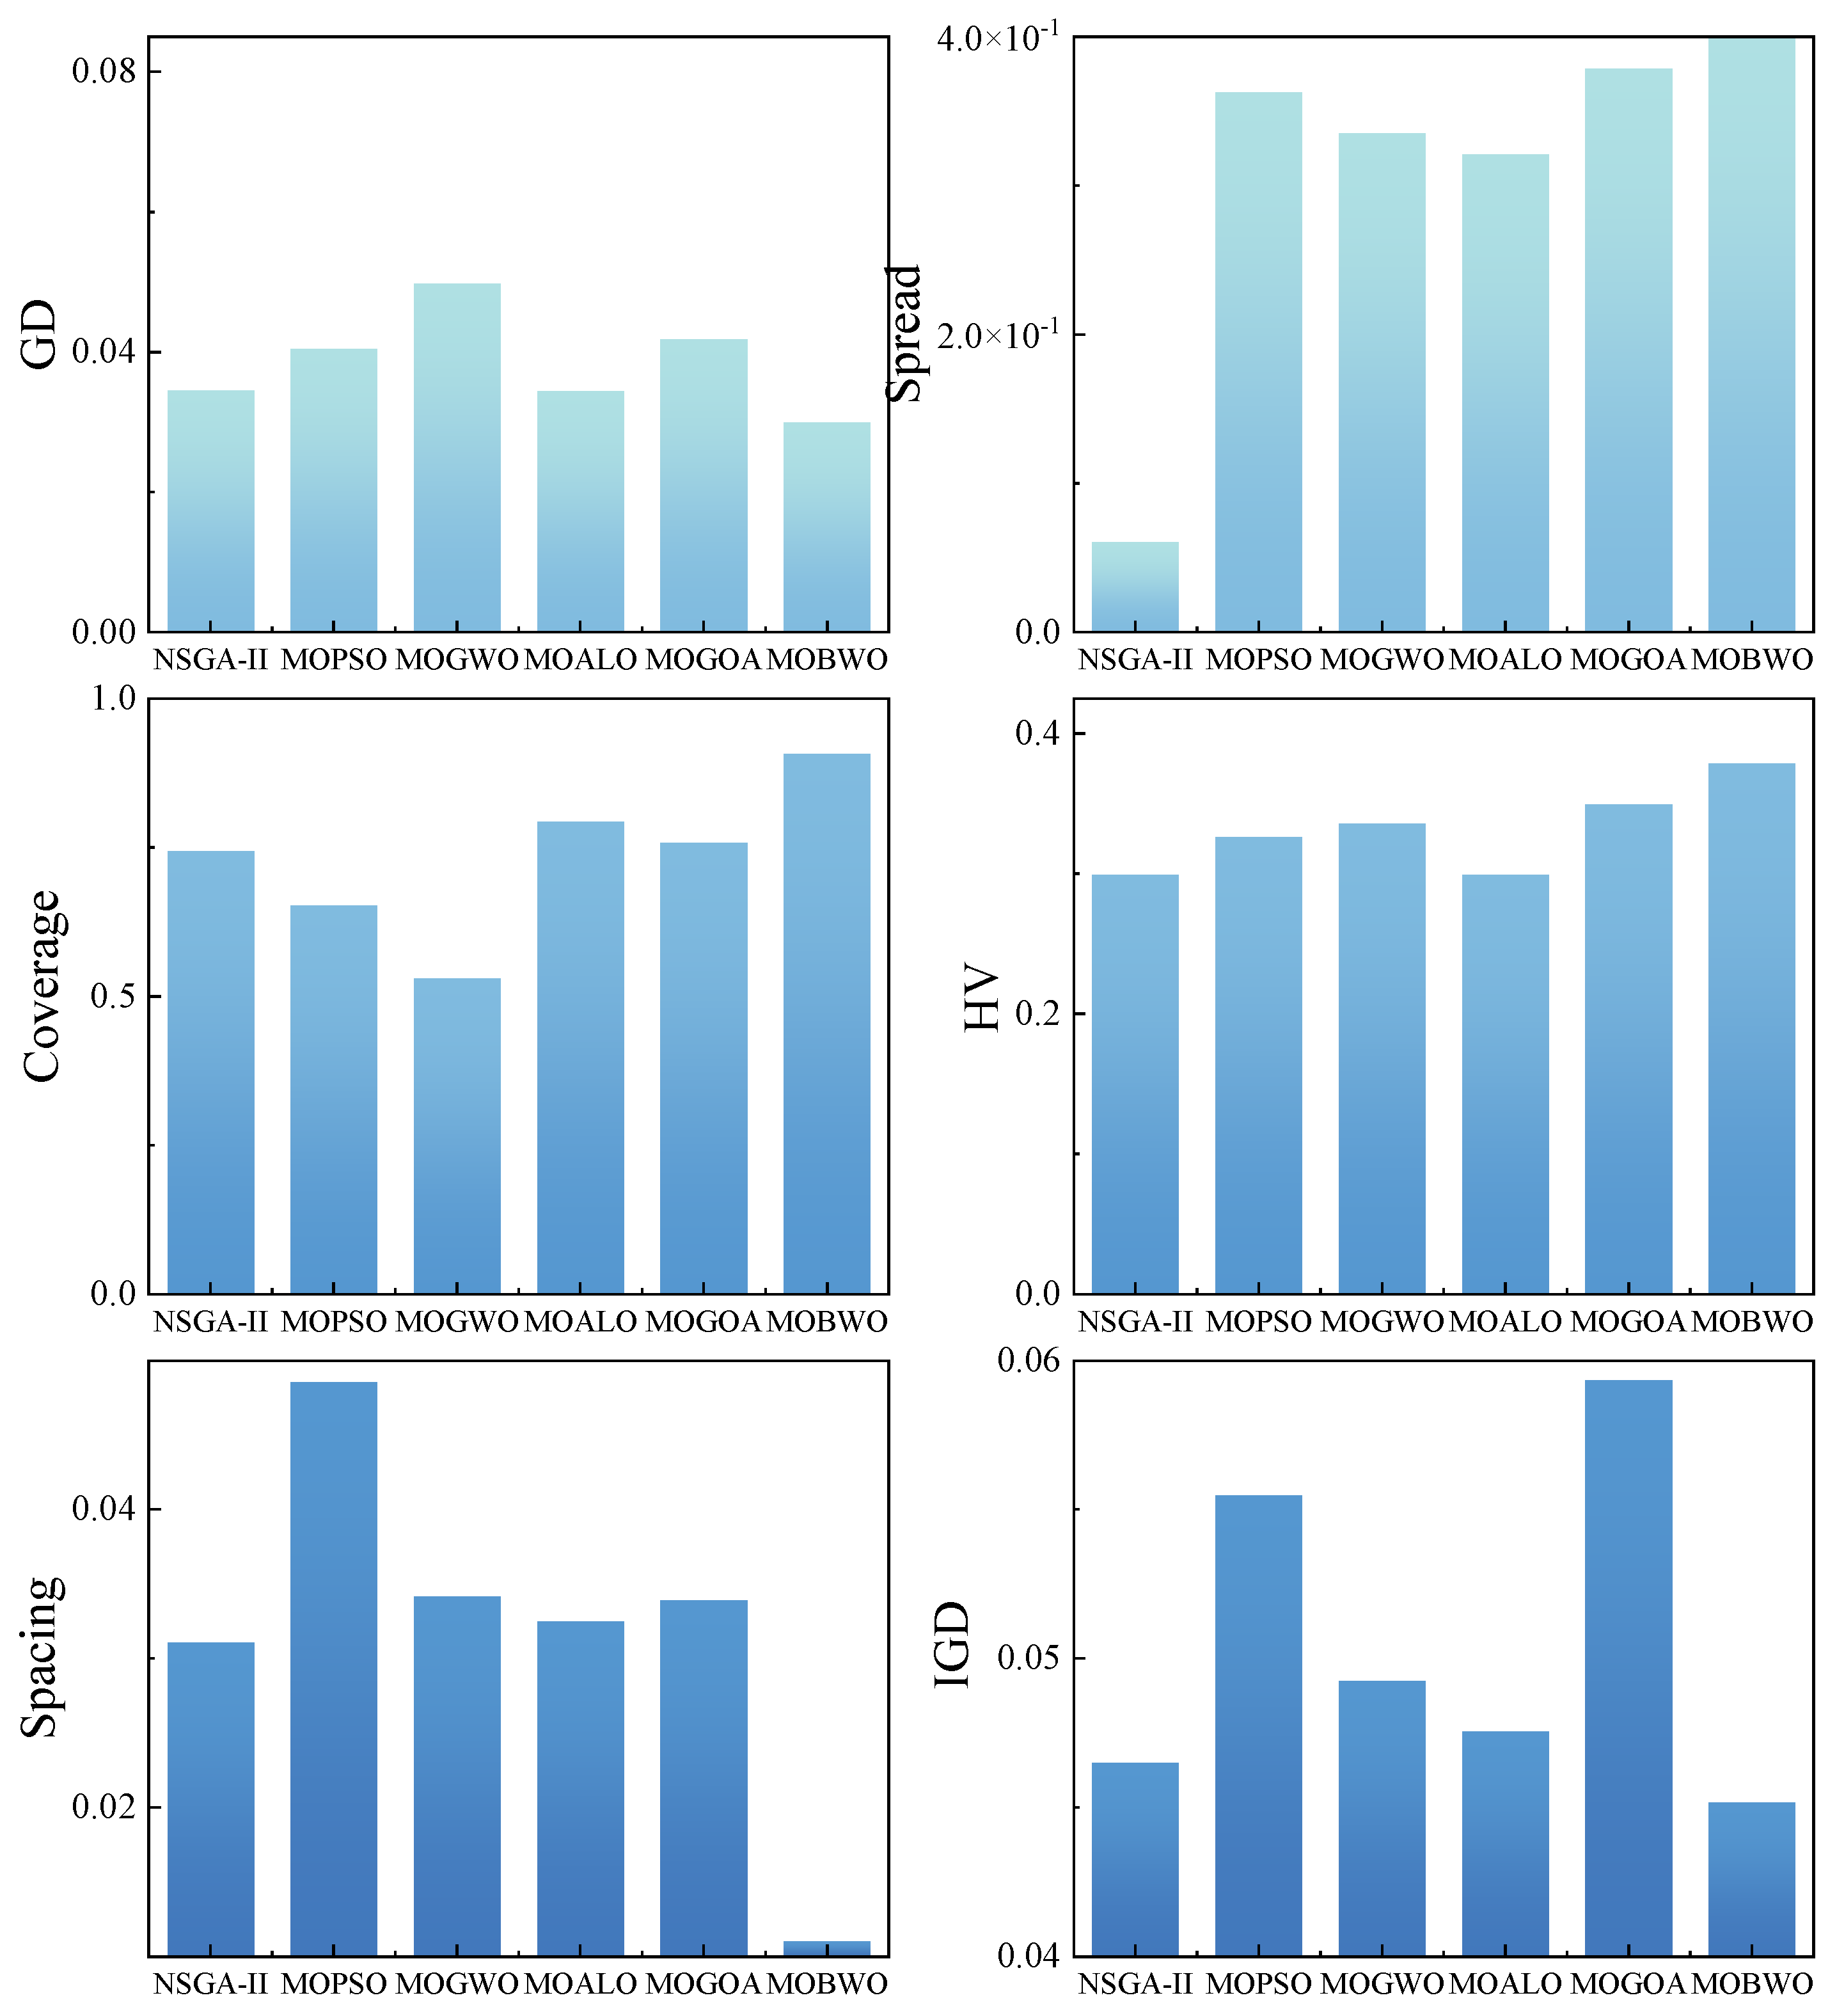
The main parameters of the MOBWO algorithm were set as follows: the population size was 100, the maximum number of iterations was 500, and the maximum number of archives was 100. As the optimization performance comparison function of the MOBWO algorithm, the main parameters of the MOALO algorithm were set as follows: the population size was 100, the maximum number of iterations was 200, and the maximum number of archives was 100. The main parameters of the MOGOA algorithm were set as follows: the population size was 100, the maximum iteration number was 500, the maximum archive number was 100, was 1, and was 0.00001. The main parameters of the MOGWO algorithm were set as follows: the population size was 100, the maximum iteration number was 100, the maximum archive number was 100, α was 0.1, β was 4, γ was 2, was 100, and was 10. The main parameters of the NSGA-II algorithm were set as follows: the population size was 100, the maximum number of iterations was 500, the maximum number of archives was 100, was 0.8, and was 0.3. The main parameters of the MOPSO algorithm were set as follows: the population size was 100, the maximum number of iterations was 500, the maximum number of archives was 100, ω was 0.6, and , were 1.5. Each algorithm was run 10 times, and the performance evaluation indicators of the optimization algorithms are shown in Table 4 and Figure 8.
Table 4.
Each optimization algorithm optimizes the performance evaluation indicators.
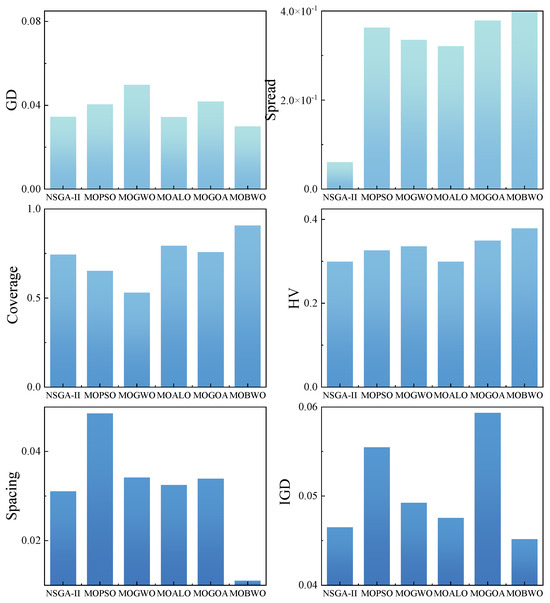
Figure 8.
Each optimization algorithm optimizes the performance evaluation indicators.
Based on the application practice and multi-dimensional index evaluation of Jinhuagong Mine, it can be seen that the Pareto solution set generated by the MOBWO algorithm shows significant advantages in terms of convergence and diversity by relying on Baldwin’s learning mechanism and the innovative search strategy when solving the air volume optimization problem of the ventilation system. The GD and IGD indicators verify that it can quickly approach the real frontier, the Spacing and Spread indicators confirm that the solution is evenly distributed, and the Hypervolume and Coverage indicators show that it has a wide coverage and strong dominance. Compared with traditional algorithms such as NSGA-II and MOPSO, the MOBWO algorithm not only has higher convergence accuracy in complex ventilation networks but also provides richer optimization options, offering a better solution for the multi-objective collaborative optimization of ventilation systems.
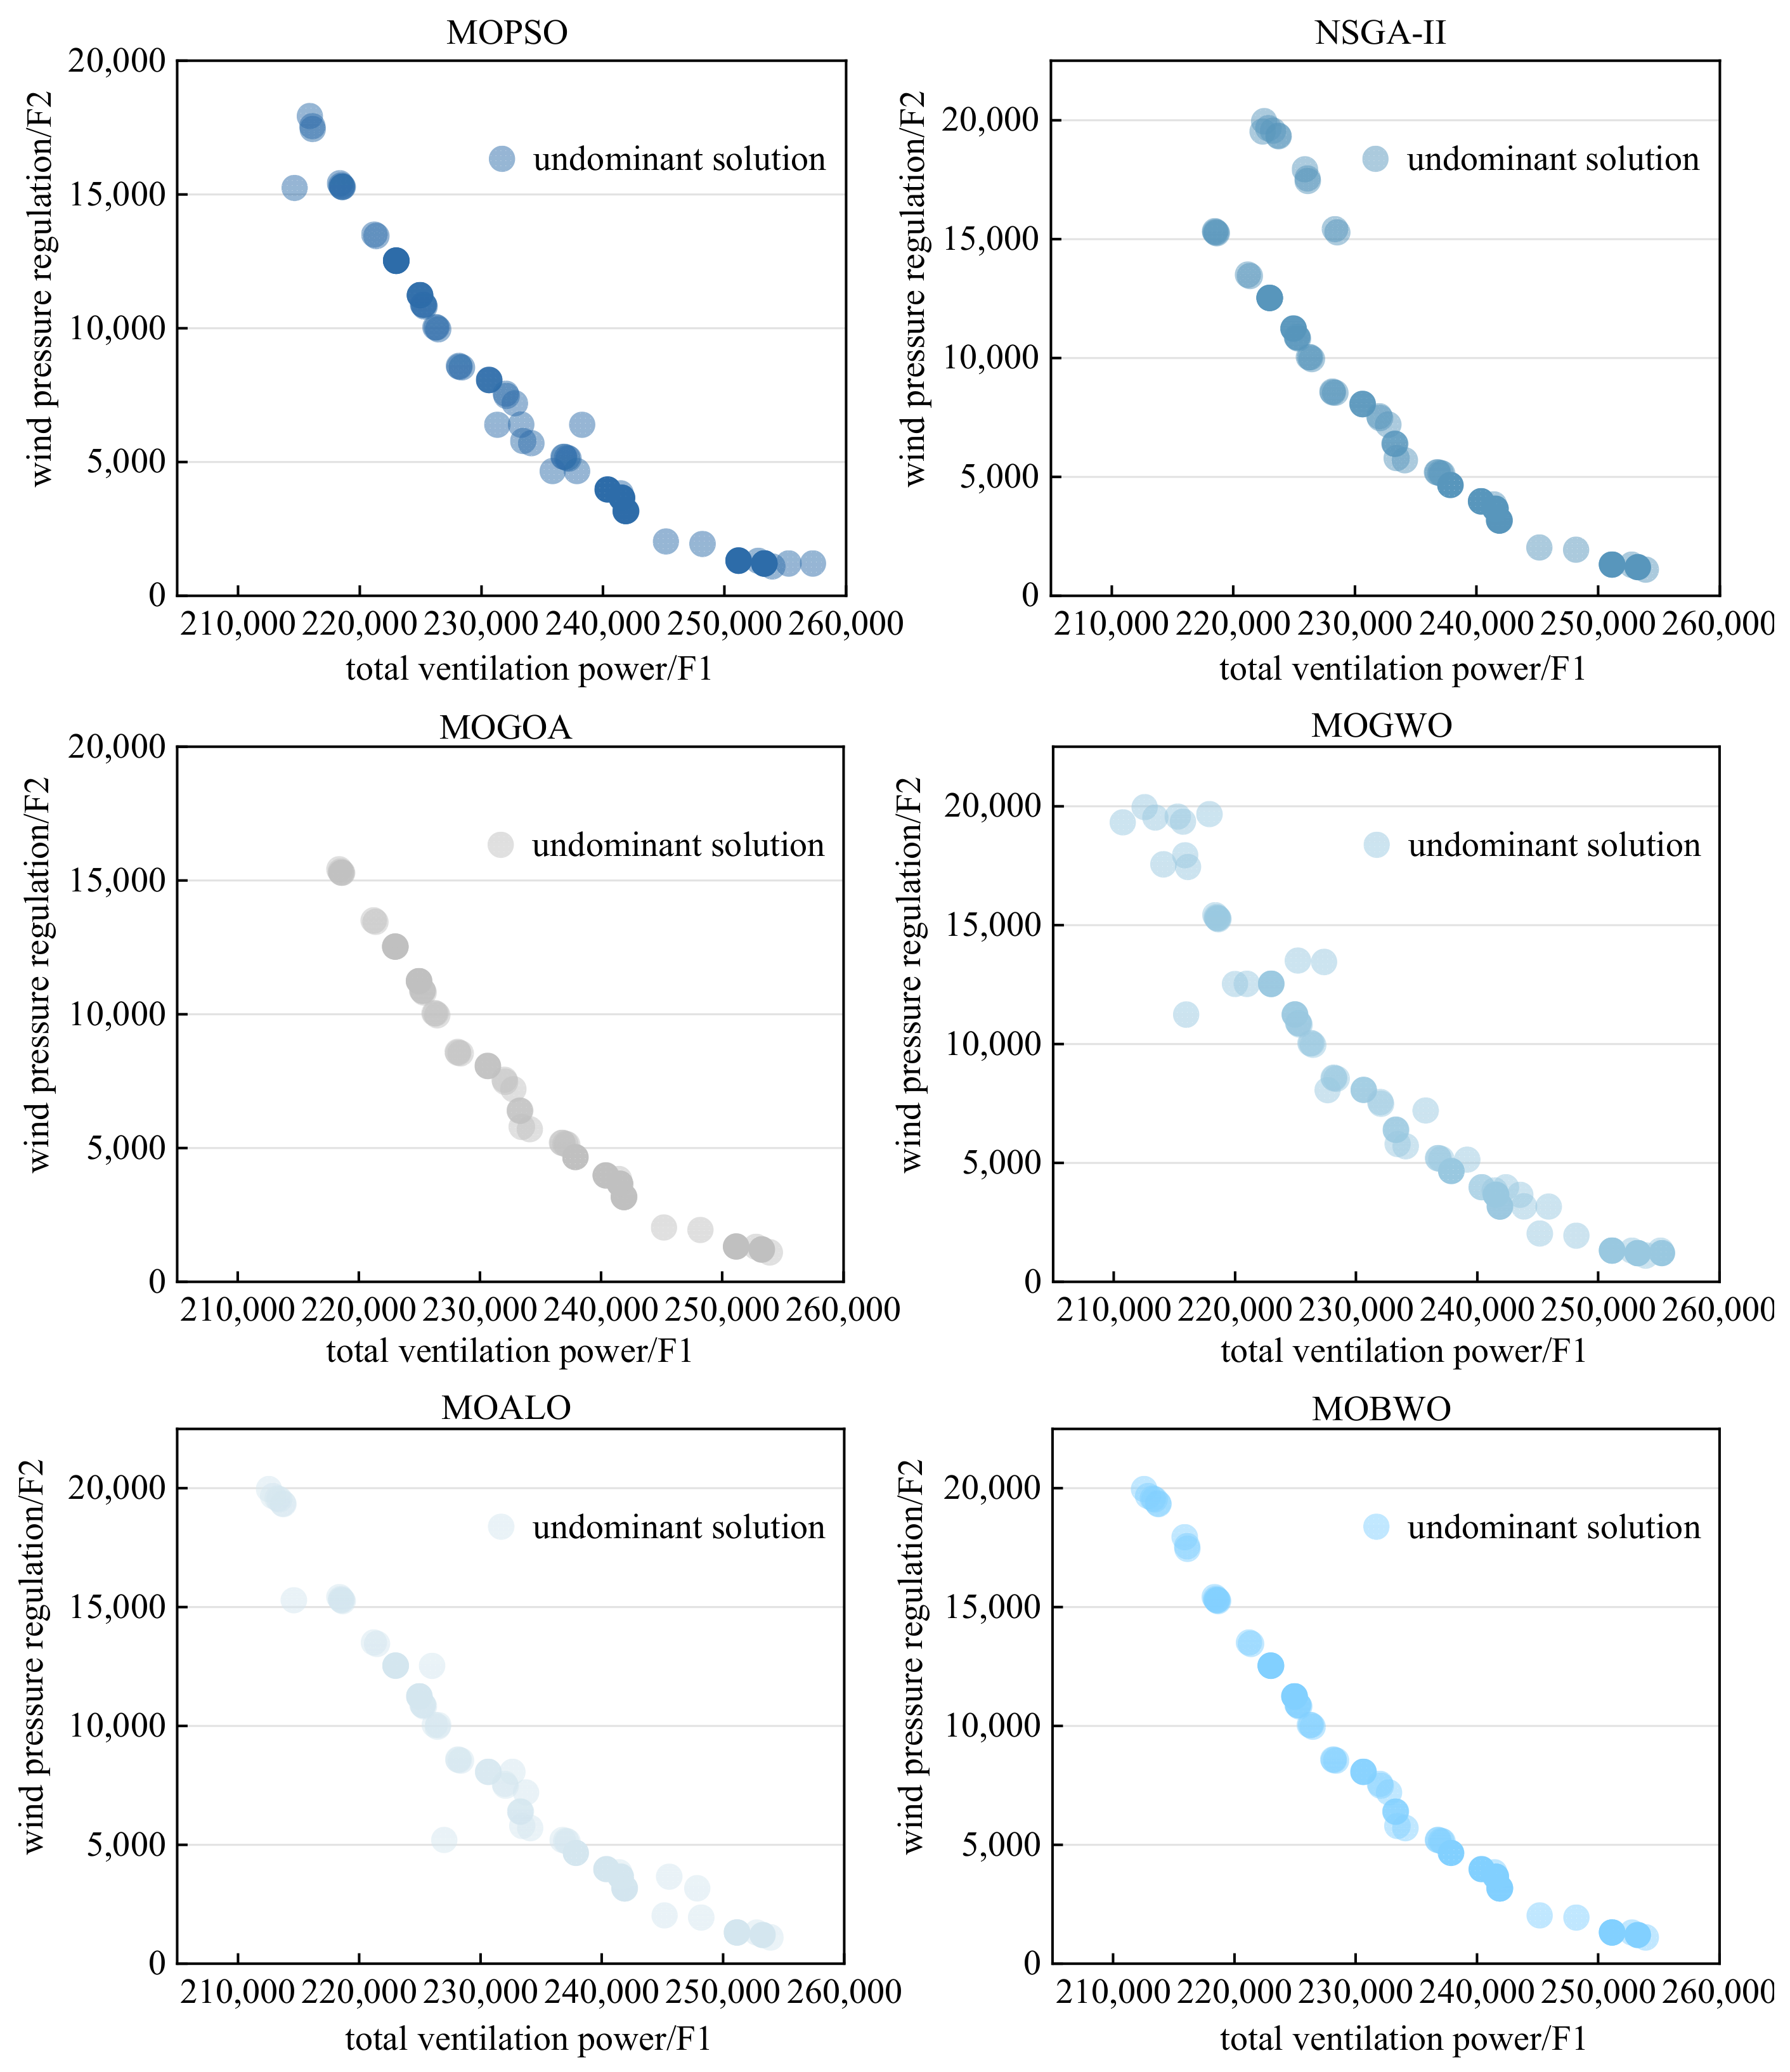
The mine airflow optimization model designated the total ventilator power and air pressure regulation complexity as its dual objectives. The optimization results of the MOBWO-based mine airflow solution are summarized in Table 5 and visualized in Figure 9. Figure 9 and Table 5 present the results of the MOBWO mine airflow optimization based on the MOBWO algorithm. Scheme 1 was as follows: the total ventilation power was 252.764 kW, and the value of the air pressure regulation was 1316 Pa; Scheme 2 was as follows: the total ventilation power was 253.895 kW, and the value of the air pressure regulation was 1108 Pa; Scheme 3 was as follows: the total ventilation power was 245.166 kW, and the value of the air pressure regulation was 2035 Pa …; Scheme 98 was as follows: the total ventilation power was 253.246 kW, and the air pressure regulation value was 1212 Pa; Scheme 99 was as follows: the total ventilation power was 253.244 kW, and the air pressure regulation value was 1215 Pa; Scheme 100 was as follows: the total ventilation power was 253.243 kW, and the air pressure regulation value was 1301 Pa.
Table 5.
MOBWO mine airflow optimization results.

Figure 9.
Optimization results of mine airflow.
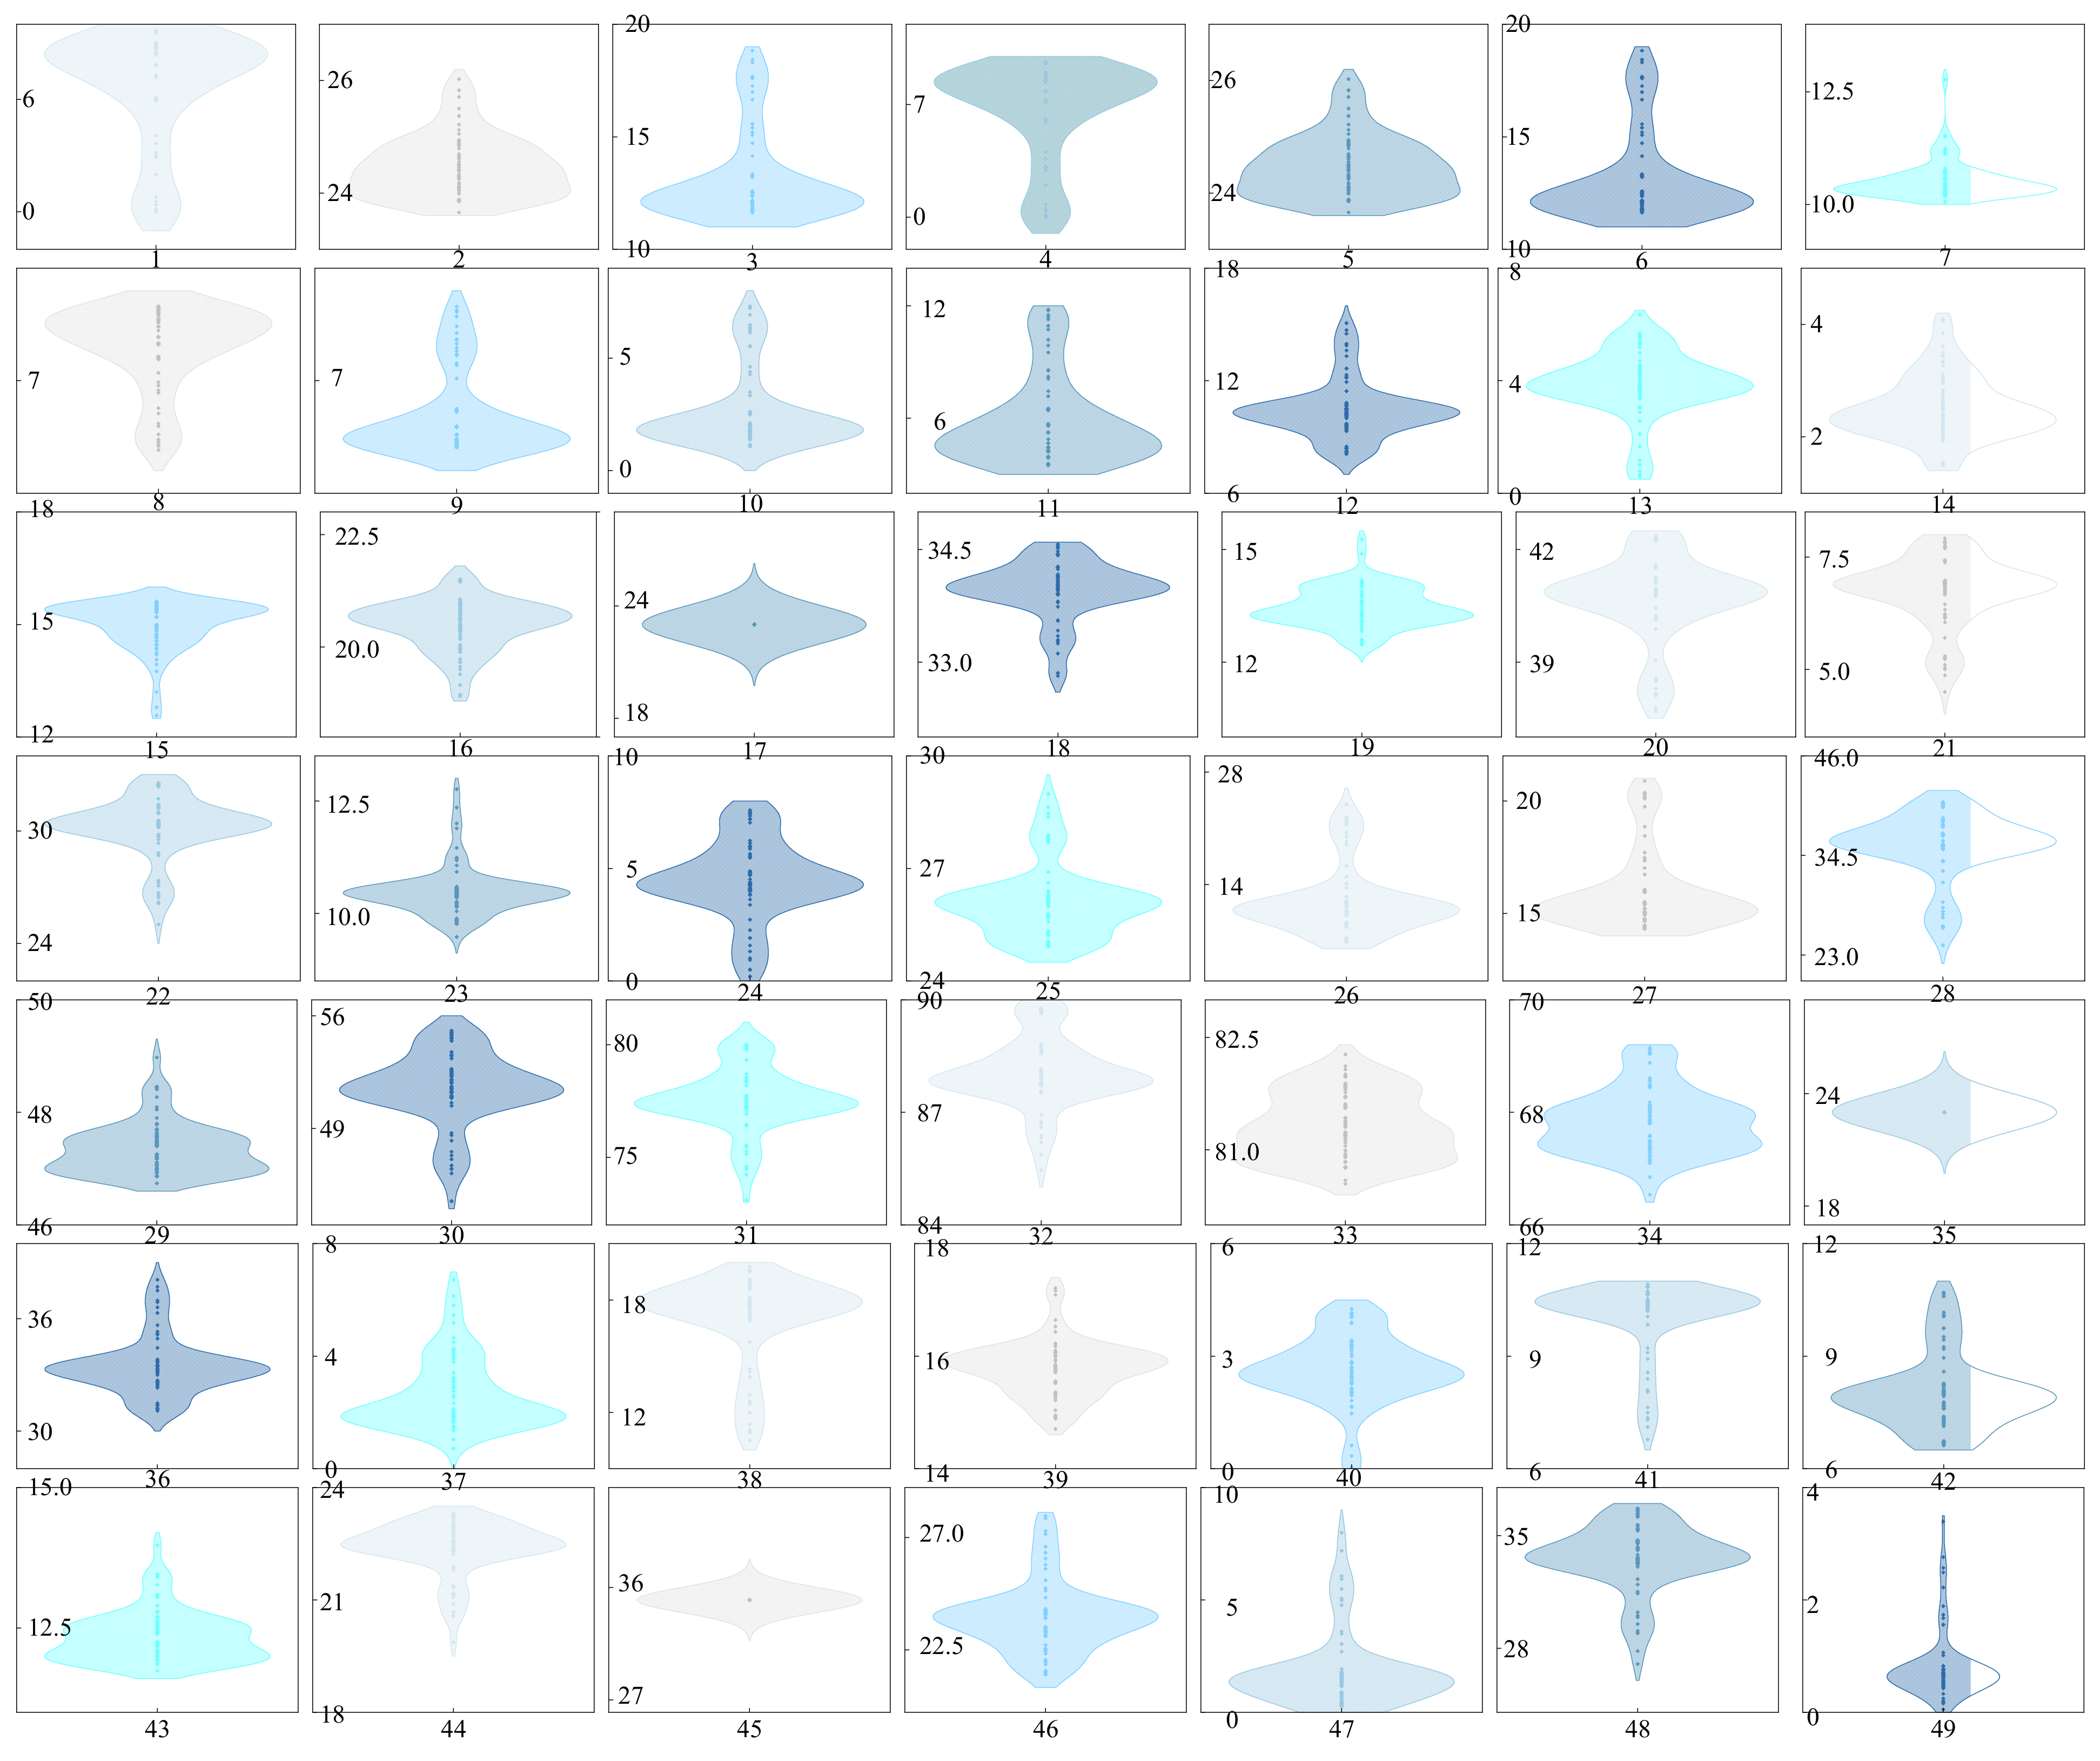
To validate the feasibility of 100 optimization schemes, the airflow of each branch was calibrated, and the adjustable ranges were summarized for verification. The validation results are presented in Figure 10. The width of each graph represents the distribution of the airflow in each branch of the airflow optimization scheme, where a larger width of the graph means that the airflow distribution is more dense, and vice versa. The upper and lower boundaries of the graph represent the upper and lower limits of the branch airflow. As shown in the figure, all branch airflows of the schemes fall within the allowable ranges, confirming their engineering feasibility.
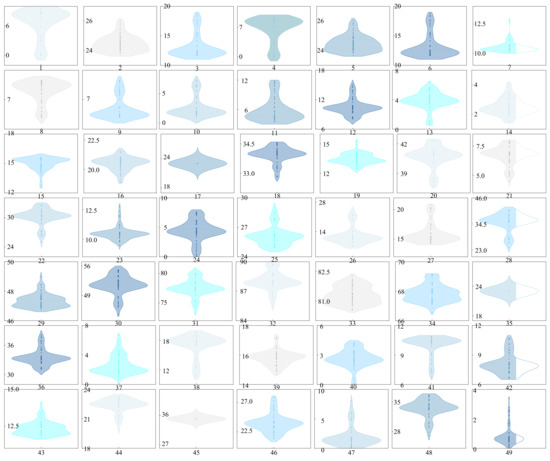
Figure 10.
Calibration results of each branch air volume.
When solving the air volume optimization problem of the ventilation system based on the MOBWO algorithm, the dictionary order method is used to set the target priority for the two key goals of the ventilator energy consumption and air volume adjustment complexity, and the optimization solution that meets the specific needs is selected from the Pareto frontier. In the period when the energy cost is high and the ventilation system is relatively stable, the energy consumption of the ventilator is set as the first priority, and the complexity of air volume regulation is set as the second priority. When the ventilation system is frequently adjusted to cope with special working conditions, the complexity of air volume adjustment is the first priority.
When the ventilator energy consumption is the first priority, the solution or set of solutions with the lowest energy consumption is filtered out in the Pareto front. If there are multiple solutions with the same energy consumption, the air volume adjustment complexity of these solutions is further compared, and the solution with the lowest complexity is selected as the final optimization scheme; at this time, the adjustment scheme with a total ventilation power of 213.2544 kW and an air pressure adjustment value of 1512 Pa is selected. On the contrary, if the complexity of air volume regulation is preferred, the solution with the lowest complexity is found first, and then the scheme with the best energy consumption is selected from these solutions, and the adjustment scheme with an air pressure adjustment value of 1032 Pa and a total power of the fan of 242.324 kW is selected. In summary, the power of the fan before optimization is 270.32 kW, and the energy consumption of the fan can be reduced by 10.3–21.1% after optimization. According to the annual situation, coal mining enterprises can choose the final selected scheme as the optimization and control plan and optimize and improve the coal mine ventilation network according to the corresponding optimization and control plan.
It should be noted that this study is based on the assumption that the natural pressure effect and steady-state airflow are ignored, and the dynamic changes in the natural air pressure and the unsteady-state characteristics of airflow in an actual mine ventilation system may have additional effects on the performance of the algorithm. In order to minimize the errors caused by the algorithm mechanism and data, follow-up research will anchor the core goal of real-time optimization, deeply integrate the physical model and the data-driven model, and strengthen the adaptability of the algorithm to complex working conditions. At the same time, the deep integration of sensor data and optimization algorithms will be promoted, and a dynamic feedback loop will be constructed to enhance the practicability and reliability of the method in complex mining scenarios.
6. Conclusions
This paper proposes a mine airflow optimization and regulation method based on the MOBWO algorithm. An airflow optimization model was constructed by taking the total power consumption of ventilators and the complexity of air pressure regulation as dual optimization objectives. An advanced multi-objective optimization algorithm was employed to solve the airflow optimization problem, and the feasibility of the proposed method was verified through case studies. The specific conclusions are as follows:
(1) By integrating graph theory with mine ventilation principles, this study constructed an airflow optimization model based on the laws of the air volume balance, nodal air pressure equilibrium, and air resistance. The model targets two optimization objectives: the total power consumption of the ventilators and the complexity of air pressure regulation. During airflow optimization, the model is constrained by the branch air pressure and air volume; additionally, ventilators are subject to operational constraints, including working air pressure and efficiency. This framework systematically unifies theoretical foundations with practical limitations to ensure the model’s engineering applicability.
(2) This study employed the classical ZDT series functions as multi-objective optimization benchmark test functions and selected GD, IGD, Spacing, and Spread as evaluation indices. Through comparative analysis of optimization performances among the MOBWO, MOALO, MOGOA, MOGWO, NSGA-II, and MOPSO algorithms, the superiority of the MOBWO algorithm in terms of optimization performance over the other algorithms was explicitly validated.
(3) Taking the Jinhuagong Mine as the research object, this paper verified the feasibility of the mine airflow optimization method through a case study. Following the optimization, 100 feasible scenarios (Scenarios 1–100) were derived from the non-dominated solutions of the multi-objective optimization. The air volume of each branch in these scenarios fell within the calibrated range, confirming that Scenarios 1–100 were all valid feasible solutions.
(4) In the period when the energy cost is high and the ventilation system is relatively stable, the energy consumption of the ventilator is set as the first priority, and the complexity of air volume regulation is set as the second priority. When the ventilation system is frequently adjusted to cope with special working conditions, the complexity of air volume adjustment is the priority. From the example verification, it can be seen that using the MOBWO algorithm for airflow optimization can reduce the power of the ventilator by 10.3–21.1% compared with that before optimization. More factors are considered in the mine air volume optimization plan, providing more choices for coal mining enterprises.
Author Contributions
Writing—original draft, Q.S.; conceptualization, supervision, Y.W.; software, Q.S.; supervision, Y.W.; software, Q.S.; writing—review and editing, Y.W. All authors have read and agreed to the published version of the manuscript.
Funding
This research received no external funding.
Data Availability Statement
The original contributions presented in this study are included in the article. Further inquiries can be directed to the corresponding author.
Acknowledgments
During the preparation of this manuscript/study, the author(s) used MATLAB R2022b for the purposes of simulation in this publication.
Conflicts of Interest
The authors declare no conflicts of interest.
References
- Zhang, P.; Li, F.; Zhu, H.; Niu, H.; Li, X. Statistical analysis and prevention countermeasures of coal mine accidents from 2008 to 2020. Min. Saf. Environ. Prot. 2022, 49, 128–134. [Google Scholar]
- Tian, S.; Wang, Y.; Li, H.; Ma, T.; Mao, J.; Ma, L. Analysis of the causes and safety countermeasures of coal mine accidents: A case study of coal mine accidents in China from 2018 to 2022. Process Saf. Environ. Prot. 2024, 187, 864–875. [Google Scholar]
- Zhao, Y.; Yan, Y.; Liu, K.; Zhao, X.; Li, H.; Cao, J.; Zhang, S.; Ma, K. Analysis of coal mine safety accident features in China, 2017–2022. Geohazard Mech. 2024, 2, 108–120. [Google Scholar]
- Lu, X.; Yin, H. The intelligent theory and technology of mine ventilation. J. China Coal Soc. 2020, 45, 2236–2247. [Google Scholar]
- Zhou, F.; Xin, H.; Wei, L.; Shi, G.; Xia, T. Research progress of mine intelligent ventilation theory and technology. Coal Sci. Technol. 2023, 51, 313–328. [Google Scholar]
- Song, H. Mine Ventilation Network Solution—Hole by Hole Calculate Method. Coal Sci. Technol. 1975, 3, 48–58+30. [Google Scholar]
- Song, H. Mine Ventilation Network Solution—Hole by Hole Graphic Method. Coal Sci. Technol. 1975, 2, 35–43. [Google Scholar]
- Li, B.R.; Inoue, M.; Shen, S.B. Mine Ventilation Network Optimization Based on Airflow Asymptotic Calculation Method. J. Min. Sci. 2018, 54, 99–110. [Google Scholar]
- Zhou, F.; Wei, L.; Xia, T.; Wang, K.; Wu, X.; Wang, Y. Principle, key technology and preliminary realization of mine intelligent ventilation. J. China Coal Soc. 2020, 45, 2225–2235. [Google Scholar]
- Hong, T. Research on the application of Scot-Hinsley method for solving complex wind networks in mines. Inner Mongolia Coal Econ. 2013, 11, 116–118. [Google Scholar]
- Xiaofeng, L. Improvement research and implementation of ventilation network solution. Min. Eng. 2008, 6, 56–59. [Google Scholar]
- Zhong, D.; Wang, L.; Bi, L.; Wang, J.; Zhu, Z. Solving algorithm of complex mine ventilation network based on loop air volume method. J. China Coal Soc. 2015, 40, 365–370. [Google Scholar]
- Lowndes, I.S.; Fogarty, T.; Yang, Z.Y. The application of genetic algorithms to optimise the performance of a mine ventilation network: The influence of coding method and population size. Soft Comput. 2004, 9, 493–506. [Google Scholar]
- She, X.; Chang, X. Integrative optimization algorithm of min ventilation networks based on genetic algorithm. J. Cent. South Univ. (Sci. Technol.) 2011, 42, 1676–1684. [Google Scholar]
- Zhao, D.; Liu, J.; Pan, J.; Ma, H. Hybrid genetic algorithm for the optimization of mine ventilation network. J. Coal Sci. Eng. 2009, 15, 389–393. [Google Scholar]
- Guo, Y.; Wang, C.; Yang, J. Mine ventilation network based on cultural particle swarm optimization algorithm. J. Southeast Univ. (Nat. Sci. Ed.) 2013, 43, 48–53. [Google Scholar]
- Zhang, X.; Zhou, Y. Study on ACPSO algorithm for mine ventilation network. J. Liaoning Tech. Univ. (Soc. Sci. Ed.) 2018, 20, 305–311. [Google Scholar]
- Chen, Y. Optimization of Ventilation On-Demand in Mines Based on Niche Particle Swarm Optimization Algorithm. Master’s Thesis, China University of Mining and Technology, Xuzhou, China, 2023. [Google Scholar]
- Zhang, Z. Application of Particle Swarm Optimization Algorithm in Air Volume Optimization of Mine Ventilation Network. Master’s Thesis, China University of Mining and Technology, Xuzhou, China, 2019. [Google Scholar]
- Ge, H. Optimization and Control of Mine Ventilation System Based on PSO Algorithm. Ph.D. Thesis, China University of Mining and Technology, Xuzhou, China, 2020. [Google Scholar]
- Song, J. Application of IPSO-TS algorithm in air volume optimization of mine ventilation network. Min. Saf. Environ. Prot. 2022, 49, 78–82. [Google Scholar]
- Shao, L.; Wang, Z.; Li, C. Optimization Algorithm of Mine Ventilation Based on SA-IPSO. J. Syst. Simul. 2021, 33, 2085–2094. [Google Scholar]
- Wei, G. Optimization of mine ventilation system based on bionics algorithm. Procedia Eng. 2011, 26, 1614–1619. [Google Scholar]
- Lian, W.-L. Research on Control Optimization Method of Mine Ventilation System Based on Intelligent Optimization Algorithm. J. Comput. 2023, 34, 239–248. [Google Scholar]
- Zhang, Z. Research on Application of Improved Grey Wolf Algorithm in Optimization and Regulation of Air Volume of Mine Ventilation Network. Master’s Thesis, China University of Mining and Technology, Xuzhou, China, 2021. [Google Scholar]
- Wang, J.; Xiao, J.; Xue, Y.; Wen, L.; Shi, D. Optimization of Airflow Distribution in Mine Ventilation Networks Using the Modified Sooty Tern Optimization Algorithm. Min. Met. Explor. 2023, 41, 239–257. [Google Scholar]
- Xu, J. Research on Improved Whale Algorithm in Intelligent Control of Mine Air Volume. Master’s Thesis, China University of Mining and Technology, Xuzhou, China, 2023. [Google Scholar]
- Liu, Y.; Chen, Q. Mine air volume optimization and adjustment method based on WOA. J. Heilongjiang Univ. Sci. Technol. 2023, 33, 475–480. [Google Scholar]
- Yu, B.; Chen, S.; Bai, T. Mine intelligent air volume regulation method based on improved pigeon-inspired algorithm. J. Liaoning Tech. Univ. (Nat. Sci.) 2023, 42, 283–292. [Google Scholar]
- Han, Z. Intelligent Optimization and Regulation of Mine Air Volume Based on Sparrow Search Algorithm. Master’s Thesis, China University of Mining and Technology, Xuzhou, China, 2022. [Google Scholar]
- Li, J.; Li, Y.; Zhang, W.; Dong, J.; Cui, Y. Multi-Objective Intelligent Decision and Linkage Control Algorithm for Mine Ventilation. Energies 2022, 15, 7980. [Google Scholar] [CrossRef]
- Zhong, C.; Li, G.; Meng, Z. Beluga whale optimization: A novel nature-inspired metaheuristic algorithm. Knowl.-Based Syst. 2022, 251, 109215. [Google Scholar]
- Rahman, C.M.; Mohammed, H.M.; Abdul, Z.K. Multi-objective group learning algorithm with a multi-objective real-world engineering problem. Appl. Soft Comput. 2024, 166, 112145. [Google Scholar]
- Yu, B.; Shao, L. An optimization method of mine ventilation system based on R2 index hybrid multi-objective equilibrium optimization algorithm. Energy Rep. 2022, 8, 11003–11021. [Google Scholar]
- Sui, J.; Yang, L.; Zhu, Z.; Fang, H.; Zhen, H. Mine Ventilation Optimization Analysis and Airflow Control Based on Harmony Annealing Search. J. Comput. 2011, 6, 1270–1277. [Google Scholar]
- Wang, Y.J. Solving mine ventilation networks with fixed and non-fixed branches. Min. Eng. 1990, 42, 1091–1095. [Google Scholar]
- Duan, Z.; Zhang, X.; Huang, X. Regulation Complex Wind Network Flow by Pathway Method. Coal Technol. 2020, 39, 137–140. [Google Scholar]
- Hao, Y.; Zhao, C.; Zhang, Y.; Cao, Y.; Li, Z. Constrained multi-objective optimization problems: Methodologies, algorithms and applications. Knowl.-Based Syst. 2024, 299, 111998. [Google Scholar] [CrossRef]
- Liu, J.; Liu, R. Objective contribution decomposition method and multi-population optimization strategy for large-scale multi-objective optimization problems. Inf. Sci. 2024, 678, 120950. [Google Scholar] [CrossRef]
- Francesco, P.; Riccardo, T. Multi-objective optimisation for sustainable few-to-many pickup and delivery vehicle routing problem. Int. J. Prod. Res. 2024, 62, 3146–3175. [Google Scholar]
- Van Veldhuizen, D.A.; Lamont, G.B. Evolutionary computation and convergence to a Pareto front. In Proceedings of the Late Breaking Papers at the Genetic Programming 1998 Conference, Madison, WI, USA, 22–25 July 1998; pp. 221–228. [Google Scholar]
- Zitzler, E.; Thiele, L. Multiobjective optimization using evolutionary algorithms-A comparative case study. In Proceedings of the International Conference on Parallei Problem Solving from Nature, Amsterdam, The Netherlands, 27–30 September 1998; pp. 292–301. [Google Scholar]
- Deb, K.; Agrawal, S.; Pratap, A.; Meyarivan, T. A fast elitist non-dominated sorting genetic algorithm for multi-objective optimization: NAGA-II. In Proceedings of the International Conference on Parallei Problem Solving from Nature, Paris, France, 18–20 September 2000; pp. 849–858. [Google Scholar]
- Zitzler, E.; Thiele, L. Multiobjective evolutionary algorithms: A comparative case study and the strength Parote approach. IEEE Trans. Evol. Comput. 1999, 3, 257–271. [Google Scholar]


Disclaimer/Publisher’s Note: The statements, opinions and data contained in all publications are solely those of the individual author(s) and contributor(s) and not of MDPI and/or the editor(s). MDPI and/or the editor(s) disclaim responsibility for any injury to people or property resulting from any ideas, methods, instructions or products referred to in the content. |
© 2025 by the authors. Licensee MDPI, Basel, Switzerland. This article is an open access article distributed under the terms and conditions of the Creative Commons Attribution (CC BY) license (https://creativecommons.org/licenses/by/4.0/).