Abstract
In this paper, a new type of cogeneration system using LNG cold energy as a cooling source and geothermal energy as a heat source is designed and studied from the perspective of LNG cold energy gradient utilization. The system integrates power generation, cold storage, and district cooling. In order to provide more detailed information, the proposed system was analyzed in terms of energy, exergy, and economy. The effects of separator pressure, LNG pump outlet pressure, the mass flow rate of n-Pentane in ORC-I, liquefaction temperature of R23 in the cold storage module, and pump 5 outlet pressure in the refrigeration module on the performance of the system were also investigated. Additionally, the particle swarm algorithm (PSO) was used to optimize the CCHP system with multiple objectives to determine the system’s optimal operation. The optimization results show that the system’s thermal efficiency, exergy efficiency, and depreciation payback period are 66.06%, 42.52%, and 4.509 years, respectively.
1. Introduction
As a kind of clean energy, LNG has been becoming more and more significant in the global energy structure in recent years [1]. The temperature of LNG in its liquid state can be as low as −162 °C, indicating an abundance of cold energy [2]. Prior to being delivered to the user terminal, LNG undergoes a regasification process that releases around 830kJ/kg of cold energy [3]. Utilization of LNG cold energy not only improves the efficiency of energy utilization but also reduces energy costs and reduces the impact on the environment [4,5,6]. The green transformation of the chemical, refrigeration, and power industries can be accelerated by effectively utilizing the cold energy released during the storage, transportation, and regasification of LNG [7,8]. Therefore, exploring diversified applications of LNG cold energy has become an important direction to promote sustainable development.
Geothermal energy, as a form of clean energy with plentiful supplies, low carbon emission, a stable supply at any time, and huge potential for power generation, has gained widespread attention worldwide [9,10]. For the purpose of recovering geothermal energy, Mosaffa and Zareei [11] designed a flash binary system with an integrated heat exchanger. Also, two strategies were used to raise the system’s efficiency. Fallah et al. [12] examined numerous geothermal power generation cycles in terms of energy, exergy, and thermo-economic perspectives. The findings show that, while it has the highest power output of all the systems considered, the triple-flash vaporization cycle is not economically viable from a thermo-economic standpoint. In contrast, the dry steam cycle had the highest energy and energy efficiency of all the systems studied. Mardan Dezfouli et al. [13] presented a new combined geothermal power plant cycle and evaluated the system employing a contingency analysis, which showed that injecting LNG streams increased the cycle’s net power output, overall contingency economic efficiency, and contingency environmental efficiency by 1.79 MW, 14%, and 16%, respectively. Khanmohammadi and Musharavati [14] conceptualized and investigated a unique hybrid cascade power generation system. The optimization outcomes indicate that the system’s optimal output power is 32,183.44 kW, the optimal sustainability index is 2.062, and the optimal total cost rate is 12.69 USD/h.
The most extensively researched simple power-generating cycle is the organic Rankine cycle (ORC) [15]. Li et al. [16] selected eight binary mixtures of CO2 as working fluids for ORC and studied their effects on the thermodynamic properties of ORC, and the results showed that CO2/R134a achieved the highest net power output of 13.50 kW among the eight alternative CO2-based binary mixtures. The demand for cryopreservation of various goods and foodstuffs is growing, which means that cold storage facility design is becoming more and more crucial [17,18]. Cold storage facilities typically operate in the −60 °C to 0 °C temperature range [19]. Messineo and Panno [20] proposed an LNG use model that utilizes CO2 as a secondary fluid to deliver LNG cold energy to ingredients, final goods, and refrigerated storage in hypermarkets.
Currently, the application of LNG in air conditioning and refrigeration is growing, mainly due to its advantages in efficient cooling and environmental protection. The low-temperature cold energy generated during the liquefaction process of LNG can be directly or indirectly utilized in air conditioning systems to provide efficient cooling solutions. This utilization of cold energy not only improves the overall efficiency of the cooling system but also eliminates the reliance on traditional refrigerants and energy sources, thereby reducing energy costs and greenhouse gas emissions. Ning et al. [21] proposed a combined cycle for cooling load and output power consisting of one food freezing storage, two food cooling storage, and two air conditioning refrigeration cycles. R717 was used as the refrigerant, and the results showed that the optimum utilization efficiency of the system was 85.19% with a coefficient of performance of 6.525.
Currently, research on LNG cold energy and geothermal energy combined power generation primarily focuses on system design and theoretical analysis, and is largely constrained by the geographical distribution differences between the two resources. However, the power generation technologies for utilizing these two energy sources separately are already well-established. For instance, Japan’s Osaka Gas Company utilizes LNG cold energy to achieve power generation through a propane Rankine cycle, with an annual output of 30 GWh. Meanwhile, China’s Fujian LNG project indirectly supports the regional grid through cold energy recovery. In the field of geothermal power generation, the Yangbajing Geothermal Power Station in Tibet employs flash cycle technology, with an installed capacity of 25 MW. In coastal areas rich in geothermal resources (such as southeastern China and the Philippines), the proximity to LNG receiving stations provides potential application scenarios for the combined utilization of the two.
This paper targets such scenarios and, from the perspective of energy cascade utilization, constructs a combined cooling, heating, and power (CCHP) system by using geothermal energy as the high-temperature heat source and LNG cold energy as the low-temperature cold source. The system consists of a geothermal single-flash cycle, a two-stage series organic Rankine cycle (ORC), a direct expansion module, and a cold storage and air conditioning module. Although this combined utilization model still faces challenges in practical engineering applications, such as geographical condition matching and system integration optimization, the study demonstrates through energy, exergy, and economic analyses, as well as optimization of key operational parameters, that the system can achieve efficient combined production of cooling, heating, and power. Moreover, economic indicators such as the payback period can be controlled at an optimal level, showcasing promising application prospects. This innovative energy coupling model provides a new technical pathway for the efficient utilization of clean energy.
2. System Description
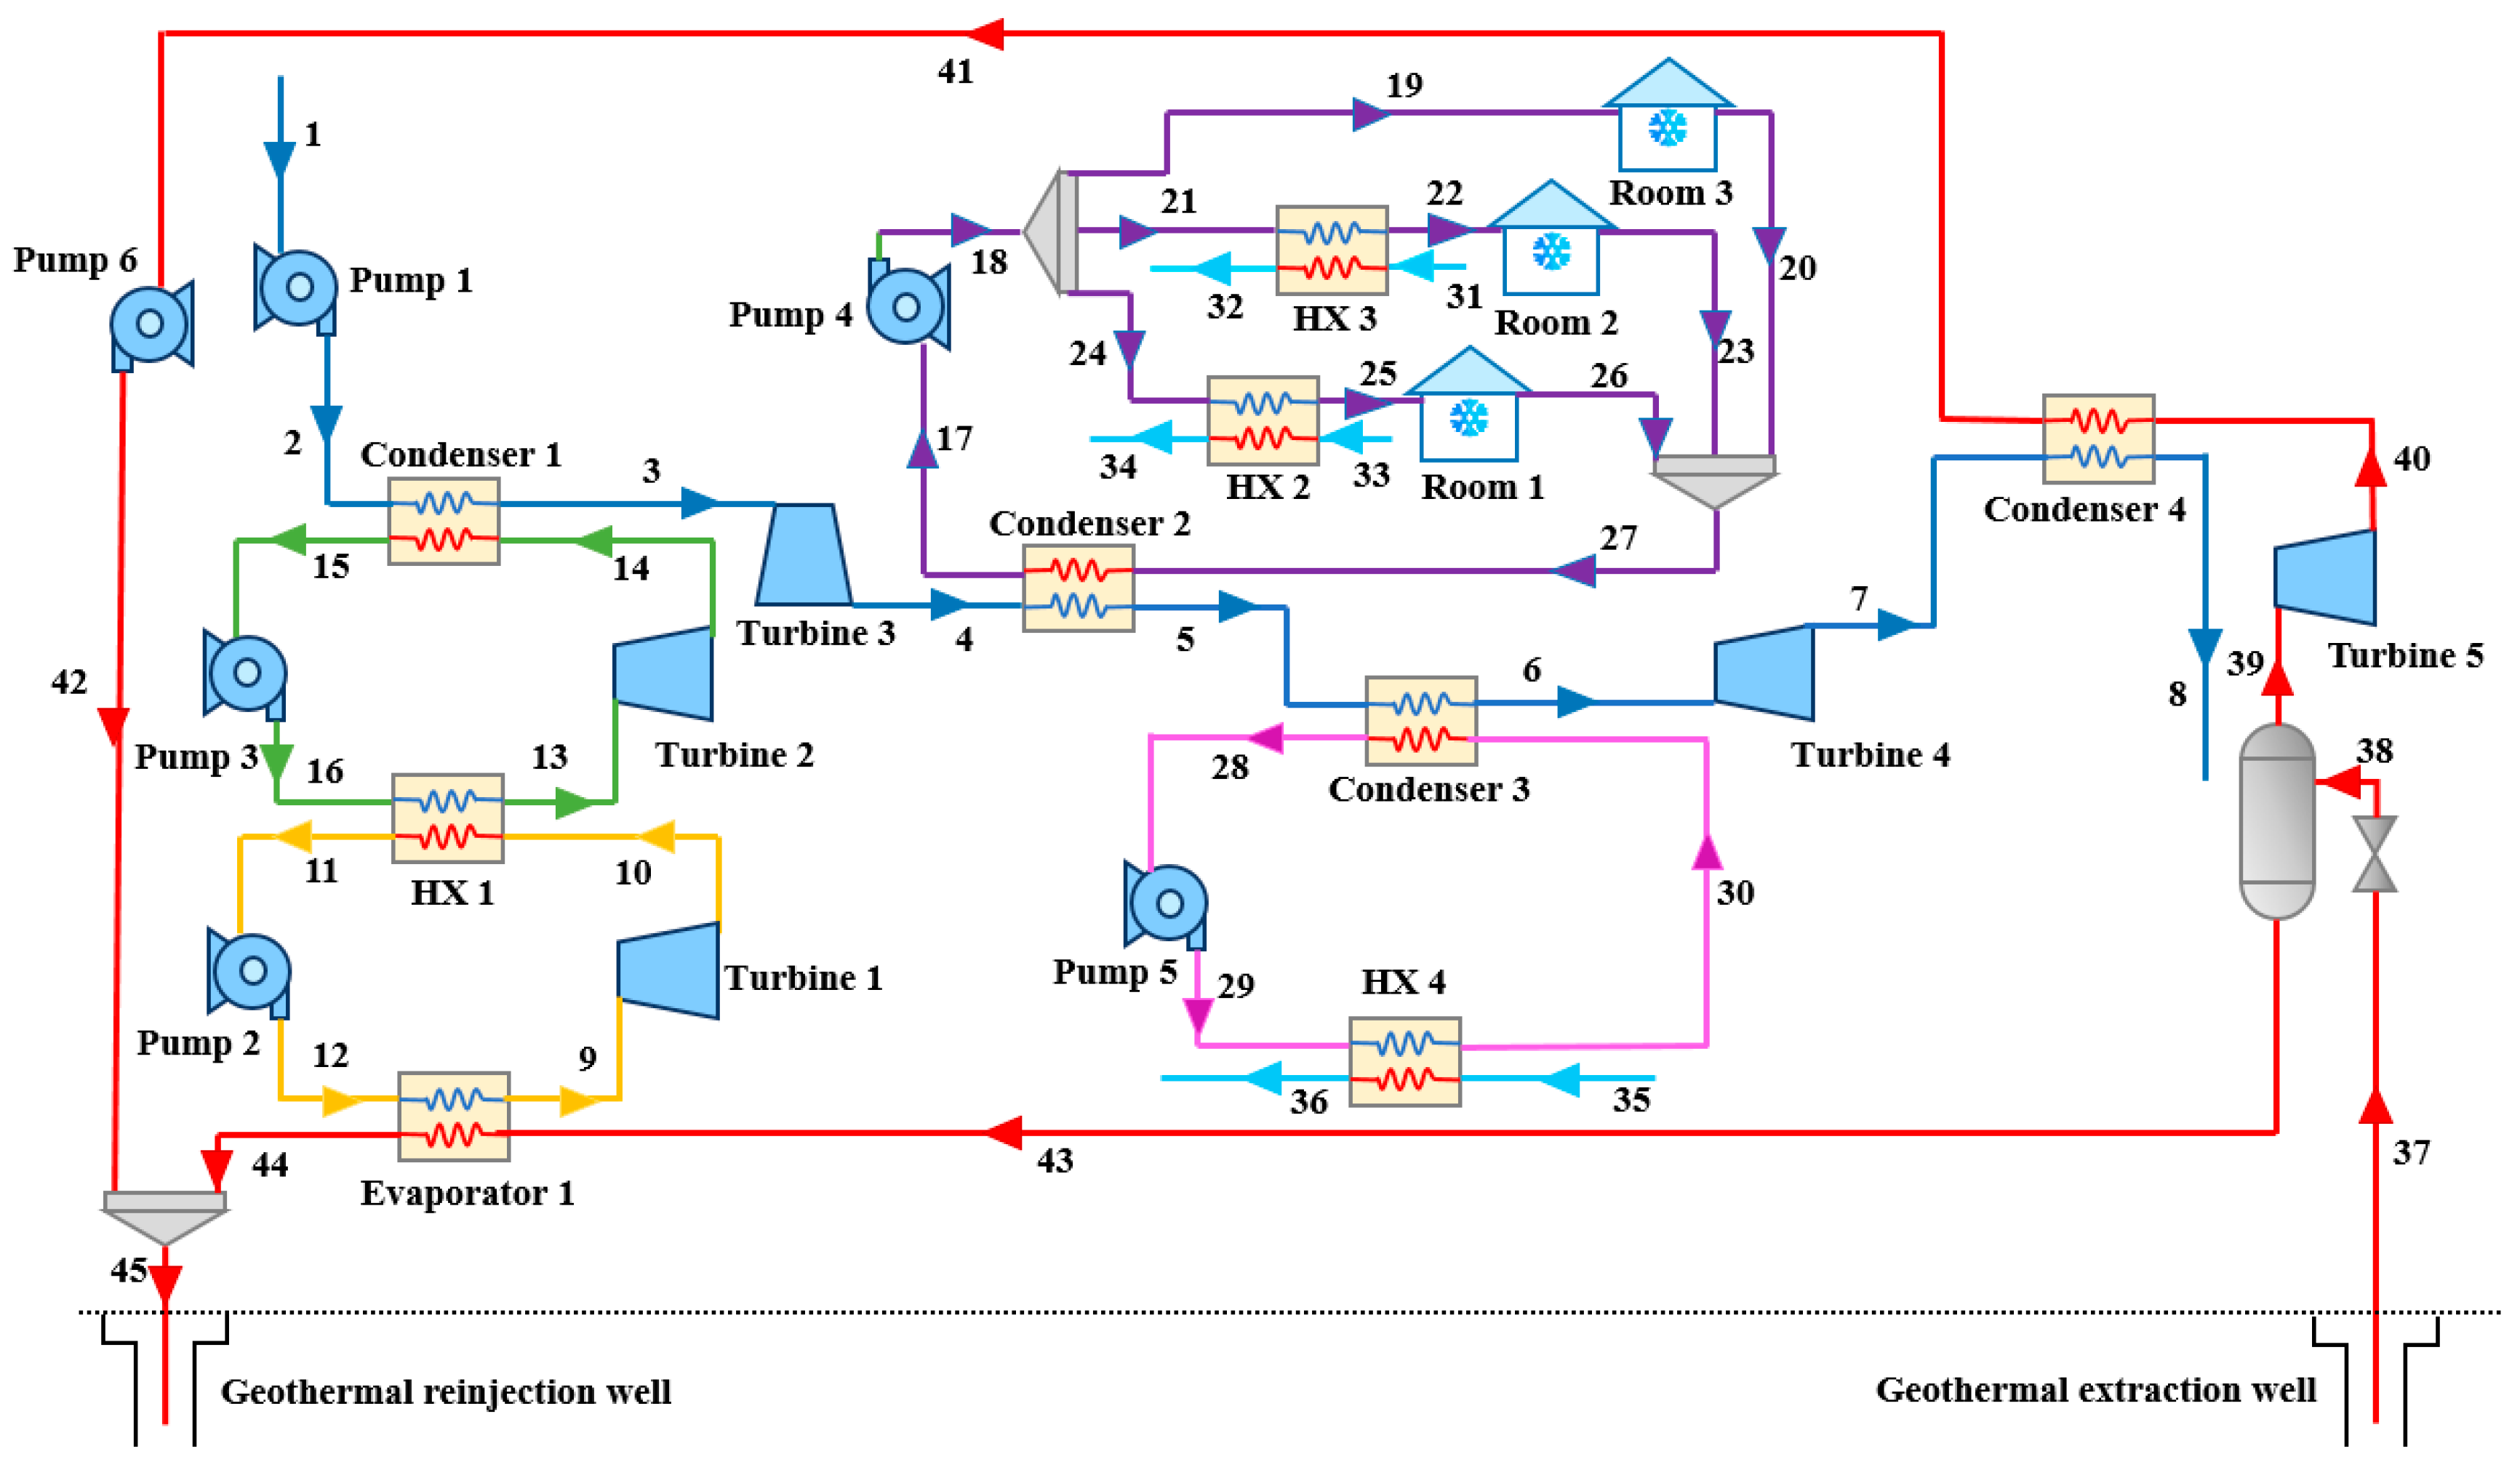
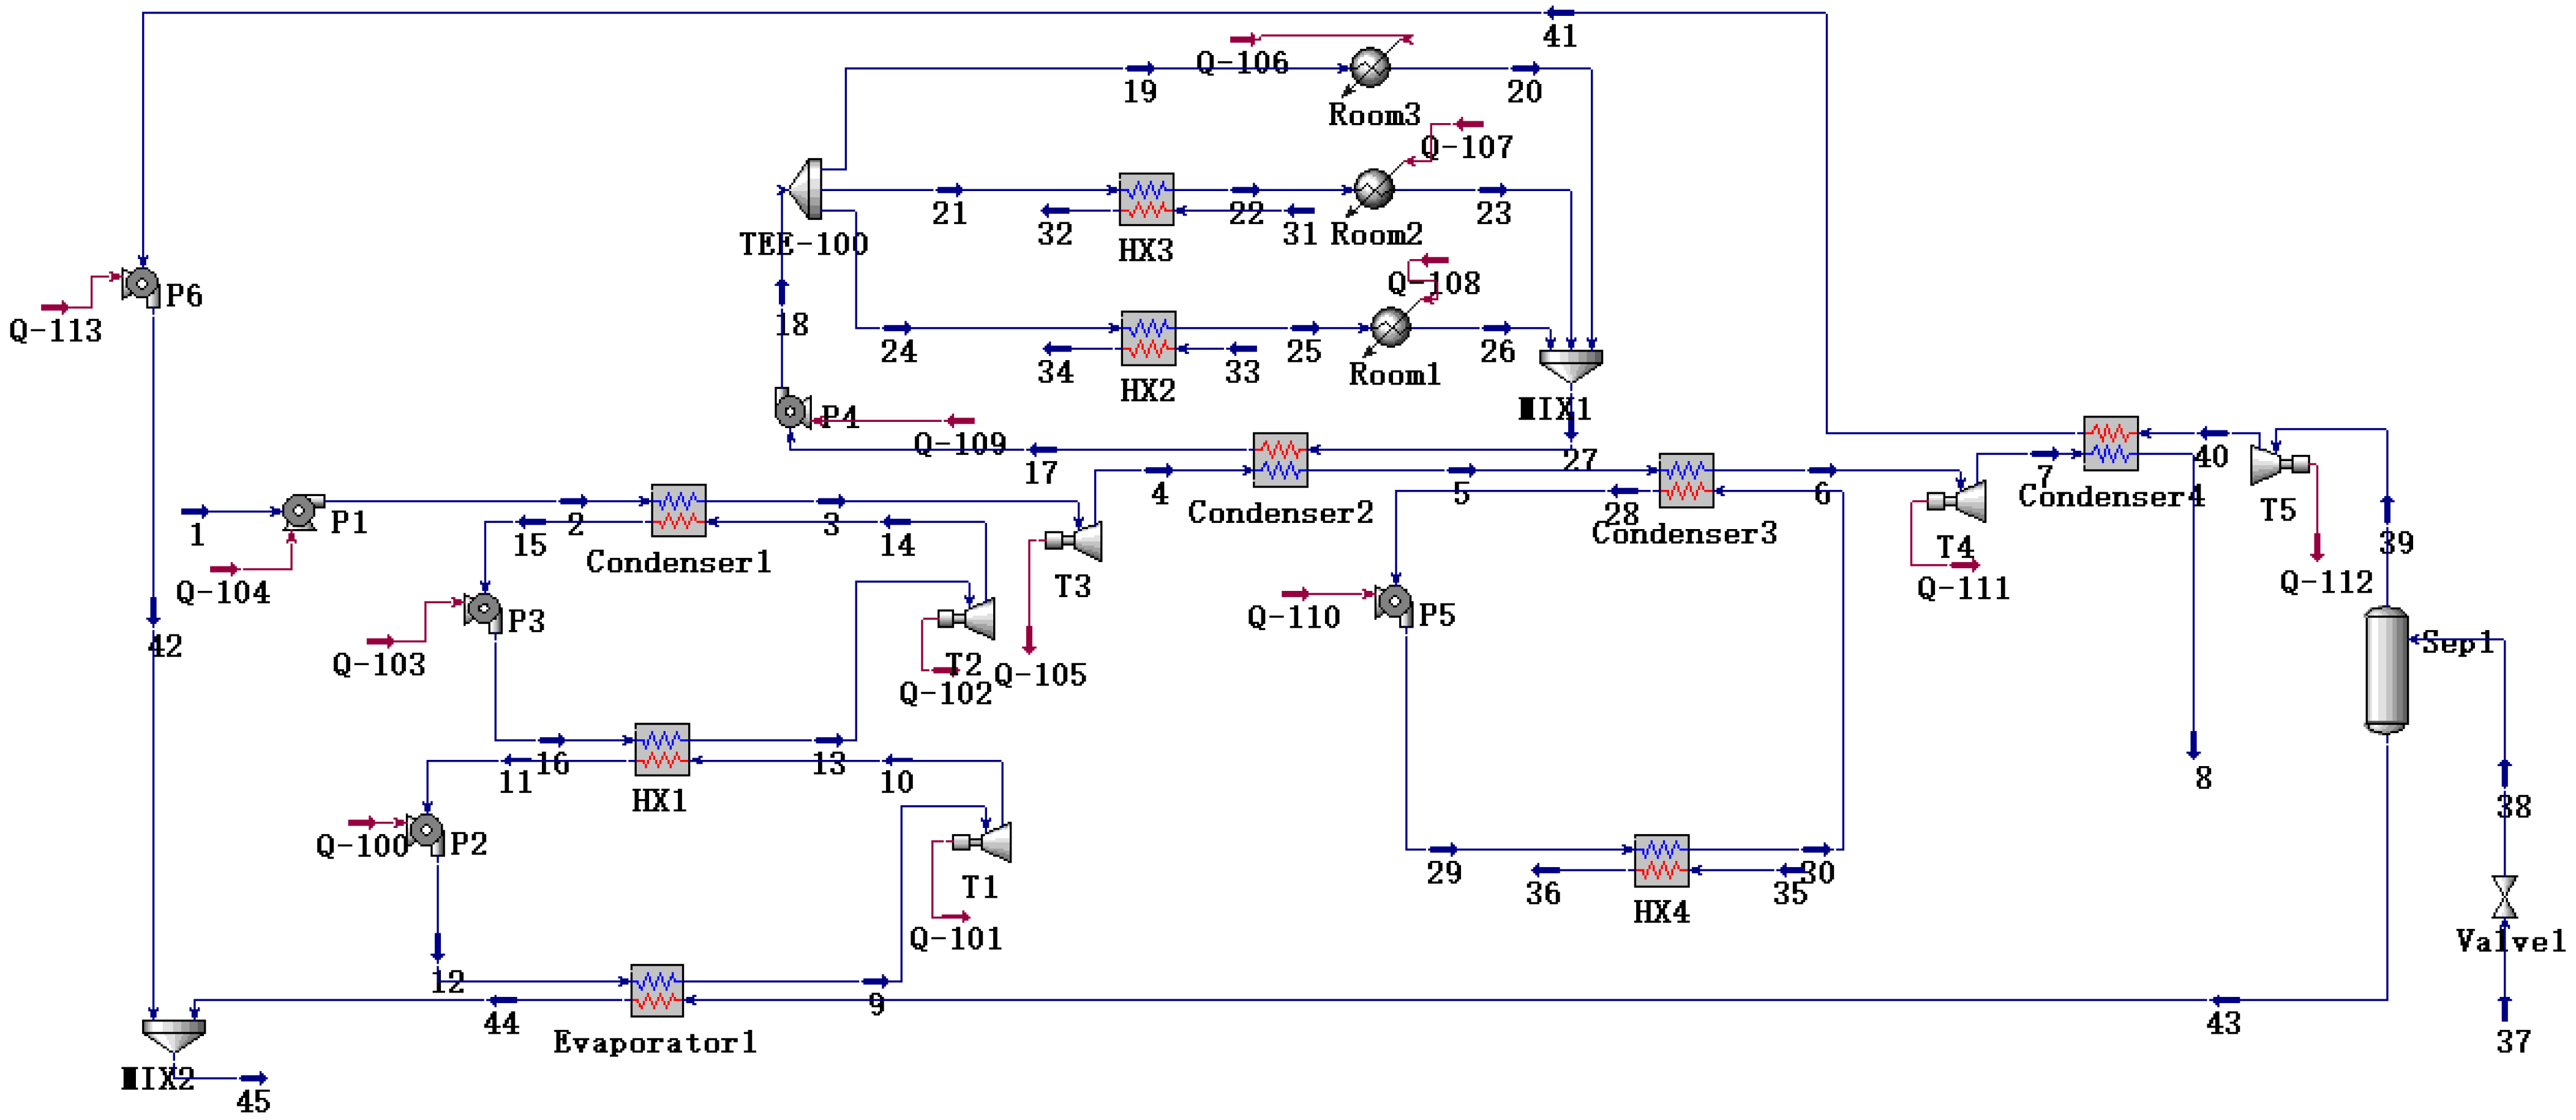
Figure 1 depicts the flow chart for the proposed new combined cooling, heating, and power (CCHP) system. The system utilizes the LNG cold energy in a stepwise manner to make full use of it, with −162 °C LNG as the cold source and 160 °C geothermal fluid as the heat source. The proposed system is composed of a geothermal flash cycle, a two-stage organic Rankine cycle (ORC-I and ORC-II), LNG direct expansion, a cold storage subsystem, and an air conditioning subsystem.
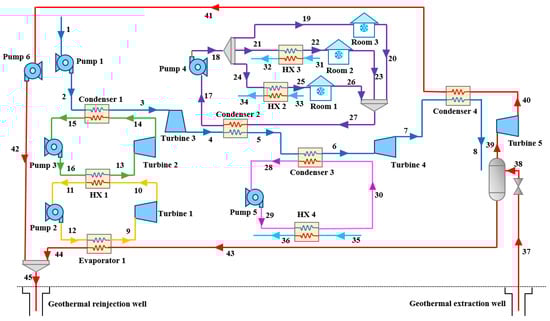
Figure 1.
Flowchart of the proposed CCHP.
The 160 °C high-temperature geothermal fluid from the geothermal well is depressurized by a valve to form a gas–liquid two-phase fluid, which then enters a separator and is split into saturated liquid and geothermal steam. The separated geothermal vapor reaches turbine 5 for power generation, is subsequently cooled into fluid by low-temperature natural gas in condenser 4, and finally is pressurized and delivered to mixer 2 by pump 6. The separated saturated liquid transfers heat to the ORC-I workings before being mixed with the liquid from pump 6 and injected into the geothermal reinjection well.
In ORC, the working fluid n-Pentane in ORC-I is heated to a high temperature, high-pressure vapor by the saturated geothermal fluid from the separator and then enters turbine 1 for expansion work. It is then cooled by the ORC-II’s work mass R600 and pumped by pump 1 to evaporator 1 to complete a cycle. In ORC-II, gaseous R600 is chilled to a state of liquid by LNG in condenser 1 and then passes through pump 3 to boost pressure to 1300 kPa, transfers into HX1 to be heated to gaseous state by n-Pentane, and then transfers into turbine 2 for power generation, and finally returns to HX1 to complete a cycle.
In cold storage module, R23 is used as the refrigerant. R23 is first cooled to −65 °C by NG in condenser 2 and then boosted to 4000 kPa by pump 4. The boosted R23 is divided into three strands. The first strand exchanges heat with seawater in HX2 to produce cold water at 3.77 °C. The R23 is heated to −20 °C to enter shallow cold storage area 1, which provides 110 kW of cooling energy. The warmed R23 enters the mixer and then merges into stream 27. The second strand of R23 exchanges heat with saltwater in HX3 to produce cold water at 14.3 °C. R23 is heated to −35 °C and enters intermediate cold storage area 2, providing 210kW of cold energy then merges into stream 27. The third strand of R23 enters directly into deep cold storage area 3, providing 310 kW of cold energy, then merges into stream 27. Stream 27 then enters condenser 3 to exchange heat with the LNG to complete a cycle (Figure 2).
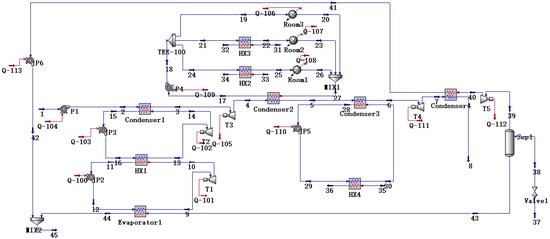
Figure 2.
Aspen HYSYS model of CCHP.
In the air conditioning module, 40% ethylene glycol solution is used as the refrigerant. Firstly, 7 °C, 1000 kPa ethylene glycol solution is condensed to −20 °C by the cryogenic NG in condenser 3 and then enters pump 5 to boost the pressure by 2000 kPa. The uplifted refrigerant enters the HX 4 to deliver cold energy to the cooling recirculating water, which cools to 7 °C before entering condenser 3 to finish the cycle.
At −162 °C, 110 kPa LNG enters pump 1, is pressurized by pump 1 to 3000 kPa, and then flows into condenser 1 to deliver a portion of the cold energy to ORC, and then enters turbine 3, where it exerts a cooling effect to maintain cold source temperatures in cold storage areas. The cooled NG enters condenser 2 and condenser 3 in turn to provide cold energy for the cold storage module and refrigeration module, respectively. It then enters turbine 4 for power generation purposes and finally enters condenser 4 to be heated to ambient temperature by the geothermal fluid.
3. System Modeling and Performance Evaluation
3.1. System Assumptions
The thermodynamic properties of fluids in the system were calculated using the Peng–Robinson equation of state in Aspen HYSYS V10, AspenTech, Bedford, MA, USA, which is suitable for hydrocarbon mixtures and cryogenic processes involving LNG. This property package was selected due to its accuracy in predicting vapor–liquid equilibrium and enthalpy changes under low-temperature conditions. The following assumptions were made to facilitate the thermodynamic calculations and economic analysis for the system:
(1) The operational state of the system is kept stable [22];
(2) Heat and friction losses in the piping and equipment, in addition to variations in the system’s kinetic and potential energy, are neglected [23];
(3) The heat exchanger, evaporator, condenser, flash tank, separator, and mixer all have a zero pressure drop [24];
(4) The cold energy of LNG is predominantly governed by methane, while the influence of minor components on the system’s energy/exergy efficiency is negligible. Therefore, the LNG composition is assumed to be pure methane [25];
(5) The thermophysical property of pure liquid water is used as the thermophysical property of geothermal water [10];
(6) The geothermal water at the geothermal wellhead is saturated liquid;
(7) To avoid scaling problems in geothermal wells, geothermal water is reinjected at temperatures higher than 70 °C [10].
This study employs certain simplified assumptions in the modeling process, such as neglecting the influence of some secondary parameters, which may affect the precision of the results to some extent. Additionally, due to the complexity of real-world operating conditions, the model may not fully account for all potential uncertainties. Nevertheless, these simplifications have a limited impact on the overall research conclusions and do not alter the main findings and core contributions of this study.
The system’s fundamental parameters are displayed in Table 1.

Table 1.
Base simulation working conditions.
3.2. Energy Analysis
In the model of a stable operating system, there is an exchange of energy between the devices. The energy analysis is based on the first law of thermodynamics. The energy balance equation is defined as Equation (1) [26]:
Based on the foregoing equations, Table 2 displays the system’s energy balance equation.
Table 2.
Energy balance equations for appliance.
The total energy input to the system is expressed in Equation (2):
The system’s cooling energy is expressed in Equation (3).
The net generation of the system is counted by the following method:
The thermal efficiency of the proposed system is expressed in Equation (5):
3.3. Exergy Analysis
Only physical energy is taken into account because kinetic and potential energy changes are neglected because of the absence of chemical reactions throughout the cycle. Each flow’s exergy is described as [27,28]
where represents the ambient temperature (298.15 K), and the generation and generation respectively reflect the enthalpy and entropy at scalar state ( = 298.15 K, P0 = 101.325 kPa) [29].
In the exergy analysis, the exergy-balance equation is stated as
where generation, generation, and generation, respectively, represent the fuel exergy, product exergy, and exergy loss of equipment k in the system [30].
Table 3 shows the exergy-balance equations for the system’s equipment.
Table 3.
Equation of exergy-balance equation.
The system’s cooling exergy is expressed in Equation (8):
For the proposed system, the exergy efficiency can be calculated by Equation (9):
3.4. Economic Analysis
is the initial capital cost of the kth piece of equipment, and the corresponding Table 4 displays the for the major pieces of equipment in the system. The economic value of valves, flash tanks, and mixers is so minimal that they are overlooked.
Table 4.
The initial invested cost of the chief equipment [27].
The heat transfer area () of the kth unit can be computed using Equation (10) [31]:
The heat load of each equipment is denoted by (kW) and the logarithmic mean temperature differential is represented by . (K) is the logarithmic mean temperature difference. (kW/m−2K−1) is the heat exchanger’s overall heat transfer coefficient, which is listed in Table 5 for the various heat exchanger types.
Table 5.
Total heat transfer coefficients for different heat transfer equipment [32].
When we introduce chemical cost index , is 802.6 and is 394.3. is the reference year asset cost of component k, calculated by the following formula [33]:
The total investment cost of equipment can be calculated by the following formula:
The annual net assets of the system are the sum of power generation income and heat income [34]:
Among them, for industrial electricity price USD/kWh [35]; , the annual operating time of the system on behalf of h; is the heating price of [36].
The depreciation payback period () of the system is defined as follows [37]:
where represents the annual interest rate, set ; represents system management and operation costs, and = , represent the management and operation cost factor, for which .
4. Results and Discussion
4.1. Model Validation
To verify the feasibility of the process, the simulated data were compared with data from the published literature. The data of Wang et al. [38] were used to validate the mathematical model of the geothermal single-flash cycle, while the data from Pan et al. [39] were employed to verify the mathematical model of the ORC. The validation results, presented in Table 6 and Table 7, show deviations not exceeding 2%, demonstrating good agreement. This confirms the correctness and reliability of the proposed model.
Table 6.
Validation of geothermal single-flash cycle results.
Table 7.
Validation of two-stage organic rankine cycle results.
4.2. Simulation Results
This study’s proposed CCHP system integrates power generation, cold storage, and regional cooling. Table 8 lists some of the key thermodynamic characteristics for the logistics in the CCHP system presented in the study. This includes flow fluid, temperature (), pressure (), mass flow () enthalpy (), entropy (), and exergy ().
Table 8.
Thermodynamic parameters of the CCHP system.
Due to the irreversible nature of the equipment, the flow of stream strands through it eventually results in exergy loss, which is a parameter that measures the equipment’s performance. Table 9 lists the exergy loss and the percentage of exergy loss of each equipment. It is worth noting that the exergy loss and economic cost of the valve, flash tank, and mixer are minimal and may be overlooked. From Table 9, it can be seen that condenser 1 reports the highest percentage of exergy loss (50.90%), and the value of the exergy loss is 2859.67 kW, followed by Condenser 4 (5.55%) and Turbine 3 (7.54%). This distribution highlights that the primary thermodynamic losses occur during cryogenic heat exchange, attributable to three key factors: (1) the substantial temperature difference (~171 °C) between LNG (−162 °C) and organic fluid R600 (9.27 °C), (2) inherent irreversibilities in phase-change heat transfer, and (3) material conductivity constraints at low temperatures. To mitigate these losses, future system iterations could implement staged heat exchange to reduce thermal gradients, optimize working fluid pairs for better temperature glide matching, and adopt advanced heat exchanger geometries (e.g., plate-fin designs). The smallest percentage of energy loss is pump 6, which is only 0.0004%, which is approximated to zero. Notably, the cumulative exergy destruction across all components totals 5618.21 kW, confirming the closure of our exergy balance [40]. This analysis provides critical guidance for prioritizing efficiency improvements in integrated LNG–geothermal systems.
Table 9.
Exergy loss and proportion of each piece of equipment in the system [41].
Table 10 summarizes the CCHP system’s overall performance indicators under initial operating settings, including net power generation, the amount of cooling energy provided, the thermal efficiency, exergy efficiency, annual net assets, and depreciation recovery period. According to the results of thermodynamic characteristics of working fluid at various condition points offered by Aspen HYSYS, and through the calculations performed with the help of the formula mentioned above, it is concluded that CCHP system can generate 3756.38 kW of net power and 1448.59 kW of cold energy under the initial working conditions, with system thermal efficiency of 63.07%, exergy efficiency of 41.80%, and a depreciation recovery period of 4.559 years.
Table 10.
Overall performance of the CCHP system.
4.3. Parameter Research
In this section, we describe the effects of the separator pressure (), the LNG pump outlet pressure (), the mass flow rate of n-Pentane in ORC-I (), the liquefaction temperature of R23 in the cold storage section (), and the outlet pressure of pump 5 in the refrigeration module () on the net output power of the system (), the thermal efficiency (), the exergy efficiency (), and the depreciation payback period (PBP) of the system.
4.3.1. Separator Import Pressure
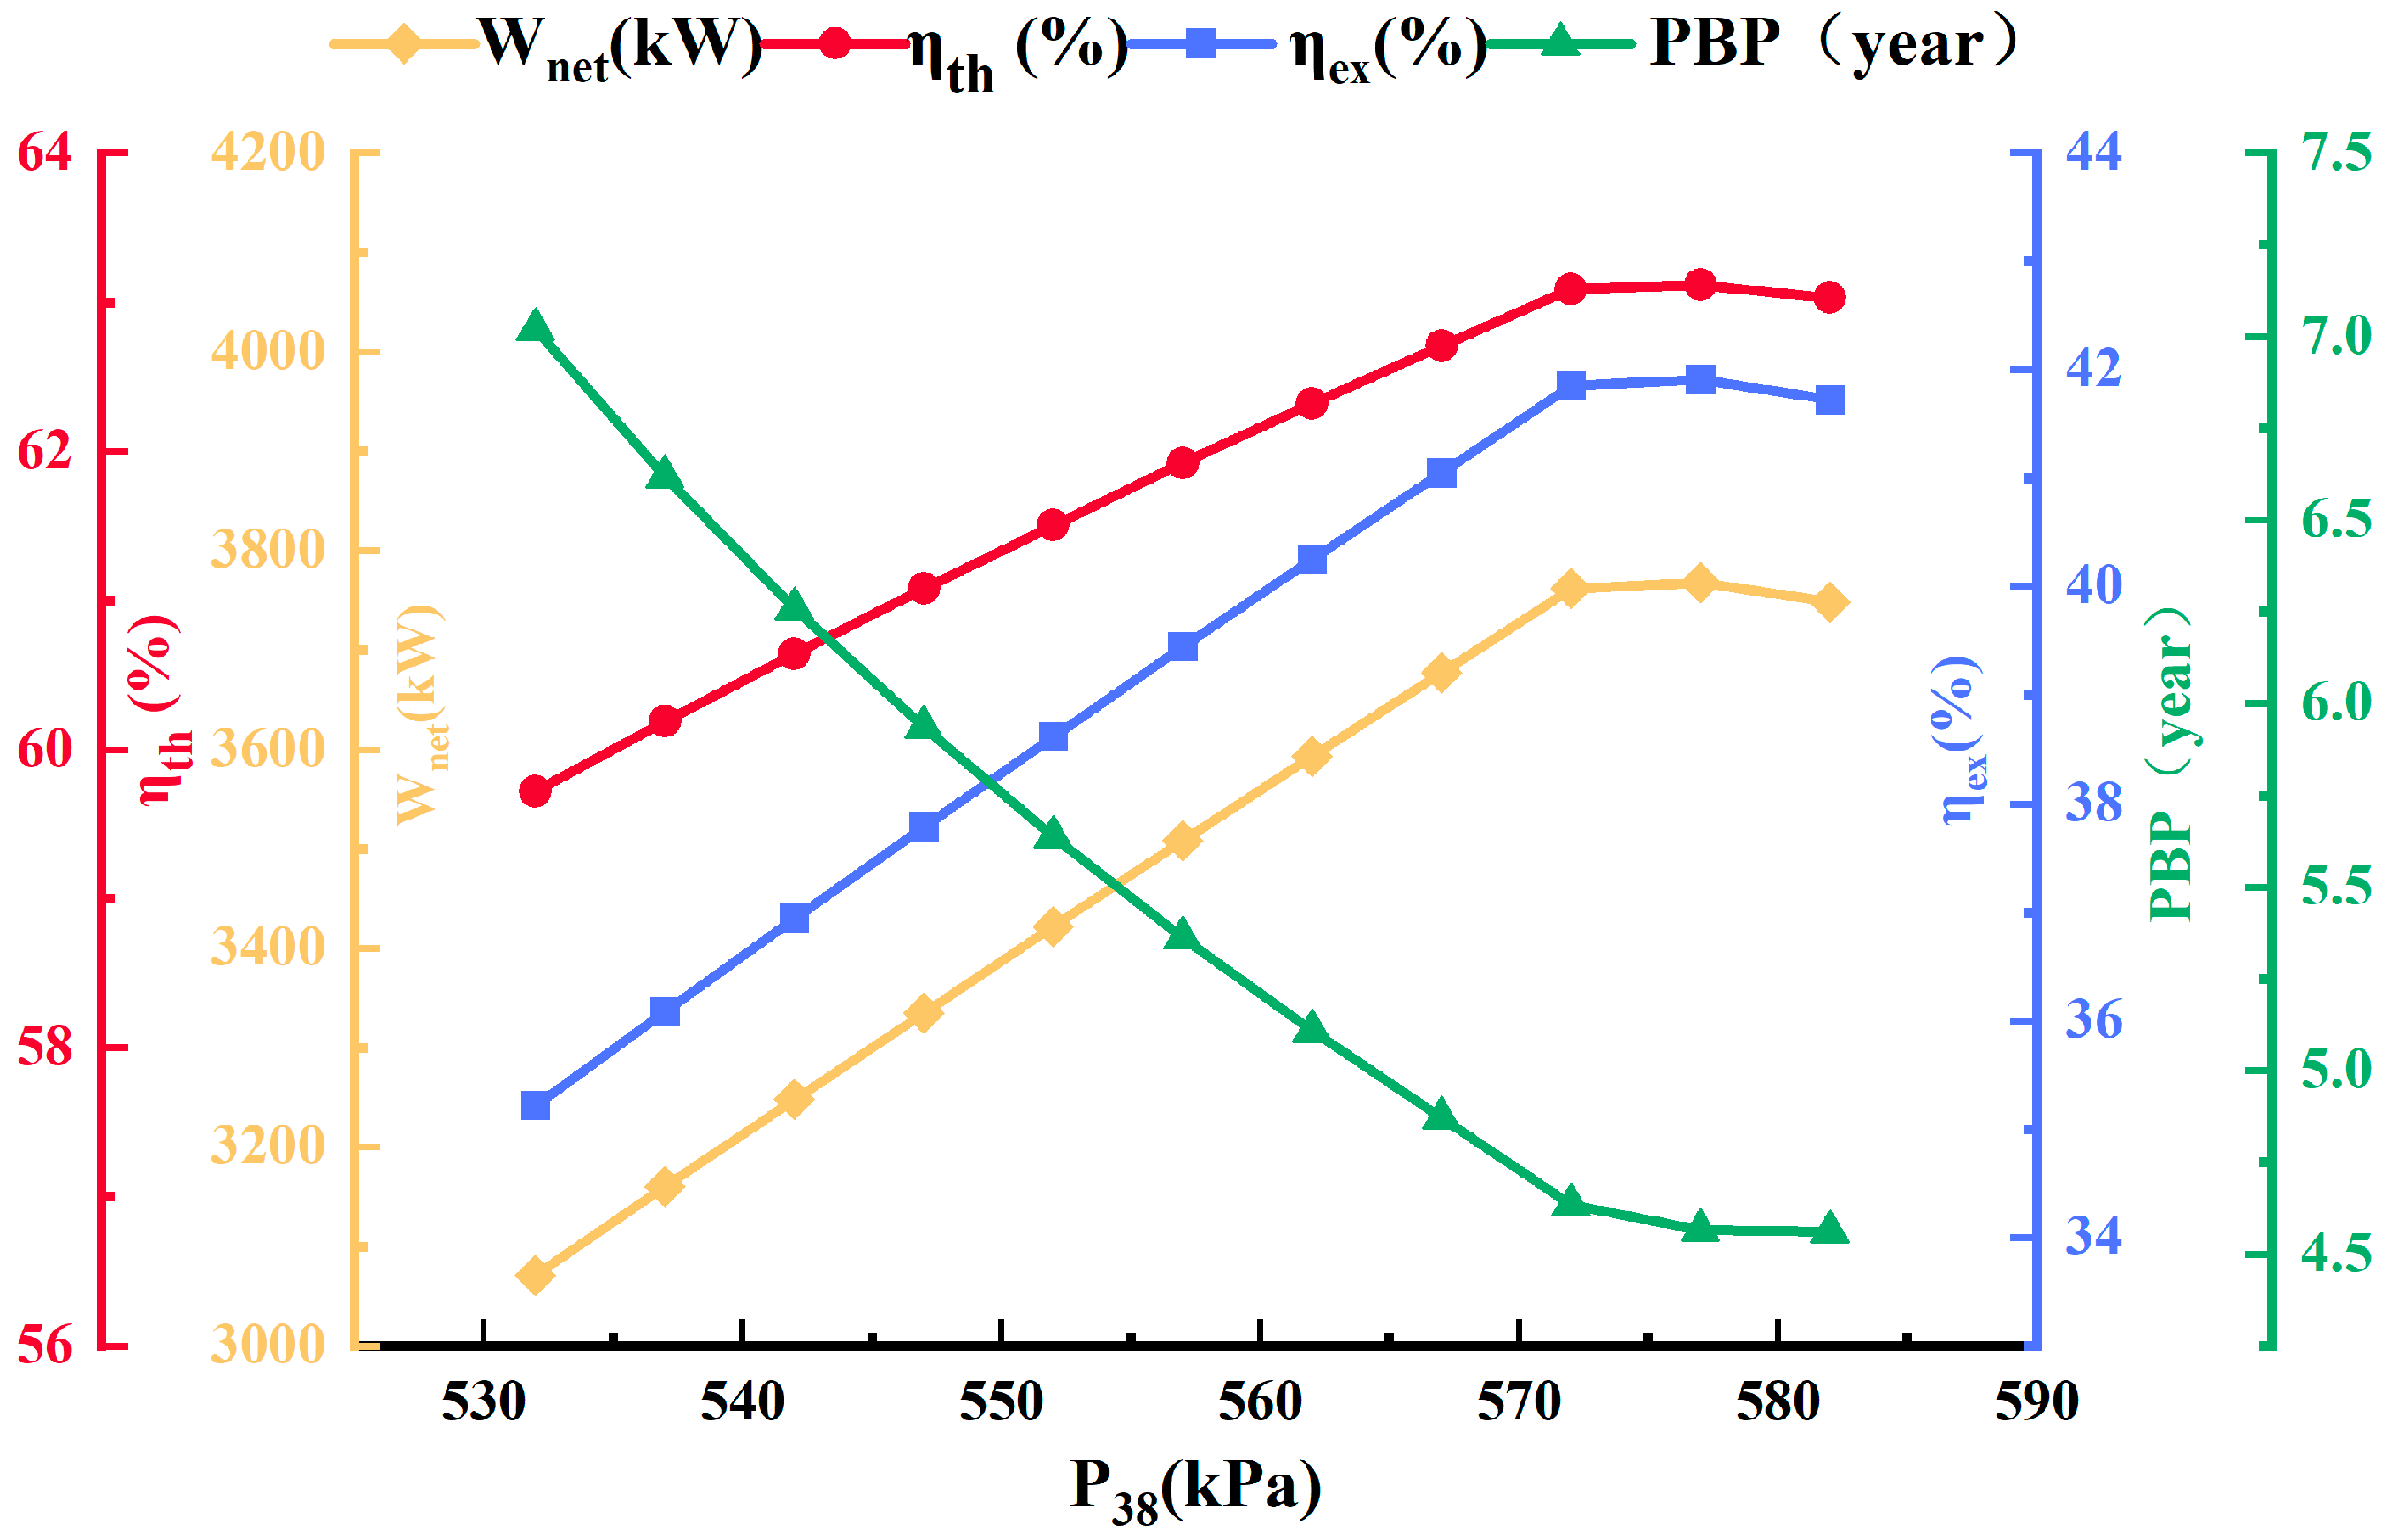
Figure 3 demonstrates how the separator inlet pressure () affects the system’s , , , and PBP. As the separator inlet pressure rises, the system’s rises and gradually falls. As increases, the temperature of the saturated geothermal vapor divided from the separator increases accordingly, and turbine 5’s enthalpy difference increases, which will lead to a tendency for the output power of the turbine to increase first. When grows, the boiling point of the geothermal water increases, so that the saturated geothermal vaporization mass flow separated by the separator decreases while the saturated geothermal water flow rate increases. The reduction in the saturated geothermal vapor mass flow rate reduces the output work performed by turbine 5, but the consequence of the decrease is bigger than the effect of the rise in the enthalpy distinction, so the total work of turbine 5 is reduced. Meanwhile, when grows, stream 41’s mass flow rate decreases, the temperature falls, the enthalpy difference decreases, and pump 6’s dissipated work decreases significantly. Under the combined influence of the two, the total output work of the system increases and then slowly decreases. In addition, improves and subsequently drops as grows. This is mainly because increasing the separator’s inlet pressure causes the system’s total output power to rise first and then decrease, while increasing boosts the system’s overall energy supply as well. However, the value of the system’s raises more than its overall energy input increases while the cold energy input maintains constant. Furthermore, the system’s is the same as its and as increasing . The rise in reduces the geothermal fluid outlet exergy, while the system’s cold exergy remains constant and the change in the geothermal water outlet exergy is much smaller than the shift in the net output power. Therefore, is increasing and then decreasing.
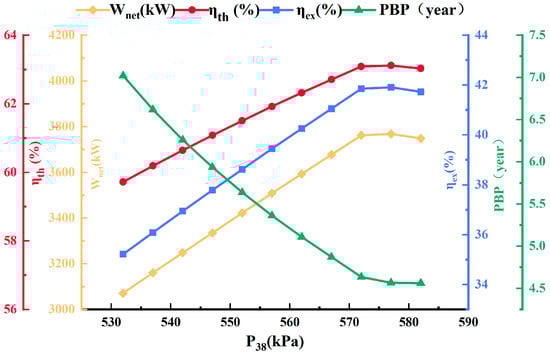
Figure 3.
Variation of system performance with separator inlet pressure ().
The system’s decreases reduces as increases. As rises, the investment cost of turbine 5, pump 6, and evaporator 1 decreases, but the investment cost of condenser 4 rises. The decreasing value of the system’s outweighs the increasing value, so the system’s gradually decreases, as does its
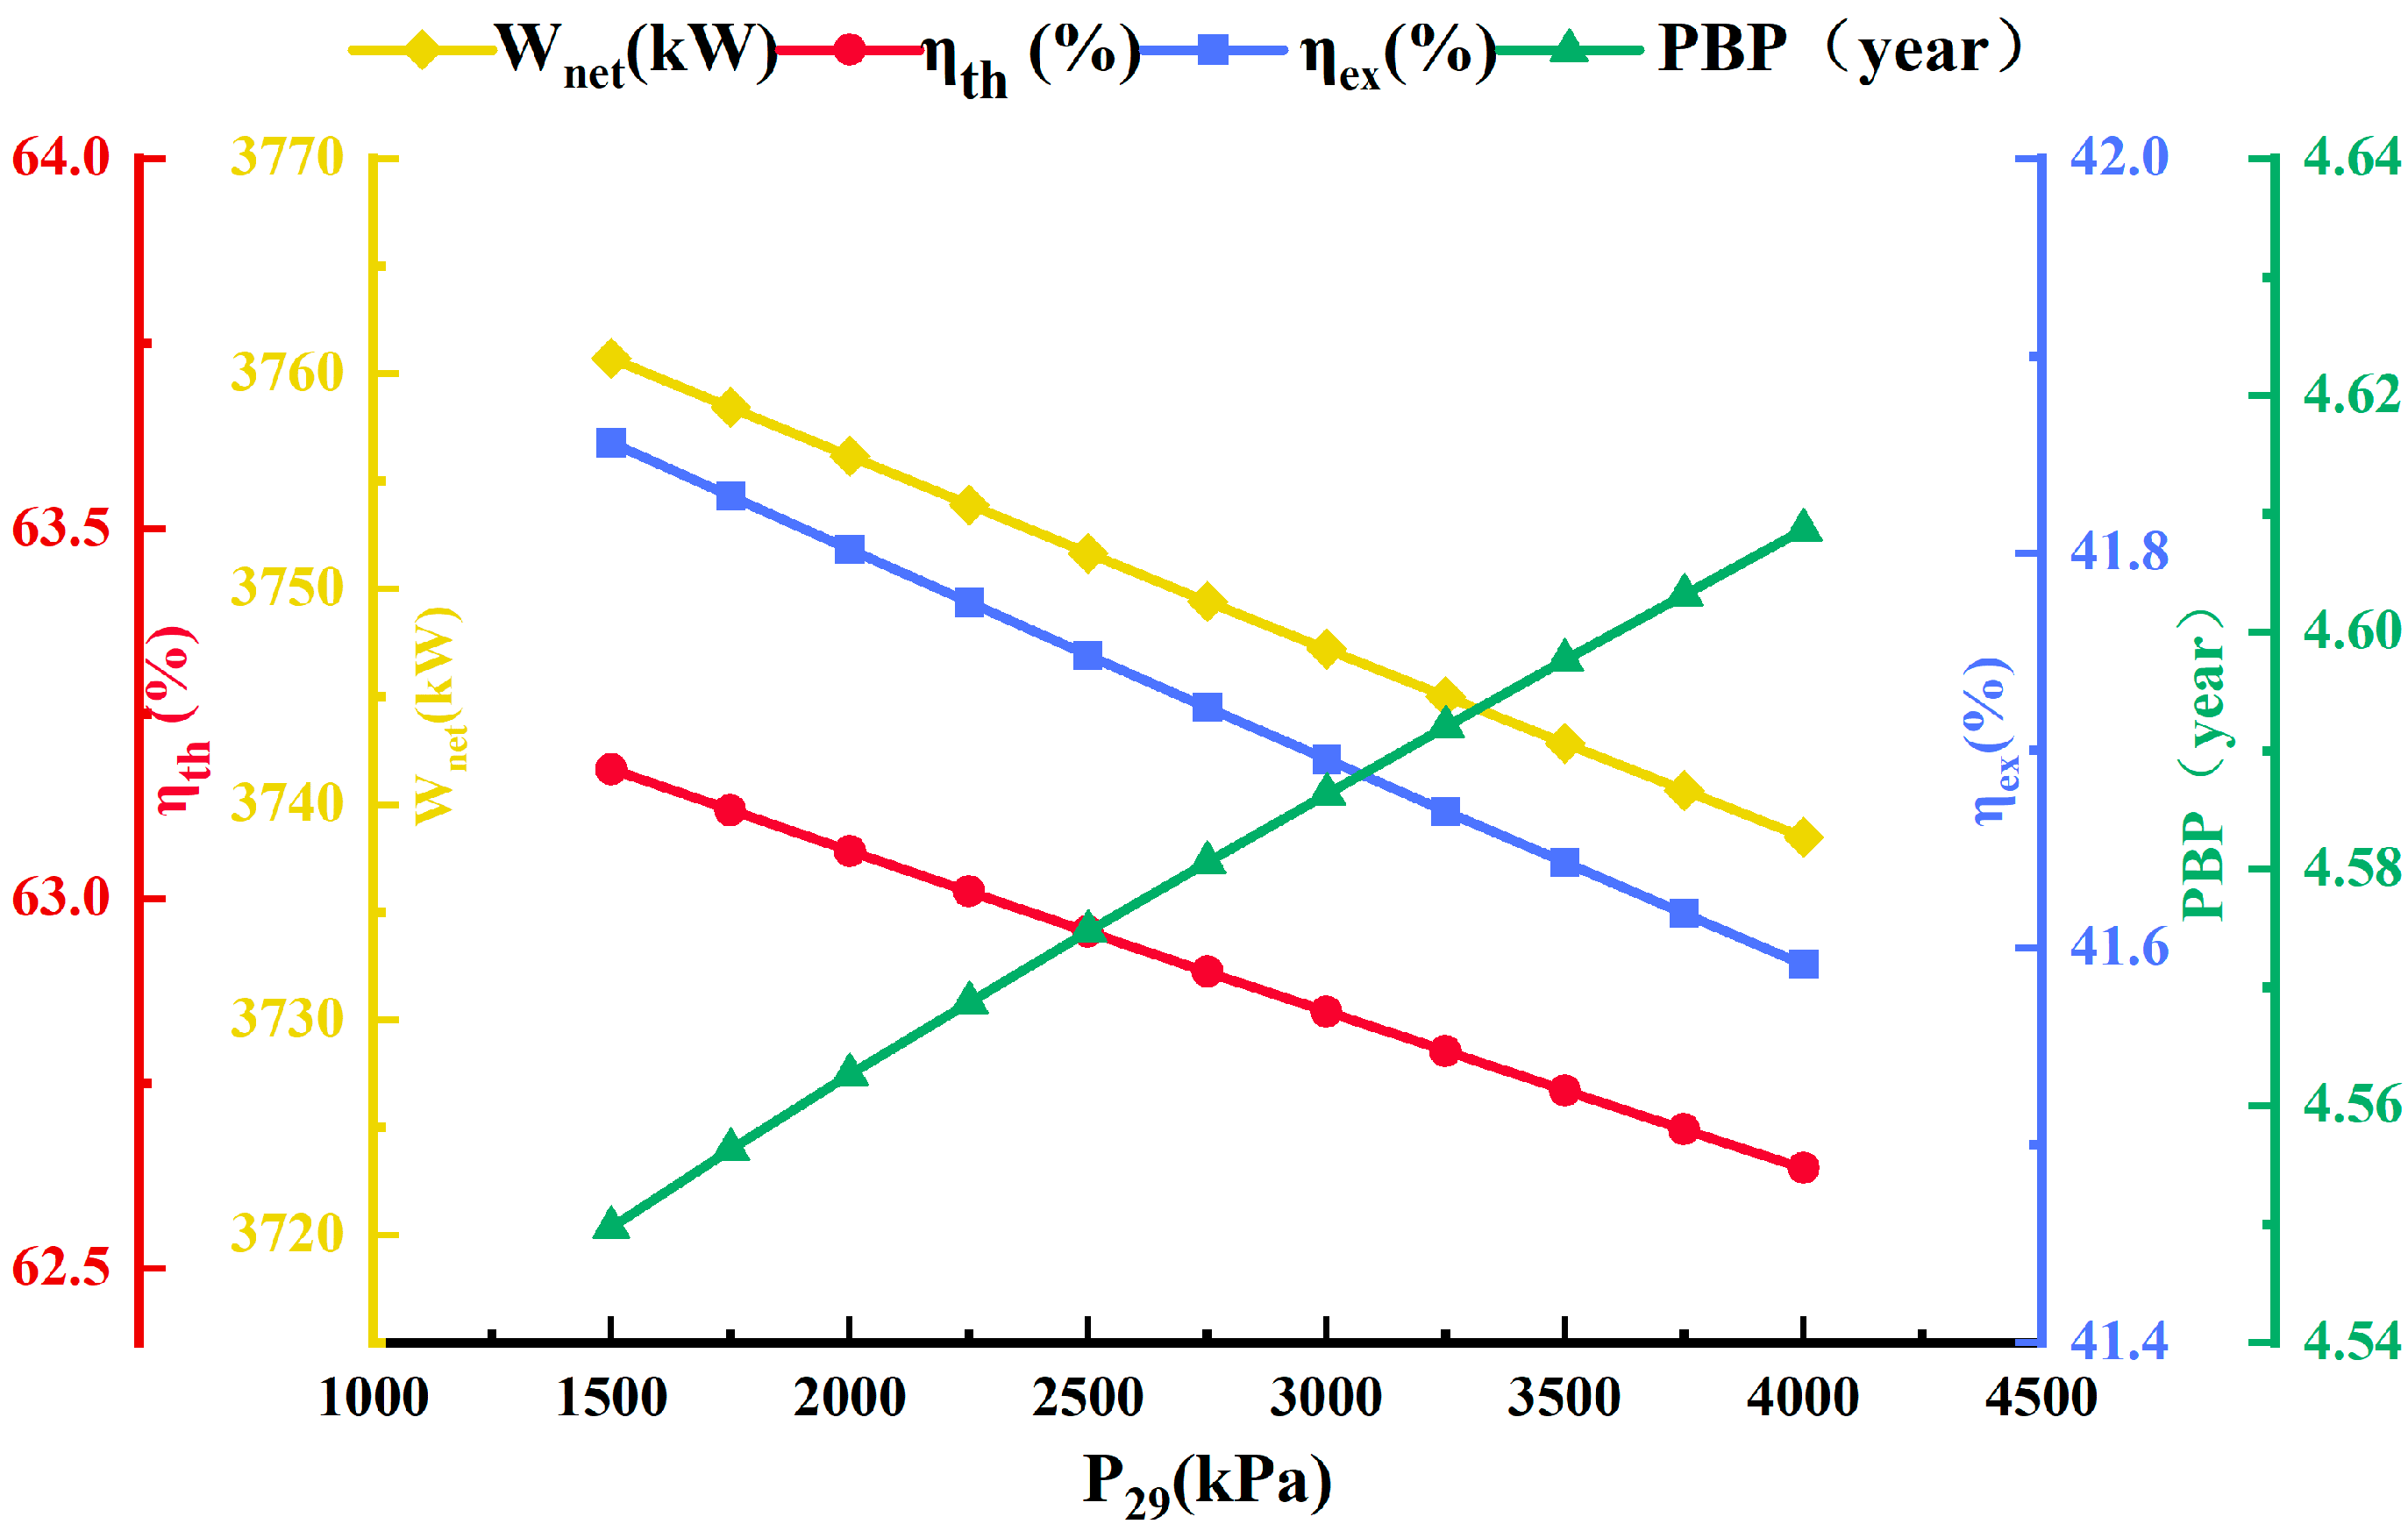
4.3.2. LNG Pump Outlet Pressure
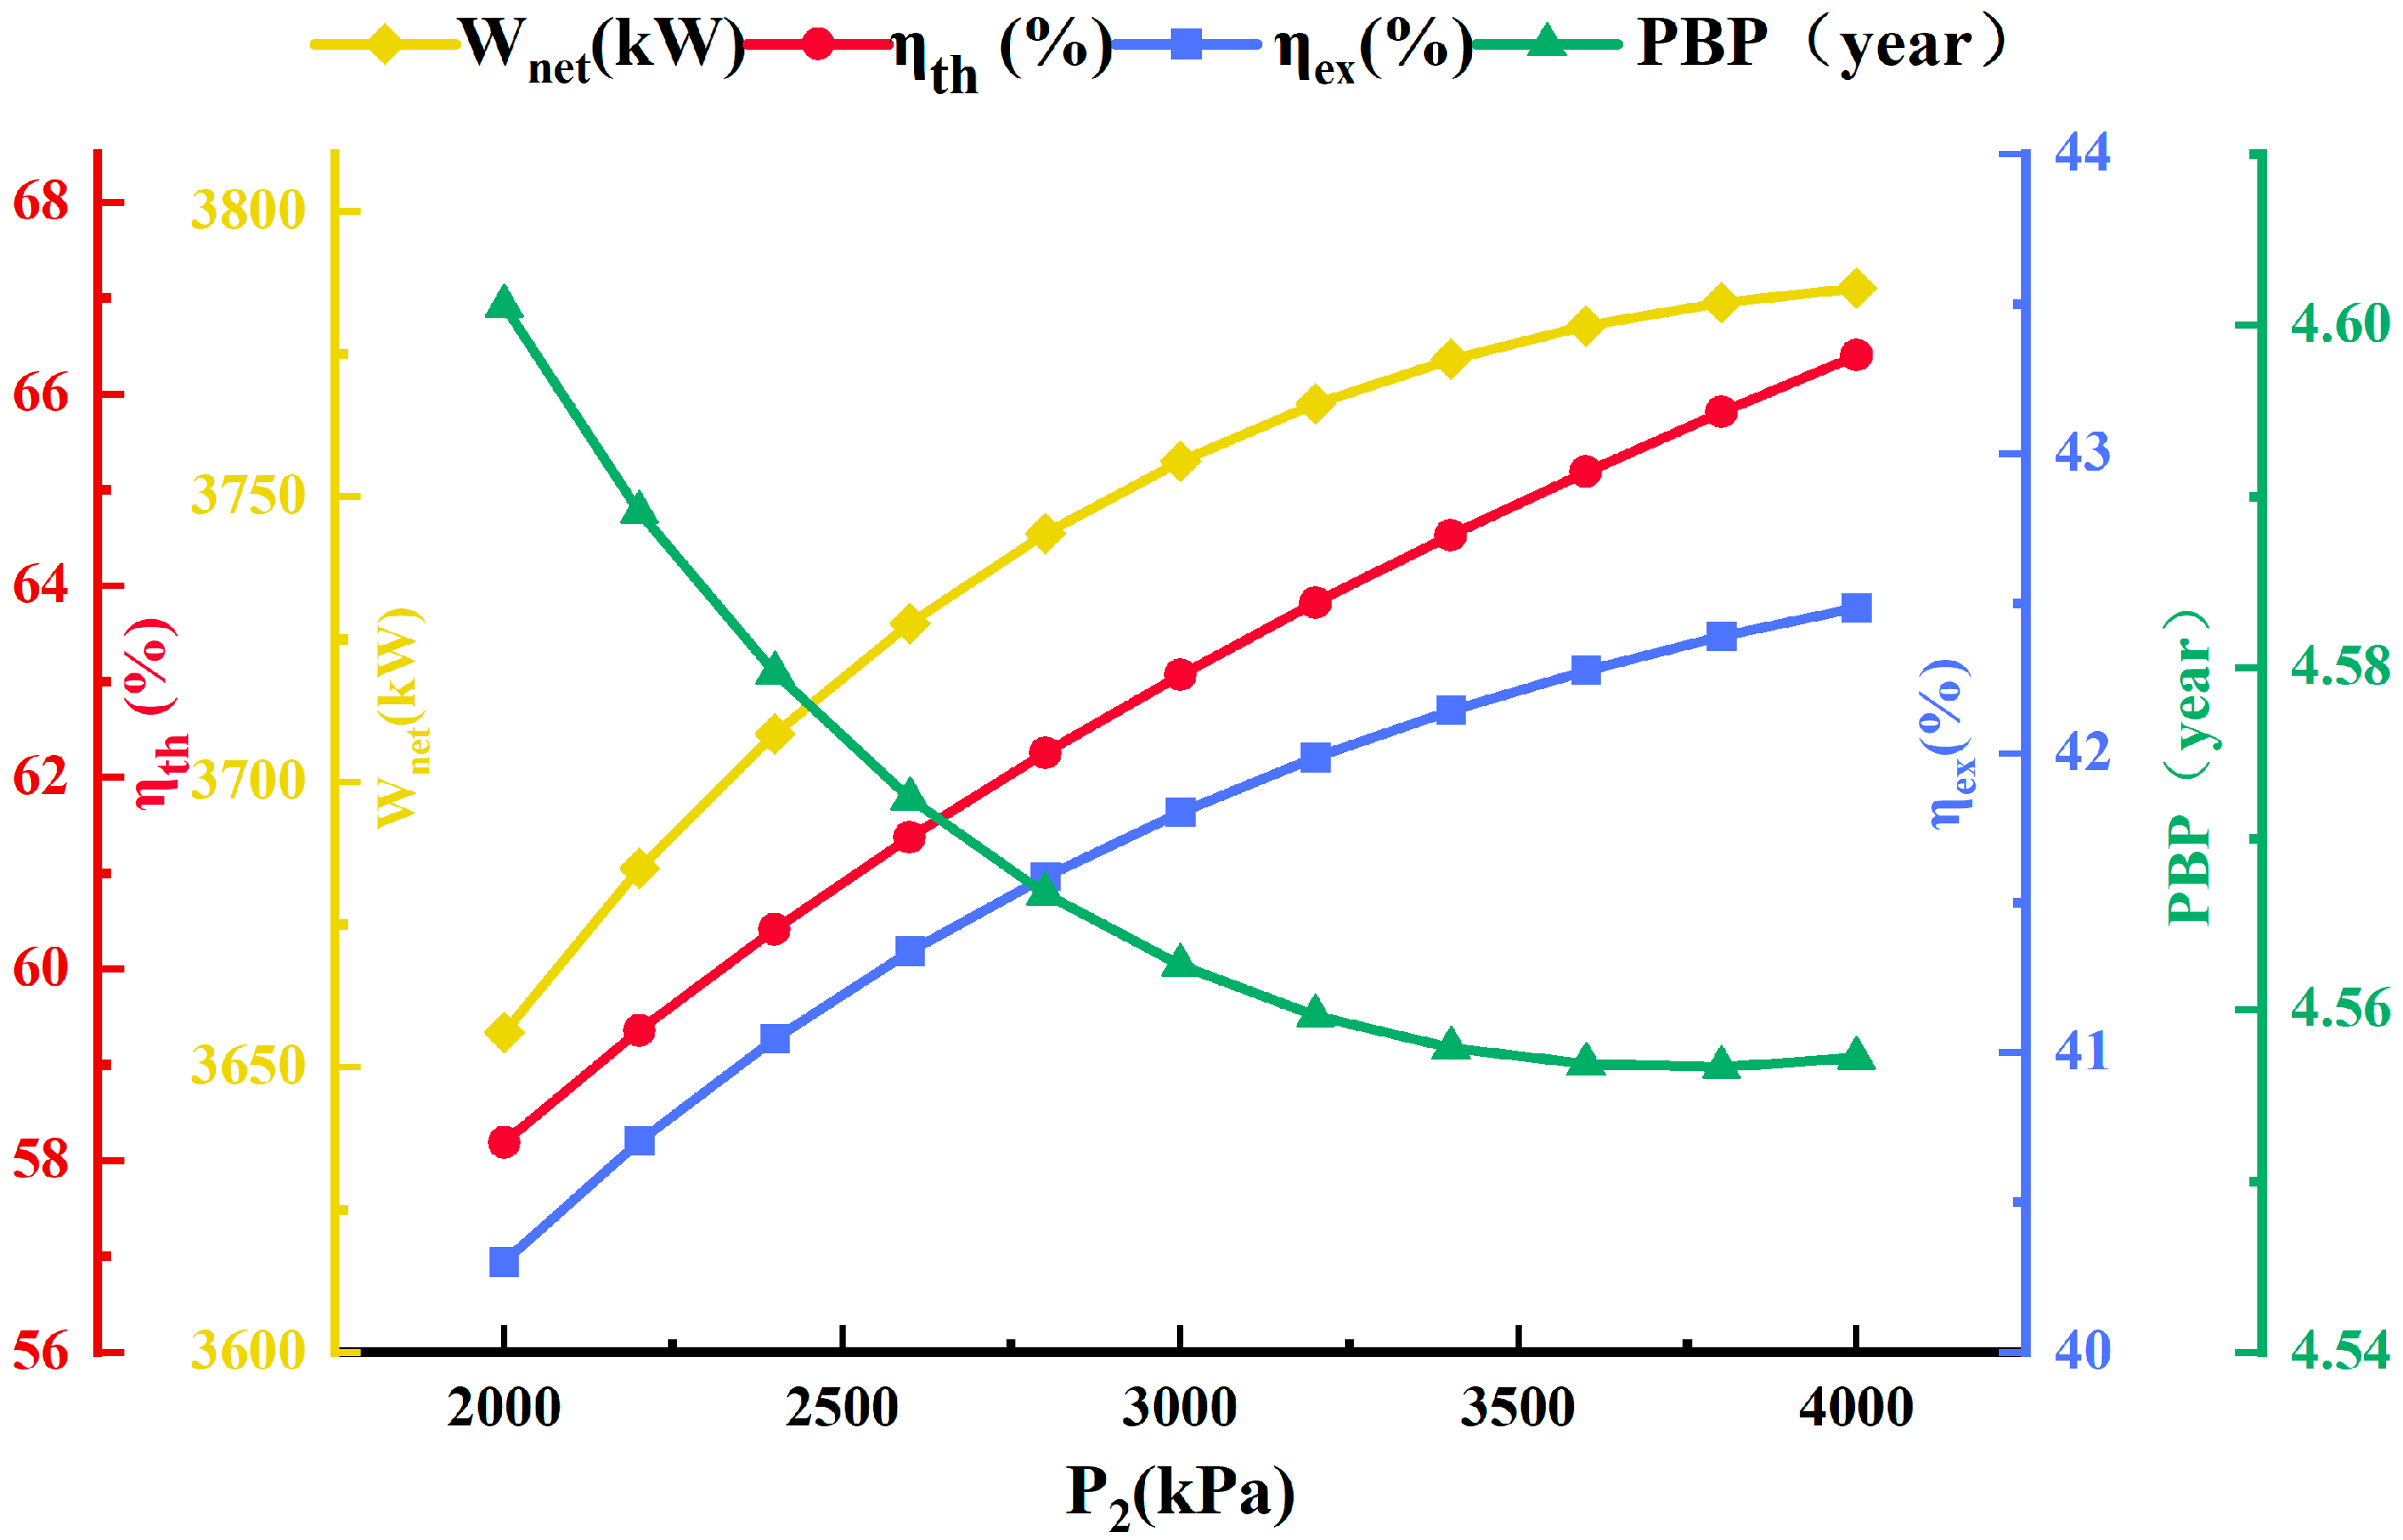
Figure 4 depicts how LNG pump outlet pressure () affects , , , and PBP within the system. The figure depicts that when grows, so does . When grows, the outlet temperature of pump 1 rises in tandem with the increase in outlet pressure, as does the enthalpy of the outflow flow strand 2. However, the LNG mass flow rate stays unchanged, leading to increased power dissipation for pump 1. Also, as rises, the enthalpy difference increases with pump 2, pump 5, and turbine 3, while decreasing through pump 3 and turbine 2. Thus, the dissipation of pump 2 and pump 5 and the output of turbine 3 grow, while pump 3’s dissipation work and turbine 2’s output work decrease. The sum of the dissipated work of pump 2 and pump 5 decreases, and turbine 2’s output work is less than the total of turbine 3’s output work increase and pump 3’s dissipated work decrease. According to Equation (4), increases. At the same time, the enthalpy of the outlet geothermal fluid increases as increases, but the mass flow rate with the outlet geothermal fluid stays constant, and the total heat generated by the geothermal fluid decreases according to Equation (2). Therefore, boosting improves the system’s . As increases, the system’s also grows. The mass flow rate of flow strand 29 increases as increases, and the exergy transferred to the flow strand 36 in the HX4 rises, as well as the system’s cold exergy. At the same time, as increases, the geothermal fluid outlet exergy increases. Therefore, system’s rises as the growth of .
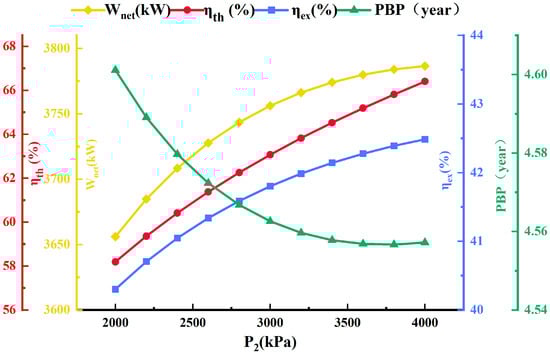
Figure 4.
Variation in system performance with LNG pump outlet pressure ().
The system’s reduces as grows. The system’s annual net assets () and keep increasing when rises. The growth of makes condenser 1’s heat exchange area larger and the temperature-matching performance worse, while HX1 and evaporator 1’s heat exchange area decreases and the temperature-matching performance improves, so condenser 1’s investment cost rises while the investment cost of HX1 and evaporator 1 decreases. The reduction in the temperature of flow strand 4 causes the heat exchange area of condenser 2 in the cold storage module to decrease and the temperature-matching performance to be better, while the heat exchange area of condenser 3 and the HX4 in air conditioning module become larger and the temperature-matching performance become worse, and thus the investment cost of condenser 2 decreases while the investment cost of condenser 3 and HX4 increases. The decline in pump 3’s power consumption and turbine 2’s output power reduces their investment costs. The increased power consumption of pumps 1, 2, and 5 and turbine 3’s output power increase their investment costs. The growth of outweighs its reduction; therefore, is raised. But at the same time, the annual net assets of the unity are also increased significantly, so the system’s is reduced.
4.3.3. Mass Flow of n-Pentane in ORC-I
Figure 5 illustrates the effect of n-pentane’s mass flow rate () in ORC-I on the system’s , , , and PBP. The of the system enhances when increases. In ORC-I, the enthalpy dissimilarity between pump 2 and turbine 1 is unchanging, while increases, so pump 2’s dissipated work and turbine 1’s output work increase. Nevertheless, the boost in turbine 1’s output work exceeds the rise in pump 2’s dissipation work; thus, the system’s increases. Also, increasing improves the system’s . When rises, the geothermal fluid outlet’s enthalpy decreases, increasing the heat supplied by the geothermal fluid to the system. The rise in the system’s is greater than the increase in the warmth supplied by the geothermal fluid to the system, expanding the of the system. The system’s as grows. increases without a change in the enthalpy of the flow streams through HX2, HX3, and HX4, which results in a constant exergy of chilled water outlet flow streams 32, 34, and 36, and a constant amount of cold exergy is provided by the system. The reduction in the geothermal fluid outlet’s enthalpy results in the growth of the exergy provided by the geothermal fluid. The boost in the system’s outweighs the rise in the exergy provided by the geothermal fluid. According to Equation (9), the system’s rises with the increase in .
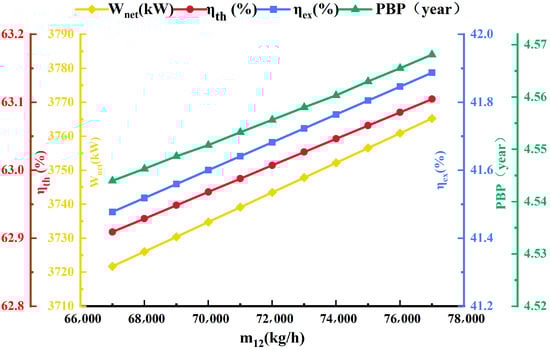
Figure 5.
Variation of system performance with ORC-I mass flow ().
The system’s rises as . increases. When . increases, the change in the enthalpy of flow strand 45 increases both its thermal burden and the logarithmic average temperature disparity of the evaporator 1. However, a rise in the heat load is greater than the boost within its logarithmic average temperature disparity, resulting in a rise in evaporator 1’s heat exchange area, which leads to a boost in evaporator 1’s investment cost. Pump 2’s power consumption and turbine 1’s output power increase pump 2 and turbine 1’s investment costs. Thus, the system’s grows and the system’s increases.
4.3.4. Liquefaction Temperature of R23
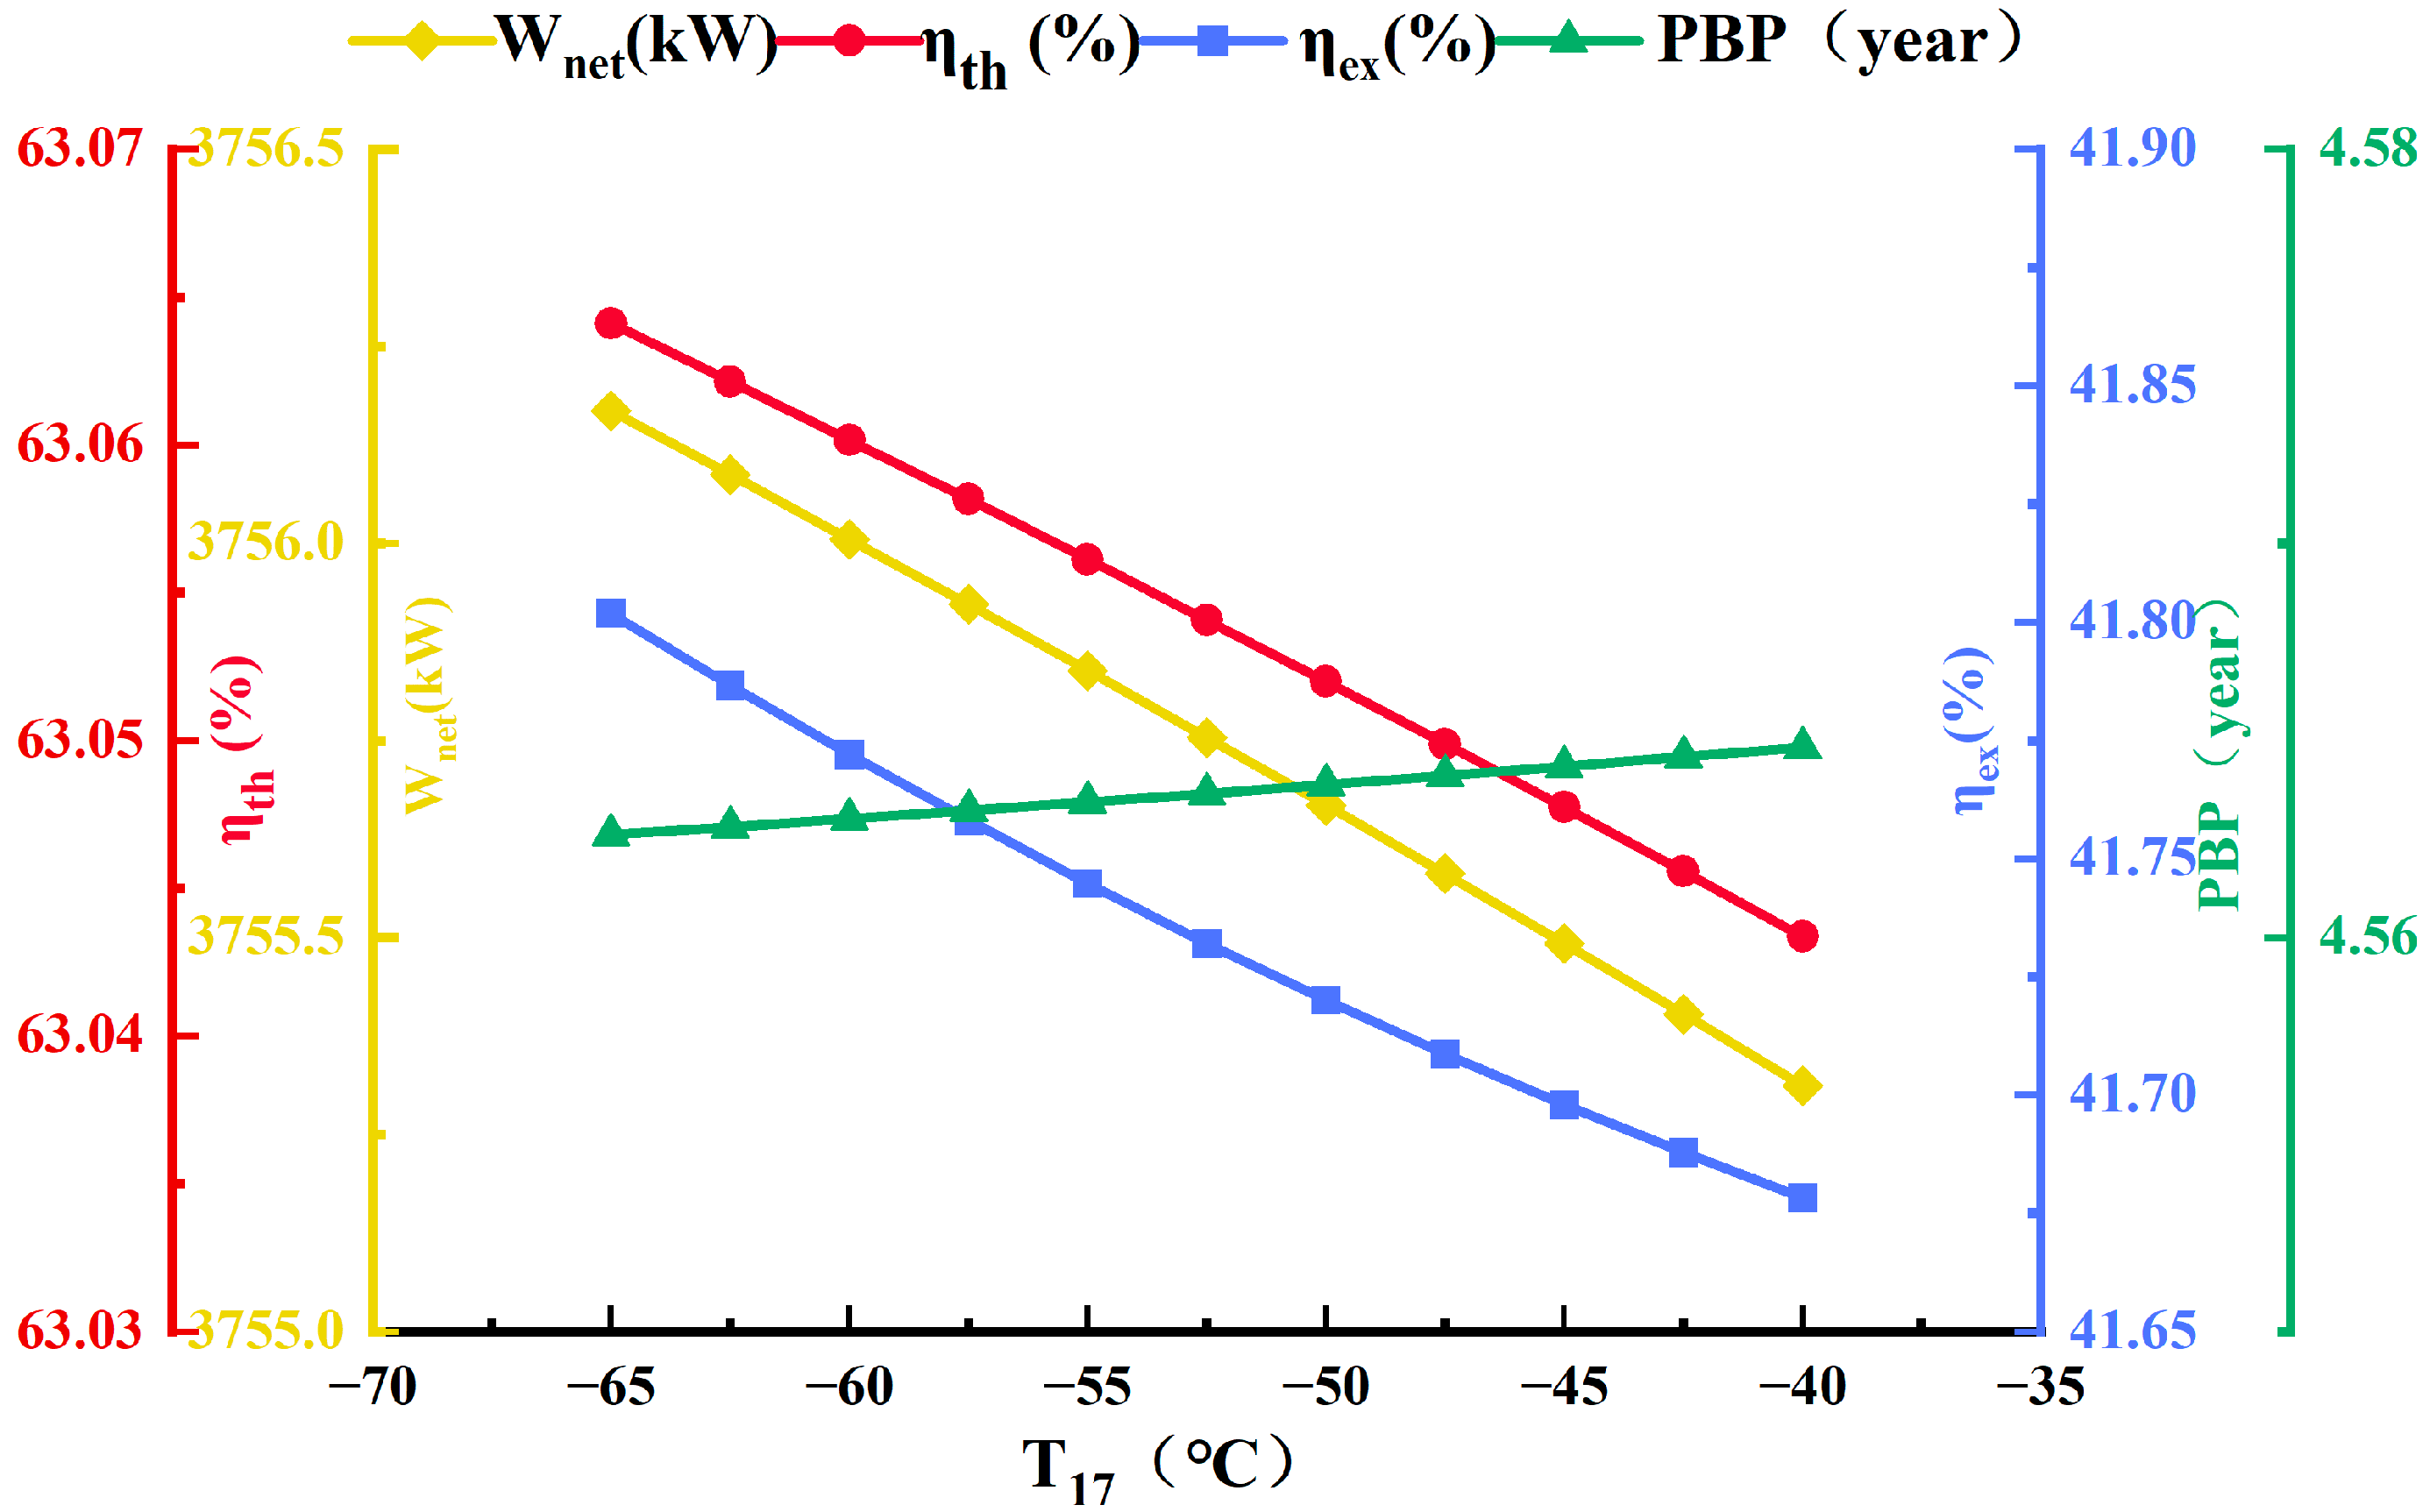
Figure 6 demonstrates the way the liquefaction temperature of R23 () influences the system’s , , , and PBP. As rises, the system’s minimizes. When rises, it increases pump 4’s enthalpy variation, and the work dissipated by pump 4 increases under an energy balance formula. Pump 5’s enthalpy variance between the intake and exit flow strands remains unchanged, but the mass flow rate of flow strands passing through it increases. This results in a rise in pump 5’s dissipated work, as calculated by the energy balance formula. The of the system decreases under Equation (4). The system’s also decreases as is elevated. The system’s cold energy decreases when is elevated, and the system’s diminishes, according to Equation (5). As rises, of the system decreases. This is mainly because the system’s and the cold exergy are reduced when ascends, while the exergy energy released to the system by the LNG and the geothermal fluid is unchanged.
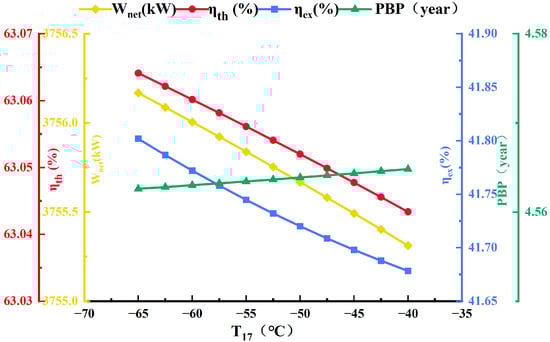
Figure 6.
Variation of system performance with R23 liquefaction temperature ().
The system’s grows slightly as rises. This is because as rises, the enthalpy of the middle shunt strand of the cold storage module changes so that the heat loads of HX2, HX3, and condenser 2 are all decreased so the thermal exchange areas of HX2 and HX3, and condenser 2 decrease. The heat exchange area’s alteration leads to a lower investment cost for HX2, HX3, and condenser 2. In the air conditioning module, the rise of increases the heat load of HX4 and condenser 3, and the heat exchange area increases accordingly, raising HX4 and condenser 3’s investment costs. Their investment costs also rise in tandem with power consumption. However, the rise in equipment investment cost outweighs the decrease in equipment investment cost, so the system’s increases slightly, as does the system’s
4.3.5. Pump 5 Outlet Pressure
Figure 7 demonstrates that pump 5 outlet pressure () in the air conditioning module influences the system’s , , , and PBP. As increases, the system’s falls. When grows, the enthalpy of pump 5 outlet flow strand 29 rises, and the work dissipated by pump 5 increases. The work produced by other equipment remains unchanged, so the system’s decreases. The system’s decreases as increases. When grows, the amount of energy transferred to flow strand 36 decreases, and the system’s cold energy decreases accordingly. According to Equation (5), the system’s is reduced. The system’s reduces as rises. When grows, the system’s net output work decreases, and the cold exergy provided in the air conditioning module decreases, according to Equation (8), as well as the system’s cold exergy. However, the exergy offered to the system by LNG and geothermal fluid is constant, and according to Equation (9), the system’s decreases.
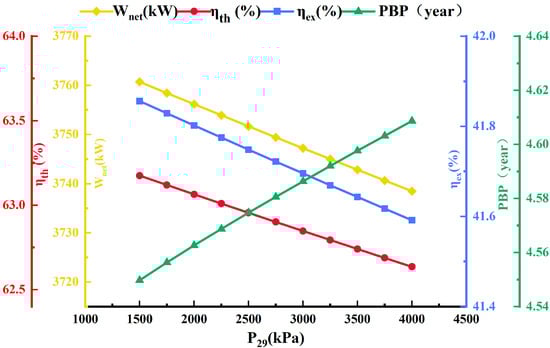
Figure 7.
Variation of system performance with the outlet pressure of pump 5 ().
As grows, so does the system’s . This is because as increases, the heat load of HX4 decreases, and according to Equation (10), HX4’s heat exchange area decreases, the temperature-matching performance becomes better, and the investment cost reduces. A rise in the power consumption of pump 5 makes its investment cost increase dramatically, and its increase exceeds the decrease in HX4’s investment cost, so the equipment’s is increased, and according to Equation (14), the system’s increases.
5. Optimization
Multi-objective optimization is a technique that considers multiple objectives when solving an optimization problem. Unlike traditional single-objective optimization, multi-objective optimization not only focuses on the optimal value of one objective when finding the optimal solution, but also considers multiple objectives that may conflict with each other at the same time, which has an important role in practical applications. This section focuses on optimizing the proposed system’s performance metrics. The objective functions of the three-objective optimization are specified as the maximum thermal efficiency, maximum exergy efficiency, and least depreciation payback period, respectively. Table 11 shows the range of values for the choice variables. The range of decision variables listed in Table 11 is determined based on the comprehensive analysis of the previous sensitivity and engineering feasibility. The boundary values of these parameters are all verified through the preliminary simulation of Aspen HYSYS.
Table 11.
Decision variabilities and their value ranges.
In this study, PSO, a commonly used optimization algorithm, is employed to optimize the proposed system. The PSO method is a group intelligence-based optimization technique that was developed by Kennedy and Eberhart in 1995. The PSO technique simulates the behavior of a group of birds or a community of fish while searching for food and solves the optimization problem by using this heuristic method. The benefits of this method are its low number of control parameters and its ease of implementation [38]. PSO’s design parameters are shown in Table 12.
Table 12.
PSO design parameters.
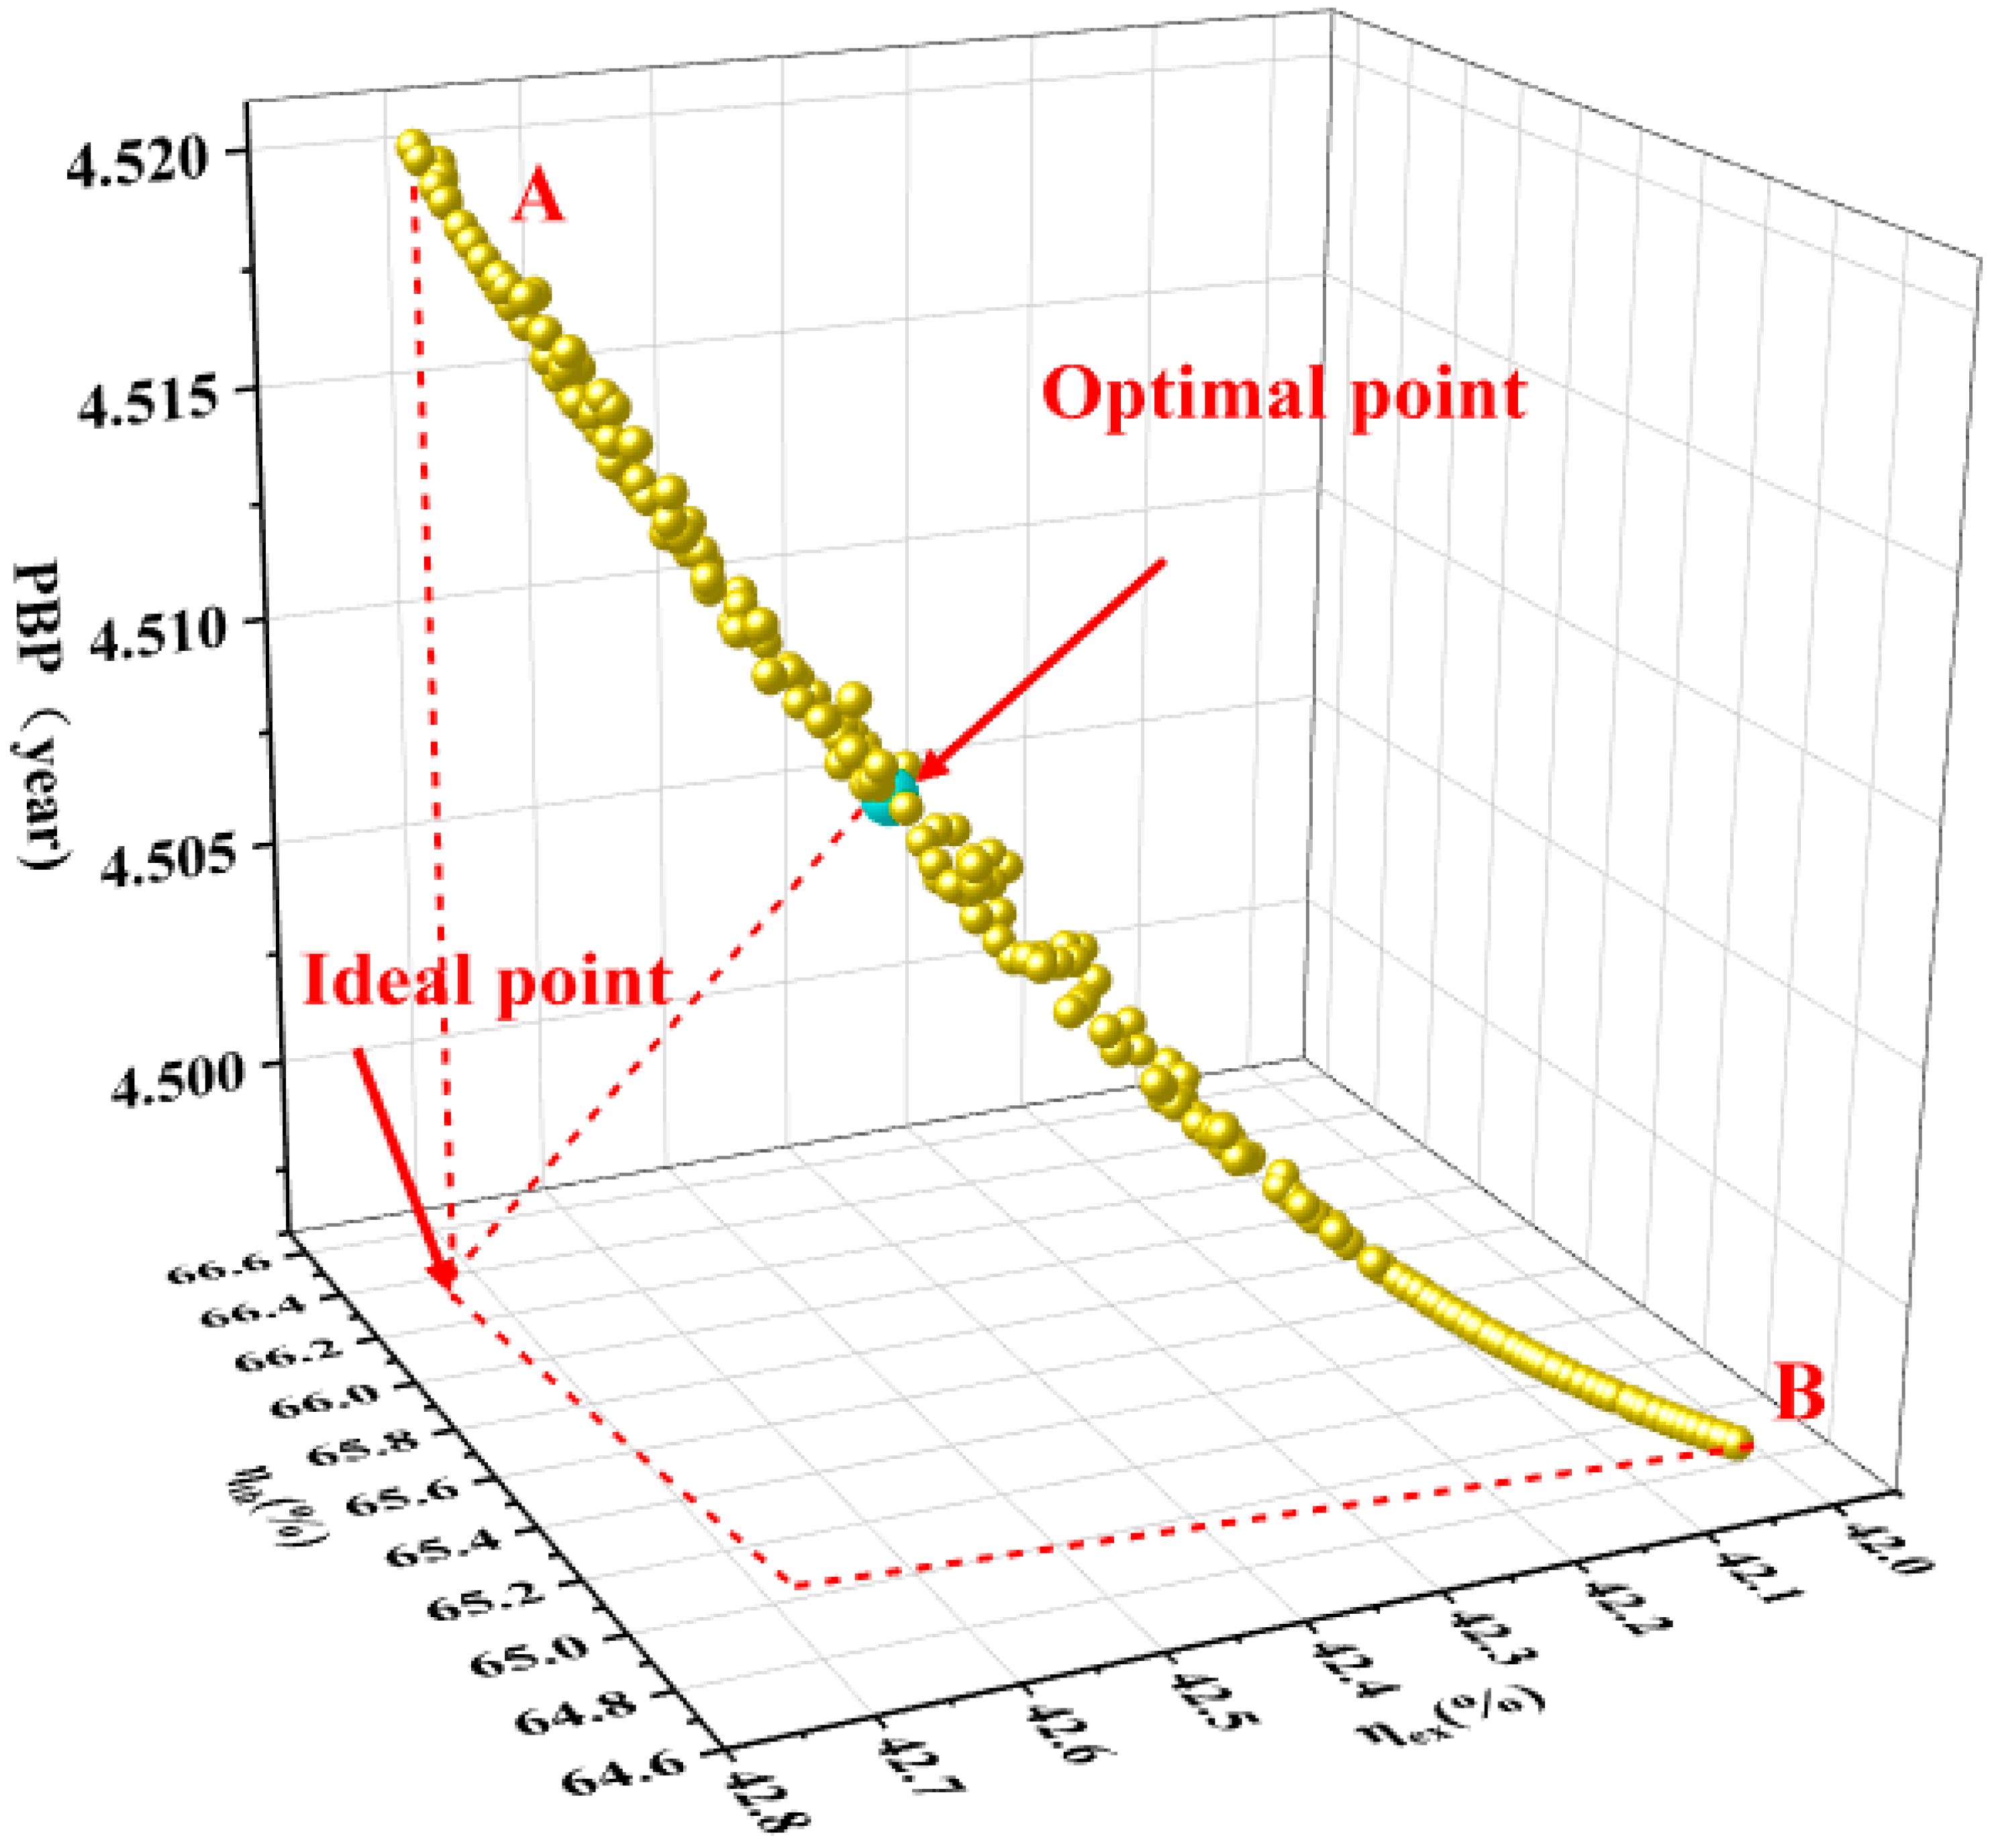
The parameters are optimized by MATLAB 2024a and the resulting Pareto frontier diagram is shown in Figure 8. Points A and B represent the largest and lowest values of , , and , respectively. The optimal location is the point where and are highest and is lowest. Table 13 displays the choice variable and objective function values from the multi-objective optimization findings. Table 13 shows that the enhanced system’s improves by 3% to 66.06%, increases by 0.72% to 42.52%, and is decreased by 0.05 years to 4.509 years.

Figure 8.
The Pareto front of PSO.
Table 13.
Multi-objective optimization results.
6. Conclusions
This paper presents an LNG cold energy cascade utilization system that combines district cooling, power generation, and cold storage with geothermal energy as a heat source. The performance of the system is assessed and parameterized by thermodynamic and economic analyses. To discover the particular state in which the proposed system achieves optimal operating conditions, the maximum thermal and exergy efficiency of the system and the minimum depreciation payback period are used as the objective functions, and , , , , and in the module are used as decision variables. The main research results are as follows:
(1) In the initial state, the CCHP system can generate 3756.38 kW of net power and 1448.59 kW of cooling energy. The is 63.06%, the is 41.80%, and the is 4.559 years. This performance is in line with the current development trend in the field of energy system integration. Thermodynamically, the two-stage ORC series configuration reduces exergy losses by approximately 15–20% compared to conventional single-stage cycles, consistent with recent findings on energy cascade utilization.
(2) In the exergy destruction examination of equipment, condenser 1 has the highest percentage of exergy loss (50.90%), with a value of 2859.67 kW. The overall exergy loss of the system heat exchange equipment is 80.71%. This finding provides guidance for improving the equipment in actual production.
(3) Raising the separator inlet pressure and pump 5 outlet pressure can enhance the system’s net power generation, thermal efficiency, and exergy efficiency while reducing the depreciation payback period. However, when increasing the mass flow rate of n-Pentane in ORC-I, although the net power generation, thermal efficiency, and exergy efficiency improve, the system’s depreciation payback period also increases. It is crucial to balance equipment costs to avoid overinvestment. In practical system optimization, the combined effects of pressure and mass flow rate must be comprehensively considered. Parameter optimization should identify the optimal balance between efficiency and economic performance to achieve efficient, stable, and economical system operation.
(4) Using the PSO method for optimization, the optimized system achieved a thermal efficiency of 66.06%, exergy efficiency of 42.52%, and an annual net profit of USD 5.55 million USD, reduced the depreciation payback period to 4.509 years. Compared with the initial operating conditions, both energy-saving performance and economic viability demonstrated significant improvements.
(5) The sensitivity analysis reveals the nonlinear influence of LNG pump outlet pressure and R23 liquefaction temperature on system performance, providing clear guidance for operational parameter optimization in practical engineering. Notably, the temperature-span coordination mechanism between −65 °C cryogenic storage and 7 °C district cooling demonstrates the unique advantages of wide-temperature-range cold energy integration. These findings not only refine the design theory of hybrid energy systems but, more importantly, offer quantifiable technical references for coastal energy infrastructure integrating both LNG terminals and geothermal resources. Subsequent research should focus on dynamic analysis under variable operating conditions to facilitate the transition of this technology from laboratory to engineering applications.
Author Contributions
Conceptualization, X.G. and J.L.; methodology, J.L.; software, J.L.; data curation, J.L.; writing—original draft preparation, X.G. and J.L.; writing—review and editing, X.G. and J.L.; supervision, J.L.; funding acquisition, J.L. All authors have read and agreed to the published version of the manuscript.
Funding
This research was funded by the Basic research project of Liaoning Provincial Department of Education, grant number LJKMZ20220740 (J.L.).
Data Availability Statement
The original contributions presented in this study are included in the article. Further inquiries can be directed to the corresponding author.
Conflicts of Interest
Xianfeng Gong was employed by the Zhongyuan Oilfield Company. The remaining author declare that the research was conducted in the absence of any commercial or financial relationships that could be construed as a potential conflict of interest.
Nomenclature
| Parameters | |
| A | Area (m2) |
| C | cost (USD) |
| E | exergy (kW). |
| h | mass enthalpy (kJ/kg). |
| s | entropy (kJ/(kg ⋅ K)) |
| PBP | depreciation payback period |
| P | pressure (kPa) |
| T | temperature (K) |
| H | annual running time (h). |
| ṁ | mass flow rate (kg/s) |
| heat rate (kW). | |
| W | power (kW). |
| Z | cost of a component (USD) |
| i | interest rate. |
| thermal efficiency | |
| exergy efficiency | |
| Subscripts | |
| D | destruction |
| tot | total |
| ex | exergy |
| th | thermal. |
| i | each flow |
| 0 | ambient condition |
| in | input |
| k | each component |
| out | output |
| net | net power |
| F | fuel |
| P | product |
| Sep | separator |
| Con | condenser |
| Eva | evaporator |
| Abbreviations | |
| LNG | liquefied natural gas |
| CCHP | combined cooling, heat, and power |
| CEPCI | chemical engineering plant cost index |
| PSO | particle swarm optimization |
| ORC | organic Rankine cycle |
| HX | heat exchanger |
| NG | natural gas |
References
- Kanbur, B.B.; Xiang, L.; Dubey, S.; Choo, F.H.; Duan, F. Cold Utilization Systems of LNG: A Review. Renew. Sust. Energy Rev. 2017, 79, 1171–1188. [Google Scholar] [CrossRef]
- He, T.; Lv, H.; Shao, Z.; Zhang, J.; Xing, X.; Ma, H. Cascade Utilization of LNG Cold Energy by Integrating Cryogenic Energy Storage, Organic Rankine Cycle and Direct Cooling. Appl. Energy 2020, 277, 115570. [Google Scholar] [CrossRef]
- Sun, Z.; Zhang, H.; Zhang, T.; Lin, L.; Lin, K. Optimizations and Comparison of Three Two-Stage Rankine Cycles under Different Heat Source Temperatures and NG Distribution Pressures. Energy Convers. Manag. 2020, 209, 112655. [Google Scholar] [CrossRef]
- Zheng, X.; Li, Y.; Zhang, J.; Zhang, Z.; Guo, C.; Mei, N. Design and Multi-Objective Optimization of Combined Air Separation and ORC System for Harnessing LNG Cold Energy Considering Variable Regasification Rates. Int. J. Hydrogen Energy 2024, 57, 210–223. [Google Scholar] [CrossRef]
- Zhang, R.; Cao, X.; Zhang, X.; Yang, J.; Bian, J. Co-Benefits of the Liquid Hydrogen Economy and LNG Economy: Advances in LNG Integrating LH 2 Production Processes. Energy 2024, 301, 131706. [Google Scholar] [CrossRef]
- Yang, X.; Zhao, H.; Hou, Q. Proposal and Thermodynamic Performance Study of a Novel LNG-Fueled SOFC-HAT-CCHP System with near-Zero CO2 Emissions. Int. J. Hydrogen Energy 2020, 45, 19691–19706. [Google Scholar] [CrossRef]
- He, T.; Chong, Z.R.; Zheng, J.; Ju, Y.; Linga, P. LNG Cold Energy Utilization: Prospects and Challenges. Energy 2019, 170, 557–568. [Google Scholar] [CrossRef]
- Akashah, M.H.N.; Rozali, N.E.M.; Mahadzir, S.; Liew, P.Y. Utilization of Cold Energy from LNG Regasification Process: A Review of Current Trends. Processes 2023, 11, 517. [Google Scholar] [CrossRef]
- Meng, D.; Liu, Q.; Ji, Z. Performance Analyses of Regenerative Organic Flash Cycles for Geothermal Power Generation. Energy Convers. Manag. 2020, 224, 113396. [Google Scholar] [CrossRef]
- Hassani Mokarram, N.; Mosaffa, A.H. Investigation of the Thermoeconomic Improvement of Integrating Enhanced Geothermal Single Flash with Transcritical Organic Rankine Cycle. Energy Convers. Manag. 2020, 213, 112831. [Google Scholar] [CrossRef]
- Mosaffa, A.H.; Zareei, A. Proposal and Thermoeconomic Analysis of Geothermal Flash Binary Power Plants Utilizing Different Types of Organic Flash Cycle. Geothermics 2018, 72, 47–63. [Google Scholar] [CrossRef]
- Fallah, M.; Ghiasi, R.A.; Mokarram, N.H. A Comprehensive Comparison among Different Types of Geothermal Plants from Exergy and Thermoeconomic Points of View. Therm. Sci. Eng. Prog. 2018, 5, 15–24. [Google Scholar] [CrossRef]
- Mardan Dezfouli, A.H.; Arshizadeh, S.; Nikjah Bakhshayesh, M.; Jahangiri, A.; Ahrari, S. The 4E Emergy-Based Analysis of a Novel Multi-Generation Geothermal Cycle Using LNG Cold Energy Recovery. Renew. Energy 2024, 223, 120084. [Google Scholar] [CrossRef]
- Khanmohammadi, S.; Musharavati, F.; Khan, M.S. Proposal a New Hybrid System Comprising of LNG Regasification and Geothermal Sources: Exergy, Exergo-Economic, and Optimization. Sustain. Energy Technol. Assess. 2023, 60, 103525. [Google Scholar] [CrossRef]
- He, T.; Ma, H.; Ma, J.; Mao, N.; Liu, Z. Effects of Cooling and Heating Sources Properties and Working Fluid Selection on Cryogenic Organic Rankine Cycle for LNG Cold Energy Utilization. Energy Convers. Manag. 2021, 247, 114706. [Google Scholar] [CrossRef]
- Li, D.; Yin, G.; Gao, W.; Zhang, C. Role of CO2-Based Mixtures in the Organic Rankine Cycle Using LNG Cold Energy. Sustain. Energy Technol. Assess. 2024, 65, 103752. [Google Scholar] [CrossRef]
- Messineo, A.; Panno, G. LNG Cold Energy Use in Agro-Food Industry: A Case Study in Sicily. J. Nat. Gas Sci. Eng. 2011, 3, 356–363. [Google Scholar] [CrossRef]
- Huang, Z.F.; Wan, Y.D.; Soh, K.Y.; Islam, M.R.; Chua, K.J. Off-Design and Flexibility Analyses of Combined Cooling and Power Based Liquified Natural Gas (LNG) Cold Energy Utilization System under Fluctuating Regasification Rates. Appl. Energy 2022, 310, 118529. [Google Scholar] [CrossRef]
- Yao, S.; Zhang, Z.; Huang, H.; Feng, G.; Xu, J. Exergetic Design and Optimisation of LNG Cold Energy Utilisation System for Dual-Fuel Main Engine of a Container Ship. Int. J. Exergy 2021, 36, 1–29. [Google Scholar] [CrossRef]
- Messineo, A.; Panno, D. Potential Applications Using LNG Cold Energy in Sicily. Int. J. Energy Res. 2008, 32, 1058–1064. [Google Scholar] [CrossRef]
- Ning, J.; Sun, Z.; Dong, Q.; Liu, X. Performance Study of Supplying Cooling Load and Output Power Combined Cycle Using the Cold Energy of the Small Scale LNG. Energy 2019, 172, 36–44. [Google Scholar] [CrossRef]
- Budiyanto, M.A.; Nasruddin; Nawara, R. The Optimization of Exergoenvironmental Factors in the Combined Gas Turbine Cycle and Carbon Dioxide Cascade to Generate Power in LNG Tanker Ship. Energy Convers. Manag. 2020, 205, 112468. [Google Scholar] [CrossRef]
- Wu, J.; Shang, L.; Pan, Z.; Zhou, L. Energy, Exergy, Economic, Exergoeconomic, and Exergoenvironmental (5E) Analyses and Optimization of a Novel Three-Stage Cascade System Based on Liquefied Natural Gas Cold Energy. Energy Technol. 2022, 10, 2200228. [Google Scholar] [CrossRef]
- Sun, W.; Li, M.; Pan, Z.; Yu, J.; Shang, L.; Zhou, L.; Lv, Z. A Heat Source Self-Supplied Thermodynamic System Using Liquefied Natural Gas: Performance Evaluation and Three-Objective Optimization. J. Clean. Prod. 2023, 429, 139545. [Google Scholar] [CrossRef]
- Fang, Z.; Shang, L.; Pan, Z.; Yao, X.; Ma, G.; Zhang, Z. Exergoeconomic Analysis and Optimization of a Combined Cooling, Heating and Power System Based on Organic Rankine and Kalina Cycles Using Liquified Natural Gas Cold Energy. Energy Convers. Manag. 2021, 238, 114148. [Google Scholar] [CrossRef]
- Nazari, N.; Mousavi, S.; Mirjalili, S. Exergo-Economic Analysis and Multi-Objective Multi-Verse Optimization of a Solar/Biomass-Based Trigeneration System Using Externally-Fired Gas Turbine, Organic Rankine Cycle and Absorption Refrigeration Cycle. Appl. Therm. Eng. 2021, 191, 116889. [Google Scholar] [CrossRef]
- Fang, Z.; Pan, Z.; Ma, G.; Yu, J.; Shang, L.; Zhang, Z. Exergoeconomic, exergoenvironmental analysis and multi-objective optimization of a novel combined cooling, heating and power system for liquefied natural gas cold energy recovery. Energy 2023, 269, 126752. [Google Scholar] [CrossRef]
- Zhao, L.; Zhang, J.; Wang, X.; Feng, J.; Dong, H.; Kong, X. Dynamic Exergy Analysis of a Novel LNG Cold Energy Utilization System Combined with Cold, Heat and Power. Energy 2020, 212, 118649. [Google Scholar] [CrossRef]
- Aghahosseini, S.; Dincer, I. Comparative performance analysis of low-temperature Organic Rankine Cycle configurations utilizing LNG cold energy. Energy 2017, 119, 322–333. [Google Scholar] [CrossRef]
- Lee, J.; Kim, K.; Lee, I. Standard chemical exergy values for cryogenic fluids. Korean J. Chem. Eng. 2023, 40, 1123–1133. [Google Scholar] [CrossRef]
- Ghaebi, H.; Namin, A.S.; Rostamzadeh, H. Exergoeconomic Optimization of a Novel Cascade Kalina/Kalina Cycle Using Geothermal Heat Source and LNG Cold Energy Recovery. J. Clean. Prod. 2018, 189, 279–296. [Google Scholar] [CrossRef]
- Ghaebi, H.; Parikhani, T.; Rostamzadeh, H. A Novel Trigeneration System Using Geothermal Heat Source and Liquefied Natural Gas Cold Energy Recovery: Energy, Exergy and Exergoeconomic Analysis. Renew. Energy 2018, 119, 513–527. [Google Scholar] [CrossRef]
- Akbari, A.D.; Mahmoudi, S.M.S. Thermoeconomic Analysis & Optimization of the Combined Supercritical CO (Carbon Dioxide) Recompression Brayton/Organic Rankine Cycle2. Energy 2014, 78, 501–512. [Google Scholar] [CrossRef]
- Zhang, L.; Pan, Z.; Zhang, Z.; Shang, L.; Wen, J.; Chen, S. Thermodynamic and Economic Analysis Between Organic Rankine Cycle and Kalina Cycle for Waste Heat Recovery From Steam-Assisted Gravity Drainage Process in Oilfield. J. Energy Resour. Technol. 2018, 140, 122005. [Google Scholar] [CrossRef]
- Yao, S.; Shen, X.; Yang, Z.; Feng, G.; Xiao, M. Design and Optimization of LNG Vaporization Cold Energy Comprehensive Utilization System Based on a Novel Intermediate Fluid Vaporizer. Appl. Therm. Eng. 2021, 190, 116785. [Google Scholar] [CrossRef]
- Sun, W.; Pan, Y.; Pan, Z.; Shang, L.; Zhou, L.; Lv, Z. Comparative Analysis of Two Cogeneration Systems with Different Connection Modes. Process Saf. Environ. Prot. 2023, 177, 1440–1460. [Google Scholar] [CrossRef]
- Tian, W.; Xi, H. Comparative Analysis and Optimization of Pumped Thermal Energy Storage Systems Based on Different Power Cycles. Energy Convers. Manag. 2022, 259, 115581. [Google Scholar] [CrossRef]
- Wang, J.; Wang, J.; Dai, Y.; Zhao, P. Thermodynamic Analysis and Optimization of a Flash-Binary Geothermal Power Generation System. Geothermics 2015, 55, 69–77. [Google Scholar] [CrossRef]
- Pan, J.; Li, M.; Zhu, M.; Li, R.; Tang, L.; Bai, J. Energy, Exergy and Economic Analysis of Different Integrated Systems for Power Generation Using LNG Cold Energy and Geothermal Energy. Renew. Energy 2023, 202, 1054–1070. [Google Scholar] [CrossRef]
- Akbari Kordlar, M.; Mahmoudi, S.M.S. Exergeoconomic Analysis and Optimization of a Novel Cogeneration System Producing Power and Refrigeration. Energy Convers. Manag. 2017, 134, 208–220. [Google Scholar] [CrossRef]
- Mehrpooya, M.; Mousavi, S.A. Advanced exergy analysis of an integrated LNG regasification process. Energy Convers. Manag. 2017, 148, 936–948. [Google Scholar] [CrossRef]

Disclaimer/Publisher’s Note: The statements, opinions and data contained in all publications are solely those of the individual author(s) and contributor(s) and not of MDPI and/or the editor(s). MDPI and/or the editor(s) disclaim responsibility for any injury to people or property resulting from any ideas, methods, instructions or products referred to in the content. |
© 2025 by the authors. Licensee MDPI, Basel, Switzerland. This article is an open access article distributed under the terms and conditions of the Creative Commons Attribution (CC BY) license (https://creativecommons.org/licenses/by/4.0/).