1. Introduction
With the development of industry, environmental pollution has significantly increased, becoming a serious global issue. Industrial processes, involving the production and release of various pollutants, lead to contamination of the air, water, and soil. Among the most dangerous pollutants are hydrophobic organic contaminants, such as nitrobenzene (NB) and meta-dinitrobenzene (DNB), which, due to their stability and toxicity, pose a serious risk to ecosystems and human health [
1,
2,
3,
4,
5,
6].
Nitrobenzene is primarily utilized as an intermediate in the industrial synthesis of aniline [
7]. Additionally, nitrobenzene serves as a key chemical in the formulation of lubricating oils, synthetic rubber, dyes, pharmaceuticals, and pesticides [
8,
9]. Occupational exposure to nitrobenzene may occur in industrial settings where it is either produced or used as a raw material in the synthesis of derivative compounds. Environmental exposure is also possible for individuals residing in proximity to hazardous waste sites containing nitrobenzene or near manufacturing and processing facilities where it is handled [
9,
10,
11].
Nitrobenzene is a chemically stable aromatic organic compound that persists in the environment for extended periods. In the atmosphere, its half-life is approximately 115 days, while in aquatic ecosystems, it tends to accumulate at the bottom, potentially causing long-term negative effects on aquatic life [
12,
13,
14]. Long-term exposure to nitrobenzene can cause serious health damage, including damage to the central nervous system, liver, and kidneys, as well as an increased risk of cancer and methemoglobinemia [
15,
16]. Its classification as “probably carcinogenic to humans” by any route of exposure emphasizes the importance of determining the concentration of NB in media relevant to human health [
17]. Its derivative, dinitrobenzene, occurs in several isomers, including para-, ortho-, and meta-dinitrobenzene, which differ in toxicity [
18]. Dinitrobenzene induces oxidative stress and inflammatory responses, further contributing to its toxicity [
19]. Although less abundant than nitrobenzene, dinitrobenzene poses a serious threat to human health (from acute liver necrosis, methemoglobinemia, visual impairment, to respiratory and reproductive problems) and ecosystems as it can cause long-term adverse effects if it enters aquatic systems, where it can accumulate and bioaccumulate in organisms [
20]. In response to potential health risks, the U.S. Environmental Protection Agency (EPA) has established a recommended maximum concentration limit of 10 µg L
−1 for nitrobenzene in surface waters. These considerations emphasize the critical importance of developing efficient and reliable techniques for the detection and removal of nitrobenzene and its related compounds from water systems [
9,
21].
2. Literature Review
Techniques for Removal of Nitroaromatic Pollutants
Various methods (e.g., chemical coagulation, electrolysis, liquid membrane isolation, etc.) for the elimination of pollutants have been reported [
22], among which the most commonly used method is adsorption on different developed materials [
5,
23,
24,
25]. Adsorption is also the most commonly used treatment for the removal of NB and DNB from aqueous solutions, with activated carbon being the dominant adsorbent material; consequently, scientists are putting emphasis on investigating carbon materials, especially bio-based ones. For instance, Dai et al. [
12] investigated the adsorption capacity of carbon materials (C1 and C2) obtained from the combustion of woody biomass, where C1 material was collected from the furnace’s bottom, while C2 was collected from the bug filter [
12]. The saturated adsorption amounts of NB were 294 and 344 mg g
−1 for C1 and commercial activated carbon, respectively [
12].
The observed differences in adsorption capacity depended on various surface factors—surface area, pore size distribution, and functional groups. For the adsorption and removal of nitroaromatic hydrocarbons (o-nitrophenol, 1,3-dinitrobenzene, and 2,4,6-trinitrophenol) from aqueous media, a graphene oxide/covalent organic framework (GO/COF) composite was also used [
26]. The prepared GO/COF showed a high pore volume, porous structure, good thermal stability, and high specific surface area, which further qualified it as a potentially good adsorbent [
26]. This was supported by the obtained maximum adsorption capacities of GO/COF composites of 317, 175, and 438 mg g
−1 for o-nitrophenol, 1,3-dinitrobenzene, and 2,4,6-trinitrophenol, respectively [
26].
The new adsorbent, cellulose-styrene copolymer (cellulose-St), was prepared using free radical polymerization [
3]. Yang et al. reported that cellulose-St possesses high hydrophobicity, as well as the ability to adsorb nitrobenzene, demonstrating its potential for continuous separation of NB from water, with a breakthrough point for an initial NB concentration of 10 mg L
−1 reaching 1.275 L g
−1 [
3]. Additionally, this material showed exceptional environmental adaptability as it maintained its hydrophobicity and adsorption ability for NB in strong acids, strong bases, and organic solvents. Finally, the reuse of the material after washing with ethanol was examined, demonstrating adsorption capacity retention after 10 cycles [
3].
Despite the promising properties of various adsorbents, challenges such as high production costs, limited reusability, and the need for large-scale application remain significant barriers to their practical use in removing NB and DNB from aqueous systems. In contrast, coconut shell-derived activated carbon (CSDAC) offers a sustainable and cost-effective alternative to conventional activated carbon. The use of coconut shells as a source material is advantageous due to their abundance, low cost, and renewability, making CSDAC a more scalable option for large-scale applications [
27,
28].
Furthermore, CSDAC has shown significant promise in overcoming common issues associated with traditional adsorbents, such as limited reusability and inefficiency in certain environmental conditions. CSDAC can be regenerated multiple times without a significant decrease in adsorption capacity, which enhances its cost-effectiveness and environmental sustainability [
29]. Compared to the commercially available activated carbon, CSDAC exhibits a higher surface area and porosity, which contributes to its superior adsorption capacity for hydrophobic pollutants like NB and DNB. This enhanced performance, combined with its environmental adaptability and scalability, makes CSDAC an attractive alternative for treating polluted water in industrial settings [
30,
31]. However, despite CSDAC showing significant potential, systematic studies focusing on the adsorption of both NB and DNB, especially under comparative and competitive conditions, are lacking. Furthermore, few works provide comprehensive kinetic, isotherm, and thermodynamic modelling of these systems, particularly with unmodified, commercially available CSDAC. This study aims to fill that gap.
In this study, we investigated the adsorption of nitrobenzene and dinitrobenzene by coconut shell-derived activated carbon (CSDAC). For the synthesized material, detailed physicochemical characterization (by SEM/EDS, N
2-sorption, XRD analysis, Raman, and FTIR spectroscopy) was performed, and subsequently, the adsorption of pollutants was investigated. During the initial evaluation of CSDAC adsorption performance, the presence of NB in the aqueous samples before and upon adsorption on CSDAC was monitored using an electrochemical sensor developed in the authors’ previous study [
32] that enables both field and laboratory analysis of a high number of samples in a short time. At the same time, the adsorbent before and after the NB adsorption was analyzed using FTIR spectroscopy. A detailed study of the adsorption of NB and its derivative DNB, individual and in a mixture, was carried out by analyzing the remaining solutions after the adsorption using UV/Vis spectroscopy, fitting the experimental data with the corresponding kinetic models, adsorption isotherms, and determining the thermodynamic parameters.
3. Materials and Methods
Carbon material (K/B powder, Trayal Corporation, Kruševac, Serbia) was prepared by carbonization of coconut shell as a precursor and subsequently activated in a static furnace using water vapor. The material was used as received from the manufacturer with no further treatment.
Nitrobenzene (NB) was purchased from Sinopharm Chemical Reagent Co, Shanghai, China; 1,3-dinitrobenzene was purchased from Merck, Darmstadt, Germany. The supporting electrolyte used for all experiments was 0.1 M sodium hydrogen phosphate/sodium dihydrogen phosphate (PBS) buffer of pH 7.02, received from Merck, Darmstadt, Germany. All chemicals used in this study were of high purity and, thus, were used with no further purifications.
A scanning electron microscope Phenom™ ProX Desktop SEM (Thermo Fisher Scientific™, Waltham, MA, USA) with an integrated energy-dispersive X-ray spectroscopy (EDS) detector was used for the investigation of surface morphology and elemental composition of the coconut shell-derived activated carbon. A Rigaku Ultima IV diffractometer (Ni-filtered CuKα radiation, a step of 0.05° and acquisition rate of 0.5° min−1) was used to examine the crystal structure. Raman spectrum of the sample was recorded in the wavenumber range of 3600 to 50 cm−1 using a DXR Raman microscope (Thermo Scientific, Madison, WI, USA). The samples were irradiated with a 532 nm laser, with an exposure time of 10 s and 10 accumulations per spectrum. The laser power was set to 2 mW to prevent sample degradation. OMNIC for Dispersive Raman 9.8.286 software was used for acquiring spectral data. The presented spectrum corresponds to the average of the spectra recorded at six randomly selected locations on the sample. FTIR spectra were obtained using a Nicolet iS20 FT-IR spectrophotometer (Thermo Scientific, Madison, WI, USA), employing the KBr pellet method, within the wavenumber range of 1200 to 400 cm−1, with 32 scans and a resolution of 4 cm−1. Nitrogen sorption analysis was carried out using a Micromeritics ASAP 2060 Surface Area Analyzer (MicrotracBEL, Osaka, Japan).
Initial study of nitrobenzene adsorption on CSDAC was conducted using FTIR spectroscopy analysis of precipitate and cyclic voltammetry in a supernatant solution,
Scheme 1. The effect of adsorbent/adsorbate ratio was evaluated by mixing a constant amount of nitrobenzene (50 mL of 200 μM aqueous solution of nitrobenzene of pH 7) and different amounts of CSDAC (5, 10, 20, 30, 40, 50, 75, and 100 mg) (J.T. Baker, Phillipsburg, NJ, USA) for 10 min. The effect of the initial pH value of the nitrobenzene solution on the adsorption process was evaluated by mixing a constant amount of CSDAC (50 mg) and NB solutions (200 μM) with a range of pH values (2, 4, 5, 6, 7, 8, 9, 10, and 11) for 10 min. The pH of test solutions was adjusted by drop-adding 1 M H
2SO
4 or 1 M NaOH solution. Subsequently, the solutions were filtered, and the precipitates analyzed using FTIR spectroscopy. As mentioned, the presence of NB in the solutions before and after adsorption was analyzed using an electrochemical sensor developed in the authors’ previous work [
32]. Namely, CoAg/rGO electrode was used as the working electrode with Pt counter electrode and saturated calomel electrode (SCE) as a reference in a three-electrode system to run cyclic voltammetry at a scan rate of 10 mV s
−1. The limit of detection of nitrobenzene using cyclic voltammetry with a CoAg/rGO sensing electrode is reported to be 6.36 μM [
32].
For kinetic and thermodynamic studies, separate NB and DNB stock solutions of defined concentrations in the range of 1–100 μM were prepared by dissolving NB and DNB in ethanol (99.8%). A total of 100 mg of CSDAC was weighed and then suspended in 50 mL of ethanol to obtain a stock suspension with a mass concentration of 2 mg mL−1. A mixture of 0.5 mL CSDAC stock dispersion and 0.5 mL of NB or DNB stock solution was made to deliver the targeted concentration of adsorbent (1 mg mL−1) and pollutants. After that, the mixtures were placed in a laboratory shaker and left for the specified period, ranging from 0 to 120 min.
Subsequently, they were filtered through a nylon membrane filter with a 0.22 µm pore size to remove any residual solid particles. The concentrations of NB and DNB in the filtrates were subsequently determined using a UV–Vis Perkin Elmer Lambda 35 spectrophotometer (Perkin Elmer, Traiskirchen, Austria), with their maximum absorption wavelengths recorded at 263 nm and 242 nm, respectively. All experiments were conducted in three replicates, and the mean values were further used with standard deviations as error limits.
The calibration curves for NB and DNB were established to ensure accurate quantification of their concentrations in the samples, as shown in
Figure S1. The equilibrium concentration c (mol dm
−3) in the filtrates was determined using the following equations:
where A is the absorbance, and 8716 dm
3 mol
−1 and 17,828 dm
3 mol
−1 are slopes of the NB and DNB calibration plots, respectively. The adsorbed concentrations (
c) of contaminants were calculated by subtracting equilibrium concentrations (
ce) from the initial (
c0).
4. Results
4.1. Physicochemical Characterisation of Coconut Shell-Derived Activated Carbon (CSDAC)
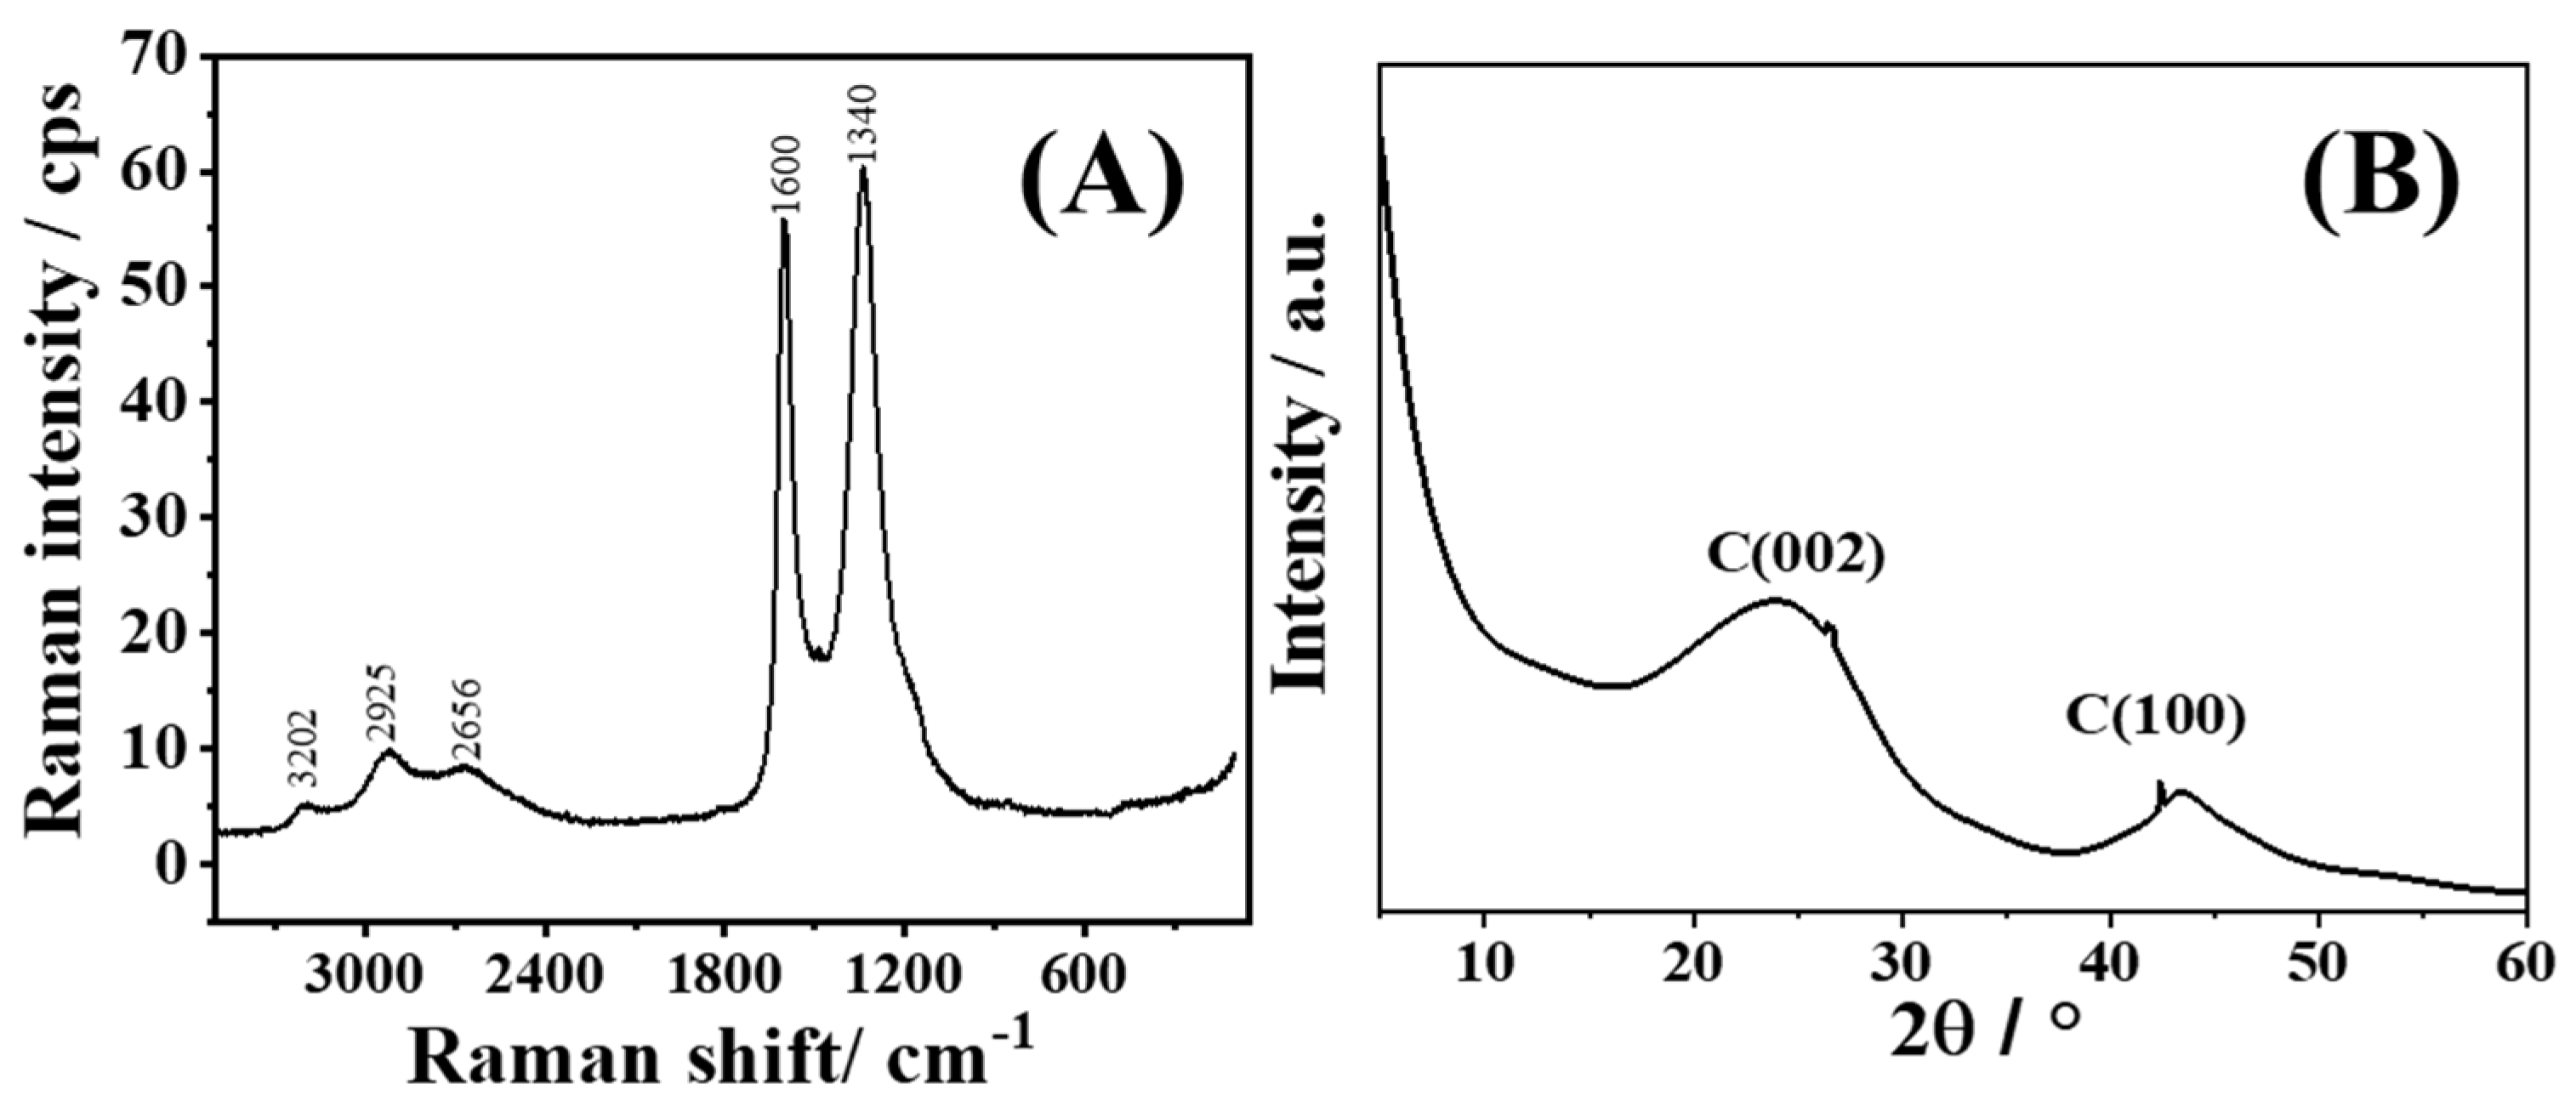
XRD pattern of CSDAC reveals two broad peaks at 2θ of 24.1° and 43.3° (
Figure 1A), corresponding to the reflections from the (002) and (100) carbon planes [
33,
34,
35,
36,
37]. To confirm the graphitic structure and the disordered nature of the activated carbon material, Raman spectroscopy was next employed. The G and D bands are observed in the Raman spectrum of CSDAC at ca. 1600 cm
−1 and 1340 cm
−1, respectively, along with a complex 2D band appearing between 3300 and 2500 cm
−1, as shown in
Figure 1B. The obtained spectrum is in good agreement with those reported in the literature for bio-based activated carbons [
38]. I
D/I
G ratio > 1 suggests structural disorder and the presence of defects in the carbon structure. Thus, XRD and Raman spectroscopy analyses results confirmed the purity and indicated the disordered nature of the coconut shell-derived activated carbon.
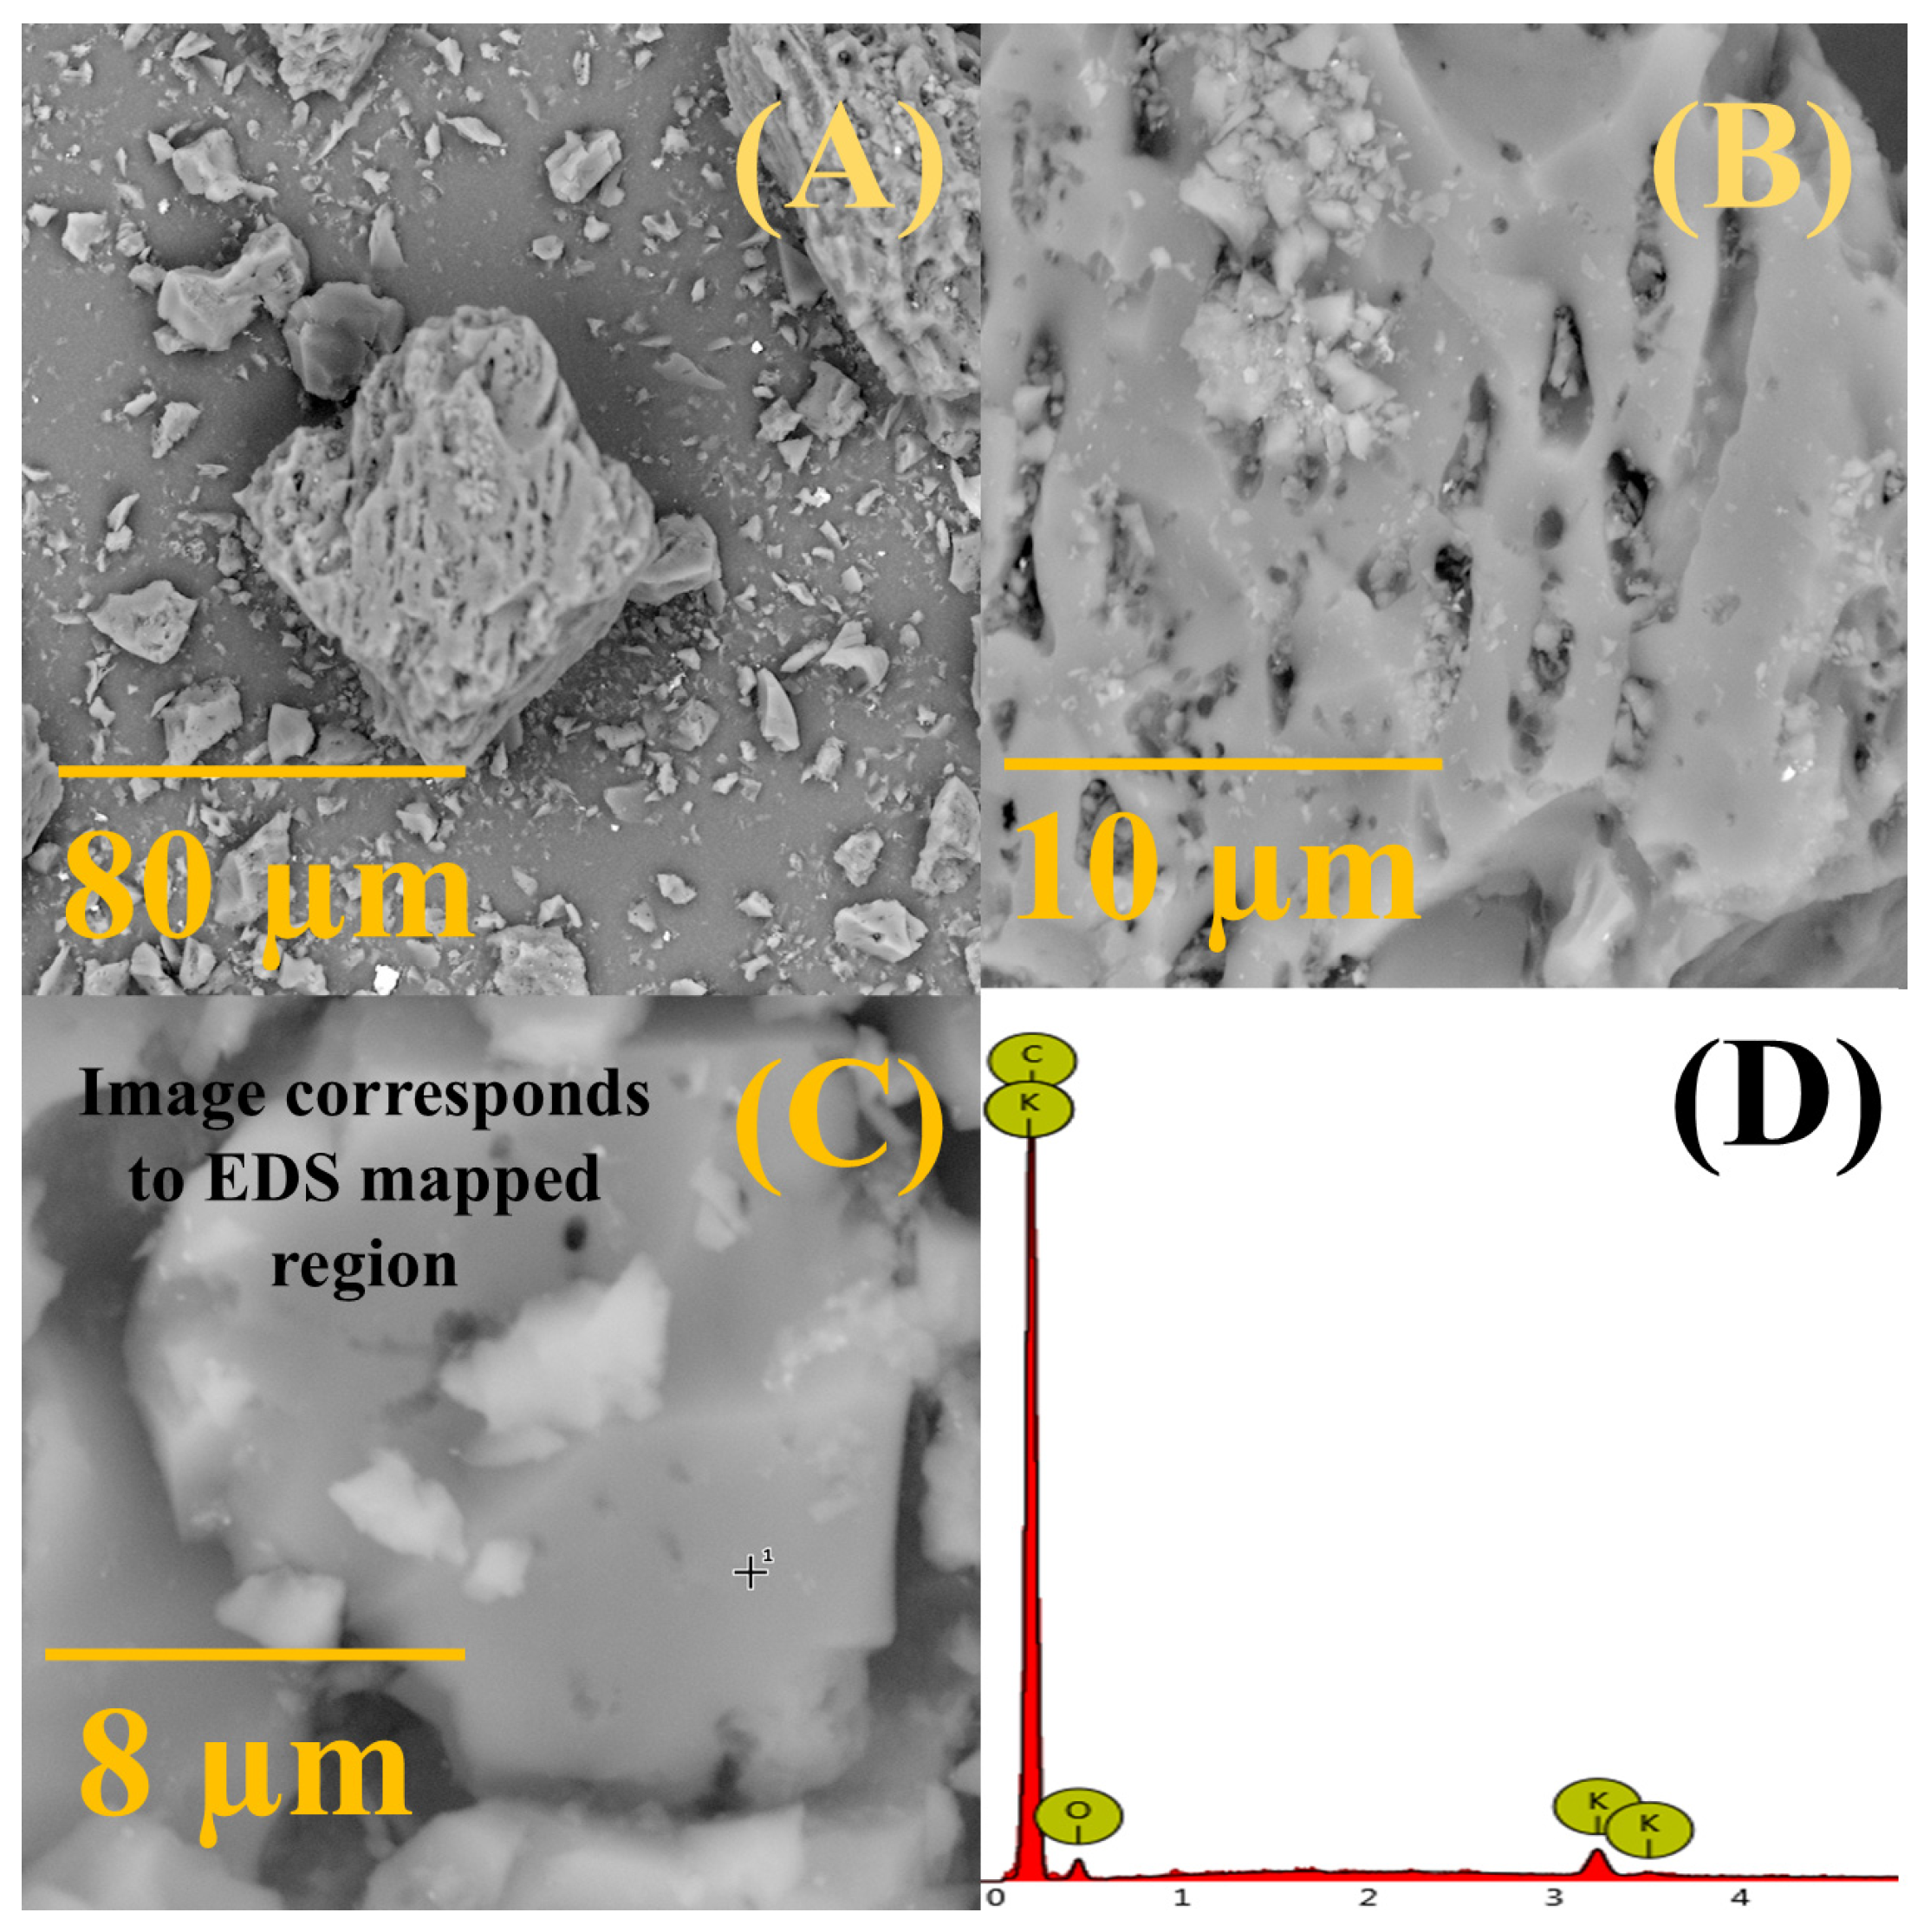
SEM images of coconut shell-derived activated carbon illustrate its nonuniform surface morphology, smooth with small pores and irregular cavities (
Figure 2A–C), somewhat resembling a honeycomb-like structure as previously observed for similar activated carbon black materials [
31,
39,
40]. Small salt particles scattered on CSDAC surface could also be observed. The EDS analysis of CSDAC confirmed the presence of carbon with a low amount of oxygen and traces of potassium,
Table S1.
N
2-sorption analysis (
Figure S3 shows N
2 adsorption/desorption isotherms of Type IV isotherm according to IUPAC) revealed a high BET (Brunauer–Emmett–Teller) surface area of CSDAC of 973 m
2 g
−1 with BJH (Barrett–Joyner–Halenda) average pore diameter of 0.31 nm and cumulative pore volume of 0.1118 cm
3. The resulting activated carbon exhibits a strong dominance of ultramicropores, with exceptional capacity for adsorbing very small molecules. Ultramicropores (≤0.95 nm) dominate the structure, contributing 0.43 cm
3 g
−1—over 75% of the total pore volume (0.569 cm
3 g
−1 for pores ≤ 44.8 nm). The pores are highly uniform, with a median width of 0.82 nm, closely matching the peak pore volume (0.457 cm
3 g
−1) observed in the ~0.8–0.9 nm range, confirming a sharp concentration in the ultramicropore region. CSDAC demonstrates significantly higher ultramicroporosity than typical commercially available bio-based steam-activated carbons, which generally feature broader microporosity (median width of 1.5–2.2 nm).
4.2. Initial Investigation of Adsorption of Nitrobenzene on Coconut Shell-Derived Activated Carbon
4.2.1. Effect of Adsorbent/Adsorbate Ratio
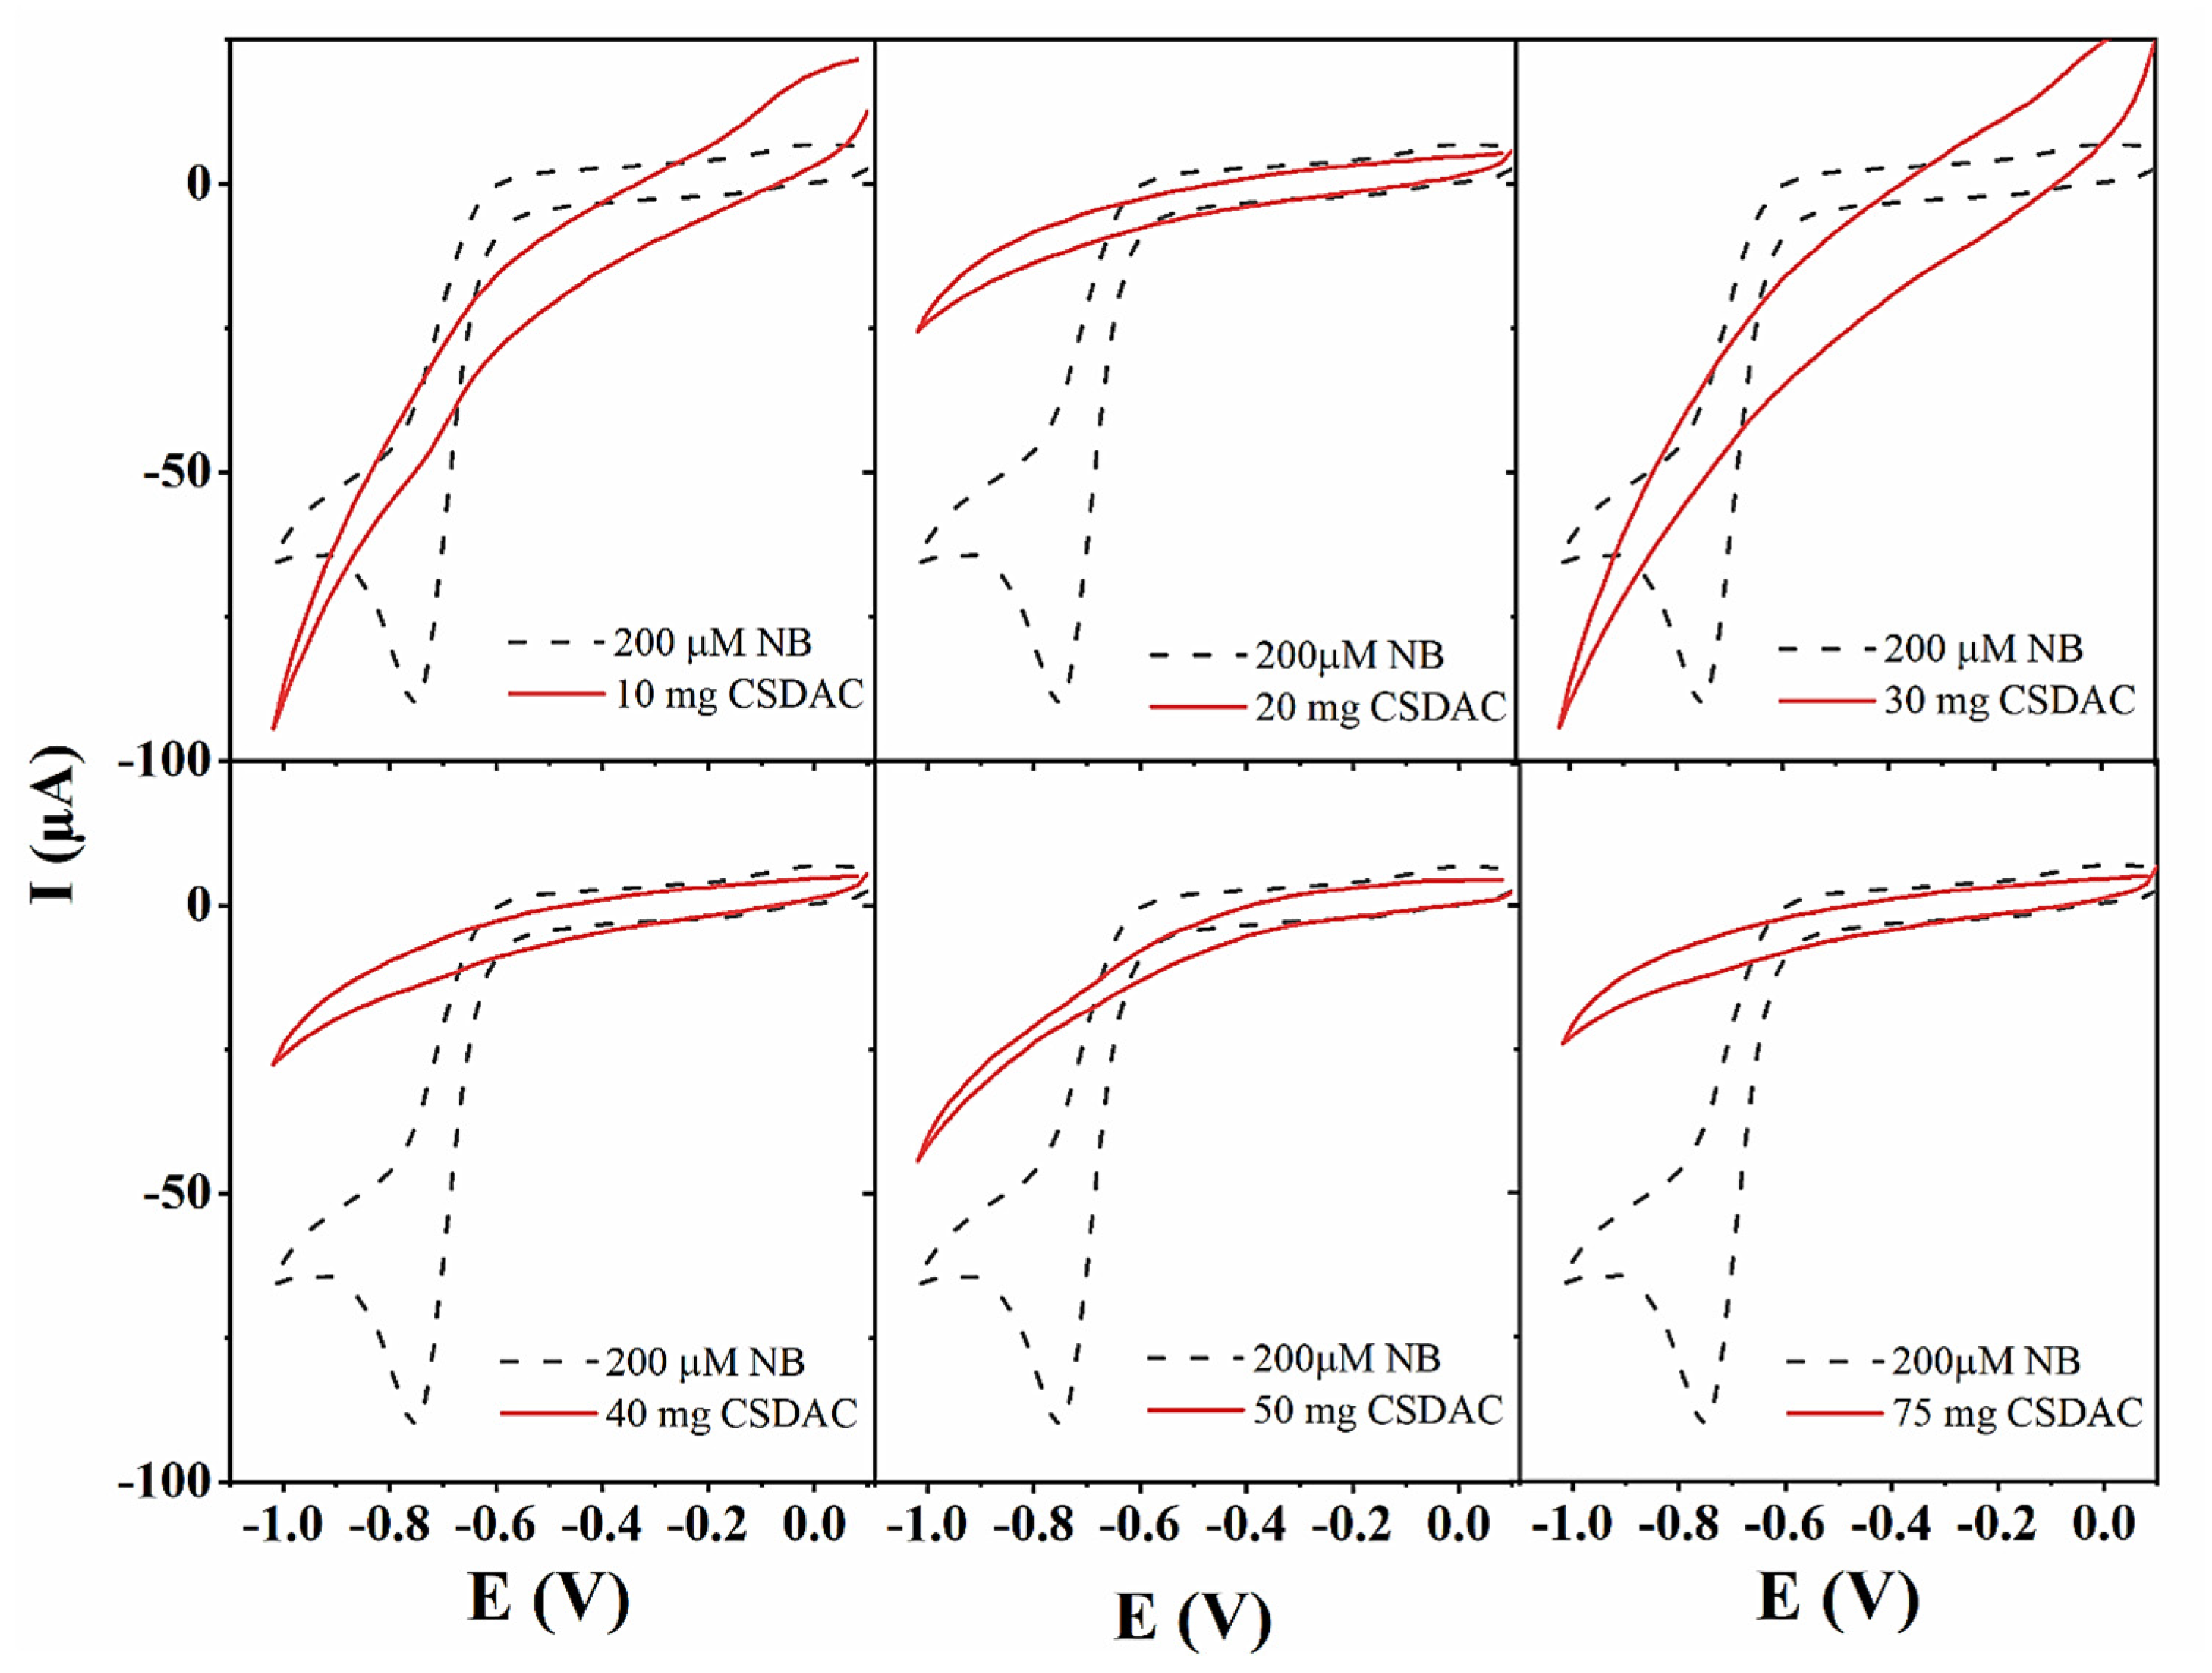
To determine the optimal experimental conditions for the adsorption of nitrobenzene compounds onto CSDAC, nitrobenzene (NB) was selected as a model compound for the investigation of key adsorption parameters. The study began with an evaluation of different adsorbent/adsorbate ratios; at this stage, NB concentration and volume were kept constant (200 μM, 50 mL), while the mass of CSDAC varied from 5 to 100 mg. The presence of nitrobenzene in the solution before and after adsorption was monitored by cyclic voltammetry using CoAg/rGO sensing platforms developed in the authors’ previous work [
32]. The voltammograms recorded in solutions prior to adsorption reveal a clear peak corresponding to nitrobenzene reduction at ca. −0.75 V, as shown in
Figure 3. Upon the adsorption process, no peak could be seen, confirming successful removal of the pollutant by CSDAC.
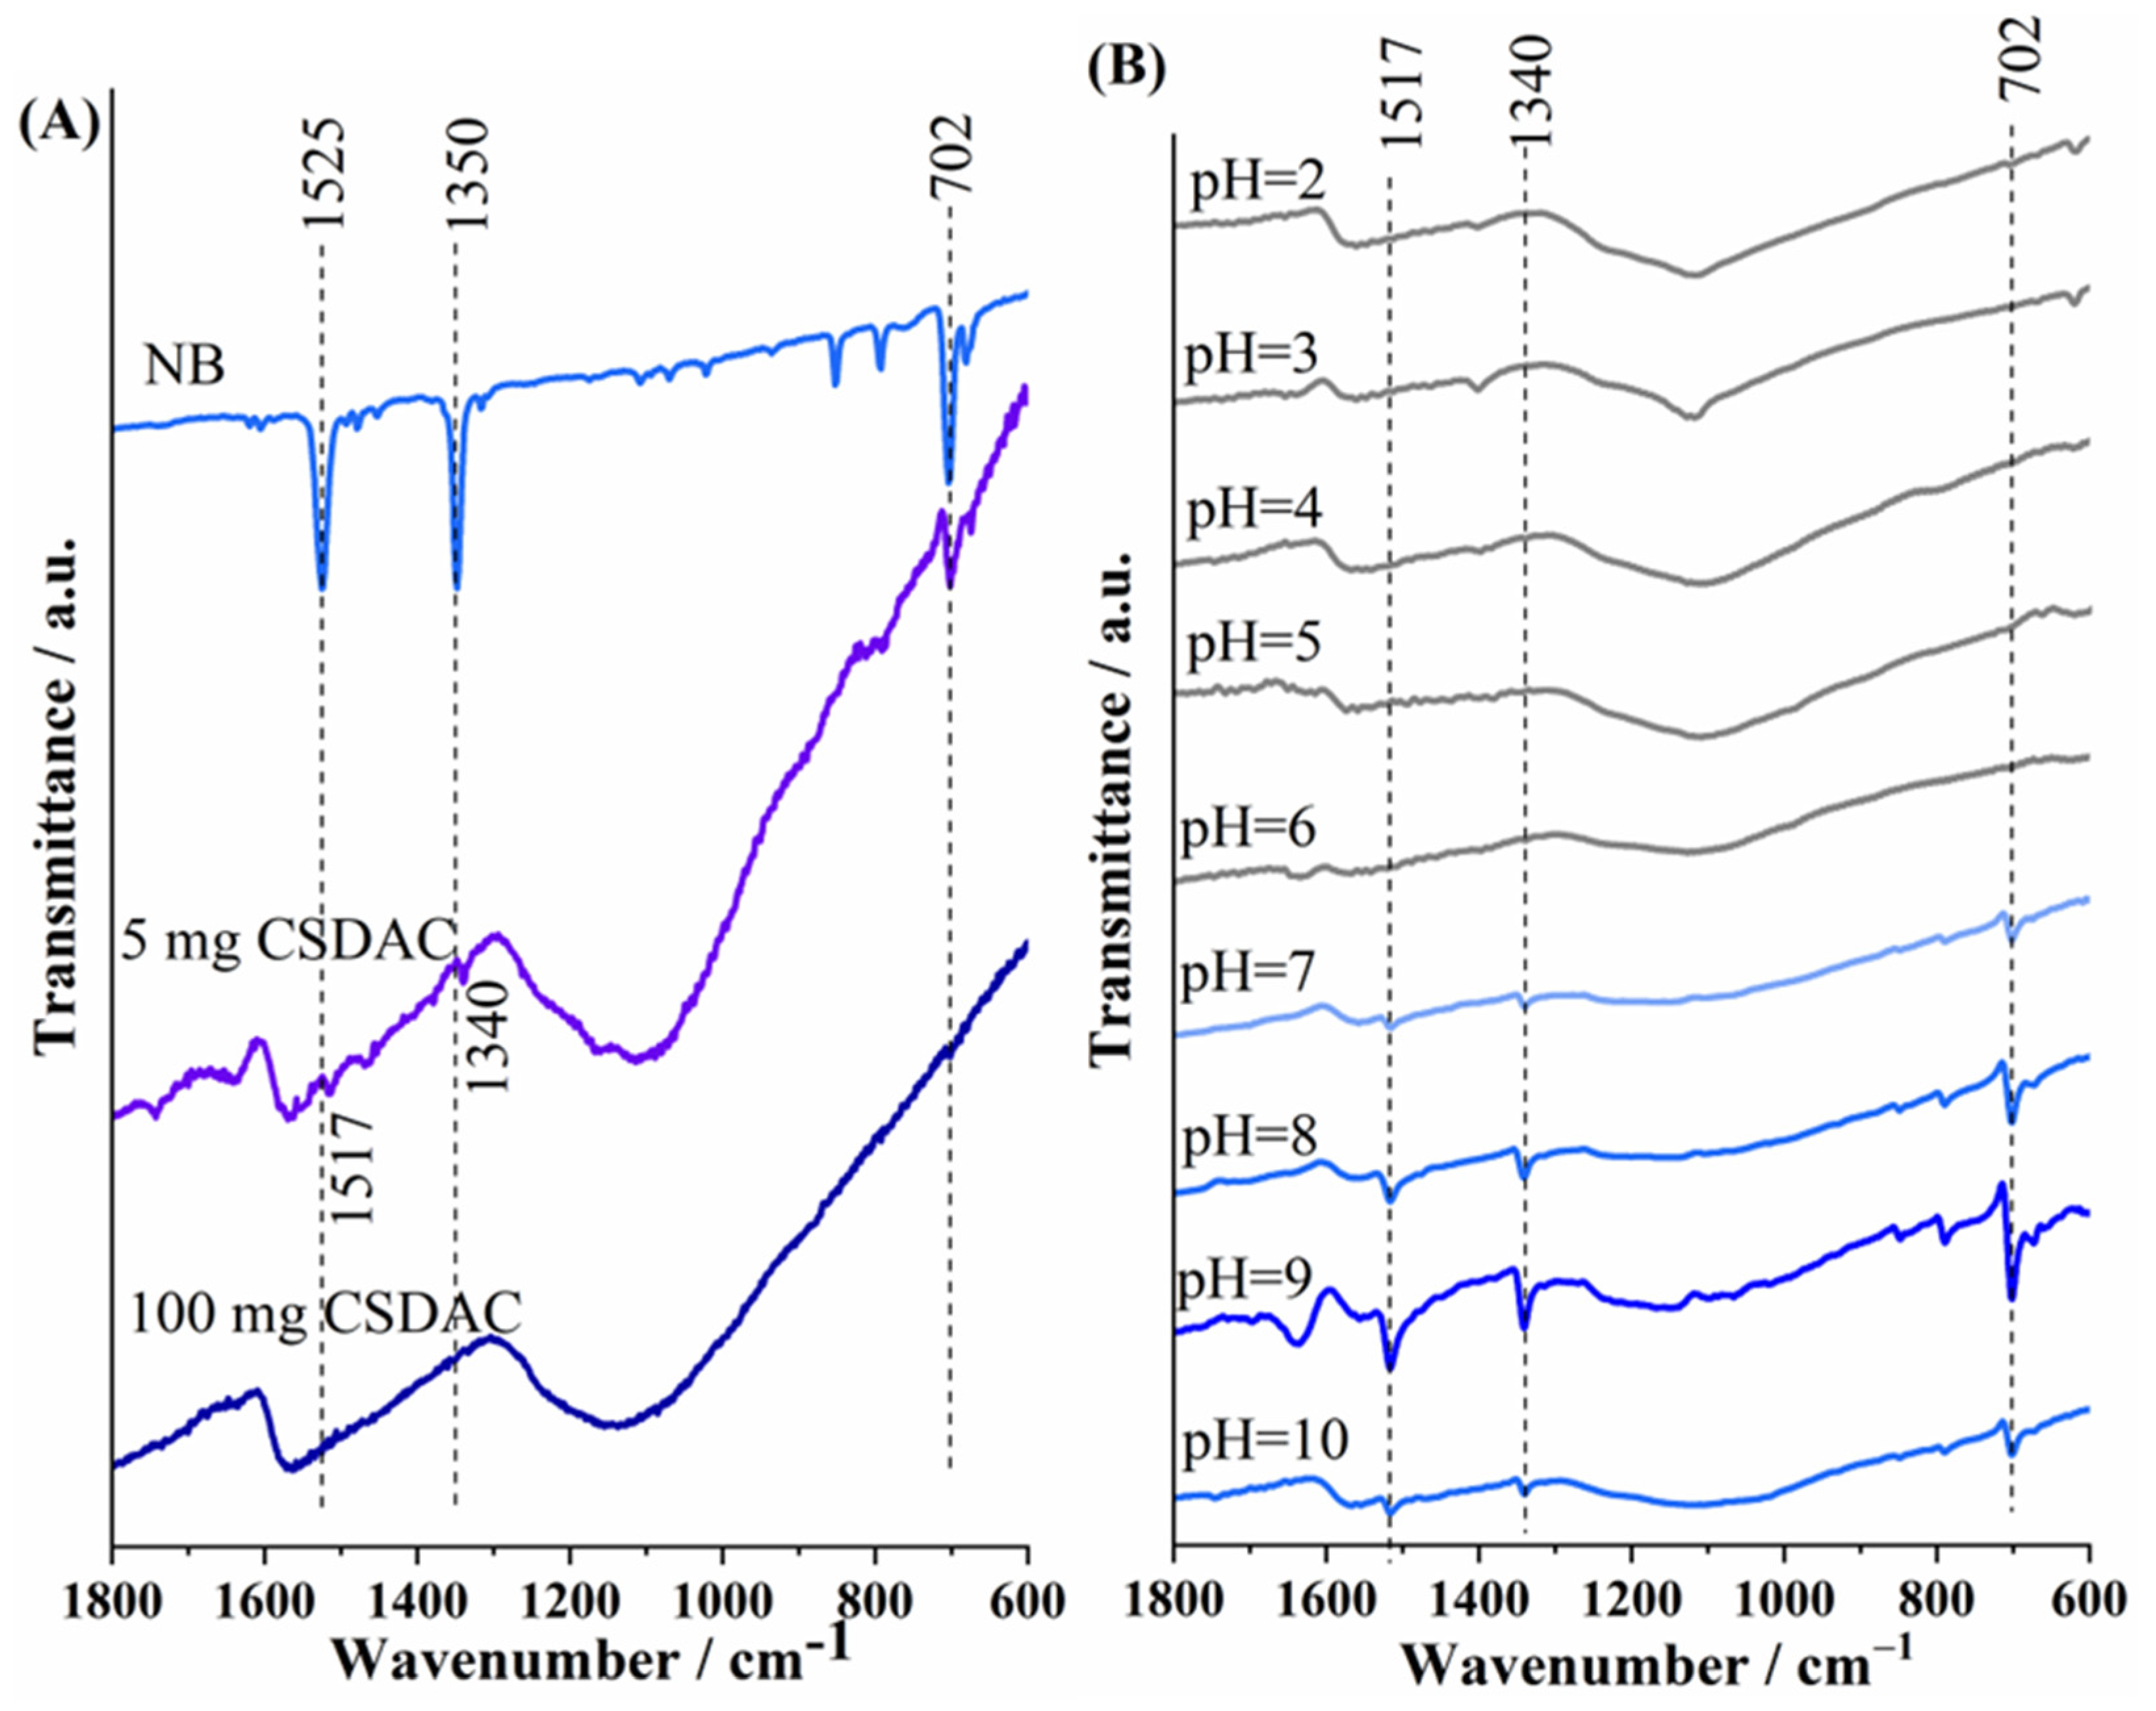
At the same time, the precipitate obtained after separating the supernatant was dried was analyzed using FTIR spectroscopy;
Figure 4A illustrates FTIR spectra of nitrobenzene and selected spectra of CSDAC saturated with nitrobenzene for different NB/CSDAC ratios. The bands originating from NB are only visible in the precipitate spectrum when the adsorbent mass is the smallest. The IR spectrum of nitrobenzene shows two strong bands around 1525 and 1350 cm
−1, which are attributed to the in-plane asymmetric and symmetric NO
2 stretching modes (v
asym (NO
2) and v
sym (NO
2)), respectively. Additionally, a moderate intensity band is observed at 702 cm
−1, corresponding to the out-of-plane NO
2 deformation mode (δ
oop (NO
2) [
41]. These v
asym and v
symbands were also observed in the spectra of CSDAC with nitrobenzene (
Figure 4A), suggesting that nitrobenzene was adsorbed onto the biochar. However, shifts in these bands were observed, with the bands moving from 1525 to 1517 cm
−1 and from 1350 to 1340 cm
−1 in nitrobenzene adsorbed on CSDAC. This red shift indicates a weakening of the N–O bonds [
42], suggesting the involvement of specific interactions such as hydrogen bonding between the nitro group and surface functional groups of the adsorbent, or π–π stacking interactions that alter the electron distribution within the nitrobenzene molecule. Previous studies involving bio-based carbon materials indicated involvement of O-containing functional groups in the adsorption of nitrobenzene by these carbons, with groups such as C=O, –OH, –COOH, and C–O–C providing adsorption sites [
9].
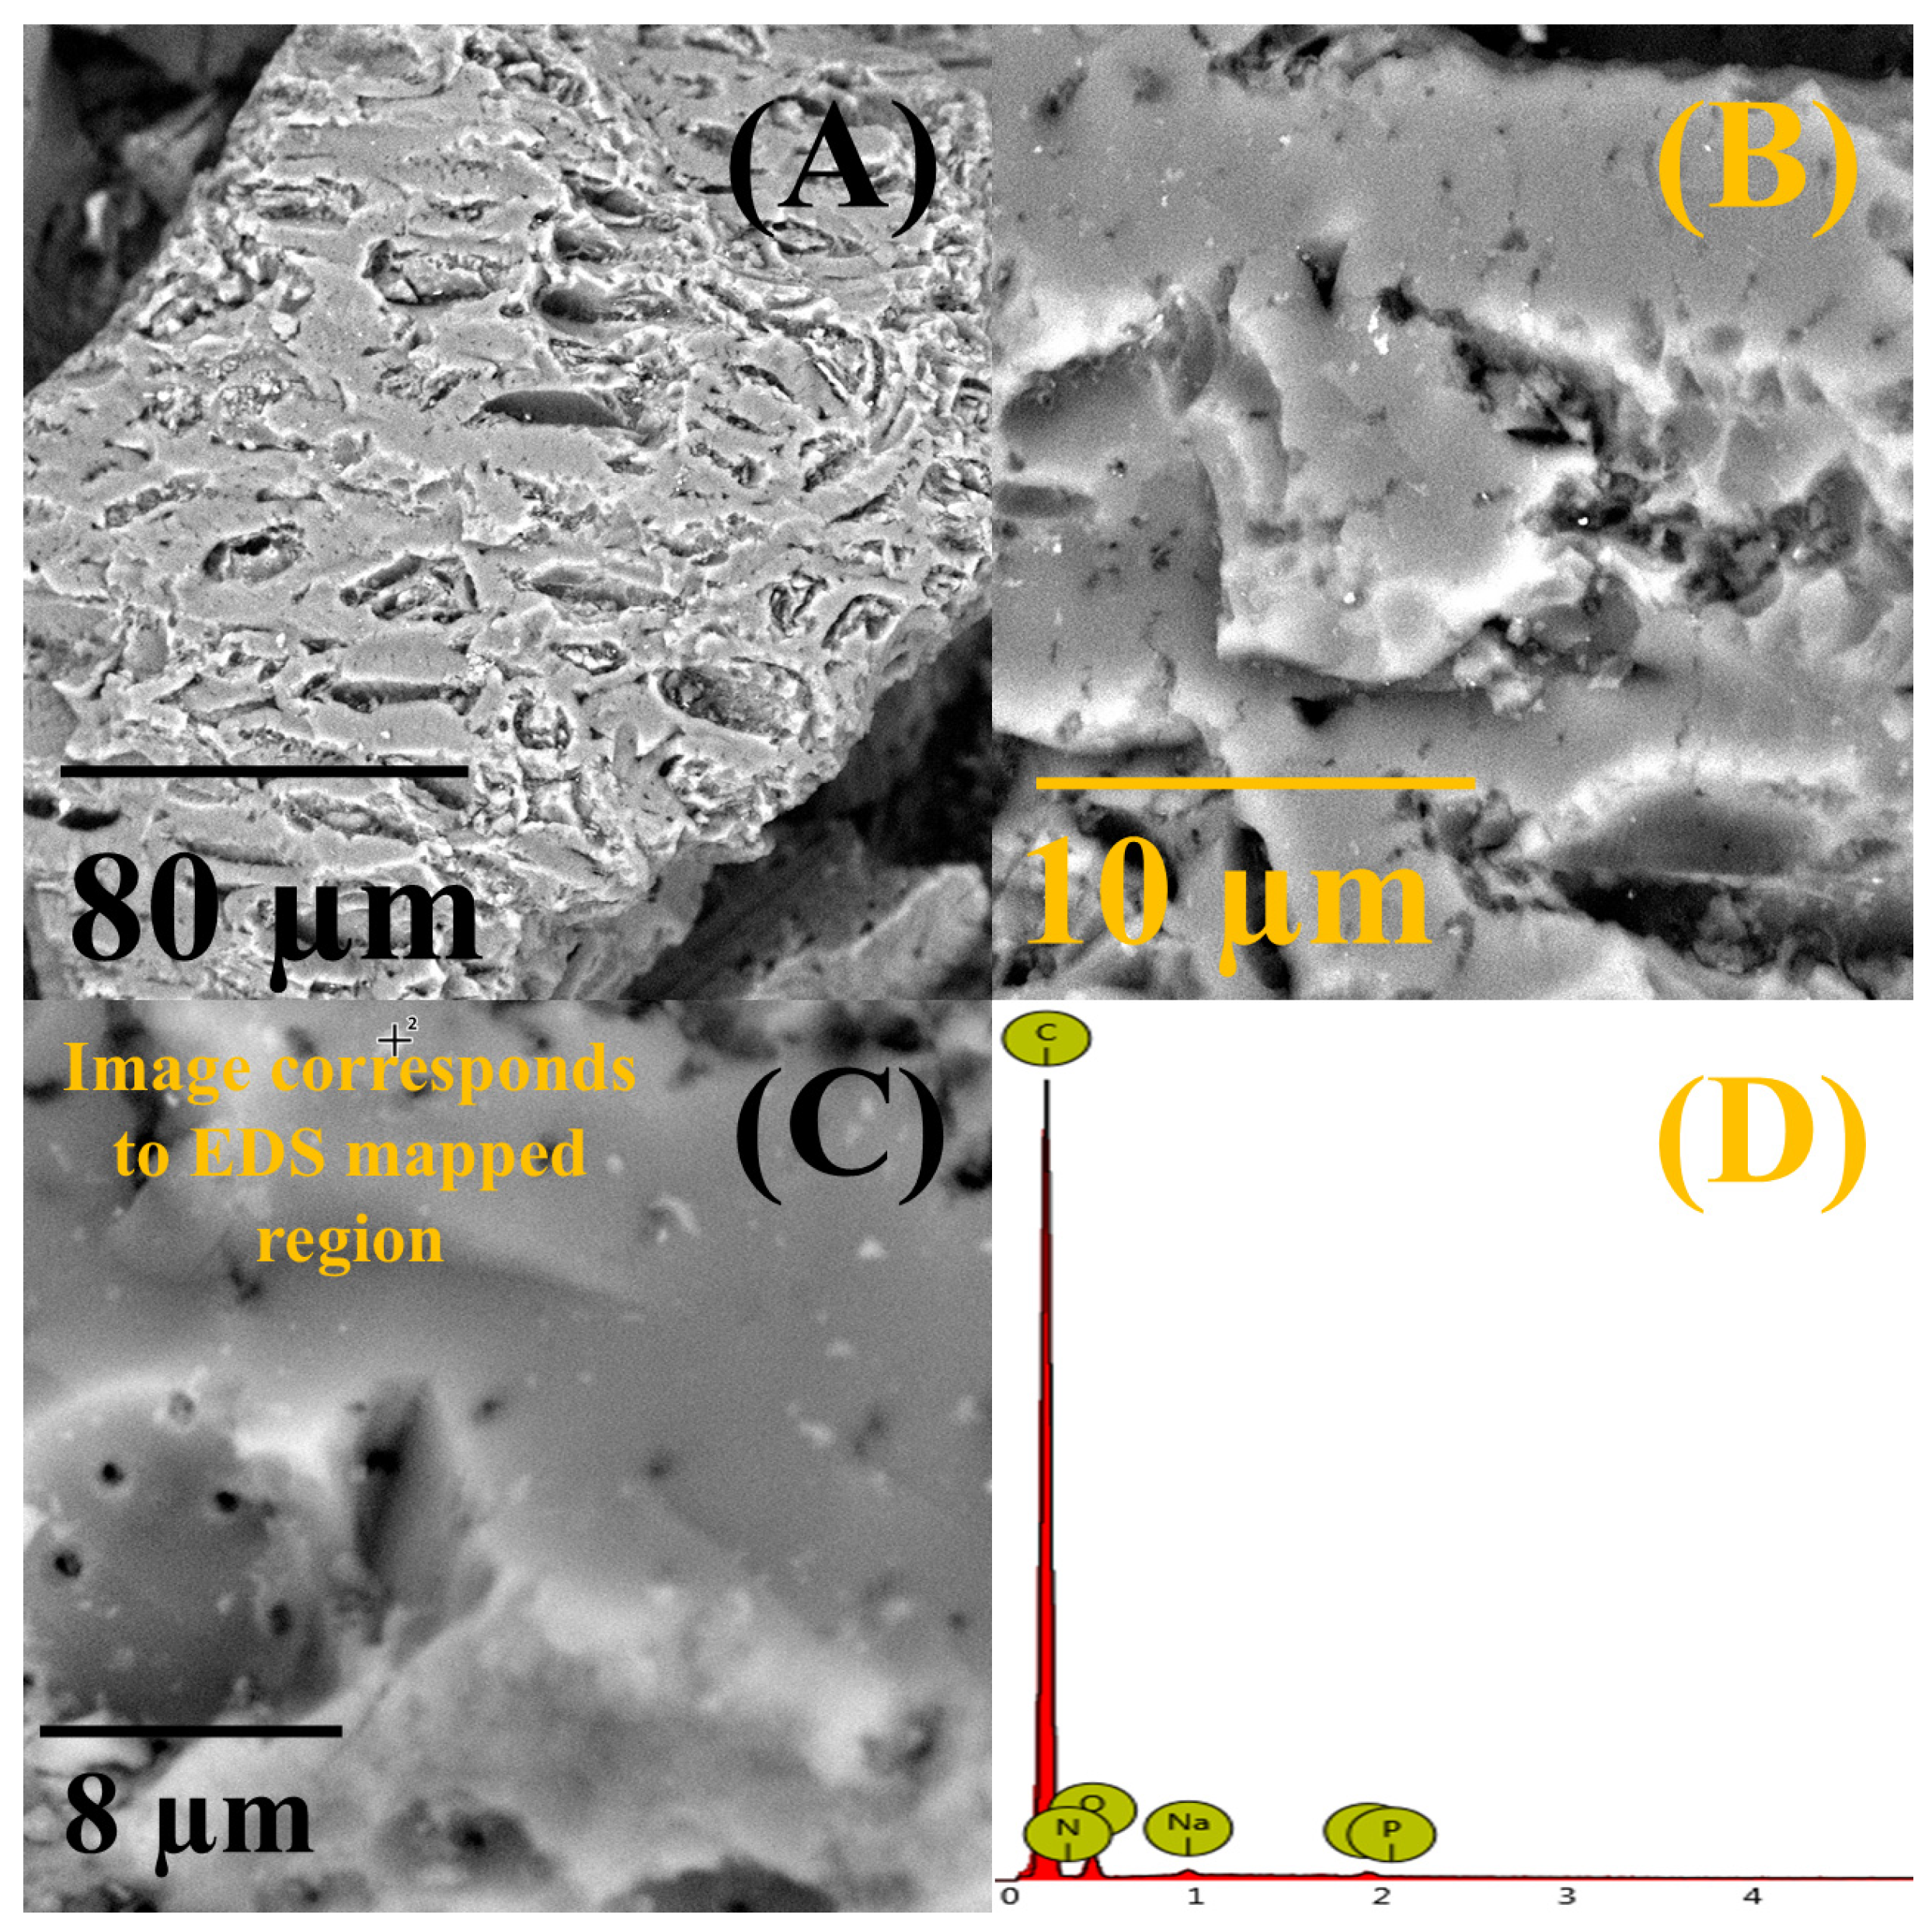
The morphology of CSDAC was preserved upon the adsorption of NB; many small pores and cavities could still be observed at the carbon’s surface (
Figure 5A–C), similar to those observed before the adsorption study (
Figure 2). EDS analysis of CSDAC after the adsorption of NB showed the presence of carbon, oxygen, nitrogen, sodium, and phosphorus (EDS spectrum is shown in
Figure 5D and analysis results summarized in
Table S2). These results confirmed that the adsorption of nitrobenzene by CSDAC was successful. High specific surface area and the observed ultramicroporosity of CSDAC are believed to directly contribute to its high capacity for adsorption of NB.
4.2.2. Effect of the pH Value of the Aqueous Sample
The effect of the pH value of NB solution was next studied by varying the pH in the 2 to 11 range while keeping constant the concentration and volume of NB (200 µM, 50 mL), as well as the mass of CSDAC (50 mg). Again, the presence of nitrobenzene in aqueous samples of a range of pH before and after mixing with CSDAC was observed using cyclic voltammetry. A clear peak attributed to nitrobenzene reduction could be seen over the studied pH range (though being less pronounced in the case of pH 5), as shown in
Figure S2. Disappearance of the nitrobenzene reduction peak upon mixing with CSDAC suggests successful removal of nitrobenzene in solutions of pH values 2–11. Still, under the same experimental conditions, the initial pH value of the NB solution plays a significant role in the amount of NB adsorbed, as further confirmed by FTIR spectroscopy analysis. Namely, FTIR spectra of precipitate upon adsorption in NB solution of different pH values were also recorded, as shown in
Figure 4B. In an acidic environment, the bands of NB are not visible, suggesting that the adsorbed amount is below the detection limit of the method. However, at pH 7, the characteristic bands of NB become visible. In an alkaline environment, the bands are also clearly visible, with the highest intensity observed at pH 9. As the pH increases further, the intensity of the bands decreases. The highest intensity of NB peaks in the case of pH 9 implies the highest amount of pollutant adsorbed on biochar and, thus, implies that pH 9 might be the optimum one for NB adsorption on CSDAC. In all cases where the characteristic bands of NB appear, the asymmetric and symmetric NO
2 stretching vibration bands shift to lower wave numbers compared to the spectrum of pure NB due to a weakening of the N–O bond.
Since initial studies indicated high potential of CSDAC for adsorption of nitrobenzene, the kinetics and thermodynamics of this process were studied in detail. Moreover, the same study was carried out for nitrobenzene derivative, dinitrobenzene, as well as for a mixture of nitrobenzene and dinitrobenzene, as real samples often contain a mixture of these pollutants.
4.3. Kinetic Studies of Nitrobenzene and Dinitrobenzene Adsorption on Coconut-Derived Activated Carbon
The adsorption kinetics were investigated by incubating CSDAC (concentration 1 mg mL
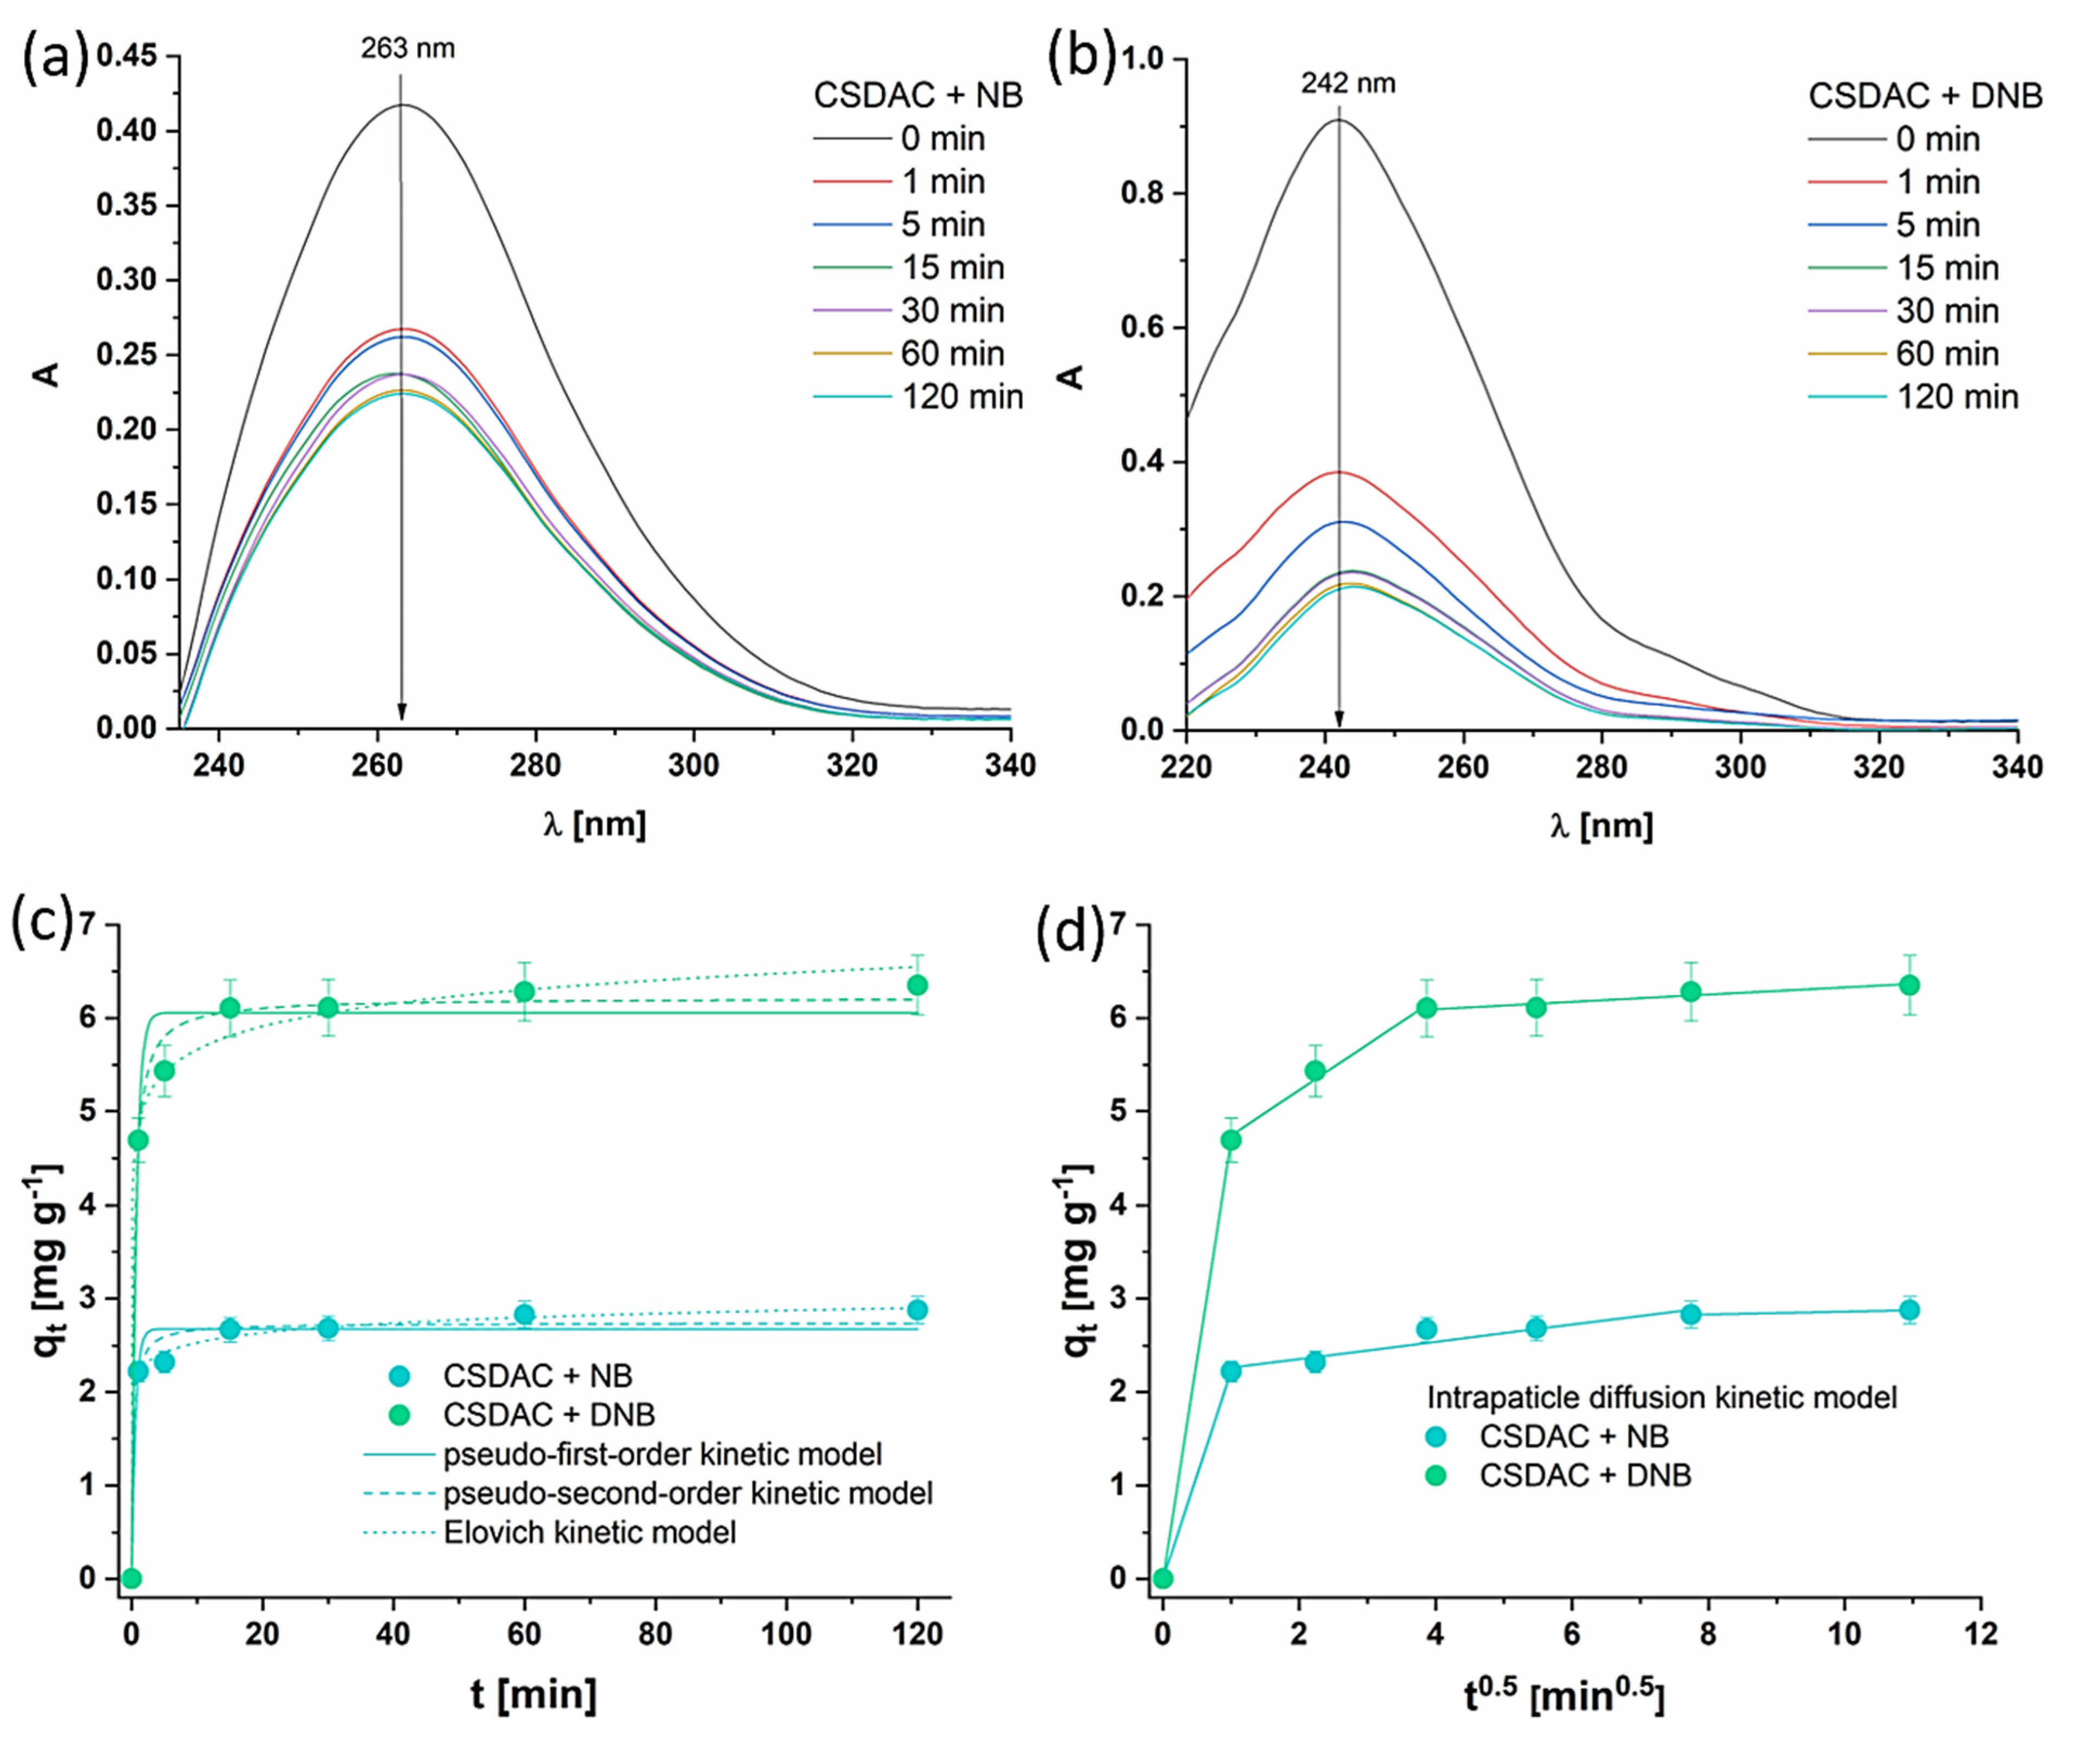
−1) with contaminants (concentration 50 µM) for various time intervals ranging from 1 min to 120 min at 25 °C. The equilibrium concentrations were measured using UV-VIS spectrophotometer. Change in the UV–VIS spectra of contaminants can be seen in
Figure 6a,b; the more pronounced decrease in absorbance over time for DNB compared to NB indicates that CSDAC removes DNB more efficiently. The UV-Vis spectra show a faster and more substantial reduction in the characteristic absorption peak of DNB, suggesting either a stronger interaction between DNB and the adsorbent surface or a higher affinity of the adsorbent for DNB. The adsorption kinetics of contaminants onto CSDAC were evaluated using nonlinear forms of the pseudo-first-order (PFO) and pseudo-second-order (PSO) models, along with the Elovich and intraparticle diffusion (IPD) models [
43]. The corresponding mathematical expressions for these models are provided in
Table S3. Graphical representations of these kinetic models fitting the experimental data (the quantity of adsorbate q
t (mg g
−1) adsorbed at a specific time t) are given in
Figure 6c,d, while the obtained parameters with corresponding coefficient of determination R
2 and χ
2 values are given in
Table 1. Pearson’s χ
2 test is used to determine whether there is a statistically significant difference between the expected and the observed value.
The graphical representation in
Figure 6 shows that the equilibrium between CSDAC and the contaminants is reached rapidly, within the first 10 min, so that time will be used as the equilibrium time in further studies. The PFO model yielded equilibrium adsorption capacities q
e of 2.67 mg g
−1 for NB and 6.06 mg g
−1 for DNB, with rate constants k
1 of 1.77 min
−1 and 1.48 min
−1, respectively. The corresponding coefficients of determination R
2 values were relatively high (0.963 for NB and 0.980 for DNB), indicating a reasonable fit. However, the PSO model provided a slightly better fit, with higher R
2 values (0.978 for NB and 0.993 for DNB) and lower χ
2 values. The PSO-derived equilibrium capacities were slightly higher than those from PFO, at 2.74 mg g
−1 for NB and 6.21 mg g
−1 for DNB, reinforcing the better applicability of the PSO model. The Elovich model also demonstrated an excellent fit, with R
2 values > 0.99 for both contaminants, suggesting a complex adsorption mechanism. The initial adsorption rate α values were slightly higher for NB than for DNB, while the desorption coefficient β was notably higher for NB than for DNB, implying stronger interactions with the adsorbent for DNB. The IPD model revealed a multi-step diffusion process, with the first stage indicating rapid adsorption onto the external surface, as evidenced by high k
id and no boundary layer effects. In subsequent stages, the lower k
id and increasing C values suggested slower intraparticle diffusion and reaching the adsorption equilibrium.
The adsorption of DNB onto CSDAC was more efficient than that of NB, as reflected by higher equilibrium capacities in both the PFO and PSO models. Additionally, the lower k
1 and k
2 values (
Table 1) for DNB suggest a slower adsorption rate compared to NB, which may be attributed to steric hindrance or solvation effects [
44]. The Elovich kinetic model results indicate that although NB exhibited a slightly higher initial adsorption rate, the lower desorption coefficient for DNB suggests stronger and more stable adsorption. The IPD analysis further supports the observed adsorption behavior by revealing that DNB undergoes a more pronounced boundary layer effect in later stages, which is indicative of greater diffusion resistance and stronger adsorbent–contaminant interactions. Specifically, the increase in the intercept C
1 from Part I to Part III in the IPD analysis indicates a growing contribution of the boundary layer effect as adsorption progresses. A higher C value reflects greater resistance to mass transfer at the external surface of the adsorbent, which is often associated with an increasing accumulation of adsorbate on surface sites before diffusion into internal pores becomes rate-limiting. This is consistent with the transition from initial rapid adsorption (Part I) toward slower intraparticle diffusion and eventual equilibrium (Part III), where surface coverage and steric hindrance become more pronounced.
The observed decrease in the intraparticle diffusion rate constant, Kid, from Part I to Part III suggests that the rate of diffusion into the inner pores slows down over time. Initially, readily accessible external sites and macropores dominate adsorption, allowing for faster diffusion. As these sites become occupied, diffusion shifts to smaller pores with more restricted access, lowering the diffusion rate constant in later stages.
The higher C and Kid values for DNB can be attributed to its molecular structure and stronger interactions with the adsorbent surface. DNB, with two nitro groups, exhibits higher polarity and a greater ability to engage in π-π interactions and hydrogen bonding with oxygen-containing functional groups on the adsorbent. This results in a more rapid initial uptake (higher Kid) and a more substantial boundary layer effect (higher C) compared to NB, which has only one nitro group and, thus, a lower affinity for the adsorbent.
These findings collectively suggest that while NB is adsorbed more rapidly, DNB achieves higher adsorption capacity and stronger binding to the CSDAC surface [
45].
4.4. Isotherm Studies of Nitrobenzene and Dinitrobenzene Adsorption on Coconut Shell-Derived Activated Carbon
To obtain experimental data for isotherm studies of NB and DNB adsorption onto CSDAC, 1 mg mL
−1 of material was incubated for 10 min with NB and DNB in the concentration range 1 µM–100 µM at 25 °C, 30 °C, and 35 °C. The experimental adsorption data were analyzed using several nonlinear isotherm models—Freundlich, Langmuir, Temkin, and Dubinin–Radushkevich [
43]—to better understand the nature of the adsorbate–adsorbent interactions and the adsorption mechanism. Each model provides distinct insights: the Langmuir model assumes monolayer adsorption onto a surface with a finite number of identical sites, while the Freundlich model accounts for multilayer adsorption on heterogeneous surfaces. The Temkin model incorporates the effects of indirect adsorbate–adsorbent interactions, suggesting that the heat of adsorption decreases linearly with coverage. The Dubinin–Radushkevich model is used to estimate the nature of the adsorption process (physical or chemical) based on the mean free energy of adsorption.
Figure 7 illustrates the equilibrium adsorption capacities q
e (mg g
−1) versus the equilibrium concentration C
e (mg dm
−3) data for NB and DNB adsorption on CSDAC fitted using the four models (corresponding equations are given in
Table S3). The Freundlich model showed high correlation with the experimental data, with high R
2 values for both contaminants at all investigated temperatures, as shown in
Table 2. The n-values for both NB and DNB ranged between 1.2 and 1.9, suggesting that adsorption was favorable. The increase in the Freundlich constant with temperature suggests enhanced adsorption at higher temperatures. However, the Langmuir model showed slightly better fits for DNB at 25 °C and 30 °C, as evidenced by high R
2 values (0.995 and 0.998), with the maximum amount of adsorbed adsorbate q
max increasing significantly with temperature, reaching 42.75 mg g
−1 at 35 °C. For NB, q
max also increased with temperature but remained lower than DNB, with a maximum of 12.88 mg g
−1 at 35 °C. These results suggest that DNB adsorption capacity is more sensitive to temperature changes compared to NB.
The Temkin isotherm model, which accounts for adsorbate–adsorbent interactions, showed a moderate fit for both NB and DNB, but DNB had generally higher values of isotherm equilibrium binding constant K
T, indicating stronger interactions at higher temperatures. The Dubinin-Radushkevich model revealed higher values of adsorption mean free energy E for DNB (ranging from 3081 to 3471 J mol
−1) compared to NB (ranging from 557 to 1244 J mol
−1), suggesting that DNB adsorption involves stronger physical interactions than NB. As temperature increased, the E-value for NB decreased, indicating weaker interactions at higher temperatures. In contrast, for DNB, the adsorption mean free energy remained high, indicating that stronger binding occurs at elevated temperatures [
46]. This difference supports the previous statement that DNB’s adsorption is more temperature-dependent and involves stronger interactions, while NB adsorption is relatively weaker and less influenced by temperature changes. The parameters obtained by the Dubinin-Radushkevich isotherm should be handled with reservation as R
2 values are below 0.9.
Based on the characterization and isotherm study results, it can be concluded that NB and DNB adsorb onto CSDAC through physical adsorption, mediated by electrostatic interactions, weak Van der Waals forces, and π-π interactions. In the case of DNB, the presence of two nitro groups at the 1 and 3 positions on the benzene ring increases its polarity compared to NB. This enhanced polarity results in stronger dipole–dipole interactions, making DNB more likely to interact with the material. Additionally, DNB benefits from electrostatic and Van der Waals interactions due to its increased dipole moment. This combination of interactions causes DNB to be more efficiently adsorbed onto CSDAC than NB [
47,
48].
4.5. Thermodynamic Studies of Nitrobenzene and Dinitrobenzene Adsorption on Coconut Shell-Derived Activated Carbon
Thermodynamic parameters, including change of enthalpy (ΔH), entropy (ΔS), and Gibbs free energy (ΔG), were evaluated to gain insight into the interactions between contaminant molecules and the material’s surface. The values of ΔH
0 and ΔS
0 were derived from the intercept and slope of the Van’t Hoff equation plot (Equation (4)), where ΔG
0 = −RTlnK
dist0. The standard distribution coefficient was determined using Equation (5). To make it dimensionless, q
e/C
e was multiplied by C
0 and q
0, representing the standard states of the contaminant in solution (1 molL
−1) and in the adsorbed phase (1 mol kg
−1), respectively.
Gibbs free energy was then calculated using the Gibbs–Helmholtz equation (Equation (6)).
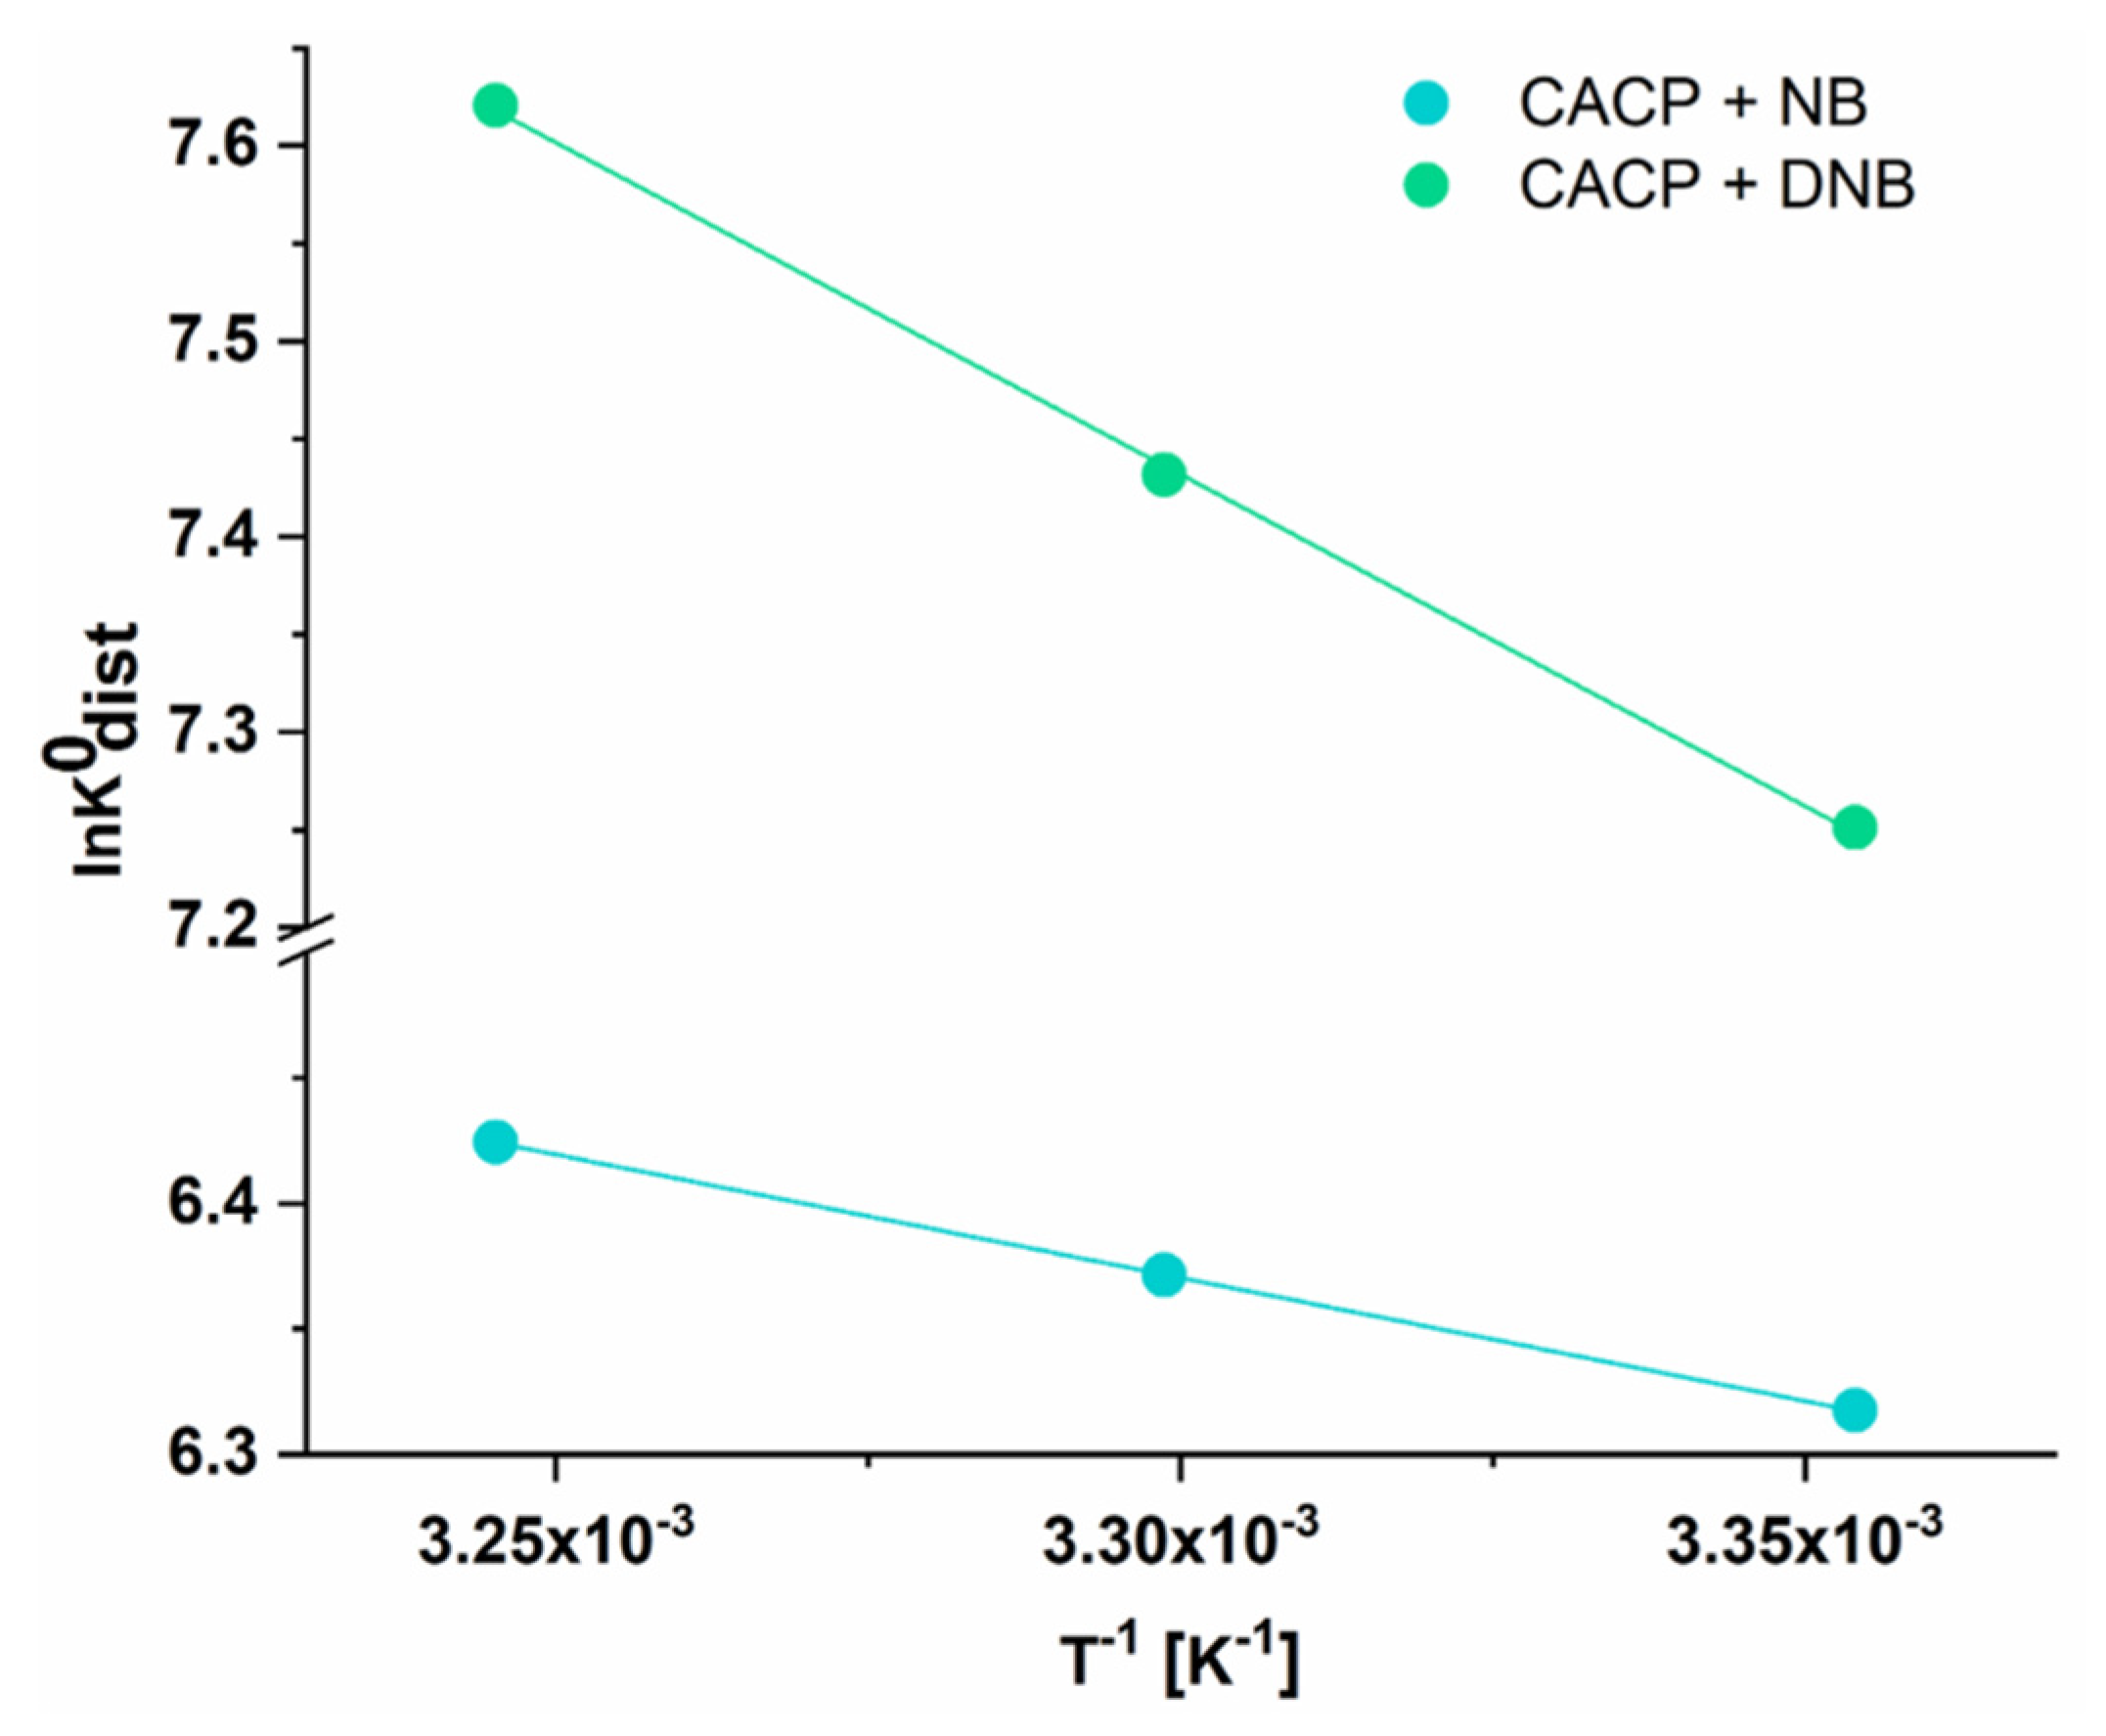
The Van’t Hoff plot for the adsorption of NB and DNB onto CSDAC at 25, 30, and 35 °C is presented in
Figure 8, while the corresponding thermodynamic parameters are summarized in
Table 3. The negative ΔG
0 values across all temperatures confirm that the adsorption of both contaminants is spontaneous. Moreover, the increasing negativity of ΔG
0 with temperature suggests that higher temperatures favor the spontaneity of the process. Additionally, temperature may induce a slight expansion of the carbon matrix, improving access to previously restricted adsorption sites. The added thermal energy also helps overcome activation energy barriers associated with specific interactions, such as π-π stacking or hydrogen bonding. Furthermore, elevated temperatures promote desolvation of adsorbate molecules in aqueous systems, reducing hydration shell effects and facilitating stronger interactions with the adsorbent surface. These combined effects result in increased adsorption capacity, as reflected by the rising q
max values with temperature. The positive ΔH
0 values (8.15 kJ mol
−1 for NB and 28.23 kJ mol
−1 for DNB) indicate that the adsorption is endothermic, meaning that heat absorption favors the process. The positive ΔS
0 values (79.86 J mol
−1 K
−1 for NB and 154.94 J mol
−1 K
−1 for DNB) suggest an increase in randomness at the solid–liquid interface upon adsorption, likely due to desolvation of contaminant molecules and their dynamic interactions with the adsorbent surface. These positive ΔS° values reflect the increase in spontaneity at higher temperatures; such behavior is often attributed to the desolvation of both adsorbent and adsorbate and increased molecular mobility at elevated temperatures, supporting an entropically favorable process despite the energy input required. Having in mind the Gibbs–Helmholtz equation, it can be concluded that these processes are entropy-driven [
49].
4.6. Adsorption of NB and DNB Under Dynamic Conditions and from a Mixture
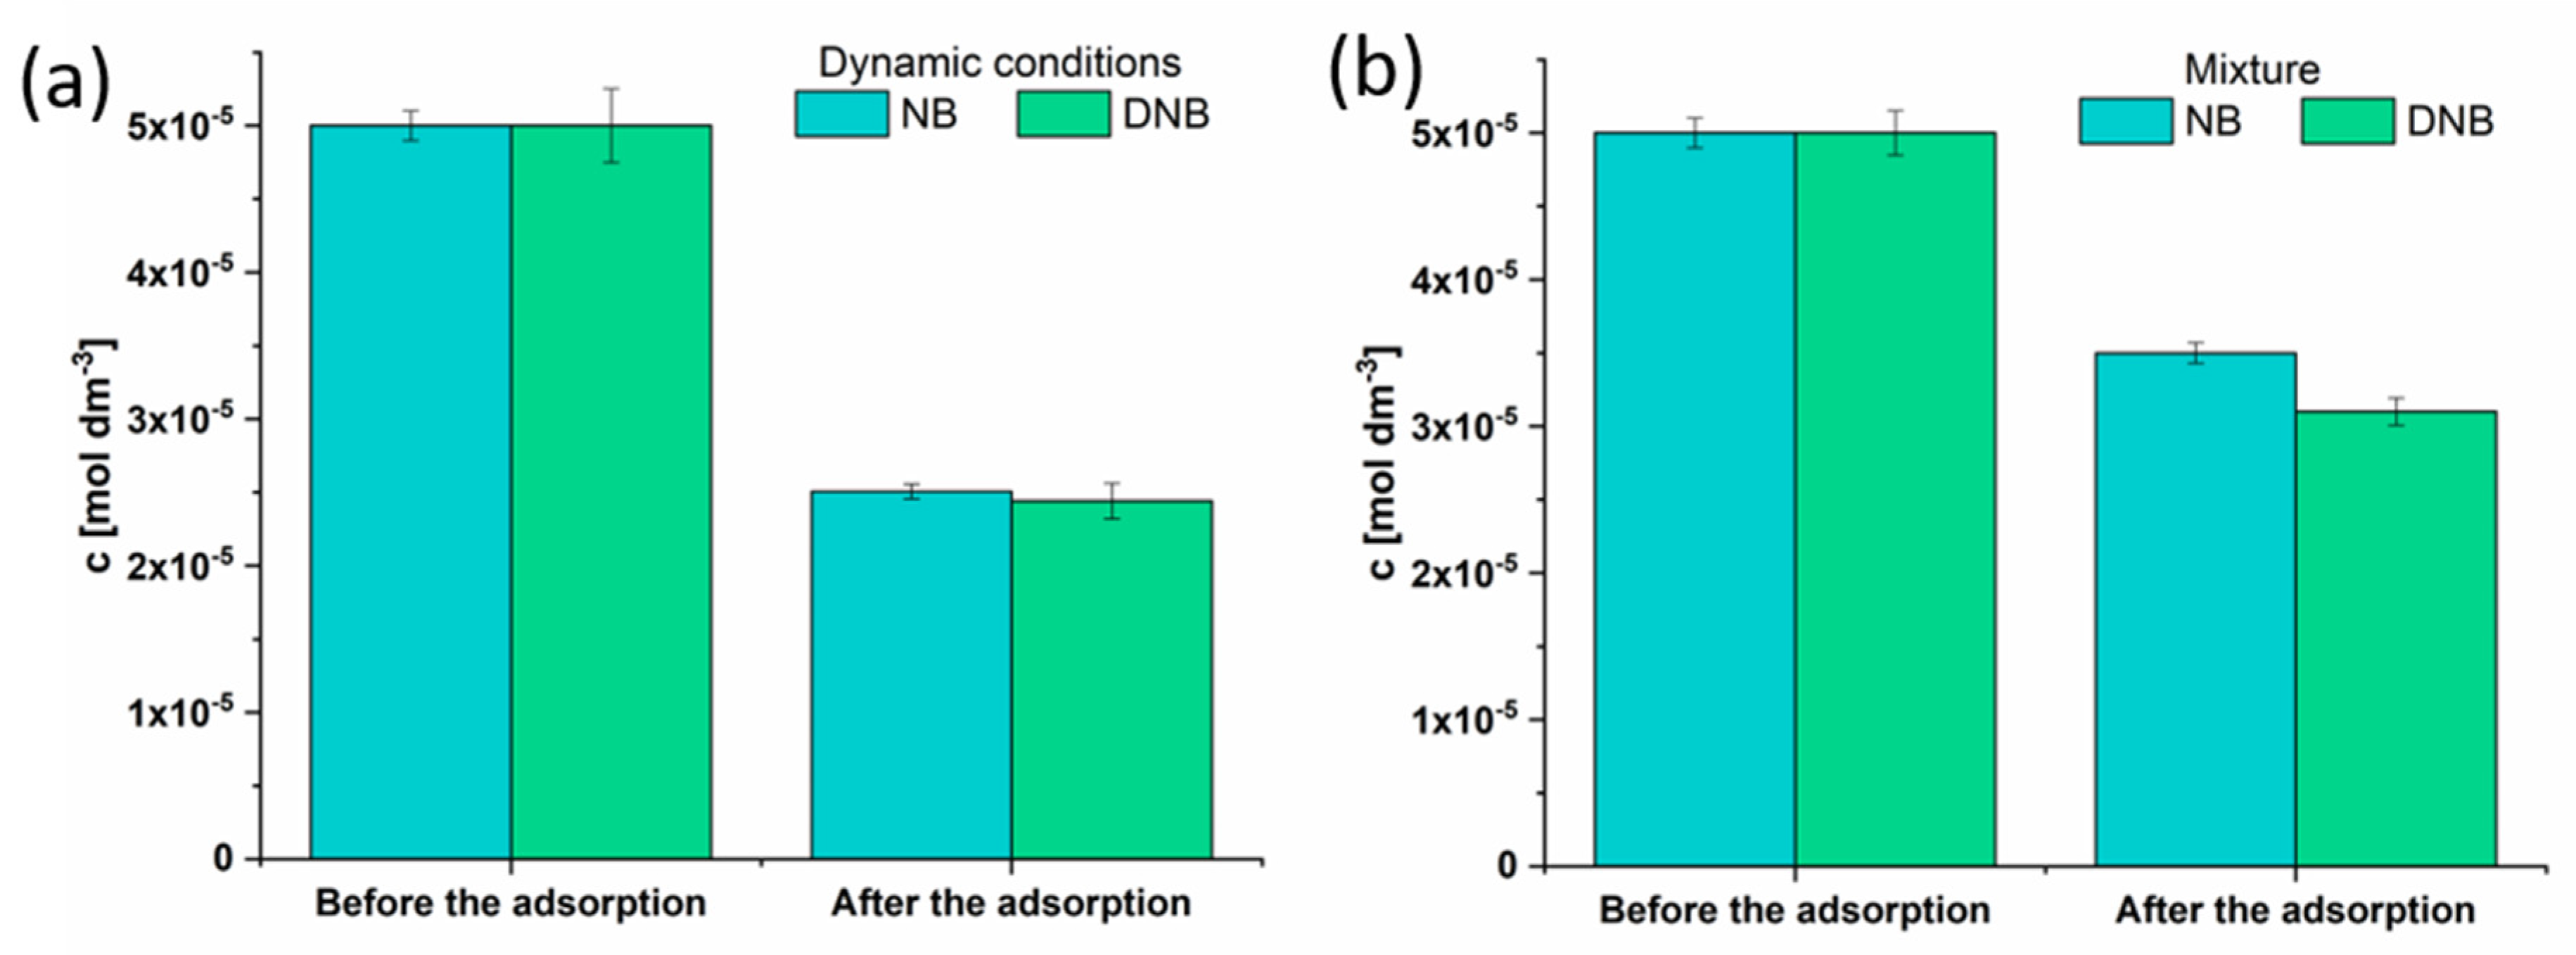
To evaluate the adsorption of NB and DNB under dynamic conditions, the nylon filter (0.22 μm) was filled with 1 mg of the CSDAC, and 1 mL of contaminants (50 µM) was injected. The adsorbed concentrations of contaminants were determined as previously described and presented in
Figure 9a. It can be noticed that under dynamic conditions, material non-specifically adsorbs similar amounts of the investigated contaminants (ca. 50%).
To test the selectivity of the material, the mixture containing 1 mg mL
−1 adsorbent and 50 µM of both contaminants was made. The mixture was incubated for 10 min and analyzed using UV-Vis spectroscopy. The results show that CSDAC has a higher affinity to DNB over NB (
Figure 9b), as was expected by comparing previously obtained q
max values from the Langmuir isotherm model. As the material adsorbs a lower amount of contaminants in the mixture than in the single-contaminant experiments, it can be assumed that they are adsorbed mostly onto the same adsorption centers. Even though the material exhibits a slight preference toward DNB, it cannot be considered specific as it adsorbs both components well.
The comparison of nitrobenzene and m-dinitrobenzene adsorption in this study with relevant literature reports [
9,
12,
43,
50,
51,
52,
53,
54] is presented in
Table S5 to provide insight into the CSDAC efficiency. The adsorption capacity (Q
m) is used as a comparison parameter.
5. Final Discussion of the Adsorption Mechanism
It is hypothesized that the initial adsorption of nitrobenzene onto the CSDAC surface is first driven by hydrophobic interactions, attributable to the polarity contrast between NB, water molecules, and the CSDAC surface [
3]. NB, characterized by its π-electron deficiency and strong dipole moment, functions as a π-acceptor, interacting with π-electron-rich sites on the CSDAC surface. Additionally, the oxygen atoms in the nitro group of NB serve as hydrogen bond acceptors, facilitating hydrogen bonding with surface hydroxyl (-OH) groups.
π–π stacking interactions are also likely to play a significant role as the polarized aromatic π-electron system of NB can engage with the aromatic domains of CSDAC, which act as π-donors. Hydrogen bonding between surface functional groups (e.g., –OH, –COOH) and the –NO2 moiety further supports the adsorption process. Spectroscopic and surface characterization analyses suggest the involvement of oxygen-containing functional groups, such as carbonyl (C=O), hydroxyl (–OH), carboxyl (–COOH), and ether (C–O–C), which serve as active sites facilitating NB adsorption.
Furthermore, the adsorption mechanism appears to be pH-dependent. Thus, at lower pH values, increased protonation of the adsorbent surface results in a net positive charge, enhancing electrostatic interactions with the negatively polarized nitro groups of NB [
22].
6. Conclusions, Implications, and Future Works
This study demonstrated the high potential of activated carbon derived from coconut shell as an effective, environmentally friendly, and economically viable adsorbent for the removal of nitrobenzene and its derivative, 1,3-dinitrobenzene, from water. Comprehensive material characterization, including SEM/EDS, Raman and FTIR spectroscopy, XRD, and N2-sorption analyses, confirmed that the adsorbent possesses high surface area, developed porosity, and surface functional groups that facilitate efficient adsorption through hydrogen bonding, Van der Waals forces, and π–π interactions.
The adsorption process exhibited rapid kinetics, reaching equilibrium within 10 min. The data fit best with the pseudo-second-order (PSO) kinetic model, suggesting the relevance of intermolecular interactions. Thermodynamic analysis (positive ΔH0 and ΔS0 values and increasingly negative ΔG0 values with temperature) indicated that the process is spontaneous and endothermic, with higher temperatures favoring adsorption.
Isotherm analysis revealed that the Freundlich and Langmuir models provide the best fit, with significantly higher maximum adsorption capacity (qmax) for DNB than for NB (42.75 mg g−1 vs. 12.88 mg g−1 at 35 °C), indicating a higher affinity of CSDAC toward highly nitrated molecules. Competitive adsorption experiments further confirmed a preferential, but not exclusive, affinity for DNB, suggesting shared adsorption sites and partial overlap in adsorption mechanisms.
Compared to many engineered adsorbents, CSDAC offers several distinct advantages: it is commercially available, low-cost, derived from renewable biomass, and does not require surface modification or complex synthesis procedures. These properties make CSDAC especially attractive for large-scale or decentralized water treatment applications, particularly in low-resource settings.
Despite these advantages, the study also recognizes several limitations. The regeneration and reuse of CSDAC were not evaluated and represent a crucial factor for long-term applicability and cost-efficiency. Additionally, while the material demonstrates strong adsorption capacity, its selectivity in multicomponent systems remains moderate. These aspects should be systematically addressed in future research.
To enhance practical relevance, future work should focus on pilot-scale testing under real wastewater conditions, incorporating various co-existing pollutants and matrix effects. Additionally, mild surface functionalization—such as oxidative treatment or amine grafting—could be explored to improve adsorbent selectivity toward specific nitroaromatic targets. This study provides a strong foundation for such future developments and confirms the potential of CSDAC as a sustainable and scalable adsorbent for the efficient removal of hazardous pollutants from contaminated water.
Supplementary Materials
The following supporting information can be downloaded at:
https://www.mdpi.com/article/10.3390/pr13072072/s1, Figure S1: Calibration curves for nitrobenzene (NB) and dinitrobenzene (DNB); Figure S2: Cyclic voltammograms recorded using CoAg/rGO electrode in 200 µM nitrobenzene solutions of different pH values prior and upon mixing with CSDAC (50 mg) sorbent; Figure S3: Nitrogen adsorption and desorption isotherms of the CSDAC; Table S1: EDS analysis of coconut shell-derived activated carbon; Table S2: EDS analysis of coconut shell-derived activated carbon after adsorption of NB; Table S3: Kinetic models and their corresponding equations; Table S4: Isotherm models and their corresponding equations; Table S5: A comparison of nitrobenzene and m-dinitrobenzene adsorption in this study with relevant literature reports.
Author Contributions
Conceptualization, B.Š.; formal analysis, A.M.Đ., J.M., V.M., and D.B.B.; investigation, A.M.Đ., J.M., V.M., D.B.B., and K.R.; data curation, A.M.Đ. and V.M.; writing—original draft preparation, A.M.Đ., J.M., V.M., D.B.B., and K.R.; writing—review and editing, M.M.K., D.R., D.S., and B.Š.; visualization, A.M.Đ., J.M., V.M., D.B.B., and B.Š.; supervision, M.M.K., D.R., D.S., and B.Š. All authors have read and agreed to the published version of the manuscript.
Funding
This research was funded by the Ministry of Science, Technological Development and Innovation of the Republic of Serbia, grants number 451-03-136/2025-03/200168, 451-03-137/2025-03/200146, 451-03-136/2025-03/200017, and 451-03-136/2025-03/200051, and by the Fundação para a Ciência e a Tecnologia (FCT, Portugal).
Data Availability Statement
The data presented in this study are available on request from the corresponding author. The data are not publicly available due to privacy restrictions.
Acknowledgments
The authors would like to thank Anup Paul for nitrogen-sorption analysis.
Conflicts of Interest
The authors declare no conflicts of interest.
References
- Nair, R.G.; Nair, A.K.; Sun, S.; Yan, B. Adsorption of Organic Pollutants on B12N12 and Al12N12 Nanocages. Comput. Theor. Chem. 2025, 1248, 115187. [Google Scholar] [CrossRef]
- Ahmad, K.; Oh, T.H. Advanced-Functional-Material-Modified Electrodes for the Monitoring of Nitrobenzene: Progress in Nitrobenzene Electrochemical Sensing. Processes 2024, 12, 1884. [Google Scholar] [CrossRef]
- Yang, G.; Lin, N.; Li, Y.; Ye, X.; Liu, Y.; Lv, Y.; Lin, C.; Liu, M. Preparation of a Novel Cellulose—Styrene Copolymer Adsorbent and Its Adsorption of Nitrobenzene from Aqueous Solutions. Polymers 2021, 13, 609. [Google Scholar] [CrossRef]
- Zhao, S.; Li, K.; Zhu, S.; Guo, Q.; Song, G.; Zhao, K.; Gong, Q.; Liu, R. Mitigating Nitrobenzene Toxicity in Anaerobic Digestion Using Hollow Carbon Spheres: Enhanced Methane Production via Direct Interspecies Electron Transfer. J. Water Process Eng. 2025, 70, 106953. [Google Scholar] [CrossRef]
- Li, S.S.; Fang, J.H.; Li, L.; Zhu, M.; Zhang, F.; Zhang, B.Y.; Jiang, T.J.; Zhang, Y.X. An Ultra-Sensitive Electrochemical Sensor of Ni/Fe-LDH toward Nitrobenzene with the Assistance of Surface Functionalization Engineering. Talanta 2021, 225, 122087. [Google Scholar] [CrossRef]
- Michenzi, C.; Proietti, A.; Rossi, M.; Espro, C.; Bressi, V.; Vetica, F.; Simonis, B.; Chiarotto, I. Carbon Nanodots from Orange Peel Waste as Fluorescent Probes for Detecting Nitrobenzene. RSC Sustain. 2024, 2, 933–942. [Google Scholar] [CrossRef]
- Kumer, A.; Ahmed, B.; Sharif, M.; Al-Mamun, A. A Theoretical Study of Aniline and Nitrobenzene by Computational Overview. Asian J. Phys. Chem. Sci. 2017, 4, 1–12. [Google Scholar] [CrossRef]
- Kokulnathan, T.; Jothi, A.I.; Chen, S.-M.; Almutairi, G.; Ahmed, F.; Arshi, N.; AlOtaibi, B. Integrating Graphene Oxide with Magnesium Oxide Nanoparticles for Electrochemical Detection of Nitrobenzene. J. Environ. Chem. Eng. 2021, 9, 106310. [Google Scholar] [CrossRef]
- Wang, D.; Shan, H.; Sun, X.; Zhang, H.; Wu, Y. Removal of Nitrobenzene from Aqueous Solution by Adsorption onto Carbonized Sugarcane Bagasse. Adsorpt. Sci. Technol. 2018, 36, 1366–1385. [Google Scholar] [CrossRef]
- Rathore, R.; Waghmare, A.; Rai, S.; Chandra, V. Removal of Nitrobenzene from Aqueous Solution Using Manganese Ferrite Nanoparticles. Inorg. Chem. Commun. 2023, 153, 110848. [Google Scholar] [CrossRef]
- Blachnio, M.; Zienkiewicz-Strzalka, M.; Derylo-Marczewska, A. Equilibrium Adsorption of Organic Compounds (Nitrobenzene Derivative, Synthetic Pesticide, Dye, and Surfactant) on Activated Carbon from Single- and Multi-Component Systems. Molecules 2024, 30, 88. [Google Scholar] [CrossRef] [PubMed]
- Dai, Y.; Mihara, Y.; Tanaka, S.; Watanabe, K.; Terui, N. Nitrobenzene-Adsorption Capacity of Carbon Materials Released during the Combustion of Woody Biomass. J. Hazard. Mater. 2010, 174, 776–781. [Google Scholar] [CrossRef]
- Parham, H.; Saeed, S. Pre-Concentration and Determination of Traces of Nitrobenzene and 1,3-Dinitrobenzene in Water Samples Using Anthracite Adsorbent. J. Ind. Eng. Chem. 2014, 20, 1003–1009. [Google Scholar] [CrossRef]
- Wang, D.; Zhang, W.; Zhang, R.; Tao, N.; Si, L.; Guo, C. Phytotoxicity of Nitrobenzene Bioaccumulation in Rice Seedlings: Nitrobenzene Inhibits Growth, Induces Oxidative Stress, and Reduces Photosynthetic Pigment Synthesis. Plant Physiol. Biochem. 2023, 204, 108096. [Google Scholar] [CrossRef]
- Journal, A.I.; Midda, O.; Srivastava, V.C.; Kushwaha, J.P. Modelling Single and Binary Adsorptive Behaviour of Aniline and Nitrobenzene onto Granular Activated Carbon. Phys. Chem. Liq. 2018, 58, 150–163. [Google Scholar] [CrossRef]
- Dasgupta, A.; Matos, J.; Muramatsu, H.; Ono, Y.; Gonzalez, V.; Liu, H.; Rotella, C.; Fujisawa, K.; Cruz-Silva, R.; Hashimoto, Y.; et al. Nanostructured Carbon Materials for Enhanced Nitrobenzene Adsorption: Physical vs. Chemical Surface Properties. Carbon 2018, 139, 833–844. [Google Scholar] [CrossRef]
- Guidelines for Carcinogen Risk Assessment. Available online: https://www.epa.gov/risk/guidelines-carcinogen-risk-assessment (accessed on 29 May 2025).
- Blackburn, D.M.; Gray, A.J.; Lloyd, S.C.; Sheard, C.M.; Foster, P.M.D. A Comparison of the Effects of the Three Isomers of Dinitrobenzene on the Testis in the Rat. Toxicol. Appl. Pharmacol. 1988, 92, 54–64. [Google Scholar] [CrossRef]
- Possible, T.H.E.; Of, R.; Stress, O.; Ignacio, A. Early metabolic changes during neurotoxicity and the possible role M-dinitrobenzene of oxidative stress. Radic. Biol. Med. 1995, 18, 311–319. [Google Scholar]
- Wu, H.; Yu, Q.; Li, H.; Chen, Z.; Zhu, W.; Li, S.; Dai, Z.; Xi, Q.; Wei, J.; Li, T. Enhanced Electrocatalytic Performance and Exceptional Durability Facilitate the Effective Degradation of M-Dinitrobenzene Wastewaters Utilizing a Novel SS/PbO2-Y2O3-SiC Electrode. J. Environ. Chem. Eng. 2024, 12, 114743. [Google Scholar] [CrossRef]
- Dai, Y.; Zhang, D.; Zhang, K. Nitrobenzene-Adsorption Capacity of NaOH-Modified Spent Coffee Ground from Aqueous Solution. J. Taiwan Inst. Chem. Eng. 2016, 68, 232–238. [Google Scholar] [CrossRef]
- Nematollahzadeh, A.; Babapoor, A.; Mojtaba, S.; Nuri, A. Nitrobenzene Adsorption from Aqueous Solution onto Polythiophene-Modified Magnetite Nanoparticles. Mater. Chem. Phys. 2021, 262, 124266. [Google Scholar] [CrossRef]
- Ouachtak, H.; El Guerdaoui, A.; Haounati, R.; Akhouairi, S.; El Haouti, R.; Hafid, N.; Ait Addi, A.; Šljukić, B.; Santos, D.M.F.; Taha, M.L. Highly Efficient and Fast Batch Adsorption of Orange G Dye from Polluted Water Using Superb Organo-Montmorillonite: Experimental Study and Molecular Dynamics Investigation. J. Mol. Liq. 2021, 335, 116560. [Google Scholar] [CrossRef]
- Vasić, M.; Šljukić, B.; Wildgoose, G.G.; Compton, R.G. Adsorption of Bismuth Ions on Graphite Chemically Modified with Gallic Acid. Phys. Chem. Chem. Phys. 2012, 14, 10027–10031. [Google Scholar] [CrossRef] [PubMed]
- Stojanović, J.; Milojević-Rakić, M.; Bajuk-Bogdanović, D.; Ranđelović, D.; Sokić, M.; Otašević, B.; Malenović, A.; Ležaić, A.J.; Protić, A. Chemometrically-Aided General Approach to Novel Adsorbents Studies: Case Study on the Adsorption of Pharmaceuticals by the Carbonized Ailanthus Altissima Leaves. Heliyon 2024, 10, e34841. [Google Scholar] [CrossRef] [PubMed]
- Liang, L.; Chen, J.; Xiao, J.; Qiu, H. Preparation of GO / COFs Composites by Interlayer-Confined Strategy for the Adsorption of Nitro Aromatic Pollutants. J. Chromatogr. A 2024, 1730, 465066. [Google Scholar] [CrossRef]
- Shukla, S.K.; Al Mushaiqri, N.R.S.; Al Subhi, H.M.; Yoo, K.; Al Sadeq, H. Low-Cost Activated Carbon Production from Organic Waste and Its Utilization for Wastewater Treatment. Appl. Water Sci. 2020, 10, 62. [Google Scholar] [CrossRef]
- Basha, N.A.; Rathinavel, T.; Sridharan, H. Activated Carbon from Coconut Shell: Synthesis and Its Commercial Applications-A Recent Review. Appl. Sci. Eng. Prog. 2022, 16, 6152. [Google Scholar] [CrossRef]
- Wu, Q.; Liang, D.; Ma, X.; Lu, S.; Xiang, Y. Chitosan-Based Activated Carbon as Economic and Efficient Sustainable Material for Capacitive Deionization of Low Salinity Water. RSC Adv. 2019, 9, 26676–26684. [Google Scholar] [CrossRef]
- Anuwa-Amarh, N.A.; Dizbay-Onat, M.; Venkiteshwaran, K.; Wu, S. Carbon-Based Adsorbents for Microplastic Removal from Wastewater. Materials 2024, 17, 5428. [Google Scholar] [CrossRef]
- Okwundu, O.S.; Aniekwe, E.U.; Nwanno, C.E. Unlimited Potentials of Carbon: Different Structures and Uses (a Review). Met. Mater. Eng. 2018, 24, 145–171. [Google Scholar] [CrossRef]
- Đorđević, A.M.; Milikić, J.; Knežević, S.; Jovanović, A.; Relić, D.; Stanković, D.; Šljukić, B. Synthesis, Characterization and Application of Bimetallic XAg/rGO (X = Co, Cu) Nanocomposites for Electrochemical Detection of Nitrobenzene. Microchem. J. 2025, 213, 113826. [Google Scholar] [CrossRef]
- Chakrabarti, A.; Lu, J.; Skrabutenas, J.C.; Xu, T.; Xiao, Z.; Maguire, J.A.; Hosmane, N.S. Conversion of Carbon Dioxide to Few-Layer Graphene. J. Mater. Chem. 2011, 21, 9491. [Google Scholar] [CrossRef]
- Rao Penki, T.; Kishore, N. Munichandraiah, B.; Shanmughasundaram, D. High Rate Capability of Coconut Kernel Derived Carbon as an Anode Material for Lithium-Ion Batteries. Adv. Mater. Lett. 2014, 5, 184–190. [Google Scholar] [CrossRef]
- Liu, X.-Y.; Huang, M.; Ma, H.-L.; Zhang, Z.-Q.; Gao, J.-M.; Zhu, Y.-L.; Han, X.-J.; Guo, X.-Y. Preparation of a Carbon-Based Solid Acid Catalyst by Sulfonating Activated Carbon in a Chemical Reduction Process. Molecules 2010, 15, 7188–7196. [Google Scholar] [CrossRef]
- Kalagatur, N.K.; Karthick, K.; Allen, J.A.; Nirmal Ghosh, O.S.; Chandranayaka, S.; Gupta, V.K.; Krishna, K.; Mudili, V. Application of Activated Carbon Derived from Seed Shells of Jatropha Curcas for Decontamination of Zearalenone Mycotoxin. Front. Pharmacol. 2017, 8, 760. [Google Scholar] [CrossRef]
- Rao, X.; Lou, Y.; Chen, J.; Lu, H.; Cheng, B.; Wang, W.; Fang, H.; Li, H.; Zhong, S. Polyacrylonitrile Hard Carbon as Anode of High Rate Capability for Lithium Ion Batteries. Front. Energy Res. 2020, 8, 3. [Google Scholar] [CrossRef]
- Vali, I.P.; Anusha, B.S.; Pruthvija, M.; Savitha, S.; Ravindra, S.; Nagaveni, M.; Poojitha, P.S.; Swathi, N. Bamboo and Coconut Shell Based Activated Carbon: A Raman Spectroscopic Study. Mater. Chem. Phys. 2024, 318, 129240. [Google Scholar] [CrossRef]
- Anisuzzaman, S.M.; Joseph, C.G.; Taufiq-Yap, Y.H.; Krishnaiah, D.; Tay, V.V. Modification of Commercial Activated Carbon for the Removal of 2,4-Dichlorophenol from Simulated Wastewater. J. King Saud Univ. Sci. 2015, 27, 318–330. [Google Scholar] [CrossRef]
- Deniz, F.; Dogan, F. Effective Cleaning of a Hazardous Synthetic Triarylmethane-Type Dye from Aquatic Environment with a Multifunctional Waste Biomass–Based Biosorbent. Biomass Conv. Bioref. 2022, 13, 10885. [Google Scholar] [CrossRef]
- McCullagh, A.M.; Gibson, E.K.; Parker, S.F.; Refson, K.; Lennon, D. The Adsorption of Nitrobenzene over an Alumina-Supported Palladium Catalyst: An Infrared Spectroscopic Study. Phys. Chem. Chem. Phys. 2023, 25, 25993–26005. [Google Scholar] [CrossRef]
- Zhao, H.-Q.; Liu, Q.; Wang, Y.-X.; Han, Z.-Y.; Chen, Z.-G.; Mu, Y. Biochar Enhanced Biological Nitrobenzene Reduction with a Mixed Culture in Anaerobic Systems: Short-Term and Long-Term Assessments. Chem. Eng. J. 2018, 351, 912–921. [Google Scholar] [CrossRef]
- Kyriakopoulos, G.L.; Tsimnadis, K.; Sebos, I.; Charabi, Y. Investigating the Effect of Pore Size Distribution on the Sorption Types and the Adsorption-Deformation Characteristics of Porous Continua: The Case of Adsorption on Carbonaceous Materials. Crystals 2024, 14, 742. [Google Scholar] [CrossRef]
- Milanković, V.; Tasić, T.; Brković, S.; Potkonjak, N.; Unterweger, C.; Bajuk-Bogdanović, D.; Pašti, I.; Lazarević-Pašti, T. Spent Coffee Grounds-Derived Carbon Material as an Effective Adsorbent for Removing Multiple Contaminants from Wastewater: A Comprehensive Kinetic, Isotherm, and Thermodynamic Study. J. Water Process Eng. 2024, 63, 105507. [Google Scholar] [CrossRef]
- Milanković, V.; Tasić, T.; Brković, S.; Potkonjak, N.; Unterweger, C.; Pašti, I.; Lazarević-Pašti, T. The Adsorption of Chlorpyrifos and Malathion under Environmentally Relevant Conditions Using Biowaste Carbon Materials. J. Hazard. Mater. 2024, 480, 135940. [Google Scholar] [CrossRef]
- Puccia, V.; Avena, M.J. On the Use of the Dubinin-Radushkevich Equation to Distinguish between Physical and Chemical Adsorption at the Solid-Water Interface. Colloid Interface Sci. Commun. 2021, 41, 100376. [Google Scholar] [CrossRef]
- Li, D.; Wu, Y.; Feng, L.; Zhang, L. Surface Properties of SAC and Its Adsorption Mechanisms for Phenol and Nitrobenzene. Bioresour. Technol. 2012, 113, 121–126. [Google Scholar] [CrossRef]
- Peng, S.; Shen, M.; Li, X.; Tong, Y.-J.; Guo, J.; Lin, W.; Ye, Y.-X.; Xu, J.; Zhou, N.; Zhu, F.; et al. Rational Design of Ordered Porous Nanoparticles for Selective Extraction of Nitrobenzene Compounds. J. Hazard. Mater. 2023, 441, 129971. [Google Scholar] [CrossRef]
- Song, X.; Wang, L.; Ma, X.; Zeng, Y. Adsorption Equilibrium and Thermodynamics of CO2 and CH4 on Carbon Molecular Sieves. Appl. Surf. Sci. 2017, 396, 870–878. [Google Scholar] [CrossRef]
- Kecira, Z.; Benturki, O.; Benturki, A.; Daoud, M.; Girods, P. High Adsorption Capacity of Nitrobenzene from Aqueous Solution Using Activated Carbons Prepared from Vegetable Waste. Environ. Prog. Sustain. Energy 2020, 39, e13463. [Google Scholar] [CrossRef]
- Bombuwala Dewage, N.; Liyanage, A.S.; Smith, Q.; Pittman, C.U.; Perez, F.; Hassan, E.B.; Mohan, D.; Mlsna, T. Fast Aniline and Nitrobenzene Remediation from Water on Magnetized and Nonmagnetized Douglas Fir Biochar. Chemosphere 2019, 225, 943–953. [Google Scholar] [CrossRef]
- Villacañas, F.; Pereira, M.F.R.; Órfão, J.J.M.; Figueiredo, J.L. Adsorption of Simple Aromatic Compounds on Activated Carbons. J. Colloid Interface Sci. 2006, 293, 128–136. [Google Scholar] [CrossRef] [PubMed]
- Chen, X.; Chen, B. Macroscopic and Spectroscopic Investigations of the Adsorption of Nitroaromatic Compounds on Graphene Oxide, Reduced Graphene Oxide, and Graphene Nanosheets. Environ. Sci. Technol. 2015, 49, 6181–6189. [Google Scholar] [CrossRef] [PubMed]
- Chen, B.; Zhou, D.; Zhu, L. Transitional Adsorption and Partition of Nonpolar and Polar Aromatic Contaminants by Biochars of Pine Needles with Different Pyrolytic Temperatures. Environ. Sci. Technol. 2008, 42, 5137–5143. [Google Scholar] [CrossRef] [PubMed]
Scheme 1.
The framework of the performed study on nitrobenzene adsorption on CSDAC.
Scheme 1.
The framework of the performed study on nitrobenzene adsorption on CSDAC.
Figure 1.
(A) Raman spectrum and (B) XRD pattern of the CSDAC.
Figure 1.
(A) Raman spectrum and (B) XRD pattern of the CSDAC.
Figure 2.
(A–C) SEM images of coconut shell-derived activated carbon taken at different magnifications with (D) the EDS spectrum taken at spot marked with + in (C) (peaks correspond to carbon (C), potassium (K) and oxygen (O)).
Figure 2.
(A–C) SEM images of coconut shell-derived activated carbon taken at different magnifications with (D) the EDS spectrum taken at spot marked with + in (C) (peaks correspond to carbon (C), potassium (K) and oxygen (O)).
Figure 3.
Cyclic voltammograms recorded using CoAg/rGO electrode in 200 µM nitrobenzene solution of pH before and upon mixing with different amounts of CSDAC sorbent.
Figure 3.
Cyclic voltammograms recorded using CoAg/rGO electrode in 200 µM nitrobenzene solution of pH before and upon mixing with different amounts of CSDAC sorbent.
Figure 4.
FTIR spectra of (A) NB and the adsorbents after NB adsorption on different amounts of CSDAC, and (B) the adsorbent after NB adsorption from aqueous samples of different initial pH values using a constant concentration and volume of NB.
Figure 4.
FTIR spectra of (A) NB and the adsorbents after NB adsorption on different amounts of CSDAC, and (B) the adsorbent after NB adsorption from aqueous samples of different initial pH values using a constant concentration and volume of NB.
Figure 5.
(A–C) SEM images of coconut shell-derived activated carbon after the adsorption of nitrobenzene taken at different magnifications with (D) the corresponding EDS spectrum (peaks correspond to nitrogen (N), oxygen (O), sodium (Na) and phosphorous (P)).
Figure 5.
(A–C) SEM images of coconut shell-derived activated carbon after the adsorption of nitrobenzene taken at different magnifications with (D) the corresponding EDS spectrum (peaks correspond to nitrogen (N), oxygen (O), sodium (Na) and phosphorous (P)).
Figure 6.
UV-Vis spectra of (a) NB and (b) DNB after incubation with CSDAC for the designated time. Graphical representation of (c) PFO, PSO, and Elovich kinetic models, and (d) IPD kinetic model fitting the experimental data.
Figure 6.
UV-Vis spectra of (a) NB and (b) DNB after incubation with CSDAC for the designated time. Graphical representation of (c) PFO, PSO, and Elovich kinetic models, and (d) IPD kinetic model fitting the experimental data.
Figure 7.
Graphical representation of isotherm models fitting experimental data for NB adsorption (a,c,e,g) and DNB adsorption (b,d,f,h). (a,b) The Freundlich model shows favorable multilayer adsorption on heterogeneous surfaces for both NB and DNB. (c,d) The Langmuir model indicates monolayer adsorption, with a higher qmax for DNB. (e,f) The Temkin model reflects moderate adsorbate–adsorbent interactions, more pronounced for DNB. (g,h) The Dubinin–Radushkevich model suggests physisorption as the dominant mechanism in both cases.
Figure 8.
Van’t Hoff plot for NB and DNB adsorption onto CSDAC at 25, 30, and 35 °C.
Figure 8.
Van’t Hoff plot for NB and DNB adsorption onto CSDAC at 25, 30, and 35 °C.
Figure 9.
Histograms representing the concentration of NB and DNB before and after the adsorption (a) under dynamic conditions, and (b) from the mixture.
Figure 9.
Histograms representing the concentration of NB and DNB before and after the adsorption (a) under dynamic conditions, and (b) from the mixture.
Table 1.
Kinetic parameters of NB and DNB adsorption (50 µM) onto CSDAC (1 mg mL−1).
Table 1.
Kinetic parameters of NB and DNB adsorption (50 µM) onto CSDAC (1 mg mL−1).
| Contaminant | NB | DNB |
|---|
| Pseudo-first order model |
| qe [mg g−1] | 2.67 | 6.06 |
| k1 [min−1] | 1.77 | 1.48 |
| χ2 | 0.038 | 0.105 |
| R2 | 0.963 | 0.980 |
| Pseudo-second order model |
| qe [mg g−1] | 2.74 | 6.21 |
| k2 [mg min−1 g−1] | 1.31 | 0.452 |
| χ2 | 0.023 | 0.037 |
| R2 | 0.978 | 0.993 |
| Elovich kinetic model |
| α × 10−5 [mg g−1 min−1] | 3.32 | 2.94 |
| β [g mg−1] | 6.68 | 2.81 |
| χ2 | 0.004 | 0.031 |
| R2 | 0.996 | 0.994 |
| Intraparticle diffusion model |
| I part | | |
| C1 [mg g−1] | 0.000 | 0.000 |
| kid1 [mg g−1 min−0.5] | 2.222 | 4.693 |
| R2 | -- | -- |
| II part | | |
| C2 [mg g−1] | 2.169 | 4.256 |
| kid2 [mg g−1 min−0.5] | 0.092 | 0.487 |
| R2 | 0.861 | 0.976 |
| III part | | |
| C3 [mg g−1] | 2.712 | 5.941 |
| kid3 [mg g−1 min−0.5] | 0.015 | 0.039 |
| R2 | -- | 0.879 |
Table 2.
Isotherm adsorption parameters of NB and DNB adsorption onto CSDAC (1 mg mL−1) at 25, 30, and 35 °C.
Table 2.
Isotherm adsorption parameters of NB and DNB adsorption onto CSDAC (1 mg mL−1) at 25, 30, and 35 °C.
| | NB | DNB |
|---|
| Temperature [°C] | 25 | 30 | 35 | 25 | 30 | 35 |
|---|
| Freundlich isotherm model |
KF
[(Lmg−1)1/n] | 1.140 | 1.020 | 0.919 | 4.508 | 3.611 | 2.716 |
| n | 1.53 | 1.359 | 1.229 | 1.896 | 1.759 | 1.556 |
| χ2 | 0.011 | 0.027 | 0.058 | 0.119 | 0.347 | 0.613 |
| R2 | 0.997 | 0.992 | 0.985 | 0.995 | 0.982 | 0.962 |
| Langmuir isotherm model |
KL
[Lmg−1] | 0.147 | 0.108 | 0.076 | 0.226 | 0.108 | 0.043 |
qmax
[mg g−1] | 8.10 | 9.99 | 12.88 | 20.20 | 26.12 | 42.75 |
| χ2 | 0.018 | 0.006 | 0.024 | 0.682 | 0.770 | 0.828 |
| R2 | 0.995 | 0.998 | 0.994 | 0.969 | 0.960 | 0.949 |
| Temkin isotherm model |
KT
[Lmg−1] | 4.875 | 3.276 | 2.427 | 35.174 | 44.237 | 69.252 |
bT
[J g mol−1 mg−1] | 2318 | 1960 | 1691 | 1352 | 1605 | 1982 |
| χ2 | 0.218 | 0.192 | 0.174 | 1.860 | 2.508 | 3.110 |
| R2 | 0.935 | 0.948 | 0.957 | 0.916 | 0.869 | 0.808 |
| Dubinin–Radushkevich isotherm model |
qDR
[mg g−1] | 3.875 | 5.269 | 5.483 | 9.056 | 8.319 | 7.620 |
KDR × 107
[mol2 J−2] | 3.23 | 16.0 | 16.1 | 0.415 | 0.466 | 0.527 |
E
[J mol−1] | 1244 | 560 | 557 | 3471 | 3274 | 3081 |
| χ2 | 0.385 | 0.157 | 0.109 | 3.737 | 3.790 | 3.729 |
| R2 | 0.885 | 0.957 | 0.973 | 0.832 | 0.801 | 0.770 |
Table 3.
Thermodynamic parameters for NB and DNB adsorption onto CSDAC (1 mg mL−1).
Table 3.
Thermodynamic parameters for NB and DNB adsorption onto CSDAC (1 mg mL−1).
| | ΔH0
(kJ mol−1) | ΔS0
(J mol−1 K−1) | ΔG0
(kJ mol−1) | R2 |
|---|
| T [°C] | | | 25 | 30 | 35 | |
| NB | 8.15 | 79.86 | −15.42 | −16.06 | −16.46 | 0.99997 |
| DNB | 28.23 | 154.94 | −17.50 | −18.74 | −19.52 | 0.99897 |
| Disclaimer/Publisher’s Note: The statements, opinions and data contained in all publications are solely those of the individual author(s) and contributor(s) and not of MDPI and/or the editor(s). MDPI and/or the editor(s) disclaim responsibility for any injury to people or property resulting from any ideas, methods, instructions or products referred to in the content. |
© 2025 by the authors. Licensee MDPI, Basel, Switzerland. This article is an open access article distributed under the terms and conditions of the Creative Commons Attribution (CC BY) license (https://creativecommons.org/licenses/by/4.0/).


 ,
, 


