Article

The Homology of Atmospheric Pollutants and Carbon Emissions in Industrial Parks: A Case Study in North China

1
School of Environmental Science & Engineering, Tianjin University, Tianjin 300350, China
2
Technical Centre for Soi, Agriculture and Rural Ecology and Environment, Ministry of Ecology and Environment, Beijing 100012, China
*
Author to whom correspondence should be addressed.
Processes 2025, 13(7), 2070; https://doi.org/10.3390/pr13072070
Submission received: 7 May 2025 / Revised: 10 June 2025 / Accepted: 18 June 2025 / Published: 30 June 2025
(This article belongs to the Section Environmental and Green Processes)

Abstract

Industrial parks are well-known as a critical intervention point for global carbon emission reductions due to the high carbon emissions emitted. Conducting carbon accounting research in these parks can provide more precise foundational data for carbon reduction initiatives, promoting low-carbon industrial park development. However, industrial parks, positioned as non-independent accounting units between provincial and industry levels, face severe challenges due to ambiguous boundaries, complex accounting entities, and data selection difficulties that significantly impact the carbon accounting accuracy. This study employed the IPCC emission factor method for industrial parks, taking its management structure as the accounting boundary. Additionally, we constructed a carbon accounting method and representation system by considering the carbon emission flow path and integrating the correlation between pollutant and carbon emissions. By categorizing carbon emissions into five groups, this study obtained emissions from fuel combustion (E1), industrial processes (E2), purchased/sold electricity (E3), purchased/sold heat (E4), and carbon-sequestering products (E5). Between 2016 and 2021, the industrial park’s carbon emissions fell from 15.0783 to 6.7152 million tons, while the intensity dropped from 4.86 to 1.91 tons of carbon dioxide (CO2) per CNY 10,000. The park achieved dual control targets for the total carbon emissions and intensity, with E2 being the main reduction source (70% of total). Meanwhile, total atmospheric pollutants decreased from 9466.19 to 1736.70 tons, with C25 and C26 industries contributing over 99%. In particular, C26 achieved significant reductions in nitrogen oxides (NOx) and sulfur dioxide (SO2), aiding pollution mitigation. A strong positive correlation was found between pollutants and carbon emissions, especially in C26, SO2 (0.77), and NOx (0.89), suggesting NOx as a more suitable carbon emission indicator during chemical production. These findings offer a theoretical framework for using pollutant monitoring to characterize carbon emissions and support decision-making for sustainable industrial development.

1. Introduction

The window to control global warming is rapidly closing, which has become the greatest non-traditional security issue that human society faces [1,2]. Over recent years, the increase in the world’s carbon emissions has been the primary driver of the global temperature rise. In response to the severe issue caused due to excessive carbon emissions, 195 countries worldwide adopted a landmark international agreement, known as the Paris Agreement [3], in 2015 to address climate change by pursuing relevant proposals and policies. As a result, in 2020, China incorporated the ‘3060 targets’ into its ‘14th Five-Year Plan,’ proposing tasks for greenhouse gas emission reductions within the sectors of construction, industry, and transportation [4], adopting appropriate carbon accounting methods to ensure the country’s emission reduction plans. In 2021, the European Union officially enacted the European Climate Law [5], which established a carbon pricing mechanism for the trading system, limiting the average emissions generated during the transportation process and other carbon reduction initiatives. Similarly, the United States enacted the Clean Energy Revolution and Environmental Justice Act [6], which mandated that publicly traded companies disclose their greenhouse gas emissions and established new standards for fuel emissions and other executive orders. Nevertheless, in 2022, the world’s carbon emissions reached 35.42 billion tons, which was over 8.2% more compared to levels in 2020 [7].
In recent years, two main approaches (i.e., the Input–Output method and the emission factor method) have been widely studied and applied for carbon accounting in order to measure and track the total emissions emitted by organization [8]. The Input–Output method is a macro-level carbon accounting approach that characterizes the interrelationships between economic sectors based on the input of raw materials and the output of products through the Input-Output tables used. With this method, the carbon footprint can be estimated using different levels of analysis regarding the direct and indirect CO2 emissions embodied in the manufacturing process. The advantage of this method is its comprehensive data analysis to eliminate arbitrary selections; however, its major limitation lies in the practical application at a large scale (e.g., nation, city, and regional) [9,10,11,12]. Meanwhile, the emission factor method determines the primary amount of CO2 emissions directly or indirectly emitted in several stages of social and production activities. This method is based on established carbon emission inventories. The method’s advantages include its simplicity, ease of dissemination, and standardization due to the continuous introduction of emission inventories and accounting standards at distinct levels (e.g., countries, provinces and cities, industries, and enterprises) [7,13,14,15,16,17], providing enough data for a precise calculation of carbon emissions. Therefore, this study adopted the emission factor method as a research approach in order to determine the accuracy of carbon accounting.
Currently, carbon accounting is a methodology employed by organizations, which is continuously improving to identify and quantify the extent of emissions emitted. According to the application scale level, the accounting method for carbon is well-defined based on the production and consumption ends, as well as the corresponding standards and databases, which are progressively established [7]. For example, China has released methodologies and reporting guidelines for nearly 24 companies to quantify the amount of greenhouse gas (GHG) emissions, which included 11 techniques used as national standards [18]. However, comparing the carbon accounting at the national, provincial, and city levels, industrial parks are distinguished for their high carbon emissions (31% of the country’s total emissions) [19] and significant potential for emission reductions. Hence, the respective emission counting analysis in this sector can provide foundational data for carbon emission reductions and, thereby, contribute to the global effort.
A carbon emission inventory for industrial parks was constructed by Zhang et al. [20] with energy as the core, and, in accordance with the IPCC Guidelines, a greenhouse gas accounting system covering three major categories—energy-related emissions, industrial process emissions, and indirect emissions—was established. A total greenhouse gas accounting framework applicable to industrial parks was thereby proposed.
On this basis, Liu et al. [21] and Wang et al. [22] further refined the accounting objects by expanding the scope of emissions to include non-industrial sectors related to park operations, such as transportation, residential areas, commercial zones, and waste treatment. This enabled the shift from solely industrial emissions to the full functional coverage across the park, better reflecting the composite functional characteristics of modern industrial parks.
In terms of accounting practices across departmental and temporal dimensions, Tan et al. [23] and Qi Jing et al. [24], based on the emission factor method, further differentiated the carbon emissions generated by different industrial sectors within the park (e.g., chemical, building materials, and equipment manufacturing) at various life cycle stages (such as the construction and operation phases). They proposed a temporally sensitive, dynamic stage-based carbon accounting approach, significantly enhancing the applicability and decision-support value of carbon accounting in project evaluation and full-process management.
Regarding spatial attribution and responsibility identification, based on a spatial boundary attribution logic, [25] categorized park-based carbon emissions into ‘on-site emissions’ and ‘off-site emissions.’ Using the centralized wastewater treatment plant within the park as a representative case, they developed a corresponding greenhouse gas accounting model, effectively strengthening the consistency and traceability between accounting objects and emission responsibilities.
In terms of comprehensive emission factors and coordinated pollutant accounting, Zhao et al. [26] built upon the carbon emission inventory developed by previous studies and further expanded the accounting scope by incorporating greenhouse gases (CO2, CH4, and N2O) along with typical air pollutants (NOx, SO2, VOCs, and PM2.5) into a unified framework, thereby achieving the coordinated accounting of carbon emissions and environmental pollutant loads. Li et al. [27], within the context of a cleaner production audit framework, integrated multi-dimensional accounting objects including carbon emissions, resource consumption, and pollutant discharges, and established a comprehensive evaluation system consisting of 35 indicators, providing methodological support for conducting quantitative, multi-dimensional assessments of clean development in industrial parks.
Although significant progress has been made in the dimensional expansion of carbon accounting objects, the current research remains relatively weak in Scope 3 accounting, which encompasses upstream raw material production and downstream consumption-related indirect emissions. Meanwhile, the standardization of existing accounting methodologies remains insufficient, resulting in the poor horizontal comparability of accounting results across different industrial parks. Therefore, it is imperative to establish a unified carbon accounting standard and statistical system at the level of industrial parks, thereby promoting the institutionalization, standardization, and refinement of carbon accounting practices and providing a scientific foundation for the low-carbon transition.
Furthermore, with the continuous increase in activities within industrial parks, excessive carbon emissions and substantial pollutants are generated, degrading the air quality and the local economy in surrounding park areas [28]. To address the above issue, many scholars have developed pollutant emission inventories to quantify regional pollutants and identify their sources. For instance, an air pollutant emission inventory for industrial parks has been established by Gao et al. [29], with the characteristics of air pollutant emissions and potential removal rates analyzed in this study area. Hua et al. [30] analyzed the cement plant as a study area to develop an inventory of harmful pollutant emissions within the plant area, exploring the pollutants’ characteristics and scenario forecasting based on the temporal and spatial perspectives. Notably, pollutants and GHGs exhibit similar spatial agglomeration and symbiotic relationships, indicating strong attributes of spatial lock-in and path dependency [31]. Conducting emission reduction analyses solely on pollutant constraints, green and low-carbon industrial parks are developed, and many scholars have begun to focus on the synergistic reduction for both emission types. A synergistic model has been employed by Yi et al. to analyze the correlation coefficients of pollution reductions and carbon emission reductions for 30 provinces in China [32]. The pollution–carbon reduction in the power industry had been analyzed by Jiang et al. to enhance its cost-effectiveness [33]. Altogether, these studies are mainly conducted at different scale levels, with the focus on industrial parks remaining scarce, which highly limits the scientific approach to the pollution–carbon reduction in industrial parks.
In this study, we conduct carbon accounting research on industrial parks based on the 2006 IPCC guidelines, which consider the characteristics of industrial activities and propose boundaries for a precise emission accounting method. The study area is selected within provincial-level industrial clusters in the Jing-Jin-Ji region, Hebei, China. The accounting scope covers five primary sources of carbon emissions in the park during 2016–2021: fuel combustion, industrial production processes, the generation of purchased and sold electricity, the generation of purchased and sold heat, and carbon-sequestering products. This study focuses on the analysis of the changes in carbon emissions of industrial parks over six years and the characteristics of their distribution. Based on the pollutant emission data provided by the parks, the distribution characteristics of pollutant emissions are analyzed, and, furthermore, the correlation between pollutant emissions and carbon emissions is explored. This provides a preliminary foundation for developing a method to estimate carbon emissions in industrial parks using pollutant monitoring data. By monitoring carbon emission data, production processes can be optimized to reduce carbon emissions while achieving the coordinated control of pollution, thereby overcoming the limitations of traditional single-objective governance models; promoting multi-objective coordinated optimization; and ultimately achieving a low-carbon, clean, and sustainable development path that integrates environmental benefits with climate goals.

2. Methodology

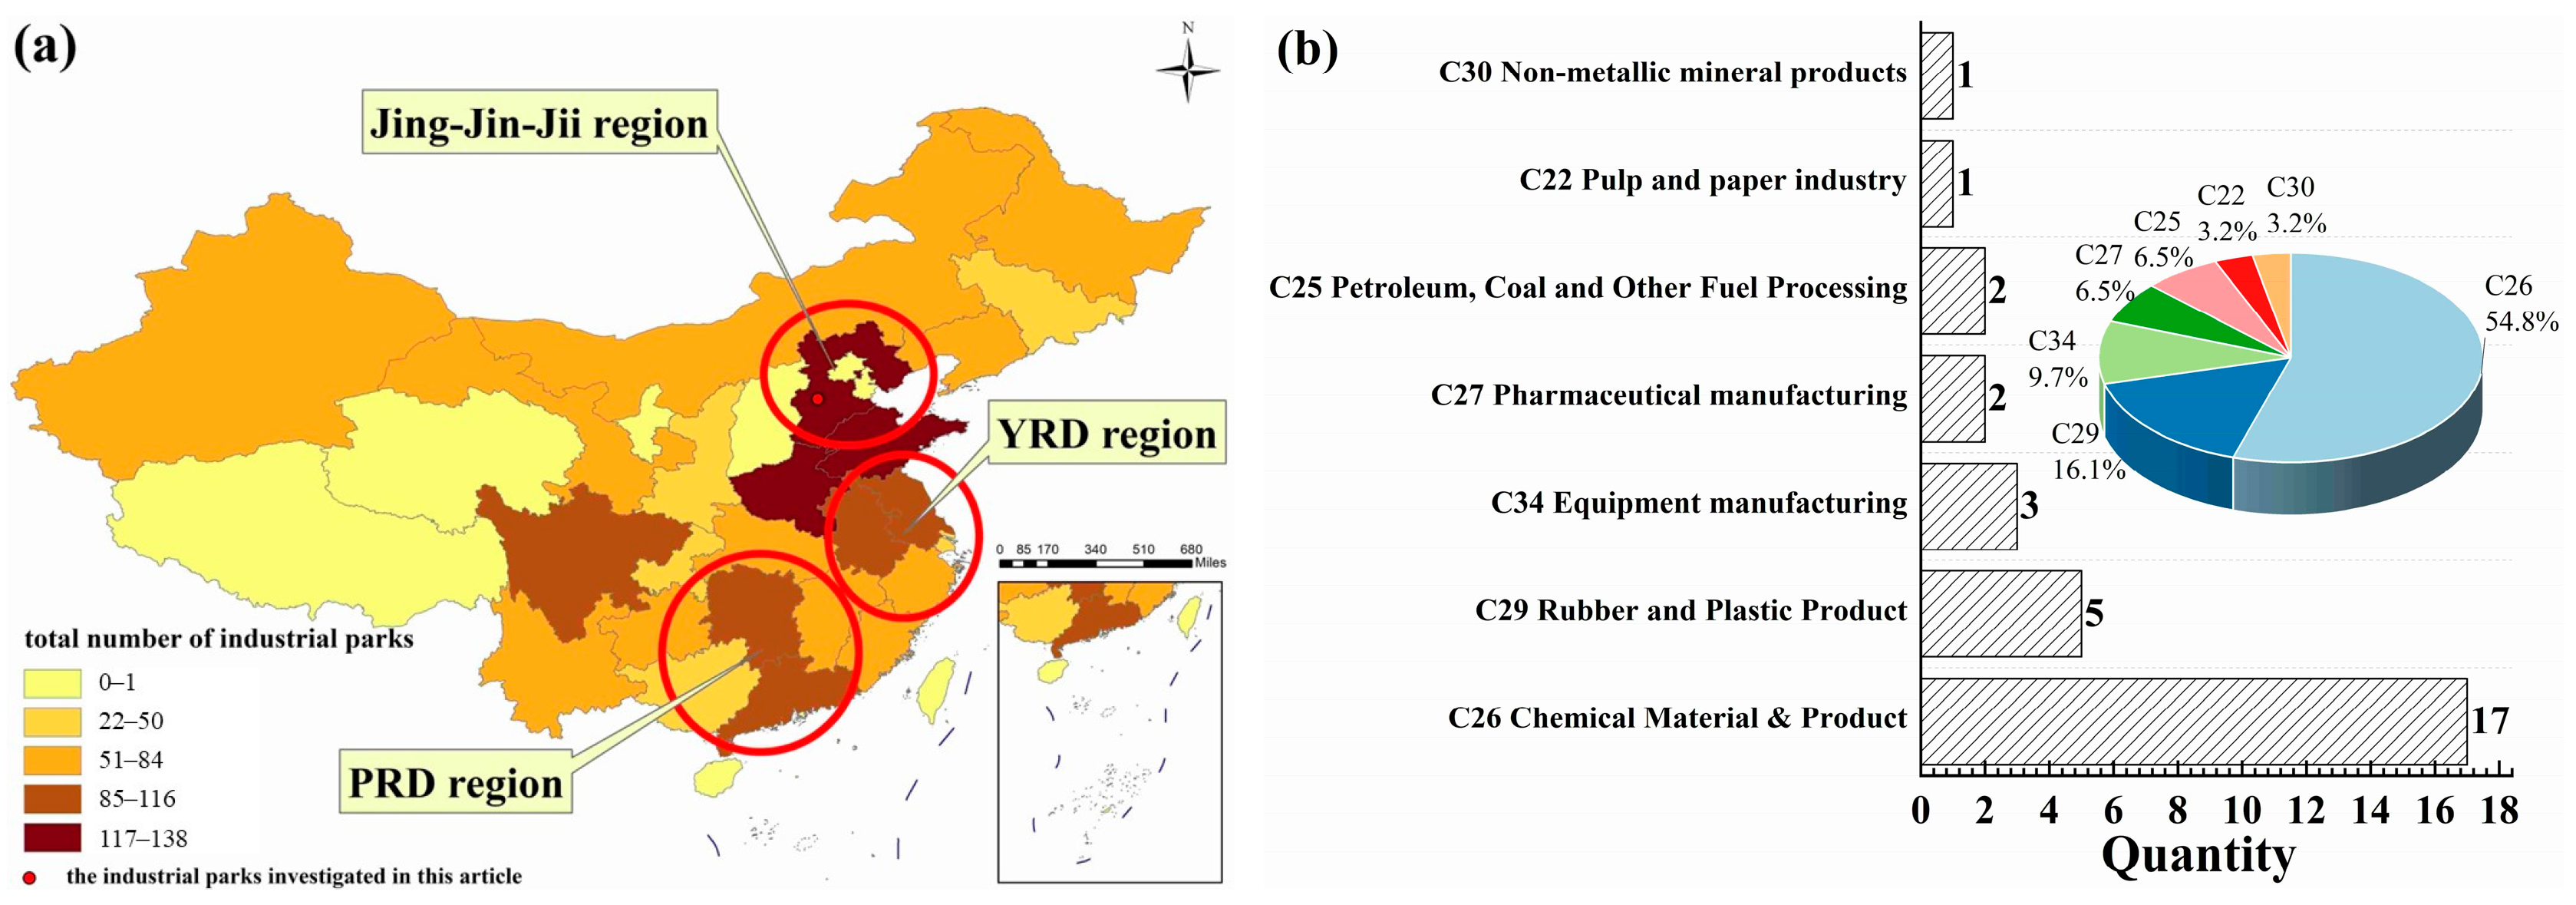
2.1. An Overview of the Study Area

In China, industrial parks are mainly distributed in regions of Jing-Jin-Ji, the Pearl River Delta, and the Yangtze River Delta (Figure 1a). The Jing-Jin-Ji region has 175 provincial-level industrial parks, which constitute 9% of the total industrial parks in China. Notably, Hebei province solely contains a total of 138 industrial zones. Moreover, characterizing the study area by energy structure (i.e., coal and fossil fuels), the Jing-Jin-Ji region has become the area with the highest carbon emissions in China. Based on that, we conducted the carbon emission accounting for high-energy-consuming industrial parks within this region, which holds practical significance for further analysis. This study selected a provincial industrial park in the southwest of the Jing-Jin-Ji region that has an extension of 21.83 million square meters and hosts 31 enterprises. Figure 1b shows the distribution and industrial classification of these enterprises analyzed in this study. According to the national economic classification, the companies are categorized into seven sectors: Chemical Material and Products, Rubber and Plastic Products, Pharmaceutical Manufacturing, Equipment Manufacturing, petroleum refining, coking and nuclear fuel, pulp and paper industry, and non-metallic mineral products. Among these, the sector of Chemical Material and Products holds the top position (55%), followed by Rubber and Plastic Products (16%), and Equipment Manufacturing (10%).

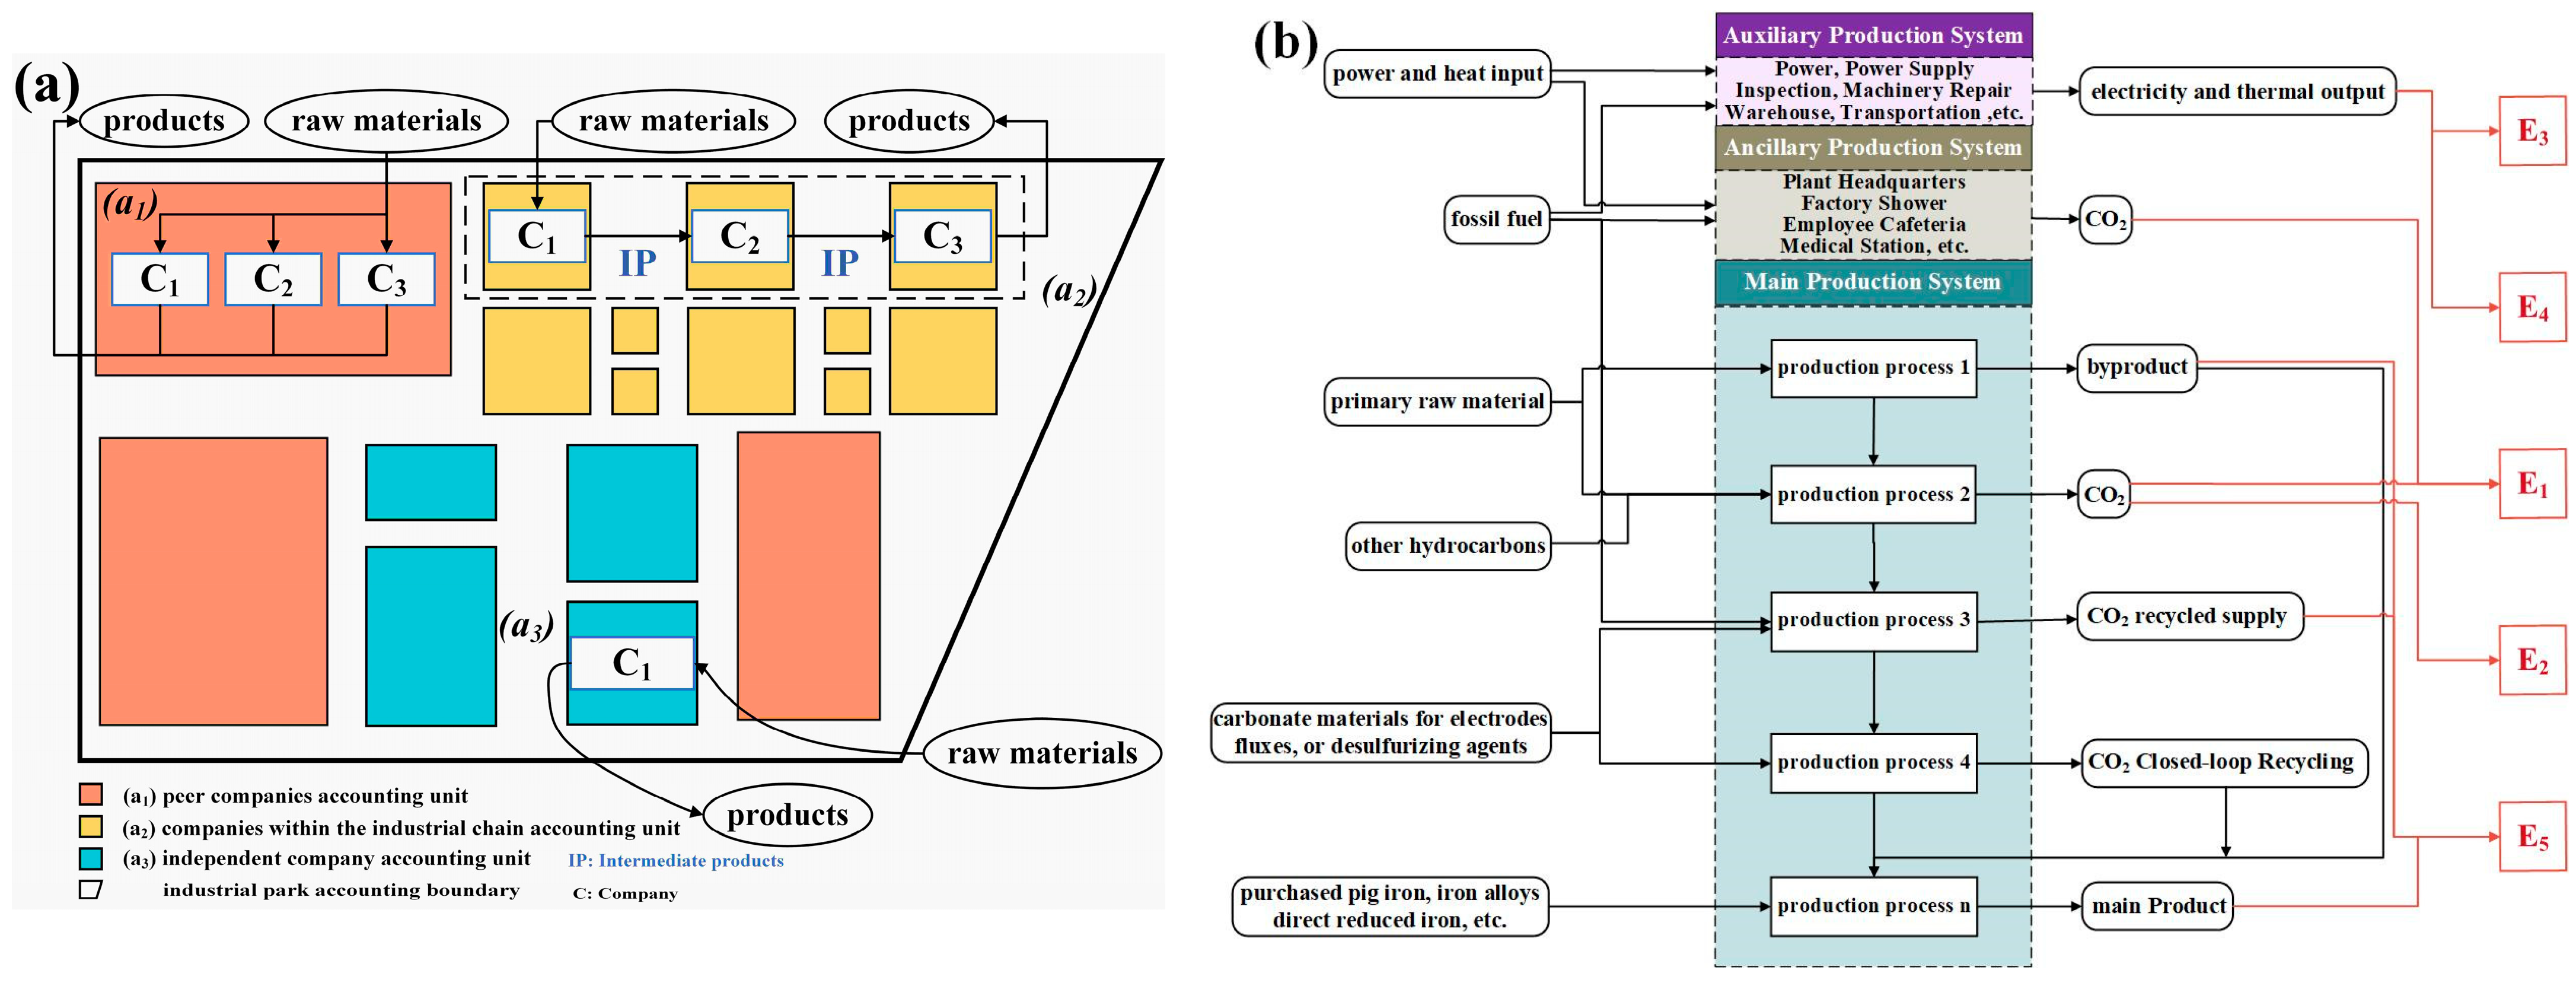
2.2. The Determination of the Accounting Boundaries and Scope

Figure 2a offers the distribution accounting units and characteristics of industrial clustering in the park regarding the organizational management structure. 2019–2022 This study regards the production enterprises and management departments within the industrial park as internal entities, while the geographical scope of the park is considered external. The external accounting boundaries are currently divided into two types: administrative boundaries and actual geographical boundaries. The administrative boundary refers to the management boundary of the area to which the park belongs, whereas the actual geographical boundary refers to the park’s defined geographical limits. The carbon accounting conducted in this study is not only to ascertain the level of carbon emissions within the industrial park but also serves as the foundation for subsequent research on real-time estimation of carbon emissions using atmospheric pollutant monitoring data from the park, ensuring consistency with the statistical caliber of pollutant emissions. On the other hand, within the study area, a management committee is established to facilitate operational management and the delineation of responsibilities; hence, this study opts for the administrative boundary as the external accounting boundary, rather than the actual geographical boundary. Furthermore, to prevent duplication and omissions in calculations and to enhance the credibility of the results, this paper has pre-emptively categorized the enterprises within the park, taking into account the differences in the industrial chain structure and clarifying the material and energy flow relationships between upstream and downstream enterprises, thereby delineating the carbon source flow relationships carried by them. This study established three accounting unit types (i.e., independent enterprises, enterprises in the same industry, and enterprises along the industrial chain) based on the upstream/downstream industrial chain analysis and the symbiotic relationships among enterprises. Additionally, using the data provided by the park, we constructed a carbon flow map to support the carbon emission accounting in the subsequent sections (Figure 2b). The detailed comparative analysis and improvement of carbon emission accounting methods are presented in the Supplementary Materials.
As shown in Figure 2b, this study determined the greenhouse gas emissions of each accounting unit within the park, identifying the carbon source flow for each accounting unit. Based on that, we delineated five types of sources of carbon emissions (i.e., fuel combustion (E1), industrial production processes (E2), purchased and sold electricity (E3), purchased and sold heat (E4), and carbon-sequestering products (E5)) according to the nodes and forms of greenhouse gas generation. It is worth mentioning that all five emission types are calculated based on the carbon dioxide equivalent, regarding the given CO2 accounts for over 90% of the total greenhouse gas emissions emitted from China [8].

2.3. Methods for Carbon Emission Calculation

This study is based on the emission factor method reported by the IPCC [34] to estimate the CO2 emissions for each type of emission. To streamline the calculation process, the emission factors utilized in the traditional carbon emission factor approach are those recommended by national standards, which are applicable at a macro-level. However, within the micro-scale context of industrial parks, the variations in industrial composition and technological capabilities across different parks can lead to results that do not accurately reflect the actual carbon emission characteristics. Therefore, this study has expanded the range of emission factor assessments, incorporating both empirical and calculated values, to more directly and accurately reflect the park’s carbon emission levels. This improves the precision of the park’s carbon accounting results and enables more targeted guidance for the park’s low-carbon initiatives. The carbon accounting can be calculated as follows:
E = i = 1 n E 1 , i + E 2 , i + E 3 , i + E 4 , i E 5 , i  
where   E represents the total amount of CO2 accounted, E 1 , i indicates the emissions emitted from fuel combustion within accounting unit i, E 2 , i represents the emissions from the industrial production processes within accounting unit i, E 3 , i is the emissions attributable to electricity consumption within accounting unit i, E 4 , i represents the emissions resulting from heat consumption within accounting unit i, and E 5 , i indicates the CO2 equivalent embedded in carbon-storing products within accounting unit i, with all quantities measured in metric tons of CO2 equivalent (tCO2e). Table 1 shows the calculation method for each type of emissions.
Regarding carbon sequestration products, the traditional carbon emission factor method only accounts for energy consumption (including fuel combustion and electricity and heat consumption) and carbon emissions related to industrial production, neglecting the implicit carbon emissions from carbon sequestration products, which leads to inaccurate carbon emission accounting. On this basis, this study has added a type of carbon emission, namely emissions from carbon sequestration products. On one hand, it can more comprehensively assess the actual carbon emission levels of the park, avoiding computational errors; on the other hand, it helps the park to formulate targeted carbon reduction strategies, optimize the energy and industrial structure, and promote its low-carbon development. (For a detailed comparison and improvement of carbon emission accounting methods, please refer to the Supplementary Materials).

2.4. Calculation of Carbon Emission Intensity

Carbon emission intensity explores the amount of carbon emissions per unit of industrial output within an industrial park [40]. This indicator can be related to the relationship between the economic results and the amount of CO2 emissions. The carbon emission intensity is estimated using Equation (2).
C I = E P  
where CI represents carbon emission intensity (tCO2e/10,000 ¥), E is the total amount of CO2 emissions (tCO2e), and P indicates the total industrial output in the park (10,000 ¥).

2.5. Air Pollutant Equivalent Accounting and Data Sources

This study selected four types of air pollutants (i.e., sulfur dioxide (SO2), nitrogen oxides (NOx), volatile organic compounds (VOCS), and inhalable particulate matter (PM)), collecting data from relevant departments in the industrial park by detection measurement. Thus, the comprehensive assessment of environmental pollution is carried out by different air pollutants using a unified standard. Based on the above, this study guarantees consistent, reliable, and accurate data and introduces the concept of air pollution from equivalent coefficients [41]. The air pollution concentration is estimated with the following equation:
E L A P = α E S O 2 + β E N O X + γ E V O C S + δ E P M
where E L A P represents the equivalent of air pollutants ,   E S O 2 is the emission amount of SO2, E N O X represents the emission quantity of NOx, E V O C S indicates the emission amount of VOCS , and   E P M is the emission amount of PM. The measuring units for all these variables are in tons (t).   α , β , γ , and δ are the equivalent coefficients corresponding to the respective air pollutants (Table 2).

3. Results and Discussion

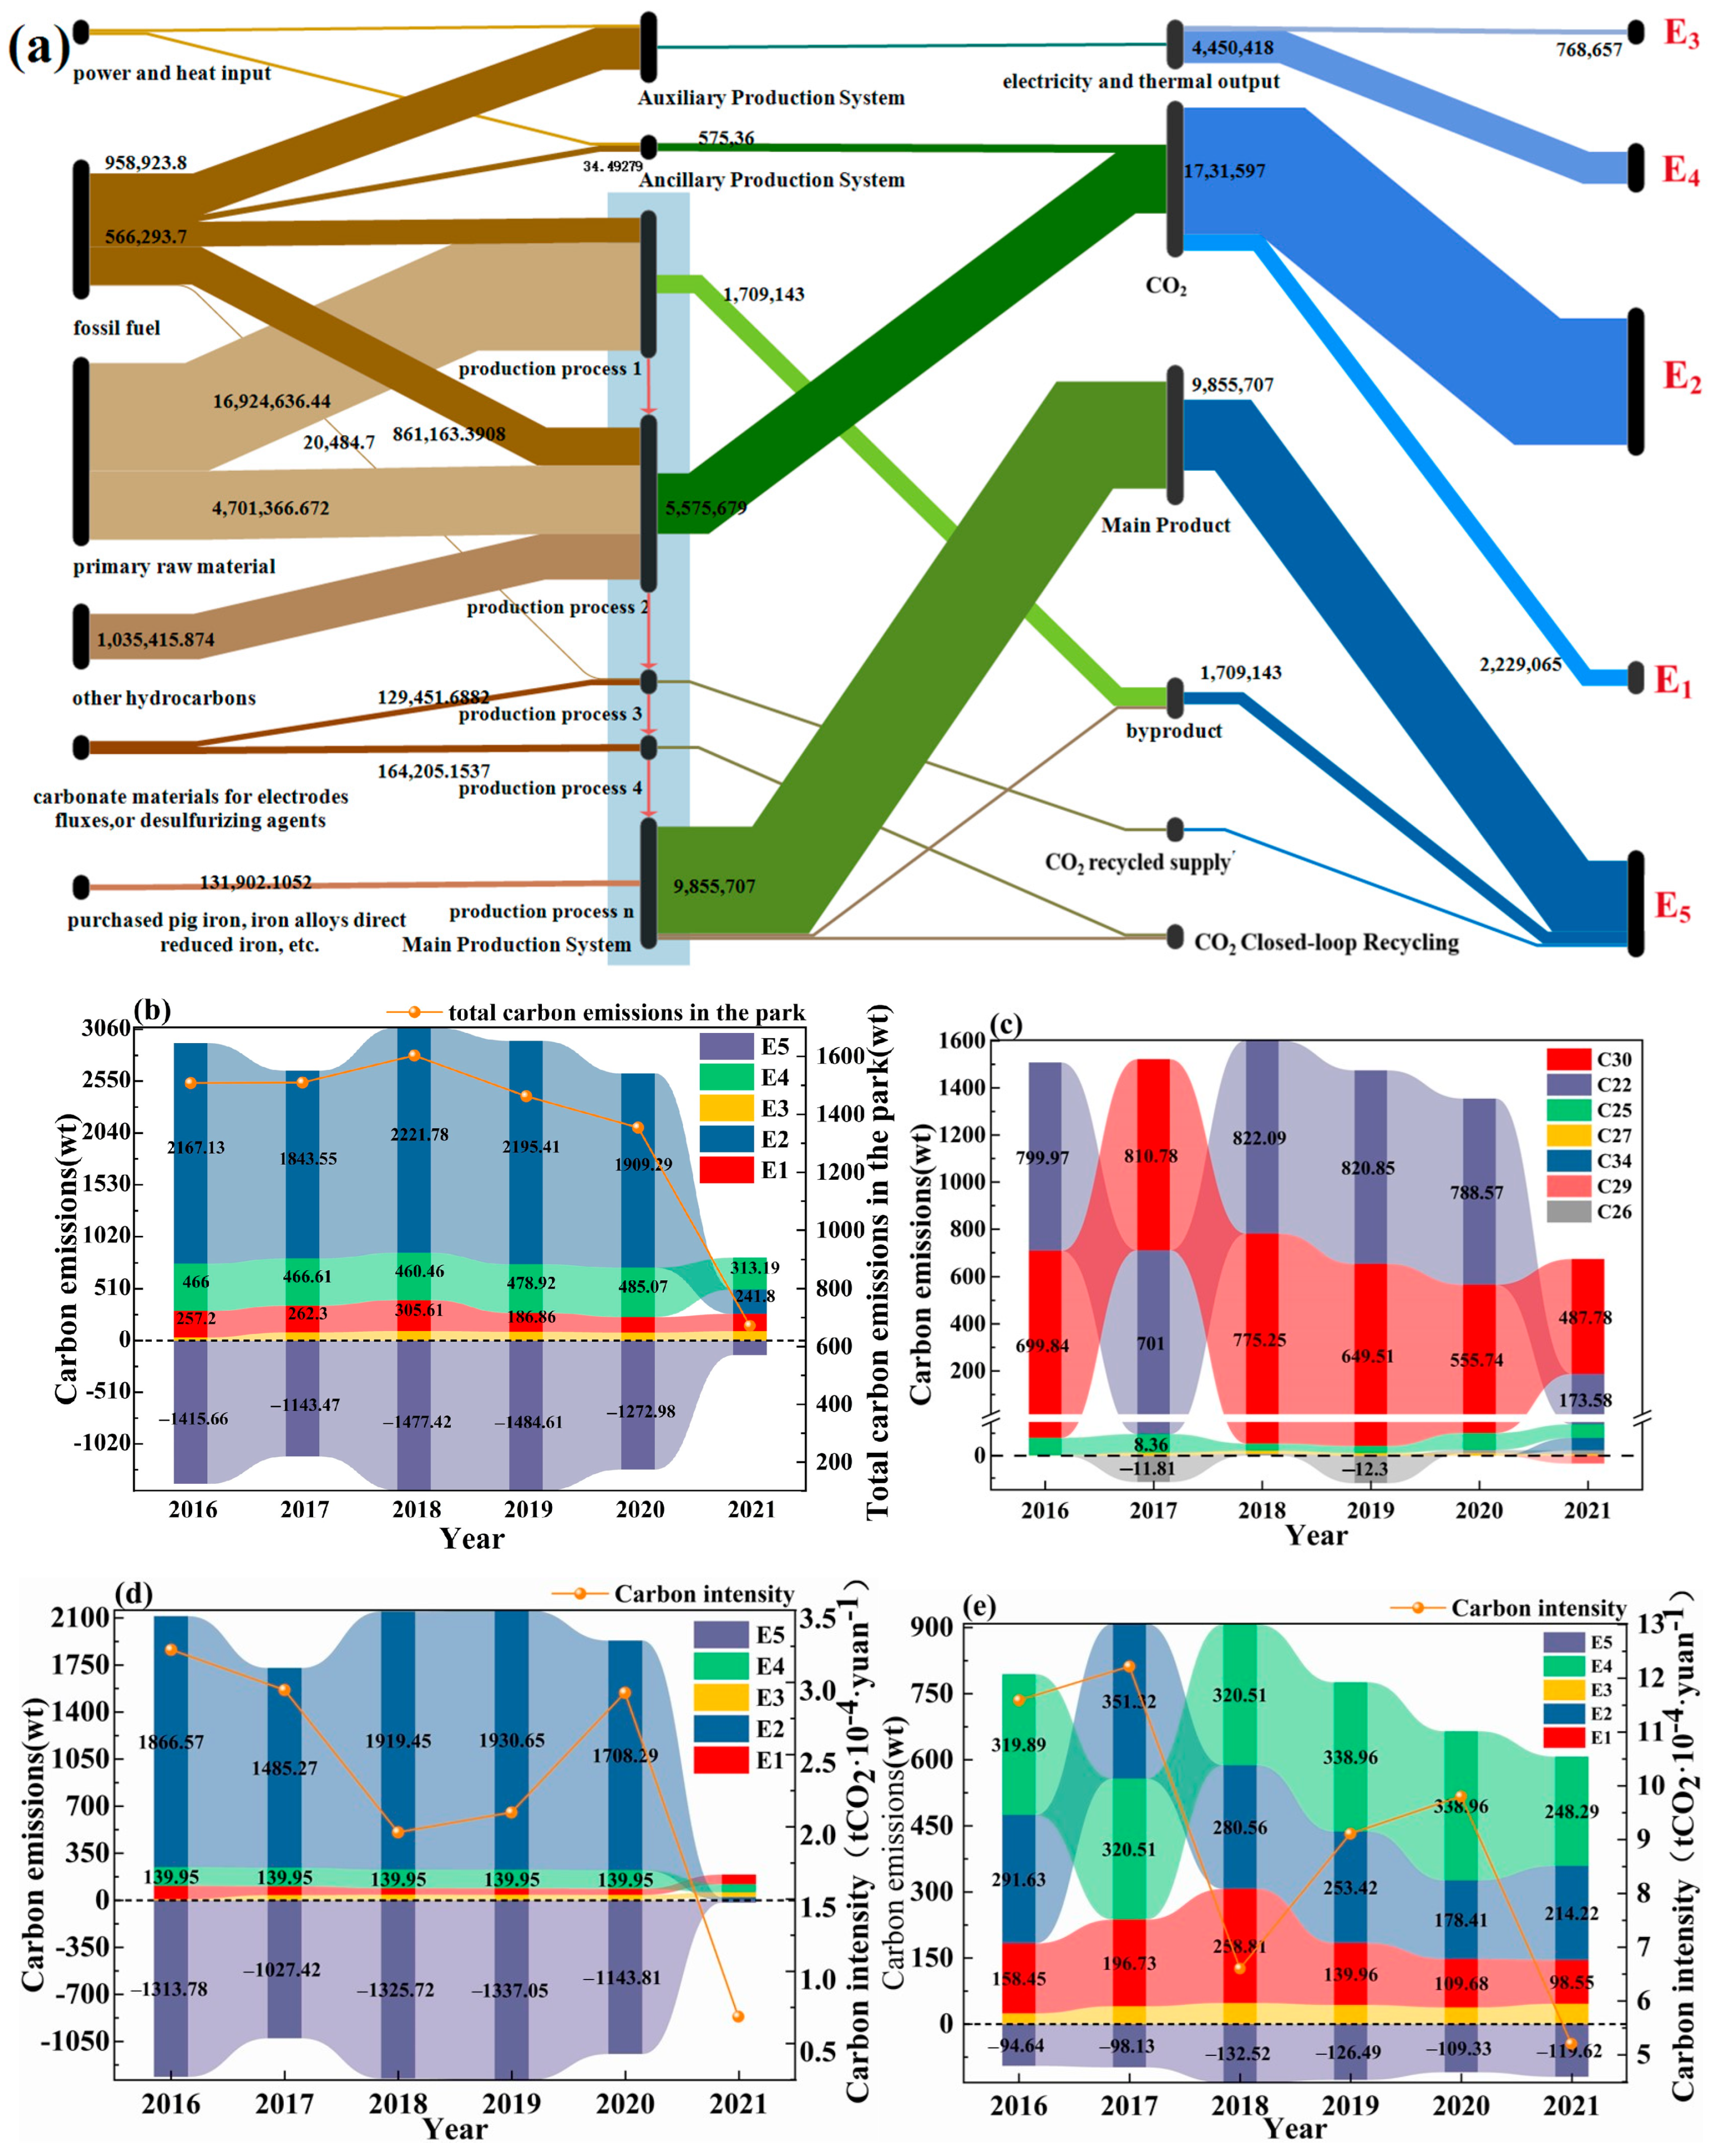
3.1. Characteristics of Carbon Emission Variations in Industrial Parks

According to the total emission and intensity generated for the high-energy-consuming industrial park from 2016 to 2021, the characteristics of carbon emission changes are analyzed and illustrated in Figure 3. Simultaneously, a carbon flow diagram is constructed based on the calculated data for further analysis. In Figure 3a, we observed that the total carbon emissions of the park had a progressive reduction from 2016 to 2021, decreasing from 15.0783 million tons (2016) to 6.7152 million tons (2021). These results showed a reduction rate of 55% in total emissions, while the average annual declined to 15%. Additionally, we noticed that the carbon emission intensity indicated an overall downward trend during these six years of analysis, decreasing from 4.86 tons of CO2/CNY 10,000 (2016) to 1.91 tons of CO2/CNY 10,000 (2021). Interestingly, we found that the highest reduction rate occurred from 2017 to 2018 (39%) and from 2020 to 2021 (53%). Based on these results, the diminution in the carbon emissions and their intensity indicated precise dual control targets of both factors in industrial zones.
Regarding the distinct types of emissions, the carbon emission quantities from high to low are ordered as E2, E1, E3, E4, and E5 (see Figure 3b). It should be noted that E5 is the carbon sequestration type and has a negative ponderation. As a result, E2 showed the highest total carbon emissions amount with an annual average emission of 17.6316 million tons of CO2, which was 7.9 times, 22.9, and 4 times more than those of E1, E3, and E4, respectively. Furthermore, E2 revealed a total emission account of 70%, especially from 2019 to 2021, having a cut-rate of 89% (from 21.9541 to 2.418 million tons of CO2). This overall diminution in carbon emissions indicated a significant reduction across the entire industrial park. Therefore, controlling the type of E2 emissions generated in the park may introduce potential efforts for future emissions management.
On the other hand, Figure 3c offers the sequence of carbon emissions based on the amount emitted for seven industries between 2016 and 2021, obtaining a quantity relation from high to low of C25, C26, C22, C34, C27, C30, and C29. Among these, we observed that the industries C25 and C26 generated the highest carbon emissions amounts, from 4106.05 to 3978.9 million tons of CO2, respectively. Combining the emissions emitted by both industries, their account represented 99% of the total emissions in the industrial park, making them the main sources of carbon emissions. The further analysis conducted on the emission characteristics of industries C25, C26, and C25 showed a general downward trend in emissions, in particular between 2020 and 2021 (from 788.57 million to 173.58 million tons CO2), indicating an annual diminution of 78% (see Figure 3d). More importantly, E2 emissions have a higher reduction from this industry, decreasing its effect in the study area. Moreover, regarding the carbon emission volume, its intensity also showed a significant downtrend (with an average annual reduction of 36%), which indicated that the technological upgrades and carbon control measures in industry C25 are effectively applied. Our findings are consistent with the report by Hassani et al. [42], confirming that technological advancements in industry C25 can adequately control GHG emissions.
In Figure 3e, the carbon emissions from industry C26 showed a gradual increase, then a decrease, reaching a peak of 8.1078 million tons of CO2 in 2017, which exhibited a growth of 14% from 2016 to 2017. The E1 emissions revealed the main reason for the overall rise in emissions. From 2017 to 2021, the emissions generated by the industry steadily declined, which exhibited a crucial factor in the general reduction in carbon emissions in the study area. Interestingly, in this period, the E2 emission showed a longer reduction (with an average annual decrease of 12%), indicating that the park achieved optimum results in its carbon control by the production process optimization.
Concurrently, the carbon emission intensity curve of the park exhibited an ‘M’ shape, which described the temporal variation in this analysis, registering peaks in 2017 and 2020. After reaching the second peak, there was a sharp decline to the lowest value within six years (5.2 tons CO2/CNY 10,000). These results suggest that the dual control (i.e., carbon emission volume and emission intensity) for industry C26 was initially achieved in 2021. However, the stability of the carbon reduction was relatively deficient; hence, the industry should implement carbon reduction measures for a gradual green production achievement. It is worth mentioning that the dual control effectiveness in both industries reflects the main driving force in order to achieve the industrial park’s control objectives. Also, this accomplishment contributes to the industrial park’s strict adherence to the ‘Development Plan for the Petrochemical and Chemical Industry (2016–2020)’ [43] announced by the Chinese government in 2016, which set a reduction rate of 18% for the CO2 emissions in the petrochemical and chemical industries by 2020.

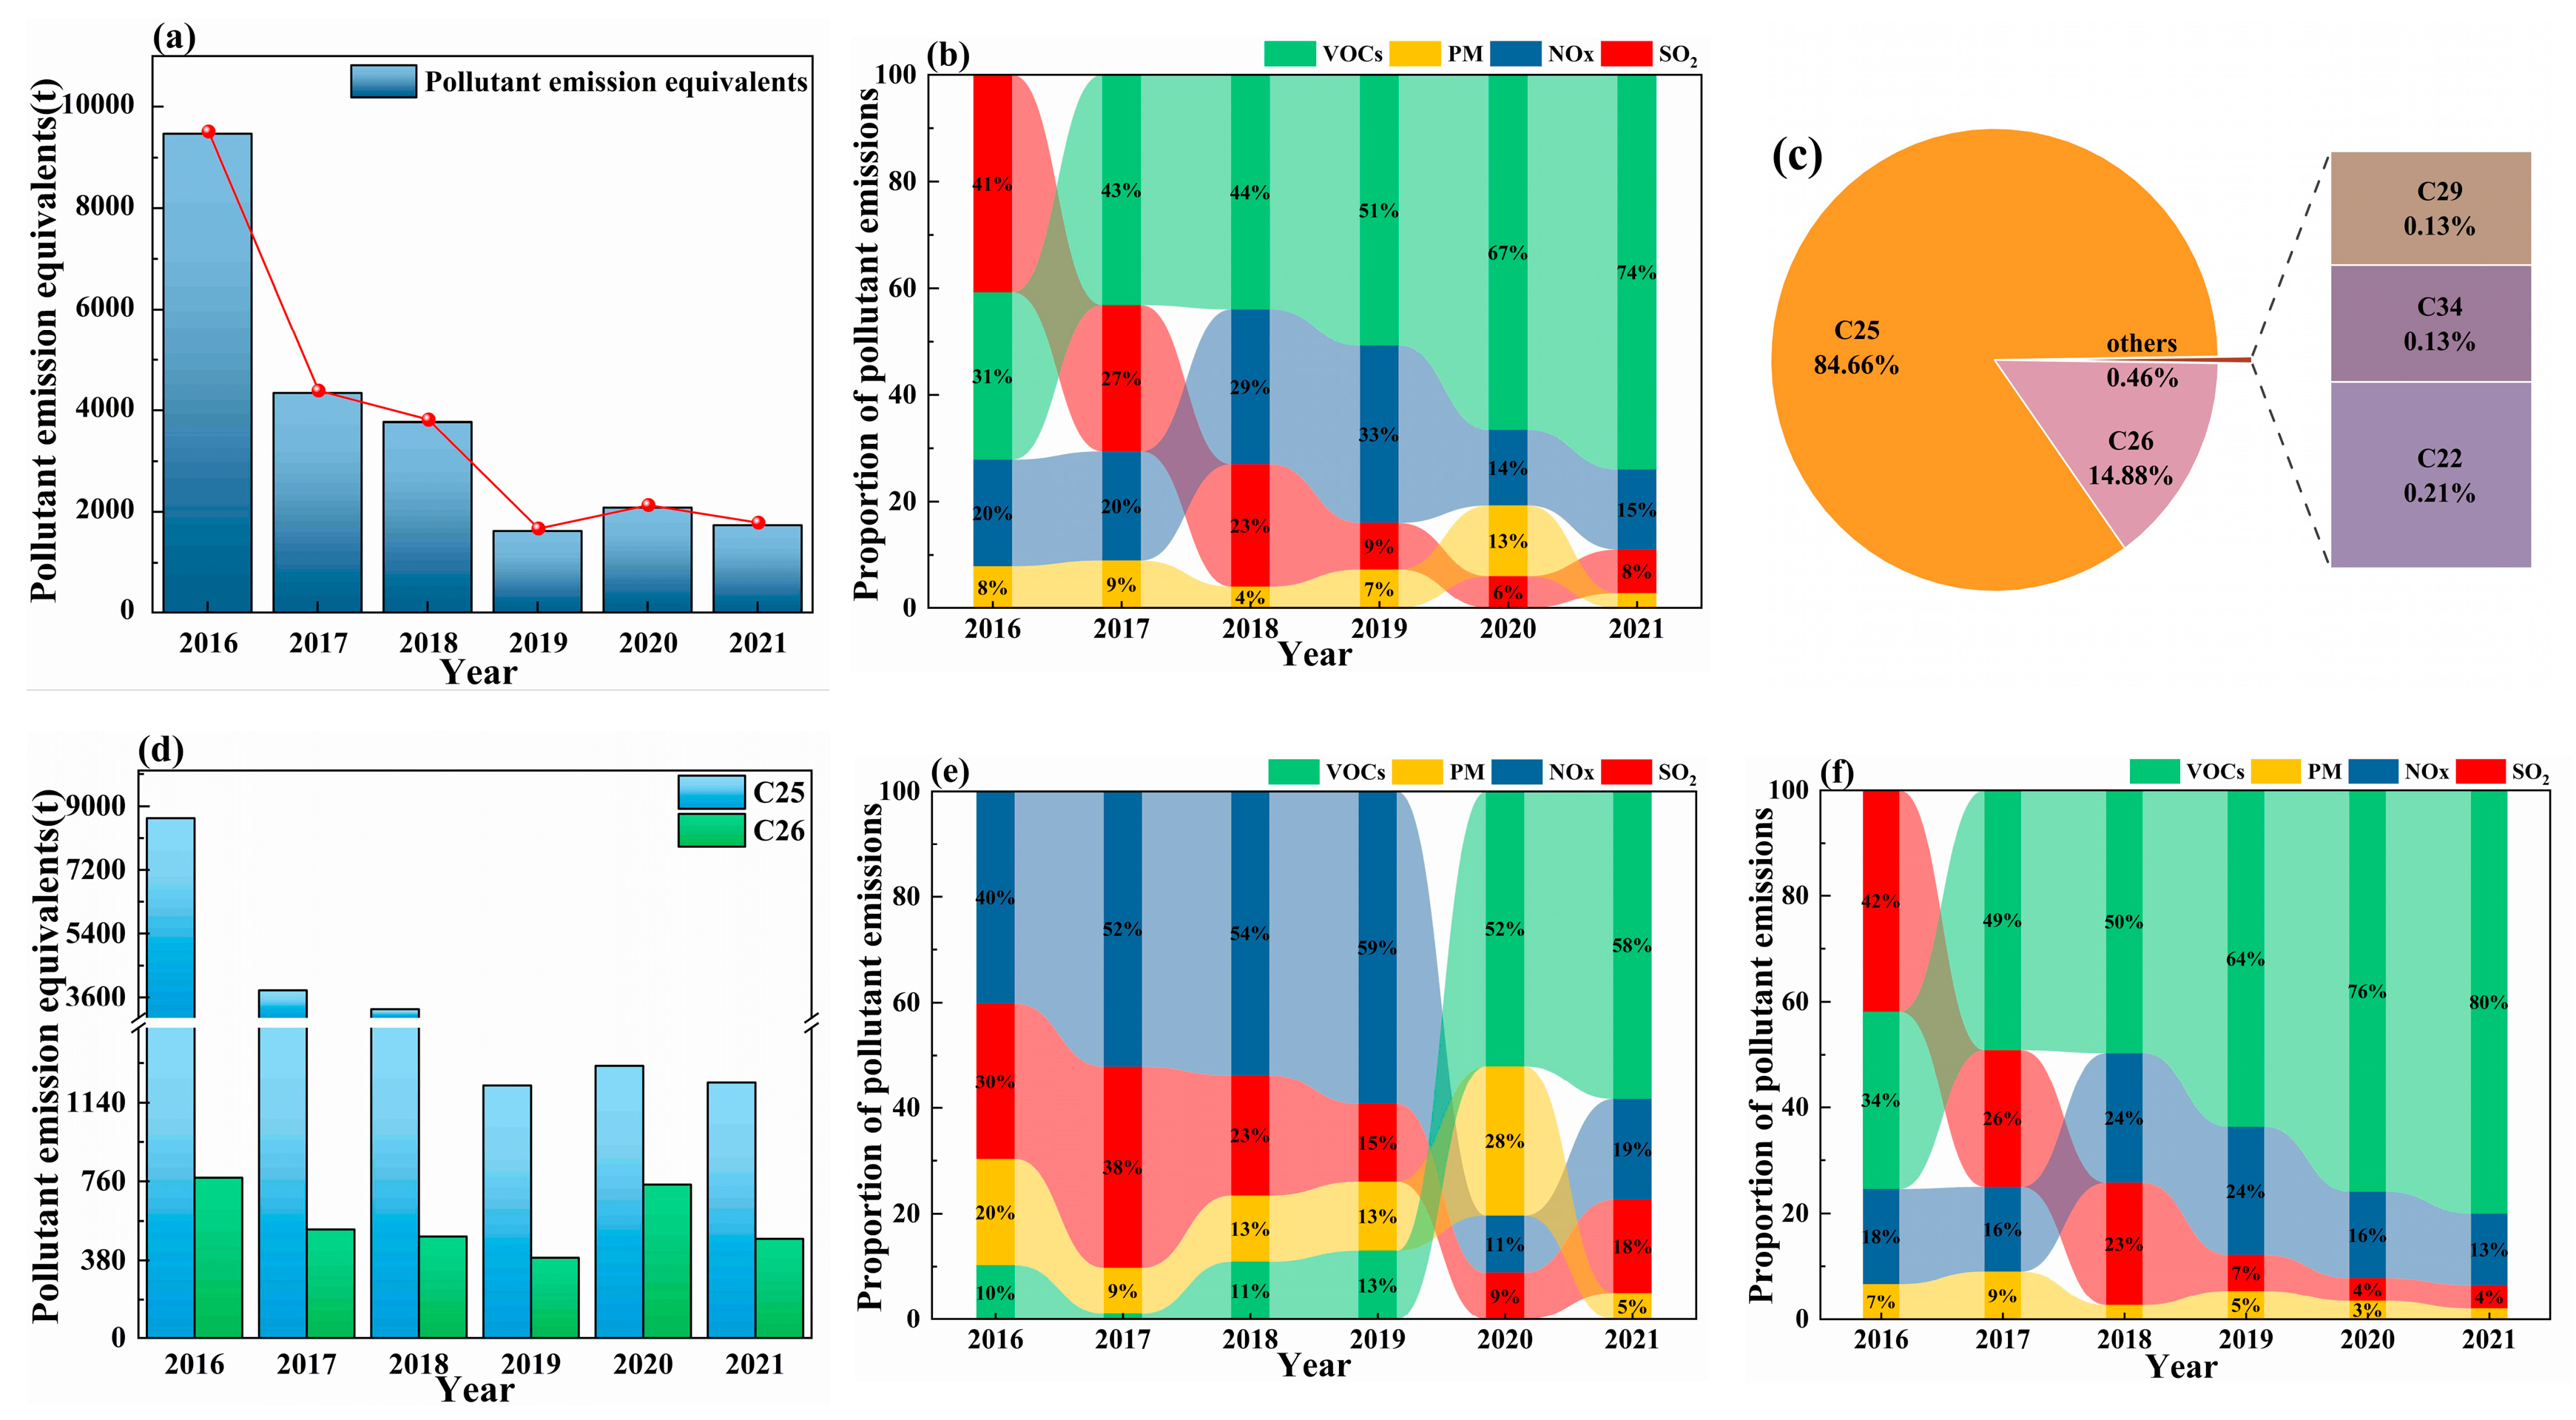
3.2. Characteristics of Pollutant Emission Distribution in Industrial Parks

Based on the equivalent coefficients of air pollutants, this study calculated the total equivalent emissions for four air pollutants from 2016 to 2021, as shown in Figure 4a. During this period, there was a significant downtrend in the equivalent emissions of air pollutants, which decreased from 9466.19 tons (2016) to 1736.70 tons (2021), with an annual cut-rate of 82% and an average of 40%. Notably, the air pollutants diminution is found between 2016 and 2017 and 2018 and 2019, reaching a reduction rate of 54% and 57%, respectively. This achievement is attributed to the ‘Air Pollution Prevention and Control Law of the People’s Republic of China’ enacted in 2015 [44], which showed that the industrial park has strictly followed the policy regulations for production process optimization, working towards a transition to an ecological industrial park.
In Figure 4b, this study analyzed the selected air pollutant emissions data provided for the industrial park for 2016–2021. Based on that, we observed that the order of pollutant emissions according to their quantity from high to low was VOCs, SO2, NOx, and PM. Notably, the proportion of VOC emissions annually increased; meanwhile, the SO2 emissions decreased, indicating that the industrial park’s sulfur measurements had a progressive growth and need further control measure optimization for volatile organic compounds. Our findings are congruent with various studies; for instance, Zhang et al. [45] explored China’s implementation of the Clean Air Action Plan in 2013 for a significant reduction in industrial SO2 emissions. Zheng et al. [46] analyzed the emissions of industrial VOCs, which experienced rapid growth, deducing the need for effective strategies to control VOC emissions based on the current environmental protection policies.
Figure 4c offers the distribution characteristics of pollutants emitted by different industry types, observing that the highest proportion of pollutant emissions was produced by industries C25 (14.88%) and C26 (84.66%), which covered 99% of the total. Based on these observations, this study focused on discussing the pollutant emission characteristics of these two industries. As shown in Figure 4d,e, the total amount of pollutants emitted by industry C26 gradually decreased from 2016 to 2019, then significantly increased between 2019 and 2020 (89.55%). The concentration growth of pollutants included the VOC and PM emissions emitted by several new dyeing and printing enterprises. Meanwhile, from 2020 to 2021, the higher reduction in pollutant emissions was 34.97% (260 tons) compared to the emissions in 2020, mitigating the rising trend of VOC and PM emissions and decreasing the total pollutant emissions emitted by the park. Moreover, the reduction rate of VOCs, including NOx (66%) and SO2 (73%), showed a significant effectiveness with the production process optimization and upgrade in industry C26. Zhang, Y. et al. [47] analyzed the impact of technological progress on the green total factor productivity (GTFP) of China’s chemical industry, further corroborating that process innovation is a major driver for green production in the sector.
Contrarily, industry C25 exhibited a strong downtrend in pollutant emissions, with an average annual cut-rate of 32.24% (Figure 4d,f), which attributed to the execution of the ‘Emission Standards for the Petrochemical Industry’ proposed by China in 2015 [48]. These guidelines play a pivotal role in driving the emissions reduction within the sector. Among the pollutants emitted by industry C25, the selected pollutants significantly decreased, especially SO2 emissions, while the proportion of VOC emissions gradually increased. Based on these results, C25 reached an optimum sulfur control and a deficient control of VOC emissions. By the comparison analysis, both industries revealed that the VOC emissions were an issue that included the entire industrial park and not only these industries analyzed. From the study of VOC emissions, it was found that under strict emission standards and new measurements, the emissions of industrial VOCs in China shall decrease by 30% by 2030, considering 2019 as the baseline year. Meantime, without new emission reduction measures, the emissions of industrial VOCs in China are expected to increase by 14% by 2030 [49]. Our findings suggest the necessity for the entire industrial park to adopt more effective measures against VOC emissions regarding the current achievements, ensuring the continued reduction in pollutant emissions and promoting sustainable industry development.

3.3. Influence of Law on Different Pollutants on Carbon Emissions

As shown in Figure 5a, we conducted the Spearman correlation analysis, (the detailed correlation analysis can be found in the Supplementary Materials) between the pollutants and carbon emissions, finding positive correlations with the SO2 (0.71), NOx (0.83), PM (0.49), and VOC (0.6) emissions. Our results may provide empirical support for the theory that air pollutants are homologous with CO2 and are consistent with the report by Li et al. [50]. Their study demonstrated that GHGs and conventional air pollutants share similar driving forces for their emissions, indicating a close relationship between them. In addition, the low-sulfur fuels were explored by Chae et al. to reduce pollutant emissions and carbon emissions at the lowest cost [51]. Therefore, this study offers a reliable assessment of the pollutant impacts on carbon emissions and enhances the proposed goal for pollution reduction and carbon emission mitigation in industrial parks, offering practical guidance for sustainable areas.

3.3.1. Processes of Carbon Emissions for Pollutant Types in Different Industries

As can be seen from Figure 5b,d, this study found higher positive correlations between carbon emissions and pollutant emissions in the C26, C22, and C25 industries. For instance, most carbon emission types correlated to SO2 emissions in the C26 industry, NOx emissions in C25, and VOC emissions in C22. In particular, with the C26 industry, SO2 emissions had the highest correlations with the E1 (0.54), E2 (0.77, p ≤ 0.05), E4 (−0.62), and E5 (0.60) emissions, which indicated moderate to strong correlations. Our findings suggest a close relationship between the SO2 and carbon emissions, stemming from fuel combustion, production processes, and the thermal energy supply and procurement in the C26 industry. Our results are congruent with those reported by [50], who explored the relationship between SO2 and CO2, suggesting that the SO2 reduction rate is related to the diminution in total CO2 emissions. Additionally, we observed that emissions of SO2 and E2 (ρ = 0.77, p ≤ 0.05) induced an evident increase in SO2 emissions emitted by the C26 industry’s production processes. By evaluating the synergistic effects of CO2 and SO2 emission reductions in China’s industrial sector, Shi et al. have identified a strong correlation when these emissions decreased to 10,000 and 1600 tons, respectively [52]. Thus, SO2 emissions can be considered as an indicative marker for carbon emissions generated by the chemical raw materials and products manufacturing industry, but also in factories and enterprises related to fertilizer manufacturing, pesticides, synthetic materials, specialty chemical products, and daily-use chemical products. Based on that, the SO2 compound can forecast changes in carbon emissions within these production processes.
As shown in Figure 5b, in industry C26, NOx emissions exhibit a significant correlation with the sector’s carbon emission categories: the correlation coefficient with E1-type carbon emissions is 0.77, with E2-type emissions is 0.89, and with total carbon emissions is 0.83—all indicating a strong positive relationship. In this industry, the primary sources of NOx emissions are concentrated in high-temperature combustion processes, such as pyrolysis, catalytic cracking, thermal cracking, and other thermochemical reactions, as well as from thermal equipment, including industrial boilers and cracking furnaces. These facilities typically rely on the combustion of fossil fuels such as coal, natural gas, and heavy oil, which not only emit substantial amounts of NOx but also serve as major contributors to carbon emissions.
As a result, NOx and carbon emissions exhibit a high degree of spatial overlap and are closely linked within industrial process flows, thereby demonstrating a strong consistency in their emission trends. A year-by-year analysis of NOx and carbon emissions in industry C26 from 2016 to 2021 reveals that during 2017–2019, both indicators showed a synchronized downward trend, suggesting that preliminary measures for coordinated emission reductions were implemented in this period. From 2019 to 2021, both NOx and carbon emissions declined significantly, displaying an even stronger pattern of synergistic reduction.
This trend indicates that the period from 2017 to 2021 can be regarded as an identifiable phase of the co-evolution between NOx and carbon emissions, with the sharp declines observed after 2019 marking a key time window for investigating their coupling relationship and coordinated control mechanisms. These findings provide a valuable empirical foundation and data basis for informing future policy interventions aimed at joint air pollutant and carbon emission mitigation.
Meanwhile, in the C25 industry, this study noticed positive and negative correlations between NOx and E2 (0.49), E4 (0.65), and E5 (−0.49) emissions, mainly generated by the combustion of fossil fuels (i.e., coal, petroleum, and natural gas). Hence, an increase in NOx emissions is strongly related to carbon emissions emitted by the thermal energy supply and procurement in the C25 industry. Xie et al. [53] confirmed the synergistic benefits of CO2 and NOx emissions based on the policy scenarios for the reduction, reaching at least a cut rate of 15% in NOx emissions. Moreover, with the increase in climate mitigation issues, the synergistic benefits between both emissions have become prominent for further analysis. Based on that, NOx emissions can be considered a robust indicator of carbon emissions in the thermal supply and procurement processes for industries such as petroleum, coal, and other fuel processing. Thus, the prediction factor can be effectively estimated under stricter emission reduction measures when the correlation between them becomes more significant.
In industry C22, the correlation coefficients between VOCs emissions and indicators E1, E2, and E5 are 0.66, −0.65, and 0.65, respectively. Among them, the strongest positive correlation appears between E1 and VOC emissions, indicating that E1 plays a significant role in explaining VOCs’ emission behavior.
In terms of specific production processes, the coating and drying process and the printing process represent the most concentrated sources of VOC emissions [54]. In particular, the coating and drying process, which serves as a key step in enhancing a product’s added value, consumes large amounts of steam and natural gas and is accompanied by substantial emissions of VOCs and greenhouse gases.
This conclusion is further supported by [55], who demonstrated that both VOC and greenhouse gas emissions are heavily dependent on fossil fuel combustion and exhibit a strong synergistic relationship in terms of emission intensity.
Therefore, in the production processes of this industry, incorporating VOCs as an effective predictor of carbon emissions—based on real-time monitoring and precise control—can enable the more scientific regulation of carbon emissions and facilitate sustained VOC reductions. This approach provides critical data support and a strategic reference for achieving the dual objectives of pollution control and carbon reduction and contributes to the development of a green manufacturing system and the promotion of high-quality industrial development.
As shown in Figure 5b, industries C25 and C22 exhibit a strong correlation between PM emissions and carbon emissions. In particular, PM emissions in industry C25 account for a substantial proportion of its total air pollutants, indicating a high particulate matter emission intensity. In contrast, PM emissions in industry C22 represent a smaller proportion, with a relatively limited overall contribution.
Despite the significant difference in the absolute PM emission levels between the two industries, both demonstrate a year-on-year declining trend in the PM-to-CO2 emission ratio, reflecting ongoing improvements in pollution control. However, it is noteworthy that although the total PM emissions in industry C22 are relatively low, its PM-to-CO2 ratio consistently remains higher than that of industry C25. This contrast reveals a typical ‘small but dirty’ characteristic, in which a higher intensity of PM emissions corresponds to each unit of carbon emissions.
Furthermore, the elevated PM/CO2 ratio in industry C22 also suggests that this metric is more responsive to variations in emission levels, exhibiting a higher dynamic sensitivity. This feature implies that in industry C22, PM emissions data can serve not only as an indicator of the pollution intensity but also as an important reference variable for inferring trends in carbon emissions. This provides strong theoretical support and a robust data foundation for predicting carbon emissions based on PM metrics.
In summary, the PM-to-carbon emission ratio, as a composite indicator of pollution intensity, not only reveals the structural differences in emission characteristics across industries but also offers directional guidance for establishing more efficient pollution monitoring and forecasting systems. This is particularly valuable in sectors with a high PM/CO2 ratio but relatively low absolute emissions, where the research potential is especially significant.

3.3.2. The Pathway Analysis Between Different Pollutants and the Distribution of Carbon Emissions

Figure 6 shows the pathway influence of different pollutant analyses on the distribution characteristics of carbon emissions. As a result, for various pollutants, the SO2 emissions had a strong relationship with seven types of sources of carbon emissions across three industries (C26-E1, C26-E2, C26-E4, C26-E5, C22-E1, C22-E4, and C25-E4). NOx emissions were strongly related to different industries, obtaining the following combination: C26-E1, C26-E2, C22-E1, C22-E4, C25-E2, C25-E4, and C25-E5. VOC emissions demonstrated six significant relations (i.e., C26-E1, C26-E2, C22-E1, C22-E2, C22-E5, and C25-E3). PM emissions showed four strong correlations, such as C26-E3, C25-E4, C22-E1, and C22-E4. Among these, SO2, NOx, and VOCs showed the highest and most common correlation (i.e., C26-E2) with coefficients of −0.77, 0.89, and 0.77, respectively. Based on these results, the carbon emissions produced by chemical industries, such as raw chemical materials manufacturing, fertilizers, pesticides, synthetic materials, specialty chemical products, and daily-use chemical products, are closely related to the emissions of these three pollutants.
Huang et al. [56] indicated that industrial sources within the country, including combustion (e.g., power plants, boilers, and kilns) and non-combustion processes, contributed nearly 97% of SO2, 86% of NOx, and 69% of VOC emissions. Lin et al. [57] reported that the chemical industry is the second-largest industrial carbon emission source in China, which highly contributes to the pollutant and carbon emissions generation. Also, their study indicated that the efficient implementation of emission reduction measures is imperative for that kind of industry. Shi et al. [52] analyzed the emission streams of SO2, NOx, PM2.5, and VOCs, identifying the strong relationships between emissions from different production sectors and the gross domestic product (GDP). That study deduced that the reduction in the pollutants had a strong influence on the CO2 emissions diminution. Lyu et al. [58] employed the Kaya identity expansion model to quantify the synergistic reduction effects of CO2 and SO2 emissions in China’s industrial sector, confirming the stable synergistic reduction in SO2 emissions resulting from CO2 emission reduction activities. Islam et al. [59] developed a multifactorial industrial structure adjustment model, demonstrating that the optimized adjustment schemes for 50 representative industries achieved the synergistic goals of pollution and carbon reduction. Altogether, these investigations confirmed that industrial structure adjustments can reduce specific pollutants (i.e., SO2, NOx, and VOCs) and CO2 emissions, providing reliable information for accurately predicting CO2 emissions. Therefore, this study plays an essential role in the flexible monitoring and control of CO2 emissions by enterprises in the raw chemical material and chemical product manufacturing sectors.
Additionally, PM exhibited the highest correlation with carbon emission type C25-E4 (0.65), indicating that PM is strongly related to carbon emissions emitted by fuel combustion. Our findings are consistent with various reports; for example, Liu et al. [60] explored the impact of China’s Emission Trading System (ETS) on PM2.5 concentrations, finding that the ETS has led to an average reduction in PM2.5 (4.8%), which reached significant effects during the summer season. Also, their study verified the strong relationship between PM and carbon emissions. Therefore, PM emissions monitoring can effectively predict the trend of GHGs in the production process, enabling flexible carbon emissions monitoring.

4. Conclusions

In this study, we employ the IPCC emission factor method and determine the management boundary in industrial zones in order to establish a carbon accounting method system for industrial parks. The accounting method is based on the carbon emission flow paths (i.e., independent enterprises, enterprises in the same industry, and enterprises in the industrial chain), obtaining the carbon emissions from different industry types. The key findings are involved in three aspects:
  • From 2016 to 2021, the industrial park’s carbon emissions were reduced from 15.078 million tons to 6.715 million tons, with an average annual reduction rate of 15%, while the intensity annually decreased from 4.86 tons to 1.91 tons of CO2/CNY 10,000. These observations indicated that the park progressively achieved the dual control targets of total carbon emissions and intensity. Among these, the E2 emissions registered 70% of the total carbon emissions; hence, the park’s carbon emissions significantly decreased (from 21.9541 million tons to 2.418 million tons of CO2) after reducing the E2 impact. The reduction rate reached by C25 (26%) and C26 (7%) showed a significant diminution after applying the process upgrades and carbon control measures.
  • This study selected SO2, NOx, PM, and VOCs as representative air pollutants, with emission volumes ranked from highest to lowest (i.e., VOCs, SO2, NOx, and PM). From 2016 to 2021, the total emissions of air pollutants decreased from 9466.19 tons to 1736.70 tons, with an average annual reduction rate of 40%. Thus, the C25 and C26 industries were the two largest polluting industries, registering 14.88% and 84.66% of the total pollutant emissions, respectively. Thus, focusing on the C26 industry, the significant diminution in the emissions of NOx (66%) and SO2 (73%) was the primary reason for the overall reduction in the pollutant emissions of the park.
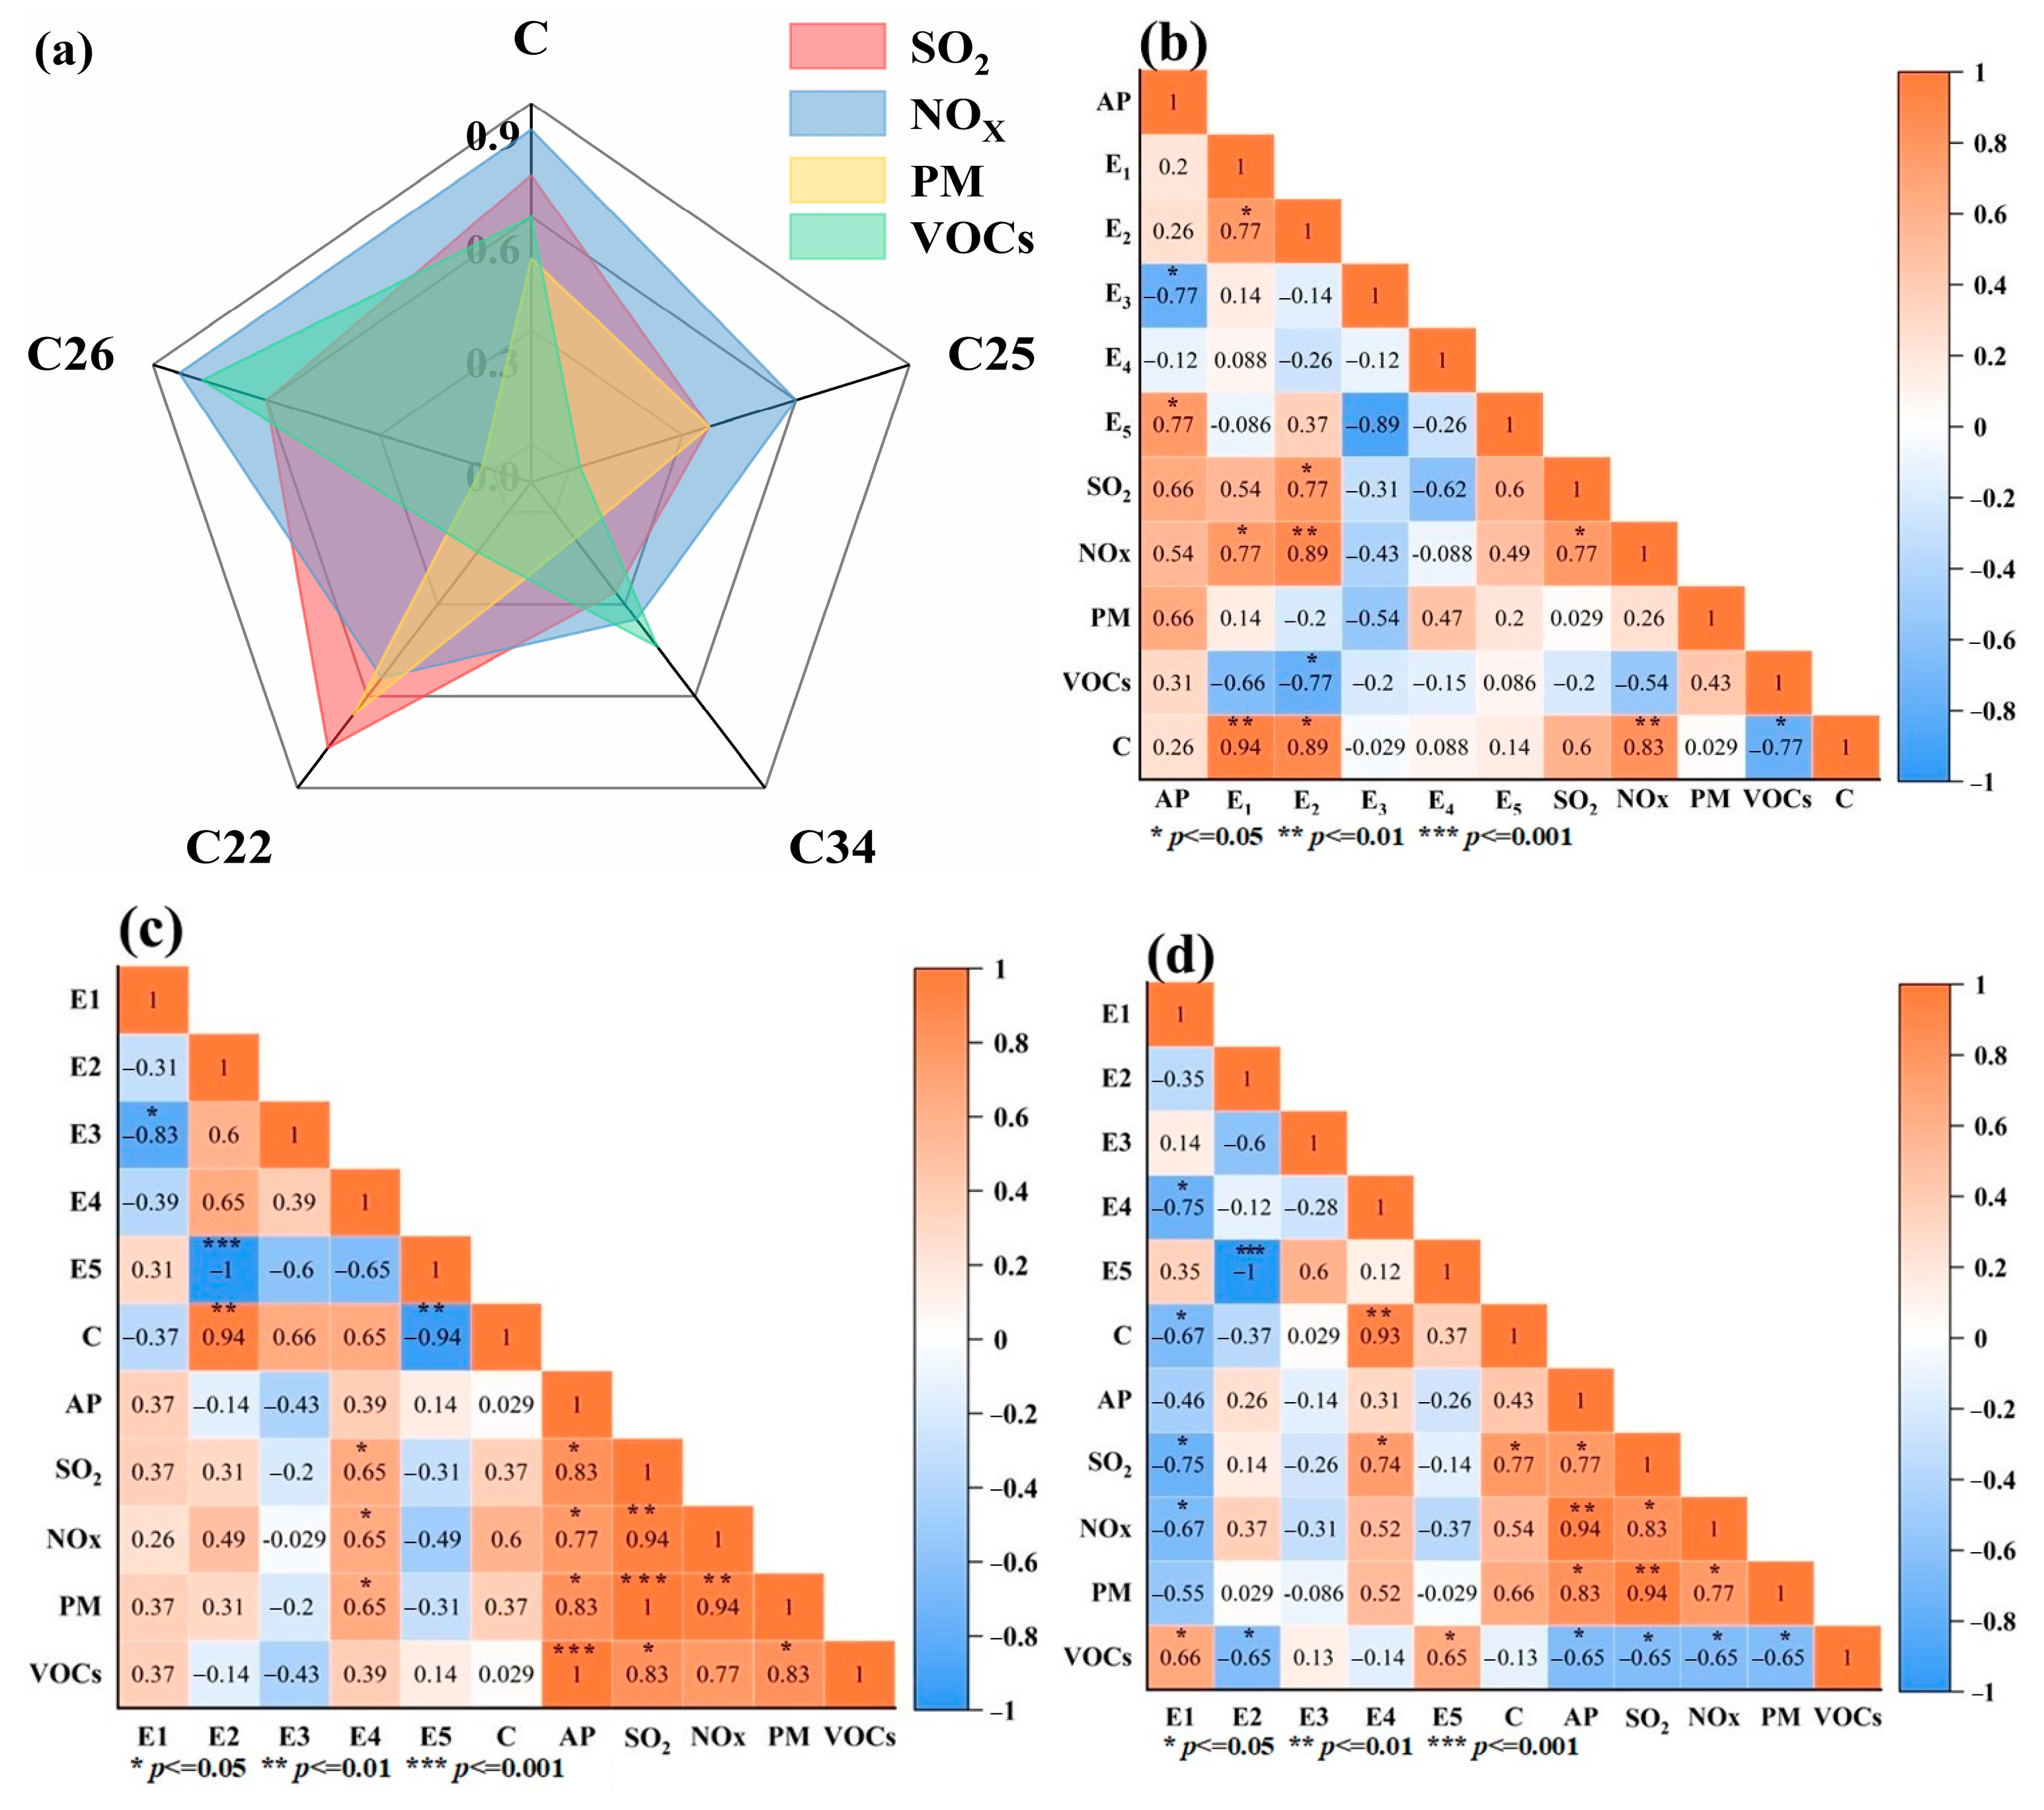
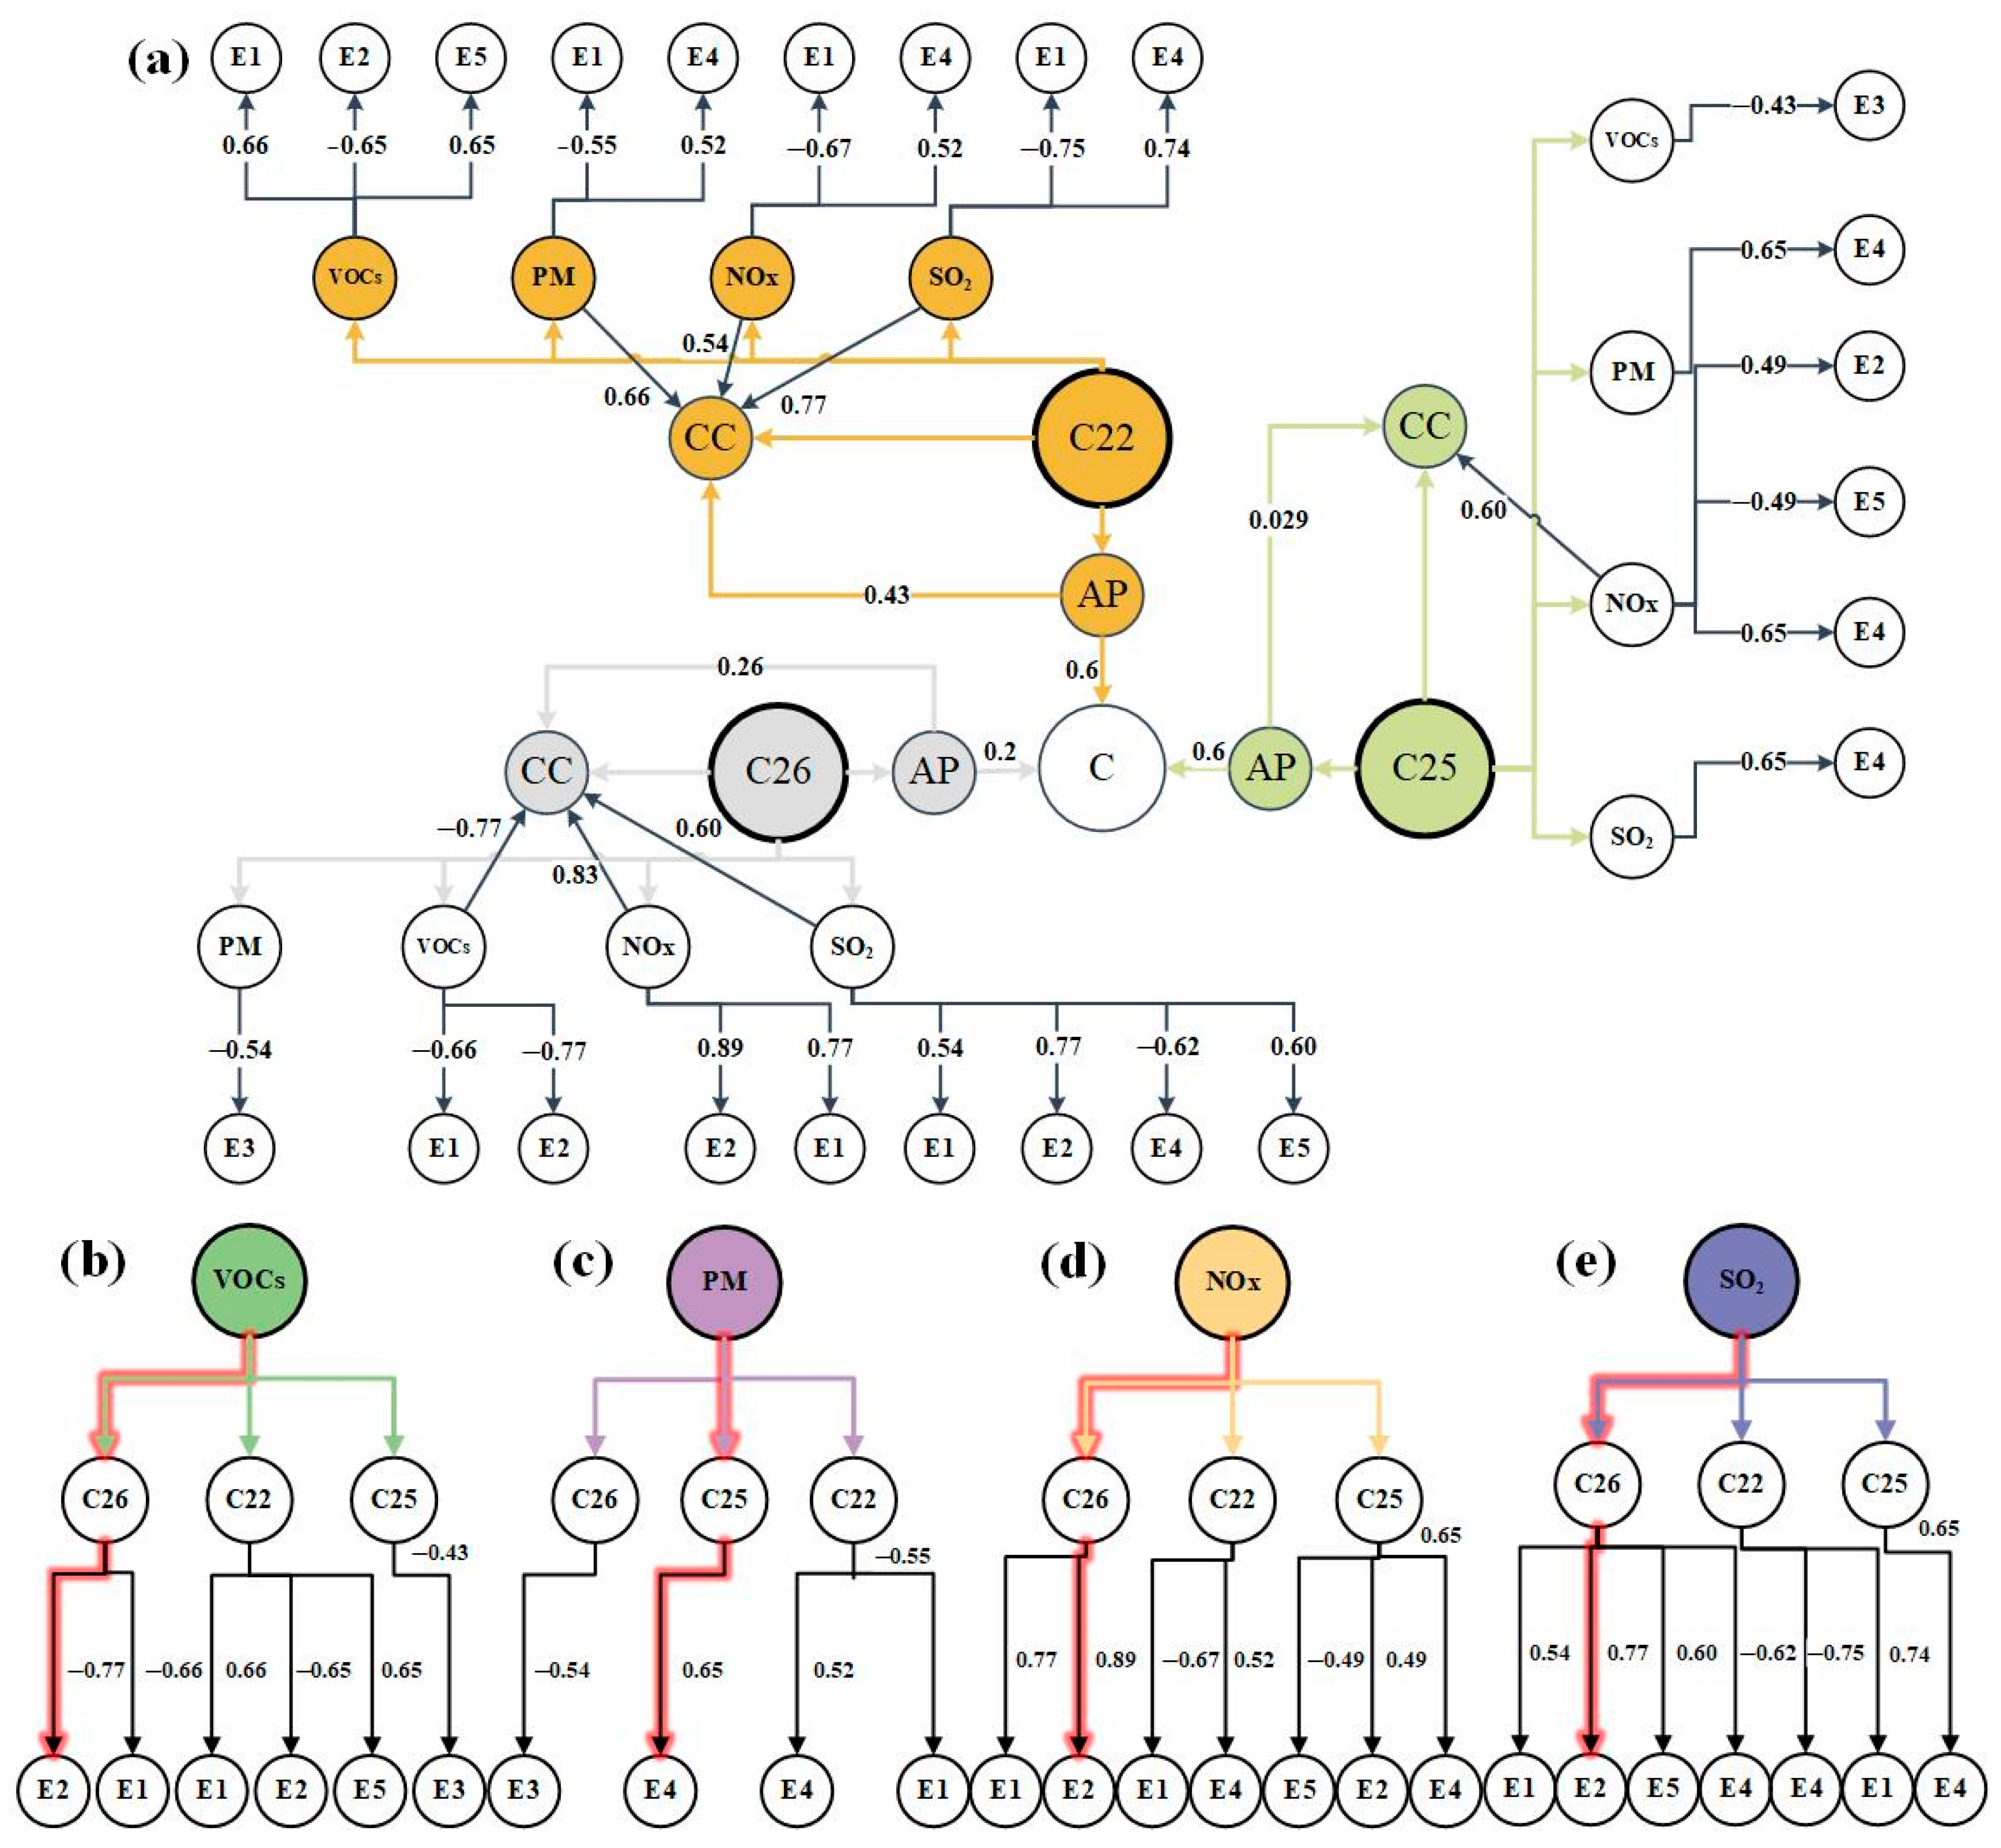
  • Furthermore, a strong positive correlation was found between the pollutants and the total carbon emissions, sharing a common source. For instance, in industry C26, we found higher correlations between carbon emissions with SO2 (0.77) and NOx (0.89). Based on that, NOx emissions are more suitable for being used as an indicator for carbon emissions during the production process of the raw chemical materials and chemical products manufacturing industry.
Atmospheric pollutants and carbon dioxide emissions share a common origin, and there is a significant positive correlation between pollutant emissions and the total carbon emissions. Specifically, the correlation coefficients between SO2 and NOx emissions and carbon emissions in the raw chemical materials and chemical products manufacturing industry (C26) are 0.77 and 0.89, respectively. This indicates that NOx emissions are more suitable as an indicator of carbon emissions during the production process in the raw chemical materials and chemical products manufacturing industry. Nowadays, production facilities in industrial parks are often equipped with real-time monitoring equipment for atmospheric pollutants, but the popularization of real-time monitoring equipment for CO2 is quite challenging. If existing pollutant monitoring equipment could be used to calculate carbon emissions in real-time through relevant theoretical calculations, it would enhance the convenience and flexibility of carbon emission assessments in the park, providing strong support for promoting sustainable development. This study provides the foundational theory and data support for estimating real-time carbon emissions based on the monitoring data of pollutant emissions in the park.
More importantly, the carbon accounting framework and multi-path scenario analysis model developed in this study demonstrate a high degree of generalizability and replicability. They can be adapted to other industrial parks through parameter adjustments, based on differences in the industrial composition, energy structure, and regional resource endowments. Therefore, although the quantitative results of this study may exhibit some degree of regional specificity, the proposed accounting logic, scenario construction approach, and pathway optimization mechanism offer methodological references and decision-making support for low-carbon development in other comparable industrial park contexts.

Supplementary Materials

The following supporting information can be downloaded at https://www.mdpi.com/article/10.3390/pr13072070/s1: Figure S1: Comparison chart of carbon Accounting approaches: (a) Traditional emission factor method (b) Carbon accounting method established in this study for industrial parks.; Table S1: Main Symbol Correspondence Table and Table S2: Correlation Coefficient Table.

Author Contributions

Conceptualization, Z.L. and T.W.; methodology, M.Z. and F.F.; software, M.Z.; validation, T.W., M.Z. and T.C.; formal analysis, T.C.; investigation, T.C.; resources, M.Z.; data curation, T.C.; writing—original draft preparation, T.C.; writing—review and editing, F.M., T.W. and T.C.; supervision, Z.L.; project administration, F.F. All authors have read and agreed to the published version of the manuscript.

Funding

The study was supported by the National Natural Science Fund Independent Innovation Fund of Tianjin University (2022XSU-0030, 2023XJS-0043).

Data Availability Statement

The raw data supporting the conclusions of this article will be made available by the authors on request.

Conflicts of Interest

The authors declare that they have no known competing financial interests or personal relationships that could have appeared to influence the work reported in this paper.

References

  1. Olhoff, A.; Christensen, J.M. Emissions Gap Report 2020; UNEP DTU Partnership 2020; ISBN 978-92-807-3812-4. Available online: https://www.unep.org/emissions-gap-report-2020 (accessed on 12 January 2025).
  2. Trenberth, K.E.; Fasullo, J.T. An apparent hiatus in global warming? Earth’s Future 2013, 1, 19–32. [Google Scholar] [CrossRef]
  3. Agreement, P. Paris agreement. In Proceedings of the Report of the Conference of the Parties to the United Nations Framework Convention on Climate Change (21st Session, 2015: Paris), Paris, France, 30 November–13 December 2015; p. 2. [Google Scholar]
  4. NDRC. The 14th Five-Year Plan for National Economic and Social Development of the People’s Republic of China and the Long-Range Objectives Through the Year 2035. Available online: https://www.gov.cn/xinwen/2021-03/13/content_5592681.htm (accessed on 12 January 2025).
  5. Woerdman, E.; Roggenkamp, M.; Holwerda, M. Essential EU Climate Law; Edward Elgar Publishing: Cheltenham, UK, 2021. [Google Scholar]
  6. Biden, J. The Biden Plan for a Clean Energy Revolution and Environmental Justice. Available online: https://www.presidency.ucsb.edu/documents/biden-campaign-press-release-joe-biden-releases-his-plan-for-clean-energy-revolution (accessed on 12 January 2025).
  7. Liu, Z.; Ciais, P.; Deng, Z.; Lei, R.; Davis, S.J.; Feng, S.; Zheng, B.; Cui, D.; Dou, X.; Zhu, B. Near-real-time monitoring of global CO2 emissions reveals the effects of the COVID-19 pandemic. Nat. Commun. 2020, 11, 5172. [Google Scholar] [CrossRef] [PubMed]
  8. Yan, K.; Lv, Y.; Guo, Y.; Tian, J.; Chen, L. Review on Greenhouse Gas Accounting Methods on China’s Industrial Parks. Chin. J. Environ. Manag. 2021, 13, 13–23. [Google Scholar] [CrossRef]
  9. Ali, Y.; Pretaroli, R.; Socci, C.; Severini, F. Carbon and water footprint accounts of Italy: A Multi-Region Input-Output approach. Renew. Sustain. Energ. Rev. 2018, 81, 1813–1824. [Google Scholar] [CrossRef]
  10. Andrew, R.; Peters, G.P.; Lennox, J. Approximation and Regional Aggregation in Multi-Regional Input-Output Analysis for National Carbon Footprint Accounting. Econ. Syst. Res. 2009, 21, 311–335. [Google Scholar] [CrossRef]
  11. Chen, G.; Shan, Y.; Hu, Y.; Tong, K.; Wiedmann, T.; Ramaswami, A.; Guan, D.; Shi, L.; Wang, Y. Review on City-Level Carbon Accounting. Environ. Sci. Technol. 2019, 53, 5545–5558. [Google Scholar] [CrossRef]
  12. Kokoni, S.; Skea, J. Input-output and life-cycle emissions accounting: Applications in the real world. Clim. Policy 2014, 14, 372–396. [Google Scholar] [CrossRef]
  13. Andrade, J.C.S.; Dameno, A.; Pérez, J.; Almeida, J.M.D.; Lumbreras, J. Implementing city-level carbon accounting: A comparison between Madrid and London. J. Clean. Prod. 2018, 172, 795–804. [Google Scholar] [CrossRef]
  14. Lee, K.; Ko, J.; Jung, S. Quantifying uncertainty in carbon emission estimation: Metrics and methodologies. J. Clean. Prod. 2024, 452, 142141. [Google Scholar] [CrossRef]
  15. Li, Y.W.; Yang, X.X.; Du, E.S.; Liu, Y.L.; Zhang, S.X.; Yang, C.; Zhang, N.; Liu, C. A review on carbon emission accounting approaches for the electricity power industry. Appl. Energy 2024, 359, 122681. [Google Scholar] [CrossRef]
  16. Meng, Z.; Wang, H.; Wang, B. Empirical Analysis of Carbon Emission Accounting and Influencing Factors of Energy Consumption in China. Int. J. Environ. Res. Public Health 2018, 15, 2467. [Google Scholar] [CrossRef] [PubMed]
  17. Zhang, H.X.; Sun, W.Q.; Li, W.D.; Ma, G.Y. A carbon flow tracing and carbon accounting method for exploring CO emissions of the iron and steel industry: An integrated material-energy-carbon hub. Appl. Energy 2022, 309, 118485. [Google Scholar] [CrossRef]
  18. NDRC. Compilation of Greenhouse Gas Emission Accounting Guidelines for 24 Industries. Available online: https://www.cmenhu.cn/3425.html (accessed on 12 January 2025).
  19. Guo, Y.; Lv, Y.; Yan, K.; Tian, J.; Chen, L. Low-carbon development pathways of industrial parks in China. Chin. J. Environ. Manag. 2021, 13, 49–58. [Google Scholar]
  20. Zhang, M.; Wang, C.; Wang, S.S.; Wang, K.; Zhang, R.Q. Assessment of greenhouse gas emissions reduction potential in an industrial park in China. Clean Technol. Environ. Policy 2020, 22, 1435–1448. [Google Scholar] [CrossRef]
  21. Liu, L.X.; Zhang, B.; Bi, J.; Wei, Q.; Pan, H. The greenhouse gas mitigation of industrial parks in China: A case study of Suzhou Industrial Park. Energy Policy 2012, 46, 301–307. [Google Scholar] [CrossRef]
  22. Wang, H.S.; Lei, Y.; Wang, H.K.; Liu, M.M.; Yang, J.; Bi, J. Carbon reduction potentials of China’s industrial parks: A case study of Suzhou Industry Park. Energy 2013, 55, 668–675. [Google Scholar] [CrossRef]
  23. Tan, X.; Zeng, Y.; Gu, B.; Tan, X.; Xu, B. The accounting for greenhouse gas emissions of a low-carbon industrial park in China: A case study in Chongqing. Energy Procedia 2017, 142, 3176–3181. [Google Scholar] [CrossRef]
  24. Qi, J.; Chen, B. Greenhouse Gas Emission Inventory of Industrial Parks. Acta Ecol. Sin. 2015, 35, 2750–2760. [Google Scholar] [CrossRef]
  25. Hu, W.Q.; Tian, J.P.; Chen, L.J. Greenhouse gas emission by centralized wastewater treatment plants in Chinese industrial parks: Inventory and mitigation measures. J. Clean. Prod. 2019, 225, 883–897. [Google Scholar] [CrossRef]
  26. Zhao, Y.; Wang, S.; Gao, G.; Xue, X.; Song, H.; Zhang, R. Exploring the green and low-carbon development pathway for an energy-intensive industrial park in China. J. Clean. Prod. 2024, 459, 142384. [Google Scholar] [CrossRef]
  27. Li, Z.; Ding, J.; Tao, T.; Wang, S.; Pi, K.; Xiong, W. Novel Evaluation Method for Cleaner Production Audit in Industrial Parks: Case of a Park in Central China. Sustainability 2024, 16, 2330. [Google Scholar] [CrossRef]
  28. Lu, X.; Yao, T.; Fung, J.C.H.; Lin, C. Estimation of health and economic costs of air pollution over the Pearl River Delta region in China. Sci. Total Environ. 2016, 566–567, 134–143. [Google Scholar] [CrossRef] [PubMed]
  29. Gao, G.; Wang, S.; Xue, R.; Liu, D.; Ren, H.; Zhang, R. Uncovering the characteristics of air pollutants emission in industrial parks and analyzing emission reduction potential: Case studies in Henan, China. Sci. Rep. 2021, 11, 23709. [Google Scholar] [CrossRef] [PubMed]
  30. Hua, S.B.; Tian, H.Z.; Wang, K.; Zhu, C.Y.; Gao, J.J.; Ma, Y.L.; Xue, Y.F.; Wang, Y.; Duan, S.H.; Zhou, J.R. Atmospheric emission inventory of hazardous air pollutants from China’s cement plants: Temporal trends, spatial variation characteristics and scenario projections. Atmos. Environ. 2016, 128, 1–9. [Google Scholar] [CrossRef]
  31. Wang, H.; Gu, K.; Sun, H.; Xiao, H. Reconfirmation of the symbiosis on carbon emissions and air pollution: A spatial spillover perspective. Sci. Total Environ. 2023, 858, 159906. [Google Scholar] [CrossRef]
  32. Yi, H.; Zhao, L.; Qian, Y.; Zhou, L.; Yang, P. How to achieve synergy between carbon dioxide mitigation and air pollution control? Evidence from China. Sustain. Cities Soc. 2022, 78, 103609. [Google Scholar] [CrossRef]
  33. Jiang, P.; Khishgee, S.; Alimujiang, A.; Dong, H. Cost-effective approaches for reducing carbon and air pollution emissions in the power industry in China. J. Environ. Manag. 2020, 264, 110452. [Google Scholar] [CrossRef]
  34. Eggleston, H.; Buendia, L.; Miwa, K.; Ngara, T.; Tanabe, K. 2006 IPCC Guidelines for National Greenhouse Gas Inventories. 2006. Available online: https://www.osti.gov/etdeweb/biblio/20880391 (accessed on 12 January 2025).
  35. National Development and Reform Commission (NDRC). Guidelines for Greenhouse Gas Emissions Accounting and Reporting in Other Industrial Enterprises (Trial)—Compilation Notes. November 2015. Available online: https://www.ndrc.gov.cn/xxgk/zcfb/tz/201511/W020190905506438889540.pdf (accessed on 10 June 2025).
  36. Dixit, M.K.; Culp, C.H.; Fernandez-Solis, J.L. Calculating primary energy and carbon emission factors for the United States’ energy sectors. RSC Adv. 2014, 4, 54200–54216. [Google Scholar] [CrossRef]
  37. NDRC. China’s Greenhouse Gas Emission Accounting and Reporting Guidelines for the Iron and Steel Industry (Trial). Available online: https://www.gov.cn/gzdt/att/att/site1/20131104/001e3741a2cc13e13f1803.pdf (accessed on 12 January 2025).
  38. MEE; Ministry of Ecology and Environment of the People’s Republic of China G.O. Notice on the Management of Greenhouse Gas Emission Reporting for the Power Generation Industry for the Years 2023–2025. Available online: https://www.mee.gov.cn/xxgk2018/xxgk/xxgk06/202302/t20230207_1015569.html (accessed on 12 January 2025).
  39. GB/T 32150-2015; Standardization Administration of China (SAC). Guidelines for Greenhouse Gas Emissions Accounting and Reporting in Other Industrial Enterprises. Standards Press of China: Beijing, China, 2015; AQSRQ.
  40. Dong, F.; Yu, B.; Hadachin, T.; Dai, Y.; Wang, Y.; Zhang, S.; Long, R. Drivers of carbon emission intensity change in China. Resour. Conserv. Recycl. 2018, 129, 187–201. [Google Scholar] [CrossRef]
  41. Babcock, L.R., Jr. A combined pollution index for measurement of total air pollution. J. Air Pollut. Control Assoc. 1970, 20, 653–659. [Google Scholar] [CrossRef]
  42. Hassani, H.; Silva, E.S.; Al Kaabi, A.M. The role of innovation and technology in sustaining the petroleum and petrochemical industry. Technol. Forecast. Soc. Chang. 2017, 119, 1–17. [Google Scholar] [CrossRef]
  43. NDRC. Development Plan for the Petrochemical and Chemical Industry (2016–2020). Available online: https://www.ndrc.gov.cn/fggz/fzzlgh/gjjzxgh/201706/t20170622_1196825.html (accessed on 12 January 2025).
  44. SCNC. Air Pollution Prevention and Control Law of the People’s Republic of China. Available online: https://www.mee.gov.cn/ywgz/fgbz/fl/201811/t20181113_673567.shtml (accessed on 12 June 2025).
  45. Zhang, L.; Wang, Y.; Feng, C.; Liang, S.; Liu, Y.; Du, H.; Jia, N. Understanding the industrial NOx and SO2 pollutant emissions in China from sector linkage perspective. Sci. Total Environ. 2021, 770, 145242. [Google Scholar] [CrossRef] [PubMed]
  46. Zheng, C.H.; Shen, J.L.; Zhang, Y.X.; Huang, W.W.; Zhu, X.B.; Wu, X.C.; Chen, L.H.; Gao, X.; Cen, K.F. Quantitative assessment of industrial VOC emissions in China: Historical trend, spatial distribution, uncertainties, and projection. Atmos. Environ. 2017, 150, 116–125. [Google Scholar] [CrossRef]
  47. Zhang, Y.; Song, Y.; Zou, H. Transformation of pollution control and green development: Evidence from China’s chemical industry. J. Envron. Manag. 2020, 275, 111246. [Google Scholar] [CrossRef] [PubMed]
  48. MEE; Ministry of Ecology and Environment of the People’s Republic of China, G.O. Emission Standard of Pollutants for the Petroleum Chemical Industry. Available online: https://www.mee.gov.cn/ywgz/fgbz/bz/bzwb/dqhjbh/dqgdwrywrwpfbz/201505/W020150506394632230539.pdf (accessed on 14 June 2025).
  49. Simayi, M.; Shi, Y.Q.; Xi, Z.Y.; Ren, J.; Hini, G.; Xie, S.D. Emission trends of industrial VOCs in China since the clean air action and future reduction perspectives. Sci. Total Environ. 2022, 826, 153994. [Google Scholar] [CrossRef]
  50. Li, X.; Qiao, Y.B.; Shi, L. The aggregate effect of air pollution regulation on CO mitigation in China’s manufacturing industry: An econometric analysis. J. Clean. Prod. 2017, 142, 976–984. [Google Scholar] [CrossRef]
  51. Chae, Y. Co-benefit analysis of an air quality management plan and greenhouse gas reduction strategies in the Seoul metropolitan area. Environ. Sci. Policy 2010, 13, 205–216. [Google Scholar] [CrossRef]
  52. Shi, Q.W.; Liang, Q.Q.; Huo, T.F.; You, K.R.; Cai, W.G. Evaluation of CO2 and SO2 synergistic emission reduction: The case of China. J. Clean. Prod. 2023, 433, 139784. [Google Scholar] [CrossRef]
  53. Xie, X.; Weng, Y.W.; Cai, W.J. Co-Benefits of CO Mitigation for NO Emission Reduction: A Research Based on the DICE Model. Sustainability 2018, 10, 1109. [Google Scholar] [CrossRef]
  54. Del Rio, D.D.F.; Sovacool, B.K.; Griffiths, S.; Bazilian, M.; Kim, J.; Foley, A.M.; Rooney, D. Decarbonizing the pulp and paper industry: A critical and systematic review of sociotechnical developments and policy options. Renew. Sustain. Energy Rev. 2022, 167, 112706. [Google Scholar] [CrossRef]
  55. Fetisov, V.; Gonopolsky, A.M.; Davardoost, H.; Ghanbari, A.R.; Mohammadi, A.H. Regulation and impact of VOC and CO emissions on low-carbon energy systems resilient to climate change: A case study on an environmental issue in the oil and gas industry. Energy Sci. Eng. 2023, 11, 1516–1535. [Google Scholar] [CrossRef]
  56. Huang, C.; Chen, C.H.; Li, L.; Cheng, Z.; Wang, H.L.; Huang, H.Y.; Streets, D.G.; Wang, Y.J.; Zhang, G.F.; Chen, Y.R. Emission inventory of anthropogenic air pollutants and VOC species in the Yangtze River Delta region, China. Atmos. Chem. Phys. 2011, 11, 4105–4120. [Google Scholar] [CrossRef]
  57. Lin, B.Q.; Long, H.Y. Emissions reduction in China’s chemical industry—Based on LMDI. Renew. Sustain. Energ. Rev. 2016, 53, 1348–1355. [Google Scholar] [CrossRef]
  58. Lyu, Y.; Chen, L.J.; Tian, J.P.; Liu, R.; Zhou, Q. Realizing synergy between pollution reduction and carbon mitigation in industrial parks: From model development to tool application. J. Clean. Prod. 2024, 446, 141197. [Google Scholar] [CrossRef]
  59. Islam, A.; Teo, S.H.; Ng, C.H.; Taufiq-Yap, Y.H.; Choong, S.Y.T.; Awual, M.R. Progress in recent sustainable materials for greenhouse gas (NOx and SOx) emission mitigation. Prog. Mater. Sci. 2023, 132, 101033. [Google Scholar] [CrossRef]
  60. Liu, J.-Y.; Woodward, R.T.; Zhang, Y.-J. Has carbon emissions trading reduced PM2. 5 in China? Environ. Sci. Technol. 2021, 55, 6631–6643. [Google Scholar] [CrossRef]
Figure 1. The distribution of the sector types based on the energy structure of industrial parks. (a) The map of provincial industrial parks in China. (b) The distribution of the high-energy-consuming industrial zone sectors.
Processes 13 02070 g001
Figure 2. The carbon flow dynamics and accounting unit distribution in the park. (a) The distribution map of enterprise accounting units. (b) A carbon flow diagram of the park. Note: Emissions from fuel combustion (E1): there are a total of 43 stationary combustion equipment units within the park, which include industrial kilns, industrial boilers, and internal combustion engines, with 70% of industrial kilns accounting in total. The fuels primarily consist of anthracite coal, oil, natural gas, etc. Emissions from industrial production processes (E2): Enterprises inside the park generate CO2 emissions from the purchased fossil fuels or other hydrocarbons as production raw materials and from the decomposition of carbonates during their utilization. Emissions generated by the purchased and sold electricity (E3): Electricity consumption for production and a minor portion for office use. Emissions generated by the purchased and sold heat (E4): The industrial park employs a centralized heating system, which is provided by six companies. The heat generated by their boilers and the surplus heat from auxiliary equipment also provides steam for production use and heating for buildings in the rest of the park. Emissions from carbon-sequestering products (E5): In the production process, a portion of the carbon is sequestered and stored in different sources. The corresponding CO2 emissions for such products are categorized under E5 and deducted based on that.
Processes 13 02070 g002
Figure 3. Carbon flow diagrams and carbon emission quantity charts for different industries and types. (a) The carbon flow diagram. (b) Carbon emission quantities and total carbon emissions by emission type. (c) Carbon emission quantities by industry. (d) Total carbon emissions and the carbon emission intensity by emission type for industry C25. (e) Total carbon emissions and the carbon emission intensity by emission type for industry C26. Note: the carbon flow diagram of the industrial park per tons of CO2e. All flow directions in the figure are from left to right, except for the CO2. It is supplied by production process 3, then recovered and used in production process 4.
Processes 13 02070 g003
Figure 4. The variation chart of pollutant emission quantities in the industrial park. (a) The variation chart of pollutant emission equivalents. (b) The proportion change chart of pollutant emission quantities. (c) The proportion of industry pollutant emission quantities. (d) The change chart of pollutant emission quantities for industries C25 and C26. (e) The proportion change chart of pollutant emission quantities for industry C26. (f) The proportion change chart of pollutant emission quantities for industry C25.
Processes 13 02070 g004
Figure 5. The relationship between pollutants and carbon emissions. (a) A radar chart of the correlation between pollutant emission quantities and carbon emission quantities. (b) A C26 industry pollutant–carbon emission heatmap. (c) A C25 industry pollutant–carbon emission heatmap. (d) A C22 industry pollutant–carbon emission heatmap.
Processes 13 02070 g005
Figure 6. Pathway diagrams of pollutants and carbon emissions. (a) Pollutant and carbon emissions correlation pathways. (b) Emission pathway for VOCs on carbon emissions. (c) Emission pathway for PM on carbon emissions. (d) Emission pathway for NOx on carbon emissions. (e) Emission pathway for SO2 on carbon emissions.
Processes 13 02070 g006
Table 1. Types of emissions and accounting formulas.
Types of EmissionsCarbon Emission Accounting FormulasReference
E1 E 1 , i = i = 1 n ( NCV j × FC j × CC j × OF j × 44 12 ) [35]
E2 E 2 , i = m = 1 n ( AD 2 , m × K m × C m × 44 12 ) q = 1 n ( AD 2 , q × K q × C q × 44 12 ) [36]
E3 E 3 , i = AD PE , i AD EE , i × EF 3 [18]
E4 E 4 , i = AD PH , i AD EP , i × EF 4 [18]
E5 E 5 , i = w = 1 n ( AD 5 × K w × C w × 44 12 ) [36]
Note: Emission factors for different emission types are sequentially obtained based on current measured observations and calculated and recommended values. The data for the fuel consumption, raw material usage, product output, electricity usage, and steam usage are calculated based on the park’s environmental statistics. The low calorific value, the carbon content per unit heat value of the fuel, and the carbon oxidation rate were adopted from the national standard recommendations corresponding to the type of company, assuming that the CO2 was 99%. The emission factors for raw materials and products are deduced based on the purity and molar mass ratio [37]. The electricity emission factor was the national grid average emission factor in 2022, which was 0.5703 tCO2/MWh [38]. Meanwhile, the thermal emission factor was at 0.11 tCO2/GJ [39] (Table S1 for details).
Table 2. Table of equivalent coefficients for air pollutants.
Air PollutantsEquivalent CoefficientCoefficient Values
SO2 α 1/0.95
NOx β 1/0.95
VOCS γ 1/0.95
PM δ 1/2.18
Disclaimer/Publisher’s Note: The statements, opinions and data contained in all publications are solely those of the individual author(s) and contributor(s) and not of MDPI and/or the editor(s). MDPI and/or the editor(s) disclaim responsibility for any injury to people or property resulting from any ideas, methods, instructions or products referred to in the content.

