
Reservoir Dynamic Reserves Characterization and Model Development Based on Differential Processing Method: Differentiated Development Strategies for Reservoirs with Different Bottom Water Energies

 and
and 
Abstract
1. Introduction
2. Experimental Section
2.1. Reservoir Model Construction
2.2. Reservoir Dynamic Reserve Characterization
3. Results and Analysis
3.1. Reservoir Dynamic Reserve Characterization and Development Effectiveness Evaluation
3.2. Discussion on Development Strategies Based on Reservoir Aquifer Energy Classification
4. Conclusions
Author Contributions
Funding
Data Availability Statement
Acknowledgments
Conflicts of Interest
References
- Li, Y.; Kang, Z.; Xue, Z.; Zheng, S. Theories and practices of carbonate reservoirs development in China. Pet. Explor. Dev. 2018, 45, 712–722. [Google Scholar] [CrossRef]
- Tang, B.; Ren, K.; Lu, H.; Li, C.; Geng, C.; Wei, L.; Chai, Z.; Wu, S. Study on residual oil distribution law during the depletion production and water flooding stages in the fault-karst carbonate reservoirs. Processes 2023, 11, 2147. [Google Scholar] [CrossRef]
- Liu, P.; Jiang, L.; Tang, B.; Ren, K.; Huang, M.; Geng, C. Residual Oil Distribution Pattern in a Fault-Solution Carbonate Reservoir and Countermeasures to Improve Oil Development Effectiveness. Geofluids 2022, 2022, 2147200. [Google Scholar] [CrossRef]
- Liu, Y.; Rui, Z.; Yang, T.; Birol, D. Using Propanol as an Additive to CO2 for Improving CO2 Utilization and Storage in Oil Reservoirs. Appl. Energy 2022, 311, 118640. [Google Scholar] [CrossRef]
- Wang, J.; Zhao, W.; Liu, H.; Liu, F.; Zhang, T.; Dou, L.; Yang, X.; Li, B. Inter-well interferences and their influencing factors during water flooding in fractured-vuggy carbonate reservoirs. Pet. Explor. Dev. 2020, 47, 1062–1073. [Google Scholar] [CrossRef]
- Tang, B.; Geng, C.; Huang, M.; Lu, H.; Ren, K. Research on the Depletion and Recovery Characteristics of Fault-Karst Reservoirs. Geofluids 2022, 2022, 1105335. [Google Scholar] [CrossRef]
- Kouassi, A.K.F.; Pan, L.; Wang, X.; Wang, Z.; Mulashani, A.K.; James, F.; Shaame, M.; Hussain, A.; Hussain, H.; Nyakilla, E.E. Identification of karst cavities from 2D seismic wave impedance images based on Gradient-Boosting Decision Trees Algorithms (GBDT): Case of ordovician fracturevuggy carbonate reservoir, Tahe Oilfield, Tarim Basin, China. Energies 2023, 16, 643. [Google Scholar] [CrossRef]
- Shi, W.; Cheng, J.; Liu, Y.; Gao, M.; Tao, L.; Bai, J.; Zhu, Q. Pressure transient analysis of horizontal wells in multibranched fault-karst carbonate reservoirs: Model and application in SHB oilfield. Pet. Sci. Eng. 2023, 220, 111167. [Google Scholar] [CrossRef]
- Yue, P.; Xie, Z.; Huang, S.; Liu, H.; Liang, S.; Chen, X. The application of N2 huff and puff for IOR in fracture-vuggy carbonate reservoir. Fuel 2018, 234, 1507–1517. [Google Scholar] [CrossRef]
- Qu, M.; Hou, J.; Qi, P.; Zhao, F.; Ma, S.; Churchwell, L.; Wang, Q.; Li, H.; Yang, T. Experimental study of fluid behaviors from water and nitrogen floods on a 3-D visual fractured-vuggy model. J. Pet. Sci. Eng. 2018, 166, 871–879. [Google Scholar] [CrossRef]
- Cheng, H.; Yuan, F.; Zhang, S.; Li, L.; Luo, X.; Chen, B. Investigation on Water Invasion Mode and Remaining Oil Utilization Rules of Fractured-Vuggy Reservoirs: A Case Study of the Intersection Region of S99 Unit in Tahe Oilfield. J. Process. 2023, 11, 1833. [Google Scholar] [CrossRef]
- Sun, Q.; Zhang, N.; Fadlelmula, M.; Wang, Y. Structural regeneration of fracture-vug network in naturally fractured vuggy reservoirs. J. Pet. Sci. Eng. 2018, 165, 28–41. [Google Scholar] [CrossRef]
- Jiao, F. Practice and knowledge of volumetric development of deep fractured-vuggy carbonate reservoirs in Tarim Basin, NW China. Pet. Explor. Dev. 2019, 46, 576–582. [Google Scholar] [CrossRef]
- Wang, J.; Liu, H.; Ning, Z.; Zhang, H.; Hong, C. Experiments on water flooding in fractured-vuggy cells in fractured-vuggy reservoirs. Pet. Explor. Dev. 2014, 41, 74–81. [Google Scholar] [CrossRef]
- Wang, J.; Liu, H.; Zhang, J.; Meng, Q.; Liu, H.; Ge, L.; Zhu, Z.; Liu, Z. Experimental investigation on water flooding and continued EOR techniques in buried-hill metamorphic fractured reservoirs. J. Pet. Sci. Eng. 2018, 171, 529–541. [Google Scholar] [CrossRef]
- Yue, P.; Xie, Z.; Liu, H.; Chen, X.; Guo, Z. Application of water injection curves for the dynamic analysis of fractured-vuggy carbonate reservoirs. J. Pet. Sci. Eng. 2018, 169, 220–229. [Google Scholar] [CrossRef]
- Zheng, S.; Yang, M.; Kang, Z.; Liu, Z.; Long, X.; Liu, K.; Li, X.; Zhang, S. Controlling factors of remaining oil distribution after water flooding and enhanced oil recovery methods for fracture-cavity carbonate reservoirs in Tahe Oilfield. Pet. Explor. Dev. 2019, 46, 786–795. [Google Scholar] [CrossRef]
- Xiao, Y.; Zhang, Z.; Jiang, T.; Cai, Z.; Deng, X.; Zhou, J. Dynamic and static combination method for fracture-vug unit division of fractured-vuggy reservoirs. Arab. J. Sci. Eng. 2018, 43, 2633–2640. [Google Scholar] [CrossRef]
- Yang, M.; Li, X.; Tan, T.; Li, Q.; Liu, H.; Zhang, Y. Remaining oil distribution and potential tapping measures for palaeo-subterranean river reservoirs: A case study of TK440 well area in Tahe Oilfield. Reserv. Eval. Dev. 2020, 10, 43–48. [Google Scholar]
- Lv, Q.; Zheng, R.; Zhou, T.; Guo, X.; Wang, W.; Li, J.; Liu, Z. Visualization study of CO2-EOR in carbonate reservoirs using 2.5 D heterogeneous micromodels for CCUS. Fuel 2022, 330, 125533. [Google Scholar] [CrossRef]
- Yang, Y.; Rong, G.; Xin, Y.; Song, Y.; Li, B. Visualization Experimental Investigation on Flow Regulation and Oil Displacement Characteristics of Gel Foam in Fractured-Vuggy Carbonate Reservoirs. ACS Omega 2024, 9, 40810–40820. [Google Scholar] [CrossRef]
- Zhang, C.; Gu, Z.; Li, P.; Xu, G.; Zhang, D.; Li, Z. Investigation on the condensate gas composition variation and wax deposition mechanism during temperature-induced phase transition process. J. Clean. Prod. 2024, 442, 141109. [Google Scholar] [CrossRef]
- Li, J.; Feng, Y.; Wang, J.; Xu, Z.; Li, B.; Zhang, C. Study on Formation and Migration Law of Foam in Fractures and Its Influencing Factors. ACS Omega 2024, 9, 24362–24371. [Google Scholar] [CrossRef]
- Zhang, C.; Yu, C.; Gu, Z.; Liu, K.; Wu, P.; Li, Z. Characterization and optimization of oil-gas interfacial tension during CO2/N2 injection in heavy oil reservoirs: Experimental study and regression model. Pet. Sci. 2025, 06, 24. [Google Scholar] [CrossRef]
- Hu, X.; Zheng, W.; Zhao, X.; Niu, B. Quantitative characterization of deep fault-karst carbonate reservoirs: A case study of the Yuejin block in the Tahe oilfield. Energy Geosci. 2023, 4, 100153. [Google Scholar] [CrossRef]
- Azizollah, K.; Anar, R.; Dmitry, I. The control of asphaltene precipitation in oil wells. Pet. Sci. Technol. 2018, 36, 443–449. [Google Scholar]
- Xu, Z.; Li, Z.; Cui, S.; Li, B.; Chen, D.; Zhang, Q.; Zheng, L.; Husein, M.M. Flow characteristics and EOR mechanism osf foam flooding in fractured vuggy reservoirs. J. Pet. Sci. Eng. 2022, 211, 110170. [Google Scholar] [CrossRef]
- Tang, H.; Juan, H.; Rong, Y.; Li, X. Study on water drive law and characteristics of remaining oil distribution of typical fault-karst in faultkarst reservoirs, Tahe Oilfield. Editor. Dep. Pet. Geol. Recovery Effic. 2018, 25, 95–100. [Google Scholar]
- Cao, L.; Sun, J.; Zhang, B.; Lu, N.; Xu, Y. Sensitivity analysis of the temperature profile changing law in the production string of a high-pressure high-temperature gas well considering the coupling relation among the gas flow friction, gas properties, temperature, and pressure. Front. Phys. 2022, 10, 1050229. [Google Scholar] [CrossRef]
- Wei, C.; Cheng, S.; Chen, G.; Shi, W.; Wu, J.; Wang, Y.; Yu, H. Parameters evaluation of fault-karst carbonate reservoirs with vertical beads-on-string structure based on bottom-hole pressure: Case studies in Shunbei Oilfield, Tarim Basin of Northwestern China. Oil Gas Sci. Technol. 2021, 76, 59. [Google Scholar] [CrossRef]
- Cao, L.; Sun, J.; Liu, J.; Liu, J. Experiment and Application of Wax Deposition in Dabei Deep Condensate Gas Wells with High Pressure. Energies 2022, 15, 6200. [Google Scholar] [CrossRef]
- Cheng, H. The Enhanced Oil Recovery Effect of Nitrogen-Assisted Gravity Drainage in Karst Reservoirs with Different Genesis: A Case Study of the Tahe Oilfield. Processes 2023, 11, 2316. [Google Scholar] [CrossRef]


| Unit | Associated Fracture-Vug System | Average Permeability/(mD) | Average Porosity/(%) | Average Production Oil Water Cut/(%) | Average Gas-to-Oil Ratio/(m3/m3) | Average Productivity Index (bbl/psi/Day) | Reservoir Rock Type | The Presence of a Gap Cap. |
|---|---|---|---|---|---|---|---|---|
| AD22 Unit | AD22 Well Cluster | 1526.38 | 17.93 | 52.26 | 66.24 | 4.39 | carbonate rock | Yes |
| TH12208 Well Cluster | 1824.74 | 15.84 | 42.09 | 70.25 | 1.96 | carbonate rock | Yes | |
| TH12201 Well Cluster | 1833.09 | 11.01 | 67.9 | 73.64 | 2.28 | carbonate rock | Yes | |
| TH12332 Well Cluster | 1806.17 | 13.64 | 36.7 | 45.93 | 2.12 | carbonate rock | No |
| Well Number | Acoustic Impedance/ (×107) | Well Number | Acoustic Impedance/ (×107) | Well Number | Acoustic Impedance/ (×107) |
|---|---|---|---|---|---|
| 1 | 1.33 | 13 | 1.36 | 25 | 1.33 |
| 2 | 1.41 | 14 | 1.39 | 26 | 1.45 |
| 3 | 1.36 | 15 | 1.36 | 27 | 1.38 |
| 4 | 1.39 | 16 | 1.35 | 28 | 1.43 |
| 5 | 1.31 | 17 | 1.23 | 29 | 1.38 |
| 6 | 1.44 | 18 | 1.32 | 30 | 1.47 |
| 7 | 1.36 | 19 | 1.40 | 31 | 1.46 |
| 8 | 1.35 | 20 | 1.51 | 32 | 1.42 |
| 9 | 1.41 | 21 | 1.42 | 33 | 1.51 |
| 10 | 1.30 | 22 | 1.53 | 34 | 1.48 |
| 11 | 1.49 | 23 | 1.41 | ||
| 12 | 1.38 | 24 | 1.38 |
| Unit | Associated Fracture–Vug System | Average Permeability/(mD) | Average Porosity/(%) | The Standard Deviation of Porosity in This Region and the Overall Porosity of the Reservoir/(%) | Reservoir Rock Type |
|---|---|---|---|---|---|
| AD22 Unit | AD22 Well Cluster | 1526.38 | 17.93 | 3.325 | carbonate rock |
| TH12208 Well Cluster | 1824.74 | 15.84 | 1.235 | carbonate rock | |
| TH12201 Well Cluster | 1833.09 | 11.01 | 3.595 | carbonate rock | |
| TH12332 Well Cluster | 1806.17 | 13.64 | 0.965 | carbonate rock |
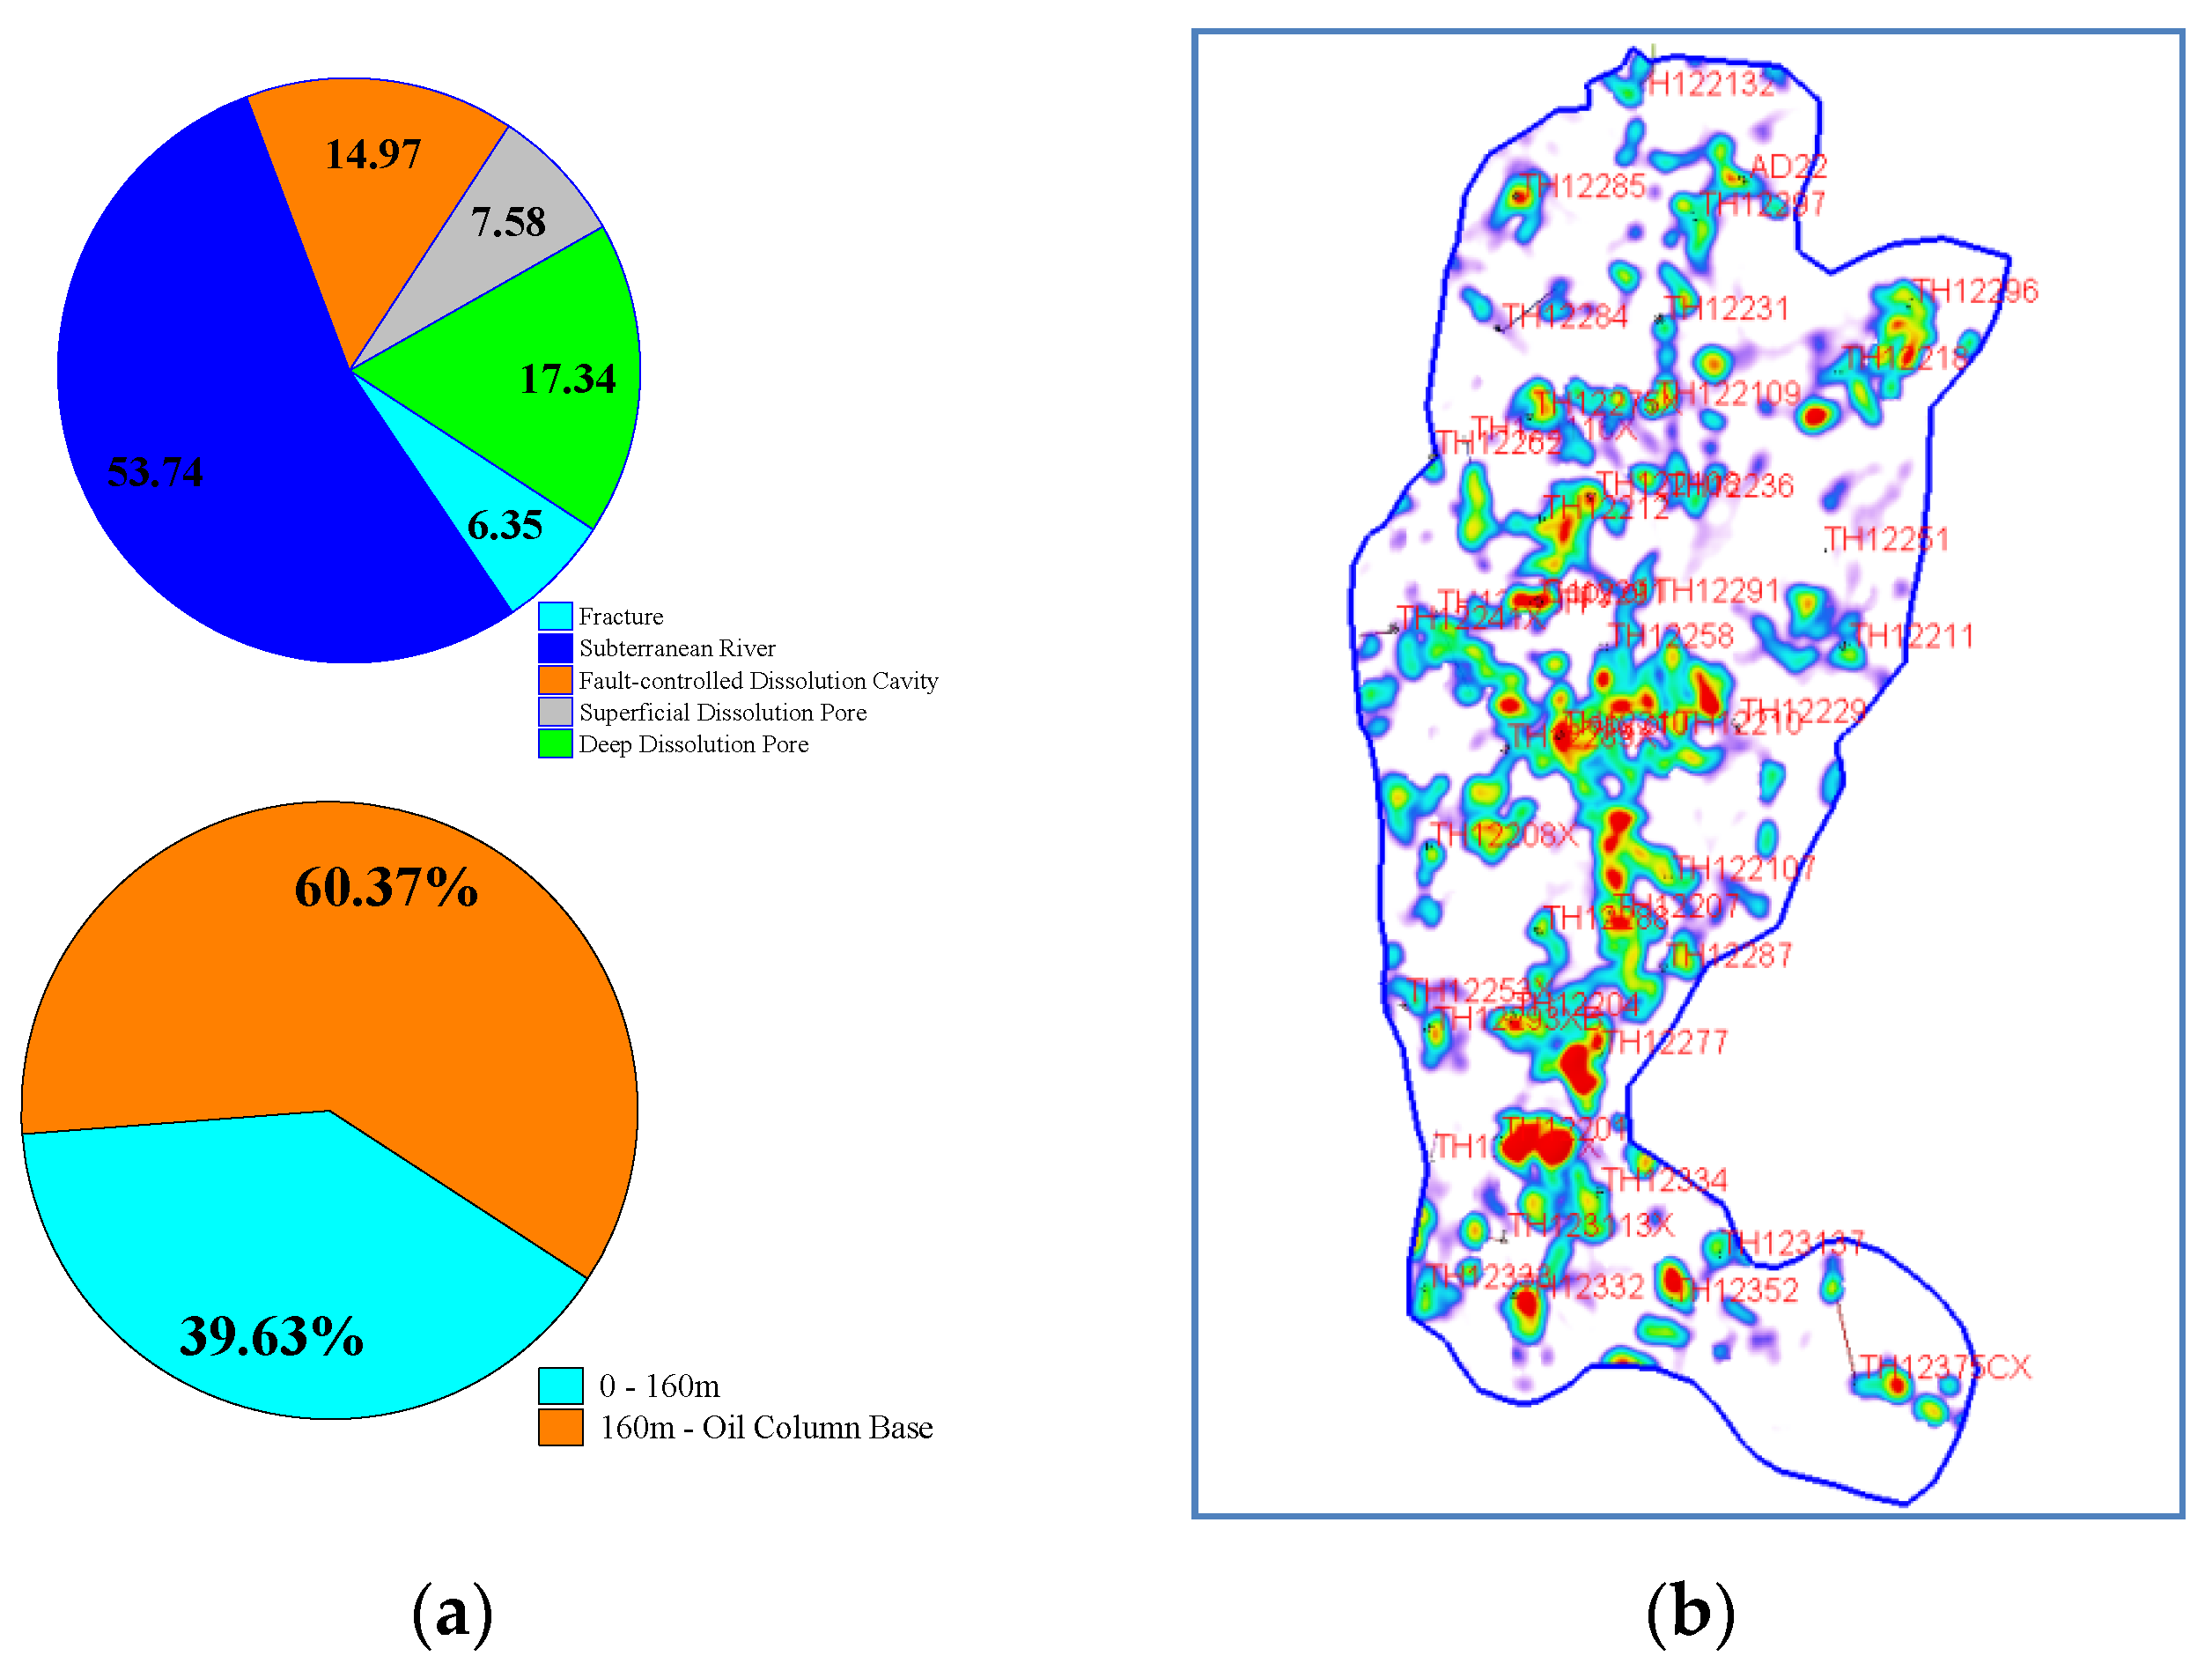
| Unit | Carved Body Volume 104 m3 | Porosity Volume 104 m3 | Geological Reserves (104 t) | Percentage (%) | |
|---|---|---|---|---|---|
| Total | 158,347 | 4069 | 3049.5 | ||
| By Type | Subterranean River | 7270 | 2187 | 1633.07 | 53.74 |
| Fault-controlled Cavities | 2012 | 610 | 454.80 | 14.97 | |
| Superficial Pores | 42,887 | 705 | 526.77 | 17.34 | |
| Deep Pores | 55,861 | 1013 | 230.28 | 7.58 | |
| Fractures | 93,204 | 259 | 192.86 | 6.35 | |
| By Depth | 0–160 m | 91,087 | 2457 | 1834.56 | 60.37 |
| 160 m—Oil Column Base | 67,260 | 1612 | 1204.17 | 39.63 | |
| Unit | Associated Fracture-Vug System | Well Count | Static Reserves | Dynamic Reserves | Production | Drainage Efficiency | Recovery Factor |
|---|---|---|---|---|---|---|---|
| 104 t | 104 t | 104 t | % | % | |||
| AD22Unit | AD22 Well Cluster | 14 | 943 | 873.5 | 108.3 | 92.6 | 11.5 |
| TH12208 Well Cluster | 10 | 910.5 | 824.5 | 113 | 90.6 | 12.4 | |
| TH12201 Well Cluster | 7 | 685 | 635 | 67.9 | 92.7 | 9.9 | |
| TH12332 Well Cluster | 12 | 511 | 261 | 36.7 | 51.1 | 7.2 | |
| Subtotal | 43 | 3049.5 | 2594 | 325.9 | 85.1 | 10.7 |
Disclaimer/Publisher’s Note: The statements, opinions and data contained in all publications are solely those of the individual author(s) and contributor(s) and not of MDPI and/or the editor(s). MDPI and/or the editor(s) disclaim responsibility for any injury to people or property resulting from any ideas, methods, instructions or products referred to in the content. |
© 2025 by the authors. Licensee MDPI, Basel, Switzerland. This article is an open access article distributed under the terms and conditions of the Creative Commons Attribution (CC BY) license (https://creativecommons.org/licenses/by/4.0/).
Share and Cite
Song, H.; Zhang, S.; Yuan, F.; Li, L.; Fu, Y.; Yu, C.; Zhang, C. Reservoir Dynamic Reserves Characterization and Model Development Based on Differential Processing Method: Differentiated Development Strategies for Reservoirs with Different Bottom Water Energies. Processes 2025, 13, 2053. https://doi.org/10.3390/pr13072053
Song H, Zhang S, Yuan F, Li L, Fu Y, Yu C, Zhang C. Reservoir Dynamic Reserves Characterization and Model Development Based on Differential Processing Method: Differentiated Development Strategies for Reservoirs with Different Bottom Water Energies. Processes. 2025; 13(7):2053. https://doi.org/10.3390/pr13072053
Chicago/Turabian StyleSong, Hongwei, Shiliang Zhang, Feiyu Yuan, Lu Li, Yafei Fu, Chao Yu, and Chao Zhang. 2025. "Reservoir Dynamic Reserves Characterization and Model Development Based on Differential Processing Method: Differentiated Development Strategies for Reservoirs with Different Bottom Water Energies" Processes 13, no. 7: 2053. https://doi.org/10.3390/pr13072053
APA StyleSong, H., Zhang, S., Yuan, F., Li, L., Fu, Y., Yu, C., & Zhang, C. (2025). Reservoir Dynamic Reserves Characterization and Model Development Based on Differential Processing Method: Differentiated Development Strategies for Reservoirs with Different Bottom Water Energies. Processes, 13(7), 2053. https://doi.org/10.3390/pr13072053