Article

The Conductivity of Combined Acid and Hydraulic Fracturing in the Fractured Tight Sandstone Reservoir: An Experimental Study

1
Petrochina Tarim Oilfield Company, Korla 841000, China
2
R&D Center for Ultra-Deep Complex Reservoir Exploration and Development, China National Petroleum Corporation (CNPC), Korla 841000, China
3
Engineering Research Center for Ultra-Deep Complex Reservoir Exploration and Development, Korla 841000, China
4
State Key Laboratory of Oil and Gas Reservoir Geology and Exploitation, Southwest Petroleum University, Chengdu 610500, China
*
Author to whom correspondence should be addressed.
Processes 2025, 13(7), 2039; https://doi.org/10.3390/pr13072039
Submission received: 21 March 2025 / Revised: 26 April 2025 / Accepted: 24 June 2025 / Published: 27 June 2025
(This article belongs to the Section Energy Systems)

Abstract

In fractured tight sandstone reservoirs characterized by high calcium content, the composite stimulation technique that combines acid fracturing and hydraulic fracturing could show great production-enhancing capabilities. Nevertheless, the mechanisms of this composite technique remain unclear, and the field applications exhibit variability. Therefore, this study carried out fracture conductivity experiments, simulating different stimulation technologies to explore the influence of these techniques on the conductivity of artificial fractures, natural fractures, and reservoir fracture systems. The results indicate that composite stimulation enhances the conductivity of artificial fractures, natural fractures, and fracture networks. For artificial fractures, composite stimulation increases the conductivity to 2.5 times as much as that of sand-supported fractures at a sand concentration of 2 kg/m2. For natural fractures, after acid dissolution, the maximum sand concentration of 70/140 mesh proppants reaches 2 kg/m2, maintaining a conductivity of 4.2 D·cm under 40 MPa closure stress, while the conductivity of acid-etched fractures without proppant nearly vanishes. For fracture networks, when the sand concentration increases to 4 kg/m2, the conductivity reaches 3.5 times that at 2 kg/m2 and 2.8 times that of sand fracturing followed by acidizing. This study can provide guidance for the composite technique design in fractured tight sandstone reservoirs with high calcium content.

1. Introduction

1.1. Field Background

The BZ-DB area is the main gas-producing tight-sandstone reservoir in the Tarim Oilfield with a burial depth of 4500–8200 m, a temperature range of 120–190 °C, and formation pressures of 100–140 MPa [1]. The average porosity and permeability of reservoir rock are 7.3% and 0.855 mD, respectively [2]. Thus, it belongs to a typical high-temperature fractured tight sandstone reservoir, which can also be reflected by the well logging curve of a typical well shown in Figure 1 [3,4]. This type of reservoir is usually stimulated by hydraulic fracturing [5,6], but the enhancing effect of this technique in some wells is suboptimal. Due to the high calcium content in the reservoir (6–10%) and the existence of calcium-filled or semi-calcium-filled fractures, the composite stimulation technique that combines acid fracturing and hydraulic fracturing was adopted to improve the fracture conductivity. However, the mechanism and applicability of this technique are still unclear, so the application effect in different reservoirs varies greatly.

1.2. Application of Acid in Sandstone Reservoirs

For the application of acid in sandstone reservoirs, most cases are aimed at eliminating reservoir damage and utilizing the reactivity of acid to enhance the conductivity of fractures, which is the same as the production increase mechanism of limestone by acid fracturing [7,8]. Through the examples of four wells, Gunawan proved that matrix acidification after fracturing can relieve the near-well damage and react with the rocks at the fracture surface to form conductive channels [9]. Rafael and Dmitriy focused on the damage caused by a large amount of working fluid leak-off in fractured high-permeability sandstone reservoirs (buried depth of 1800–2300 m, rock permeability of 20–200 mD), and used acid to bypass the damage. Then, proppants were pumped to support the fracture to triple production [10,11]. Organic mud acid was used to create branch fractures in the area without water intrusion, which promoted the communication between artificial fractures and the reservoir. At the same time, the acid dissolved the clay to reduce its swelling and improve, or even double, the production [12]. Zhao proves that acid in fracturing of tight sandstone reservoirs can make the morphology of fractures more complex, and acid could make the hydraulic fracture surface rougher, thereby improving fracture conductivity through a large physical model experiment [13]. Kishorekumar used acid in a tight sandstone reservoir (porosity of 8–12%, permeability of 0.08–0.6 mD) in the Mandapeta field in India to enhance wellbore, enabling more proppant to support fractures, thereby improving fracture conductivity [14]. These studies demonstrate that acid could provide a positive impact on the stimulation of tight sandstone reservoirs. However, the impact of the combination of acid and proppant on natural fractures is ignored in these studies, and these fractures provide effective space and seepage channels and is a key factor in the development of tight sandstone reservoirs [15,16]. In addition, Oya Karazincir proved that acid could dissolve mineral particles to relieve pore blockage, but the permeability of acid-etched rock would decrease faster with pressure through experiments. Acid will reduce the mechanical strength of the fracture surface, resulting in the proppant embedment and the fracture conductivity decreasing [17]. This phenomenon shows that the application of acid in sandstone reservoirs is not all positive. Therefore, in this study, based on the fractured tight sandstone reservoir with high calcium content in BZ-DB zone, the conductivity test experiments of artificial fractures and natural fractures with different stimulation techniques were carried out, and the mechanism and differences of the composite stimulation technique to improve production in the reservoirs with varying calcium content were clarified from the fracture conductivity, to provide guidance for the application of the composite stimulation technique in the BZ-DB zone.

2. Experimental Design

2.1. Experimental Device

In the experiment, an API (178 mm × 38 mm × 50 mm) acid etching experimental device (Figure 2a) was used to simulate the acid etching process in artificial main fractures, and a fracture conductivity test device (Figure 2b) was used to test the fracture conductivity. A plunger rock sample (25 mm × 50 mm) acid displacement device (Figure 2c) was used to simulate the acid etching in small-scale natural fractures and test the natural fracture conductivity. Finally, a 3D laser scanning device (Figure 2d) was used to obtain acid fracture morphology.

2.2. Experimental Material

(1)
Rock sample
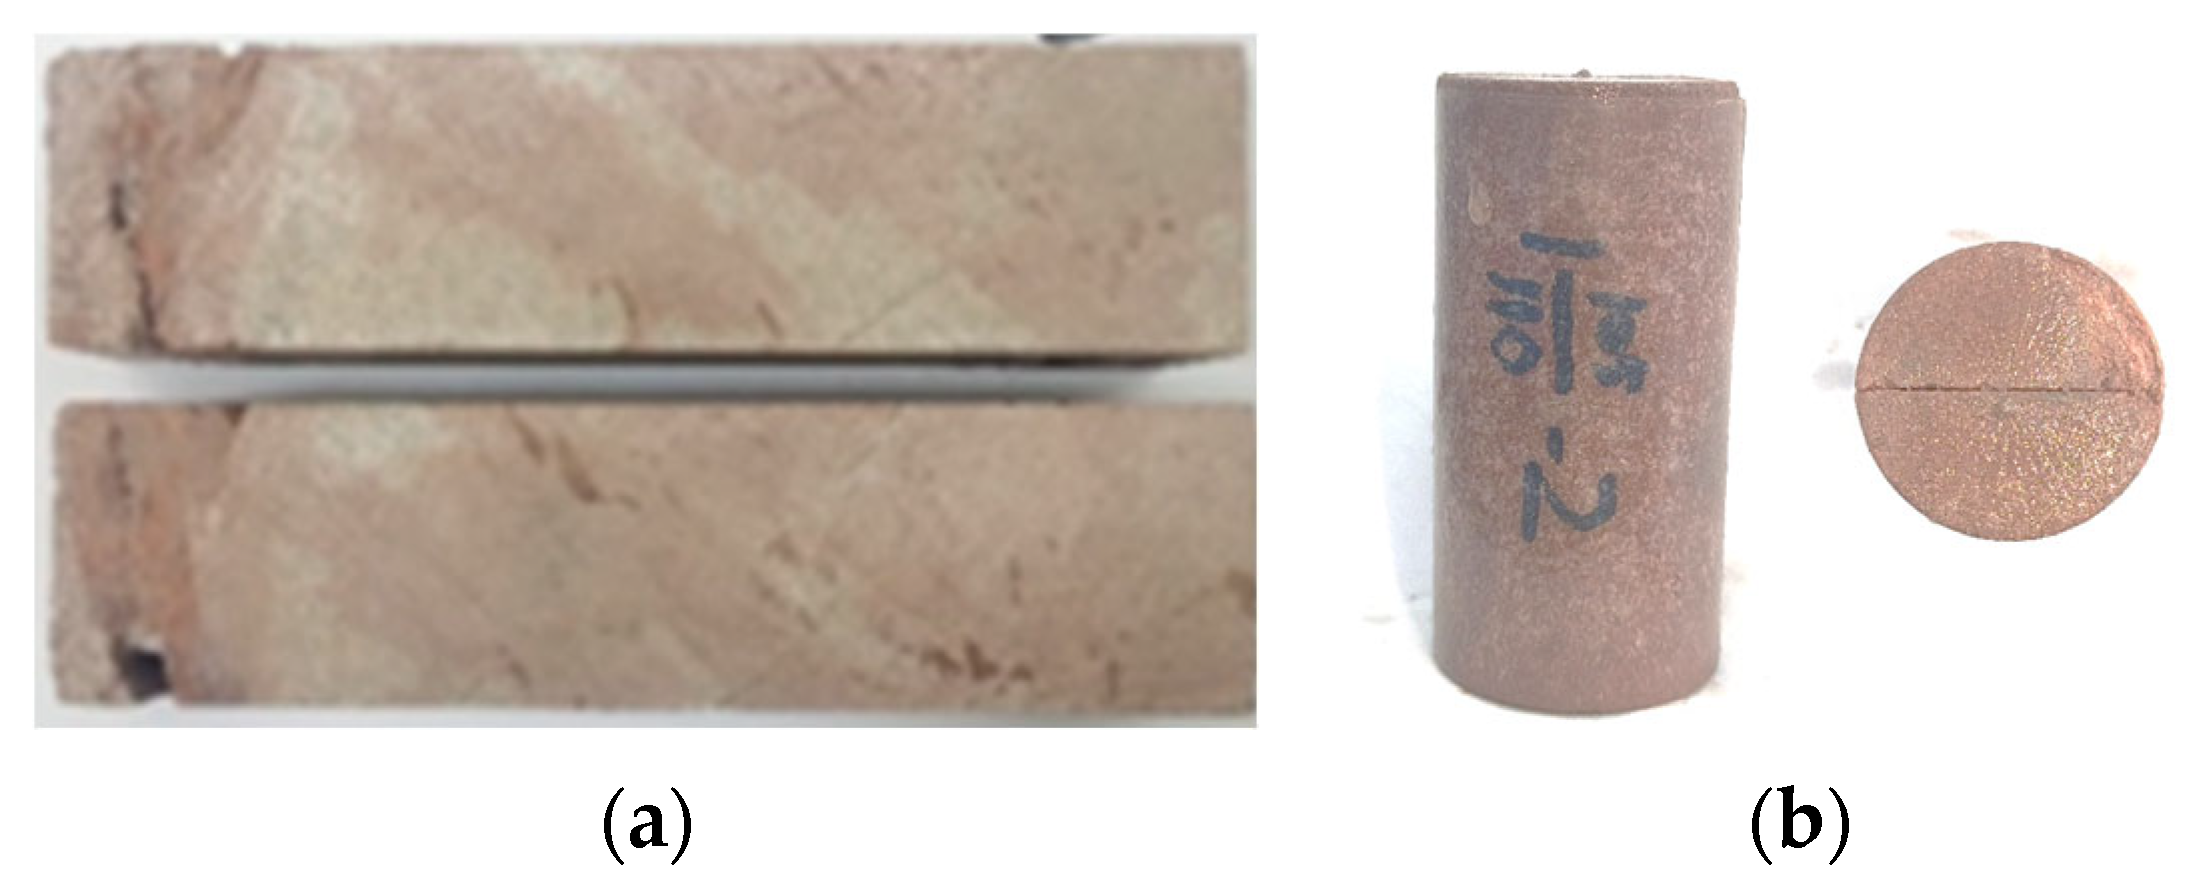
The downhole core was machined into 140 mm × 38 mm × 50 mm slabs (Figure 3a) and 50 mm × 25 mm plunger pillars (Figure 3b). The rock samples of two sizes were divided into two parts and overlapped along the section to simulate the fracture. To prevent the fracture of the rock slab during the splitting process, the rock slab was cut into two smooth rock slabs. The smaller size of the plunger core is more likely to remain intact, so the Brazilian splitting method was used to create rough fractures. The mineral composition of the underground core is shown in Table 1. The rock samples, in addition to the common minerals of sandstone, also contained calcite in varying amounts.
(2)
Proppant
The proppants used in the experiment were 40/70 mesh and 70/140 mesh ceramsite proppants used in the field (Petrochina Tarim Oilfield Company, Korla, China).
(3)
Liquid material
Hydrochloric acid, mud acid, and fracturing fluid used in the field were used in the experiment. The liquid formula is shown in Table 2.

2.3. Experimental Method and Scheme

2.3.1. Experimental Method

(1)
Stimulation techniques in artificial fractures
1.
Acid fracturing
Firstly, the image of the fracture surface before the acid etching is recorded. The slabs are then sealed with an epoxy resin, and the two slabs are separated to ensure that the acid only contacts the fracture surface. Then, the two slabs are superimposed and sealed in the rock slab holder of the acid etching experimental device (Figure 2a), and the temperature of the holder is raised to the temperature at the fracture entrance in the reservoir to simulate the acid–rock reaction in the high-temperature sealed reservoir. After acid etching, a 3D laser scanning device (Figure 2c) is used to obtain the morphology of the acid-etched fracture. Finally, the acid-etched rock slab is sealed in the fracture conductivity test device (Figure 2d). The hydraulic press is used to continuously raise the pressure on the fracture surface to closure pressure in the reservoir, and the conductivity under different closure pressures is calculated by Formula (1) [19].
K f w = 5.555 μ Q Δ p
where Kfw is fracture conductivity, D·cm; μ is the fluid viscosity, mPa·s; Δp is the pressure difference between the entrance and exit of the fracture, kPa; Q is the water injected rate, cm3/min.
2.
Acid and sand support composite stimulation technique
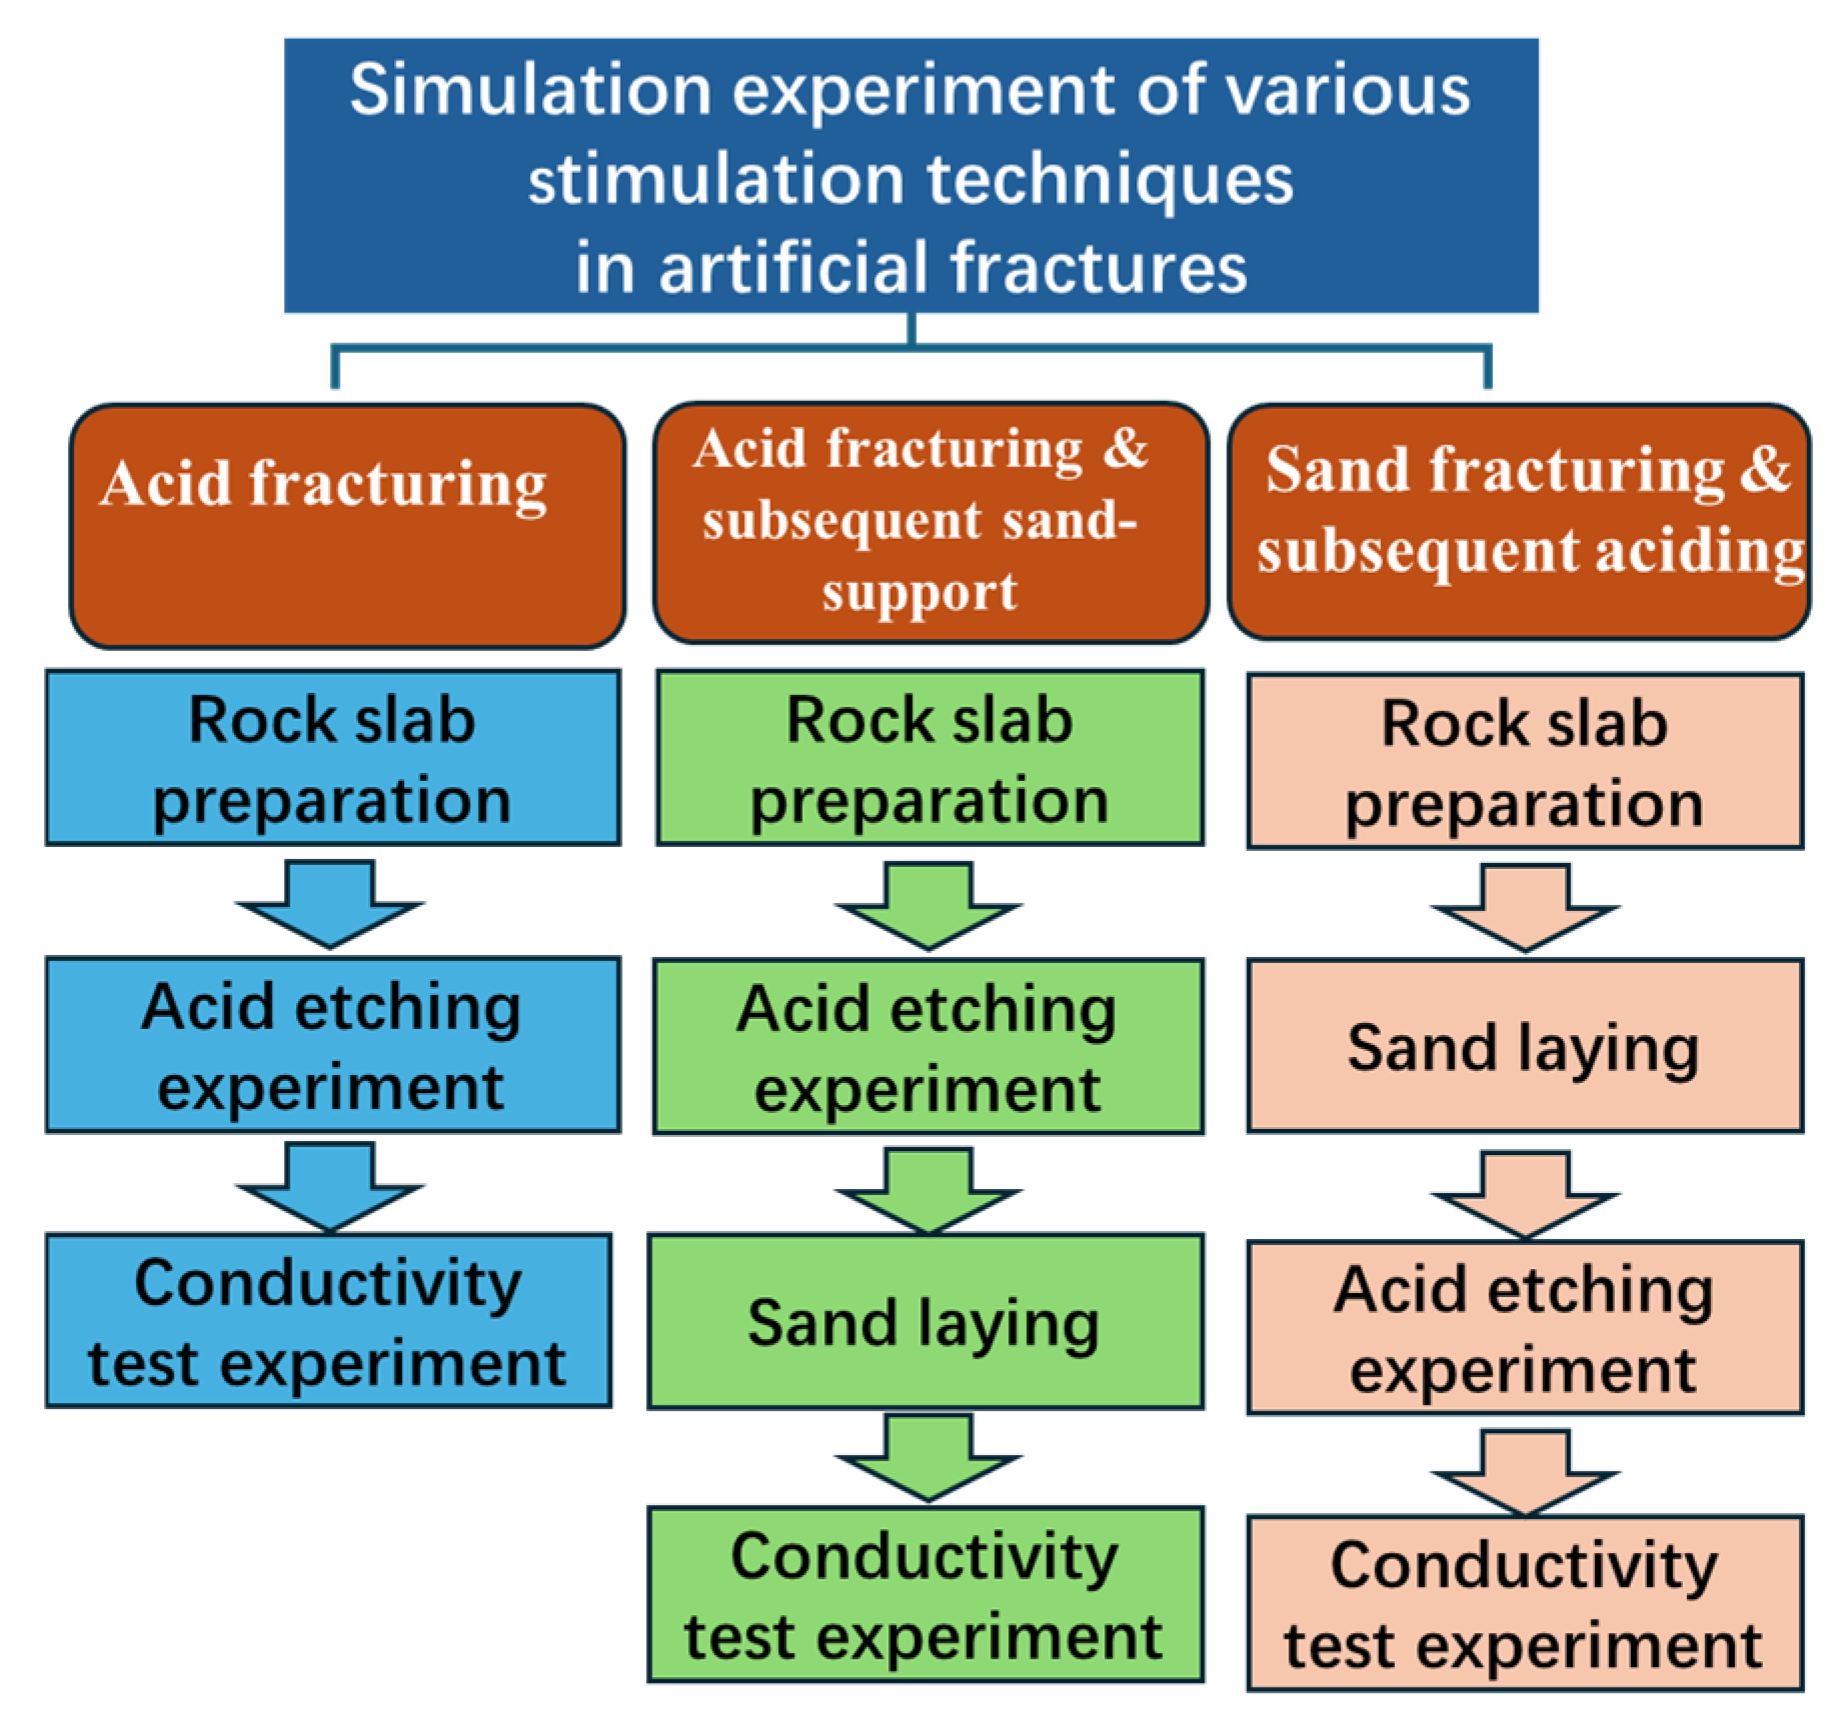
Firstly, the proppant is soaked in the fracturing fluid at the experimental temperature for 2h to simulate the wrapped state in the sand-carrying fluid. Then, the simulation experiments of acid fracturing and subsequent sand-support, as well as sand fracturing and subsequent acidizing, are carried out, respectively. The experimental methods of the two composite stimulation techniques are as follows (Figure 4):
A. Acid fracturing and subsequent sand support
After the acid etching experiment, the acid-etched rock slab is placed in the holder of the fracture conductivity test device (Figure 2d). The proppant soaked in fracturing fluid is then evenly laid in the middle of the two slabs. Then, the fracture conductivity is tested by the device.
B. Sand fracturing and subsequent acidizing
Before the acid etching experiment, the proppant, soaked in fracturing fluid, is evenly laid in the middle of the two rock slabs and is sealed with epoxy resin. Then, the inlet and outlet of the fracture are blocked with a sieve mesh with small holes to prevent the proppant from being washed out by the acid. After sealing the slabs in the holder, the same steps as in (1) are followed to stimulate the acid flowing through the sand-filled fracture. Finally, the acid-etched slab is placed in the fracture conductivity test device, and the proppant in the acid-etched fracture is laid in the fracture according to the method described in (2) A to test the fracture conductivity.
(2)
Acid etching simulation experiment in natural fractures
The rough natural fracture surface elevation data before acidizing are obtained using a 3D laser scanner (Figure 2c), and the axial surface of the plunger core is sealed to ensure that the acid only contacts the fracture. Then, the core is placed in the holder of the plunger rock sample acid displacement device (Figure 2b). Water is then injected into the ring inside the holder to make the ring fit tightly to the core, preventing acid flow through the gap between the core and the ring. After the acid etching experiment, the water is used to flush the acid into the fracture and pipelines, and the conductivity of the acid-etched fractures is tested according to Formula (2) [20]. The simulation procedure of the two composite stimulation techniques in natural fractures is similar to that in the artificial fracture.
K w f = q μ L D Δ p
where Kwf is fracture conductivity, D·cm; q is the pumping rate of the test fluid displacement, mL/s; μ is the fluid viscosity, mPa·s; l is the core length, cm; D is the core diameter, cm; Δp is the pressure difference between the entrance and exit of the fracture, atm.

2.3.2. Experimental Scheme

(1)
Artificial fractures
The initial width of the artificial fracture is set at 2 mm, and the acid pumping rate in the artificial fracture at experimental scale is calculated as 132 mL/min (Table 3) by Formula (3) [18]. The experimental temperature is 90 °C, which is set as the temperature when the acid reaches the fracture entrance in the reservoir. The acid pumping time is set as 30 min. After conducting mineral composition tests on multiple downhole slabs to determine the reservoir mineralogy, rock slabs with varying calcite contents are selected to investigate the effect of calcium content on fracture conductivity. Meanwhile, rock slabs with similar calcium contents are chosen to study the influence of stimulation techniques on fracture conductivity. Due to the random distribution of the calcium in the reservoir, rock slabs with different calcium content are adopted to simulate the acid etching process in different zones. At the same time, based on the different acid fracture widths, conductivity experiments are carried out to test the fractures with different sand concentrations. The experimental scheme is shown in Table 4.
q l = q f h l 2 h f w f w l 2 n 2 2 n × 10 6
where wf is the artificial fracture width in the formation, m; qf is the engineering scale acid pumping rate, m3/min; hf is the artificial fracture height, m; wl is the artificial fracture width at experimental scale, m; ql is the acid pumping rate at laboratory scale, mL/min; hl is the rock slab width, m; n is the flow index, no dimension.
(2)
Natural fractures
It is assumed that natural fractures filled with calcium cannot be activated by hydraulic fracturing, but they can be activated by acid. The average natural fracture width of the reservoir, which is 0.12 mm, is converted into the experimental natural fracture width of 0.2 mm using Formula (4) [21] (Table 5). The acid pumping rate is calculated to be 48 mL/min using Formula (5) [21] (Table 6). In addition, the experimental temperature is also set at 90 °C, and the acid pumping time is set to 30 min. The experimental scheme is shown in Table 7
w l n = w 0 + Δ p n k n
where wln is the experimental width of the natural fracture, mm; w0 is the natural fracture width in the reservoir, mm; kn is the normal stiffness of the fracture, MPa/mm; and ΔPn is the fluid pressure difference acting on the fracture surface, MPa.
q f w 0 L 0 ρ f H × 10 6 = q ln w l n D
where H is the thickness of the reservoir, m; qf is the fluid displacement, m3/min; w0 is the width of the natural fracture, m; L0 is the length of the fracture, m; ρf is the density of the natural fracture, in m−1; D is the height of the experimental fracture, m; wln is the width of the natural fracture in the experiment, m; qln is the acid fluid displacement of the natural fracture in the experiment, mL/min.

3. Results and Discussion

3.1. Artificial Fractures

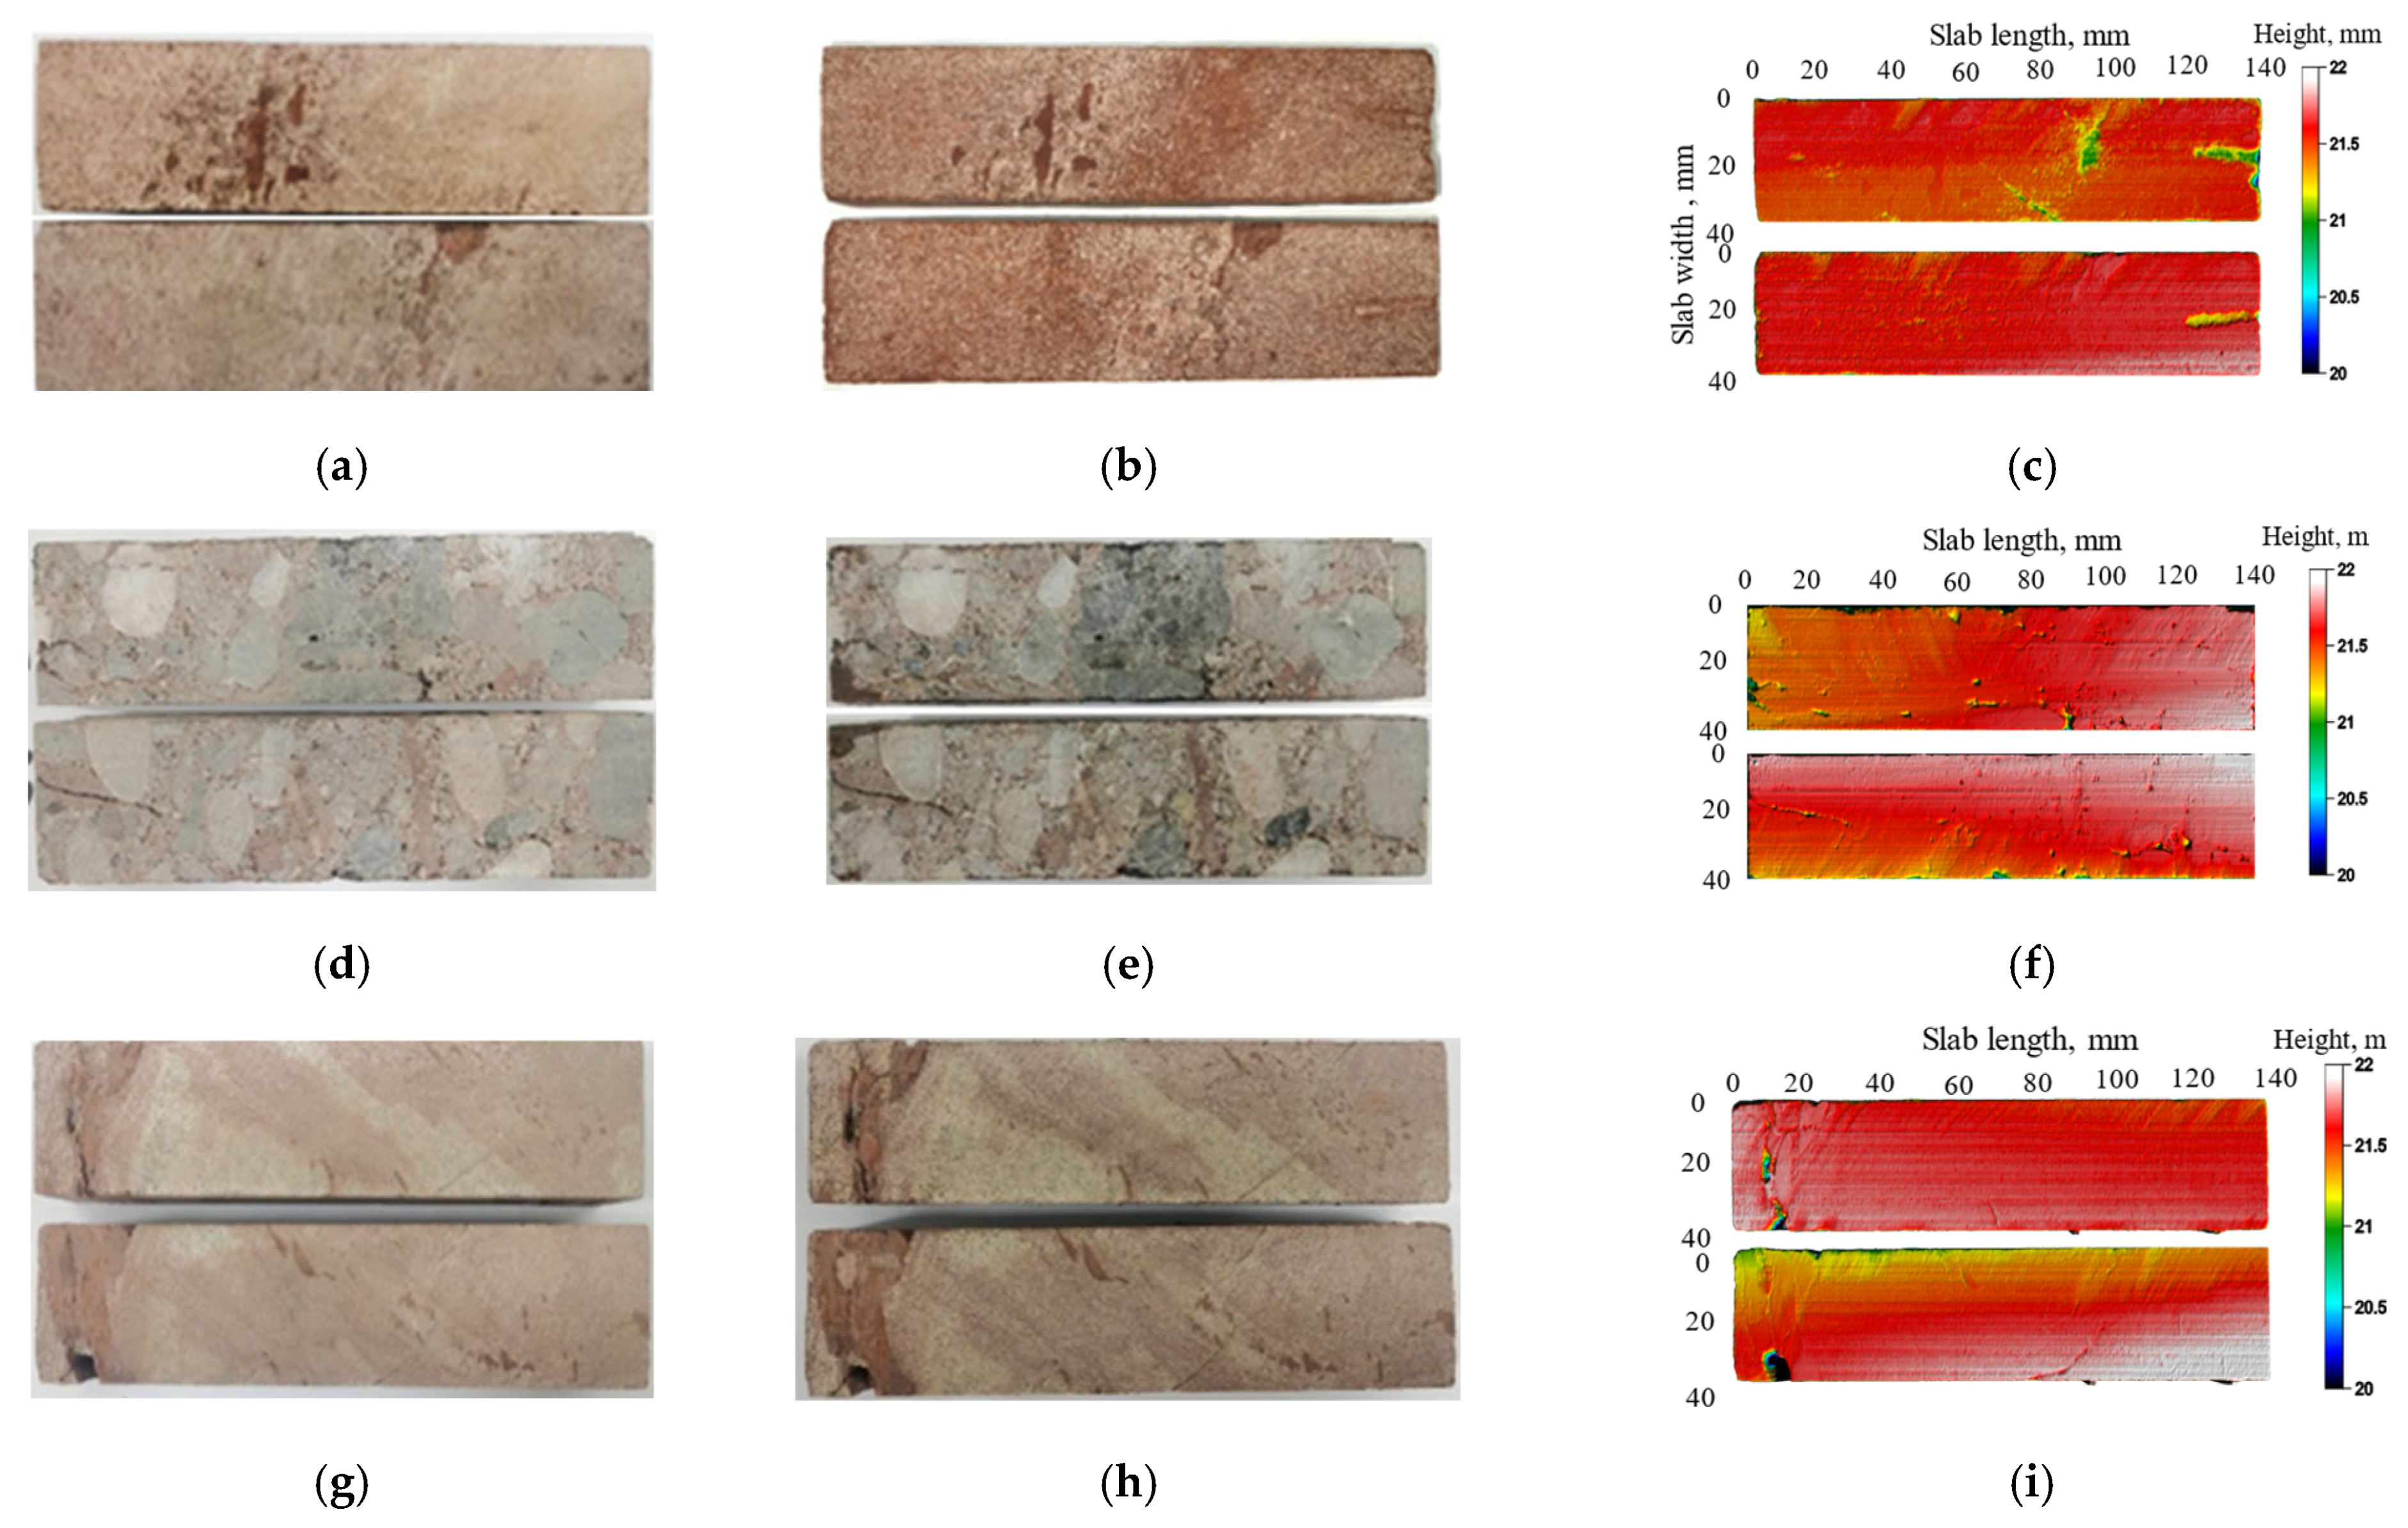
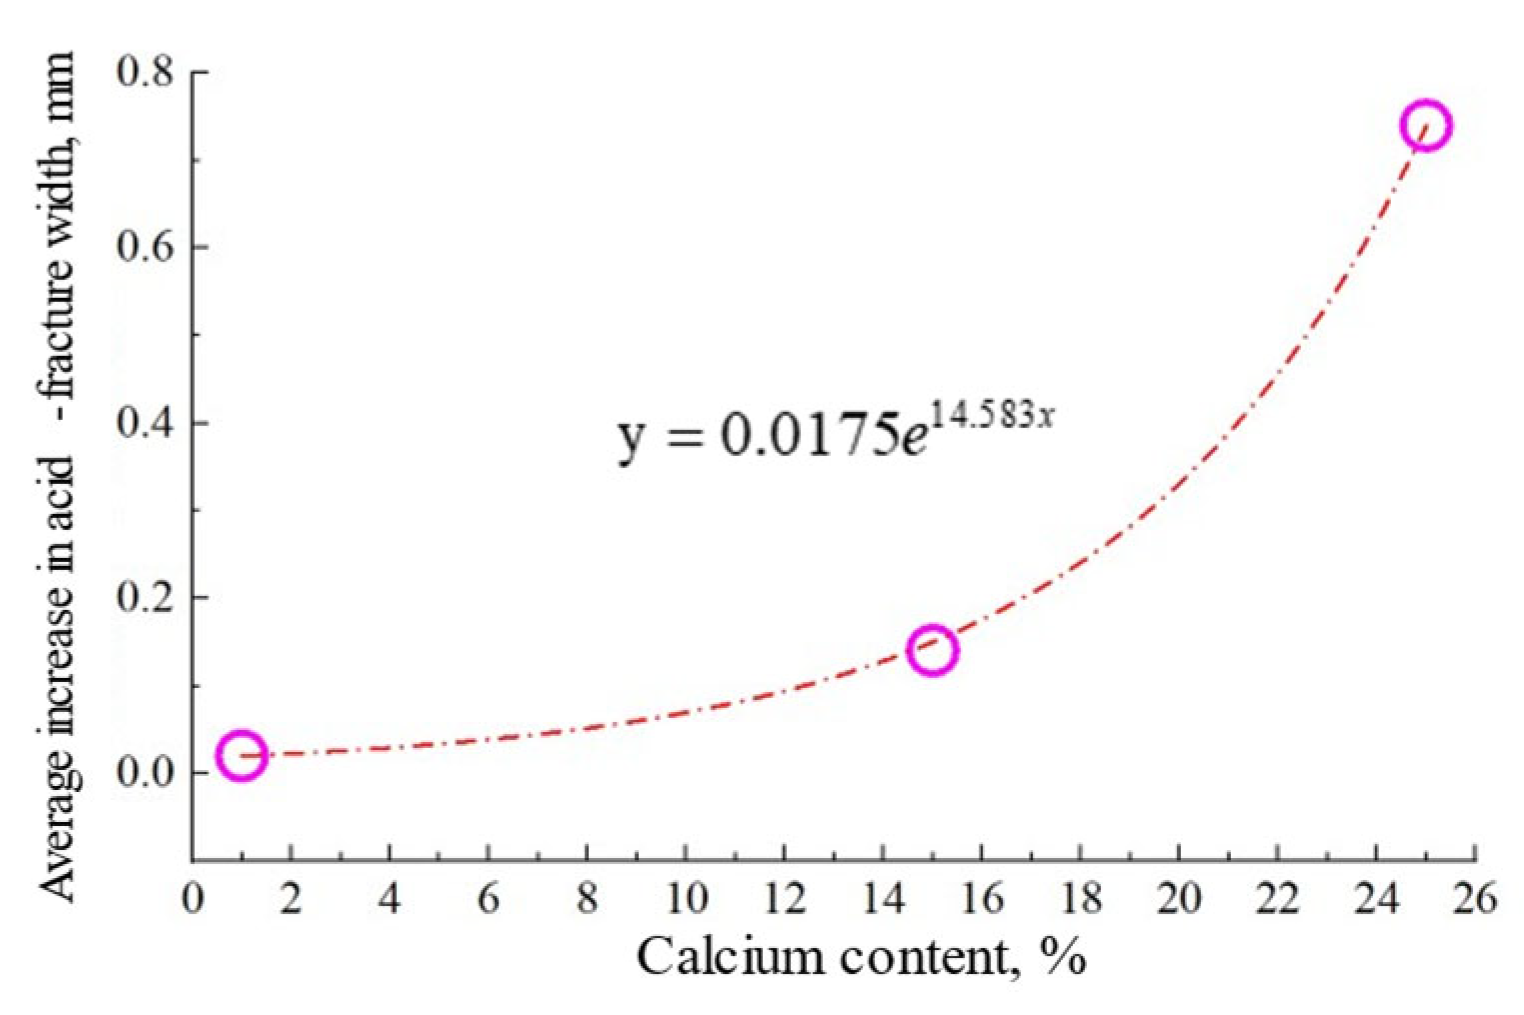
The fracture morphology of slab #1 with the calcium content of 25.4% is relatively uniform after acid etching, forming a distinct groove (Figure 5a–c). The number of acid-etched holes in slab #2 with the calcium content of 14.7% increases (Figure 5d–f), and there is little change in slab #3 with a calcium content of 0.7% (Figure 5g–i). The fracture width after acid etching was tested, and the width is as follows: slab #1, slab #2, and slab #3 in order from the largest to the smallest. The width increment increased exponentially with calcium content, as shown in Figure 6 and Equation (6). When the calcium content is 25.4%, the maximum average width of acid-etched fractures is 2.7 mm, and the maximum sand concentration of 40/70 ceramic proppant can reach 5 kg/m2. According to Formula (6), the average sand concentration of 40/70 ceramsite proppant can reach 4 kg/m2 in the reservoir with 6–8% calcium content.
y = 0.0175 e 14.583 x
where y is the increment of acid-fracture width, mm; x is the calcium content of the rock, %.
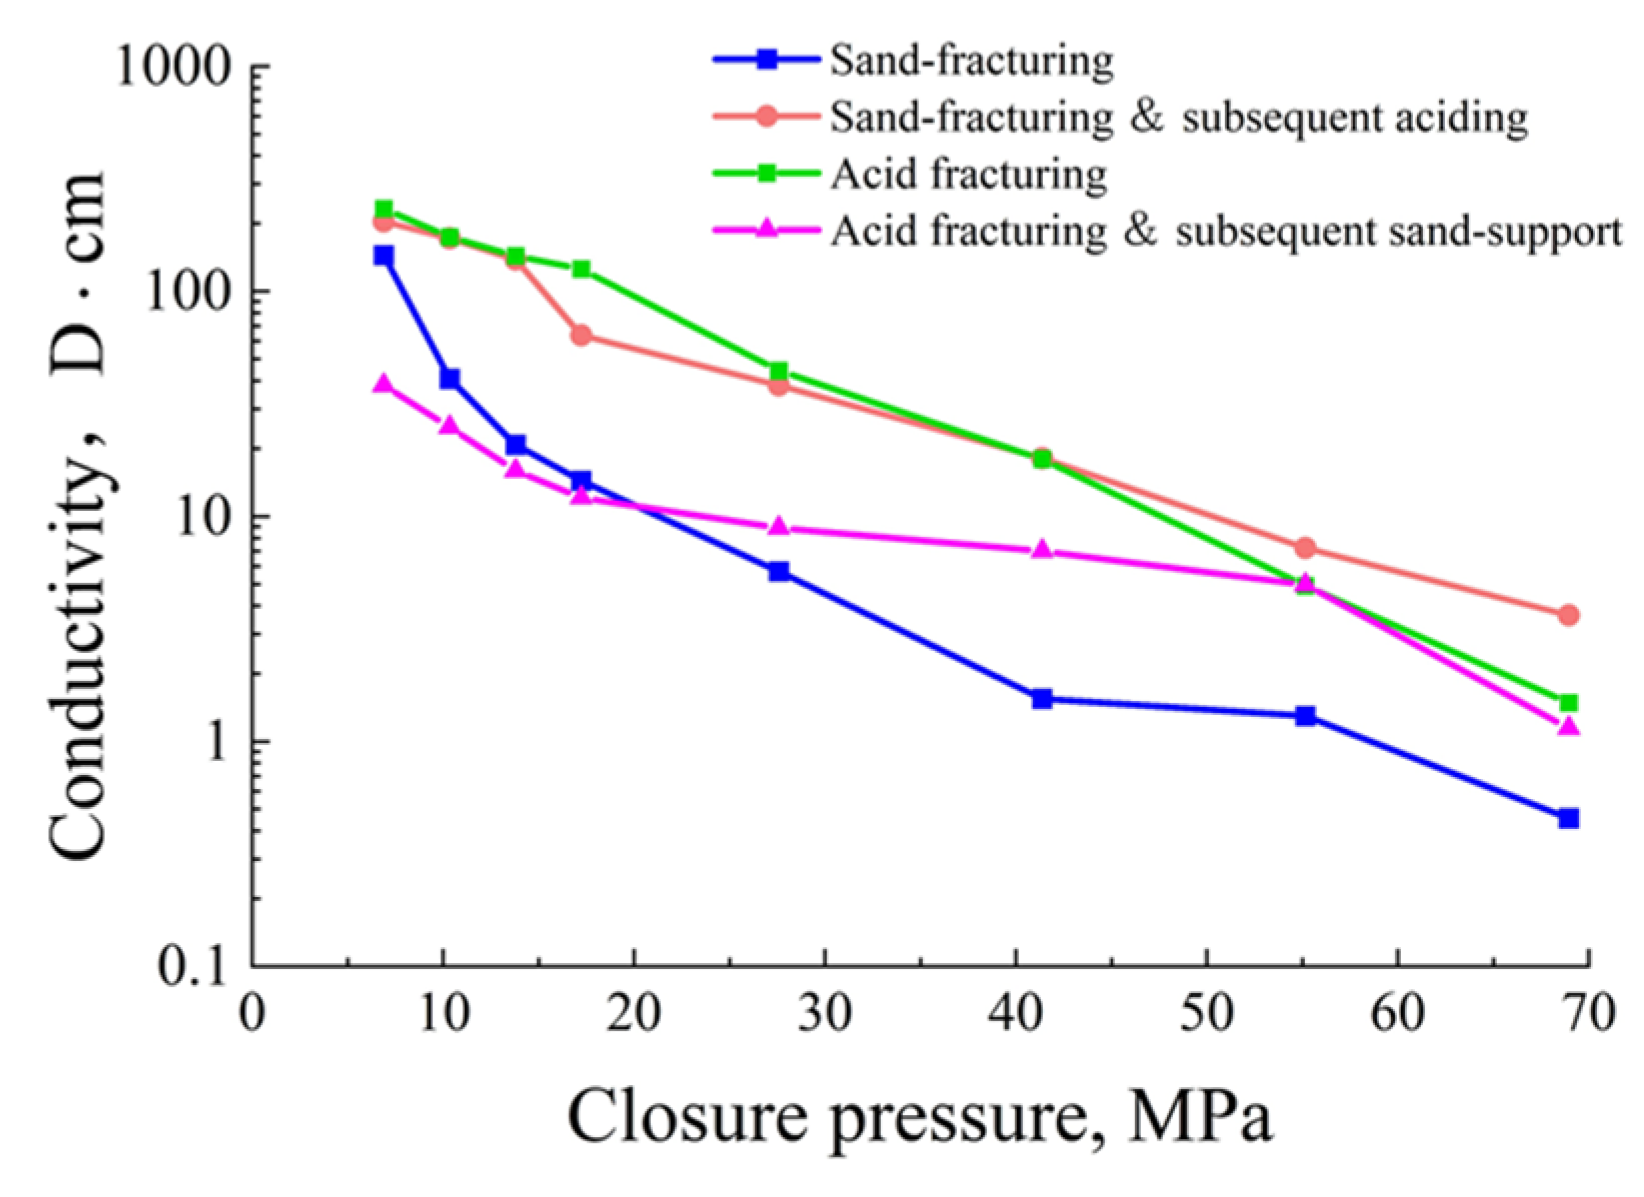
An average sand concentration in the oilfield of 2 kg/m2 was adopted in the experiment. Acid fracturing fractures have an advantage when the closure pressure is lower than 40 MPa, but the fracture conductivity of the sand fracturing and subsequent acidizing is the highest, which is 7.5 times that of acid fractures and 8 times that of the sand-supported fractures, as the same concentration when the closure pressure exceeds 40 MPa (Figure 7). However, the fracture conductivity of the composite stimulation of acid fracturing and subsequent sand support is only 0.3 times that of the sand fracturing and subsequent acidizing.
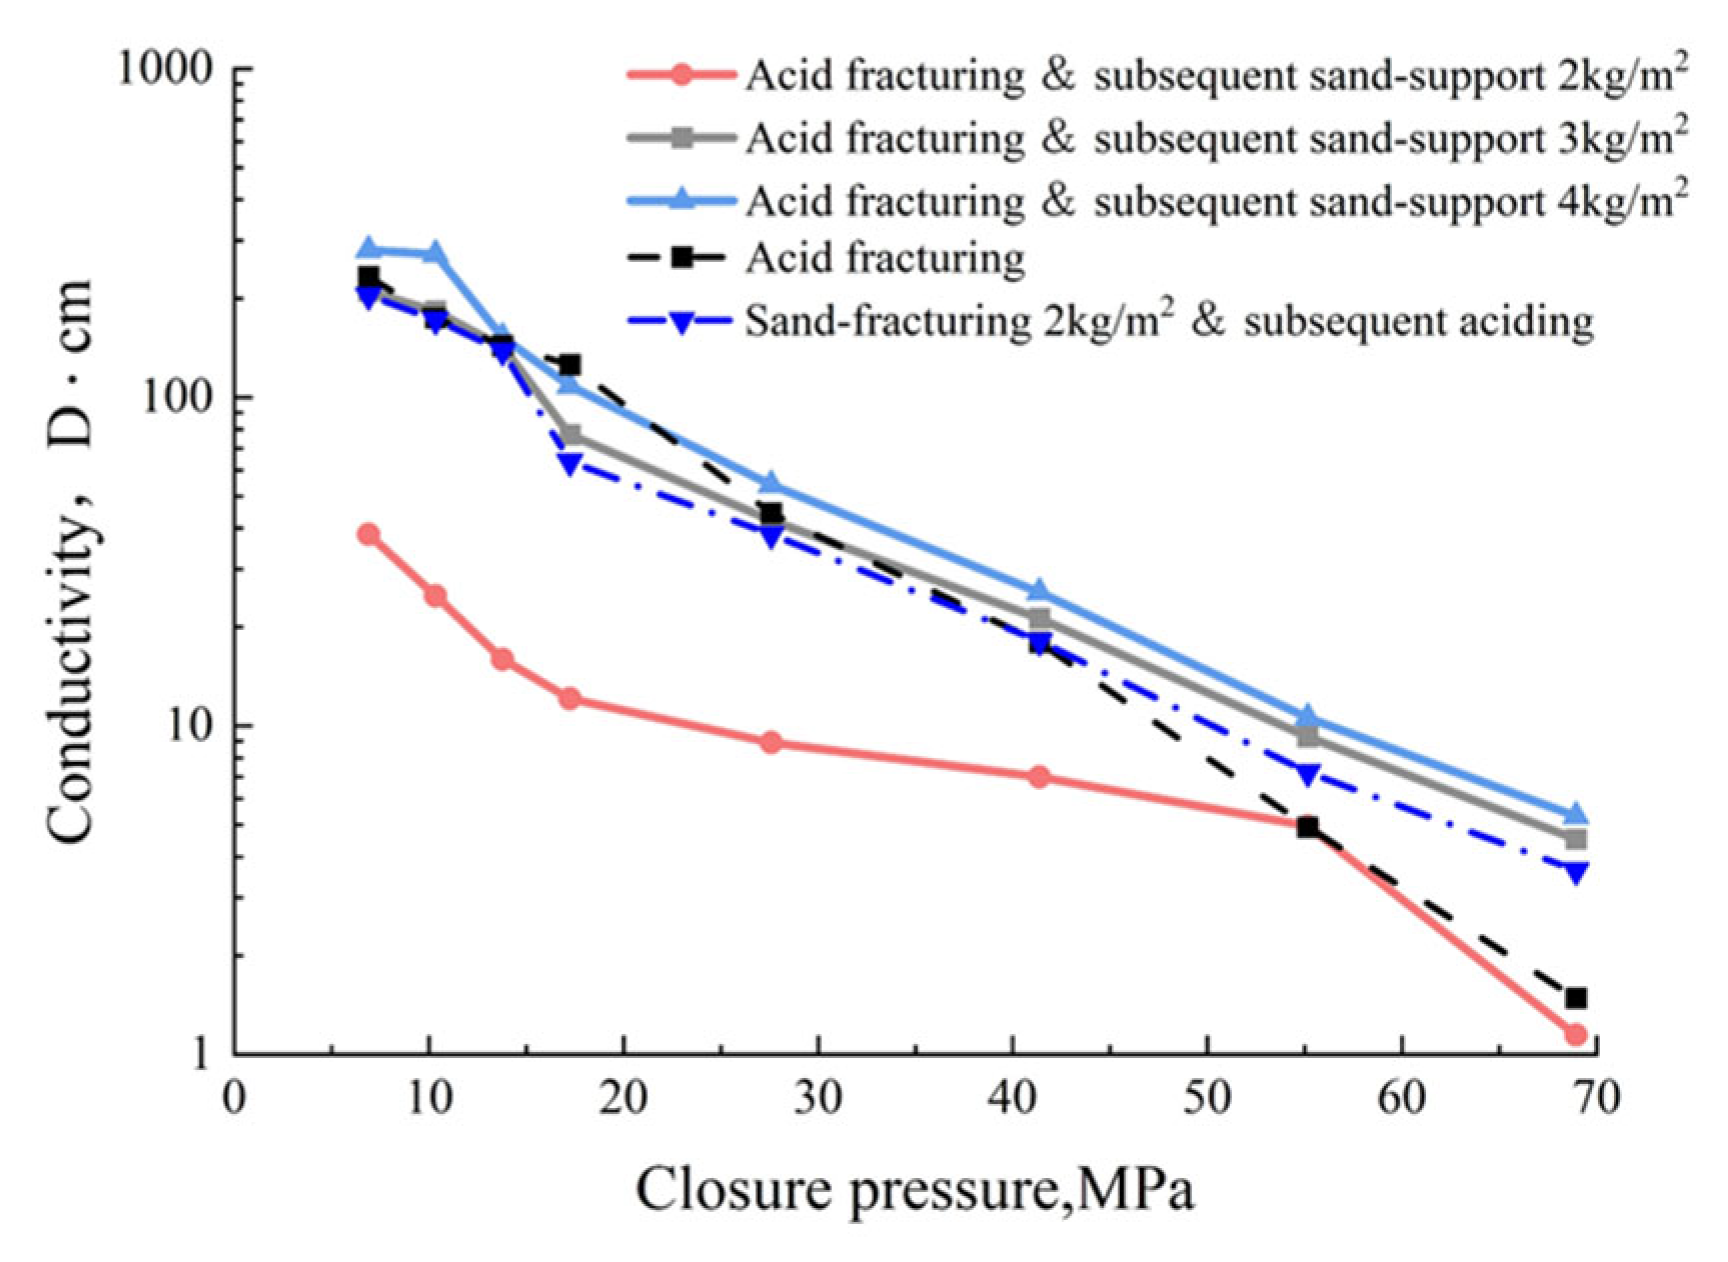
It can be known from Equation (5) that the sand placement concentration of the artificial fractures after acid fracturing can reach 4 kg/m2. However, the sand fracturing and subsequent acidizing cannot increase the fracture width before sand placement, so the sand concentration remains at 2 kg/m2. The fracture conductivity of the acid fracturing and subsequent sand support increases with the increase in sand concentration under 70 MPa (Figure 8). When the sand concentration reaches 3 kg/m2, the fracture conductivity exceeds that of the fractures in the sand fracturing and subsequent acidizing. When the sand concentration reaches 4 kg/m2, the fracture conductivity is 1.3 times that of the fractures in the sand fracturing and subsequent acidizing. Obviously, acid fracturing and subsequent sand support can provide higher fracture conductivity, which is consistent with the conclusions drawn by Kong et al. [22]. They adopted the same rock slab scale and conductivity testing experimental methods to clarify that the composite stimulation has a larger conducting and maintenance capacity than acid fractures. Although carbonate rock samples were used in their studies, tight sandstone was used in this study.

3.2. Natural Branch Fracture

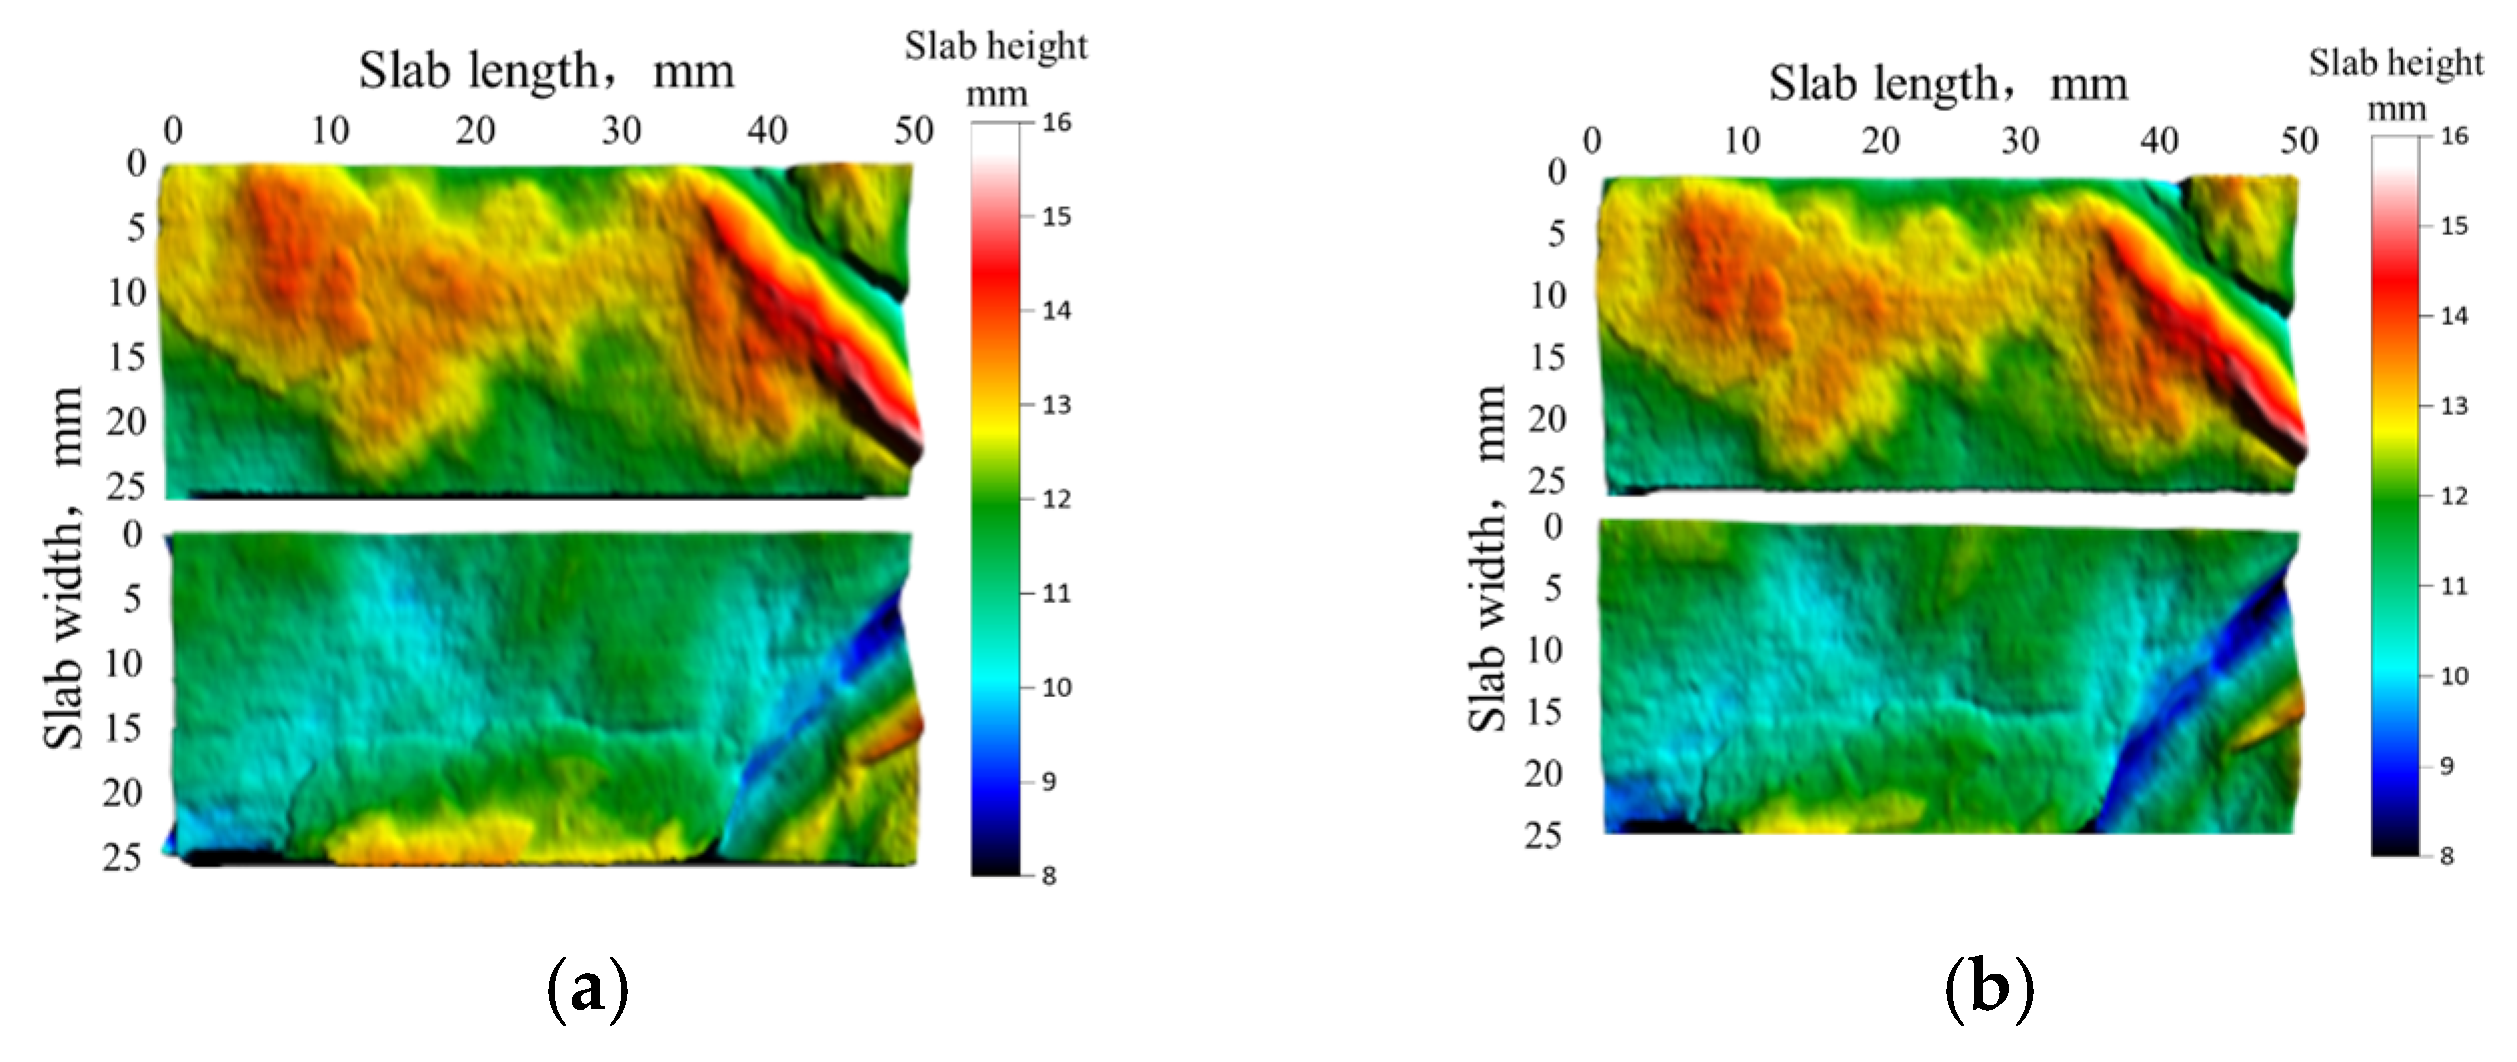
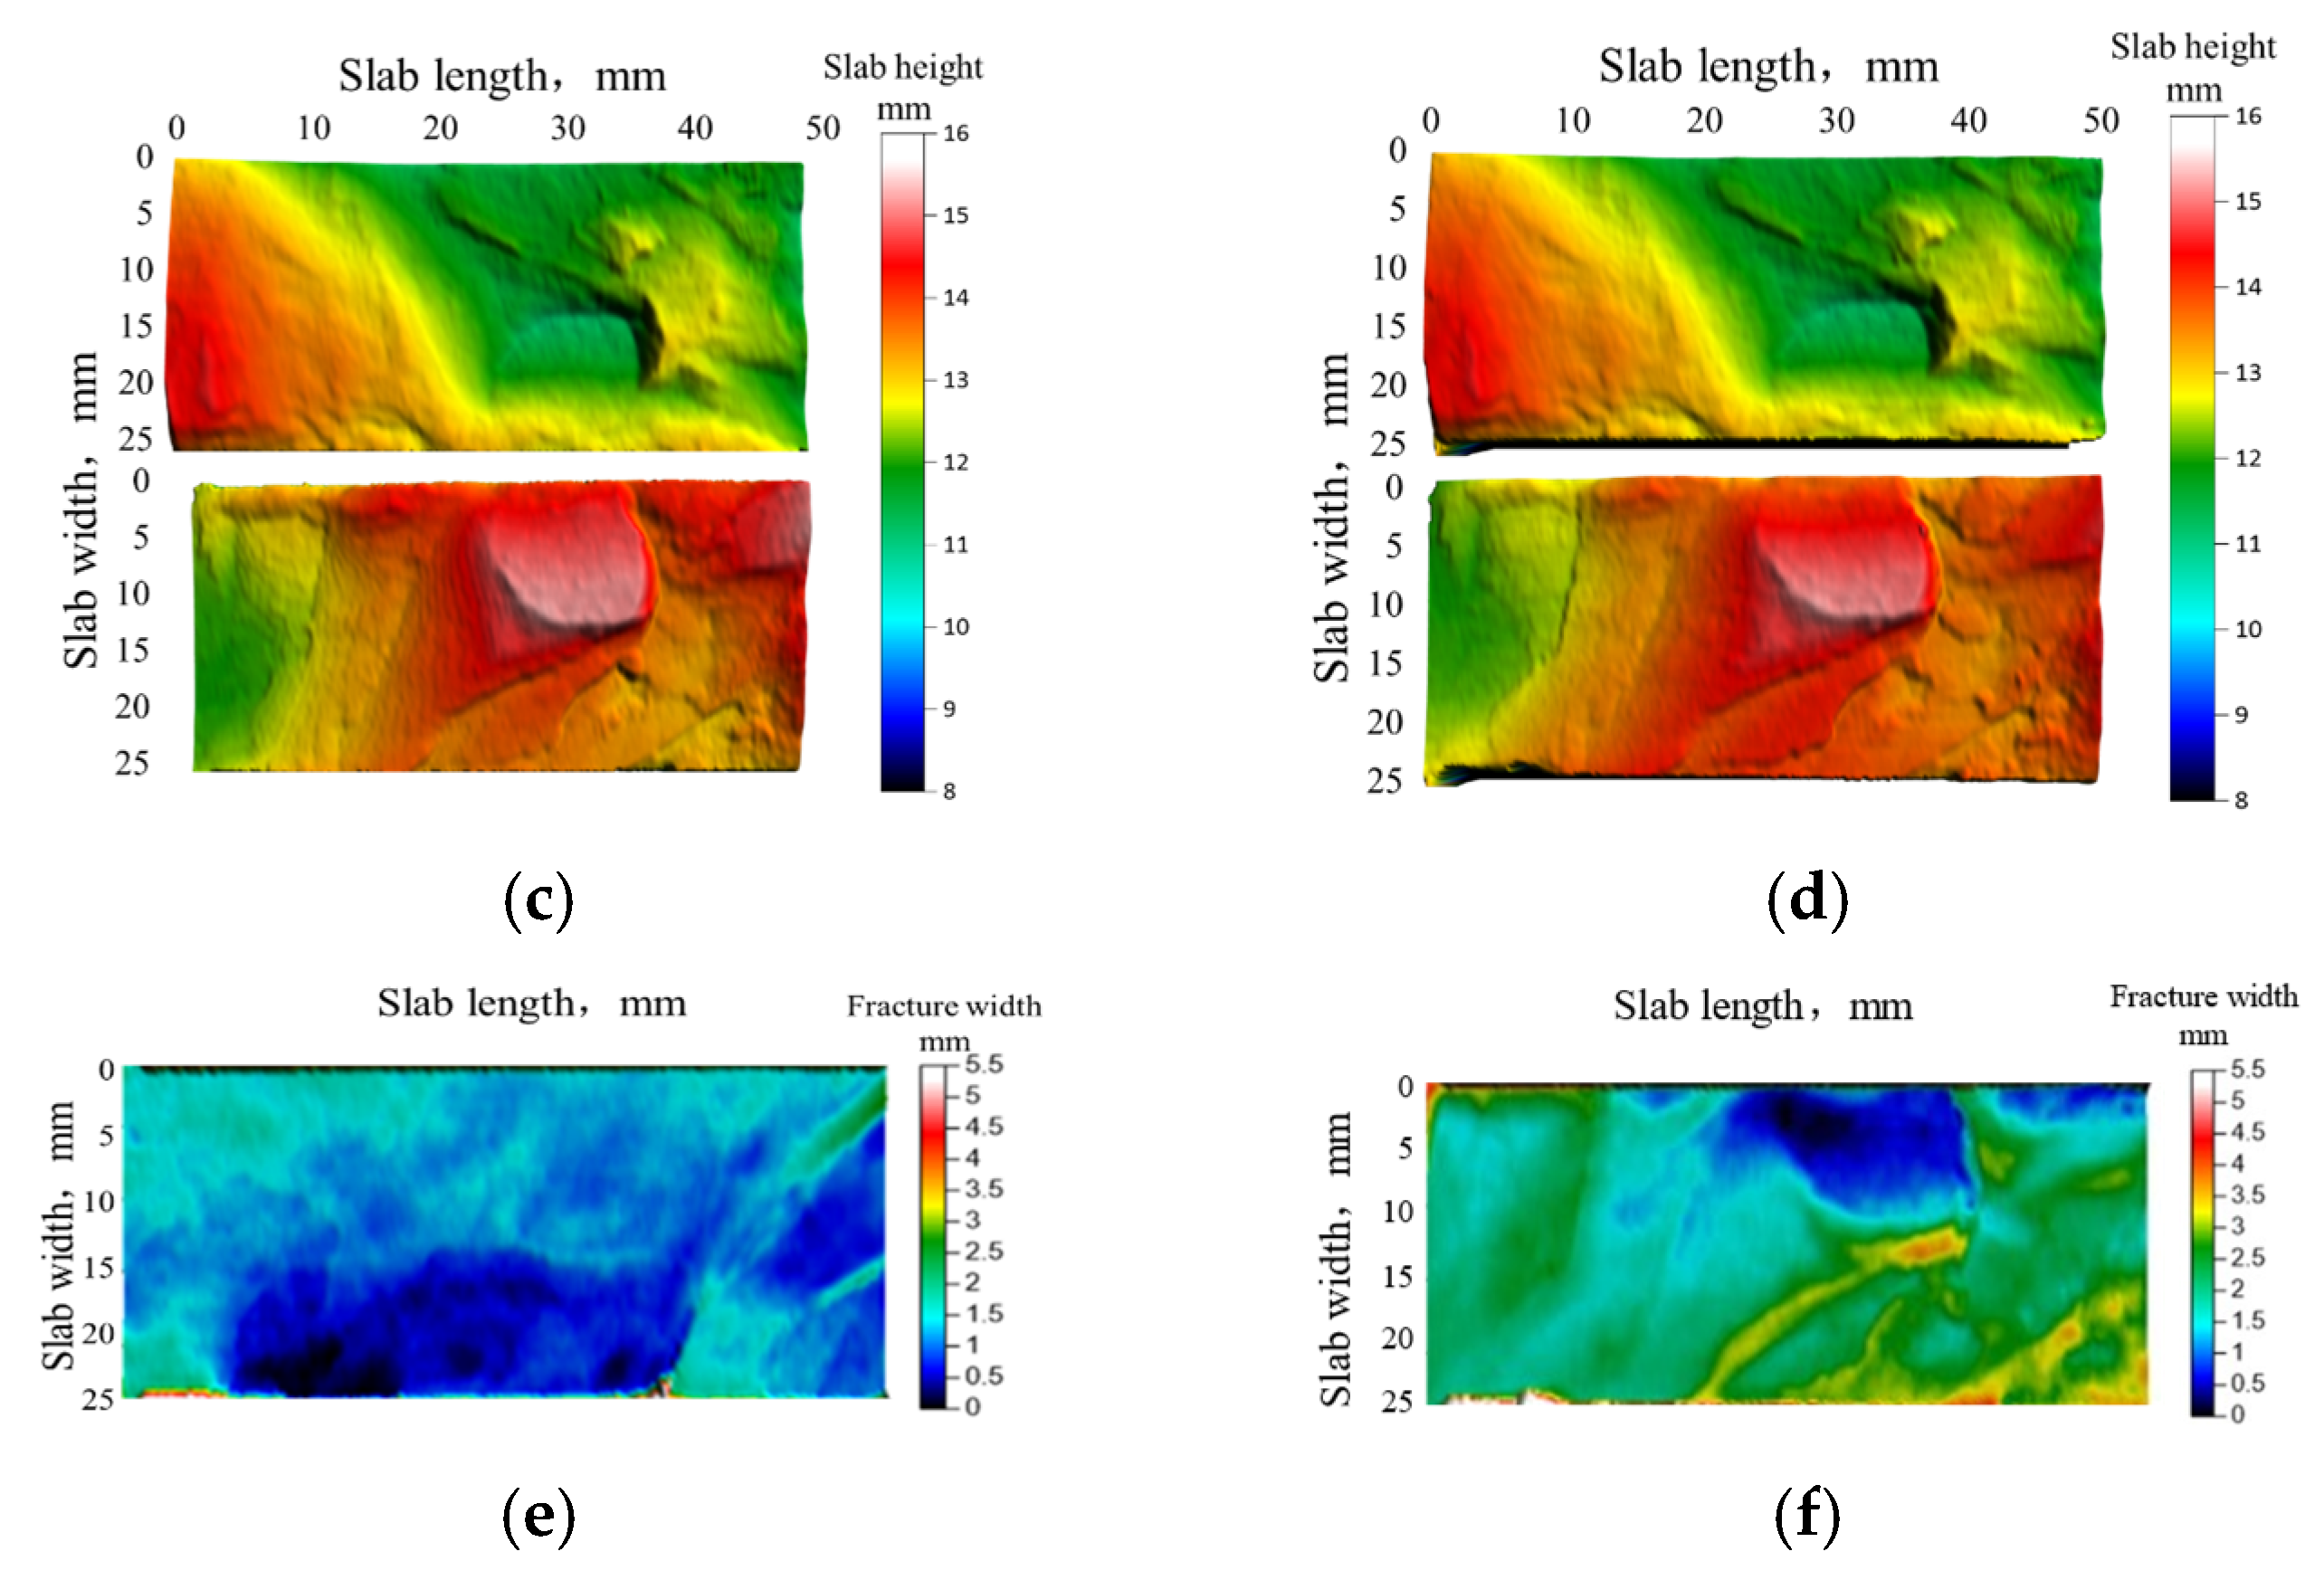
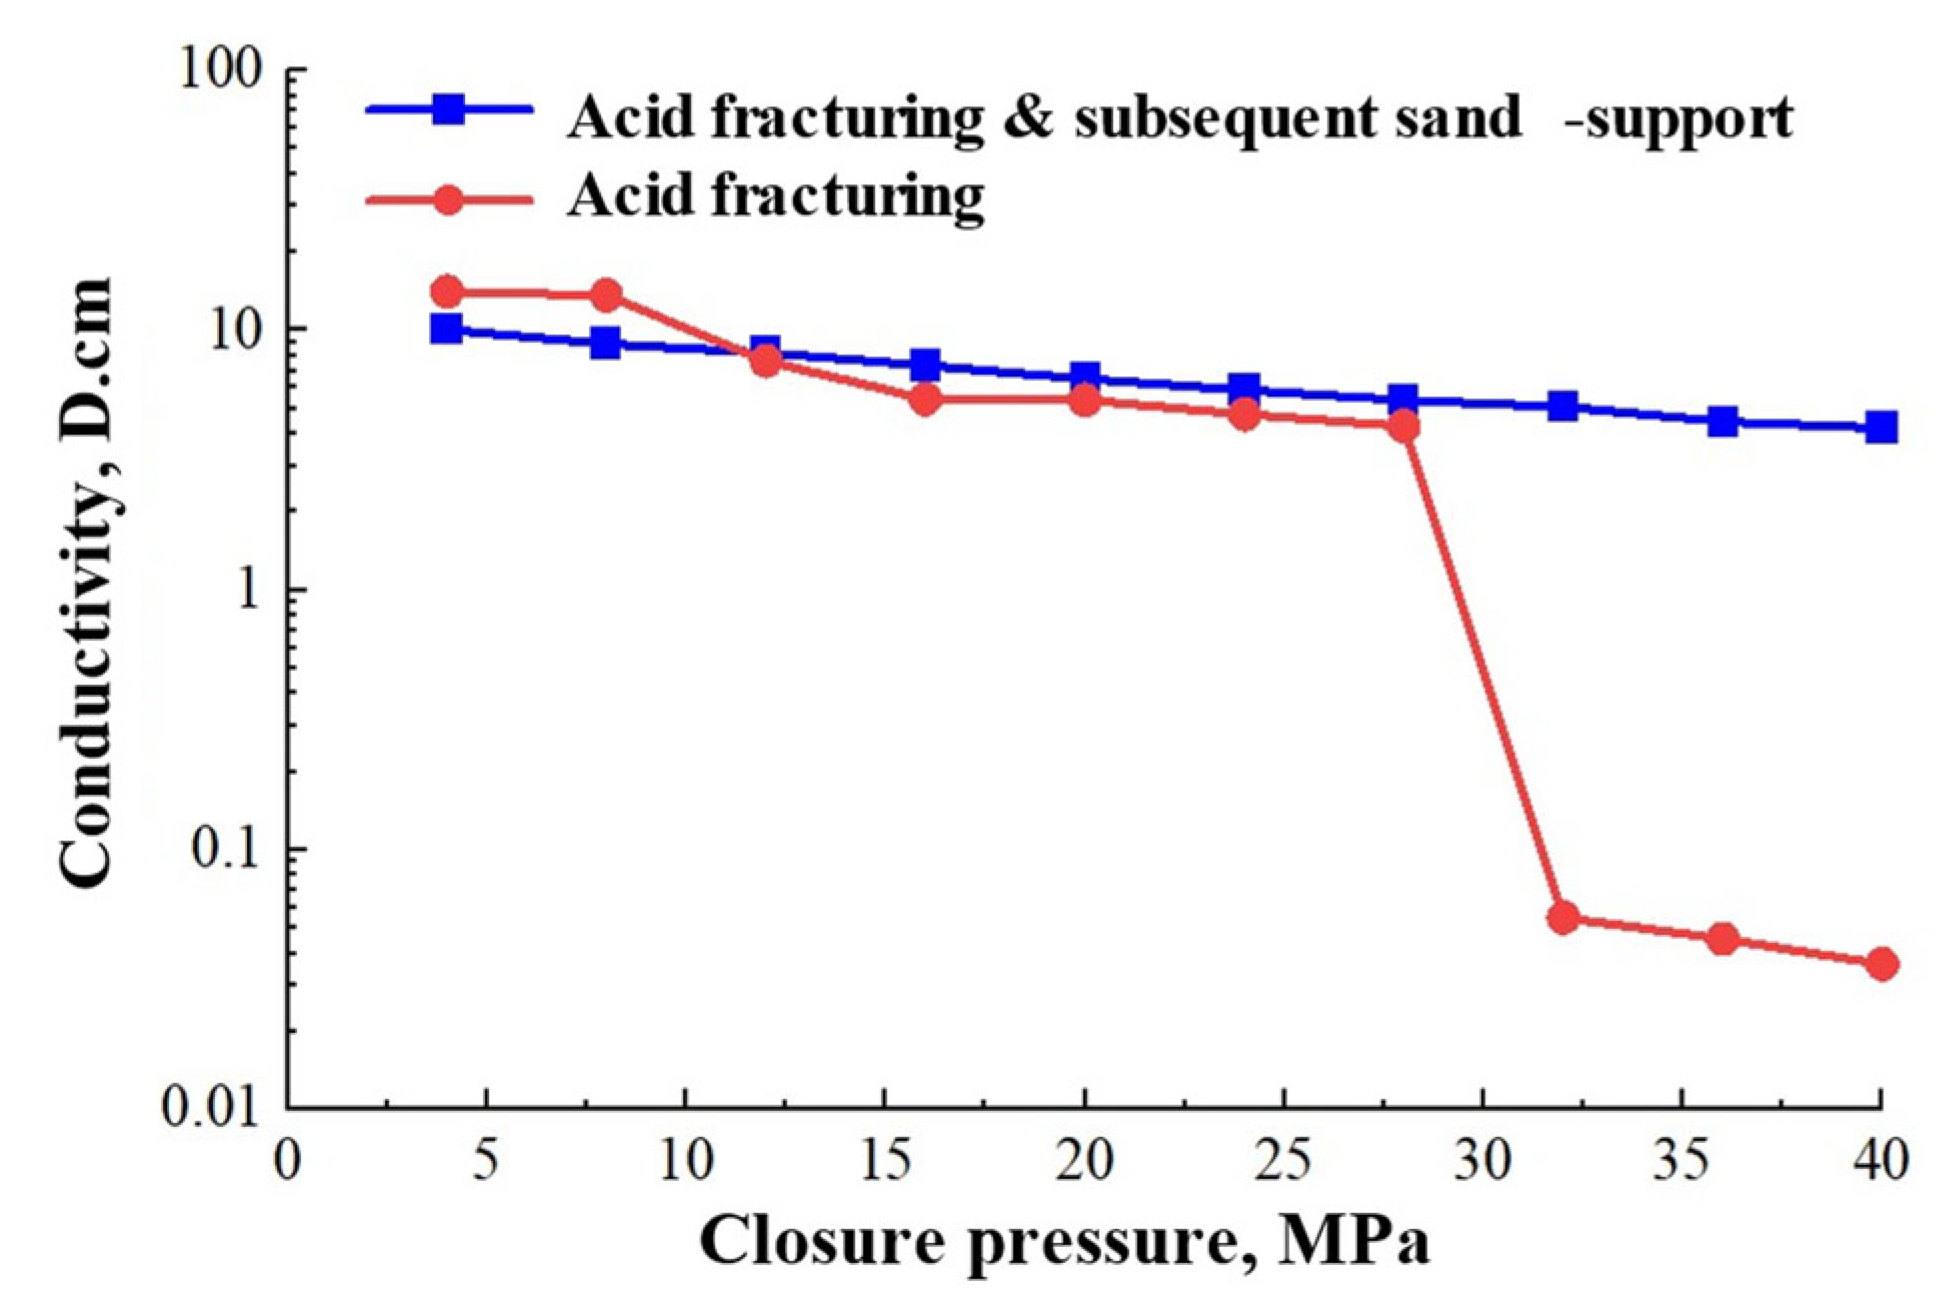
Acid has a small impact on the natural fracture morphology (Figure 9). However, mud acid dissolves the fractures to a greater extent than block HCl, so the fracture width increased significantly (Figure 9c–f). After being dissolved by mud acid, the average fracture width increased to 1.38 mm, which could be supported by 70/140 mesh ceramsite proppants, and the maximum sand concentration could reach 2 kg/m2. Therefore, an experiment of acid fracturing and subsequent sand support with mud acid was carried out. The study found that the fracture conductivity of the acid-etched fractures dropped sharply while the closure pressure increased to 32 MPa. The fracture conductivity of the acid fracturing and subsequent sand support with a sand concentration of 2 kg/m2 decreased slowly as the closure pressure increased. When the pressure reached 40 MPa, the fracture conductivity of the acid fracturing almost disappeared, but the fracture conductivity of the acid fracturing and subsequent sand support was 4.2 D·cm (Figure 10).

3.3. Characteristics of the Conductivity of Main Fractures and Branch Fractures

The fracture conductivity of the artificial fractures obtained in the experiment is regarded as the conductivity of each section of the main fractures in the reservoir. It is assumed that the natural fractures are uniformly distributed in the form shown in Figure 11a, and the conductivity of each natural fracture is the same (Figure 11a). The hydro-electric analogy method and Darcy’s law are used, considering the fluid pressure difference as the voltage and the flow rate as the current (Figure 11b). Thus, the fluid seepage resistances of the main fractures and natural fractures are obtained as Formulas (7)–(9) [23]. Calculating the conductivity of the fracture system involves artificial fractures and connected natural fractures. The conductivity of the acid-etched fractures almost completely disappears when the closure pressure is greater than 40 MPa, so the conductivity of the fractures under 40 MPa is used in this study to calculate the conductivity of the fracture systems under different stimulation techniques.
R i = μ L K f w H
1 R t 1 = 1 R 1 + 2 R 2 1 R t 2 = 1 R t 1 + R 1 + 2 R 2 1 R t 3 = 1 R t 2 + R 1 + 2 R 2 R F = R t 3 + R 1
K f w F = μ L R F H
where Ri is the seepage resistance of the fractures, R1 is the seepage resistance of the artificial fractures, and R2 is the seepage resistance of the natural fractures; RF is the seepage resistance of the entire fracture system, mPa·s·cm−3; µ is the fluid viscosity, mPa·s; L is the sum of the lengths of all the fractures, m; H is the fracture height, m; Kfw is the conductivity of a single fracture, and KfwF is the conductivity of the fracture system, D·cm.
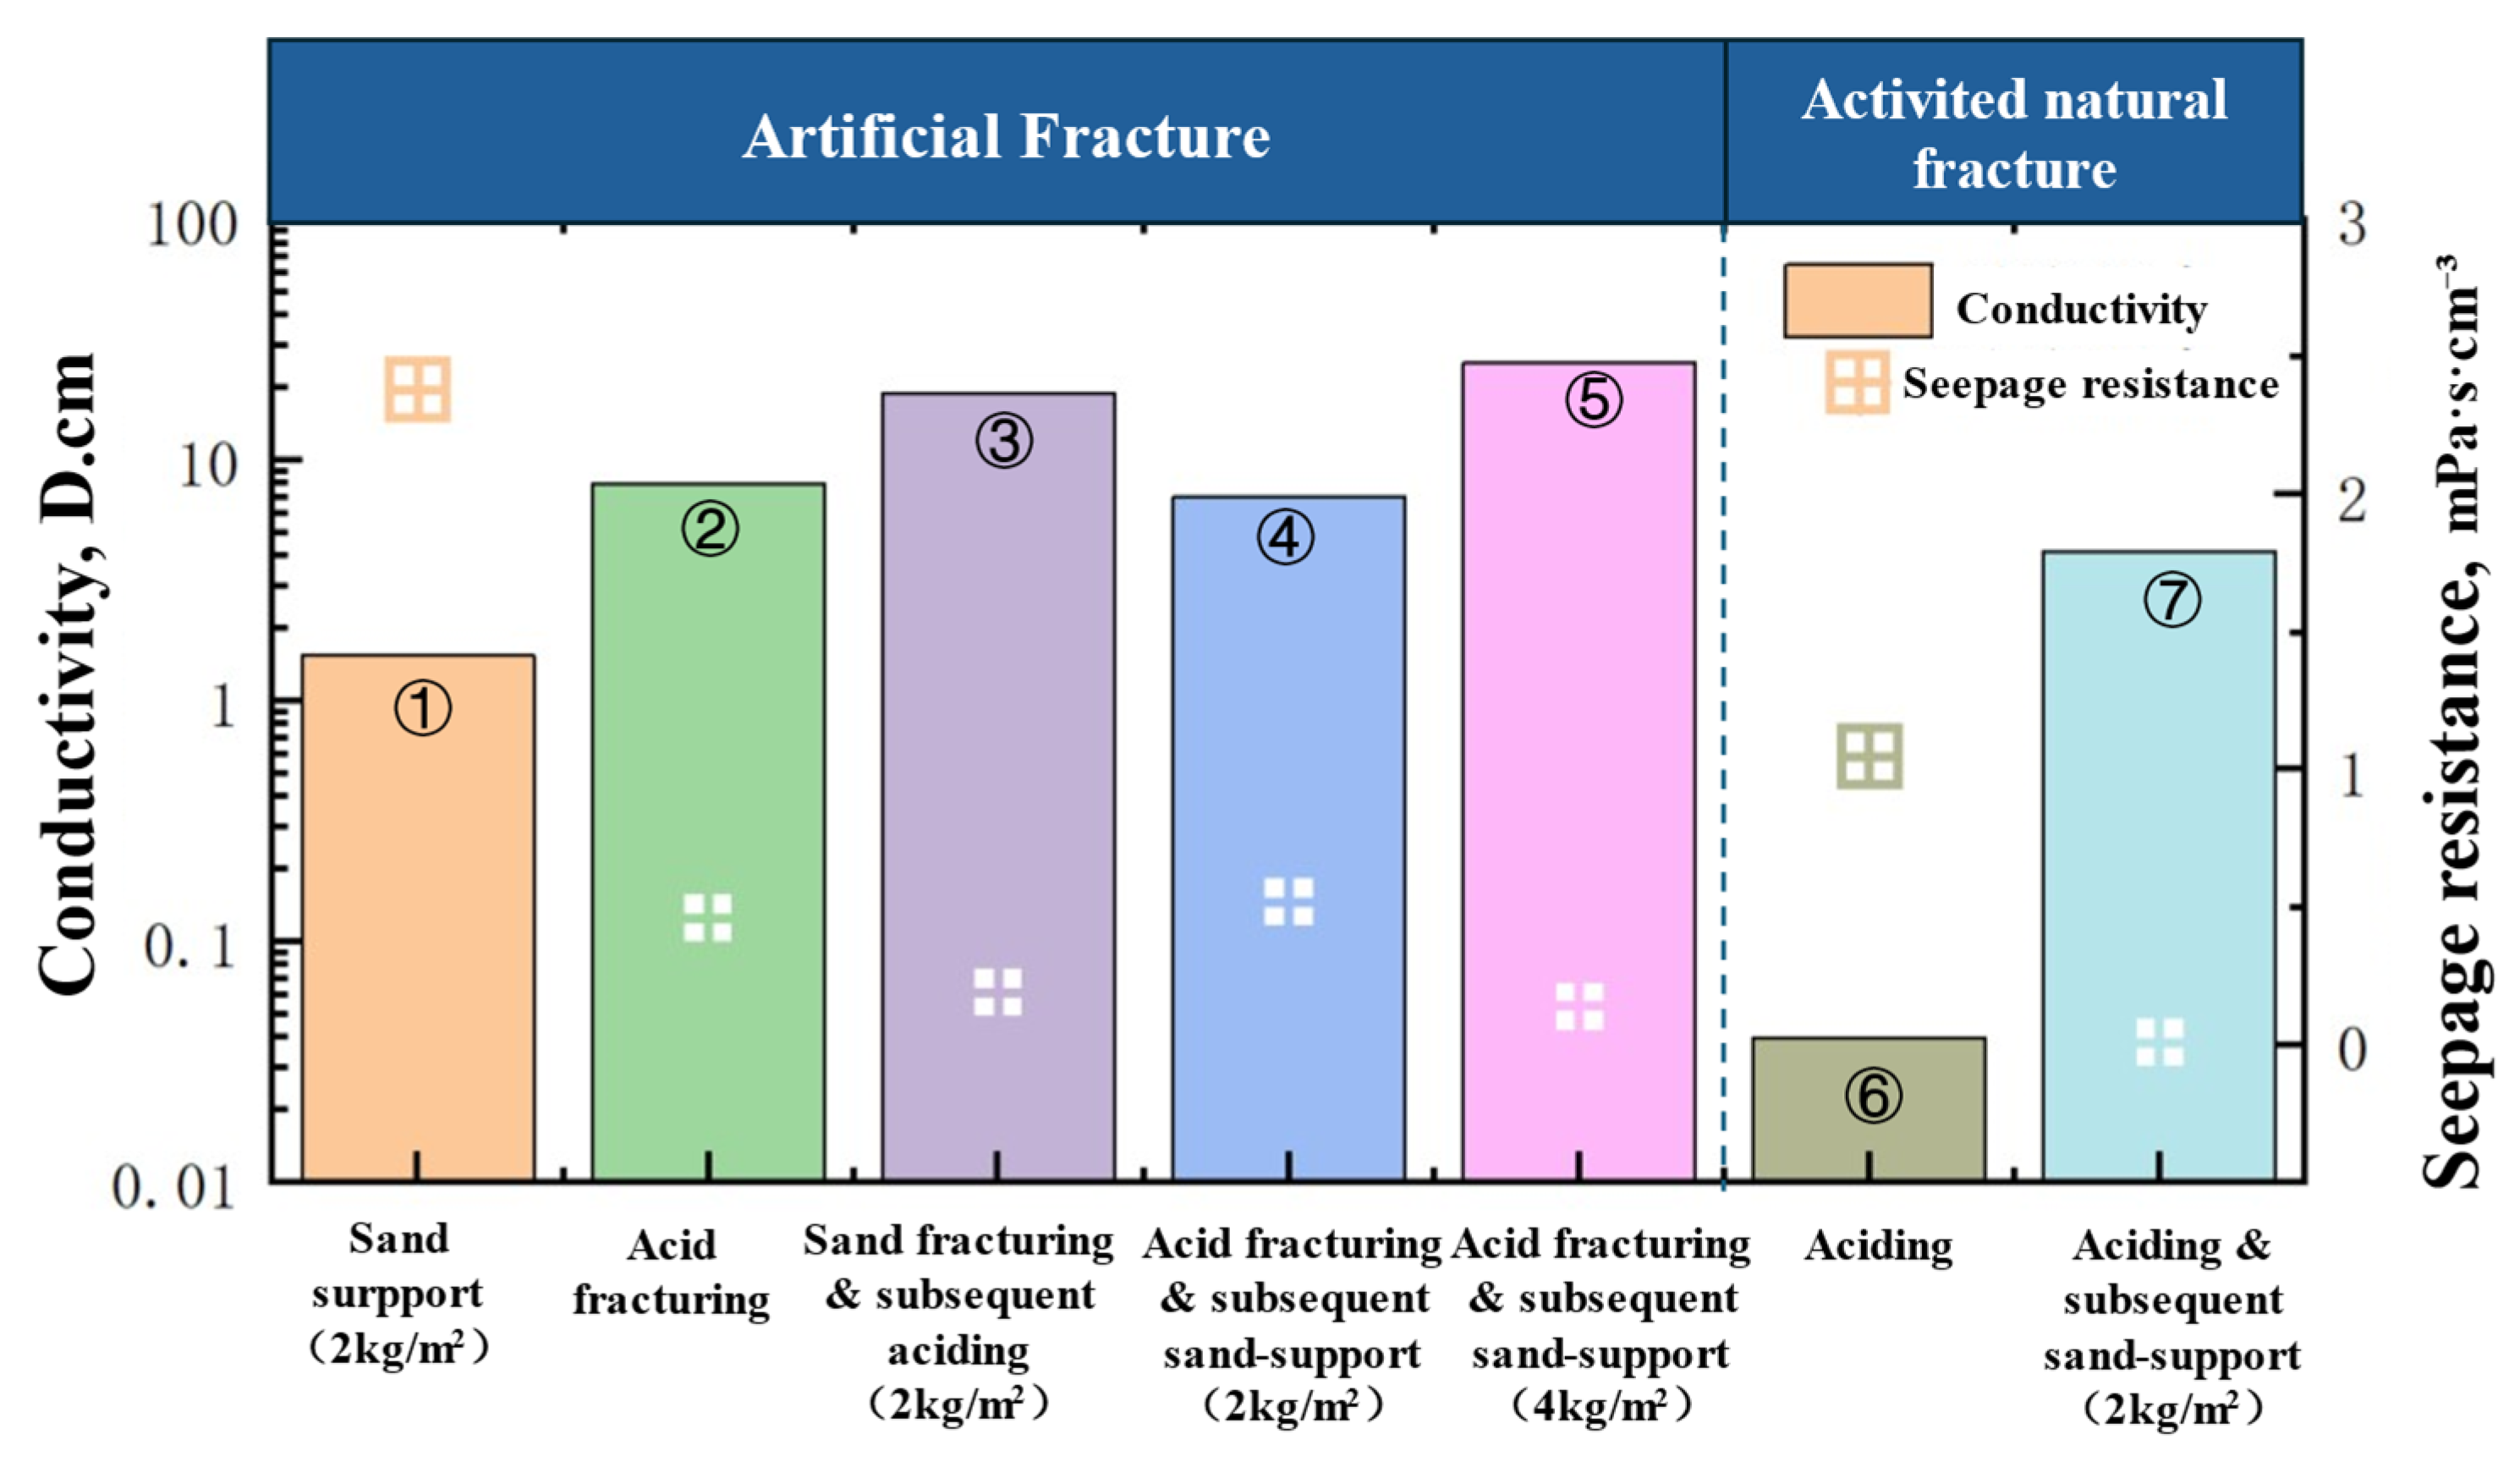
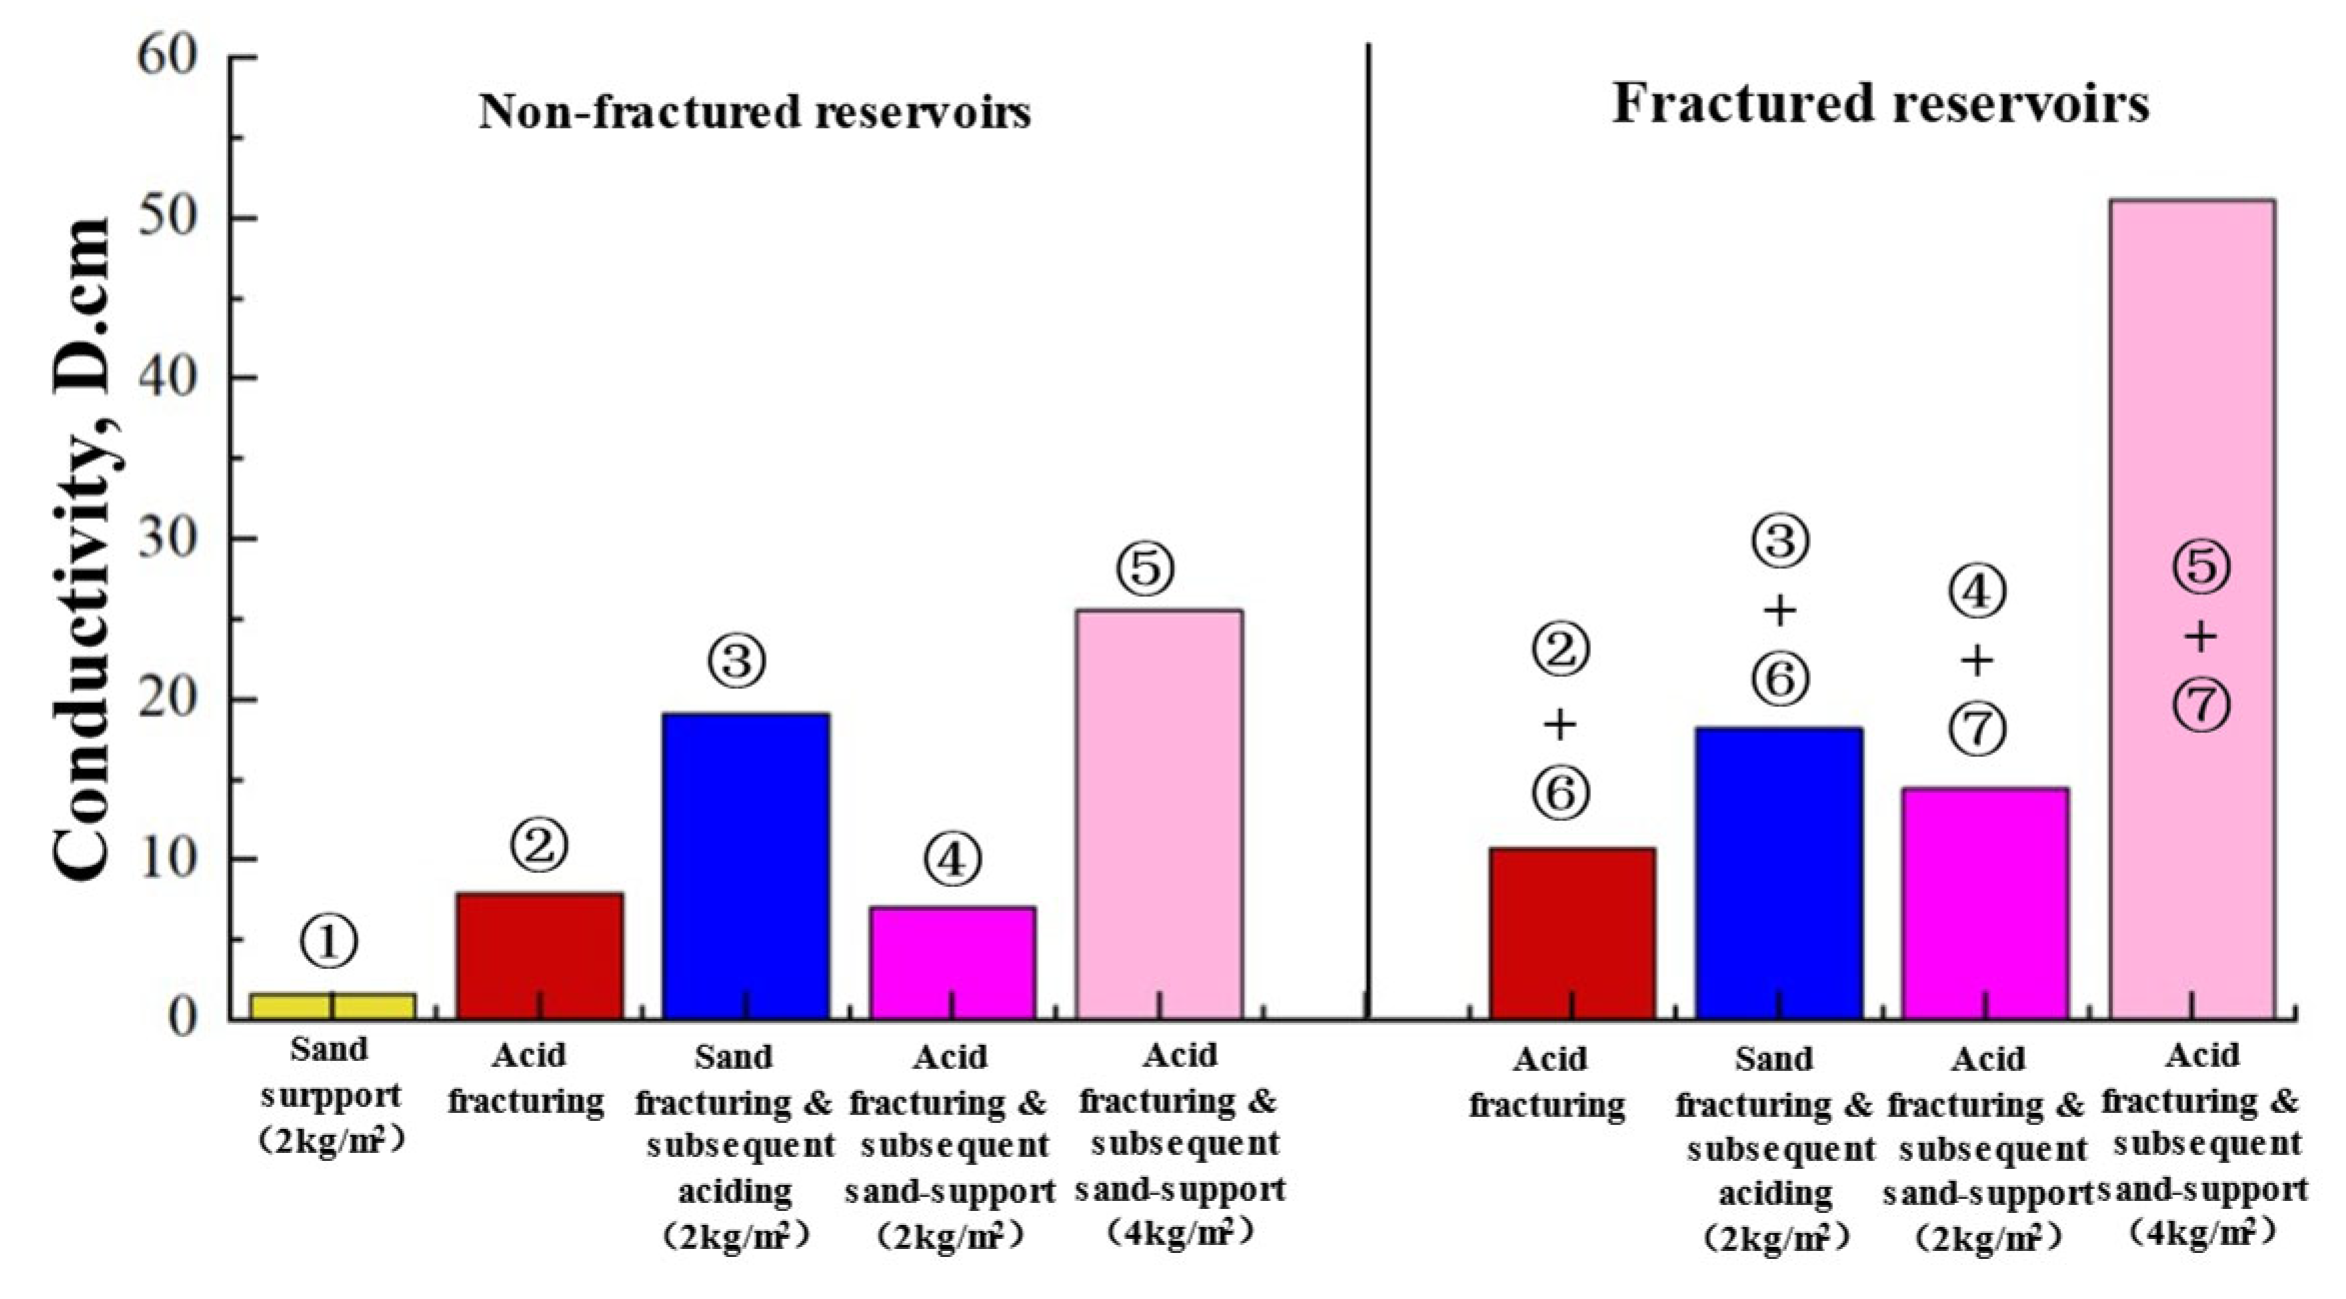
The conductivity and seepage resistances of the artificial fractures and the fracture system under different stimulation techniques are shown in Figure 12. Among them, four techniques are considered for the artificial fractures and for the composite stimulation technique of acid fracturing and subsequent sand support, with two sand concentrations (2 kg/m2 and 4 kg/m2). The study assumes that natural fractures would be activated by acid. Both cases of acid activation with sand support and without support are considered (Figure 12). Thus, a total of nine cases are studied for reservoirs with and without natural fractures (Figure 13).
In reservoirs with poor natural fractures, the conductivity of the fracture system is provided only by the artificial fractures. As shown in 12, when the sand concentration is 2 kg/m2, the fracture conductivity of the sand fracturing and subsequent acidizing is 2.7 times that of the acid fracturing and subsequent sand support. As the fracture width is increased by acid, when the sand concentration is 4 kg/m2, the fracture conductivity of acid fracturing and subsequent sand support reaches 3.6 times the conductivity when the sand concentration is 2 kg/m2 and is 1.3 times that of the sand fracturing and subsequent acidizing. Thus, expanding the fracture width through acid first and then increasing the sand concentration is the most effective method to enhance the conductivity of artificial fractures.
In reservoirs with richly developed natural fractures, the acid activates natural fractures, and then, proppants support the fractures, resulting in the conductivity of the fracture system being significantly higher than that of reservoirs with poorly developed natural fractures. Among them, when the sand concentration is 4 kg/m2, the fracture conductivity of the acid fracturing and subsequent sand support is 3.5 times the conductivity when the sand concentration is 2 kg/m2 and is 2.8 times that of the fractures in the composite stimulation of sand fracturing and subsequent acidizing. Currently, the conductivity of the fracture system is the highest. Therefore, in terms of conductivity, the composite stimulation technique of acid fracturing and subsequent sand support is the most effective among the four methods.
A total of 24 wells with similar reservoir qualities were statistically analyzed, among which 12 adopted the combined stimulation. Results shows that the product-increasing performance of combined stimulation (open flow 157 × 104 m3/d) is slightly higher than that of hydraulic fracturing (147 × 104 m3/d), but more obvious than that of acid fracturing (51 × 104 m3/d), which indirectly proves the feasibility of the application of combined modification in tight sandstone reservoirs.

4. Conclusions

We carried out an experimental study on the adaptability of the composite stimulation technique of acid and sand support for fractured tight sandstone reservoirs. The main research conclusions are as follows:
(1)
Composite stimulation of acid and sand support could significantly improve the conductivity of the artificial fractures. When the sand concentration is 2 kg/m2, the sand fracturing and subsequent acidizing could increase the fracture conductivity to 8 times that of the sand-supported fractures. The acid fracturing and subsequent sand support could increase the fracture conductivity to 2.5 times that of the sand-supported fracture.
(2)
Acid fracturing and subsequent sand support can increase the fracture width, thus increasing the sand concentration. When the sand concentration reaches 3 kg/m2, the fracture conductivity is 1.2 times that of the fractures in the sand fracturing and subsequent acidizing. When the sand concentration reaches 4 kg/m2, the fracture conductivity is 1.3 times that of the fractures in the sand fracturing and subsequent acidizing.
(3)
The composite stimulation of acid fracturing and subsequent sand support is an effective means to improve the conductivity of natural fractures. After being dissolved by the acid, the maximum sand concentration of the 70/140 mesh ceramsite proppants for the natural fractures can reach 2 kg/m2. The fracture conductivity remains at 4.2 D·cm under 40 MPa. Under the same conditions, the conductivity of the acid-etched fractures almost disappears.
(4)
In reservoirs with richly developed natural fractures, the acid fracturing and subsequent sand support have a better effect in terms of improving the fracture system conductivity. When the sand concentration is 4 kg/m2, the conductivity of the fracture system reaches 3.5 times the conductivity when the sand concentration is 2 kg/m2 and is 2.8 times that of the fractures in the sand fracturing and subsequent acidizing.

5. Future Works

(1)
The rock breaking and fracture propagation of the reservoir in composite fracturing are also important research directions in reservoir stimulation. Subsequently, the influence of the three-directional principal stress of the reservoir on the rock breaking and fracture propagation behavior in composite fracturing can be studied through triaxial mechanical experiments.
(2)
The optimization methods of acid systems, pumping procedures, and treatment parameters are essential to clarifying the improvement laws of each parameter on the main fractures, natural fractures, and the fracture network.
(3)
The research on the applicability of composite stimulation in multiple types of reservoirs can be expanded; the retention performance of the fracture conductivity of composite stimulation should be evaluated under different reservoir conditions; and the applicability of the process can be further improved.
(4)
Based on clarifying the production-increasing mechanism of the composite stimulation, the relevant model needs to be established to determine, on the engineering scale, how much the production-increasing capacity of the composite stimulation has improved compared with hydraulic fracturing.

Author Contributions

Conceptualization, F.P., J.P., J.L., Q.S. and B.G.; Methodology, F.P., J.Z., J.L., Q.S., K.X. and B.G.; Validation, J.P. and J.Z.; Formal analysis, J.Z.; Investigation, J.P. and J.L.; Resources, F.P.; Writing—original draft, K.X.; Writing—review & editing, F.P. and K.X.; Visualization, F.P.; Supervision, F.P., Q.S. and B.G. All authors have read and agreed to the published version of the manuscript.

Funding

This research received no external funding.

Data Availability Statement

The original contributions presented in this study are included in the article. Further inquiries can be directed to the corresponding author.

Conflicts of Interest

Authors Fen Peng, Jianxin Peng, Jianping Zhou, Junyan Liu and Qiuqiang were employed by the companies Petrochina Tarim Oilfield Company and CNPC. The remaining authors declare that the research was conducted in the absence of any commercial or financial relationships that could be construed as a potential conflict of interest.

References

  1. Wang, Q.; Zhang, H.; Xu, K.; Yuan, F.; Yin, G.; Wang, H. Key Geomechanical Issues in Efficient Development of Ultra Deep Oil and Gas. In Proceedings of the International Petroleum Technology Conference, Kuala Lumpur, Malaysia, 18–20 February 2025. [Google Scholar]
  2. Liu, Z.; Zhang, Y.; Wu, J.; Zhang, L.; Feng, D.; Zhou, P.; Ge, Q.; Song, M. Multi-Scale Fracture Prediction and Modeling. In Proceedings of the International Petroleum Technology Conference, Kuala Lumpur, Malaysia, 18–20 February 2025. [Google Scholar]
  3. Wang, J.; Yang, X.; Zhang, J.; Wang, K.; Zhang, R.; Wang, Q.; Ren, B.; Ukar, E. Subsurface Fracture Characterization in a Folded Ultra-deep Tight-gas Sandstone Reservoir: A case study from the Keshen gas field, Tarim Basin, China. J. Struct. Geol. 2023, 172, 104867. [Google Scholar] [CrossRef]
  4. Wang, Z.; Wang, C.; Xu, K.; Zhang, H.; Chen, N.; Deng, H.; Hu, X.; Yang, Y.; Feng, X.; Du, Y.; et al. Characteristics and Control Factors of Tectonic Fractures of Ultra-deep Tight Sandstone: Case Study of the Lower Cretaceous reservoir in Bozi-Dabei area, Kuqa Depression, Tarim Basin, China. J. Nat. Gas Geosci. 2023, 8, 439–453. [Google Scholar] [CrossRef]
  5. Liu, J.; Lu, Y.; Luo, Y.; Yang, H.; Lu, L. Method for Predicting the Injection Pressure for Horizontal Wells in Fractured Tight Sandstone Reservoirs. Geophysics 2024, 89, 1JA-V359. [Google Scholar] [CrossRef]
  6. Wu, B.; Xiao, F.; Kong, M.; Wang, B.; Zhang, S. Research on Proppant Optimization and Field Test of Ultra-Deep Tight Conglomerate Sandstone Reservoir. Front. Energy Res. 2022, 10, 891063. [Google Scholar] [CrossRef]
  7. Wang, Y.; Zhang, G.; Peng, Y.; Zhang, T. Combined Influences of Acid Solution and Geo-Stress on Fracture Geometry During Acid Fracturing in Laboratory. In Proceedings of the 52nd U.S. Rock Mechanics/Geomechanics Symposium, Seattle, WA, USA, 17–20 June 2018. [Google Scholar]
  8. Xiao, Y.; Wang, H.; Mi, Z.; Cheng, Y.; Cao, X.; Qu, J.; Guo, J. Laboratory Measurements of Acid-Etched Fracture Conductivity for Medium-High Porosity and Low Permeability Limestone Reservoirs in EE Oil Field. In Proceedings of the 54th U.S. Rock Mechanics/Geomechanics Symposium, Golden, CO, USA, 28 June–1 July 2020. [Google Scholar]
  9. Gunawan, H.; Susanto, H.; Widyantoro, B.; Noguera, J. Fracture Assisted Sandstone Acidizing, Alternative Approach To Increase Production in Tight Sandstone Reservoir. In Proceedings of the SPE Oil and Gas India Conference and Exhibition, Mumbai, India, 28–30 March 2012. [Google Scholar]
  10. Rozo, R.; Paez, J.; Mendoza, A.; Milne, A.; Soler, D. Combining Acid- and Hydraulic-Fracturing Technologies Is the Key to Successfully Stimulating the Orito Formation. In Proceedings of the SPE Hydraulic Fracturing Technology Conference, College Station, TX, USA, 29–31 January 2007. [Google Scholar]
  11. Salazar, F.; Rachid, R.; Jimenez, J.; Milne, A.; Ali, S. Hydraulic Fracturing with Water-Based Fluids in Water-Sensitive Formations. In Proceedings of the SPE European Formation Damage Conference & Exhibition, Noordwijk, The Netherlands, 5–7 June 2013. [Google Scholar]
  12. Boucher, A.; Del Rio, C.; Salazar, F.; Milne, A.; Robles, M. Increasing Oil Production without Increasing Water Cut in Wells in Ecuador. In Proceedings of the SPE European Formation Damage Conference, Noordwijk, The Netherlands, 7–10 June 2011. [Google Scholar]
  13. Zhao, H.; Xiong, Y.; Zhen, H.; Liu, C.; Li, X. Experimental Investigation on the Fracture Propagation of Three-stage Acid Fracturing of Tight Sandstone Gas Reservoir. J. Pet. Sci. Eng. 2022, 211, 110143. [Google Scholar] [CrossRef]
  14. Medavarapu, K.; Das, S.; Ch, S.; Nainwal, S.P. Optimization of Fracturing Technique for Successful Exploitation of Tight Gas Reservoirs of Mandapeta Field. In Proceedings of the SPE Oil and Gas India Conference and Exhibition, Mumbai, India, 4–6 April 2017. [Google Scholar]
  15. Connolly, P.; Cosgrove, J. Prediction of Fracture-Induced Permeability and Fluid Flow in the Crust Using Experimental Stress Data1. AAPG Bull. 1999, 83, 757–777. [Google Scholar]
  16. Zhu, P.; Lin, C.; Ren, H.; Zhao, Z.; Zhang, H. Micro-fracture Characteristics of Tight Sandstone Reservoirs and Its Evaluation by Capillary Pressure curves: A Case Study of Permian Sandstones in Ordos Basin, China. J. Nat. Gas Sci. Eng. 2015, 27, 90–97. [Google Scholar] [CrossRef]
  17. Karazincir, O.; Li, Y.; Williams, W.; Zaki, K.; Rijken, P.; Rickards, A. Impact of Remedial Acid Practices on Proppant Embedment and Fracture Face Permeability. In Proceedings of the SPE Annual Technical Conference and Exhibition, Virtual, 26–29 October 2020. [Google Scholar]
  18. Gou, B.; Guan, C.; Li, X.; Ren, J.; Zeng, J.; Wu, L.; Guo, J. Acid-etching fracture morphology and conductivity for alternate stages of self-generating acid and gelled acid during acid-fracturing. J. Pet. Sci. Eng. 2021, 200, 108358. [Google Scholar] [CrossRef]
  19. Liang, X.; Zhou, F.; Liang, T.; Huang, Y.; Wei, D.; Ma, S. The effect of Combined Proppants Upon the Fracture Conductivity in Tight Gas Reservoirs. Energy Rep. 2020, 6, 879–884. [Google Scholar] [CrossRef]
  20. Shaibu, R.; Guo, B.; Wortman, P.B.; Lee, J. Stress-sensitivity of Fracture Conductivity of Tuscaloosa Marine Shale cores. J. Pet. Sci. Eng. 2022, 210, 110042. [Google Scholar] [CrossRef]
  21. Guo, J.; Zhan, L.; Gou, B.; Zeng, J.; Zhou, C. Experimental Optimization of Acid System for Acidizing in Mud-damaged Deep Fractured Carbonate Formation. J. Pet. Sci. Eng. 2020, 195, 107639. [Google Scholar] [CrossRef]
  22. Kong, X.; Liu, B.; Wan, X.; Li, S.; Liu, Z.; Chen, M.; Shen, J. Experimental Evaluation and Optimization of Improved Conductivity of Gelling Acid Etched Fractures in Deep, Low-Permeability Reservoirs. Fuel 2023, 348, 128468. [Google Scholar] [CrossRef]
  23. Guo, J.; Ren, J.; Wang, S.; Chen, C.; Lai, J.; Gou, B. Comprehensive Study of Fracture Flow Characteristic and Feasibility of Hybrid Volume Stimulation Technique in Tight Fractured Carbonate Gas Reservoir. J. Pet. Sci. Eng. 2019, 174, 362–373. [Google Scholar] [CrossRef]
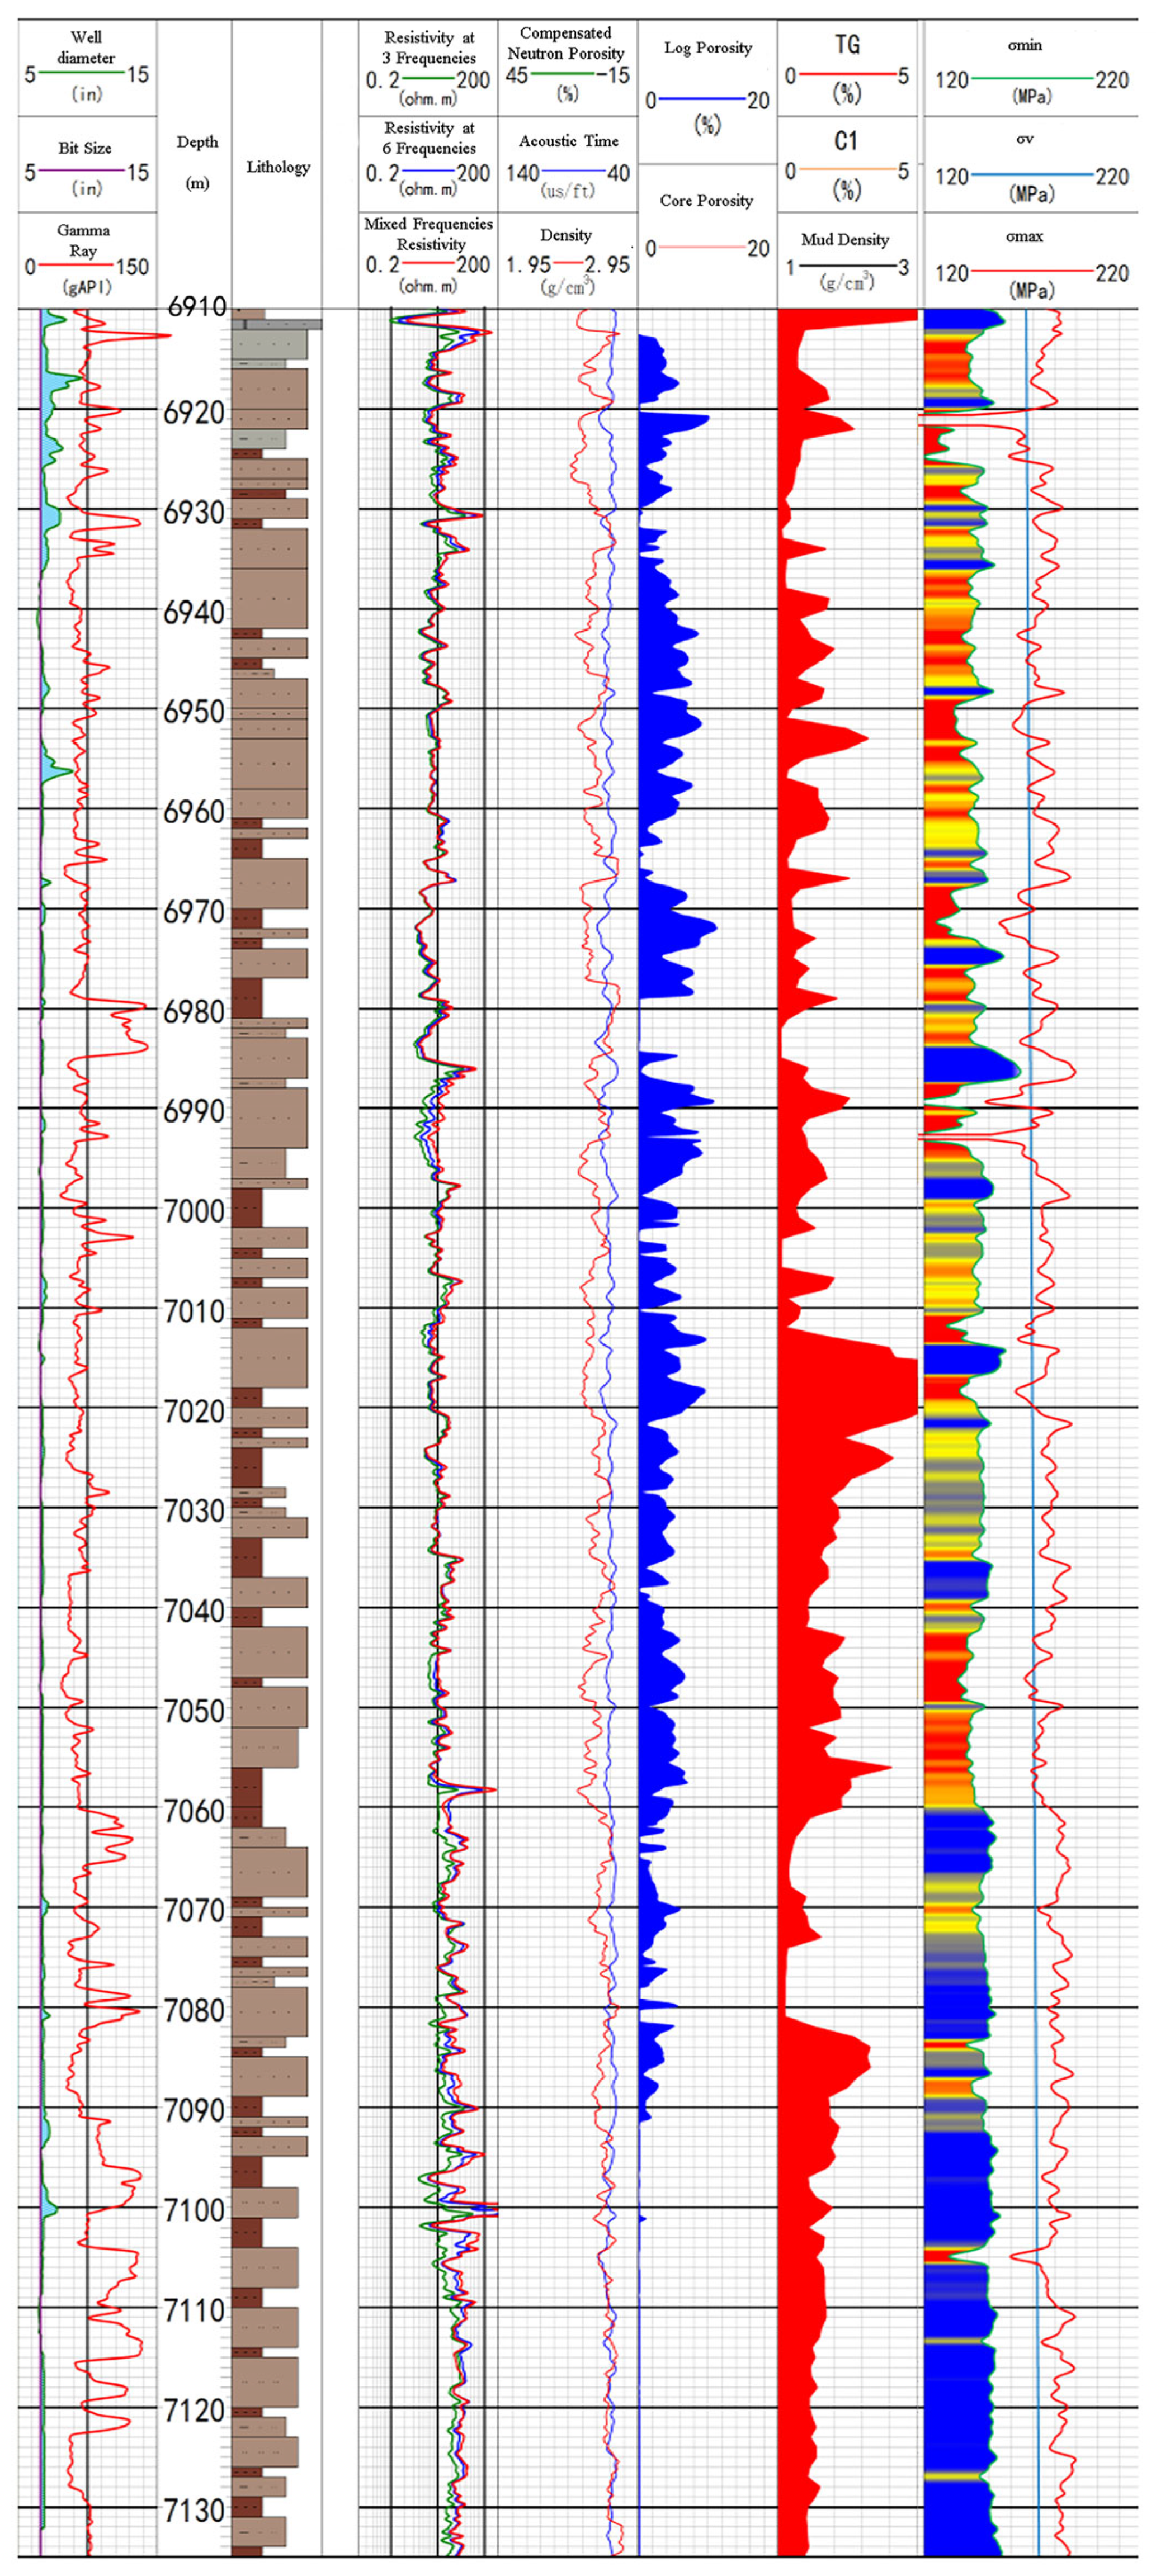
Figure 1. A well logging curve of a typical well in the BZ-DB area.
Processes 13 02039 g001
Figure 2. Experimental device [18]. (a) API acid etching experimental device; (b) fracture conductivity test device; (c) plunger rock sample acid displacement device; (d) 3D laser scanning device (Southwest petroleum university, Chengdu China).
Processes 13 02039 g002
Figure 3. Physical pictures of rock samples. (a) API rock slabs; (b) plunger rock (Petrochina Tarim Oilfield Company, Korla, China).
Processes 13 02039 g003
Figure 4. The experimental process of various stimulation techniques in artificial fractures.
Processes 13 02039 g004
Figure 5. The morphologies of rock slabs with different calcium contents before and after acid etching (calcium content: rock slab #1 is 25.4%, rock slab #2 is 14.7%, and rock slab #3 is 0.7%): (a) slab #1 before etching; (b) slab #1 after etching; (c) morphology of slab #1 after acid etching; (d) slab #2 before etching; (e) slab #2 after etching; (f) morphology of slab #2 after acid etching; (g) slab #3 before etching; (h) slab #3 after etching; (i) morphology of slab #3 after acid etching.
Processes 13 02039 g005
Figure 6. The acid-fracture width increments with different calcium carbonate contents.
Processes 13 02039 g006
Figure 7. The acid-etched fracture conductivity under different stimulation techniques.
Processes 13 02039 g007
Figure 8. The acid fracture conductivity with different proppant placement concentrations.
Processes 13 02039 g008
Figure 9. The natural fracture morphology and the width under different acid systems (core #1 is dissolved by block HCl, and core #2 is dissolved by mud acid): (a) #1—before acid etching; (b) #1—after acid etching; (c) #2—before acid etching; (d) #2—after acid etching; (e) #1—cloud maps of acid-fracture width; (f) #2—cloud maps of acid-fracture width.
Processes 13 02039 g009aProcesses 13 02039 g009b
Figure 10. The conductivity of natural fractures under different stimulation techniques.
Processes 13 02039 g010
Figure 11. A schematic diagram of the distribution of reservoir fractures and a schematic diagram of the calculation method for fracture conductivity: (a) a schematic diagram of the fracture network; (b) a schematic diagram of the principle of similarity between hydraulics and electricity.
Processes 13 02039 g011
Figure 12. The conductivity and seepage resistance of artificial fractures and natural fractures with different stimulation techniques at 40 MPa.
Processes 13 02039 g012
Figure 13. The conductivity of different reservoir fracture systems.
Processes 13 02039 g013
Table 1. The mineral composition of slabs with different calcium content.
No.Clay (%)Analcite (%)Quartz (%)Potassium Feldspar (%)Plagioclase (%)Calcite (%)
14.50.029.016.324.825
218.72.743.28.412.315
315.515.337.919.411.21
The calcium content mostly comes from calcite, whose component is calcium carbonate.
Table 2. The formula of the liquid material (Petrochina Tarim Oilfield Company, Korla, China).
LiquidFormula
Block HCl9% HCl + 2% clay stabilizer + 3.6% corrosion inhibitor + 0.5% discharge aid + 2% iron stabilizer + 0.3% resistance reducer
Mud acid9% HCl + 2% HF + 2% clay stabilizer + 3.6% corrosion inhibitor + 0.5% discharge aid + 2% iron stabilizer + 0.3% resistance reducer
Fracturing fluid0.45% Super guanidine gum + 0.5% discharge aid + 0.8% temperature stabilizer + 0.4% Crosslinking regulator + 2% clay stabilizer
Table 3. Acid pumping rate in artificial fractures at experimental scales.
qf (m3/min)wf (m)hf (m)wl (m)hl (m)nql (mL/min)
40.02820.0020.0360.3132
Table 4. The experimental scheme of the artificial fracture.
SubjectNo.Production ProcessCalcium Content (%)Acid SystemTemperature (°C)Pumping Rate (mL/min)Pumping Time
(min)
The effect of calcium content#1Acid fracturing25%Block HCl9013230
#215%Block HCl9013230
#31%Block HCl9013230
The influence of various production processes#4Sand fracturing8%Block HCl9013230
#5Acid fracturing8%Block HCl9013230
#6Acid fracturing and subsequent sand support8%Block HCl9013230
#7Sand fracturing and subsequent acidizing8%Block HCl9013230
Table 5. The opening of the natural fractures in the experiment.
Natural Fracture Width (mm)Fluid Pressure Difference on the Fracture Surface (MPa)Fracture Normal Stiffness (MPa/mm)The Width of Natural Fractures in the Experiment (mm)
0.123.43400.2
Table 6. The acid fluid displacement in different fractures at the experimental scale.
qf (m3/min)w0
(m)
L0
(m)
ρf
(m−1)
D
(m)
wln
(m)
qln
(mL/min)
40.0001241.60.0250.000248
Table 7. Experiment schemes for different stimulation techniques of artificial main fractures.
Stimulation TechniquesNo.Acid
System
Temperature (°C)Pumping Rate (mL/min)Pumping Time (min)
Acid fracturing#1Block HCl904830
Acid fracturing#2Mud acid904830
Acid fracturing and subsequent sand support#3Mud acid904830
Disclaimer/Publisher’s Note: The statements, opinions and data contained in all publications are solely those of the individual author(s) and contributor(s) and not of MDPI and/or the editor(s). MDPI and/or the editor(s) disclaim responsibility for any injury to people or property resulting from any ideas, methods, instructions or products referred to in the content.