1. Introduction
Sectors such as the textile, paper, leather and food industries have resorted to the greater production and use of chemicals in order to meet the needs of an increasing population. While the sector is growing on the one hand, on the other hand, it poses a threat to nature and life due to its toxic effects when wastewater containing dyes is released into the environment.
One of the dyes frequently found and examined in wastewater is methylene blue (MB). MB is an organic cationic dye with a stable structure that is highly soluble in water and highly toxic. Due to its intense and eye-catching coloring, it is effectively used in the leather production, printing and textile sectors, and is found in wastewater released from these facilities into nature. Thus, it exhibits harmful effects on living beings in one way or another. While these effects are seen in the form of nausea, migraines and nervous disorders for humans interacting with MB [
1], it is reported that it also causes the death of plants because it reduces the oxygen level in water when wastewater is discharged into the environment [
2]. Of course, the risks are not limited to these, as shown in another study. In fact, in the long term, fatal risks such as genetic mutation and cancer are also seen in complex organisms such as humans due to their interaction with MB [
3]. For this reason, the effective uptake of MB from the environment and especially from wastewater is of vital importance [
4,
5,
6,
7].
The removal of pollutants and threatening substances such as heavy metals and dyes has been carried out using methods such as flotation [
8], photocatalytic degradation [
9,
10], adsorption [
1,
2,
3], electrochemical treatment [
11] and oxidative degradation [
12]. These methods are disadvantageous compared to adsorption when considered in terms of the time required, excessive and harmful chemical use, cost effectiveness and energy economy. In addition, in methods such as oxidative degradation, the degradation products of the molecule causing pollution remain in the environment. Among these methods, adsorption has been reported to be a convenient, easy, cheap and practical method. Adsorption is also an effective method as it completely removes the molecule causing pollution from the environment at high rates. Carbon-based activated carbons have mostly been used in studies on the removal of MB from wastewater [
13].
Adsorbents with a high surface area and porous structure provide a higher removal efficiency in adsorption. It is known that nanofibers obtained from polymers by the electrospinning method are effective at adsorbing pollutants due to their high surface area and nanostructure. In the literature, such nanofibers have been successfully used to adsorb many heavy metals such as Copper (Cu (II)) and Chrome (Cr (II)) [
14,
15], as well as water-based pollutants such as MB, due to their high adsorption capacity. Among the nanofibers used for this purpose are cellulose acetate (CA) [
16], polylactic acid (PLA) [
17], and various composites such as the PLA-polyacrylonitrile (PAN) composite [
18]; these have been prepared to increase the adsorption performance. PAN, which is effective as an adsorbent, cheap and electrospun, gains function thanks to the nitrile group it contains, and provides more efficient adsorption by aminating with various amine compounds. The amination of functional groups is also among the methods applied to increase efficiency. Nanofibers have also been modified with nanoparticles such as SiO
2 [
19]. On the other hand, it has been reported that composites containing Ni and NiO, when used as catalysts, are sensitive to gas and moisture [
20,
21,
22,
23]. The reason for incorporating NiO nanoparticles into the structure was their catalytic effect and ability to provide n–π interactions between oxygen and the aromatic ring of MB molecules [
20,
24]. On the other hand, it was expected that TEA, as an amine compound, would also affect nitrile (-CN) groups and increase electrostatic interaction. Considering these effects, PAN nanofibers were modified with NiO and/or TEA to increase MB adsorption [
15,
24,
25,
26].
However, no study has performed MB adsorption and compared it with PAN nanofibers containing Ni and functionalized with tea. Since it was believed that this gap in the literature would be filled, this study aimed to increase the efficiency of MB adsorption in electrospun PAN obtained by treating it with Ni and TEA. This study is the first to do so. In this context, a certain amount of PAN (PAN-nl) was aminated with TEA (Am/PAN/Ni-nl) and used in MB adsorption. The adsorption of PAN-nl, PAN/Ni-nl and Am/PAN/Ni-nl MB was compared in terms of the maximum adsorption capacity.
2. Material and Methods
2.1. Materials
PAN (molecular weight of 160,000 g/mol), N,N-dimethylformamide (DMF ≥ 99.9%), Ethanol, Nickel nitrate [Ni(NO3)2·6H2O], Triethanolamine (TEA) and MB were purchased from Sigma-Aldrich, Darmstadt, Germany. The pH of the solutions was adjusted by adding 0.1 mol L−1 HNO3 or 0.1 mol L−1 NaOH solutions dropwise.
2.2. Methods
Instrumental: Brunauer–Emmett–Teller (BET) (Quantachrome Nova 1200 series instrument, Boynton Beach, FL, USA), Attenuated total reflectance–Fourier transform infrared spectroscopy (ATR FT-IR) (Bruker Vertex 70 FTIR device, Bruker Corporation, Karlsruhe, Germany), scanning electron microscope (SEM) (ZEISS Evo/LS 10 electron microscope, Cambridge, UK), Ultra violet–visible (UV-Vis) (Hitachi U-0080D, Hitachi, Tokyo, Japan), pH meter (Mettler-Toledo, Columbus, OH, USA).
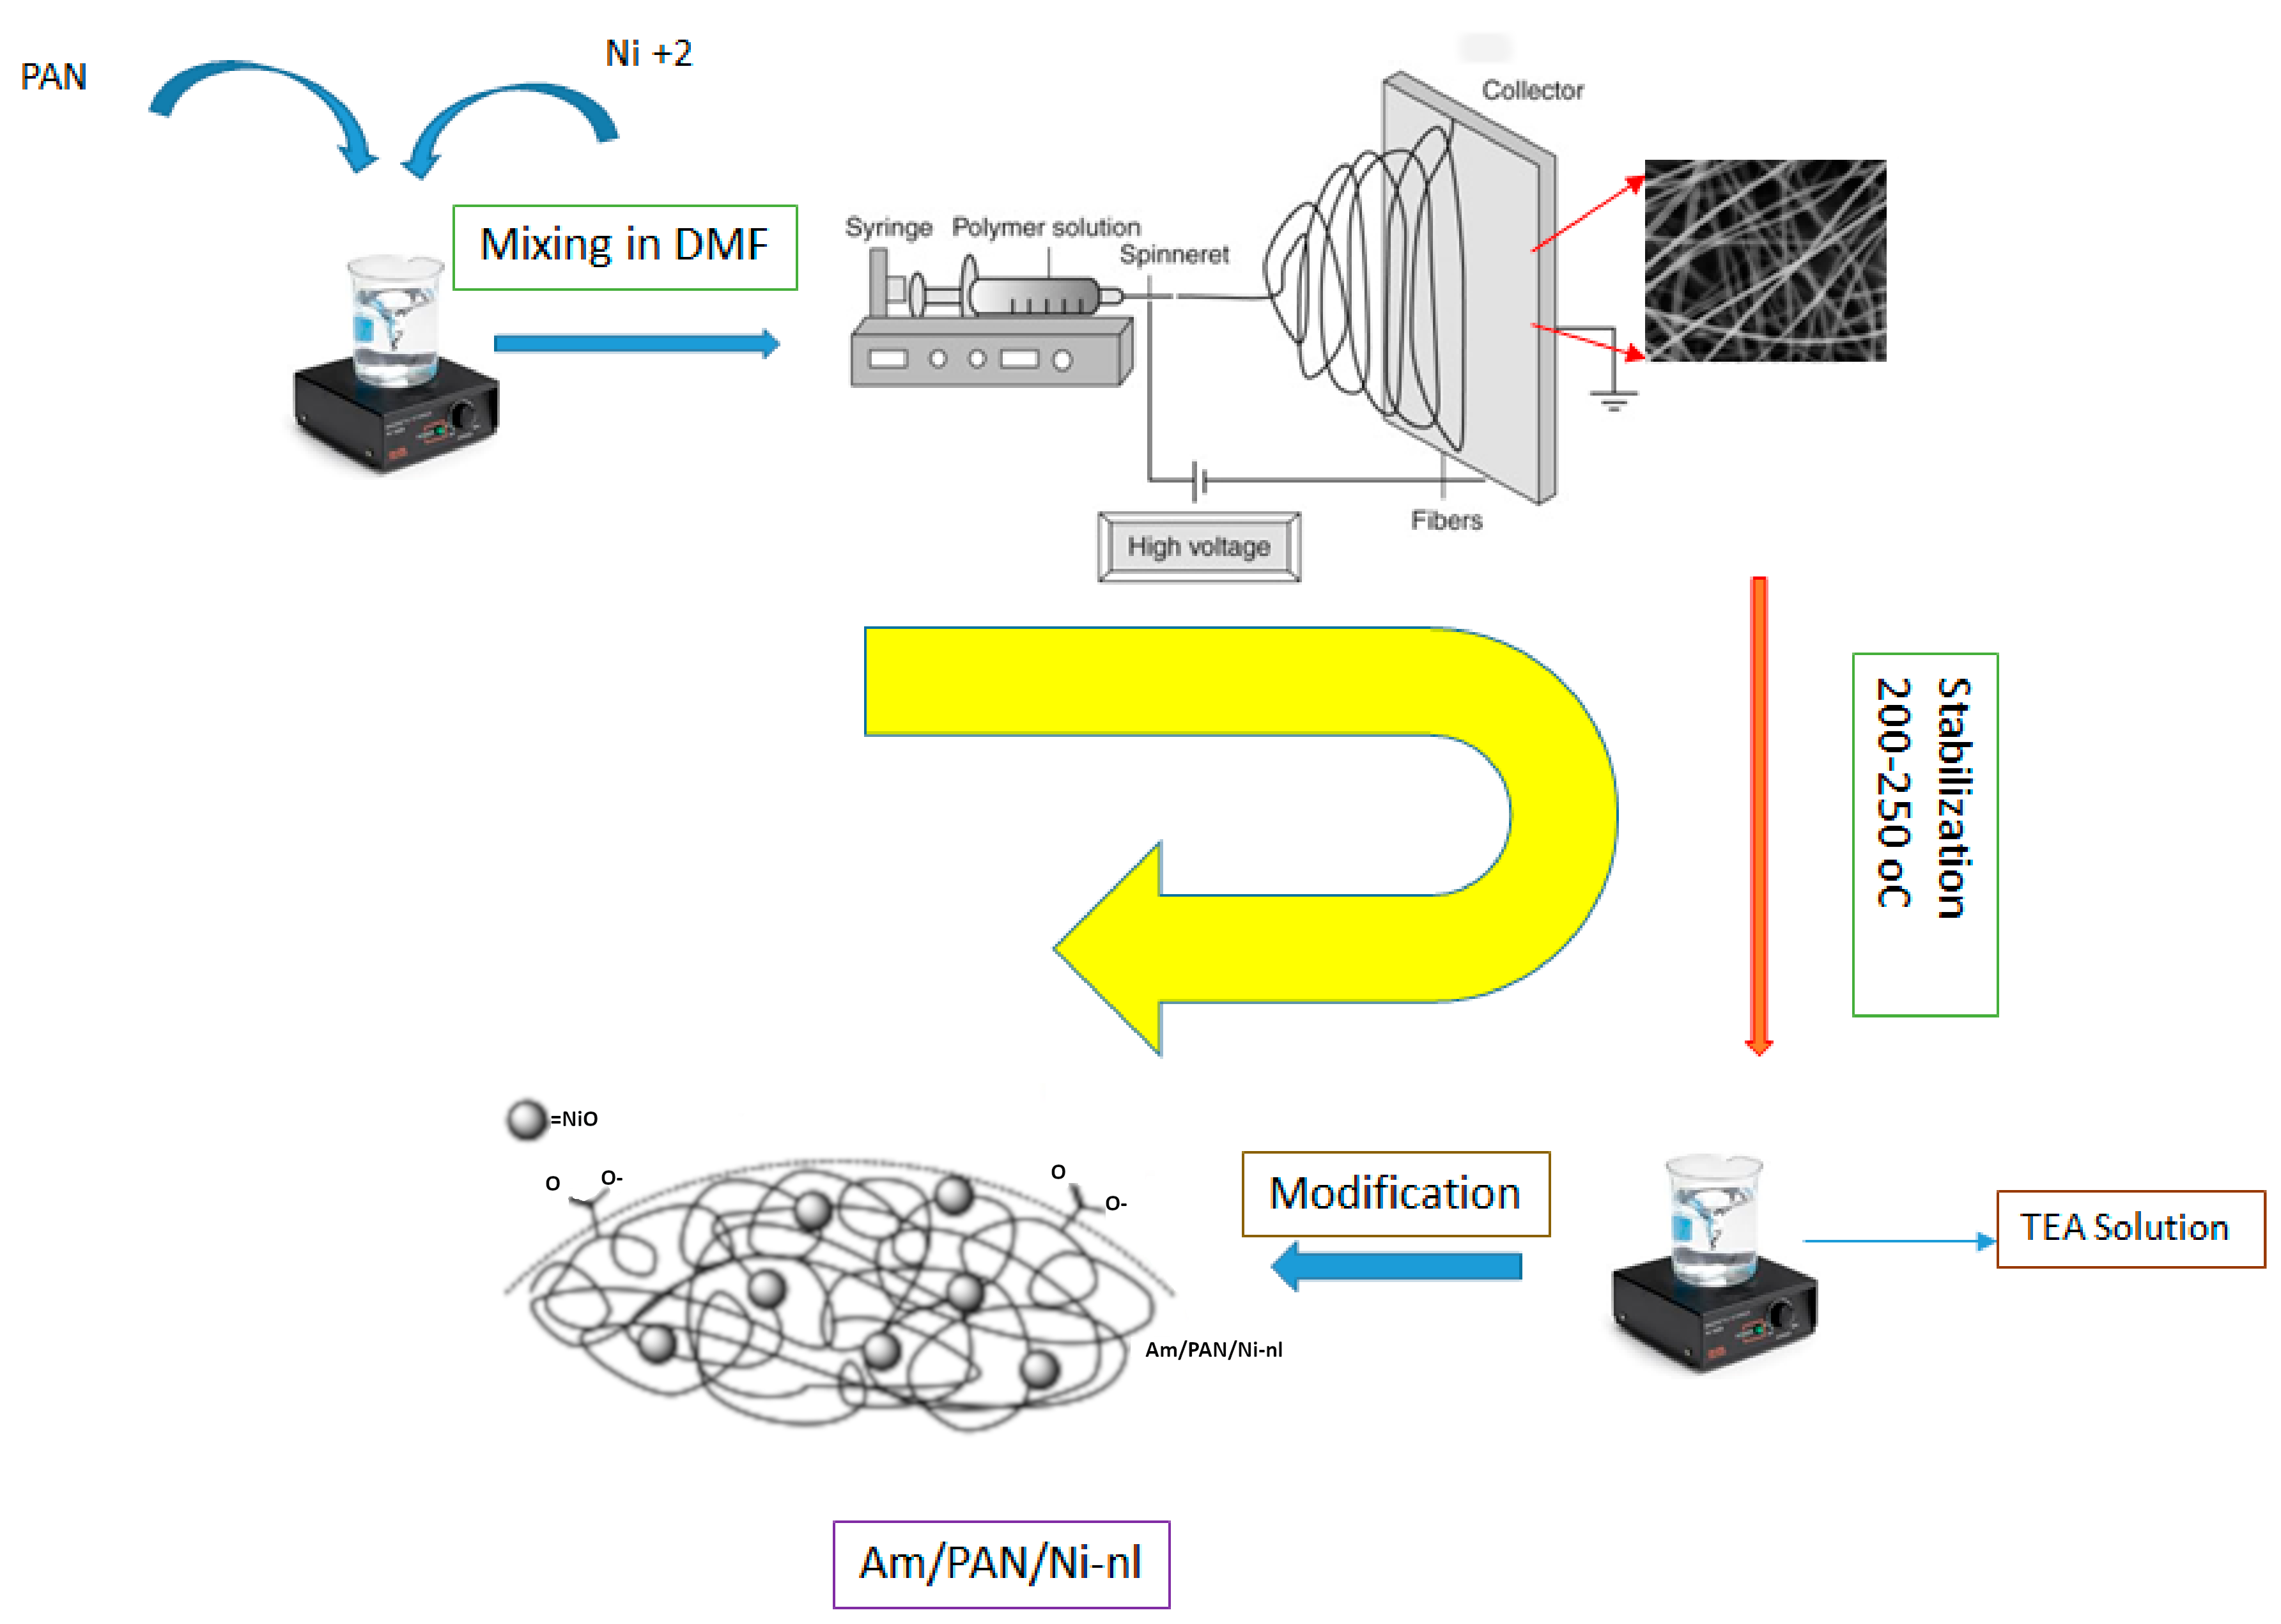
Preparation of nanofibers: PAN electrospun polymers were prepared based on Ref. [
27]. Using DMF as the solvent, a solution containing 10% PAN was prepared by weighing the calculated amount. It was continuously stirred at 60 °C to obtain a homogeneous solution. A 10 mL syringe was filled with this solution and electrospun. The applied electrospinning conditions were as follows: Nanofibers were obtained by applying a voltage of 25 KV. The aluminum plate used as a collection plate was placed at a distance of 15 cm. The negative electrode was connected to the aluminum plate, and the positive electrode was connected to the tip of the syringe containing the polymer solution. The flow rate of the polymer from the syringe was set to 4 mL min
−1. The electrospinning process was continued until the PAN solution in the syringe was depleted. The obtained nanofiber network (PAN-nl) was stored in room conditions for later treatment with Ni
+2 and/or TEA.
NiO incorporation: PAN/Ni-nl was prepared by adding 3% Ni(NO
3)
2·6H
2O to the preparation solution (%10 PAN-DMF solution) described above. At this stage, the obtained nanofibers were stabilized at 250 °C, at which point Ni
+2 ions became NiO or Ni nanoparticles with the help of oxygen in the air and dispersed in the network [
28].
TEA treatment: The amination method with TEA was applied to both nanofibers. The final products obtained were named as Am/PAN-nl for PAN-nl and Am/PAN/Ni-nl for PAN/Ni-nl. The amination process was carried out as follows [
15]: 0.1 g of nanofiber network was added to the mixture containing 50 mL of TEA and 2 g of NaOH. The reaction was continued at 80–90 °C for 4–5 h. Then, the fiber mat was washed with distilled water and ethanol and dried at room temperature. The flow of the applied processes is shown in
Scheme 1.
2.3. Adsorption Studies
A 500 ppm MB stock solution was prepared. The concentration effect was investigated at 7 different concentrations (5 ppm, 10 ppm, 50 ppm, 100 ppm, 150 ppm, 200 ppm, 300 ppm) in the range of 0−500 ppm. Experimental solutions with the desired concentration were prepared from this stock by dilution. The pH effect was examined at 6 different values (3, 5, 6, 7, 9, 11) in the range of 0−14. The pH of the solution was adjusted by adding 0.1 M NaOH and/or 0.1 M HCl dropwise until the desired pH was reached. It was checked with a pH meter. Except for the temperature effect examination, it was kept constant at 30 °C for other effects. The use of 0.1 g of adsorbent and 50 mL of experimental solution was constant for each experimental stage. PAN-nl (unmodified PAN as baseline) was tested under the same conditions for other adsorbents and the results obtained were compared. The procedure applied to find the amount of substance adsorbed on the adsorbent is explained below: at the end of each experimental period, the absorbances of the solution at 664 nm were read. Each reading was repeated 3 times and averaged. The concentration of MB remaining in the solution was determined based on the equation (Beer–Lambert) obtained from the calibration curve using the absorbance values of solutions with known concentrations. From here, the amount of substance adsorbed was calculated as mg g
−1 with the equation given below:
Here, Ci (mg L−1) and Cf (mg L−1) represent the concentration values of MB obtained at the beginning and at the end of the period, respectively, V represents the volume of the solution used in the experiment (L), and W represents the weight of the adsorbent used in the experiment (g).
2.4. Adsorption Isotherm
Adsorption isotherms: Adsorption equilibrium isotherms include theorems that allow the maximum amount of substance adsorbed on the adsorbent surface to be obtained and to comment on whether the adsorption exhibits a heterogeneous or homogeneous orientation on the adsorbent surface. One of these is the Langmuir isotherm (Equation (2)) [
13,
29], the equation of which is given below.
Here,
qe (mg g
−1) and
Ce (mg L
−1) are the amount of substance adsorbed at equilibrium, and the equilibrium concentration
qmax (mg g
−1) represents the maximum amount of substance that can be adsorbed, respectively. These data can be found using the Langmuir isotherm.
KL is the equilibrium constant, and
RL (Equation (3)) is a constant that depends on the adsorption energy, which helps us determine whether adsorption is supported or not. If this value is greater than 1, adsorption is unfavorable, if it is between 0 and 1, it is favorable, and if it is equal to 0, it is irreversible [
28].
Another isotherm is the Freundlich isotherm given by Equation (4) [
26,
30].
With the help of this isotherm, the degree of adsorption (n) and the adsorption constant KF can be determined.
2.5. Adsorption Kinetics
Here, to investigate how the adsorption process changes depending on the motion, Lagargren pseudo-first [
13], (Equation (5)), pseudo-second [
29] (Equation (6)), and intraparticle diffusion [
13] (Equation (7)) kinetic models were examined.
2.6. Thermodynamic Data
These data are temperature dependent and are calculated based on the Van’t Hoff equation (Equations (8) and (9)) for adsorption enthalpy.
Here, ΔH, ΔS and ΔG give the Enthalpy, Entropy and Gibbs free energy changes in adsorption, respectively.
2.7. Response Surface Methodology (RSM) for Experimental Design
When the adsorption reached equilibrium, modeling was performed to provide the association between the amount of adsorbed substance (
qe) and the temperature, concentration, time, amount of adsorbent and pH of the medium in the form of a relationship. These are the independent variables that control the adsorption. Analysis of variance (ANOVA) diagrams were used for this purpose [
13,
29]. The parameters and ranges used in this modelling are presented in
Table 1.
3. Result and Discussion
3.1. Characterization
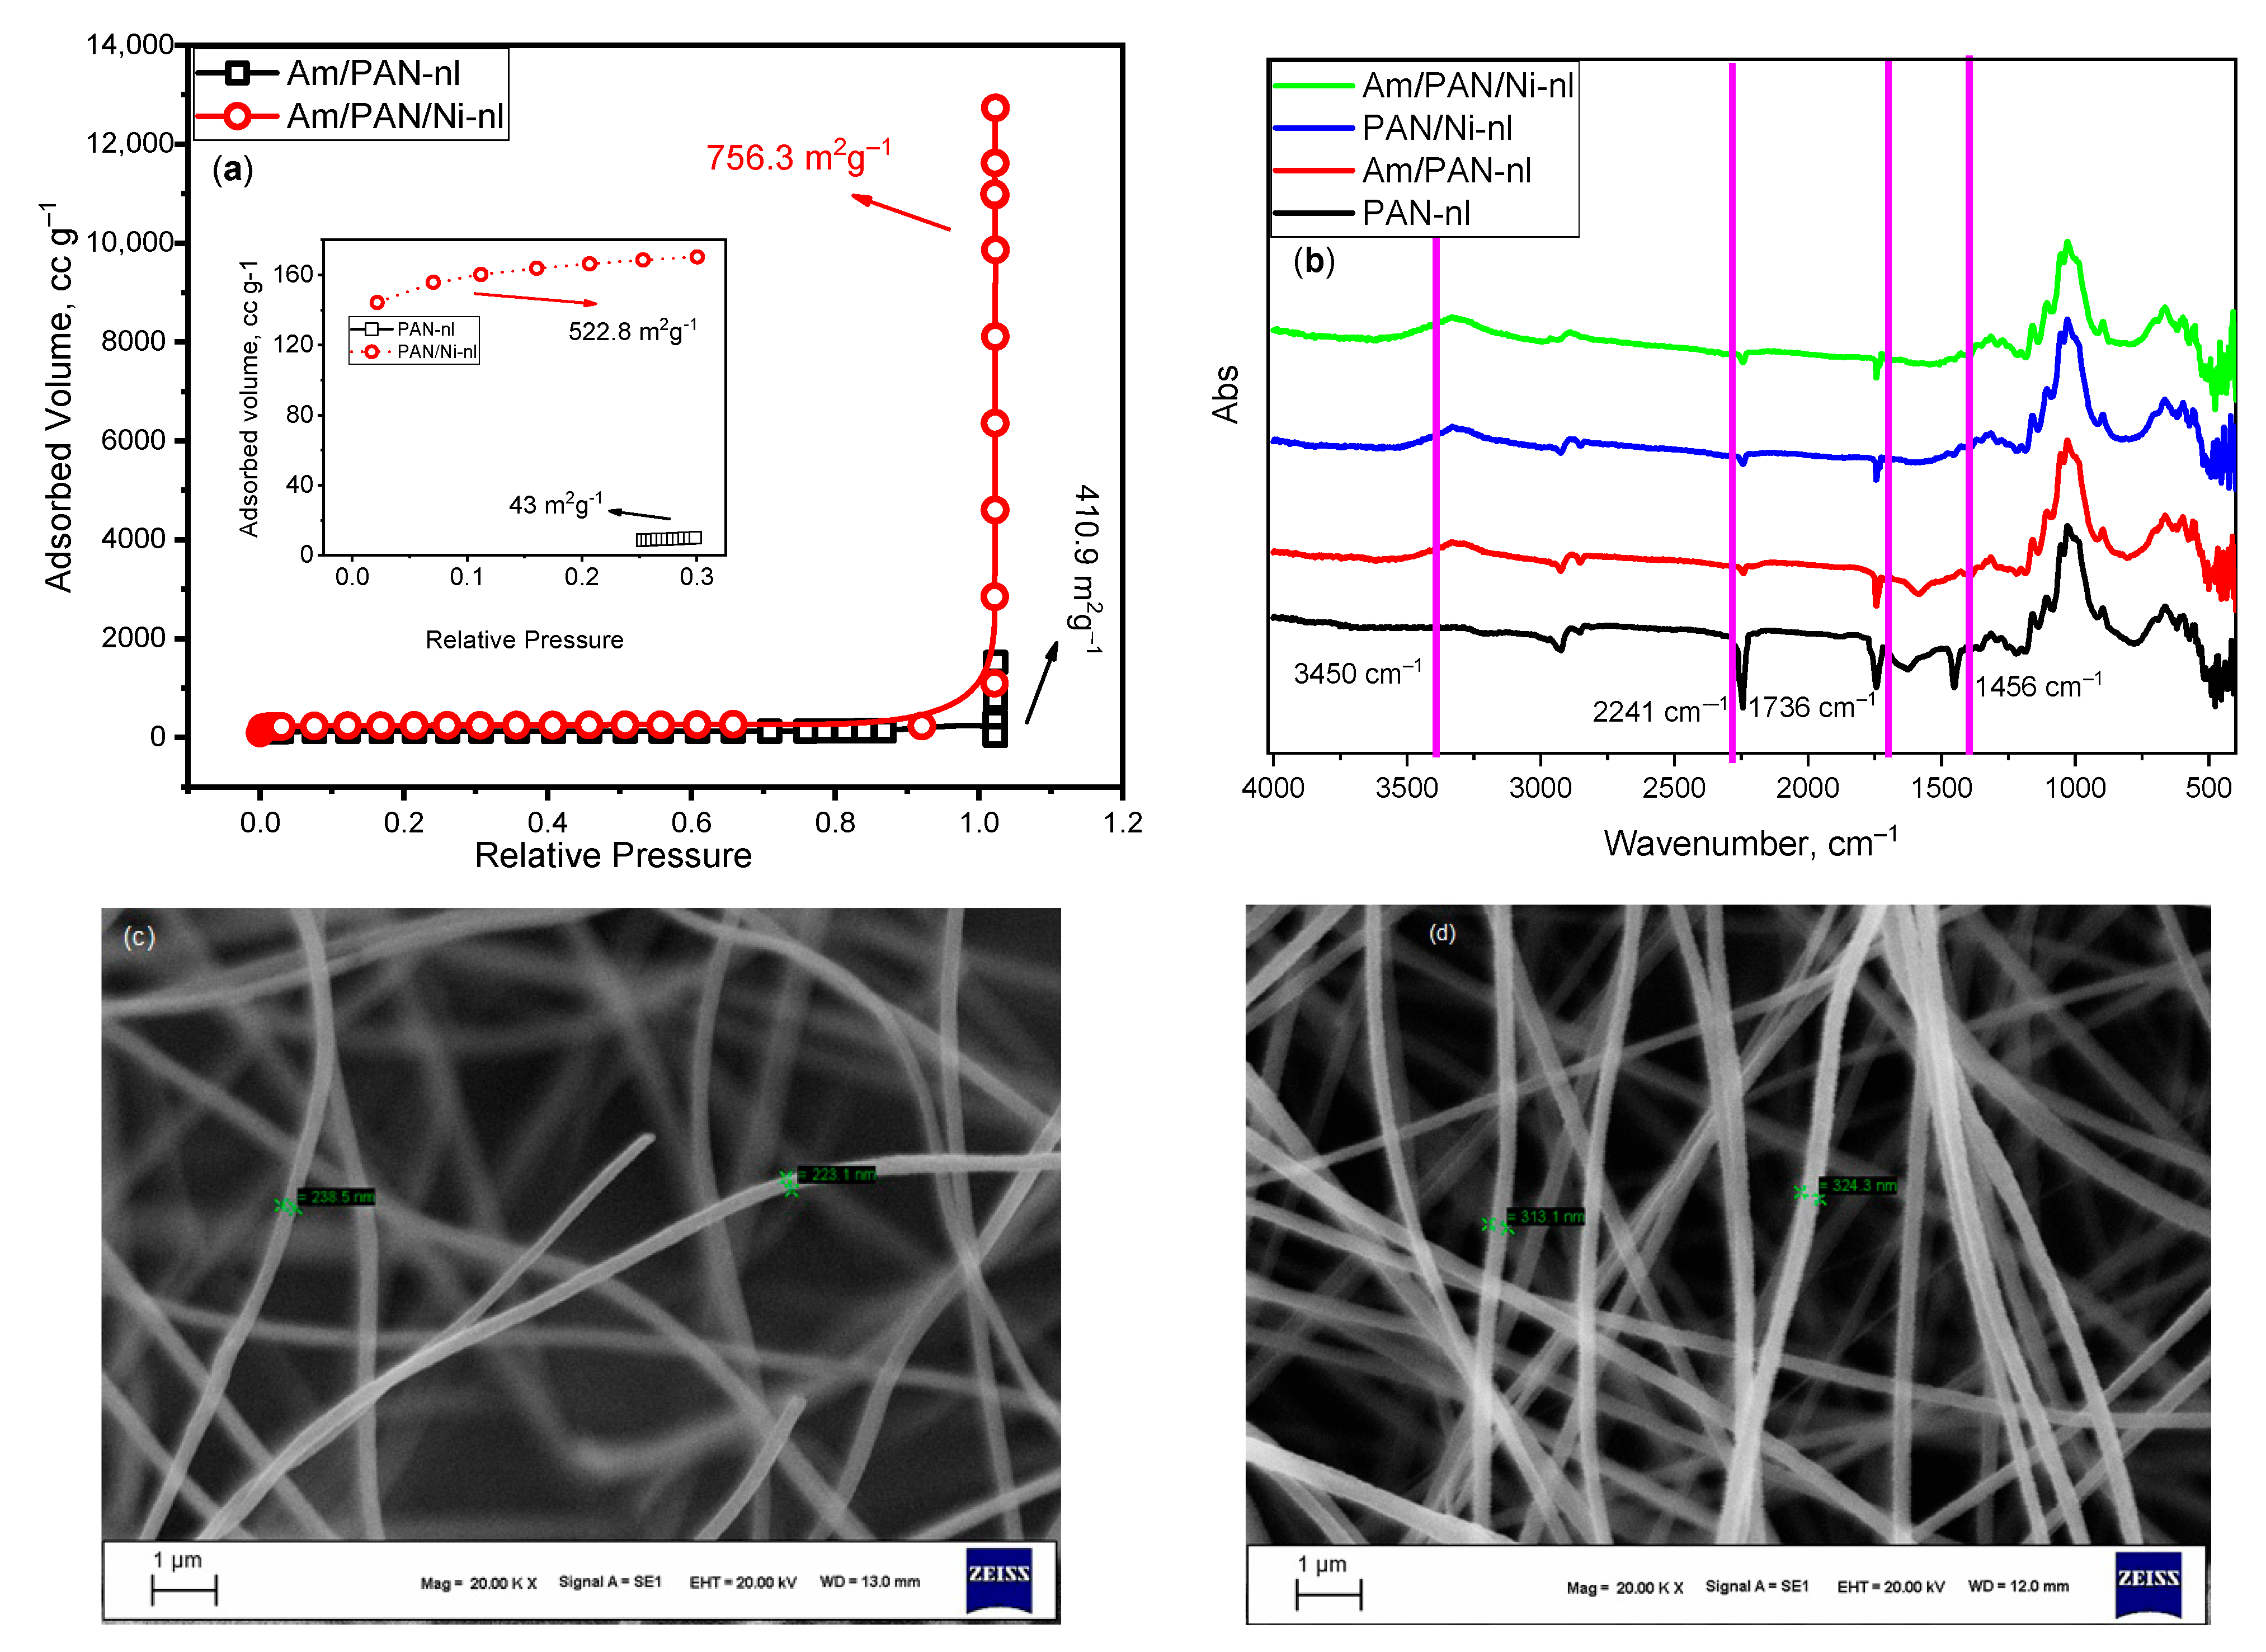
The surface areas of the obtained nanofibers are given in
Figure 1a, and the inset graph in the same figure shows the surface areas of PAN-nl and PAN/Ni-nl. Since the surface areas of these nanofibers are less than their TEA-treated forms, they are given as a separate graph. When the graph is examined, it is seen that Ni
+2 and treatment with TEA create more active sites on the surface, giving it a higher surface area. While treatment with TEA increased the surface area of PAN-nl from 43 m
2 g
−1 to 410 m
2 g
−1, incorporating NiO into the structure increased the surface area to 522.8 m
2 g
−1.
The PAN-Ni(NO
3)
2 mixture was electrospun under certain conditions and its oxidation was ensured during stabilization. In this way, NiO nanoparticles were formed and these particles were included in the structure. Here, the interaction between oxygen and the nitrile group may be in question. In our previous study and in the literature, it was reported that the presence of nanoparticles in the structure increases the active surface area due to adsorption [
20].
On the other hand, it is thought that the -R-OH group attached to N in TEA is connected to the carbon in the nitrile group and that the remaining -N(ROH)
2 group in TEA is connected to N in the -CN group [
31]. It is thought that the addition of NiO nanoparticles to the structure and the treatment of the PAN as raw material precursor with TEA gave it extra functionality compared to PAN. These are the sites that can serve as active sites for adsorbents. Some of the -CN groups of PAN are aminated when treated with amine compounds [
15,
31]. This is supported by the decrease in the CN group peak intensity at 2245 cm
−1 and 1250 cm
−1 in the FT-IR spectrum (
Figure 1b) [
31].
The FT-IR spectrum was obtained to see the pre-existing bonds in the obtained fiber network structure and the bonds that were newly formed or lost their effect after the treatment. The spectrum obtained in the wave number range of 400 and 4000 cm
−1 is given in
Figure 1b. The characteristic peaks of the nitrile group found in the structure of PAN at 2241 cm
−1, 1736 cm
−1 and 1456 cm
−1 disappeared after interaction with Ni and TEA [
31].
It was reported in the literature that the modification of PAN with amine compounds under basic conditions caused some of the nitrile groups in its structure to undergo amination and transform into the -COO
− functional group. For this reason, the peak belonging to the nitrile group at 2241 cm
−1 and 1456 cm
−1 was significantly reduced and was not visible. However, the -C=O acrylate stretching peak at 1736 cm
−1 did not undergo a significant change. On the other hand, there is a very broad peak orientation in the hydrogen bond region (3400–3600 cm
−1). This orientation is expressed as the presence of hydrogen bonding originating from amination in the structure. For this reason, the results obtained were found to be compatible with the literature [
31].
The SEM images of PAN-nl and Am/PAN/Ni-nl are shown in
Figure 1c,d, respectively. It was observed that the PAN-nl network consisted of fibers with a diameter of 220–230 nm, while the AM/PAN/Ni-nl network consisted of fibers with a diameter of 310–320 nm. The fibers gained roughness and fluffiness after modification with NiO and TEA. This change may be due to the change in the functional group in the structure after the modification and/or addition of NiO to the structure. This is because a larger diameter was expected due to the transformation of some of the C nitrile groups into amine and -COO
− groups. In addition, it was also expected that the addition of NiO nanoparticles to the structure would cause an increase in the nanofiber diameter. When all these effects are considered, the increase in diameter, although small, may seem significant. As a result, among the obtained adsorbents, the Am/PAN/Ni-nl adsorbent with the highest BET surface area showed a greater adsorption performance than the other adsorbents. The increase in surface area can be explained by the addition of NiO nanoparticles to the structure [
31] and the increase in functional groups. This can also be observed in SEM images showing the change in nanofiber diameters. Since the surface area increased with the addition of NiO nanoparticles and the addition of new functional groups to the structure creates a more active site for MB uptake, the adsorption performance increased accordingly.
3.2. Adsorption Studies
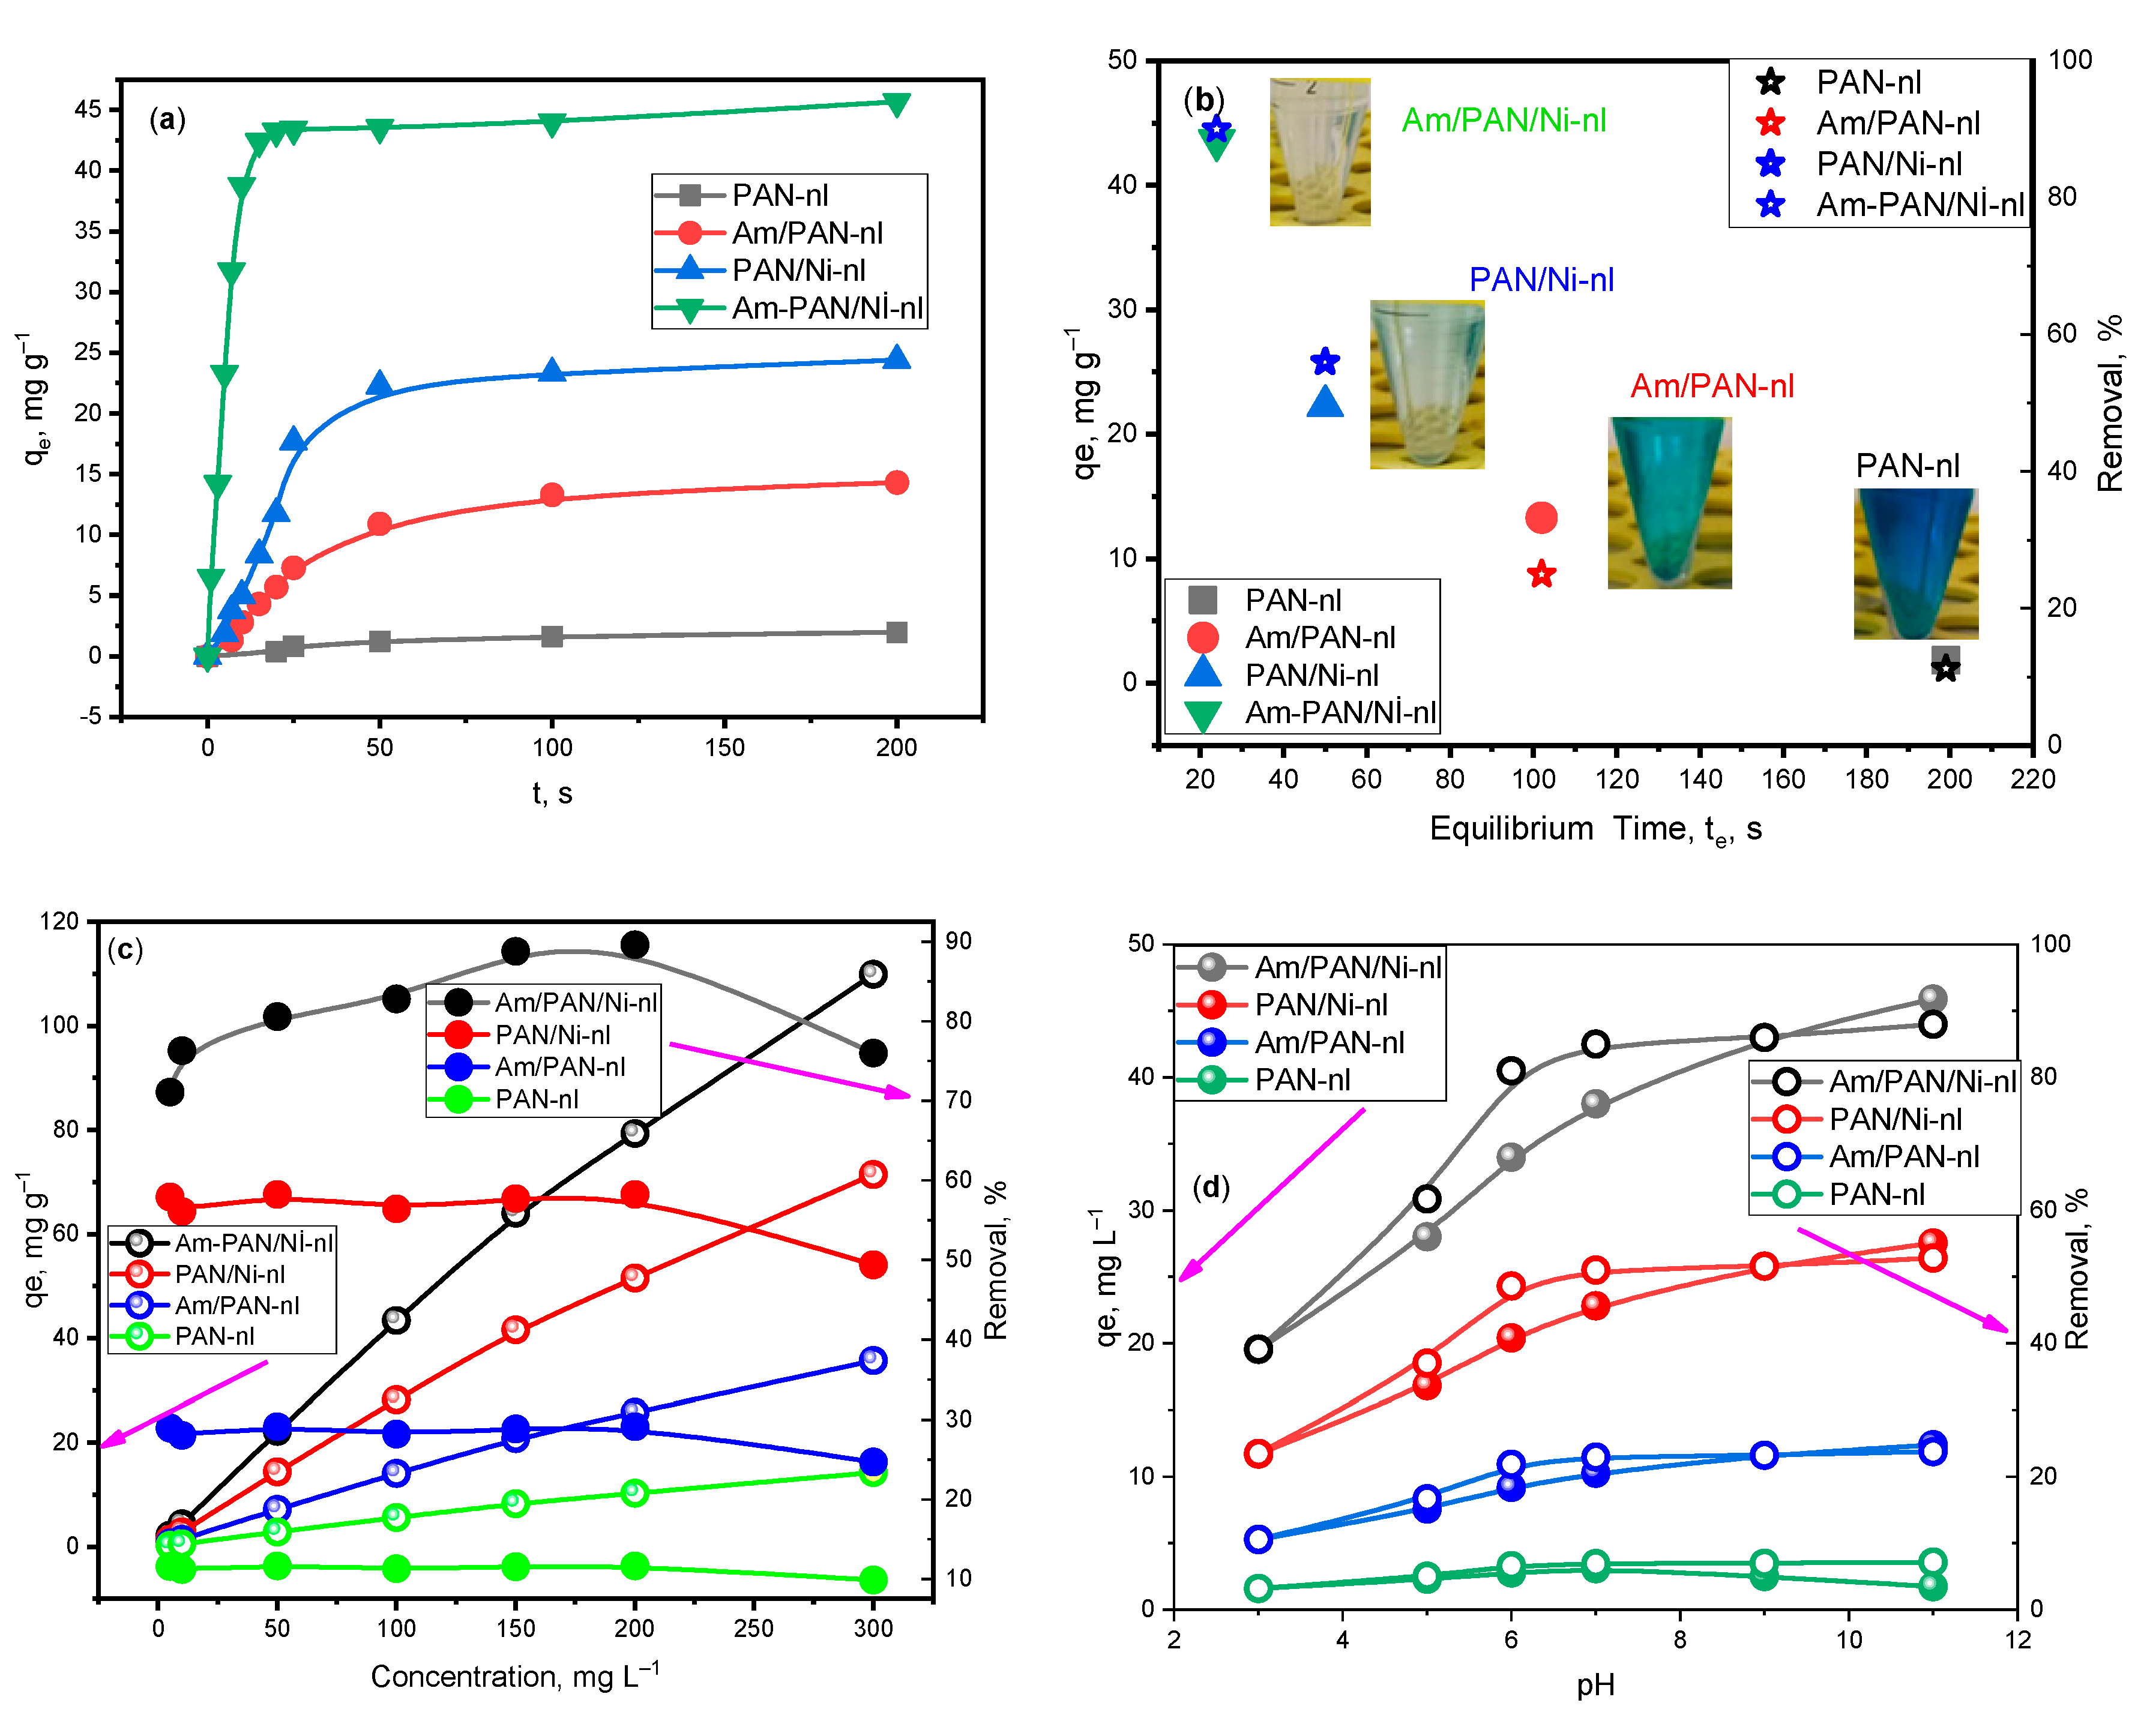
The
qe values obtained over time in the adsorption experiment performed with 100 ppm of different adsorbents are given in
Figure 2a. Accordingly, while equilibrium was reached with PAN-nl in 200 min with 1.85 mg g
−1, with Am/PAN-nl, it was reached with 13.3 mg g
−1 in 100 min. It was observed that the equilibrium amount adsorbed reached 58.6 mg g
−1 with the inclusion of NiO nanoparticles. With treatment with both Ni
+2 and TEA, 45.96 mg g
−1 was reached. It was understood that this Ni
+2 and the treatment with TEA created regions that provided suitable n-π transitions for MB adsorption. In this way, the time to reach equilibrium was shortened as the adsorbents were processed and the amount adsorbed at the equilibrium time increased. This change is shown graphically in
Figure 2b. In addition, the photographs of the obtained solutions are shown next to the relevant adsorbent values in order to emphasize the performance.
In this study, it was seen that adsorption was supported at high concentrations (
Figure 2c) and pHs (
Figure 2d). As the concentration and pH increased, the amount adsorbed at equilibrium increased but the removal percentage decreased after reaching equilibrium at 200 ppm and pH 9. This may be due to the adsorption of active sites with MB molecules [
32]. However, equilibrium tended to be reached at pH 7–9 for the
qe and removal percent. In addition, MB adsorption at low pHs decreased because the adsorbent was protonated with H
+ ions and thus gained a + charge, and because the cationic structures of MB electrostatically repelled each other. In contrast, at high pHs, since the presence of OH
− ions in the environment and the adsorbent surface coordinated with OH
− groups, MB molecules were electrostatically attracted by the adsorbent surface groups and the adsorption increased, which was an expected result [
25,
26,
33,
34]. Higher yields were obtained from PAN-nl via treatment with Ni
+2 and TEA at different pHs. While
qe was calculated as 1.85 mg g
−1 for PAN-nl at pH 9, it was calculated as 45.96 mg g
−1 for Am/PAN/Ni-nl.
In the literature, adsorbents recently prepared for MB removal and the adsorbent obtained in this study were compared in terms of their adsorption capacity and equilibrium time. The obtained data are compiled in
Table 2.
According to the data, the adsorbent capacity of PAN/B- cyclodextrin was reported as 108.66 mg g−1 at the end of 200 min. With the composite formed with cellulose acetate graphene oxide and zeolite, an absorption capacity of 236.76 mg g−1 was obtained at an equilibrium time of 120 min. Nanofibers obtained from keratin showed a lower beta surface area, with a value of 13.59 m2 g−1, compared to the nanofibers obtained in this study. While the adsorption capacity was 170 mg g−1, the equilibrium time was reported to be 60 min. With the adsorbent obtained in this study, a 20 min equilibrium time and 45.96 mg g−1 adsorption capacity were obtained. When the results are compared, based on the unit time, the Am/PAN/Ni-nl obtained in this study could be a candidate for MB adsorption.
3.3. Adsorption Isotherms
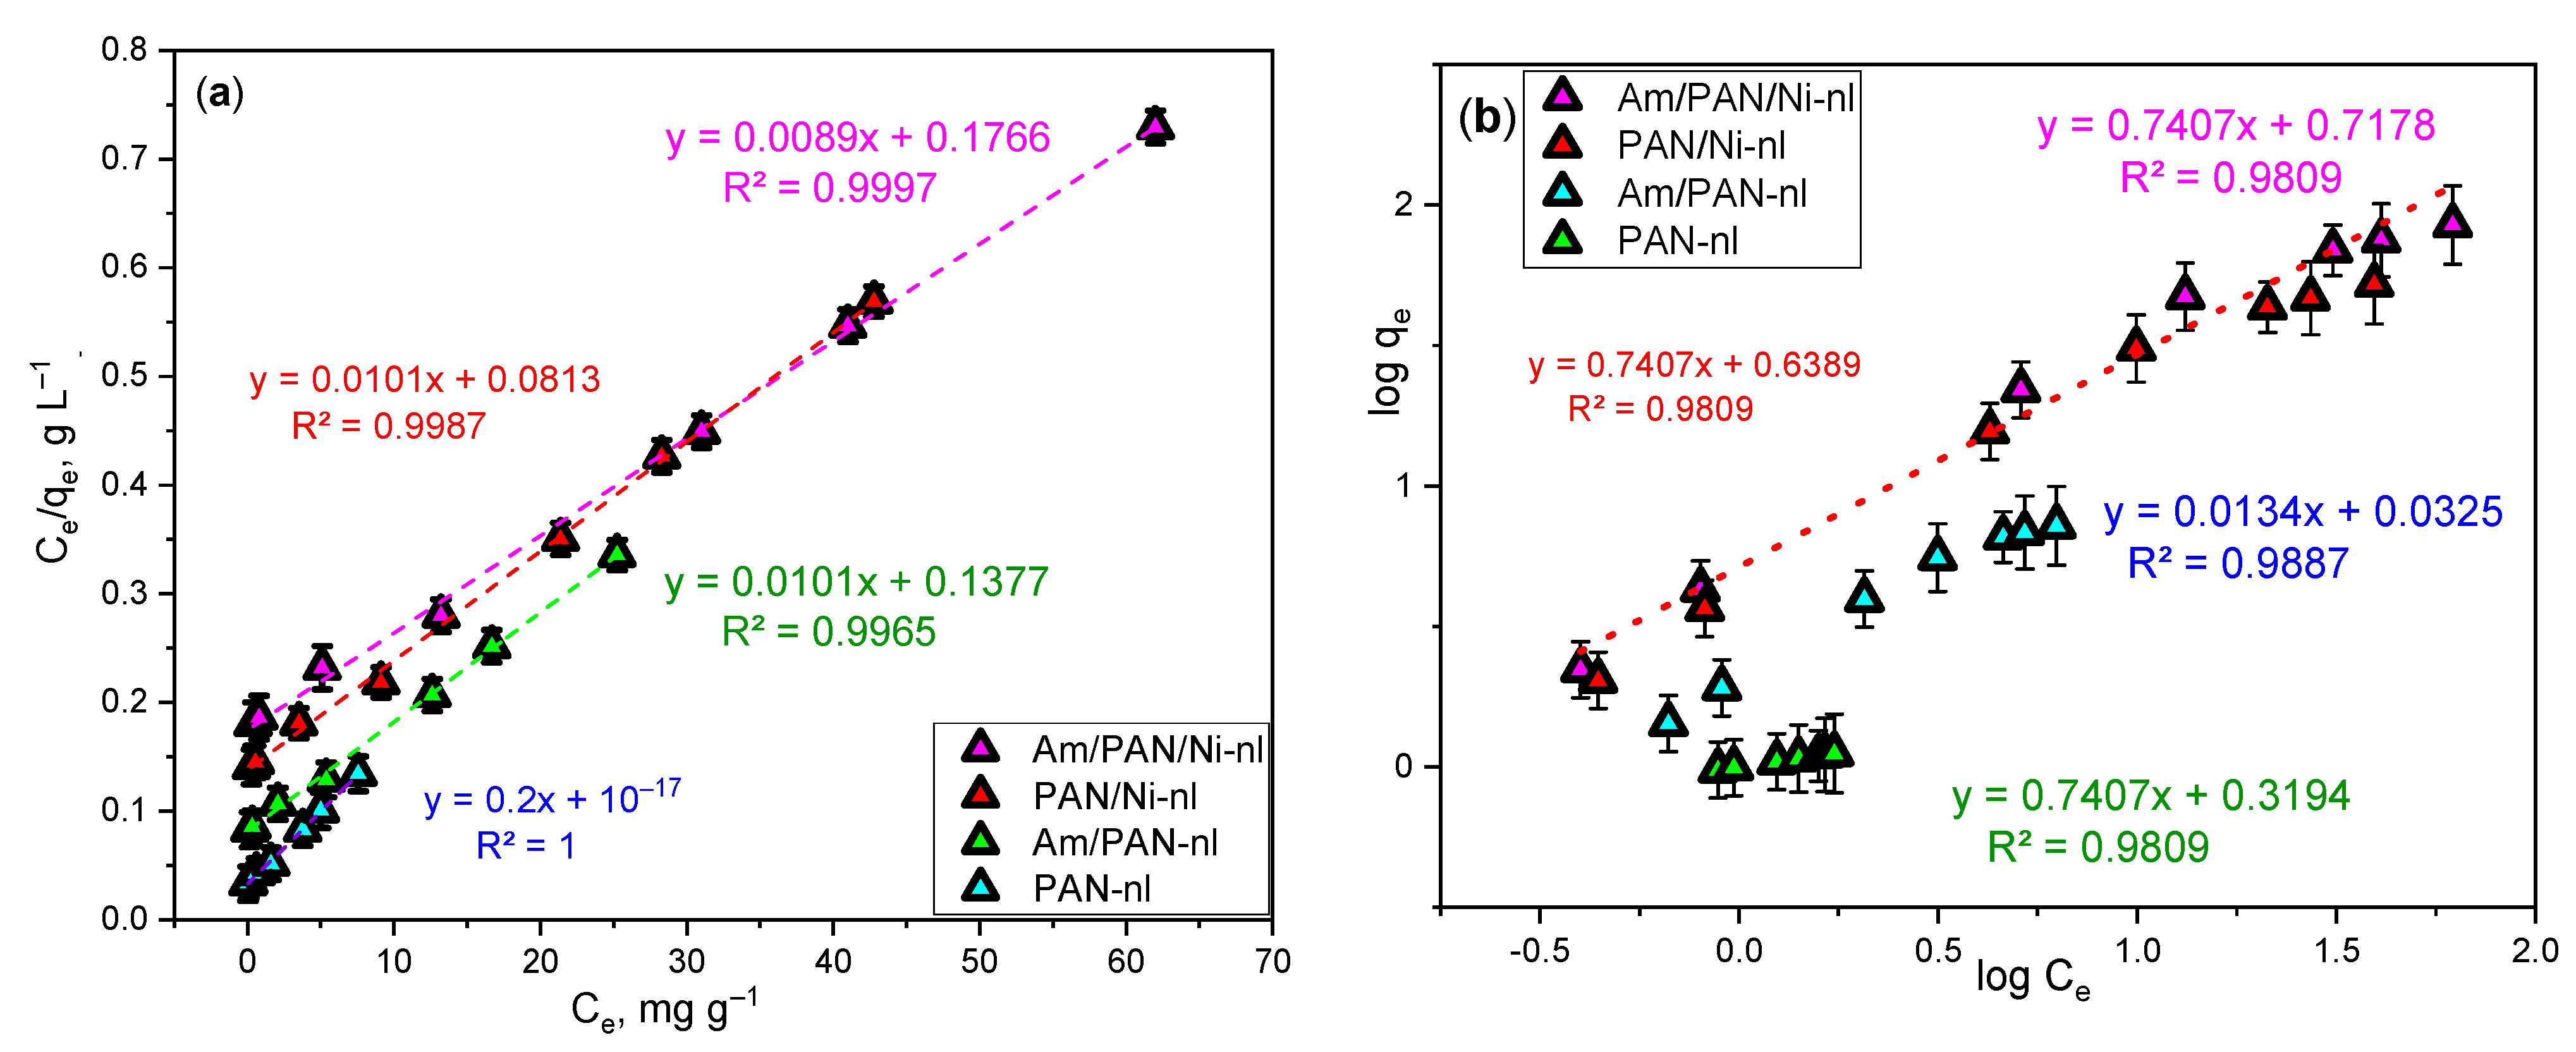
The evaluation of the adsorption results at constant temperature has been performed by most researchers using Langmuir and Freundlich isotherm graphs [
13,
17,
26,
29,
30]. These graphs were also used in this study for the same purpose. The evaluation was performed based on the data obtained from the adsorbent showing the best MB adsorption (
Figure 3). The equilibrium data obtained from these graphs are also given for MB adsorption in
Table 3.
The most suitable adsorption isotherm was the Langmuir isotherm, with an R2 value varying between 0.998 and 1 and an error bar of 0.01. The R2 value and the error bar were also in the range of 0.98 and 0.15 for the Freundlich isotherm, respectively. For this reason, the Langmuir isotherm was selected as the most suitable. Accordingly, the adsorbent surface showed homogeneous and monolayer adsorption, and when the data obtained from these graphs are calculated, it can be seen that the highest KL value is for Am/PAN-nl and the highest qe value is for Am/PAN/Ni-nl. The degree of adsorption varies between 0.89 and 0.82.
The RL value was calculated as 0.22 for the applied conditions. This finding shows that the MB adsorption with Am/PAN/Ni-nl was favorable. On the other hand, as will be explained in the RSM section, according to the model suggested by the method, the highest R2 value was obtained for the quadratic model with 0.9878. Information about the degree was also obtained from kinetic calculations and a comparison was made.
3.4. Adsorption Kinetics
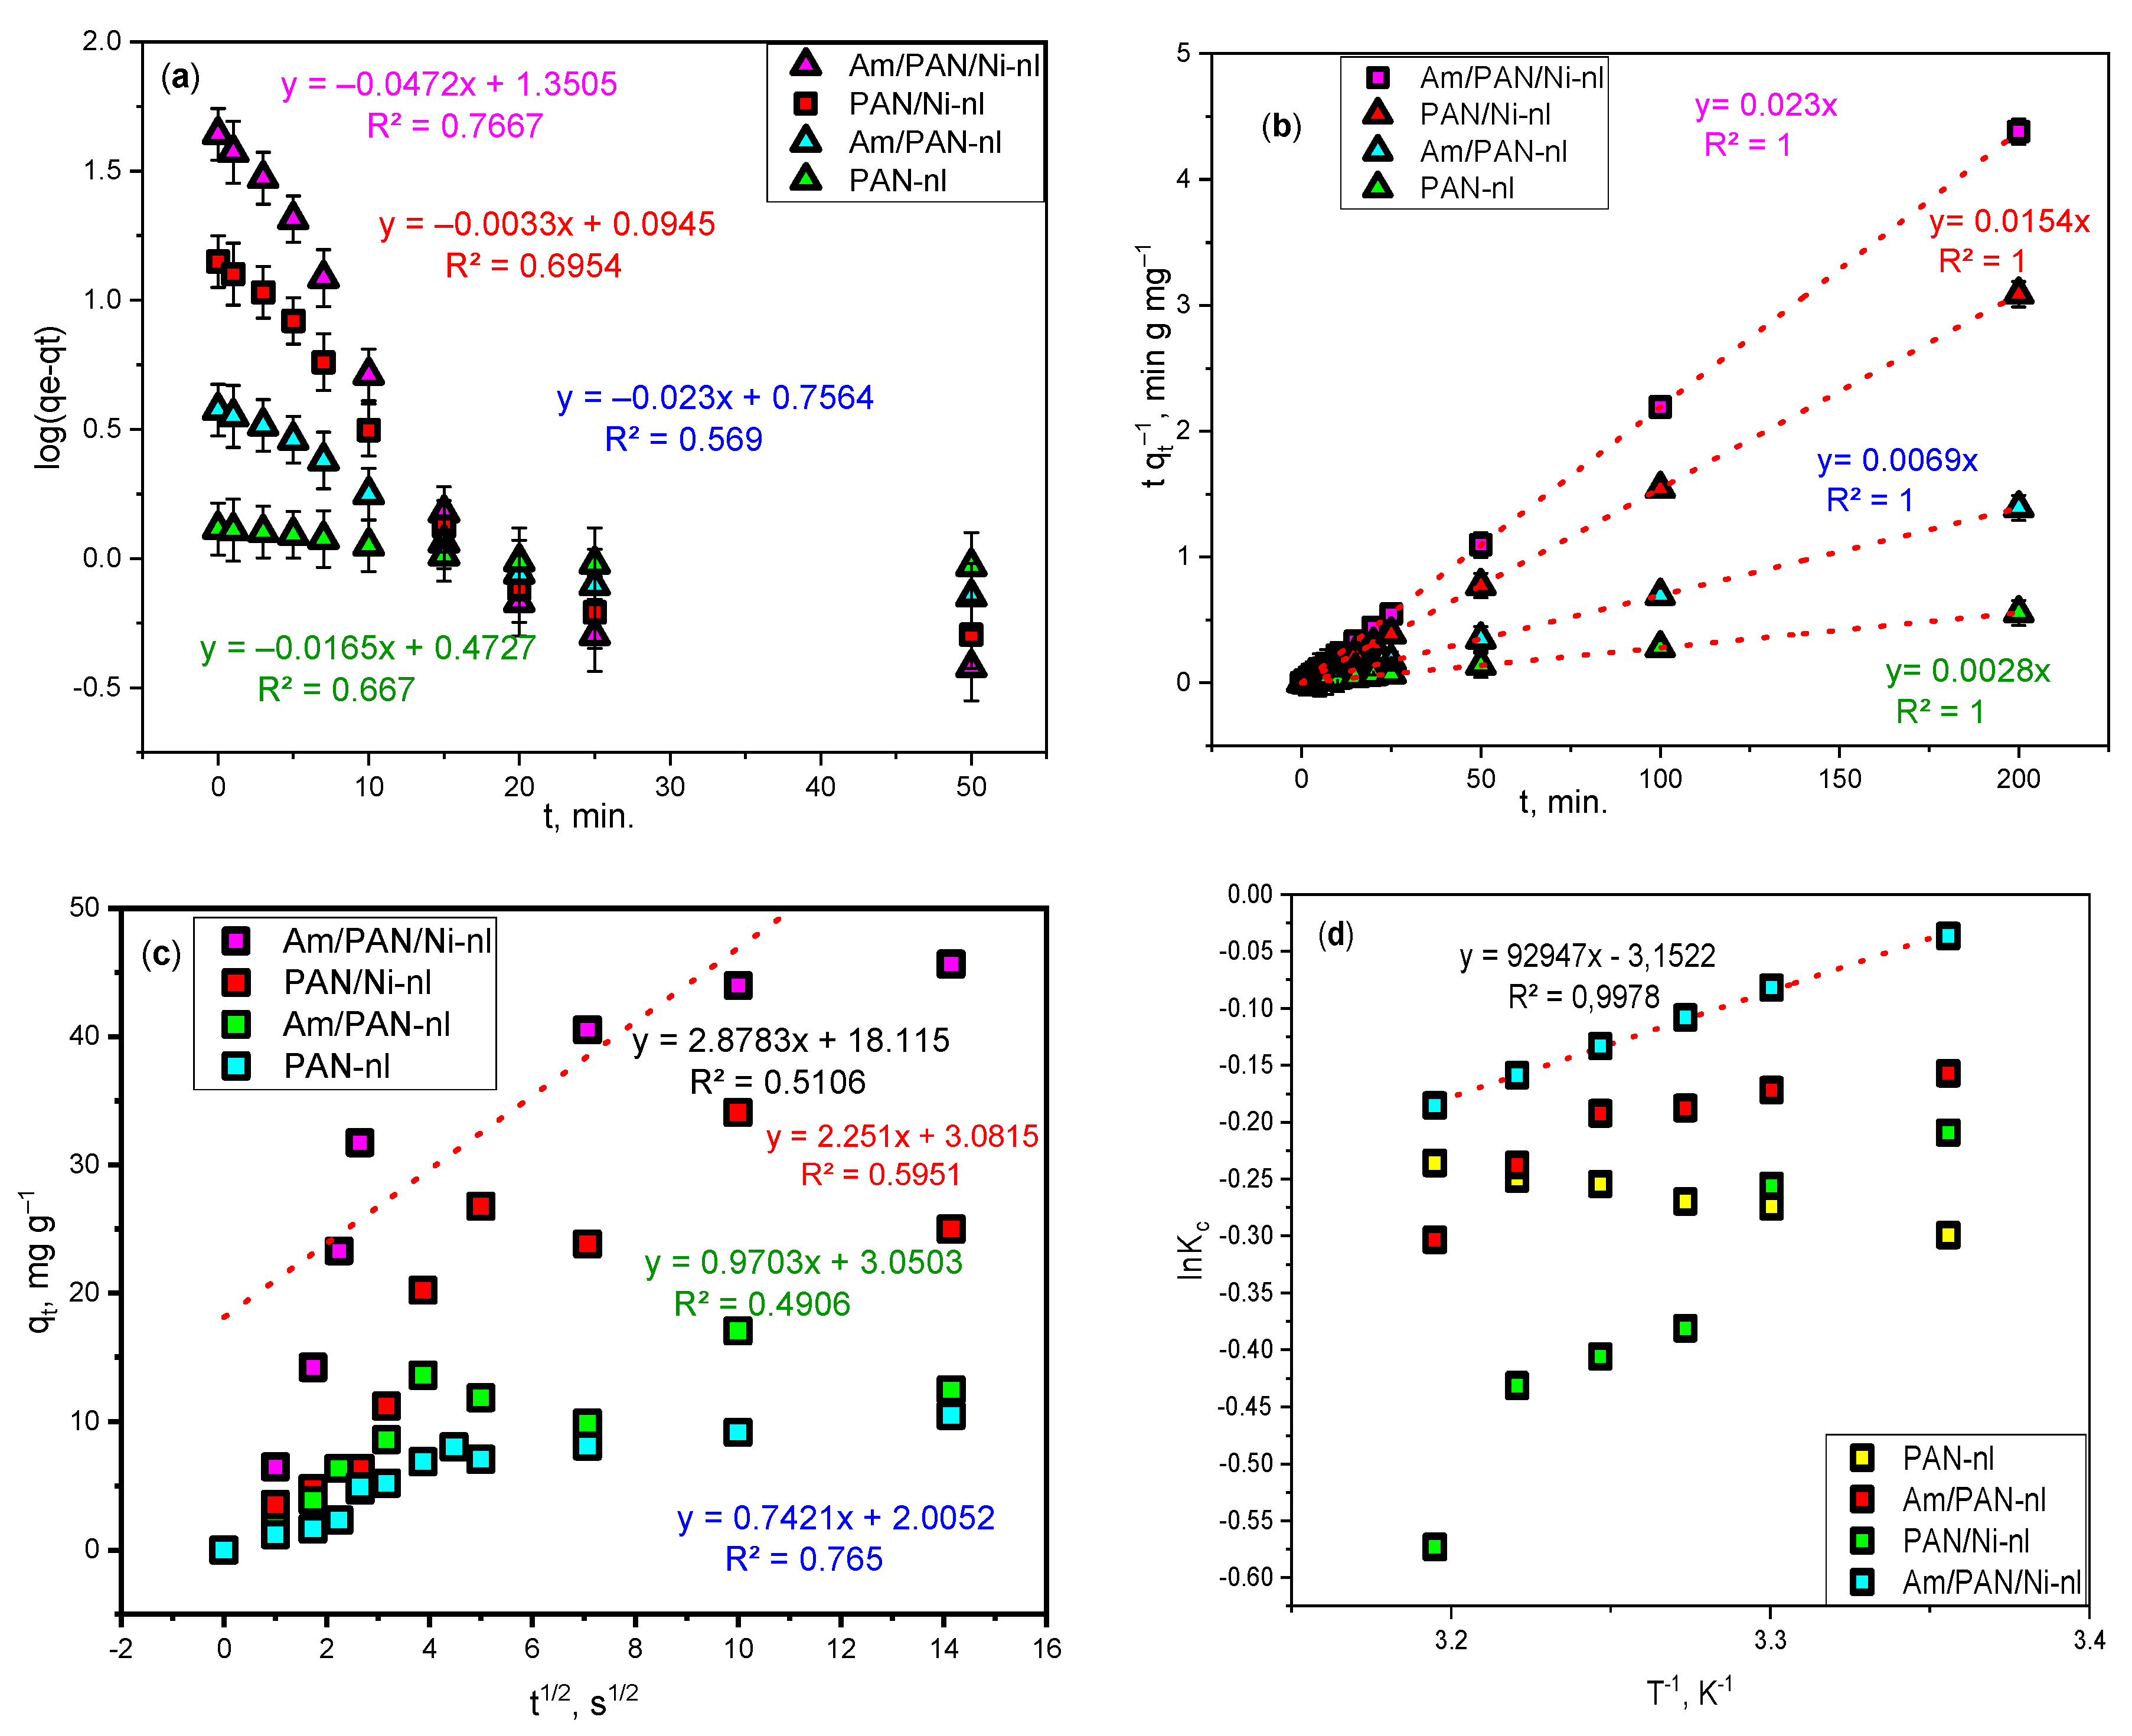
The kinetic investigation of adsorption events is performed depending on the time. The kinetic model determination process was applied in a time range of 0–200 min. The obtained data is shown in
Figure 4, together with the error bars.
The kinetic characteristics calculated based on the equation obtained in these models are given in
Table 4.
The regression coefficient was calculated as 1 with an error bar of 0.05 for the pseudo-second-order kinetic model, when the lowest R
2 value was calculated as 0.5106 for intraparticle diffusion and a value of 0.7667 was obtained for the pseudo-first-order kinetics model. The closer the regression coefficient is to 1, the better the fit between the experimental data and the theoretical data. For this reason, in this study, it was thought that the adsorption of MB with the Am/PAN/Ni-nl adsorbent proceeded via pseudo-second-order kinetics and that the interaction was based on electron sharing or exchange between the adsorbent and the adsorbate [
39].
3.5. Thermodynamic Studies
The results obtained from the experiments carried out at different temperatures (25 °C, 30 °C, 32.5 °C, 35 °C, 37.5 °C, 40 °C) to determine the thermodynamic behavior are given in the comparative graphic in
Figure 4d. Since the graphic belonging to Am/PAN/Ni-nl is more meaningful compared to other adsorbents, the calculation was made for this. Accordingly, the thermodynamic data were determined as enthalpy change ΔH = −92.947 kJ mol
−1, entropy change ΔS = −0.04 kJ mol
−1K
−1 and free energy change ΔG = −92.935 kJ mol
−1. In this case, it can be said that the adsorption is exothermic, that is, physical adsorption, since the enthalpy change is negative. In addition, since the entropy and Gibbs free energy changes were negative and the absolute Gibbs free energy value was greater than 20 kJ mol
−1, it is thought that the reaction between the adsorbent and MB was spontaneous.
3.6. RSM
The central composite design model was utilized to investigate the response surface methodology (RSM) related to the adsorption of methylene blue onto the Am/PAN/Ni-nl.
Table 5 shows the applied experimental conditions and the
qe values obtained under these conditions.
The suitability of the model used in this study was assessed using the regression coefficient (R
2). This coefficient is an important data-based measurement tool that shows how well the values obtained with the model match the results obtained with the experiment. The obtained R
2 data are shown in
Table 6. These data show the correlation between the dependent and independent variables.
Since R
2 is a numerical value indicating the degree of fit, the best fit is obtained at the R
2 value closest to 1. Therefore, it can be said that the best fit in this study based on the data in
Table 6 is in the quadratic model with a R
2 value of 0.9148–0.9878. An equation that can give the effect of concentration, temperature and pH on the
qe value was obtained using this model. Since the equation (Equation (11)) contains mathematical functions that give the relationship between these factors affecting adsorption, it allows researchers to predict how the adsorption capacity
qe value will be affected when conditions change.
where
A (pH) refers to the acidity of the MB solution,
B (°C) refers to temperature, and
C (ppm) denotes the concentration of the MB solution.
The data obtained using ANOVA diagrams are given in
Table 7. This approach provided the opportunity to examine in detail the effect of each parameter on the
qe value and the relationship between them.
The F-value was determined to be 145.27, and the
p value of
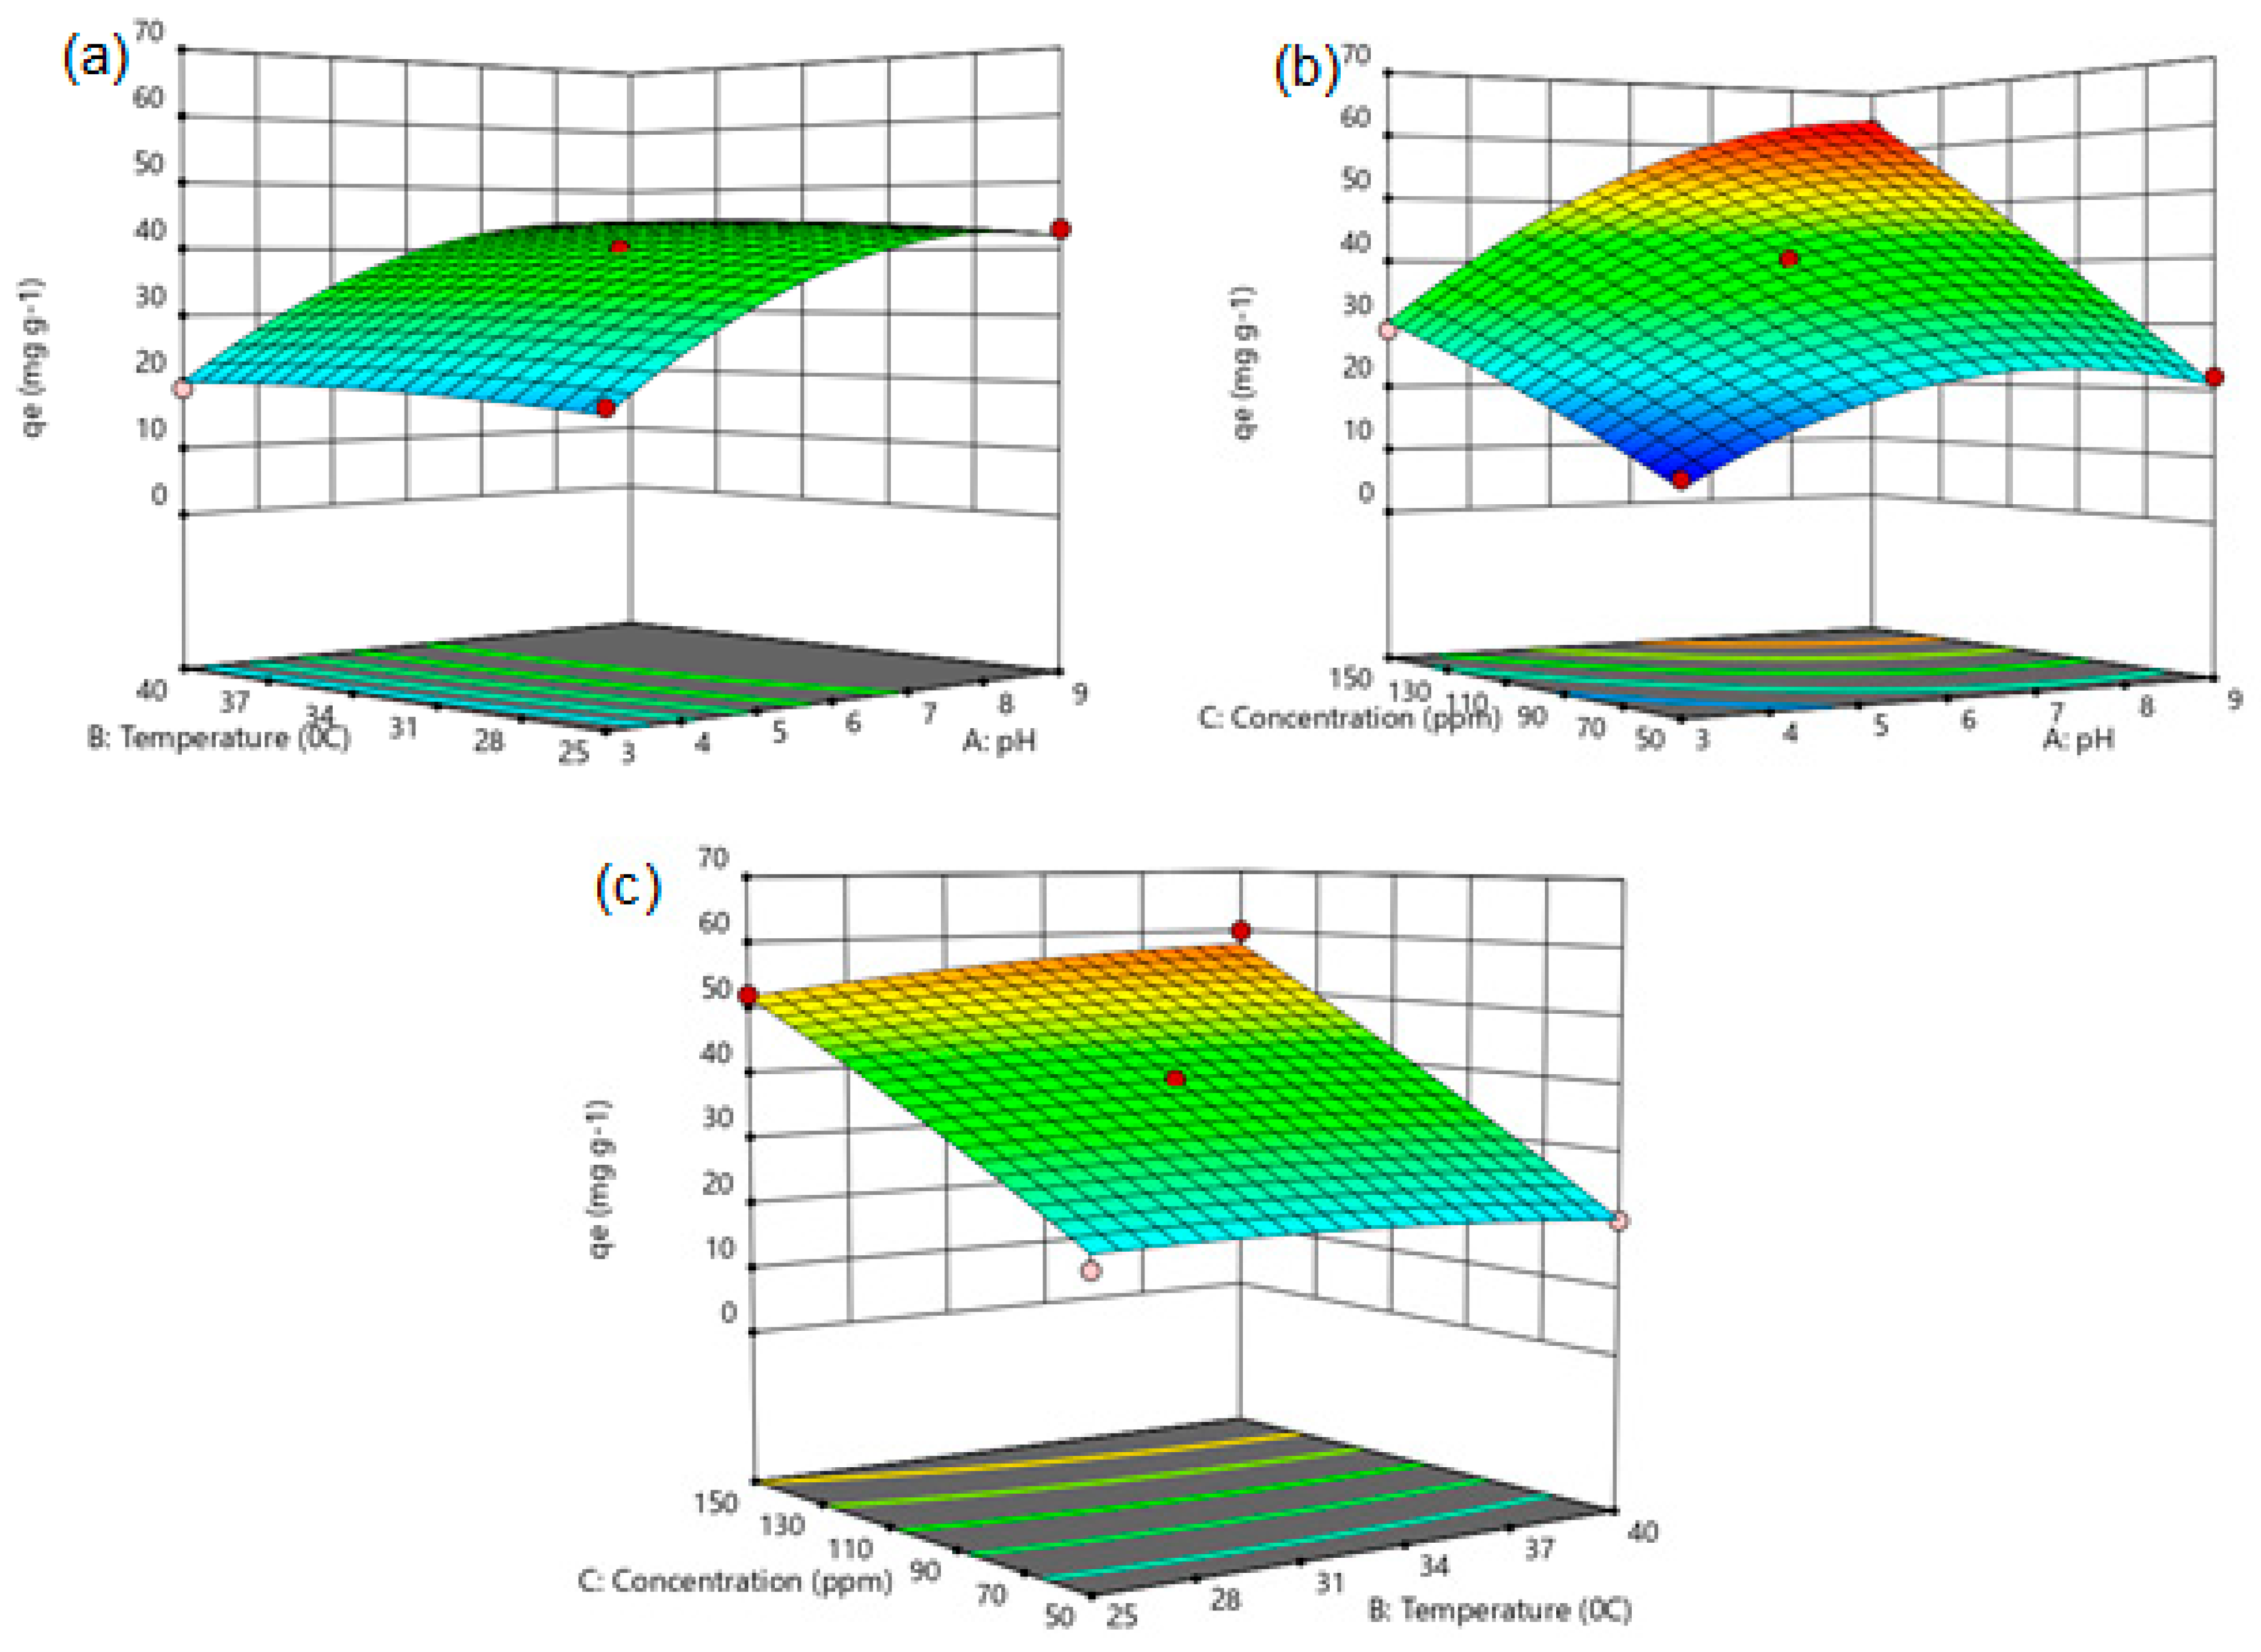
p was less than 0.0001. This shows that the model used creates significant differences due to the effect of independent variables rather than random variations. This effect is shown in
Figure 5.
Figure 5a shows the interaction between pH and temperature. Accordingly, while the
qe values are at minimum levels under low-pH and low-temperature conditions, an increase in
qe values is observed with the increase in pH values. In the pH range of 7–9, the adsorption capacity showed a tendency to approach maximum and equilibrium. This situation can be explained by the ionization behavior of the active sites on the adsorbent surface. However, the increase in temperature has a limited effect on
qe since this is associated with physical adsorption. Parallel to the ANOVA results, it is seen that the effect of temperature is not statistically significant (
p > 0.05), while that of pH is quite significant (
p < 0.0001).
The combined effect of pH and the initial concentration is evaluated in
Figure 5b. The increase in both variables significantly increased the
qe value. Especially in conditions where the pH is around 7–9 and the concentration is 130–150 ppm,
qe reaches maximum levels. This can be explained by the high amount of adsorbate in the solution and the more effective operation of the adsorbent surface under suitable pH conditions. This result showed the synergistic effect of pH and concentration.
The effect of the temperature and initial concentration is given in
Figure 5c. As the initial concentration increases, the
qe value increases sharply. Especially at concentration values between 130 and 150 ppm,
qe reaches the highest levels. On the other hand, the increase in temperature causes a more limited increase in
qe or remains constant. This situation can be attributed to the exothermic nature of the adsorption process. However, since the high concentration effect is dominant, the
qe values were high.
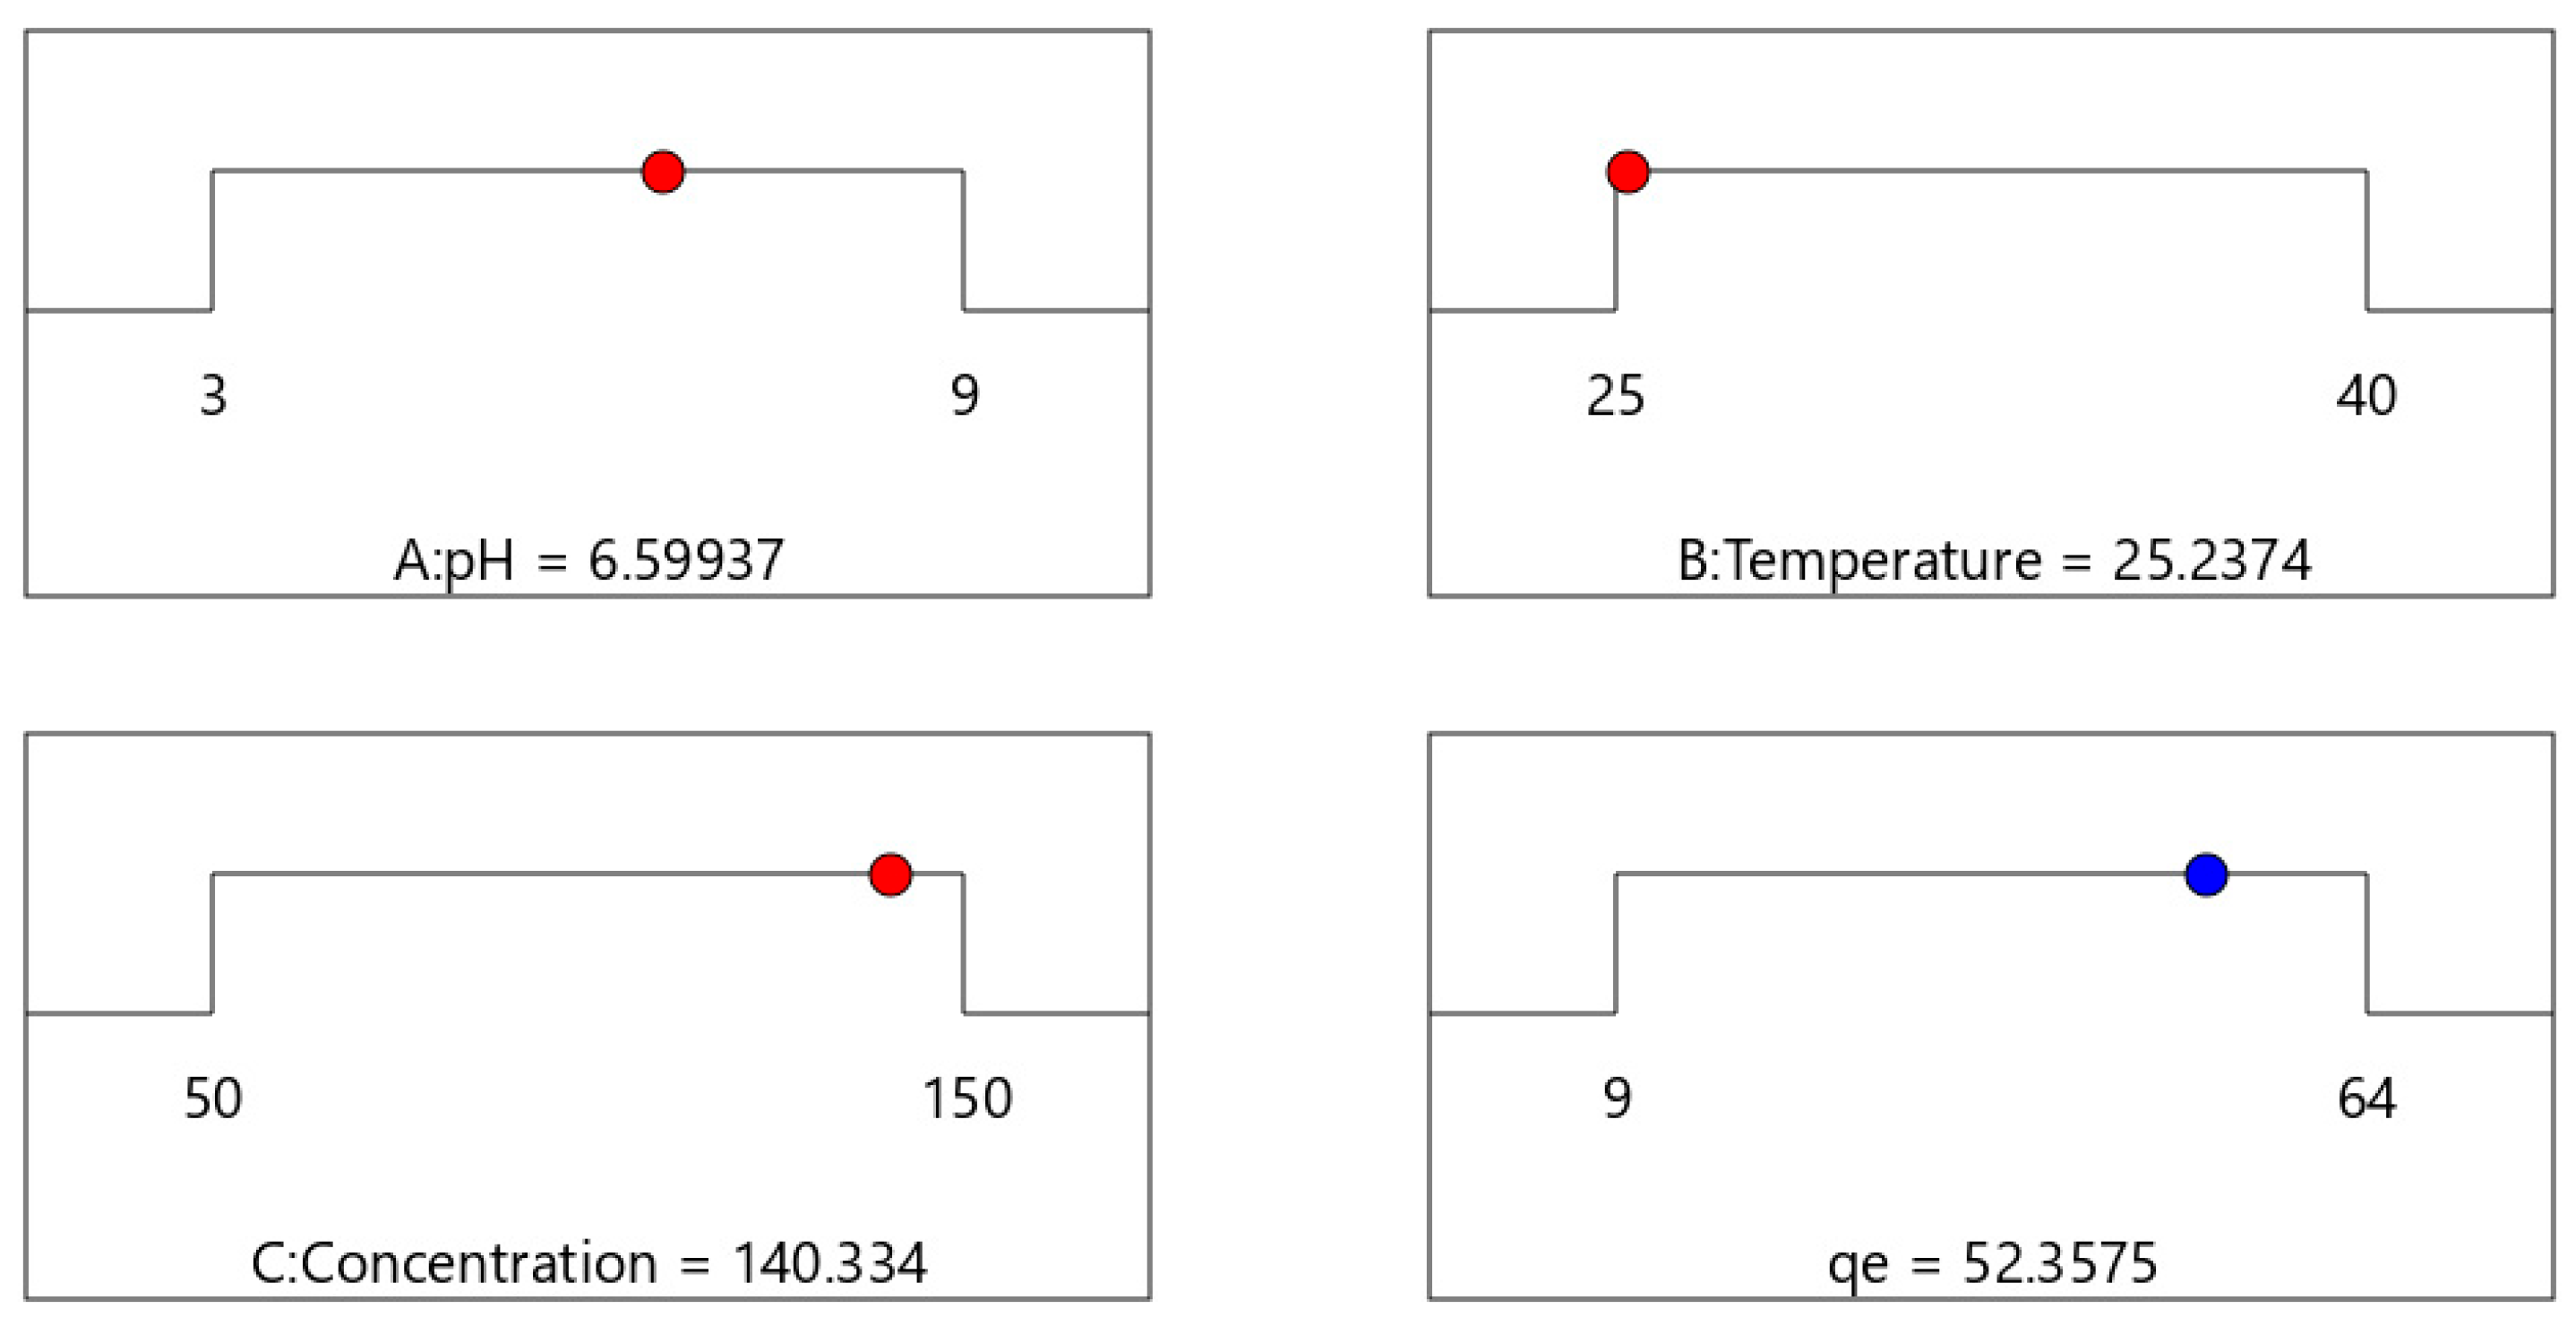
Upon conducting a response surface methodology (RSM), the optimal initial concentration, time, and adsorbent amount parameters were determined and are illustrated in
Figure 6. The analysis concluded that, under optimal conditions, the adsorbent exhibited a maximum adsorption capacity of 52.3575 mg g
−1 for methylene blue.
3.7. Mechanism
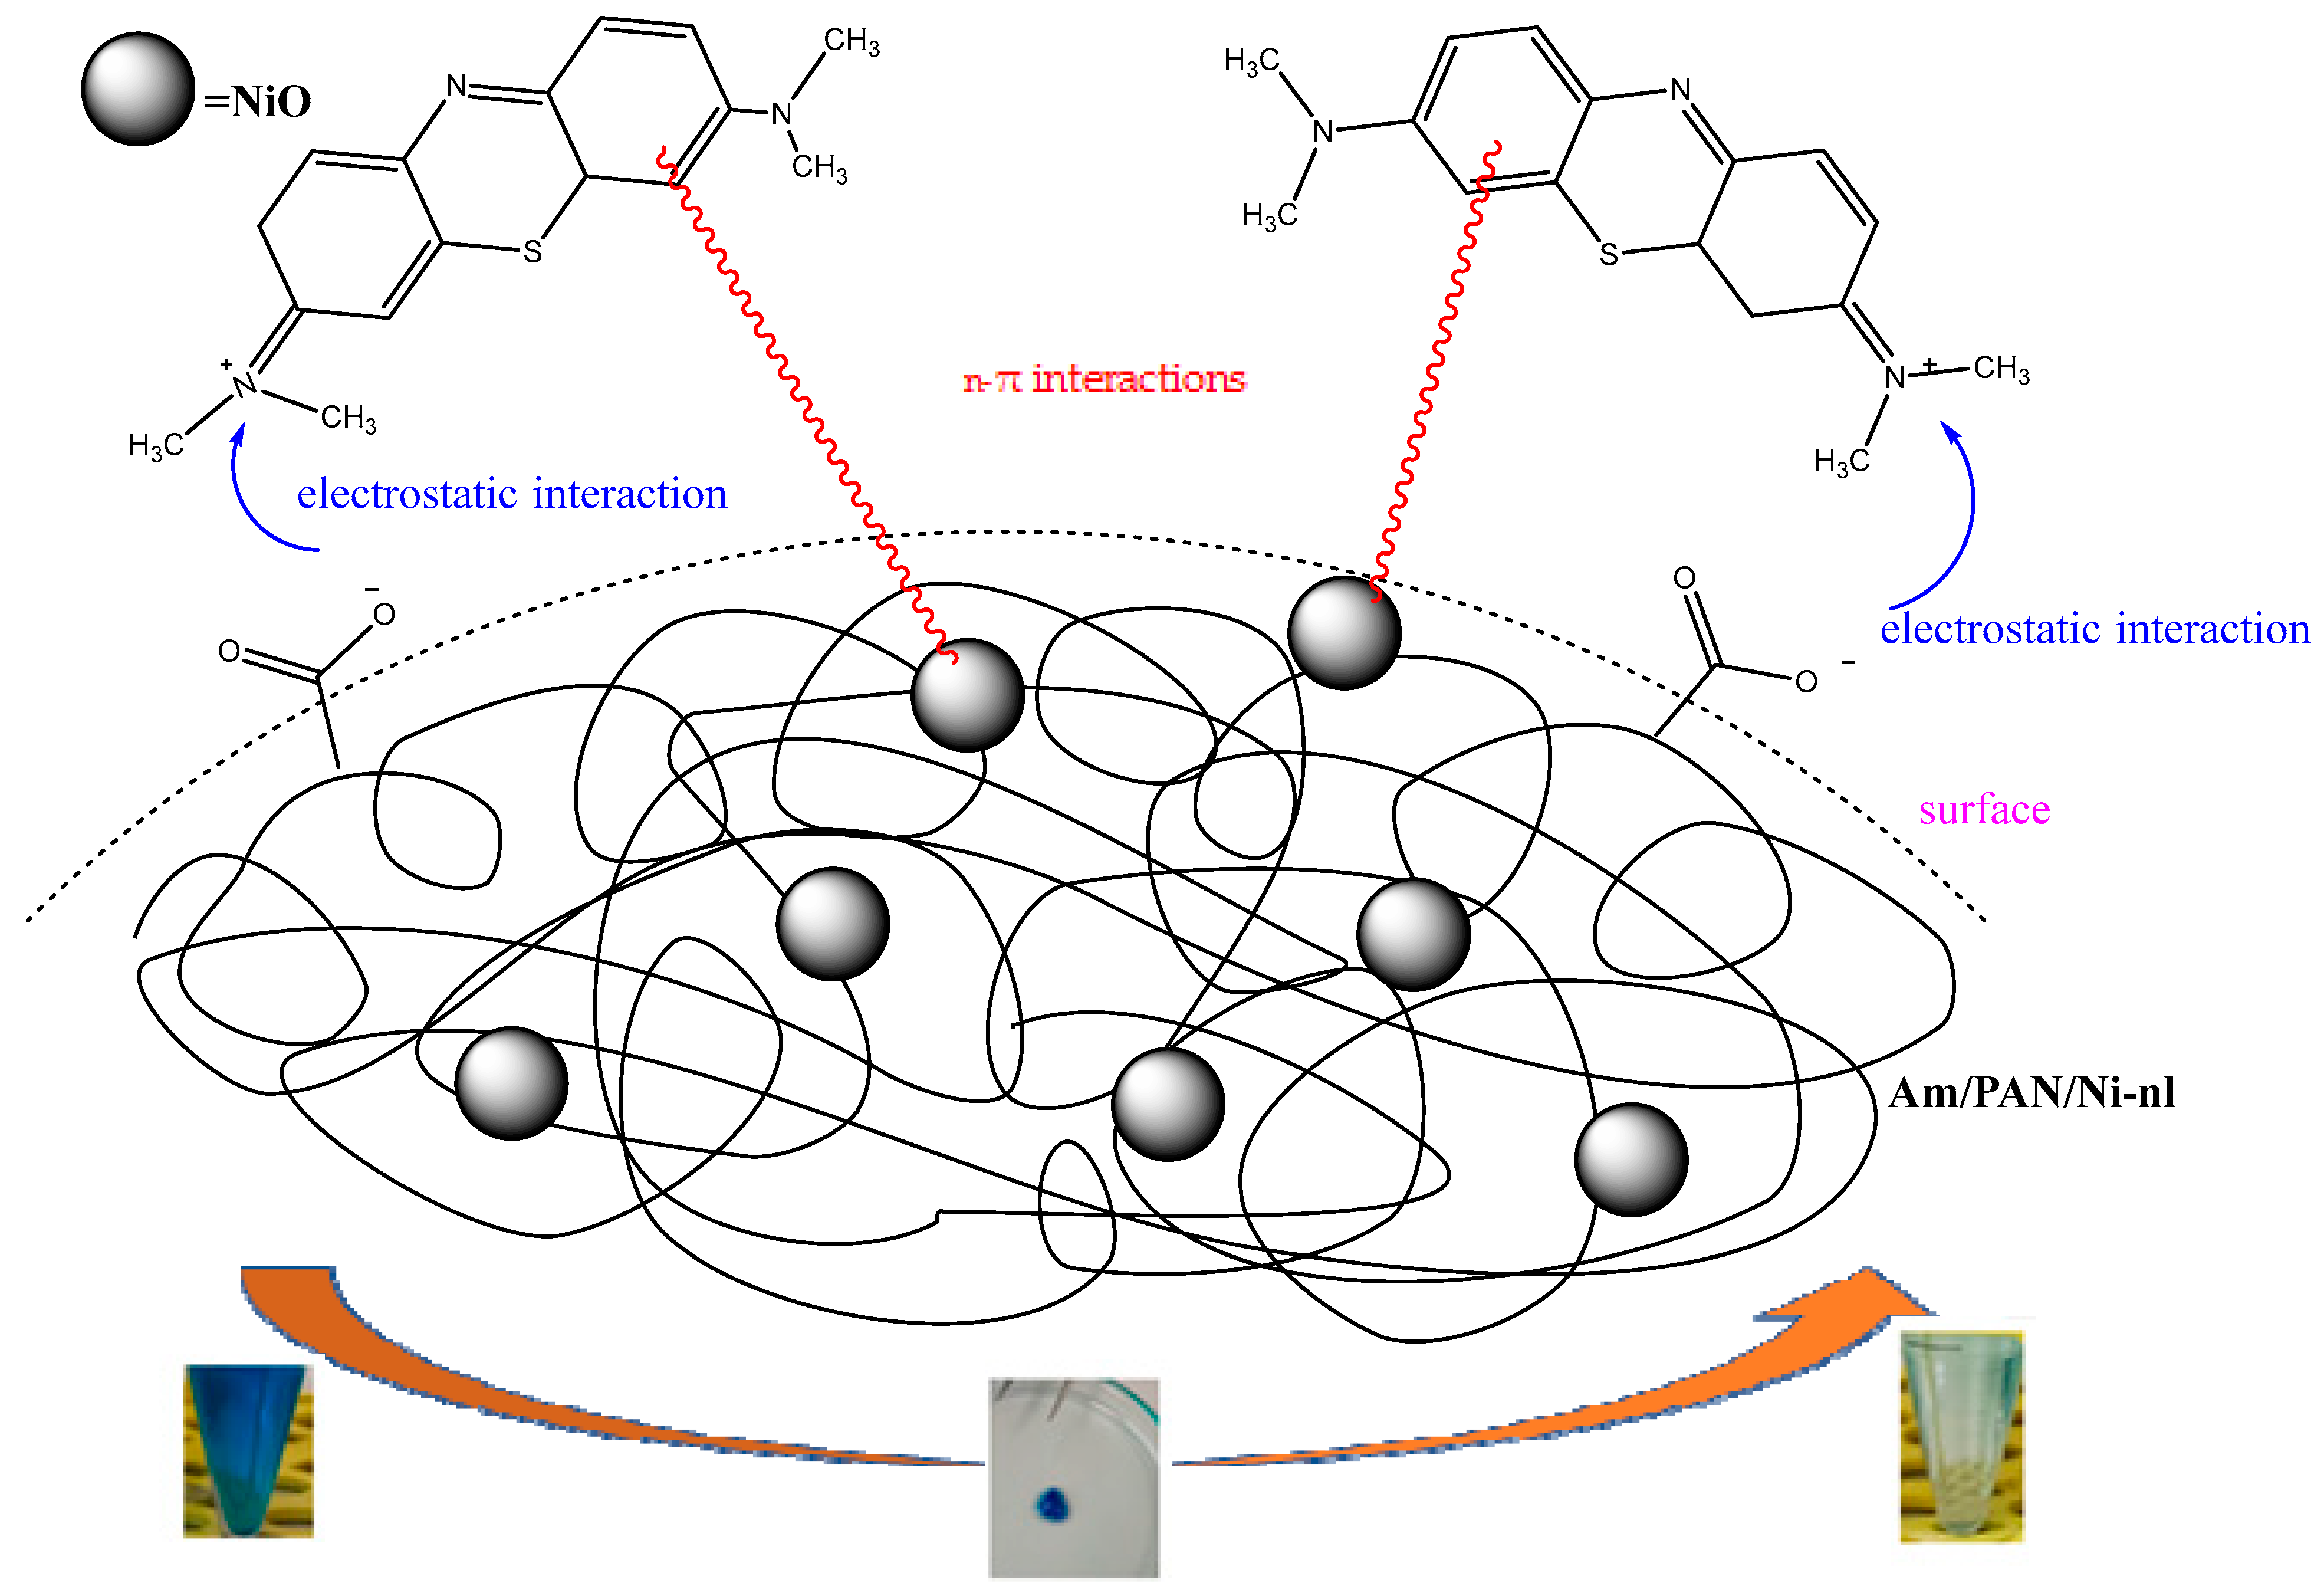
In this study, the possible interaction mechanism between the surface groups of the Am/PAN/Ni-nl adsorbent and MB is given in
Figure 6. To benefit from the catalytic effect of nickel, nanofibers were prepared by incorporating nickel salts into the PAN structure [
40]. In the literature, Ni
+2 ions are oxidized using basic media (OH-). However, in this study, the Ni
+2 ions included in the structure were stabilized in the air environment and oxidized into NiO nanoparticles. In this way, NiO nanoparticles were included in the PAN structure. It was thought that in the MB adsorption of PAN nanofibers containing NiO nanoparticles, the unshared electron pairs in these structures were used as n donors (unshared electron pairs of O in the structure of NiO and N atoms in the structure of PAN) and the n-π interaction was realized with the π electrons in the structure of MB (as acceptors). This idea was found to be compatible with the literature [
20].
On the other hand, adsorbents were modified using various amine compounds. It was reported that amination occurred as a result of this modification process [
41].
It was also reported in the literature that a group of nitriles at a high pH converted to COO
− functional groups in the presence of O in the environment. It is thought that the nitrile groups in PAN converted to COO
− functional groups with the O atoms in the tea structure at a high pH. Based on this report and the materials used [
42], it can be said that such a transformation occurred and that there is electrostatic attraction between these groups and the cationic N+ of MB [
25,
26].
All these proposed interactions are shown in the mechanism in
Figure 7. These interactions are also supported by the kinetic, isotherm and structural results.
3.8. The Reusability Studies
The reusability of the adsorbent was achieved by emptying the active sites by applying appropriate conditions after adsorption. An acidic environment was used to perform this emptying process. Briefly, adsorption was performed using 0.1 g of adsorbent in 50 mL of 100 ppm MB solution at 30 °C. Then, the adsorbents separated from the adsorption test medium were kept separately in 100 mL of HCl solution for 12 h with continuous mixing. At the end of the period, the adsorbents were washed with pure water to be used in the next cycle.
Desorption tests were performed to understand the degree of interaction between Am/PAN/Ni-nl and MB and the properties of the adsorbent. Desorption was also performed in acidic media (0.5 mol L
−1 HCl) for the regeneration of the adsorbent [
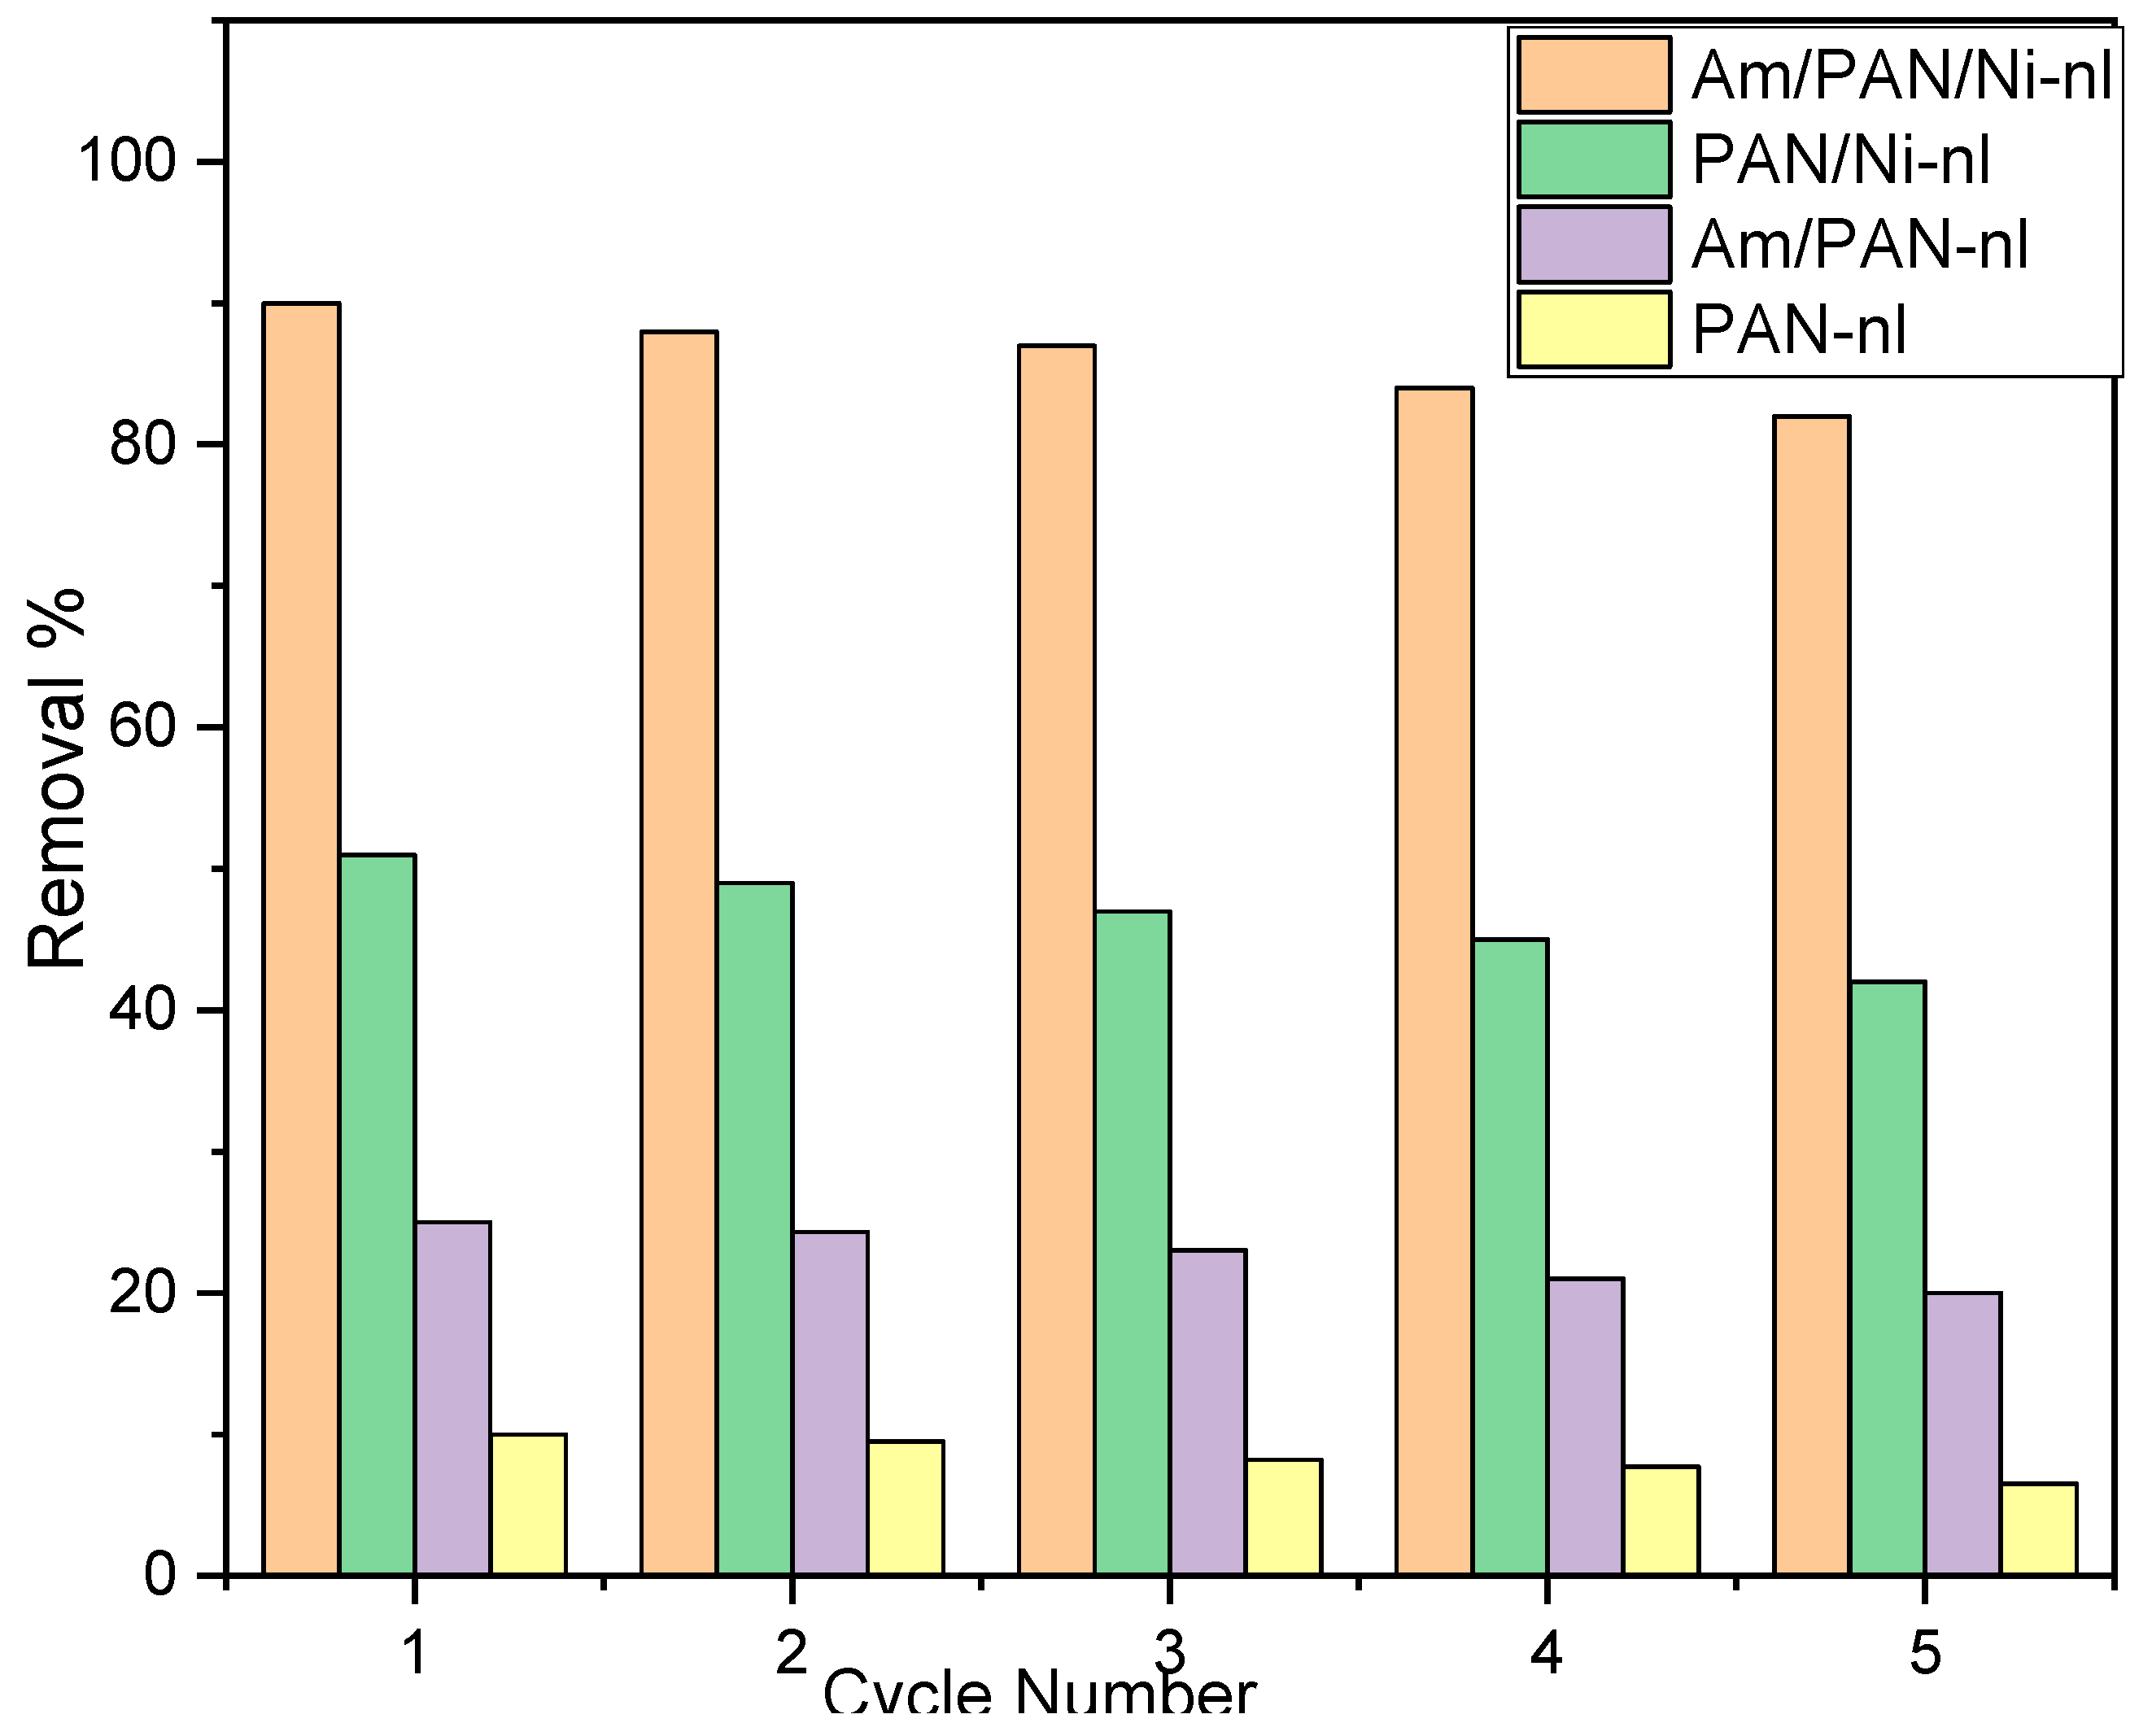
43]. This effect showed that the adsorbent surface interacted with the cationic species in the medium. As reported in the literature, MB helped to make the adsorbent surface usable again for uptake. The results were compared with all the adsorbents (
Figure 8).
According to the data obtained, the uptake of MB started to decrease in the first cycle for all the adsorbents. However, it was determined that this decrease was 1% in the 1st cycle and 8% in the 5th cycle for the Am/PAN/Ni-nl adsorbent, while it was 1% in the 1st cycle and 4.5% in the 5th cycle for PAN-nl. It was determined that the decrease in the other adsorbents was parallel to this behavior. This effect may be due to either the weakening of the interaction of the active sites on the adsorbent surface with MB in each new cycle or the irreversibility of the interaction between MB and the active sites. The last possibility has been addressed in the literature. However, it was believed that the first possibility should also be considered because most of these types of uptake are known as physical adsorption [
13,
29,
32].
4. Conclusions
In this study, PAN nanofibers were modified with Ni and/or TEA via the electrospinning method to increase the efficiency of MB adsorption. According to the data obtained, it was observed that the surface area of PAn-nl increased approximately 10 times, the adsorption capacity increased approximately 15 times and the time required to reach equilibrium decreased 4 times by adding NiO nanoparticles to the structure.
The following results were obtained in the investigations.
- -
With FT-IR, it was understood that the nitrile group bonds were broken and replaced by new functional groups (2241 cm−1, 1736 cm−1,1456 cm−1 and 3400–3600 cm−1).
- -
TEA treatment increased the surface area of PAN-nl from 43 m2 g−1 to 410 m2 g−1, and incorporating Ni into the structure increased the surface area to 522.8 m2 g−1. Am/PAN/Ni-nl had approximately 10 times more surface area compared to PAN-nl.
- -
Equilibrium was reached in 200 min with 1.85 mg g−1 for PAN-nl. It was reached with 13.3 mg g−1 in 100 min for Am/PAN-nl. The shortest equilibrium time and the highest qe amount were obtained with Am/PAN/Ni-nl, with values of 25 min and 45.96 mg g−1, respectively. This effect was thought to be due to the interaction of NiO nanoparticles and their participation in the structure.
- -
It was seen that adsorption was supported at high pHs. While 1.72 mg g−1 adsorption was observed with So, PAN-nl at pH 9 and 45.96 mg g−1 (91%) was observed with Am/PAN/Ni-nl.
- -
The Langmuir isotherm and pseudo-second-order kinetics were found appropriate, with an R2 value of 0.9987.
- -
The change in the enthalpy was −92.947 kJ mol−1. So, adsorption was physical adsorption because of the exothermic value for enthalpy.
- -
Using RSM, the adsorption for Am/PAN/Ni-nl obeyed the quadratic model and an adsorption capacity of 52.3575 mg g−1 was achieved with this adsorbent for methylene blue at pH 6, 25 °C and 140 ppm. If the optimized conditions can be adapted to real-world wastewater treatment technologies, they may have positive effects in terms of energy cost, energy consumption, and scalability.
- -
The reusability of the adsorbents was determined, showing a loss of 8% for Am/PAN/Ni-nl and 4.5% for PAN-nl after five cycles. However, the adsorption capacity of the Am/PAN/Ni-nl sorbent was determined to be 12 times higher than that of PAN-nl.
As a result, it was observed that the adsorption efficiency of PAN-NL fibers was increased by treating them with Ni+2 and TEA. It is thought that this practical, cheap and low-chemical treatment method could form the basis of effective and efficient adsorption applications in the future. Of course, the adsorbent, as in all adsorbents, has limitations due to its reusability and the potential presence of other ions in the environment. It is thought that these limitations will be overcome by more effective catalytic nanoparticles and increasing surface functional groups in the future.


