Article

Impact of Acidic Pretreatment on Biomethane Yield from Xyris capensis: Experimental and In-Depth Data-Driven Insight

by
Kehinde O. Olatunji
1,2,*,
Oluwatobi Adeleke
1,
Tien-Chien Jen
1 and
Daniel M. Madyira
1
1
Department of Mechanical Engineering Science, University of Johannesburg, Johannesburg 2006, South Africa
2
Process, Energy and Environmental Technology Station, University of Johannesburg, Johannesburg 2006, South Africa
*
Author to whom correspondence should be addressed.
Processes 2025, 13(7), 1997; https://doi.org/10.3390/pr13071997
Submission received: 24 May 2025 / Revised: 9 June 2025 / Accepted: 20 June 2025 / Published: 24 June 2025
(This article belongs to the Special Issue Biogas Technologies: Converting Waste to Energy)

Abstract

This study presents an experimental and comprehensive data-driven framework to gain deeper insights into the effect of acidic pretreatment in enhancing the biomethane yield of Xyris capensis. The experimental workflow involves subjecting the Xyris capensis to different concentrations of HCl, exposure times, and digestion retention time in mesophilic anaerobic conditions. Key insights were gained from the experimental dataset through correlation mapping, feature importance assessment (FIA) using the Gini importance (GI) metric of the decision tree regressor, dimensionality reduction using Principal Component Analysis (PCA), and operational cluster analysis using k-means clustering. Furthermore, different clustering techniques were tested with an Adaptive Neuro-Fuzzy Inference System (ANFIS) tuned with particle swarm optimization (ANFIS-PSO) for biomethane yield prediction. The experimental results showed that HCl pretreatment increased the biomethane yield by 62–150% compared to the untreated substrate. The correlation analysis and FIA further revealed exposure time and acid concentration as the dominant variables driving biomethane production, with GI values of 0.5788 and 0.3771, respectively. The PCA reduced the complexity of the digestion parameters by capturing over 80% of the variance in the principal components. Three distinct operational clusters, which are influenced by the pretreatment condition and digestion set-up, were identified by the k-means cluster analysis. In testing, a Gaussian-based Grid-Partitioning (GP)-clustered ANFIS-PSO model outperformed others with RMSE, MAE, and MAPE values of 5.3783, 3.1584, and 10.126, respectively. This study provides a robust framework of experimental and computational data-driven methods for optimizing the biomethane production, thus contributing significantly to sustainable and eco-friendly energy alternatives.

1. Introduction

Population and industrial growth have significantly increased the global energy demand for industrial and commercial activities. For some centuries, hydrocarbons such as petroleum, natural gas, and coal have been the primary sources of energy [1]. About 80% of energy for human activities is generated from fossil fuels, which are non-renewable, and their depletion has become a global challenge, while their extensive usage is currently creating a new and significant problem. Fossil fuel combustion is reported to be responsible for about 89% of the world’s greenhouse gas emissions, including CO2 emissions [2]. This finite nature of fossil fuels, the attendant environmental concerns, and the surge in global energy demands have caused a shift towards renewable energy resources. Among these renewable energy resources, biomass is unique because it can be converted into solid, liquid, or gaseous fuels, offering a versatile and sustainable alternative for electricity generation, heating, and transportation. The application of biomass for renewable energy generation is regarded as a sustainable technology that can meet energy needs and, at the same time, reduce the emission of greenhouse gases. Additionally, biomass use provides the merits of cost–benefit viability and minimizes the waste released into the environment [3]. Lignocellulose biomass has been identified as the most available renewable energy source globally, and it is in the form of agricultural residues, energy crops, softwood, hardwood, and grasses. Lignocellulose materials are a composition of lignin, cellulose, and hemicellulose, and a larger percentage of hemicellulose and cellulose makes it a bright feedstock for biogas production. The biogas released from lignocellulose feedstocks is an environmentally friendly energy source widely acceptable as a substitute for fossil fuels [4].
Despite the availability and the potential of lignocellulose feedstocks, their major limitation is the poor biodegradability due to the lignin content that reduces the available surface area, limiting the enzymatic hydrolysis and cellulose crystallinity [5]. Pre-treatment assists in overcoming this challenge through effective delignification, enhanced digestion of hemicellulose and cellulose portions, and improved biomethane. Pretreatment techniques are categorized into thermal, biological, physical/mechanical, chemical, nano-additive, and combined. Irrespective of the pretreatment method selected, the primary interest is to enhance the availability of hemicellulose and cellulose during enzymatic hydrolysis and subsequent biogas release [6]. Amongst these, chemical pretreatment is the most popular technique, which can alter the crystalline arrangement of cellulose and remove the hemicellulose and lignin portion of lignocellulose feedstock. Various chemical agents, such as acid, alkali, oxidizing compounds, and solvents, have been investigated for lignocellulose feedstock pretreatment [7,8]. Acidic pretreatment using sulphuric, hydrochloric, acetic, and formic acids is an efficient chemical method that solubilizes the hemicellulose content and partially solubilizes lignin, making the cellulose more available for further enzymatic hydrolysis [9]. The literature is replete with several studies on the anaerobic digestion (AD) of lignocellulosic biomass subjected to acidic pretreatment. The biomethane yield of groundnut shells was reported to increase by 178% when 0.5% v/v H2SO4 was used for pretreatment for 15 min at 90 °C [10]. Corn straw pretreated with 2% v/v of HCl enhances the biogas released by 115% compared to the untreated feedstock [8]. The methane yield was improved by 8.9% when the wheat plant was subjected to H2SO4 treatment for 60 min [11], while thermal-diluted H2SO4 on cassava residues increased the methane released by 56.96% [12]. One of the significant challenges of acid pretreatment is the release of inhibitory compounds like phenolic acids, furfurals, 5-hydroxymethylfurfural, and aldehydes. The acidic pretreatment of lignocellulose focuses more on H2SO4 pretreatment, with limited studies on applying HCl. Therefore, more studies are required on the potential of HCl as a pretreatment technique for biomethane optimization. HCl is a strong acid like H2SO4, which should be able to degrade the recalcitrant characteristics of lignocellulose feedstock and have a comparative cost with H2SO4.
The efficiency of biogas production is significantly influenced by feedstock composition, process parameters, and microbial dynamics, rendering optimization challenging. Consequently, intelligent models have demonstrated efficacy in intelligent feedstock management and real-time decision-making. Interest in advanced computational techniques for extensive data-driven insights into biogas research technology has grown recently. Different mathematical models, including modified Gompertz, logistic, and first-order statistical methods, have been investigated to predict AD yield [13]. However, a paradigm shift from these classical models to artificial intelligence (AI) and machine learning (ML)-based models has been noted to analyze the complex non-linear relation in the AD process. An Artificial Neural Network (ANN) was used to predict and monitor the biogas released from cassava wastewater, and the retention time, pH, and calcium eggshell concentration were selected as input parameters. It was observed that the model can predict the yield accurately with a correlation coefficient (R2) of 0.9999 [
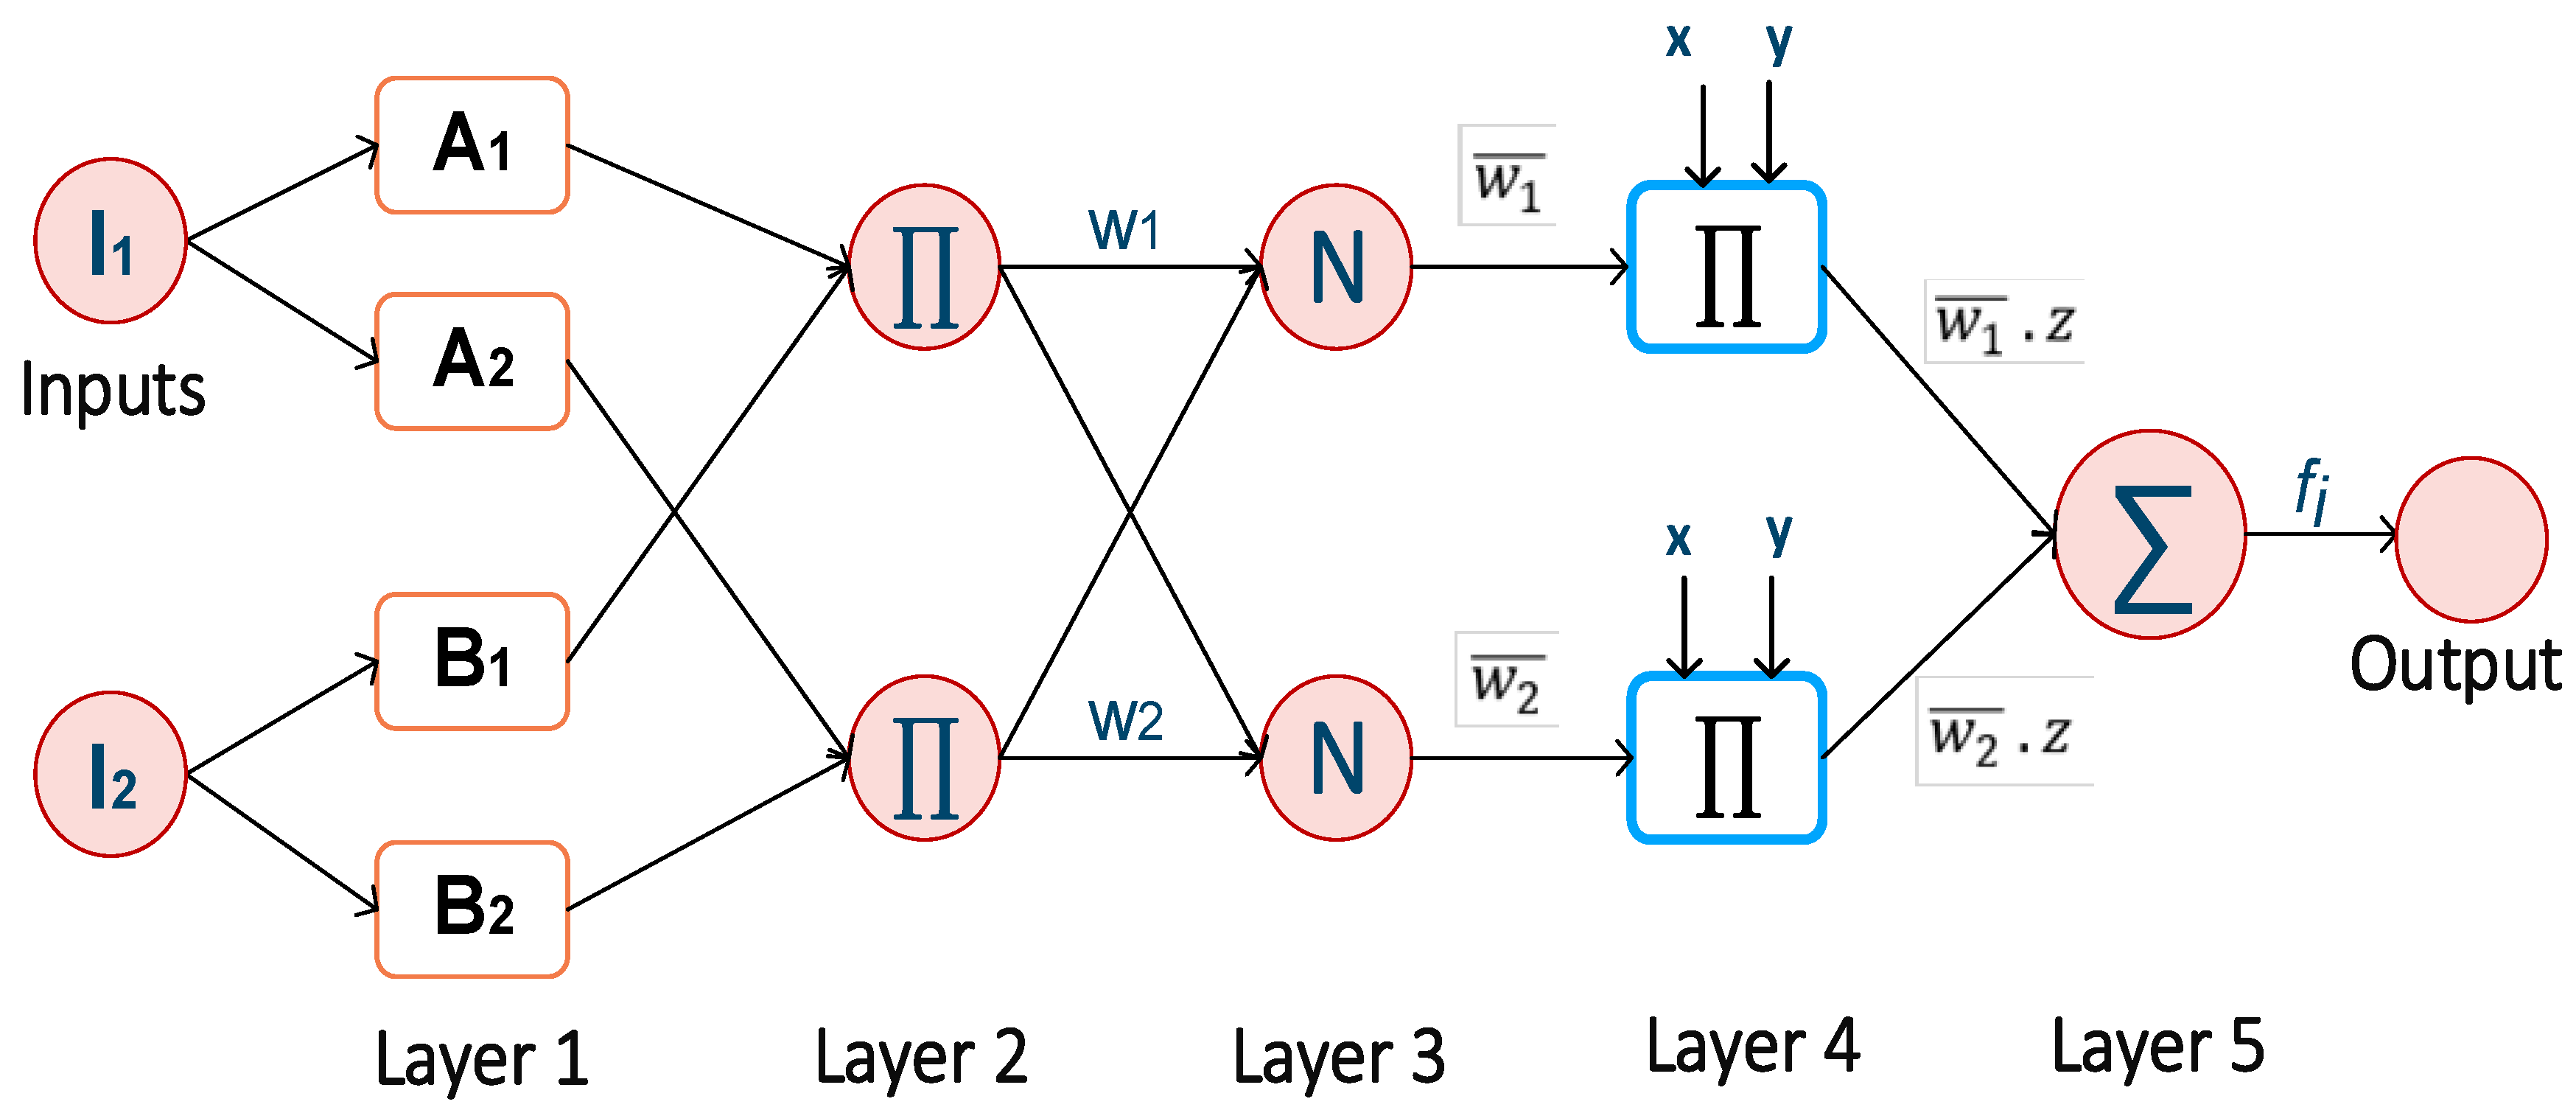
14]. An Adaptive Neuro-fuzzy Inference System (ANFIS) was utilized to predict and optimize the biomethane yield from the anaerobic co-digestion of Xyris capensis and duck waste, with the mixing ratio, temperature, and retention time as input parameters and biomethane as the output parameter. The observed cumulative biomethane and ANFIS predicted yield were 478.42 and 436.20 mL CH4/gVSadded, with a root square mean error of 2.7629 [15]. The biogas released from the Mushroom was modeled using the ANFIS model with the temperature, C/N ratio, and retention time; an R2 value of 0.9997, representing 99% accuracy, was reported [16]. The anaerobic co-digestion of tea waste and cow manure process was modeled using ANFIS, and the model was reported to have around 99% accuracy [17]. However, studies on optimizing and predicting the biomethane yield when the process parameter of pretreatment is considered an input parameter are limited.
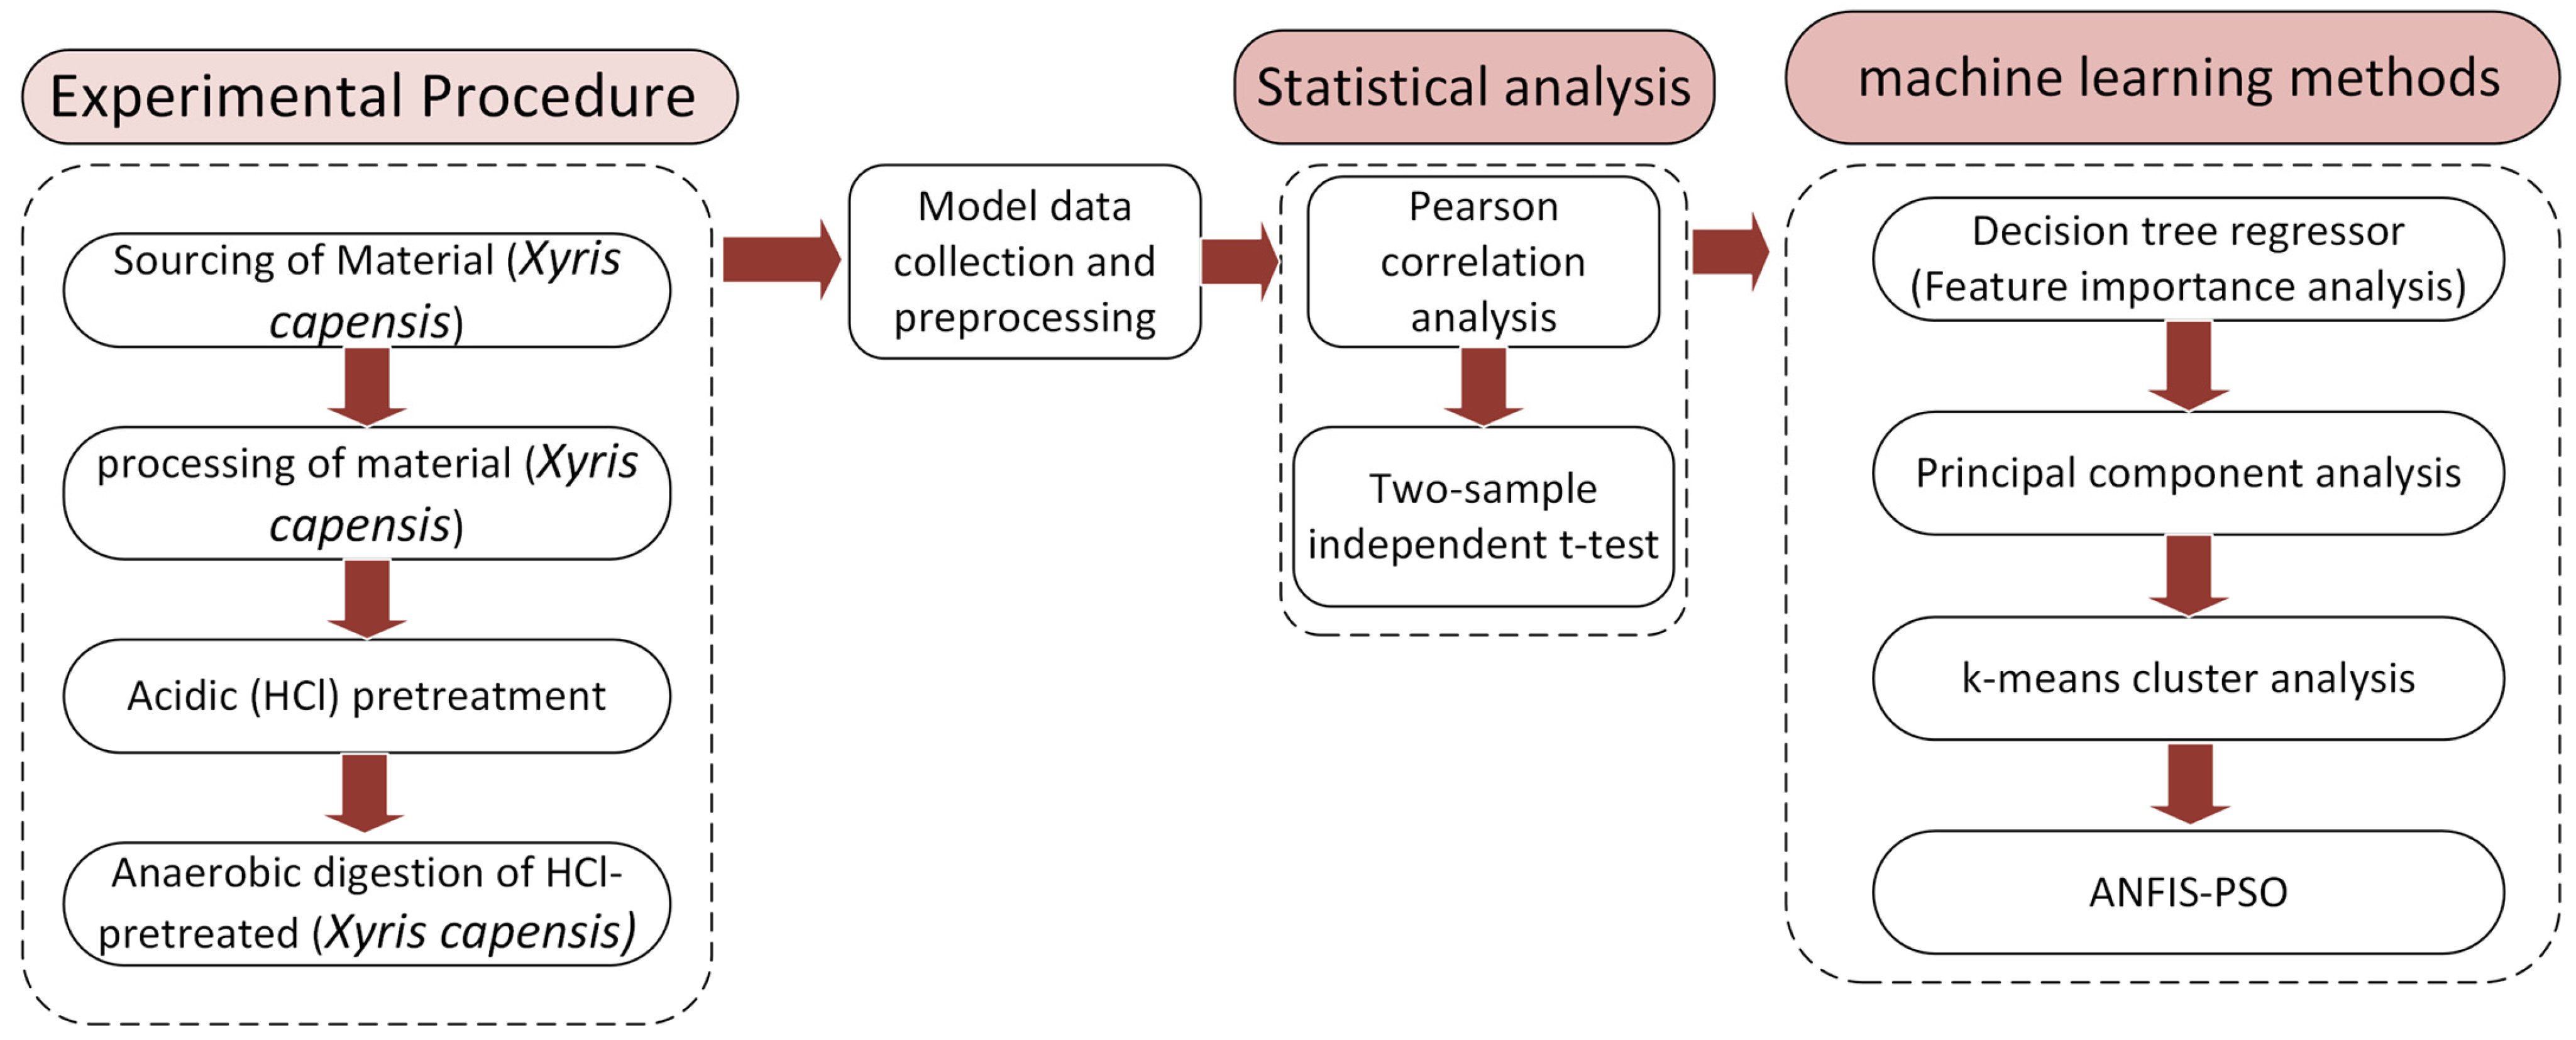
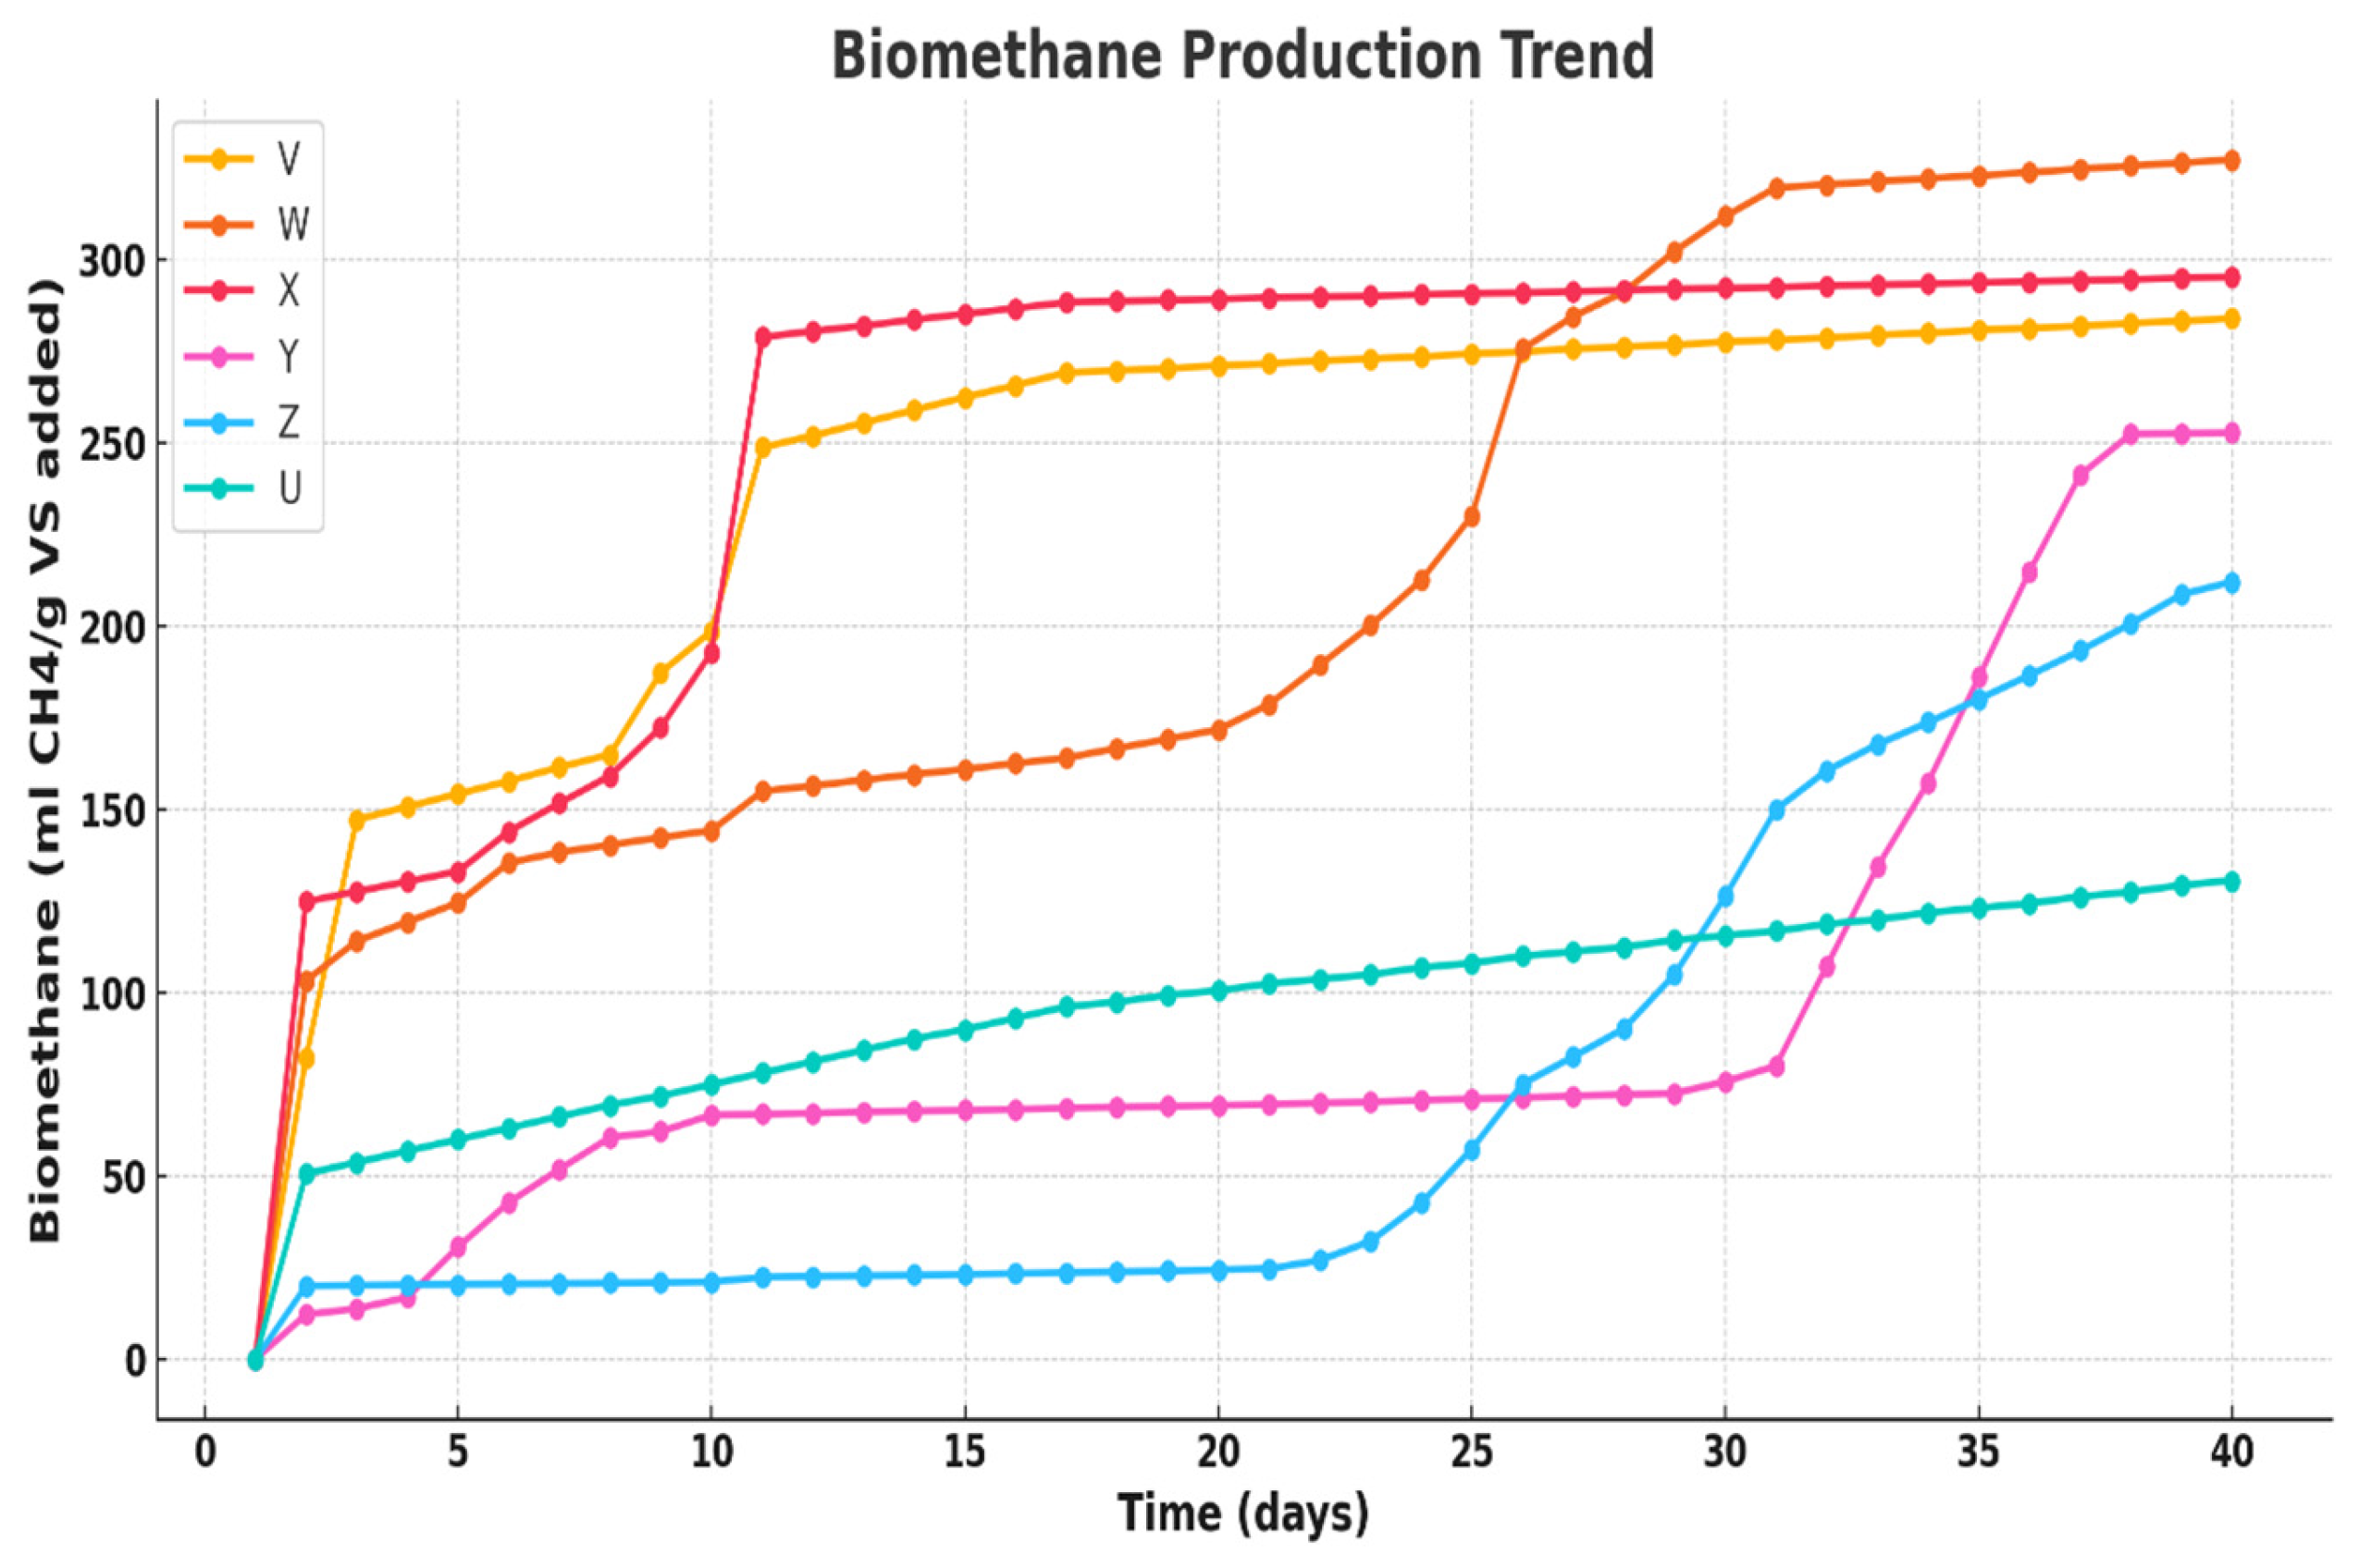
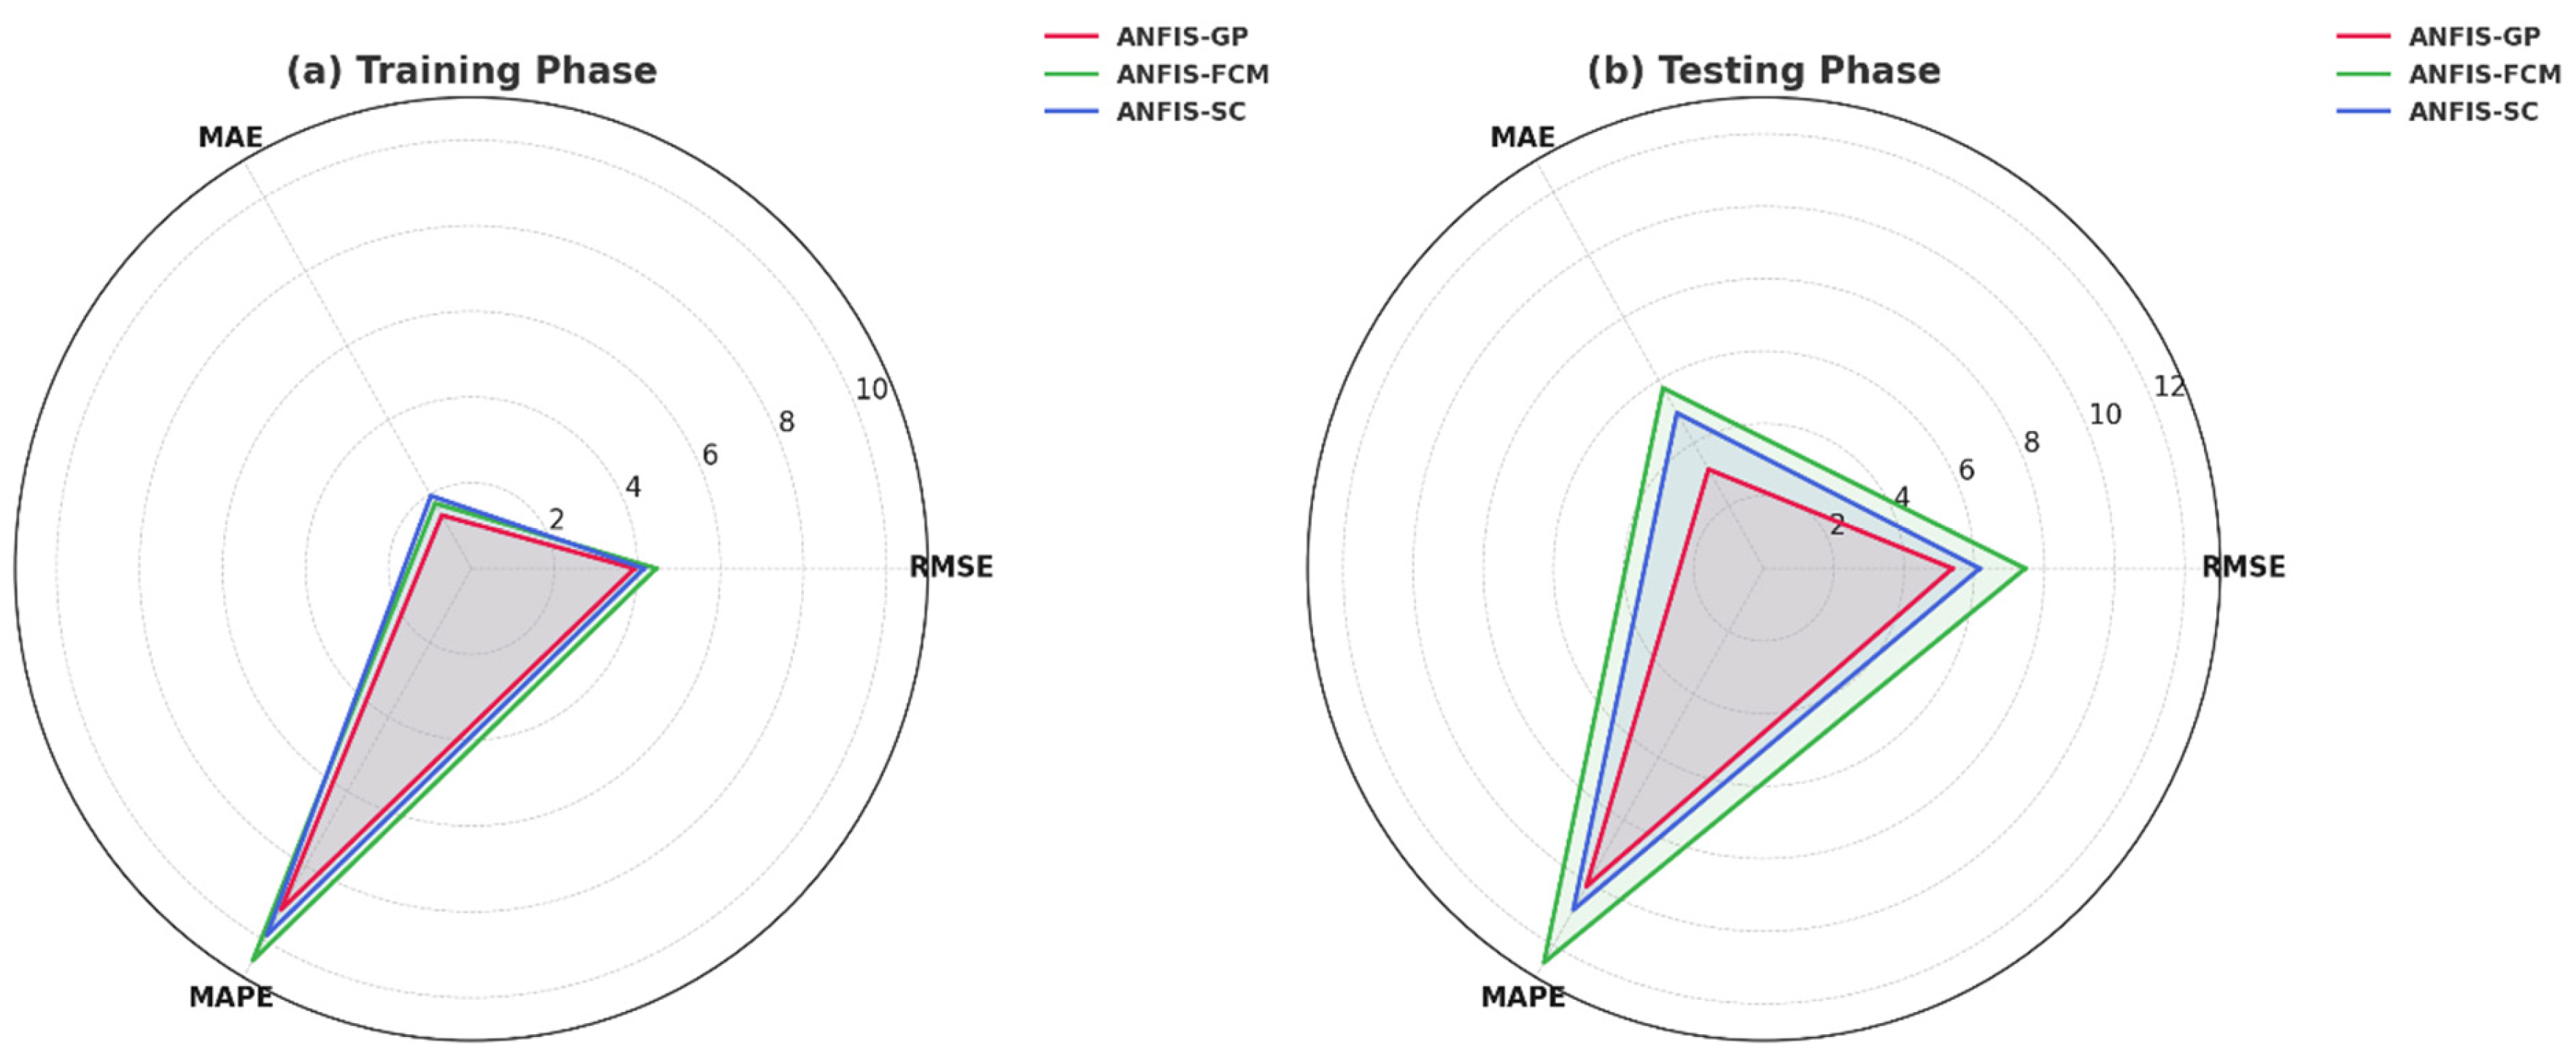
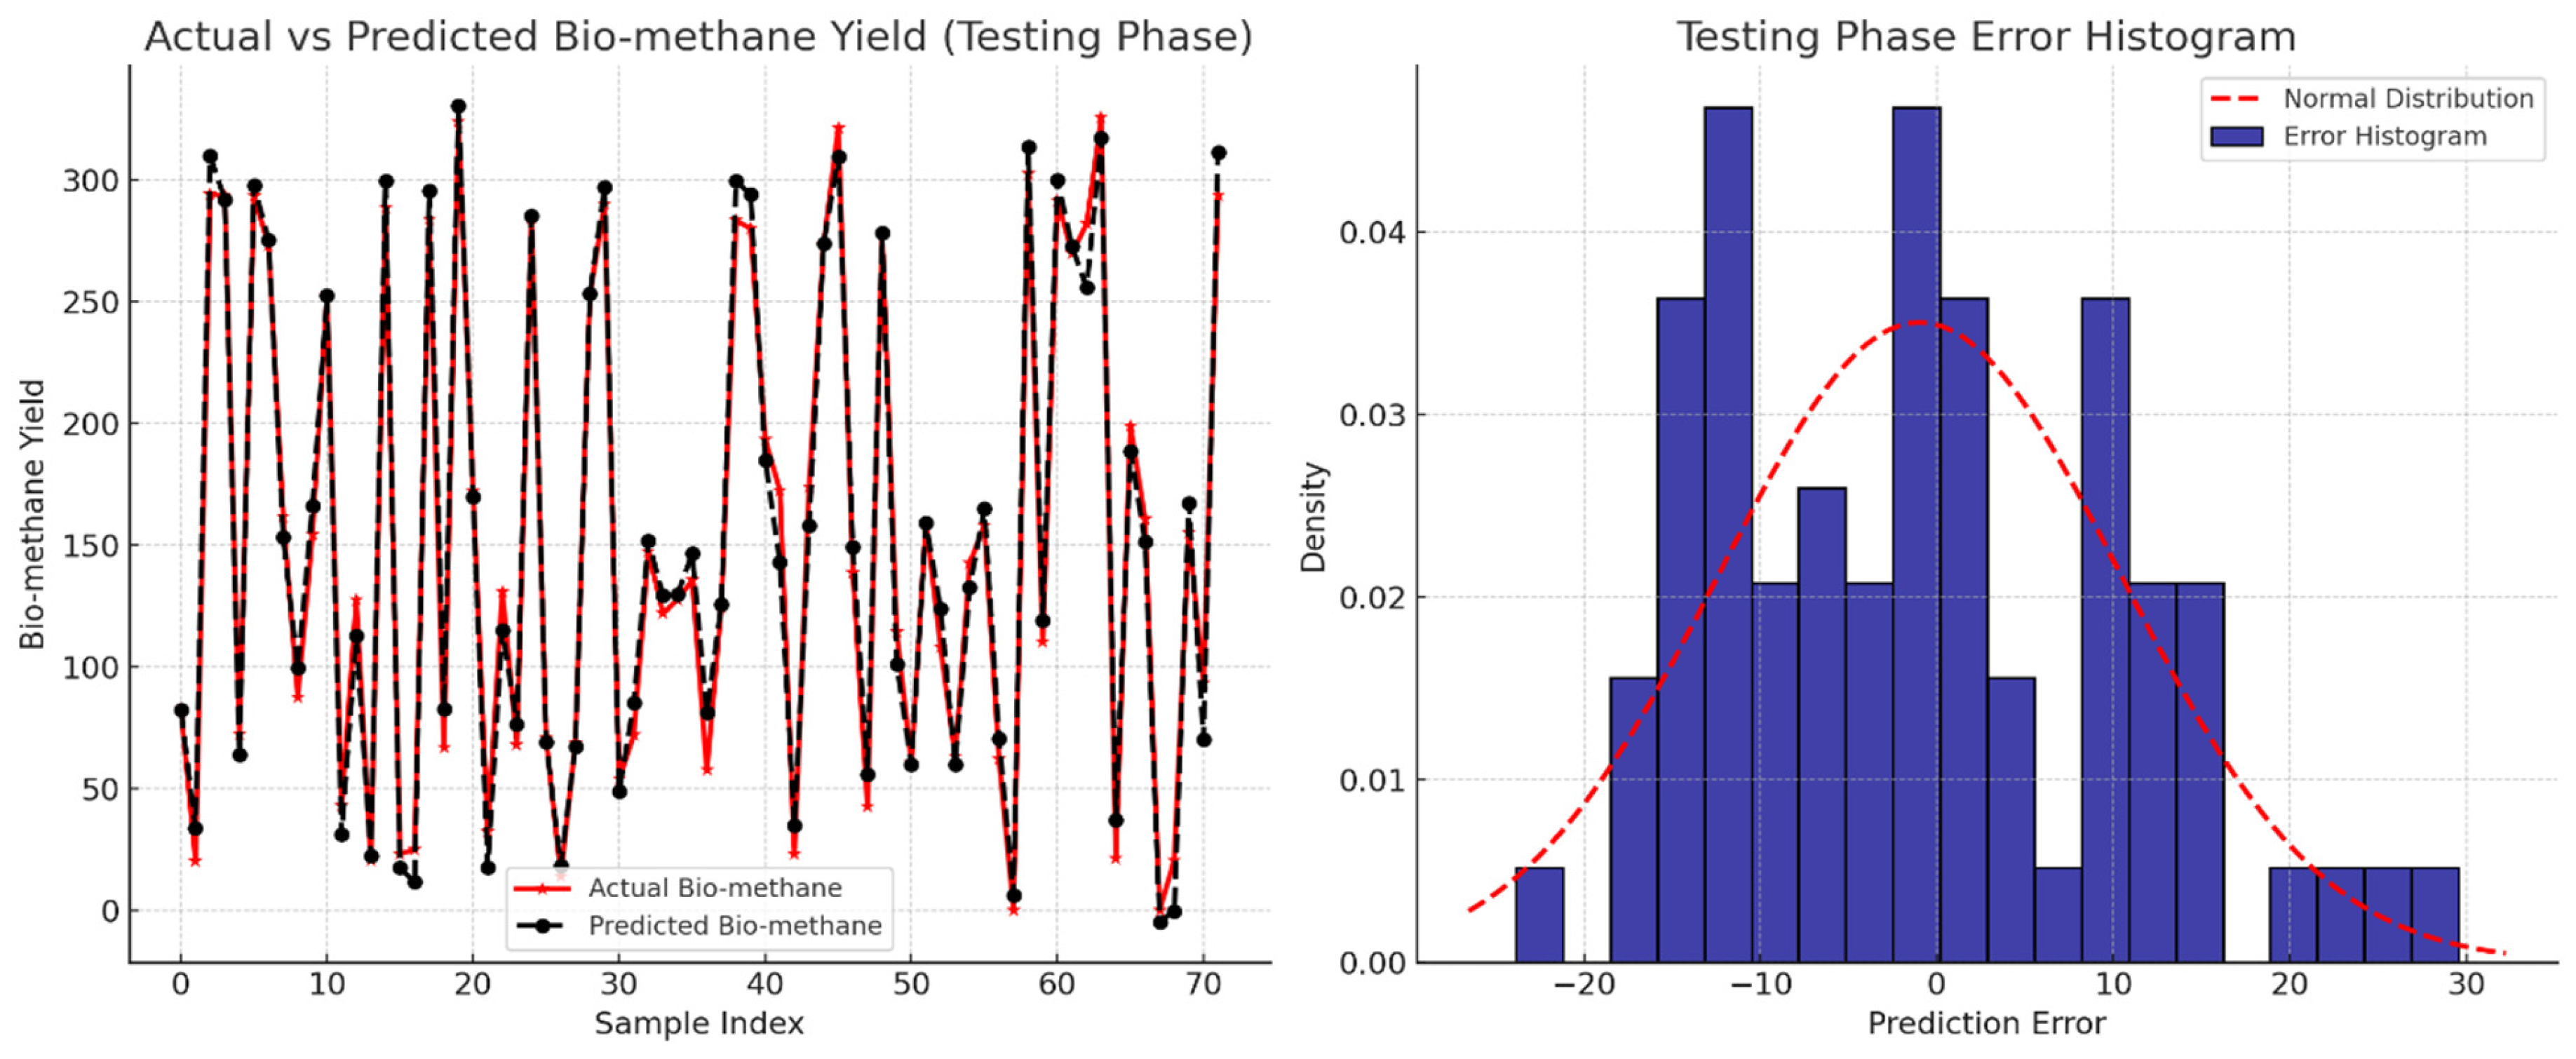
In addition to the experimental investigations, the complex microbial interactions in the bio-digestion process and the pretreatment dynamics necessitate intelligent, data-driven strategies that can comprehend and interpret system behavior, identify hidden patterns, and facilitate biomethane process optimization. This study develops a novel integration of experimental and advanced computational analysis that addresses this gap by providing in-depth data-driven insights for optimizing the biomethane production from the AD of Xyris capensis subjected to acidic (HCl) pretreatment. The biomethane yield was determined experimentally by subjecting the Xyris capensis to different HCl pre-treatment conditions, with digestion conducted in mesophilic anaerobic conditions for 40 days. We leverage the experimental dataset to develop advanced statistical methods for parameter profiling, feature ranking, dimensionality reduction, cluster analysis, and neuro-fuzzy-based predictive modeling. The digestion process’ operational parameters and pretreatment conditions serve as input variables, while the biomethane yield serves as the output for the neuro-fuzzy model. Many studies have developed machine learning-based models in biogas research. However, little or no attention has been given to assessing the novel impact of data clustering on neuro-fuzzy models in biogas research. Thus, this study investigates the effects of the prominent data clustering techniques and hyper-parameters on the ANFIS with Particle-Swarm-Optimization (PSO). This integrated approach enables a comprehensive data-driven enhancement of the process output of the anaerobic digestion of biomass resources.
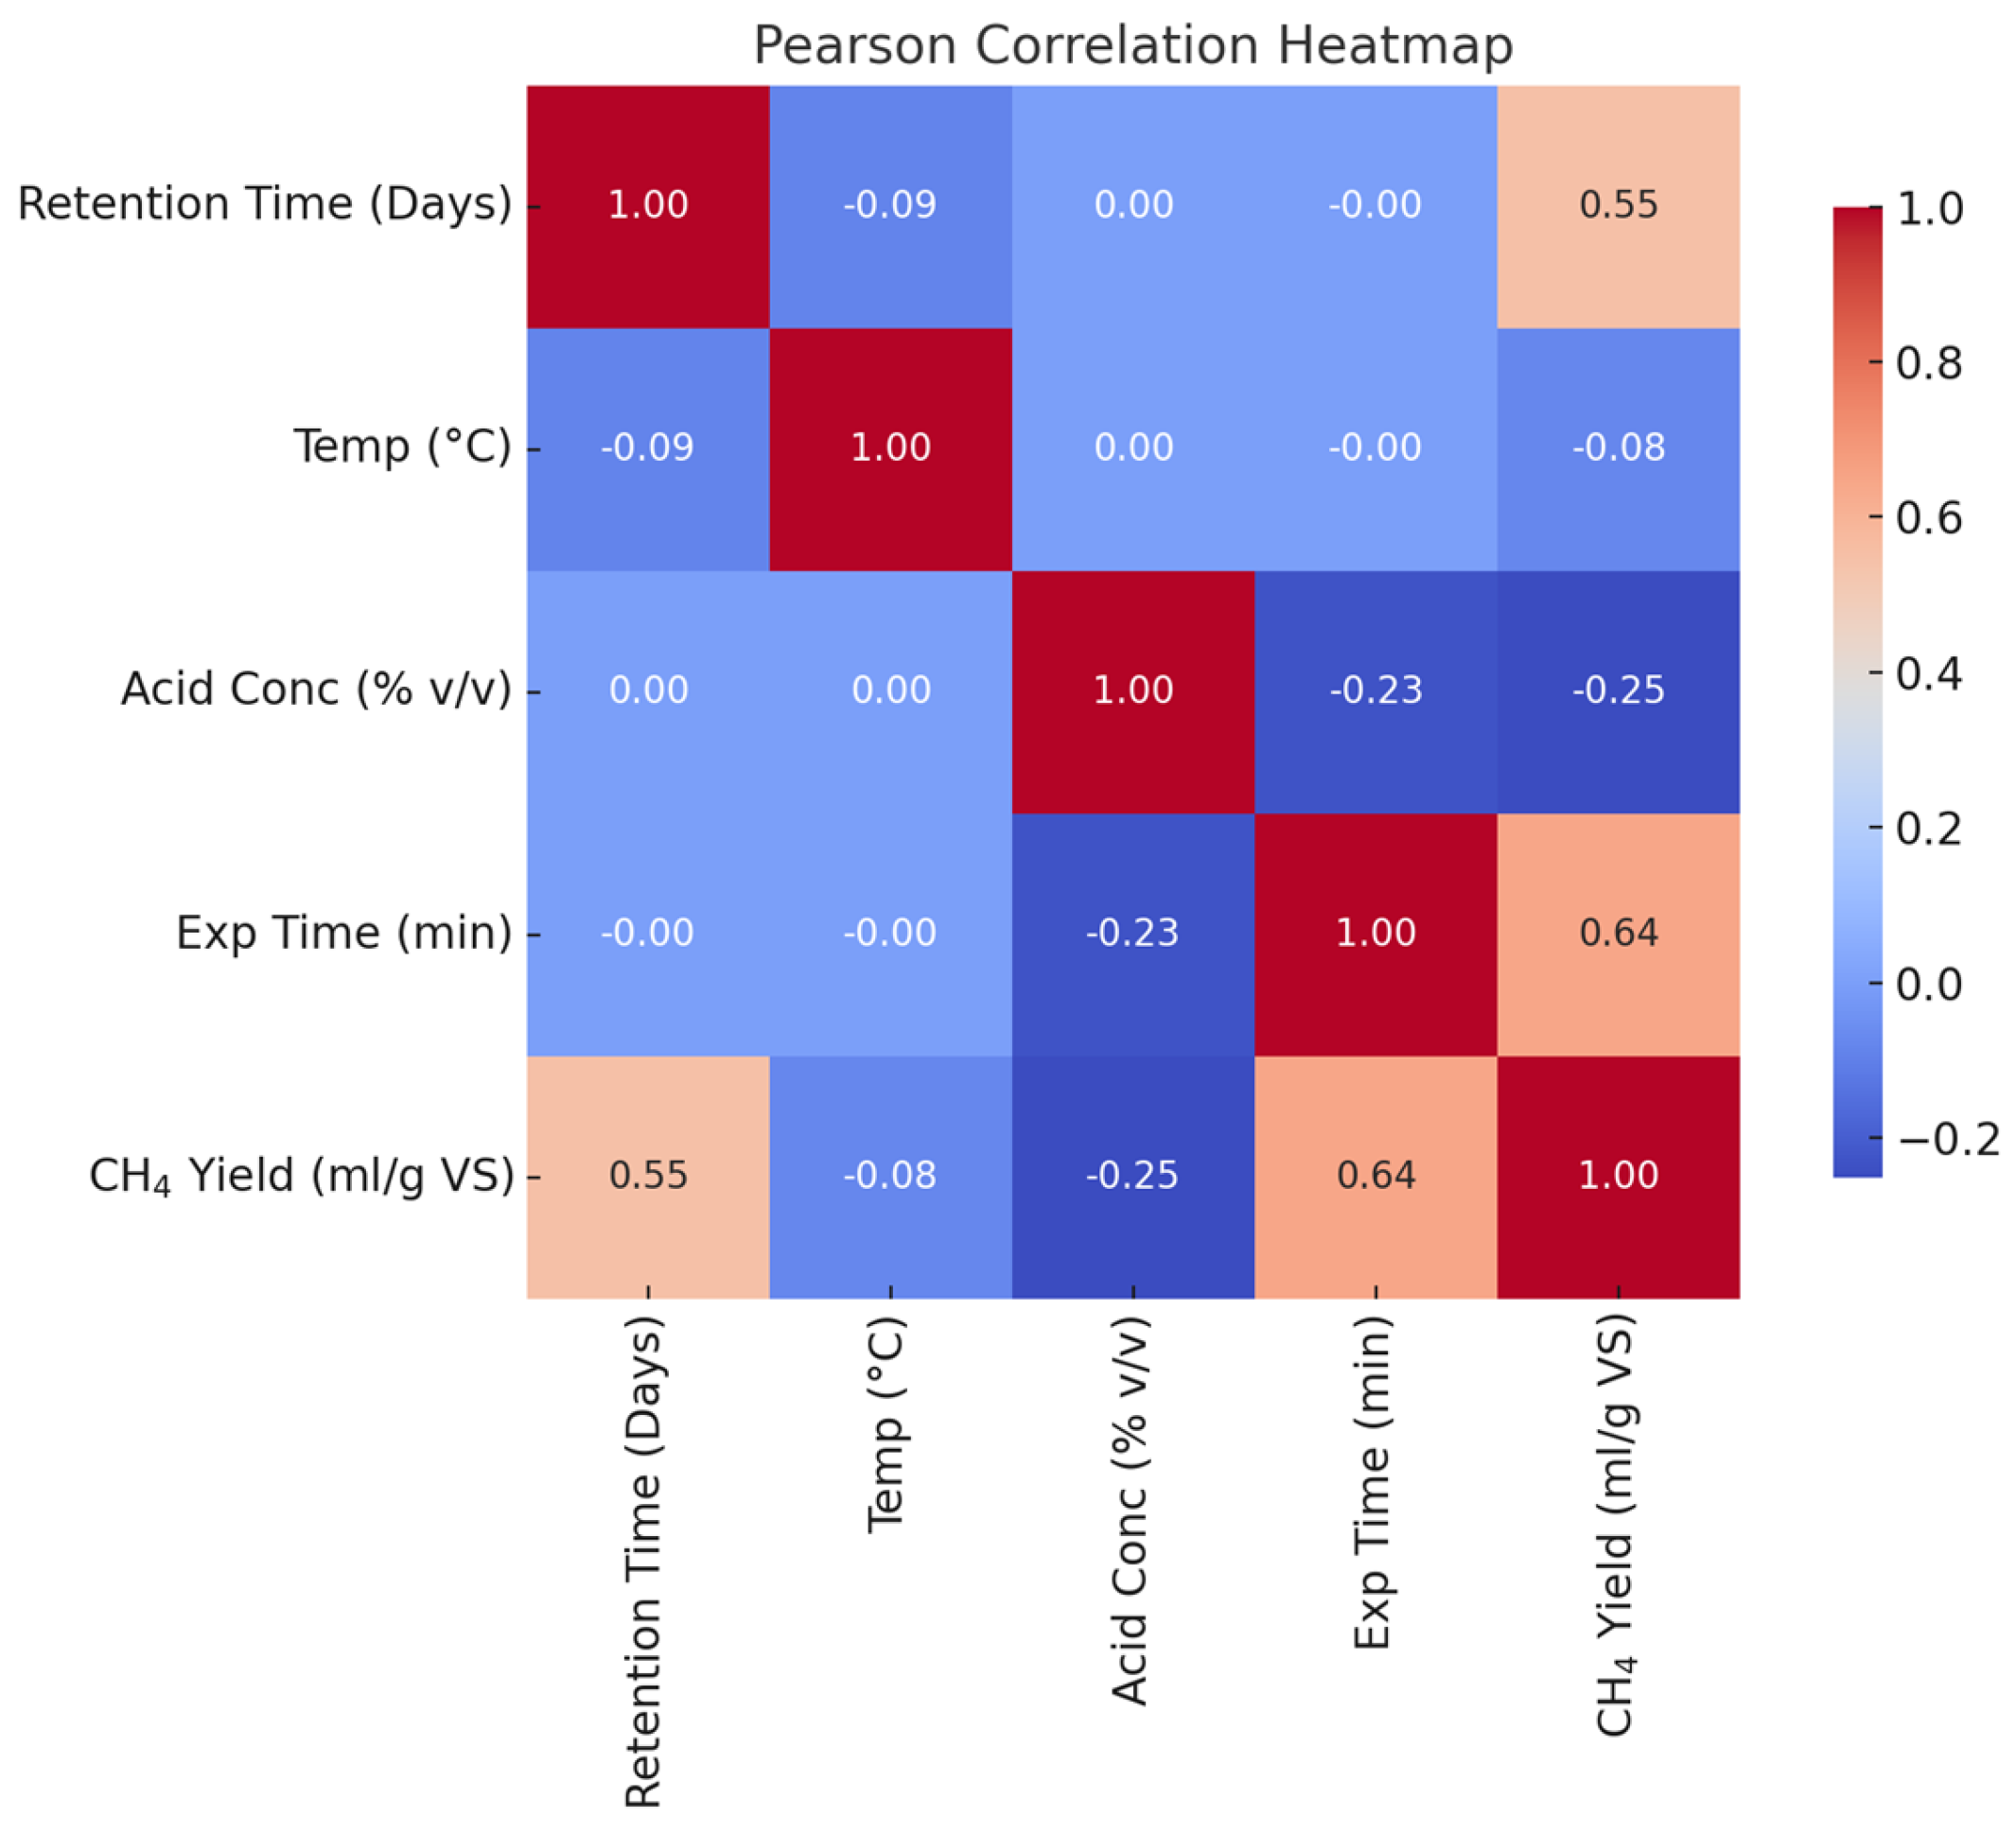
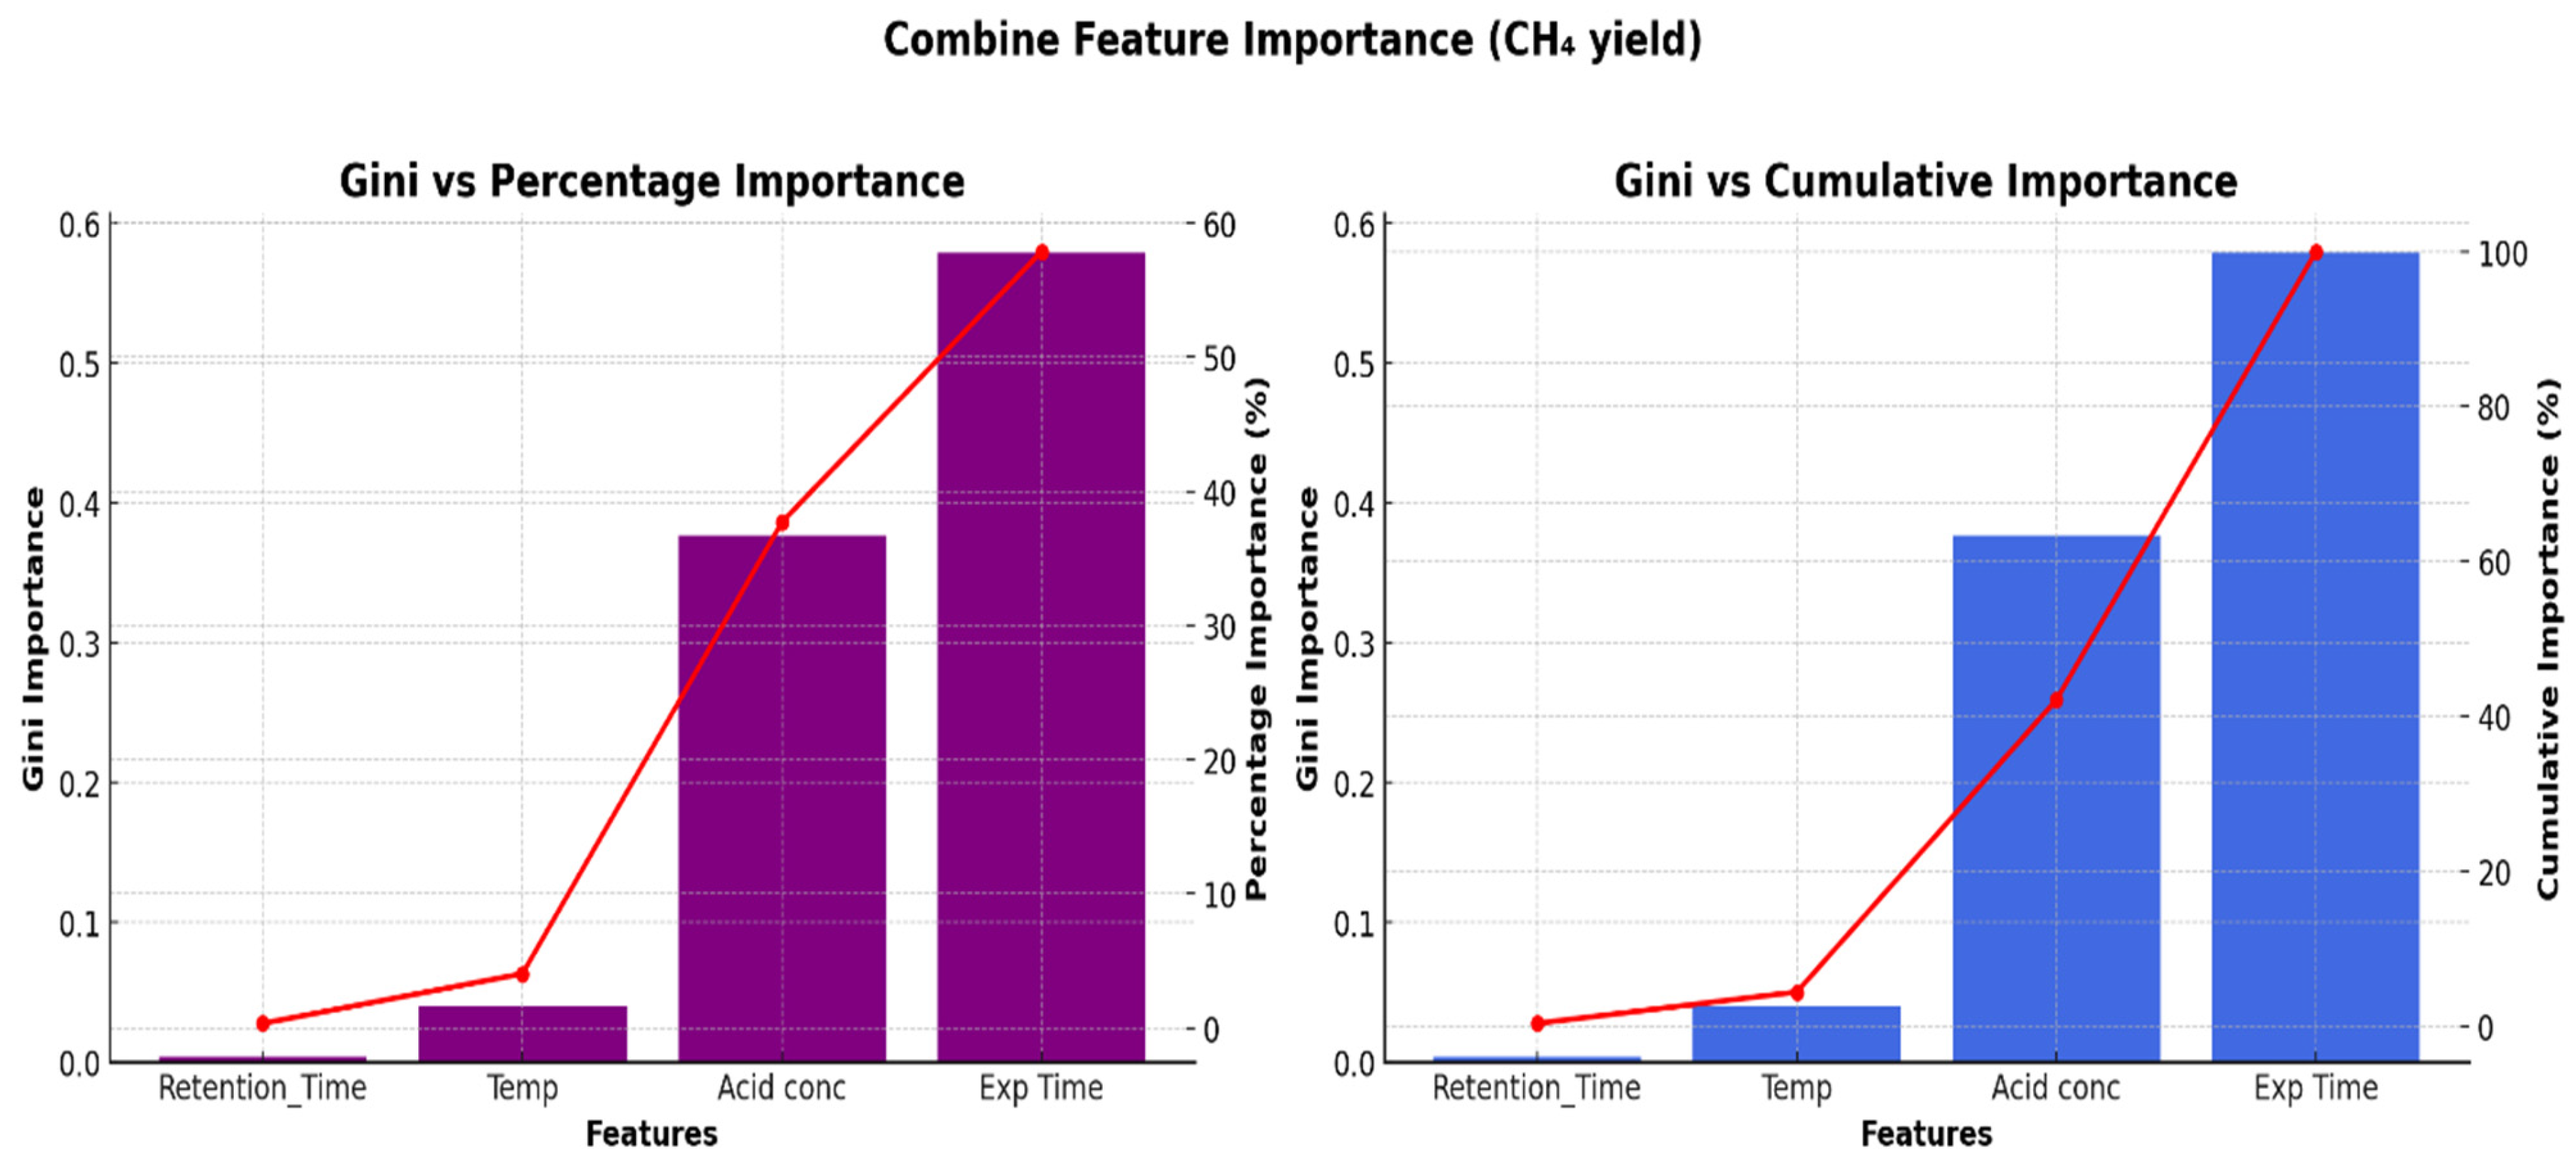
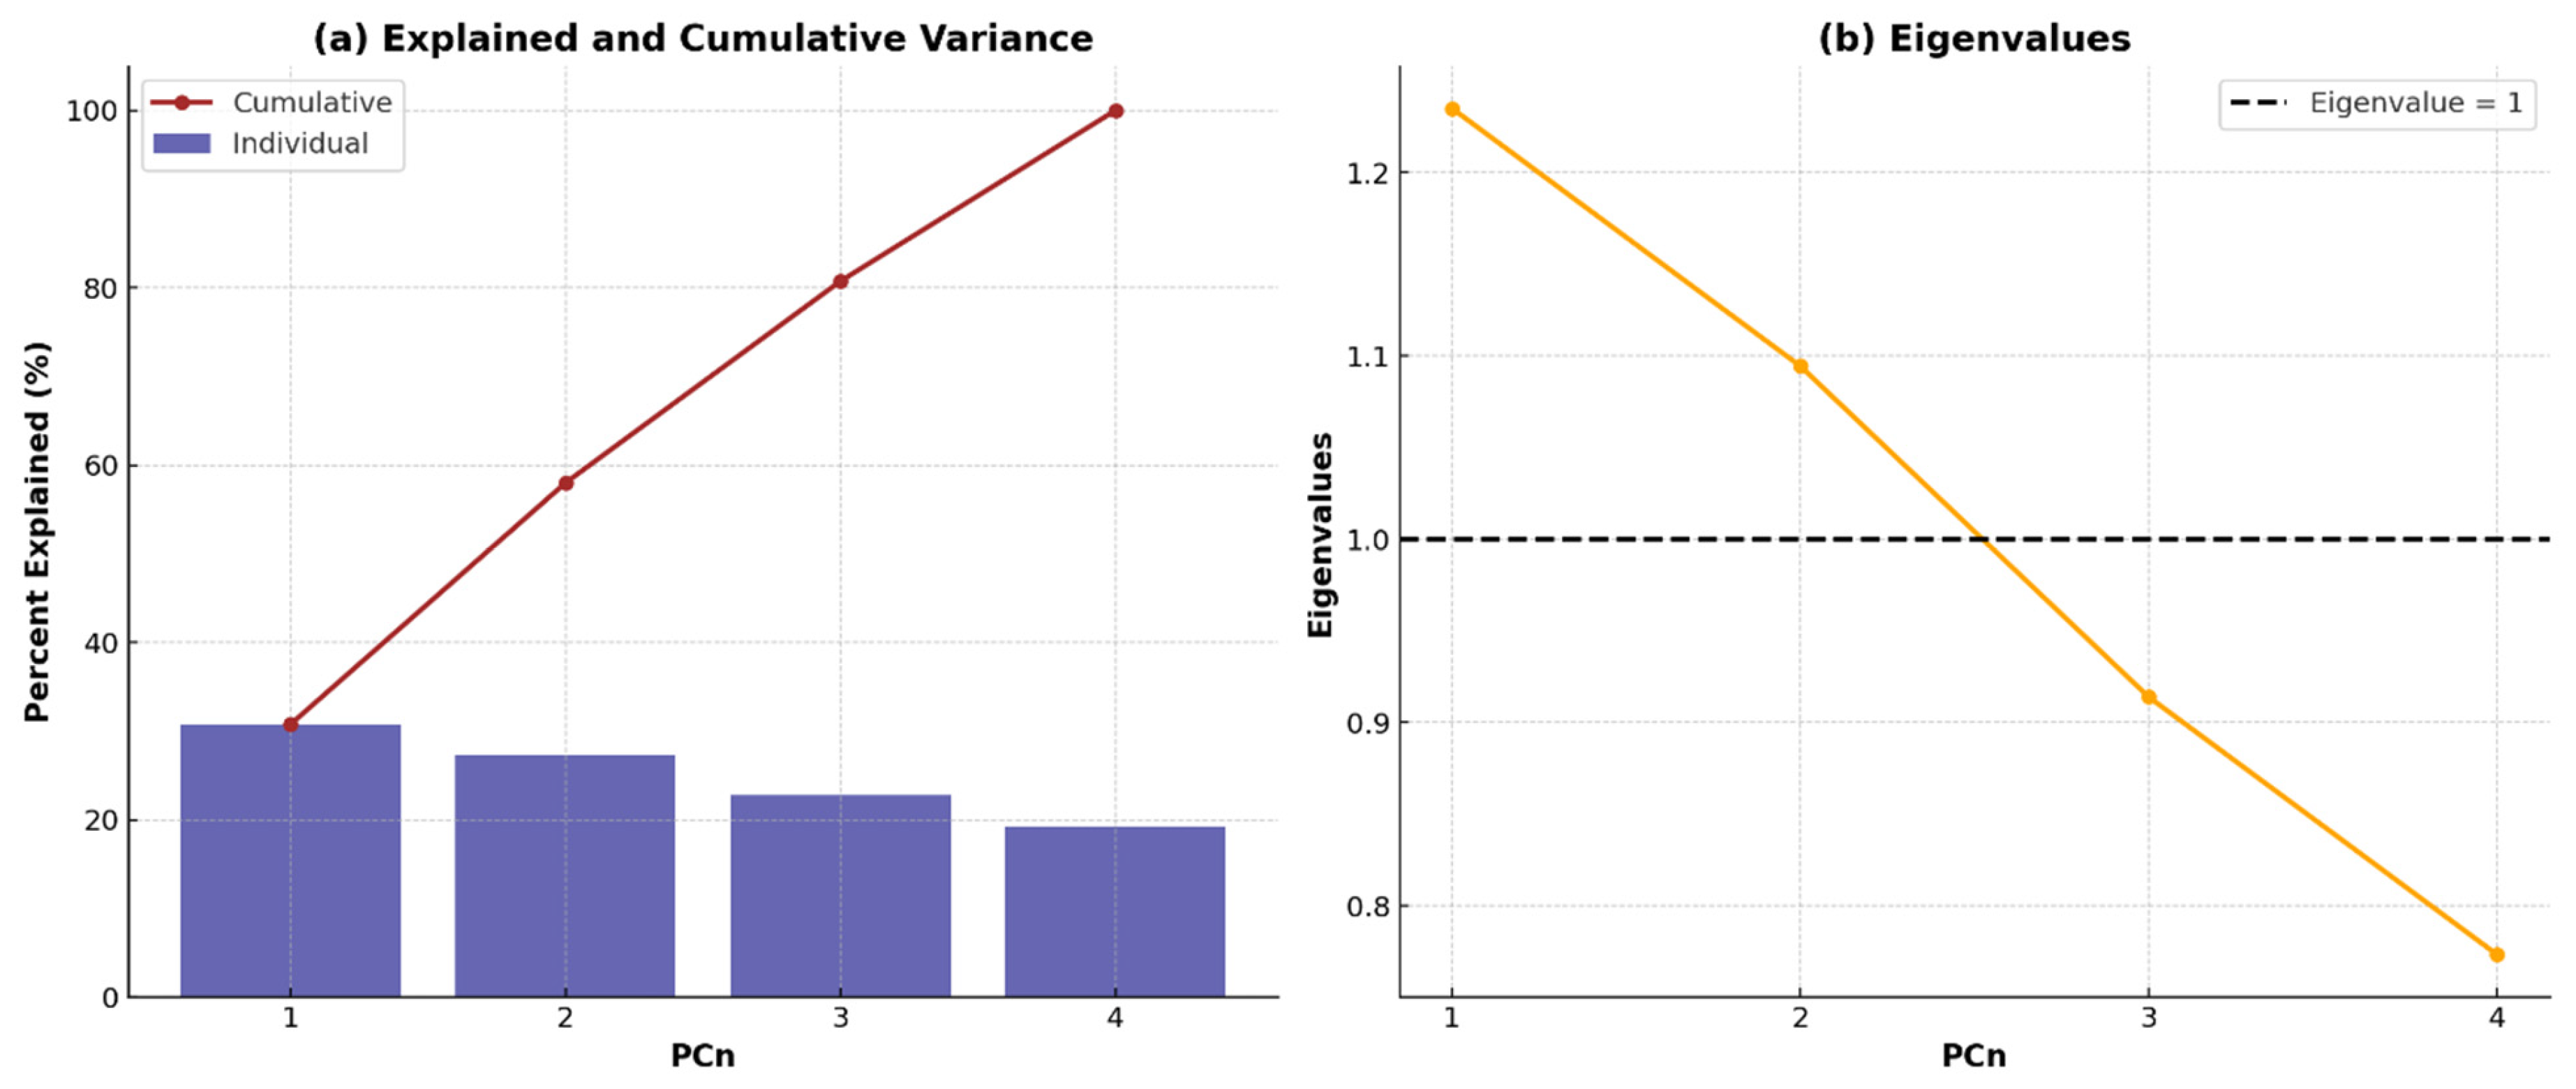
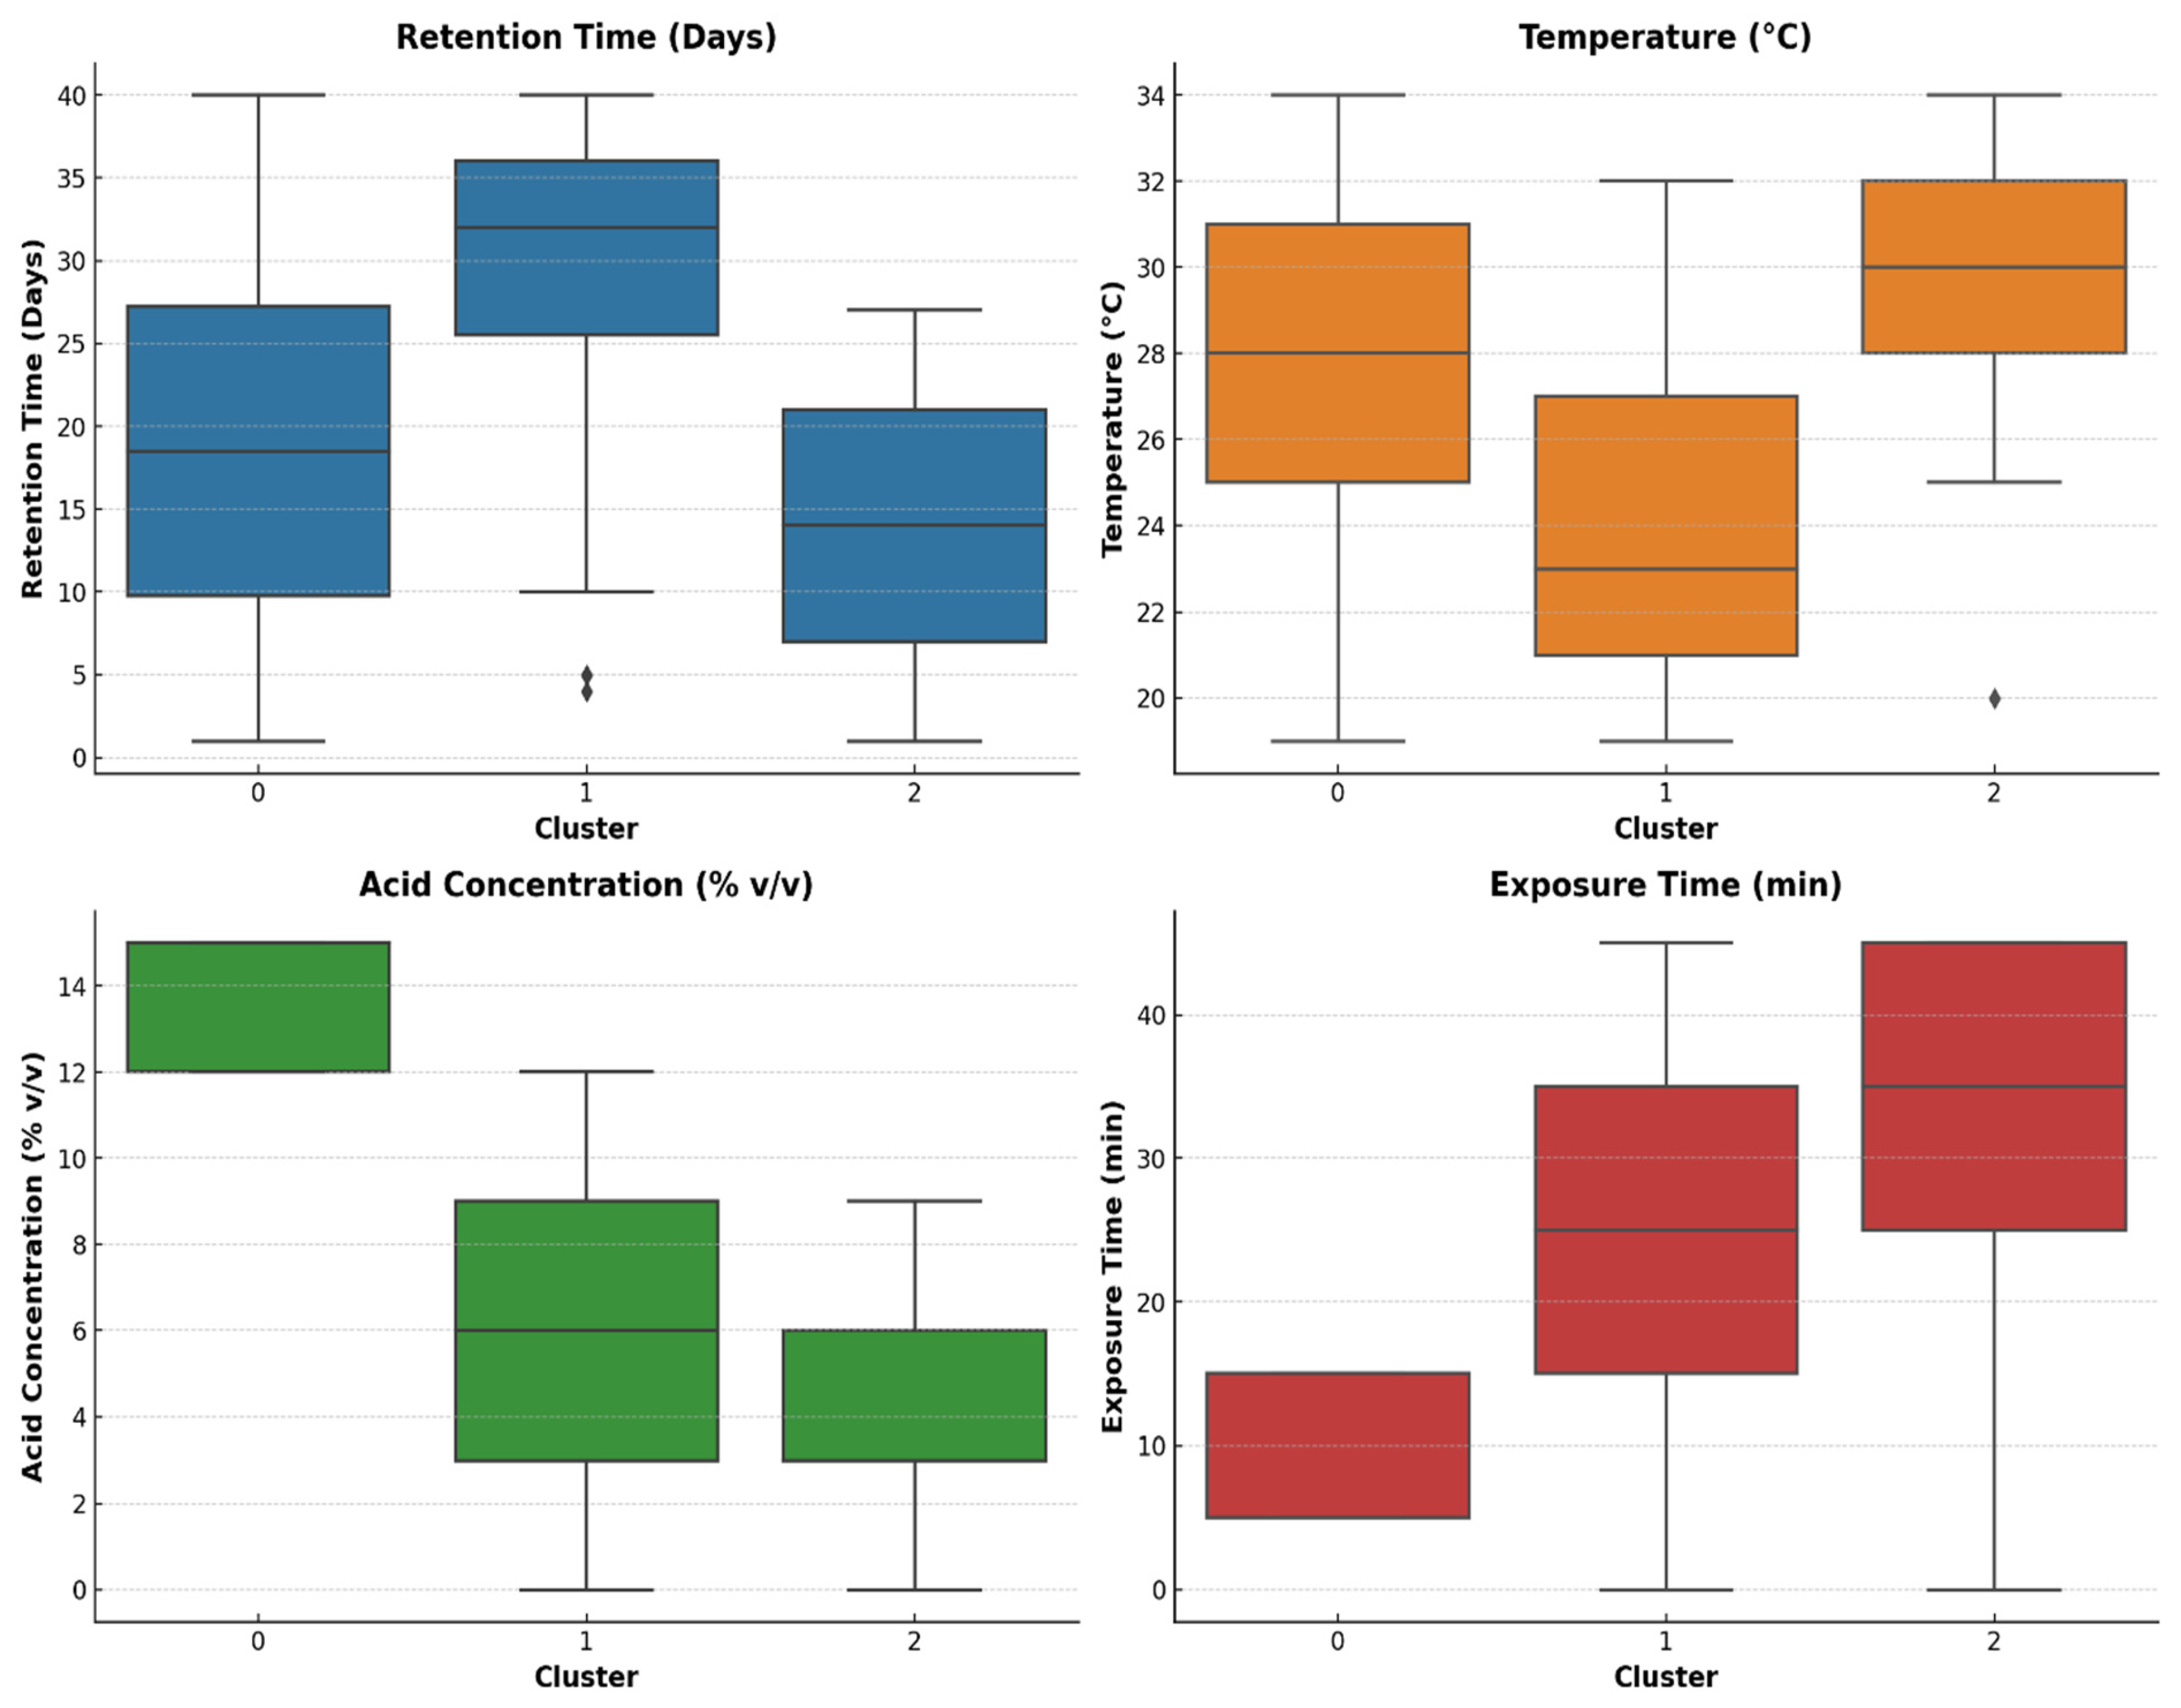
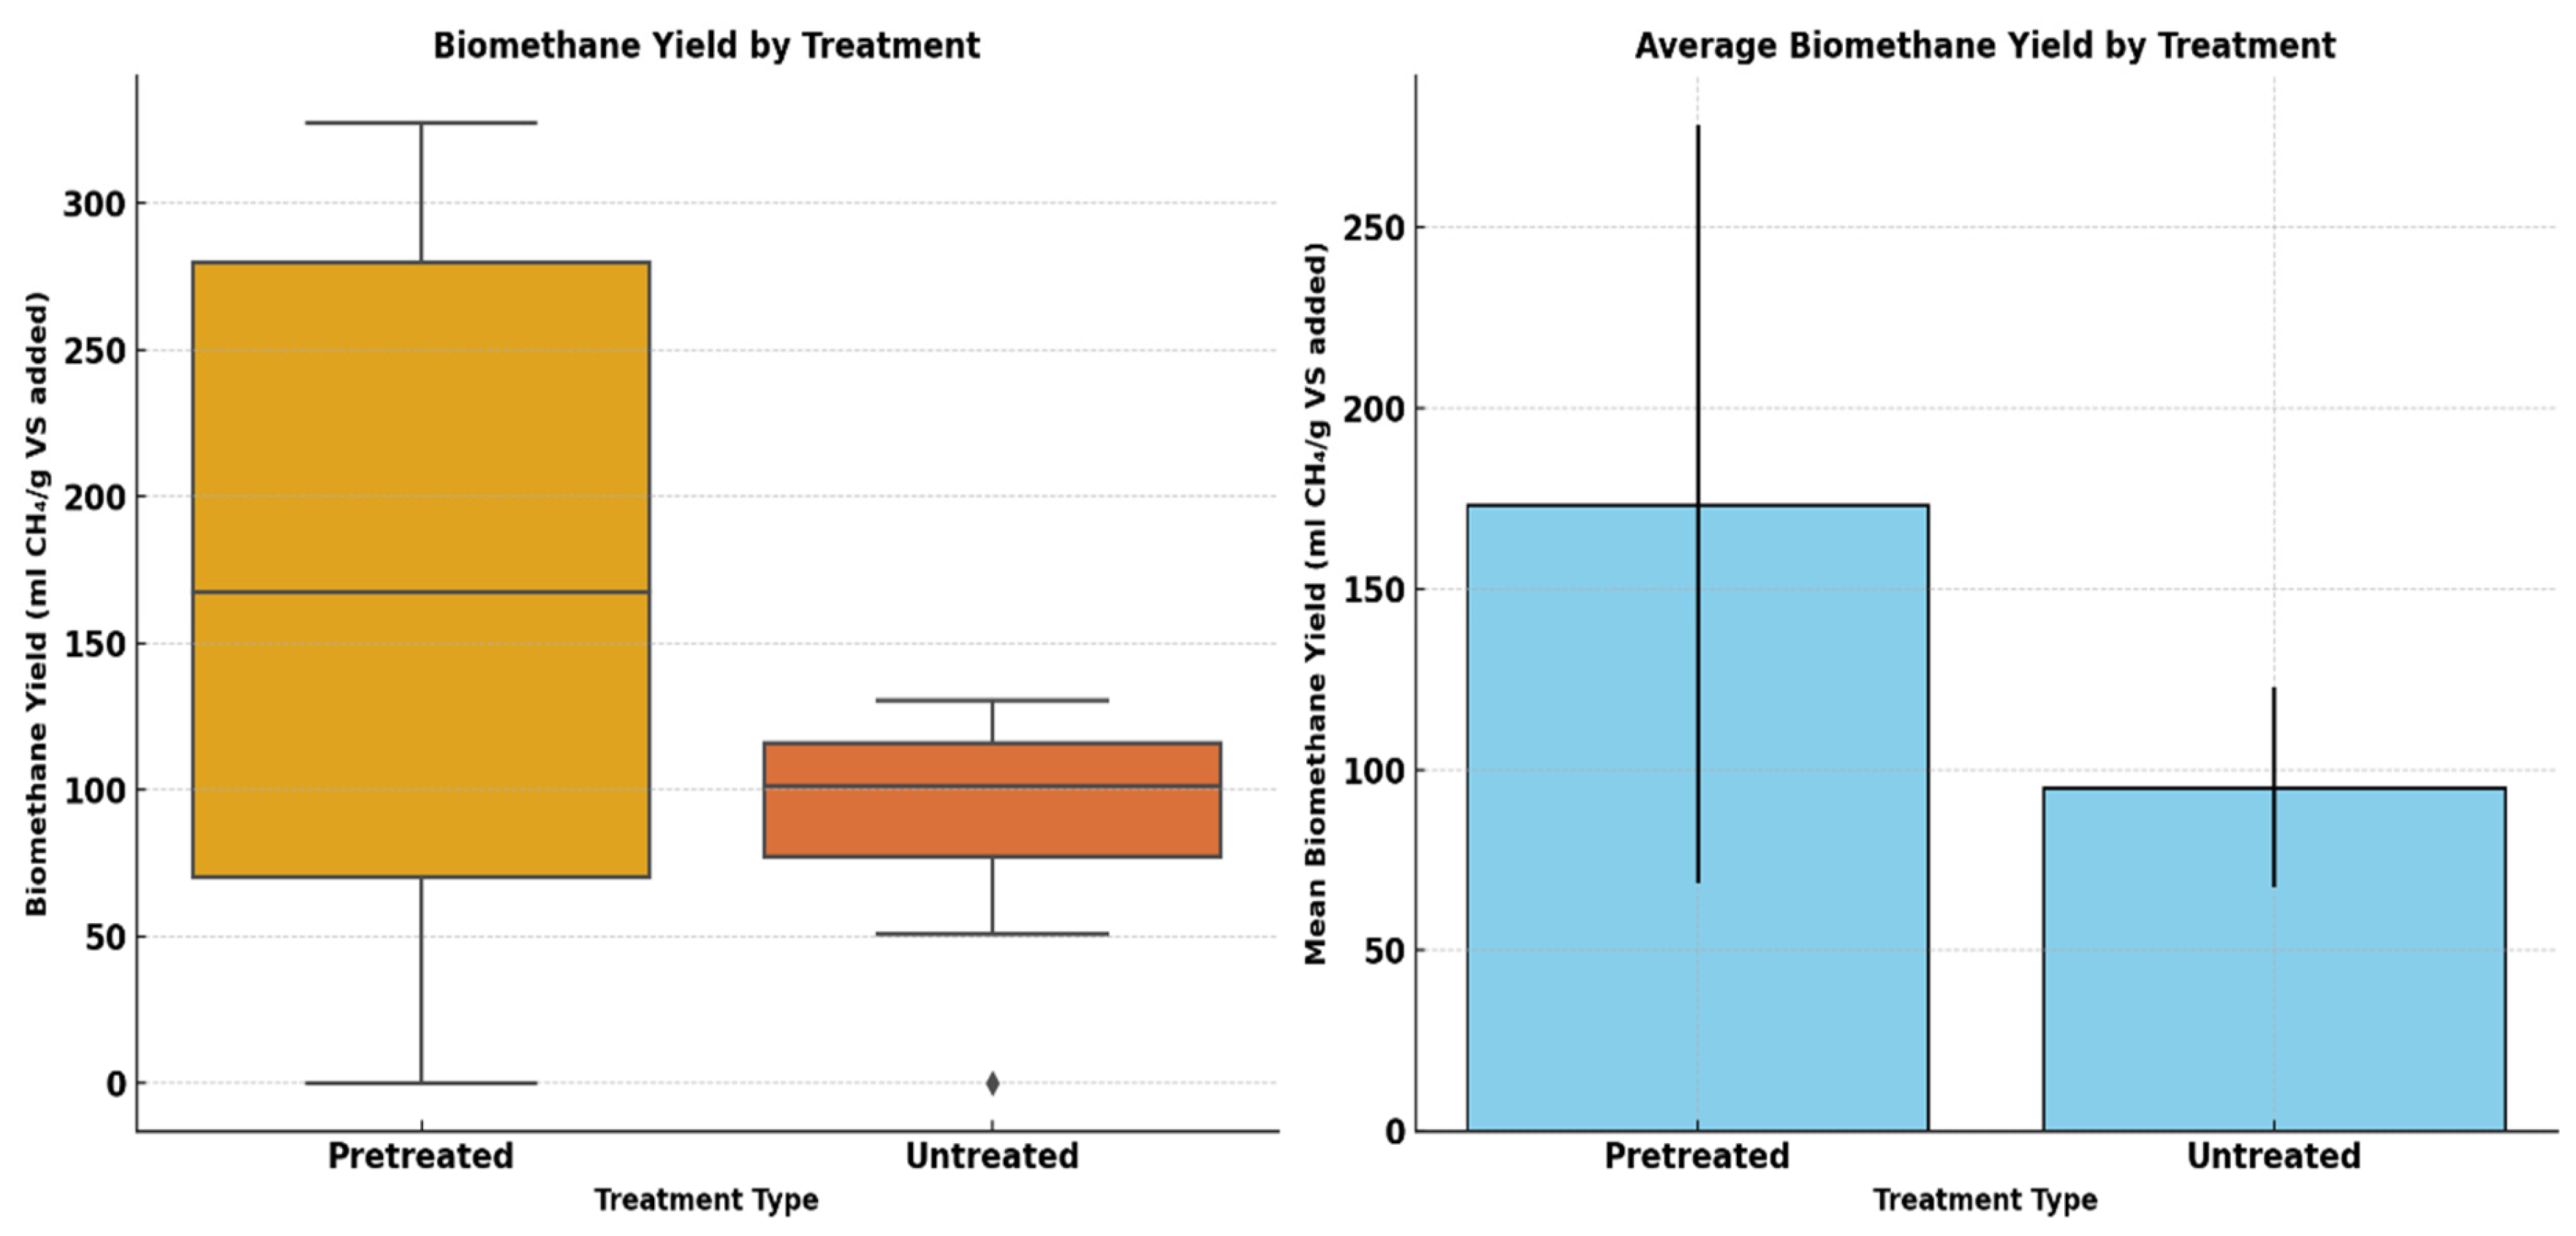
This research aims at investigating the impact of acidic pretreatment on the biomethane yield of Xyris capensis through the following objectives: (i) experimental investigations of biomethane yield under a different HCl concentration, exposure time, and digestion retention time in mesophilic anaerobic conditions for 40 days; (ii) assessment of the linear correlation between digestion parameters, pretreatment conditions, and biomethane yield; (iii) statistical assessment and visualization of the impact of acidic pretreatment on biomethane yield using a two-sample independent t-test; (iv) feature ranking of digestion and pretreatment parameters based on their relative importance and influence on biomethane yield prediction using a decision tree-based feature importance assessment; (v) unveiling dominant features influencing the energy yield of the biodigestion of Xyris capensis through dimensionality reduction using PCA; and (v) investigations of the impact of the data clustering and hyper-parameter optimization on the ANFIS-PSO model for biomethane yield prediction. The choice of the machine learning techniques, namely the PCA, k-means, and ANFIS-PSO techniques, was based on their unique strengths and capability in addressing the multidimensional complexity of the bio-digestion process and the dataset. Integrating lab-scale bio-digestion and data-driven methods in this research presents a robust and holistic framework that enhances anaerobic digestion optimizations. This research establishes an innovative and scalable approach for optimizing bioenergy, marking a substantial contribution to sustainable biogas development.

2. Materials and Methods

This methodological workflow for this research is presented in Figure 1. The experimental procedure generates the data utilized for the statistical and computational studies. MATLAB R2015a, MathWorks, Inc., Natick, MA, USA, was used for the numerical computation.

2.1. Materials Sourcing

The Xyris capensis used for the research was sourced locally in South Africa, chopped into smaller sizes (2–4 cm), and sun-dried to 25% moisture content. The dried sample was kept in a plastic bag in a well-ventilated and controlled environment in the laboratory (about 4 °C). The sample was then subjected to acidic pretreatment before the pretreated and untreated samples were characterized for ultimate and proximate composition according to the Association of Official Analytical Chemists (AOACs) procedure [18]. Liquid digestate from the previous anaerobic digester, where lignocellulose feedstock and wastewater were co-digested, was collected and used as the inoculum for the experiment. The inoculum was also stored in a controlled environment in the laboratory before characterization and AD.

2.2. Acidic Pretreatment

The acidic pretreatment of Xyris capensis was carried out using dilute hydrochloric acid to break down the recalcitrant property of the feedstock and enhance the biomethane release. Concentrated HCl was purchased locally from Sigma-Aldrich (Pty), Ltd., Johannesburg, South Africa. Pretreatment was applied as recorded in the previous investigation, with a bit of adjustment, considering the morphological arrangement of the substrate [19]. Concentrated HCl was diluted at different concentrations, as presented in Table 1, and chopped Xyris capensis was dipped into the prepared solution for the predetermined exposure times and temperature. The soaking was conducted with 1:10 of w:v at 100 °C and stirred continuously with a magnetic stirrer at 200 rpm. At the expiration of the exposure period, the substrate was filtered from the solution and washed with running water. During the washing, a pH meter was used to check the acidity of the water until a neutral pH was achieved. The acid-free substrate was then oven-dried at 50 °C for 5 h to remove the water to an acceptable moisture content. The dried samples were kept in plastic bags and put in a fridge at 4 °C before characterization and AD.

2.3. Experimental Setup

The experiment to investigate the biomethane potential of HCl pretreated and untreated Xyris capensis was carried out according to the VDI 4630 standard using the Automatic Methane Potential Testing System II (AMPTS II) [20]. Twelve 500 mL digester bottles were charged with 400 g of stable inoculum, and the pretreated and untreated substrate was added. The feedstock added to each digester was calculated using Equation (1), which was determined based on volatile solids (VS) at 2:1 of substrate to inoculum. The digesters were loaded and labeled, as shown in Table 1. The experiment was conducted at mesophilic conditions; therefore, the water bath temperature where the digesters were arranged was set at 37 ± 2 °C. The experiment was duplicated twice, and the average value for each treatment was recorded. Two reactors filled with only inoculum were also run simultaneously to ascertain the gas remaining in the inoculum and used for overhead correction. The gas generated from the digesters with only inoculum was deducted from other yield to determine the actual volume of biomethane produced by the substrate alone. The AMPTS II software was set at 60 s on and 60 s off for the mixer, 10% CO2 flush gas, and 80% of the stirrer speed for the experiment. The headspace of the reactor was set at 100 mL, and the biomethane generation was projected at 60% [21]. To remove the trapped oxygen and set anaerobic conditions in the digester, each digester was purged with nitrogen gas for about 60 s. To purify the gas released, 75 mL NaOH (3M) solution in a 100 mL screw bottle was used. Silicon tubes were used to transfer the gas produced from the digesters directly to the purification unit before being linked to the measuring unit, where the volume of biomethane released was recorded. The experiment was terminated on day 40 of the retention period when it was established that the daily biomethane release was below 1%.
M s =   M i C i 2 C S  
where M i is the Inoculum mass (g), C i is the inoculum concentration (%), M s is the substrate mass (g), while C S = is the substrate concentration (%) [20].

2.4. Statistical and Computational Framework

2.4.1. Operational Parameter Profiling

The linear interrelationship between the variables of AD and pretreatment conditions was analyzed using a Pearson correlation matrix and visualized using the correlation heat map. This expresses the potential co-linearity amongst the variables and the positive and negative correlation of the key bio-digestion and pre-treatment variables to the methane yield.

2.4.2. Statistical Assessment of Pretreatment Impact on Biomethane Yield

The impact of the acid pretreatment on the methane yield was statistically validated using a 2 sample independent t-test. The t-test assessed the average biomethane yields between the no-treatment and acid-pretreatment conditions, with the null hypothesis (H0) assuming that no significant difference existed between the means. A significant level of p-value = 0.05 was employed. The test statistics were calculated according to Equation (2).
t = X ¯ 1 X ¯ 2 s 1 2 n 1 + s 2 2 n 2
where n 1 ,   n 2 are sample sizes, X ¯ 1 and X ¯ 2 are samples, and s 1 2   a n d   s 2 2 are sample variance. A boxplot depicting the mean, variance, and standard deviation of the biomethane yield across the two treatment categories was further used to visualize the result of the t-test.

2.4.3. Decision Tree Regressor

A decision tree (DT) is a non-parametric technique for regression and classification tasks. The Decision Tree Regressor (DTR) illustrates the relationship between the input and the target features by iteratively dividing the dataset into smaller segments. One important DTR metric that quantifies each feature’s contribution to the model’s predictions is the Gini importance (GI) value. The degree to which each feature reduces Gini impurity is used to calculate the GI. At a tree node t, impurity is computed using Equation (3).
I t = 1 N t i = 1 N ( y i y i ¯ ) 2
where N t represents the number of samples at a node t , y i   is the actual value of the samples i , and y i ¯ is the mean of the target values at the node t . The impurity reduction for a feature f is computed using Equation (4) when it splits the node t into the left ( t L ) and right ( t R ) child nodes.
I f , t = I t N t L N t I t L + N t R N t I t R
The overall importance of the feature f , as expressed in Equation (5), is the aggregate of impurity reductions it provides at all nodes where it is utilized for splitting.
G I f = t T f I f , t

2.4.4. Principal Component Analysis

Principal Component Analysis (PCA) is a mathematical method employed to effectively reduce the dimensions required to represent the features of data matrices. This approach means the original matrix is transformed into an array of new uncorrelated variables known as principal components (PCs), which retain most variance in the biodigester dataset. The co-variant matrix C is estimated from the averaged dataset using Equation (6).
C = 1 N 1 · x T · x
where x is the mean data matrix, C is the covariance matrix, and N is the number of observations. The eigen decomposition can be solved using Equation (7).
C v i = λ i v i
where λ i is the eigen-value of the i t h PC, while v i is the corresponding eigen-vector. Each PC accounts for a segment of the total variance, and the explained variance ratio (EVR) is computed as in Equation (8).
E V R i = λ i j = 1 p λ j
where p is the number of features. To determine the PC scores, project the mean data onto the chosen eigenvectors using Equation (9).
  P C = x v k
where v k is the matrix of top k eigenvectors.

2.4.5. Biodigester Operational Clusters Analysis (k-Means Clustering)

K-means clustering was used to identify distinct operational clusters within the biodigester operational dataset, considering the key input variables involved. The k-means clustering partitions the dataset into k non-overlapping clusters by minimizing the within-cluster sum of squares (WCSSs), effectively grouping operational states with similar characteristics. In the iterative process, each data point x j is assigned to the cluster with the nearest centroid μ i , using the Euclidean distance in Equation (10), and the cluster assignment is formalized using Equation (11).
d x j , μ i = m = 1 p x j m μ i m 2
C j = a r g   min i   d x j , μ i
After the assignment, cluster centroids are adjusted by calculating the mean of all data points within each cluster with Equation (12).
μ i = 1 c i x j c i x j
where c i   represents the collection of data points allocated to cluster i, while c i is the data points within the cluster. The total within-cluster sum of squares (WCSSs) is minimized, as followed in Equation (13).
W C S S = I = 1 K x j c i x j μ i 2
Iterations continue until the change in the WCSS between iterations falls below a threshold. The clustering results were further validated by projecting the clustered data onto the first two principal components derived from PCA, enabling an intuitive interpretation of the operational regime.

2.4.6. Adaptive Neuro-Fuzzy Inference System (ANFIS)

The ANFIS is a hybrid machine learning algorithm and a soft computing model that incorporates a fuzzy logic linguistic system with the numerical terms of a neural network to learn from experience and make decisions in a manner that mimics that of humans [22]. It has four distinct layers (see Figure 2), transforming input into crisp output via fuzzy logic and neural learning. At the first layer, the system gets input variables from the outside environment, containing fuzzy membership functions τ A i x and τ B i y related to the input/features x   and y , while its output function is defined by   O 1 j and F 1 j at each node, as is presented in Equation (14).
O 1 j = τ A i x   a n d   F 1 j = τ B i y , i = 1,2   a n d   j = 1 , 2 .
The second layer maps the crisp input variables to fuzzy sets, where each node contains membership functions MF (e.g., gaussian, triangular, bell-shaped, etc.). Equation (15) presents the output through an AND operation of the fuzzy layer O 2 j   to compute the firing strength of each rule.
O 2 j = τ A i x × τ B i y , i = 1 , 2   a n d   j = 1 , 2 .
At the normalization layer, fuzzy logic is applied. As seen in Equation (16), the output function ( O 3 j )   is a fraction of the node’s firing strength to the sum of the firing strength of the other nodes.
O 3 j = w ¯ i = w 1 w 1 + w 2 + w 3 , i = 1 , 2   a n d   j = 1 , 2
where w 1 ,   w 2 ,   w 3 represents the firing strengths of the three fuzzy rules while w ¯ represents a normalized firing strength.
The defuzzification layer changes the inference layer’s fuzzy output value into a crisp output value. To do this, the outputs   O 4 j , each rule is averaged using a weighted formula, where the weights represent the rules’ firing strength, as shown in Equation (17).
O 4 j = w ¯ i f i = w 1 p 1 x + q 1 y + r 1 , i = 1 , 2   a n d   j = 1 , 2 .
where f i is the linear function for the i t h   rule, and p 1 , q 1 , and r 1 are the adjusting parameters.
The output layer produces the final output value of the ANFIS system. At this layer, a single node adds all the signals from all incoming layers to get the overall crisp output ( O 5 j ) , as in Equation (18).
O 5 j = i = 1 n w ¯ i f i = i = 1 n w i f i i = 1 n w i i = 1 , 2   a n d   j = 1 , 2 .

2.4.7. ANFIS-Based Clustering Techniques

Clustering is a crucial stage in ANFIS modeling that is necessary to construct the fuzzy inference system structure for the data, assign membership functions (MFs), and arrange data points into a comparable fuzzy cluster. The grid-partitioning (GP) technique, where the input space is separated into rectangular subspaces, uses an axis-parallel partition contingent on the kind and quantity of the pre-defined MF [23]. A modest number of MFs becomes practical due to the exponential relationship between the number of fuzzy rules ( m ) and the number of inputs ( n ), which results in several fuzzy rules ( n m ). The probability that each data point would define the cluster center based on the density of nearby data points is estimated using the subtractive clustering (SC) approach, which is computed based on the assumption that each data point’s likelihood of being a possible cluster center. The potential P i of the i t h and the nth data point in an M -dimensional space is shown in Equation (19). The Euclidean distance is denoted as α .
P i = j = 1 n e α x i x j 2
where α = 4 r a 2   is a parameter that controls the spread of the influence of each data point ( x i   a n d   x j ) in the input space ,   a n d   r a > 0 is the radius that describes the adjacent dataspace. Here, x i x j 2   is the squared Euclidean distance between the points x i   a n d   x j . The fuzzy c-means (FCM) clustering assigns data points to a cluster and a membership degree to each data point based on the premise that there is a known number of clusters.

2.4.8. Particle Swarm Optimization (PSO)

In this study, PSO has been chosen to tune the hyper-parameters of ANFIS because it can efficiently find global optima in complex, high-dimensional solution spaces. The best local and international positions within the entire swarm are used to monitor the position and speed of the particles. Equations (20) and (21) can be used to explain the velocity ( v i ) and position ( x i ) of the i t h particle in a population of N particles.
v i k = ω v i k 1 + r 1 c 1 x P b e s t x i k + r 2 c 2 x G b e s t x i k
x i k = x i k 1 + v i k
where P b e s t denotes the particle’s best local location while G b e s t denotes the particle’s best swarm position. k represents the current iteration or time step, ω is the initial weight, c 1 and c 2 are the social and cognitive acceleration constants, respectively, while r 1   a n d   r 2 are random values between 0   a n d   1 . The damping factor ωdamp is used to update ω over time, allowing it to decrease gradually during the optimization process, as shown in Equation (22).
ω k = ω k 1 × ω d a m p

2.4.9. Model Parameter Setting for the ANFIS-PSO Model

A few hyper-parameters were tested in each clustering. Different MF types were investigated for the GP, while a range of cluster radii was investigated using SC methods. The FCM method was tested with an optimal range of cluster numbers. Table 2 provides more details on the model’s parameters.
To assess the accuracy and robustness of the model, statistical metrics like the mean absolute error (MAE), the mean absolute percent error (MAPE), and the root mean square error (RMSE) were employed and computed using Equations (23)–(25).
M A P E = 1 N k = 1 N y k y k ^ y k × 100 %
R M S E = k = 1 N [ y k y k ^ ] N
A E = k = 1 N y k ^ y k N

3. Results and Discussion

3.1. Cumulative Biomethane Yield

Physicochemical analysis of the sample according to the AOAC standard [18] shows that the sample has 100, 94.00, 44.21, 1.60, 5.68, 48.01, and 27.53 total solids, volatile solids, carbon, nitrogen, hydrogen, oxygen, and C/N ratio, respectively. These results indicate that the sample is a suitable feedstock for biomethane production, considering the composition compared to other lignocellulose feedstocks [21,24]. The acid pretreated and untreated Xyris capensis were digested for a 40 day retention time, and the cumulative biomethane yield is presented in Figure 3. The biomethane yields released were 284.04 ± 10.12, 327.28 ± 13.54, 295.25 ± 11.40, 252.84 ± 10.51, 212.14 ± 10.95, and 130.63 ± 4.35 mL CH4/g VSadded for treatments V, W, X, Y, Z, and U, respectively. The biomethane yield was improved by 117.44, 150.54, 126.02, 93.55, and 62.40% for treatments V, W, X, Y, and Z, respectively, compared to the untreated substrate (treatment U). This result shows that HCl pretreatment enhances the biomethane yield of Xyris capensis. This agreed with previous studies that reported that pretreatment improves the biomethane yield of lignocellulose feedstocks [10,11]. It was noticed from the result that treatment W released the highest biomethane yield of Xyris capensis. This result shows that an increase in the concentration of HCl improves the biomethane yield until a point when the yield starts to decline. It can be observed from the result that lower concentrations of acid with a longer exposure time were more effective than higher concentrations of HCl and a shorter retention time. This could be linked to the strength of the strong acid in producing inhibitory compounds like phenolic acid, 5-hydroxymethylfurfural, and furfural in large quantities that inhibit the biomethane during the digestion process [25]. A similar study reported that a low concentration of HCl released higher reducing sugars from pretreated agave leaf powder. The study shows that 0.5% v/v produces the highest sugar reduction against other higher HCl concentrations [26].
The difference in the HCl concentration between the study and this is due to the difference in the microstructural arrangement of both feedstocks. Agave leaf powder has a lower percentage of lignin, which allows the pretreatment solution to access the feedstock faster than Xyris capensis, which is rich in lignin with a smaller surface area. On the other hand, the biomethane yield was increased by 143% when alkali pretreatment was applied to Xyris capensis, a value that is a bit lower in this study. It was also noticed that a higher concentration of NaOH (4% v/v) with a shorter exposure time (20 min) released the highest biomethane yield [27]. This study indicates that HCl is stronger than NaOH in removing the lignin portion of the substrate and exposing the cellulose and hemicellulose to microbial attack. Oxidizing pretreatment using Piranha solution, which is another chemical treatment technique, was investigated on Xyris capensis, and it was observed that the biomethane yield was increased by 48.52%, which is lower than the value recorded in this study [28]. It can be inferred from this study that among all the chemical pretreatments investigated on Xyris capensis, HCl pretreatment released the optimum biomethane yield. Rice straw was pretreated with different concentrations of HCl, and it was noticed that 2% v/v released the highest biogas yield with a 46.5% increase compared to the untreated substrate [29]. It can be observed that lower concentrations of HCl also produced the optimum yield, which agrees with this study.
V—3% v/v HCl for 45 min., W—6% v/v HCl for 35 min, X—9% v/v HCl for 25 min, Y—12% v/v HCl for 15 min, Z—15% v/v HCl for 5 min, and U—control.
Dilute HCl pretreatment was noticed to reduce the recalcitrant characteristics of Xyris capensis across all the conditions considered in this study. This shows that the acid disintegrates important bonds such as hydrogen and covalent. Also, the impacts of pretreatment on the van der Waals in the feedstock enhance the hemicellulose solubility and partial cellulose solubility during the digestion process, as observed by Baadhe et al. [30]. HCl pretreatment hydrolyzed the xylose content of Xyris capensis to monosaccharides, resulting in hemicellulose depolymerization, as noticed in the biomethane yield from this investigation. This technique can be seen to promote organic solubilization and improve the surface area accessible for enzymatic hydrolysis [8]. Lower acid concentrations, exposure time, and temperature partially reduced the amorphous portions, such as hemicellulose and lignin. Zhao et al. reported that amorphous cellulose provides more accessibility to microorganisms than crystalline cellulose [31], which can be the reason for the better yield in this condition. Biogas improved by 115.41% when 2% v/v of HCl was applied to pretreat corn straw [8]. Comparison with other studies on HCl pretreatment is a bit difficult because there is minimal literature on the application of HCl on lignocellulose feedstocks. However, the process is efficient compared to other acidic pretreatments on lignocellulose feedstocks. Wheat straw, rapeseed, and maize residue were pretreated with 0.5% H2SO4, and it was observed that the biogas yield increased by 32% and 71% from wheat straw and rapeseed straw, respectively. On the contrary, biogas yield from the maize residue was reduced by 23.5% compared to the untreated substrate [32]. The variation in the performance of these feedstocks can be linked to different morphological arrangements of the feedstocks. The methane yield of cassava residues increased by 56.96% when thermal sulphuric acid was applied, compared to the untreated substrate [12]. In another study where Salvinia molesta was pretreated with H2SO4, the biogas yield was enhanced by 82% [33]. The results from these studies differ from this study due to the differences in morphological arrangements of the substrate, but this study produces higher results. Acid purity, temperature, treatment time, and acid concentration are other factors that can lead to this variation. The challenges that hinder this technique are high investment costs, process toxicity, the need for sophisticated equipment due to acid corrosion, and the release of inhibitory materials.

3.2. Operational Profiling of the Digestion Parameters and Pretreatment Conditions

A comprehensive understanding of the interplay between the significant biodigester and pre-treatment conditions and the complex biochemical process within the biodigester provides a valuable insight into methane production trends. A correlation analysis between the critical operating and pre-treatment parameters was performed. These observed correlations underscore the multifactorial nature of the AD process, where no single parameter exclusively dictates the methane yield but rather a collective interaction of physical, chemical, and biological factors. Table 3 presents a statistical summary of the relevant parameters.
Figure 4 shows the magnitude and direction of the linear correlation between the key operating conditions and methane yield. The correlation coefficient of 0.64 indicates a substantial positive relationship between the duration of acid treatment and methane yield, suggesting that prolonged exposure to HCl pretreatment markedly improves biodegradability and methane generation. The retention time of the digestion exhibits a positive correlation (0.55) with the methane yield. This indicates that prolonged digestion facilitates more thorough hydrolysis and methanogenesis. However, acid concentration exhibits a negative correlation with the methane yield, suggesting that methanogenesis may be inhibited at higher acid concentrations owing to excessive lignin solubilization. The digestion temperature exhibits a slight negative correlation with methane yield, indicating minimal impact within the examined range. These findings underscore the significance of controlling pretreatment duration rather than intensity to enhance biogas production from Xyris capensis.

3.3. Feature Importance Assessment of the Digestion Parameters

A comprehensive feature importance assessment was conducted to provide further data-driven insights into the AD of Xyris capensis subjected to acidic pretreatment. The Gini important (GI) metric of the DTR was utilized for feature ranking of the critical bio-digestion properties, pretreatment conditions, and their respective influence on predicting the biomethane yield. Figure 5 shows the feature ranking based on the Gini, percentage, and cumulative importance values for each biodigester and pretreatment parameter. With a GI value of 0.5788, exposure time with acid emerges as the dominant driver of output yield and the most significant predictor of biomethane yield, contributing about 60% of the predictive power in predicting the biomethane yield. The acid concentration has a GI value of 0.3771, contributing about 37% to the prediction of methane yield. The other two features (temperature and retention time) collectively contribute less than 5%. This indicates that nearly all significant variability in methane yield can be accounted for by acid contact time and concentration, which are critical for enhancing the CH4 yield, likely affecting the breakdown of lignocellulosic biomass. The very low GI value of the retention time indicates that their variations do not significantly impact the prediction of the CH4 yield. This may indicate that the DTR model does not consider the retention time important or that other features properly represent its impact. Including the retention time into the other features makes no difference in the predictive power. The feature selection for predictive modeling can potentially focus on just the top two features, improving model simplicity and training efficiency with minimal loss in accuracy. This also assists in designing the digestion experiment and optimizing the pretreatment process.

3.4. Dimensionality Reduction in Anaerobic Digestion Parameters Using PCA

The PCA result depicts individual contributions, relationships, and interdependence among digestion and pretreatment variables. This further reinforces the insights gained from the DTR-based feature importance by reducing the dataset’s dimensionality while retaining the bio-digestion dataset’s core structure. The PCA efficiently illustrated the variance inherent in the digestion dataset by vividly identifying the dominant principal component (PC) accountable for significant variability. The result of the PCA is presented in Table 4 and visually illustrated in Figure 6. From Table 4, the first principal component (PC1) accounts for about 30.75% of the variance in the data, while 27.25% is attributed to the second principal component (PC2). The combined cumulative variance between PC1 and PC2 (59.9%) was insufficient to represent the dataset’s structure. While PC3 and PC4 contribute less variance, the combined cumulative variance between PC1 and PC3 (80.75%) shows that the 3 PCs are enough to capture the variance and the structure in the dataset.
Figure 6a presents the explained variance and the cumulative variance for each component expressed in percentage. The cumulative variance plot reveals that the first three PCs (PC1 to PC3) together capture nearly 81% of the variability. While PC4 contributes less, it is still considered significant. However, the dimensionality of the bio digestion dataset has been reduced to 3 (PC1 to PC3), implying that these 3 PCs can substantially capture the variance in the dataset. Figure 6b is the scree plot, which depicts the eigenvalues for each principal component with a reference line at eigenvalue = 1 to indicate significant components. The eigenvalue for only PC1 and PC2 substantially exceeds 1, whilst the other elements are approximately below 1. According to Kaiser’s Criterion, only PCs with eigenvalues above 1 are significant [34]. This establishes PC1 and PC2 as substantial contributors to the dimensional structure. The PCA outcome is important for monitoring efforts in the biodigesters’ operation by focusing on parameters that load strongly on PC1 and PC2. From the PCA result, PC1 is substantially positively correlated with acid concentration and negatively with the acid contact time. PC2 is positively influenced by the retention time and negatively related to acid concentration. PC1 is negatively influenced by the retention time and temperature, while PC4 is negatively influenced by time and temperature.

3.5. Operational Cluster Analysis of the Digestion Process

The dynamics of the anaerobic digestion of Xyris capensis subjected to acidic pre-treatment were further illustrated using a k-means cluster analysis visualized through the PCA. The k-means unveils the natural groups and clusters within the operational data of the digestion process by considering all the critical digestion parameters and pretreatment conditions. The cluster analysis revealed three clusters, i.e., three distinct operational frameworks, each aligning with the operational situation of the bio-digestion process (see Figure 7). Cluster 1 most likely encompasses bio-digestion set-ups characterized by reduced retention and contact times with the acid or a higher acid concentration. The PCA projection indicates a diminished influence of PC2 while exhibiting a significant impact of PC1. Cluster 2 illustrates a digestion scenario characterized by balanced operating parameters, likely involving slight exposure duration and acid concentration, as it is centrally positioned. Cluster 3 may indicate prolonged retention and exposure durations or less severe pretreatment conditions. These units constitute a distinct cluster in the lower PCA region.
Figure 8 illustrates the distribution and variability of key operating parameters across the three clusters. Acid concentration is the most distinct differentiator among clusters, indicating the impact of pretreatment intensity on clustering. Cluster 0 functions with the highest acid concentration, and is densely concentrated at 13–15% v/v. Cluster 1 exhibits significant acid use, whereas Cluster 2 functions with minimal amounts. The median retention time is maximum at Cluster 1, and closely clustered around 30–35 days. This likely supports stable, high-yield digestion due to extended microbial action. In Cluster 0, the broadest range in retention time was noted, spanning around 1 day up to 40 days and indicating variable retention setups. Cluster 2 exhibits the minimum median retention time, suggesting a focus on shorter digestion cycles. With a median value of 30 °C, cluster 2 operates in the maximum temperature range. This implies that Cluster 2 may exhibit more thermophilic tendencies or better thermal insulation. Clusters 0 and 1 show slightly lower and more variable ranges, with Cluster 1 having the lowest median. Cluster 2 demonstrates the most prolonged acid contact durations, indicating greater acid penetration or hydrolysis. Cluster 2 may enhance gentler acids by protracted contact, reconciling safety with efficacy. Cluster 0 employs the shortest contact, likely owing to the strong acid strength offsetting the duration. Cluster 1 is positioned centrally, exhibiting a wide distribution.

3.6. Statistical Insight into the Effect of Acid Pretreatment on the Biomethane Yield

Beyond the experimental investigation, the impact of the acid pretreatment of the Xyris capensis biomass sample on its biomethane is validated statistically. A two-sample independent t-test was carried out to compare the average yield of biomethane between the pretreated and untreated categories, with a null hypothesis that there is no significant difference in the biomethane in the untreated and pretreated categories. The statistical analysis demonstrates HCl pretreatment’s effectiveness in improving Xyris capensis’ biomethane output. Based on the t-test’s p-value < 0.05, we can ignore the null hypothesis, assuming no difference between the two categories. Hence, the improvement in the biomethane yield is statistically significant. Figure 9 shows the variation in the biomethane yield and the mean and standard deviation of the biomethane yield values across the untreated and pretreated categories. These charts further establish an enhanced methane generation after pretreatment. The ability of HCl acid to disrupt the lignocellulosic structure of Xyris capensis is accountable for the improvement in yield upon pretreatment with HCl. This effect gives the anaerobic bacteria more access to the cellulose and hemicellulose, expediting hydrolysis and subsequent methanogenesis. This result is consistent with prior research on lignocellulosic substrates. The pretreatment of rice straw with sulfuric acid led to a 74.6% enhancement in the methane output relative to untreated straw [35]. Furthermore, the thermo-acidic pretreatment of beach macroalgae with HCl at high temperatures markedly enhanced methane generation [36].

3.7. Performance Evaluation of the ANFIS-PSO Model

The accuracy of the ANFIS-PSO model for predicting the biomethane yield of Xyris capensis was evaluated based on the selected metrics. By considering different clustering techniques, we obtain the optimal combination of hyper-parameters for the most accurate prediction. The optimal FCM-clustered model was obtained with 4-clusters, while the best SC-clustered model was obtained at a cluster radius of 0.5. A Gaussian MF-type of the GP-clustering gives the optimal performance. Table 5 presents the statistical metrics value of the optimal ANFIS-PSO models at the training phase. Based on RMSE, ANFIS-PSO-GP outperformed other models, exhibiting the lowest prediction error (RMSE of 3.93). This signifies that the GP-clustered neuro-fuzzy model exhibits slight variation in predicting the biomethane yield at the training phase. ANFIS-PSO-FCM had the greatest RMSE of 4.45244, indicating worse predictive accuracy, whereas ANFIS-PSO-SC demonstrated a moderate RMSE of 4.1567, surpassing FCM but falling short of GP. Based on the MAE metrics, the ANFIS-PSO-GP was also noted to produce the least absolute deviation with a MAE value of 1.431343, making it more reliable in practical applications. This further suggests that predictions by ANFIS-PSO-GP are, on average, the closest to the actual values. The FCM and SC-clustered ANFIS-PSO models follow with MAEs of 1.7544 and 1.95756, respectively. The MAPE is a crucial statistical metric in environmental and energy systems modeling because minor variations can lead to considerable operational inefficiencies. Based on the MAPE value, ANFIS-PSO-GP is considered the best with a MAPE value of 9.1811, showing that it is 90.9% accurate at the training for predicting the biomethane yield. These results indicate that GP offers superior structure and parameter distribution in the fuzzy inference system, facilitating enhanced learning and generalization. Although FCM and SC provide acceptable approximations, their higher errors suggest a less efficient partitioning of the input–output space.
Table 6 provides the generalization performance of the ANFIS-PSO for the three distinct clusters in the testing phase. ANFIS-PSO-GP attained the minimal RMSE of 5.37828, validating its robustness and consistency across training and testing phases. ANFIS-PSO-FCM exhibited the highest RMSE of 7.45244, signifying greater prediction errors. ANFIS-PSO-SC achieved an RMSE of 6.1567, demonstrating superior performance compared to FCM; however, it is inferior to GP. The GP-based model’s lowest MAE (3.158433) further underlines its prediction accuracy. With an MAE of 5.75435, FCM had the greatest average absolute deviation. With a MAE of 4.95756, SC outperformed FCM. Reflecting more percentage-based accuracy, ANFIS-PSO-GP once more produced the lowest MAPE of 10.12611. ANFIS-PSO-FCM produced the worst MAPE of 12.5434. With a 10.8656 MAPE value, ANFIS-PSO-SC was closer to GP but still less accurate. The GP model remains the most efficient in minimizing relative prediction error [37]. The outcomes of the testing phase validate the ANFIS-PSO model’s better generalization ability using GP. Across all metrics, it consistently surpassed the FCM and SC variants, suggesting that GP allows more optimal rule extraction and better structure formation in the fuzzy inference system. This makes ANFIS-PSO-GP the most dependable model for estimating the biomethane output from Xyris capensis, particularly in practical use.
The ANFIS-PSO-GP model has the least area on the radar plot in Figure 10, indicating a lower RMSE, MAE, and MAPE relative to FCM and SC. Wider shapes created by the FCM and SC models suggest larger error metrics. This verifies that GP clustering provides improved learning capacity and error minimization during the building of models. The pattern stays constant, and ANFIS-PSO-GP exceeds the others with lower values on all axes. The radar charts confirm visually that ANFIS-PSO-GP is the most dependable and precise model for forecasting the biomethane yield from Xyris capensis. Its minimal errors and greater resilience throughout training and testing make it the perfect choice for practical bioenergy modeling and deployment. Although all models showed a decline in performance in testing (as expected because of unseen data), GP exhibited superior generalization and slight performance loss. Compared to other machine learning applications in biogas production, the result in this study is higher. Artificial neural network, linear regression, random forest, XGBoost, and support vector machine models were used to optimize and predict the biogas yield from the organic fraction of municipal solid waste. It was observed that regression and XGBoost models produce the best performance with R2 values of 0.68 and 0.88, and RMSE values of 496 and 305, respectively [38], which are lower than what was observed in this study. In a similar study, R2 and RMSE values of 0.72 and 247, respectively, were reported when a Tree-based pipeline optimization tool was used to predict the biogas yield of a municipal wastewater treatment plant [39].
Figure 11 compares the actual and predicted biomethane value at the training stage. This graph shows the actual biomethane yield values compared to the ANFIS-PSO-GP model-predicted values. The actual and predicted values across all sample indices significantly overlap, suggesting great prediction accuracy during training. The model’s capacity to identify nonlinear patterns in the data is confirmed even more by the close clustering of points and consistent tracking of the trends between the real and predicted values. The error histogram shows the distribution of prediction errors during training. The distribution is centered around zero, indicating that the model does not show consistent bias. The bell-shaped error distribution is similar to the overlay normal distribution curve, suggesting that the prediction errors are random. The error distribution verifies that most prediction errors are within a small range and that large departures are uncommon.
Similarly, at the testing phase, the actual and predicted biomethane value was compared in Figure 12. This chart shows the actual biomethane yield values compared to the ANFIS-PSO-GP model-predicted values at the testing phase. Although certain areas show little variation, the general trend tracking stays consistent. The model accurately predicts biomethane yield during testing outside training data by effectively understanding the complicated, nonlinear relationships required. The histogram shows the spread of prediction errors throughout testing. Centered around zero, the error distribution indicates low bias in model predictions. The error distribution is somewhat more spread out than during training, and the fit with the normal distribution is less perfect, suggesting a broader error spread. Although more diverse than in training, the testing errors still fall within a reasonable range.
Table 7 compares the experimental values of the biomethane yield of the treated biofuel with values predicted using developed models alongside their percentage error. The ANFIS-PSO-GP model prediction outcome remains consistent regardless of the changes in the digestion parameters and pretreatment conditions. The model shows minimal error margins, whether the acid concentration is 0% (untreated) or up to 15%, implying strong learning of the nonlinear interactions. The greatest recorded inaccuracy seems to be in the row where the model forecast is 3.7345 mL CH4/g VSadded and the experimental value is 0.00 mL CH4/g VSadded. The model’s inability to forecast precise zeros most likely explains this.
The outcome of the ANFIS-PSO model establishes its reliability in estimating biomethane output under varying pretreatment and digestion scenarios. This provides a viable alternative to expensive and costly environmental procedures, supporting optimization and planning of the digestion process. Further to this, the result aids in preventing over-treatment and under-treatment, which come with adverse effects like poor yield, corrosion, and the production of inhibitory compounds by simulating the choice of optimal pretreatment conditions. This helps the plant operators, energy legislators, and biomass resource managers even more in making data-driven judgments to assess the energy potential of underused biomass like Xyris capensis across many environments. Reliable biomethane yield projections enable this model to contribute to more accurate energy forecasts, feasibility studies, and scale-up designs, thereby supporting sustainable energy targets and lowering dependency on fossil fuels.

4. Conclusions

This study presents an experimental and data-driven framework for optimizing the biomethane yield from Xyris capensis through HCl-based acidic pretreatment. The integration of experimental characterization and advanced statistical modeling, including correlation analysis, feature importance ranking via the Gini index, dimensionality reduction using PCA, and clustering via k-means, offered robust insights into the operational dynamics of anaerobic digestion. The HCl pretreatment demonstrated a substantial enhancement in the biomethane yield by breaking down the recalcitrant properties of Xyris capensis. Correlation analysis highlighted exposure time as the strongest positive contributor to methane output, while DTR-based feature ranking confirmed exposure time and acid concentration as dominant predictors, collectively accounting for over 90% of predictive significance. The data-driven framework developed in this study assists the plant operators in designing optimized pretreatment conditions, a low-cost alternative to laboratory experiments for biomethane yield estimations. This also aids the exploration of new substrates, supporting rural energy development. This research demonstrates the efficacy of HCl pretreatment in enhancing biogas production from lignocellulosic biomass and highlights the critical role of intelligent modeling frameworks in understanding and optimizing complex bioconversion processes. Future studies may extend this approach to explore additional pretreatment strategies, substrate types, and real-time bio-digester monitoring to advance sustainable energy solutions further.

Author Contributions

Conceptualization, K.O.O., O.A., T.-C.J. and D.M.M.; methodology, K.O.O., O.A. and D.M.M.; software, O.A.; validation, K.O.O. and T.-C.J.; formal analysis, O.A. and T.-C.J.; investigation, K.O.O.; writing—original draft, K.O.O. and O.A.; writing—review and editing, T.-C.J. and D.M.M.; supervision, T.-C.J. and D.M.M.; project administration, T.-C.J. and D.M.M. All authors have read and agreed to the published version of the manuscript.

Funding

This research received no external funding.

Data Availability Statement

The data are contained within the article and presented in tables and figures.

Conflicts of Interest

The authors declare no conflict of interest.

References

  1. Kpalo, S.Y.; Zainuddin, M.F.; Manaf, L.A.; Roslan, A.M. A review of technical and economic aspects of biomass briquetting. Sustainability 2020, 12, 4609. [Google Scholar] [CrossRef]
  2. Farghali, M.; Osman, A.I.; Chen, Z.; Abdelhaleem, A.; Ihara, I.; Mohamed, I.M.A.; Yap, P.S.; Rooney, D.W. Social, environmental, and economic consequences of integrating renewable energies in the electricity sector: A review. Environ. Chem. Lett. 2023, 21, 1381–1418. [Google Scholar] [CrossRef]
  3. Bekchanov, M.; Mondal, M.A.H.; de Alwis, A.; Mirzabaev, A. Why adoption is slow despite promising potential of biogas technology for improving energy security and mitigating climate change in Sri Lanka? Renew. Sustain. Energy Rev. 2019, 105, 378–390. [Google Scholar] [CrossRef]
  4. Gao, Z.; Alshehri, K.; Li, Y.; Qian, H.; Sapsford, D.; Cleall, P.; Harbottle, M. Advances in biological techniques for sustainable lignocellulosic waste utilization in biogas production. Renew. Sustain. Energy Rev. 2022, 170, 112995. [Google Scholar] [CrossRef]
  5. Banu, J.R.; Sugitha, S.; Kavitha, S.; Kannah, R.Y.; Merrylin, J.; Kumar, G. Lignocellulosic Biomass Pretreatment for Enhanced Bioenergy Recovery: Effect of Lignocelluloses Recalcitrance and Enhancement Strategies. Front. Energy Res. 2021, 9, 679. [Google Scholar] [CrossRef]
  6. Li, X.; Shi, Y.; Kong, W.; Wei, J.; Song, W.; Wang, S. Improving enzymatic hydrolysis of lignocellulosic biomass by bio-coordinated physicochemical pretreatment—A review. Energy Rep. 2022, 8, 696–709. [Google Scholar] [CrossRef]
  7. Rabemanolontsoa, H.; Saka, S. Various pretreatments of lignocellulosics. Bioresour. Technol. 2016, 199, 83–91. [Google Scholar] [CrossRef]
  8. Song, Z.; Yang, G.; Liu, X.; Yan, Z.; Yuan, Y.; Liao, Y. Comparison of seven chemical pretreatments of corn straw for improving methane yield by anaerobic digestion. PLoS ONE 2014, 9, 93801. [Google Scholar] [CrossRef]
  9. Ummalyma, S.B.; Sahoo, D.; Pudiyamadam, A.; Adarsh, V.P.; Sukumaran, R.K.; Bhaskar, T.; Parida, A. Sono-Assisted Alkali and Dilute Acid Pretreatment of Phragmites karka (Tall Reed Grass) to Enhance Enzymatic Digestibility for Bioethanol Conversion. Front. Energy Res. 2021, 8, 594452. [Google Scholar] [CrossRef]
  10. Olatunji, K.O.; Madyira, D.M. Effect of acidic pretreatment on the microstructural arrangement and anaerobic digestion of Arachis hypogea shells; and process parameters optimization using response surface methodology. Heliyon 2023, 9, e15145. [Google Scholar] [CrossRef]
  11. Mancini, G.; Papirio, S.; Lens, P.N.L.; Esposito, G. Increased biogas production from wheat straw by chemical pretreatments. Renew Energy 2018, 119, 608–614. [Google Scholar] [CrossRef]
  12. Zhang, Q.; Tang, L.; Zhang, J.; Mao, Z.; Jiang, L. Optimization of thermal-dilute sulfuric acid pretreatment for enhancement of methane production from cassava residues. Bioresour. Technol. 2011, 102, 3958–3965. [Google Scholar] [CrossRef] [PubMed]
  13. Pramanik, S.K.; Suja, F.B.; Porhemmat, M.; Pramanik, B.K. Performance and Kinetic Model of a Single-Stage Anaerobic Digestion System Operated at Different Successive Operating Stages for the Treatment of Food Waste. Processes 2019, 7, 600. [Google Scholar] [CrossRef]
  14. Cruz, I.A.; Nascimento, V.R.S.; Felisardo, R.J.A.; Santos, A.M.G.D.; de Jesus, A.A.; de Vasconcelos, B.R.; Kumar, V.; Cavalcanti, E.B.; de Souza, R.L.; Ferreira, L.F.R. Evaluation of artificial neural network models for predictive monitoring of biogas production from cassava wastewater: A training algorithms approach. Biomass Bioenergy 2023, 175, 106869. [Google Scholar] [CrossRef]
  15. Olatunji, K.O.; Madyira, D.M.; Adeleke, O. Optimizing anaerobic co-digestion of Xyris capensis and duck waste using neuro-fuzzy model and response surface methodology. Fuel 2023, 354, 129334. [Google Scholar] [CrossRef]
  16. Najafi, B.; Ardabili, S.F.; ANFIS, A.O. ANN and logistic methods in estimating biogas production from spent mushroom compost (SMC). Resour. Conserv. Recycl. 2018, 133, 169–178. [Google Scholar] [CrossRef]
  17. Khayum, N.; Rout, A.; Deepak, B.B.V.L.; Anbarasu, S.; Murugan, S. Application of Fuzzy Regression Analysis in Predicting the Performance of the Anaerobic Reactor Co-digesting Spent Tea Waste with Cow Manure. Waste Biomass Valorization 2020, 11, 5665–5678. [Google Scholar] [CrossRef]
  18. AOAC International. Official Methods of Analysis, 21st Edition. 2019. Available online: https://www.aoac.org/about-aoac-international/ (accessed on 15 October 2021).
  19. Calabrò, P.S.; Catalán, E.; Folino, A.; Sánchez, A.; Komilis, D. Effect of three pretreatment techniques on the chemical composition and on the methane yields of Opuntia ficus-indica (prickly pear) biomass. Waste Manag. Res. 2017, 36, 17–29. [Google Scholar] [CrossRef]
  20. VDI 4630; Fermentation of Organic Materials—Characterization of the Substrate, Sampling, Collection of Material data, Fermentation Tests. VDI-Gesellschaft Energie und Umwelt: Düsseldorf, Germany, 2016. Available online: https://www.vdi.de/en/home/vdi-standards/details/vdi-4630-fermentation-of-organic-materials-characterization-of-the-substrate-sampling-collection-of-material-data-fermentation-tests (accessed on 27 September 2021).
  21. Dhungana, B.; Lohani, S.P.; Marsolek, M. Anaerobic Co-Digestion of Food Waste with Livestock Manure at Ambient Temperature: A Biogas Based Circular Economy and Sustainable Development Goals. Sustainability 2022, 14, 3307. [Google Scholar] [CrossRef]
  22. Fattahi, H. Adaptive Neuro Fuzzy Inference System Based on Fuzzy C—Means Clustering Algorithm, A Technique for Estimation of TBM Penetration Rate. Int. J. Optim. Civ. Eng. 2016, 6, 159–171. [Google Scholar]
  23. Wei, M.; Bai, B.; Sung, A.H.; Liu, Q.; Wang, J.; Cather, M.E. Predicting injection profiles using ANFIS. Inf. Sci. 2007, 177, 4445–4461. [Google Scholar] [CrossRef]
  24. Olugbemide, A.D.; Oberlintner, A.; Novak, U.; Likozar, B. Lignocellulosic Corn Stover Biomass Pre-Treatment by Deep Eutectic Solvents (DES) for Biomethane Production Process by Bioresource Anaerobic Digestion. Sustainability 2021, 13, 10504. [Google Scholar] [CrossRef]
  25. Patowary, D.; Baruah, D.C. Effect of combined chemical and thermal pretreatments on biogas production from lignocellulosic biomasses. Ind. Crops Prod. 2018, 124, 735–746. [Google Scholar] [CrossRef]
  26. Avila-Gaxiola, J.; Velarde-Escobar, O.J.; Millan-Almaraz, J.R.; Ramos-Brito, F.; Atondo-Rubio, G.; Yee-Rendon, C.; Avila-Gaxiola, E. Treatments to improve obtention of reducing sugars from agave leaves powder. Ind. Crops Prod. 2018, 112, 577–583. [Google Scholar] [CrossRef]
  27. Madyira, D.M.; Olatunji, K.O. Alkali Pretreatment of Lignocellulose Feedstock Improves Morphological Structure and Biomethane Yield. Sustainability 2025, 17, 534. [Google Scholar] [CrossRef]
  28. Olatunji, K.O.; Madyira, D.M. Optimization of Biomethane Yield of Xyris capensis Grass Using Oxidative Pretreatment. Energies 2023, 16, 3977. [Google Scholar] [CrossRef]
  29. Dai, B.L.; Guo, X.J.; Yuan, D.H.; Xu, J.M. Comparison of Different Pretreatments of Rice Straw Substrate to Improve Biogas Production. Waste Biomass Valorization 2018, 9, 1503–1512. [Google Scholar] [CrossRef]
  30. Baadhe, R.R.; Potumarthi, R.; Mekala, N.K. Influence of dilute acid and alkali pretreatment on reducing sugar production from corncobs by crude enzymatic method: A comparative study. Bioresour. Technol. 2014, 162, 213–217. [Google Scholar] [CrossRef]
  31. Zhao, X.; Zhang, L.; Liu, D. Biomass recalcitrance. Part I: The chemical compositions and physical structures affecting the enzymatic hydrolysis of lignocellulose. Biofuels Bioprod. Biorefining 2012, 6, 465–482. [Google Scholar] [CrossRef]
  32. Jankovičová, B.; Hutňan, M.; Czölderová, M.N.; Hencelová, K.; Imreová, Z. Comparison of acid and alkaline pre-treatment of lignocellulosic materials for biogas production. Plant Soil Environ. 2022, 68, 195–204. [Google Scholar] [CrossRef]
  33. Syaichurrozi, I.; Villta, P.; Nabilah, N.; Rusdi, R. Effect of Sulfuric Acid Pretreatment on Biogas Production from Salvinia molesta. J. Environ. Chem. Eng. 2018, 7, 102857. [Google Scholar] [CrossRef]
  34. Ďuriš, V.; Bartková, R.; Tirpáková, A. Principal Component Analysis and Factor Analysis for an Atanassov IF Data Set. Mathematics 2021, 9, 2067. [Google Scholar] [CrossRef]
  35. Amin, F.R.; Khalid, H.; Zhang, H.; Rahman, S.U.; Zhang, R.; Liu, G.; Chen, C. Pretreatment methods of lignocellulosic biomass for anaerobic digestion. AMB Express 2017, 7, 72. [Google Scholar] [CrossRef] [PubMed]
  36. Barbot, Y.N.; Thomsen, L.; Benz, R. Thermo-Acidic Pretreatment of Beach Macroalgae from Rügen to Optimize Biomethane Production—Double Benefit with Simultaneous Bioenergy Production and Improvement of Local Beach and Waste Management. Mar. Drugs 2015, 13, 5681–5705. [Google Scholar] [CrossRef]
  37. Adeleke, O.; Olatunji, O.O.; Jen, T.-C.; Olawuyi, I. Enhanced prediction of heating value of municipal solid waste using hybrid neuro-fuzzy model and decision tree-based feature importance assessment. Green Energy Resour. 2025, 3, 100119. [Google Scholar] [CrossRef]
  38. Singh, D.; Tembhare, M.; Pundalik, K.; Dikshit, A.K.; Kumar, S. Machine learning based prediction of biogas generation from municipal solid waste: A data-driven approach. Process Saf. Environ. Prot. 2024, 192, 93–103. [Google Scholar] [CrossRef]
  39. Wang, Y.; Huntington, T.; Scown, C.D. Tree-Based Automated Machine Learning to Predict Biogas Production for Anaerobic Co-digestion of Organic Waste. ACS Sustain. Chem. Eng. 2021, 9, 12990–13000. [Google Scholar] [CrossRef]
Figure 1. Methodological workflow of the research.
Processes 13 01997 g001
Figure 2. Architectural framework of ANFIS.
Processes 13 01997 g002
Figure 3. Cumulative biomethane yield of acidic pretreated and untreated Xyris capensis.
Processes 13 01997 g003
Figure 4. Correlation heat map of the anaerobic digestion of Xyris capensis.
Processes 13 01997 g004
Figure 5. Gini, percentage, and cumulative importance value of bi-digestion parameters and pretreatment conditions.
Processes 13 01997 g005
Figure 6. Scree plot showing (a) explained and cumulative variance, (b) eigenvalues relating to each principal component.
Processes 13 01997 g006
Figure 7. Operational clusters of the AD of Xyris capensis.
Processes 13 01997 g007
Figure 8. Variation of biodigestion parameters and pretreatment conditions across the operational clusters.
Processes 13 01997 g008
Figure 9. Biomethane yield changes under pre-treatment and no-treatment conditions.
Processes 13 01997 g009
Figure 10. Statistical metrics for the best model (ANFIS-PSO-GP) at training and testing.
Processes 13 01997 g010
Figure 11. Comparison plot of the actual and predicted methane yield using ANFIS-PSO-GP during training.
Processes 13 01997 g011
Figure 12. Comparison plot of the actual and predicted methane yield using ANFIS-PSO-GP during testing.
Processes 13 01997 g012
Table 1. Acidic pretreatment conditions.
TreatmentConcentration (% v/v)Time (Min)Temperature (°C)
V345100
W635100
X925100
Y1215100
Z155100
UUntreatedUntreatedUntreated
Table 2. Parameter settings for ANFIS and PSO algorithms.
Algorithm ParameterValue
ANFISFIS structureTakagi–Sugeno type
FIS functiongenfis 1–3 (FCM, SC, and GP)
Max iteration50
Min improvement1 × 10−5
PSO Initial swarm size20
  ω 0.5
ω d a m p 0.8
c 1   a n d   c 2 2
Table 3. Statistical summary of digestion and pretreatment parameters.
ParametersMinimumMaximumMeanStandard Deviation
Retention Time (Days)14020.511.57
Temperature (0 °C)193426.924.46
Acid Concentration (% v/v)0157.55.13
Exposure Time (min)04520.8315.95
Biomethane Yield (ml CH4/g S added)0327.28160.31100.66
Table 4. PCA matrix of the AD parameter and pretreatment conditions.
Principal ComponentExplained VarianceCumulative Variance
PC10.30750.3075
PC20.27250.5999
PC30.22750.8075
PC40.19251.0000
Table 5. Statistical metrics of the ANFIS-PSO model during training.
ModelRMSEMAEMAPE
ANFIS-PSO-GP3.93091.43139.1811
ANFIS-PSO-FCM4.45241.754410.5434
ANFIS-PSO-SC4.15671.95769.8656
Table 6. Statistical metrics of the ANFIS-PSO model during testing.
Model RMSEMAEMAPE
ANFIS-PSO-GP5.378283.15843310.12611
ANFIS-PSO-FCM7.452445.7543512.5434
ANFIS-PSO-SC6.15674.9575610.8656
Table 7. Comparison of experimental and ANFIS-PSO-GP predicted biomethane yield of Xyris capensis under varying pretreatment conditions.
InputBiomethane (mL CH4/g VSadded)
Retention Time (Days)Temp. Deg. CHCl Concentration (% v/v)Exposure Time (min)ExperimentalANFIS-PSO-GP
PredictedError (%)Standard Deviation
228untreateduntreated50.6349.5462.140.542
1730untreateduntreated96.2593.6432.711.3035
3722untreateduntreated126.25123.3432.301.4535
1313450.003.73453.731.86725
1121345248.77243.3272.192.7215
3523345280.81275.3671.942.7215
332635114.12114.0560.060.032
1534635161.03153.0754.963.9775
3722635324.78314.5323.165.124
629925144.00143.8420.110.079
1121925278.88275.3541.271.763
4032925295.25289.7481.862.751
420121516.9214.74512.851.0875
1121121566.9261.9457.432.4875
39271215252.64248.9351.471.8525
52015520.4518.34310.301.0535
142815523.0320.483411.061.2733
3624155186.63178.3554.434.1375
Disclaimer/Publisher’s Note: The statements, opinions and data contained in all publications are solely those of the individual author(s) and contributor(s) and not of MDPI and/or the editor(s). MDPI and/or the editor(s) disclaim responsibility for any injury to people or property resulting from any ideas, methods, instructions or products referred to in the content.

