Article

Assessment of Carbon Footprint for Organization in Frozen Processed Seafood Factory and Strategies for Greenhouse Gas Emission Reduction

by
Phuanglek Iamchamnan
1,*,
Somkiat Saithanoo
2,
Thaweesak Putsukee
2 and
Sompop Intasuwan
2
1
Sustainable Development Program, International College, Thaksin University, Songkhla 90000, Thailand
2
International College, Thaksin University, Songkhla 90000, Thailand
*
Author to whom correspondence should be addressed.
Processes 2025, 13(7), 1990; https://doi.org/10.3390/pr13071990
Submission received: 13 May 2025 / Revised: 9 June 2025 / Accepted: 20 June 2025 / Published: 24 June 2025
(This article belongs to the Special Issue Sustainable Waste Material Recovery Technologies)

Abstract

This study aims to assess the carbon footprint for the organization of frozen processed seafood manufacturing plants and propose sustainable strategies for reducing greenhouse gas emissions. Organizational activity data from 2024 were utilized to evaluate the carbon footprint and develop targeted mitigation measures. The findings indicate that Scope 1 emissions amounted to 12,685 tons of CO2eq, Scope 2 emissions amounted to 15,403 tons of CO2eq, and Scope 3 emissions amounted to 31,564 tons of CO2eq. The total greenhouse gas emissions across all three scopes were 59,652 tons of CO2eq, with additional greenhouse gas emissions recorded at 34,027 tons of CO2eq. Mitigation measures were considered for activities contributing to at least 10% of emissions in each scope. In Scope 1, the use of R507 refrigerant in the production cooling system accounted for 9907 tons of CO2eq, representing 78.10% of emissions. In Scope 2, electricity consumption contributed 15,403 tons of CO2eq, constituting 100% of emissions. In Scope 3, the procurement of surimi (processed fish meat) was responsible for 20,844 tons of CO2eq, accounting for 66.04% of emissions. Based on these findings, key mitigation strategies were proposed. For Scope 1, reducing emissions involves preventive maintenance of cooling systems to prevent leaks, replacing corroded pipelines, installing shut-off valves, and switching to alternative refrigerants with no greenhouse gas emissions. For Scope 2, energy-saving initiatives include promoting electricity conservation within the organization, maintaining equipment for optimal efficiency, installing energy-saving devices such as variable speed drives (VSD), upgrading to high-efficiency motors, and utilizing renewable energy sources like solar power. For Scope 3, emissions can be minimized by sourcing raw materials from suppliers with certified carbon footprint labels, prioritizing purchases from producers committed to carbon reduction, and selecting suppliers closer to manufacturing sites to reduce transportation-related emissions. Implementing these strategies will contribute to sustainable greenhouse gas emission reductions.

1. Introduction

Greenhouse gases contribute significantly to global warming by trapping heat in the Earth’s atmosphere. International environmental organizations have recognized seven major greenhouse gases with heat-retaining properties that drive climate change (Climate Change Institute, 2023) [1]. These include carbon dioxide (CO2), methane (CH4), nitrous oxide (N2O), hydrofluorocarbons (HFCs), perfluorocarbons (PFCs), sulfur hexafluoride (SF6), and nitrogen trifluoride (NF3). These gases are primarily emitted through human activities such as energy consumption, industrial expansion, agriculture, transportation, deforestation, and other forms of environmental degradation. As these activities intensify, the issue of global warming continues to escalate. Given the increasing energy consumption associated with the growth of both public and industrial sectors, countries worldwide have prioritized the assessment of greenhouse gas emissions to develop effective mitigation strategies. One widely adopted approach is the Carbon Footprint for Organization (CFO) or Corporate Carbon Footprint (CCF), which quantifies an organization’s greenhouse gas emissions from its operations. This assessment serves as a foundation for implementing effective emission reduction strategies at the corporate, industrial, and national levels. The industrial sector is a significant contributor to greenhouse gas emissions, accounting for approximately 21% of total emissions, followed by land use changes at 24% and electricity and heat production at 25%. The Asia-Pacific region has seen a growing trend in industrial emissions (Thailand Greenhouse Gas Management Organization (Public Organization), 2019) [2].
In 2019, Thailand’s total greenhouse gas emissions, excluding land use, land use change, and forestry (LULUCF), amounted to 372,716.86 gigagrams of carbon dioxide equivalent (GgCO2eq). The energy sector was the largest emitter, responsible for 260,772.69 GgCO2eq, or 69.96% of total emissions. This was followed by agriculture at 56,766.32 GgCO2eq (15.23%), industry at 38,301.21 GgCO2eq (10.28%), and waste management at 16,876.64 GgCO2eq (4.53%) (Office of Natural Resources and Environmental Policy and Planning, 2022) [3]. These figures highlight the critical role of the energy and industrial sectors in Thailand’s greenhouse gas emissions and underscore the urgent need for effective carbon reduction strategies.
Frozen processed seafood manufacturing primarily involves freezing processes, which preserve food for extended periods while maintaining quality better than other methods such as drying, heat sterilization, and fermentation. Freezing lowers the temperature of food below its freezing point, ensuring that its core temperature reaches −18 °C or lower. This transformation of liquid water into ice inhibits microbial growth, slows spoilage, and extends shelf life beyond refrigeration or ice storage. However, freezing and storage processes require significant electricity consumption and refrigerants, distinguishing them from other food production methods (Pisit Wongsangasri, 2020) [4]. The Carbon Footprint for Organization serves as a tool for measuring, reporting, and managing greenhouse gas (GHG) emissions. It quantifies emissions from various organizational activities, such as fuel combustion, refrigerant leakage, wastewater treatment, electricity consumption, waste management, employee commuting, raw material procurement, and transportation. These emissions are measured in tons of carbon dioxide equivalent (CO2eq) and are categorized into three scopes (Management System Certification Institute (Thailand), 2024) [5].
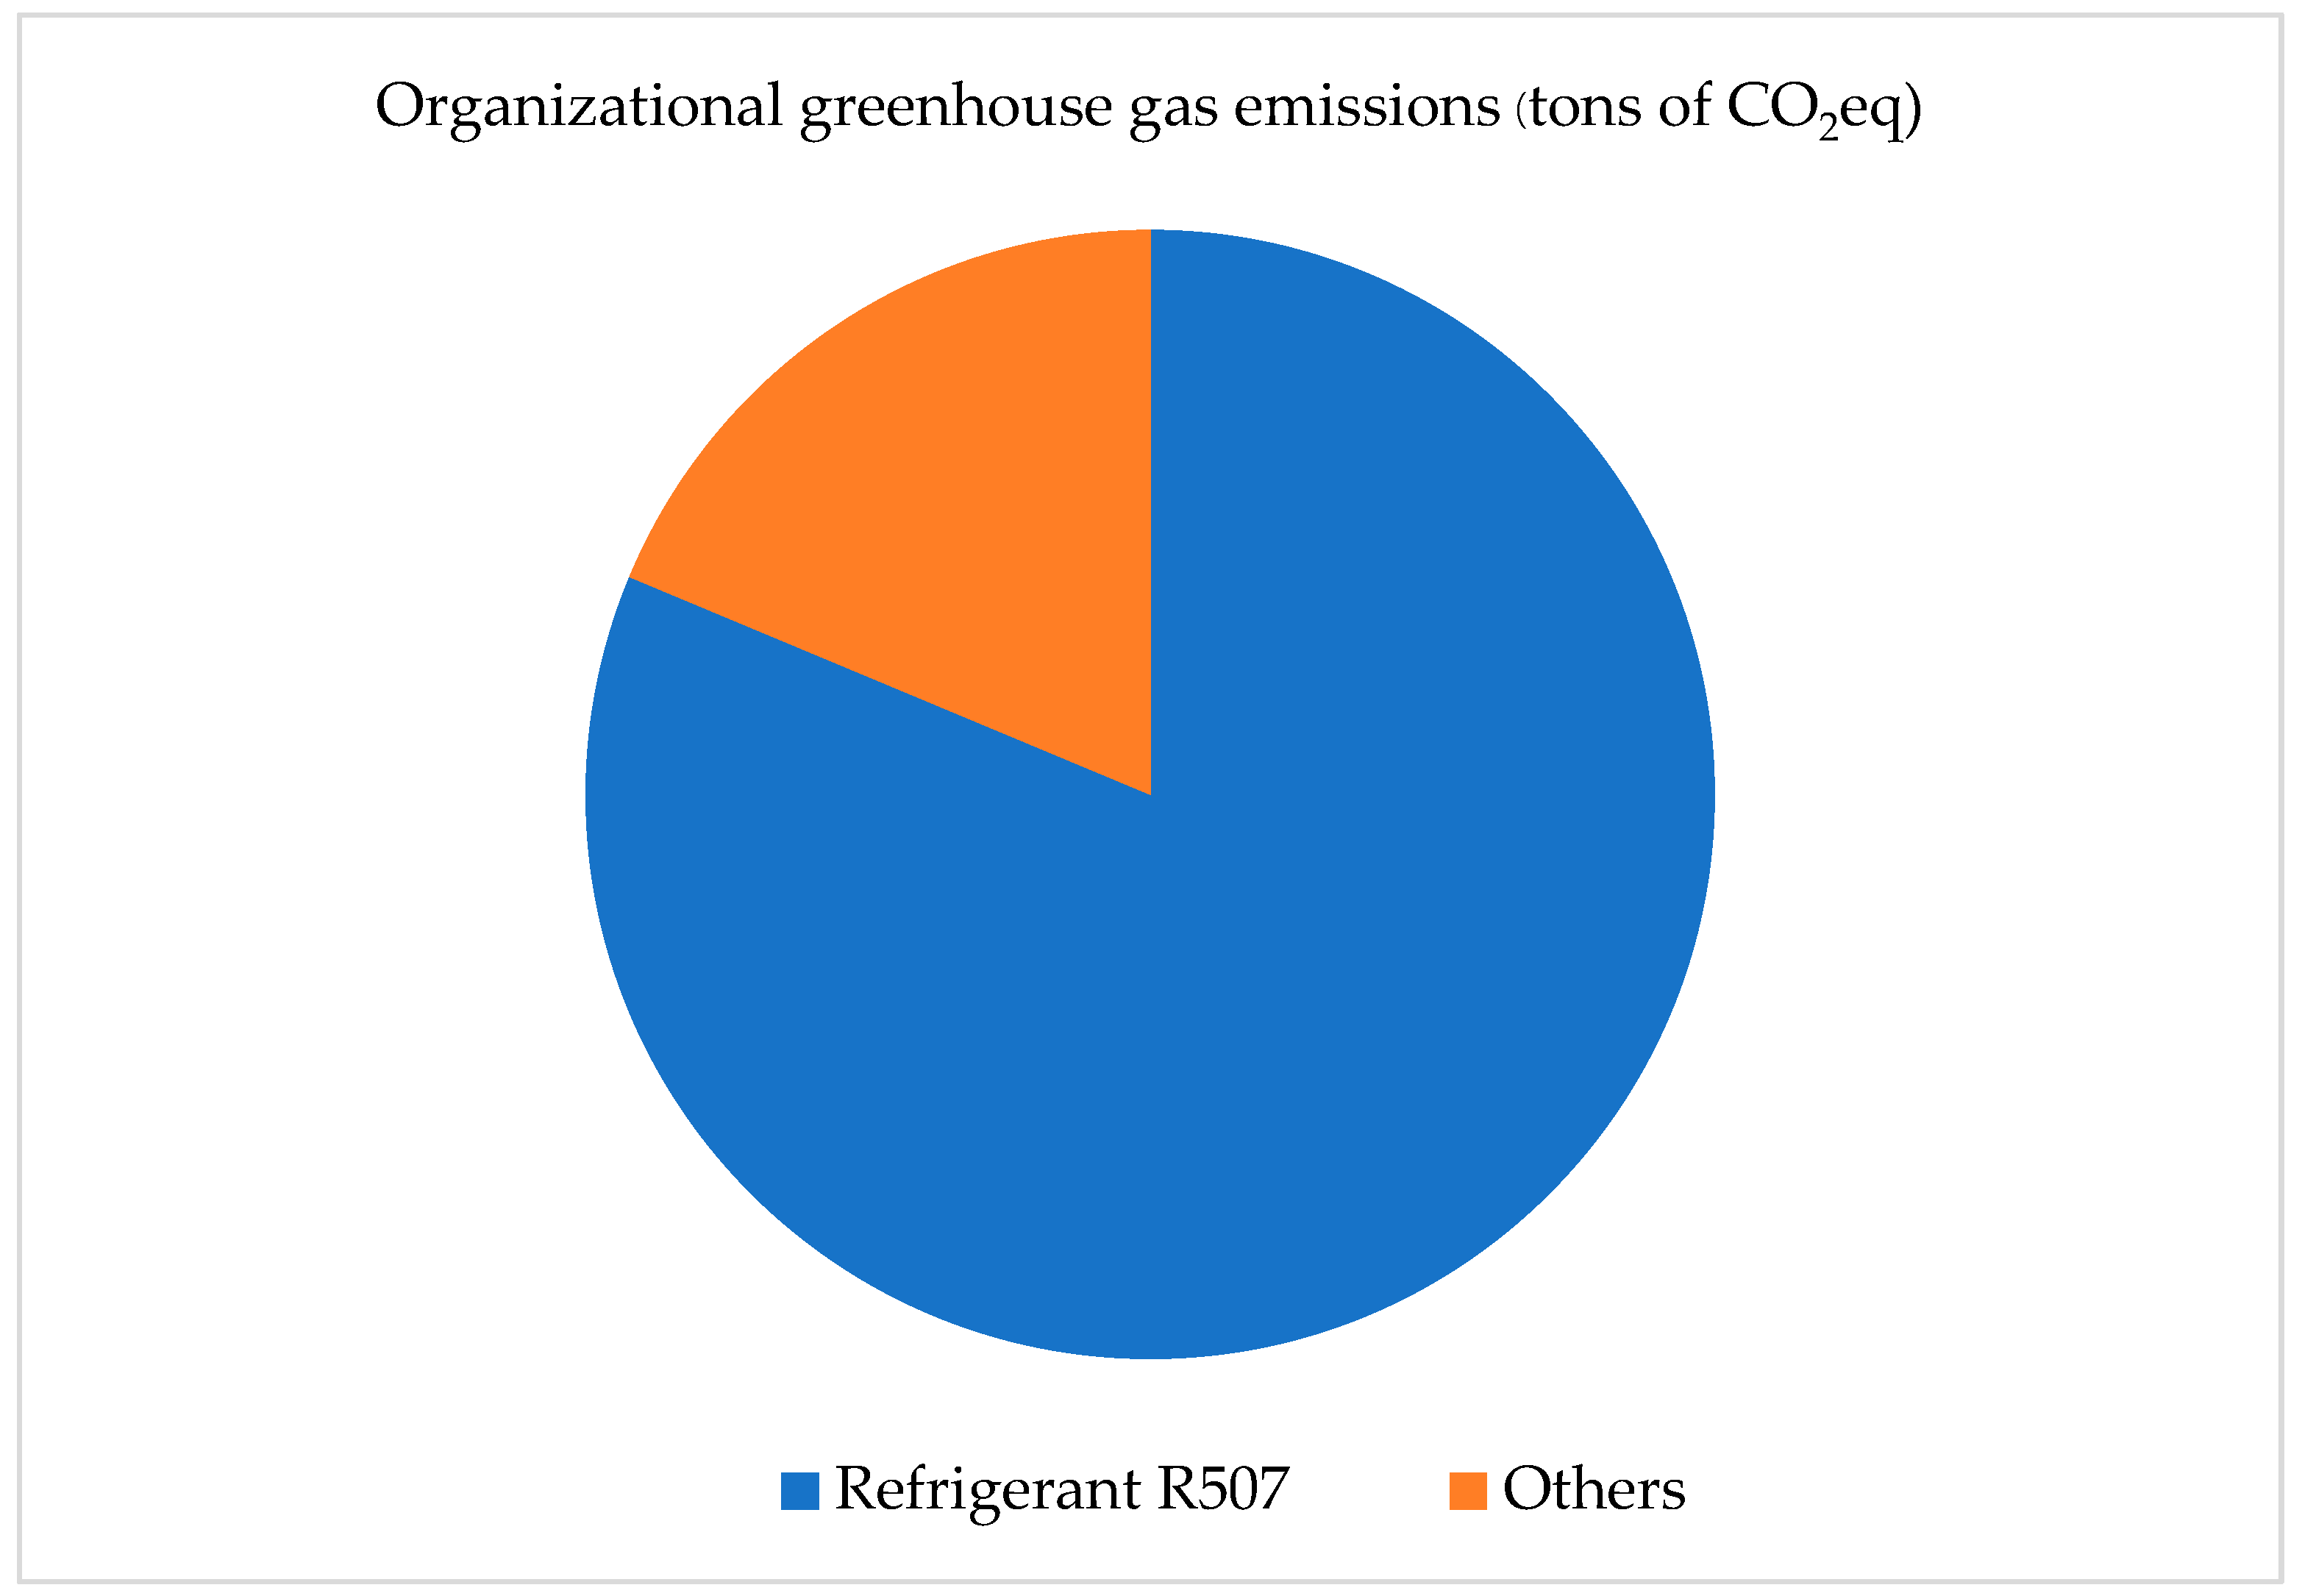
  • Scope 1: Direct Emissions: GHG emissions from sources directly owned or controlled by the organization, including stationary and mobile fuel combustion, industrial processes, chemical use in wastewater treatment, and refrigerant leaks.
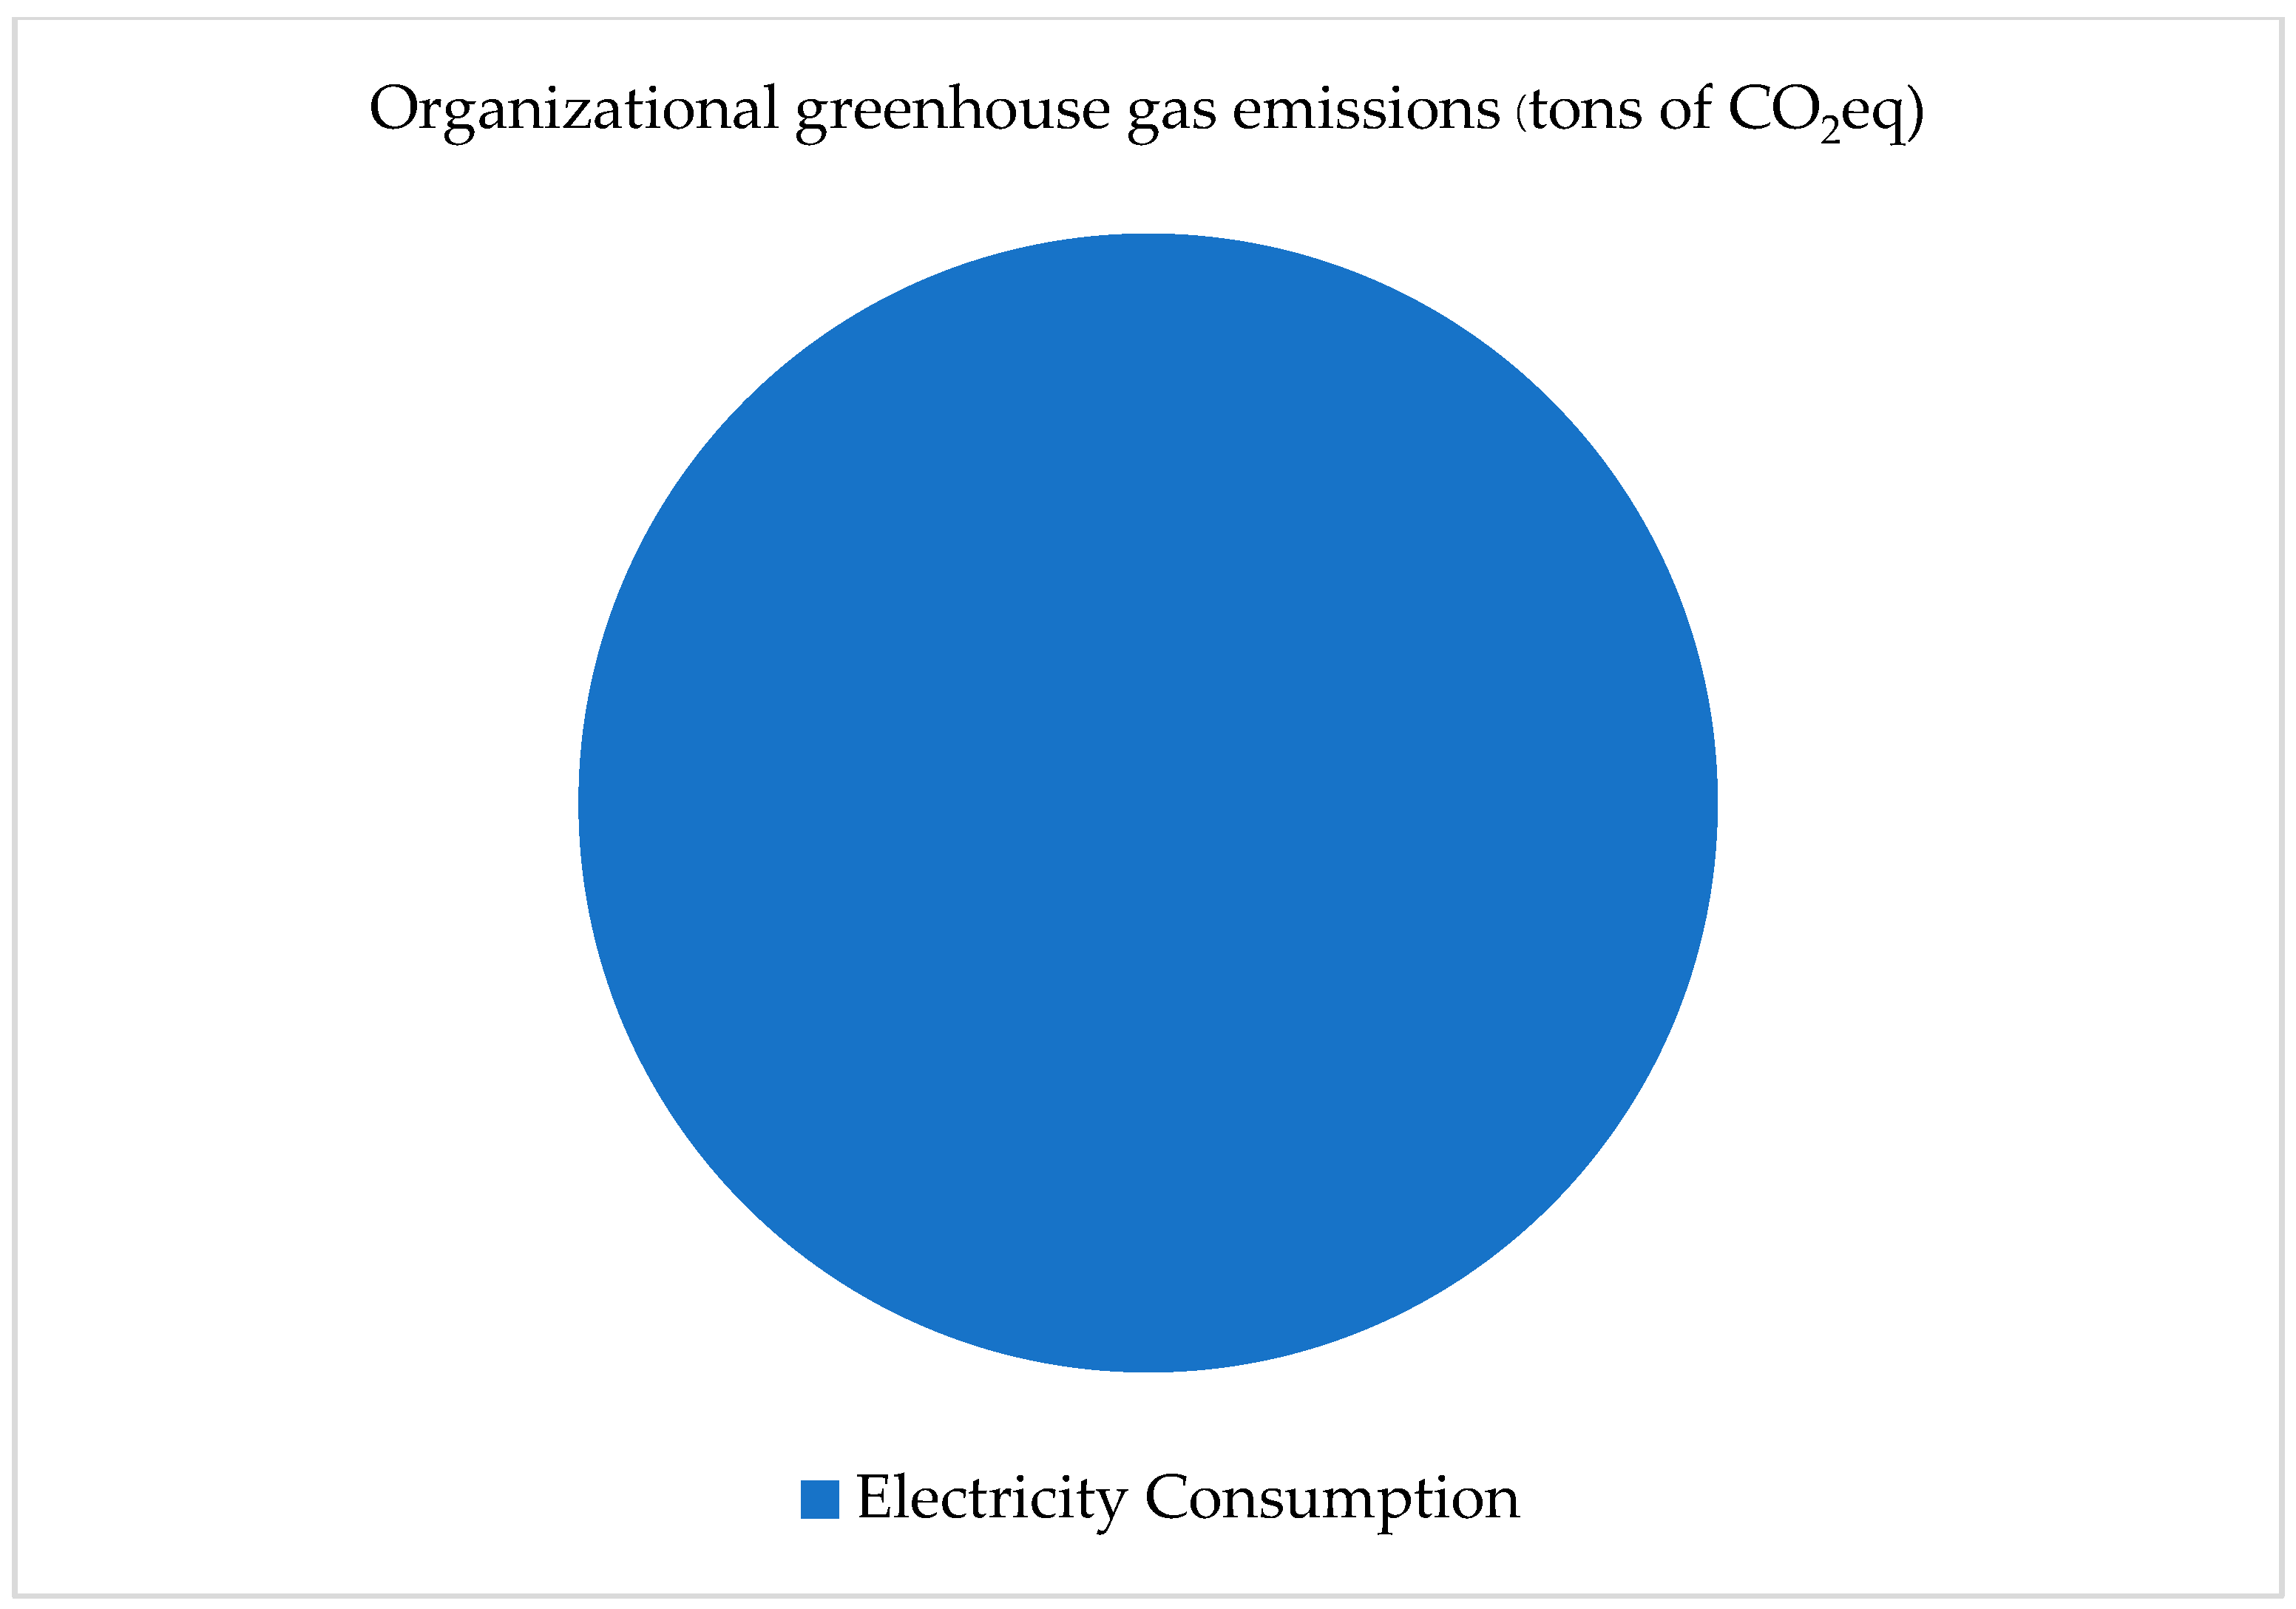
  • Scope 2: Indirect Energy-Related Emissions: GHG emissions from purchased electricity, steam, heating, cooling, and compressed air used within the organization.
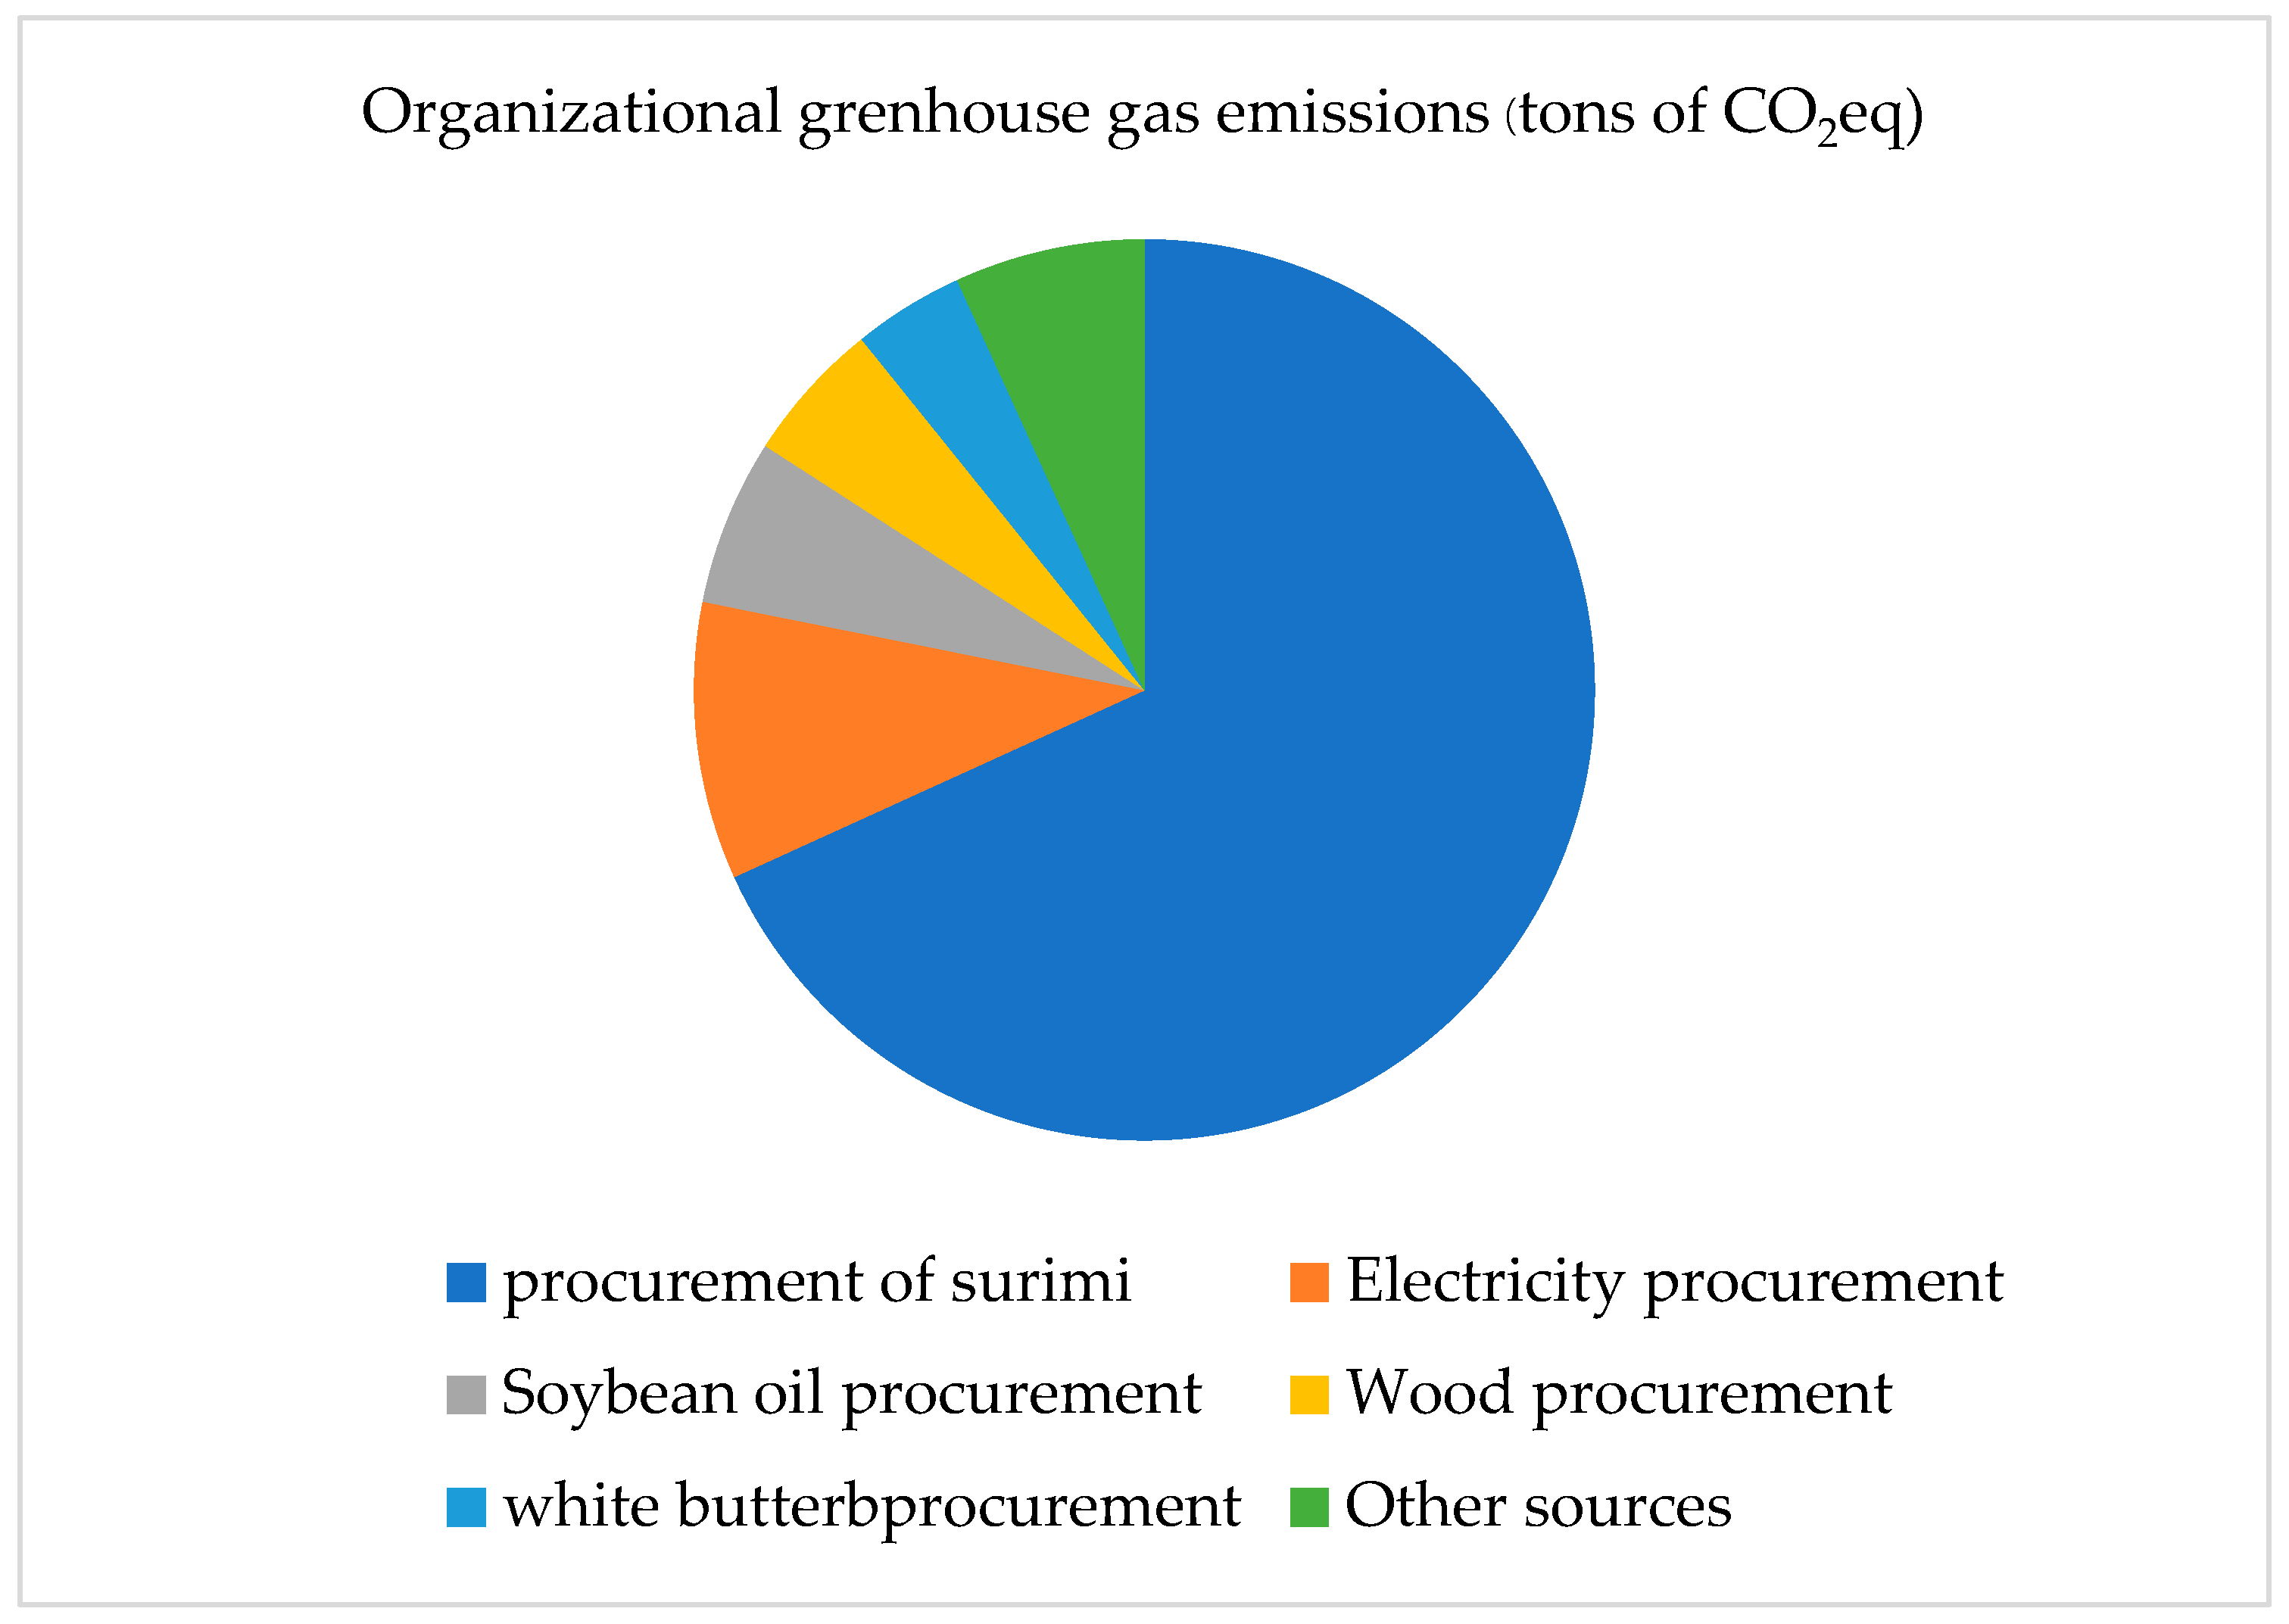
  • Scope 3: Other Indirect Emissions: GHG emissions from activities outside the organization’s direct control, including upstream and downstream activities such as raw material procurement, supply chain transportation, employee commuting, business travel, and waste disposal. Scope 3 emissions are further divided into 15 subcategories according to ISO 14064-1:2018: (2018) [6]. The organization can determine the method for assessing Scope 3 greenhouse gas emissions, as some categories of data may be difficult to collect or cannot be collected. However, the organization must specify the method for selecting Scope 3.
An organization’s carbon footprint assessment will help to identify the amount of greenhouse gases that organization emits and which types of greenhouse gases are most emitted, and organizations can develop effective strategies to reduce their overall carbon footprint.

1.1. Literature Review

Pacharee Srirord (2019) [7] conducted a study on the Carbon Footprint for Organization assessment and sustainable greenhouse gas (GHG) emission reduction strategies for the Regional Environmental Offices in Thailand. The study found that the total GHG emissions from all 16 offices in 2016 amounted to 1412.09 tons of CO2eq per year, with Scope 2 accounting for the largest share at 47.88% of total emissions. The study identified education level as a key factor influencing carbon footprint reduction and proposed the following strategies: (1) using solar energy for office buildings, (2) upgrading electrical appliances and cooling systems to energy-efficient models, (3) planning trips before official travel, (4) implementing fuel-efficient driving policies, (5) enforcing electricity-saving measures, (6) replacing air conditioning units with low-GHG refrigerants, and (7) providing training and awareness programs on carbon footprint reduction.
Chalida Sommana and Setth Sumpattakul (2021) [8] assessed and managed the Carbon Footprint for Organization in an electronic component manufacturing company. The study found that the company emitted 20,065.44 tons of CO2eq per year, with Scope 2 emissions (electricity use) being the highest at 17,620.40 tons CO2eq per year, followed by Scope 1 emissions (direct emissions) at 2424.44 tons CO2eq per year and Scope 3 emissions (other indirect emissions) at 20.60 tons CO2eq per year. The study employed hierarchical analysis to determine optimal carbon footprint management strategies, considering three key factors, including time, economic, and social aspects. These factors were used to develop an effective emission reduction framework for the organization.
Tian et al. (2023) [9] explored net-zero emission decision models for sustainable business districts in China, where business zones contribute approximately 30% of China’s total CO2 emissions. The study emphasized the importance of developing strategies to reduce GHG emissions in urban business districts, as they serve as representative models for broader emission reduction efforts. The two primary approaches identified were energy efficiency improvements and carbon reduction product purchases. However, limited research exists on optimizing the combination of these approaches to achieve net-zero emissions cost-effectively. To address this, the study proposed a comprehensive decision model that integrates carbon reduction and energy savings. Using Markowitz’s portfolio theory, the model balances carbon reduction risk and expected costs over a 10-year life cycle, incorporating investment costs, carbon reduction product costs, and energy-saving benefits. The findings suggest that sustainable business districts can reduce energy consumption by 24% through infrastructure improvements and carbon credit purchases, with 66% of reductions coming from Certified Carbon Emission Reduction (CCER) investments. Additionally, by optimizing energy efficiency improvements, business districts could reduce lifecycle costs by 16% while achieving net-zero carbon emissions.
Safaa et al. (2023) [10] evaluated carbon emissions from air and road transportation in the tourism sector, focusing on travel-related CO2 emissions to Morocco over a nine-year period. The study revealed that international tourism to Morocco generated 7148.90 tons of CO2eq, with the average carbon footprint per traveler worldwide estimated at 0.416 kg CO2eq per person. Tourism, especially air travel, was identified as a rapidly growing source of GHG emissions. The study emphasized the need for climate policy considerations under the Paris Agreement, urging policymakers to incorporate aviation emissions into carbon reduction frameworks.
These related studies highlight the significance of carbon footprint assessments across various sectors, emphasizing the role of energy efficiency improvements, renewable energy adoption, policy implementation, and carbon credit mechanisms in achieving sustainable emission reductions.

1.2. Research Objective

This study aims to assess the carbon footprint of a frozen processed seafood manufacturing plant and propose sustainable strategies to reduce greenhouse gas (GHG) emissions.

1.3. Research Methodology

The research process for assessing the carbon footprint of the frozen processed seafood manufacturing plant and developing GHG reduction strategies involves five steps: defining organizational boundaries, identifying GHG emissions sources, data collection, carbon footprint calculation, and developing GHG reduction strategies, (Figure 1), as outlined in the next paragraph.
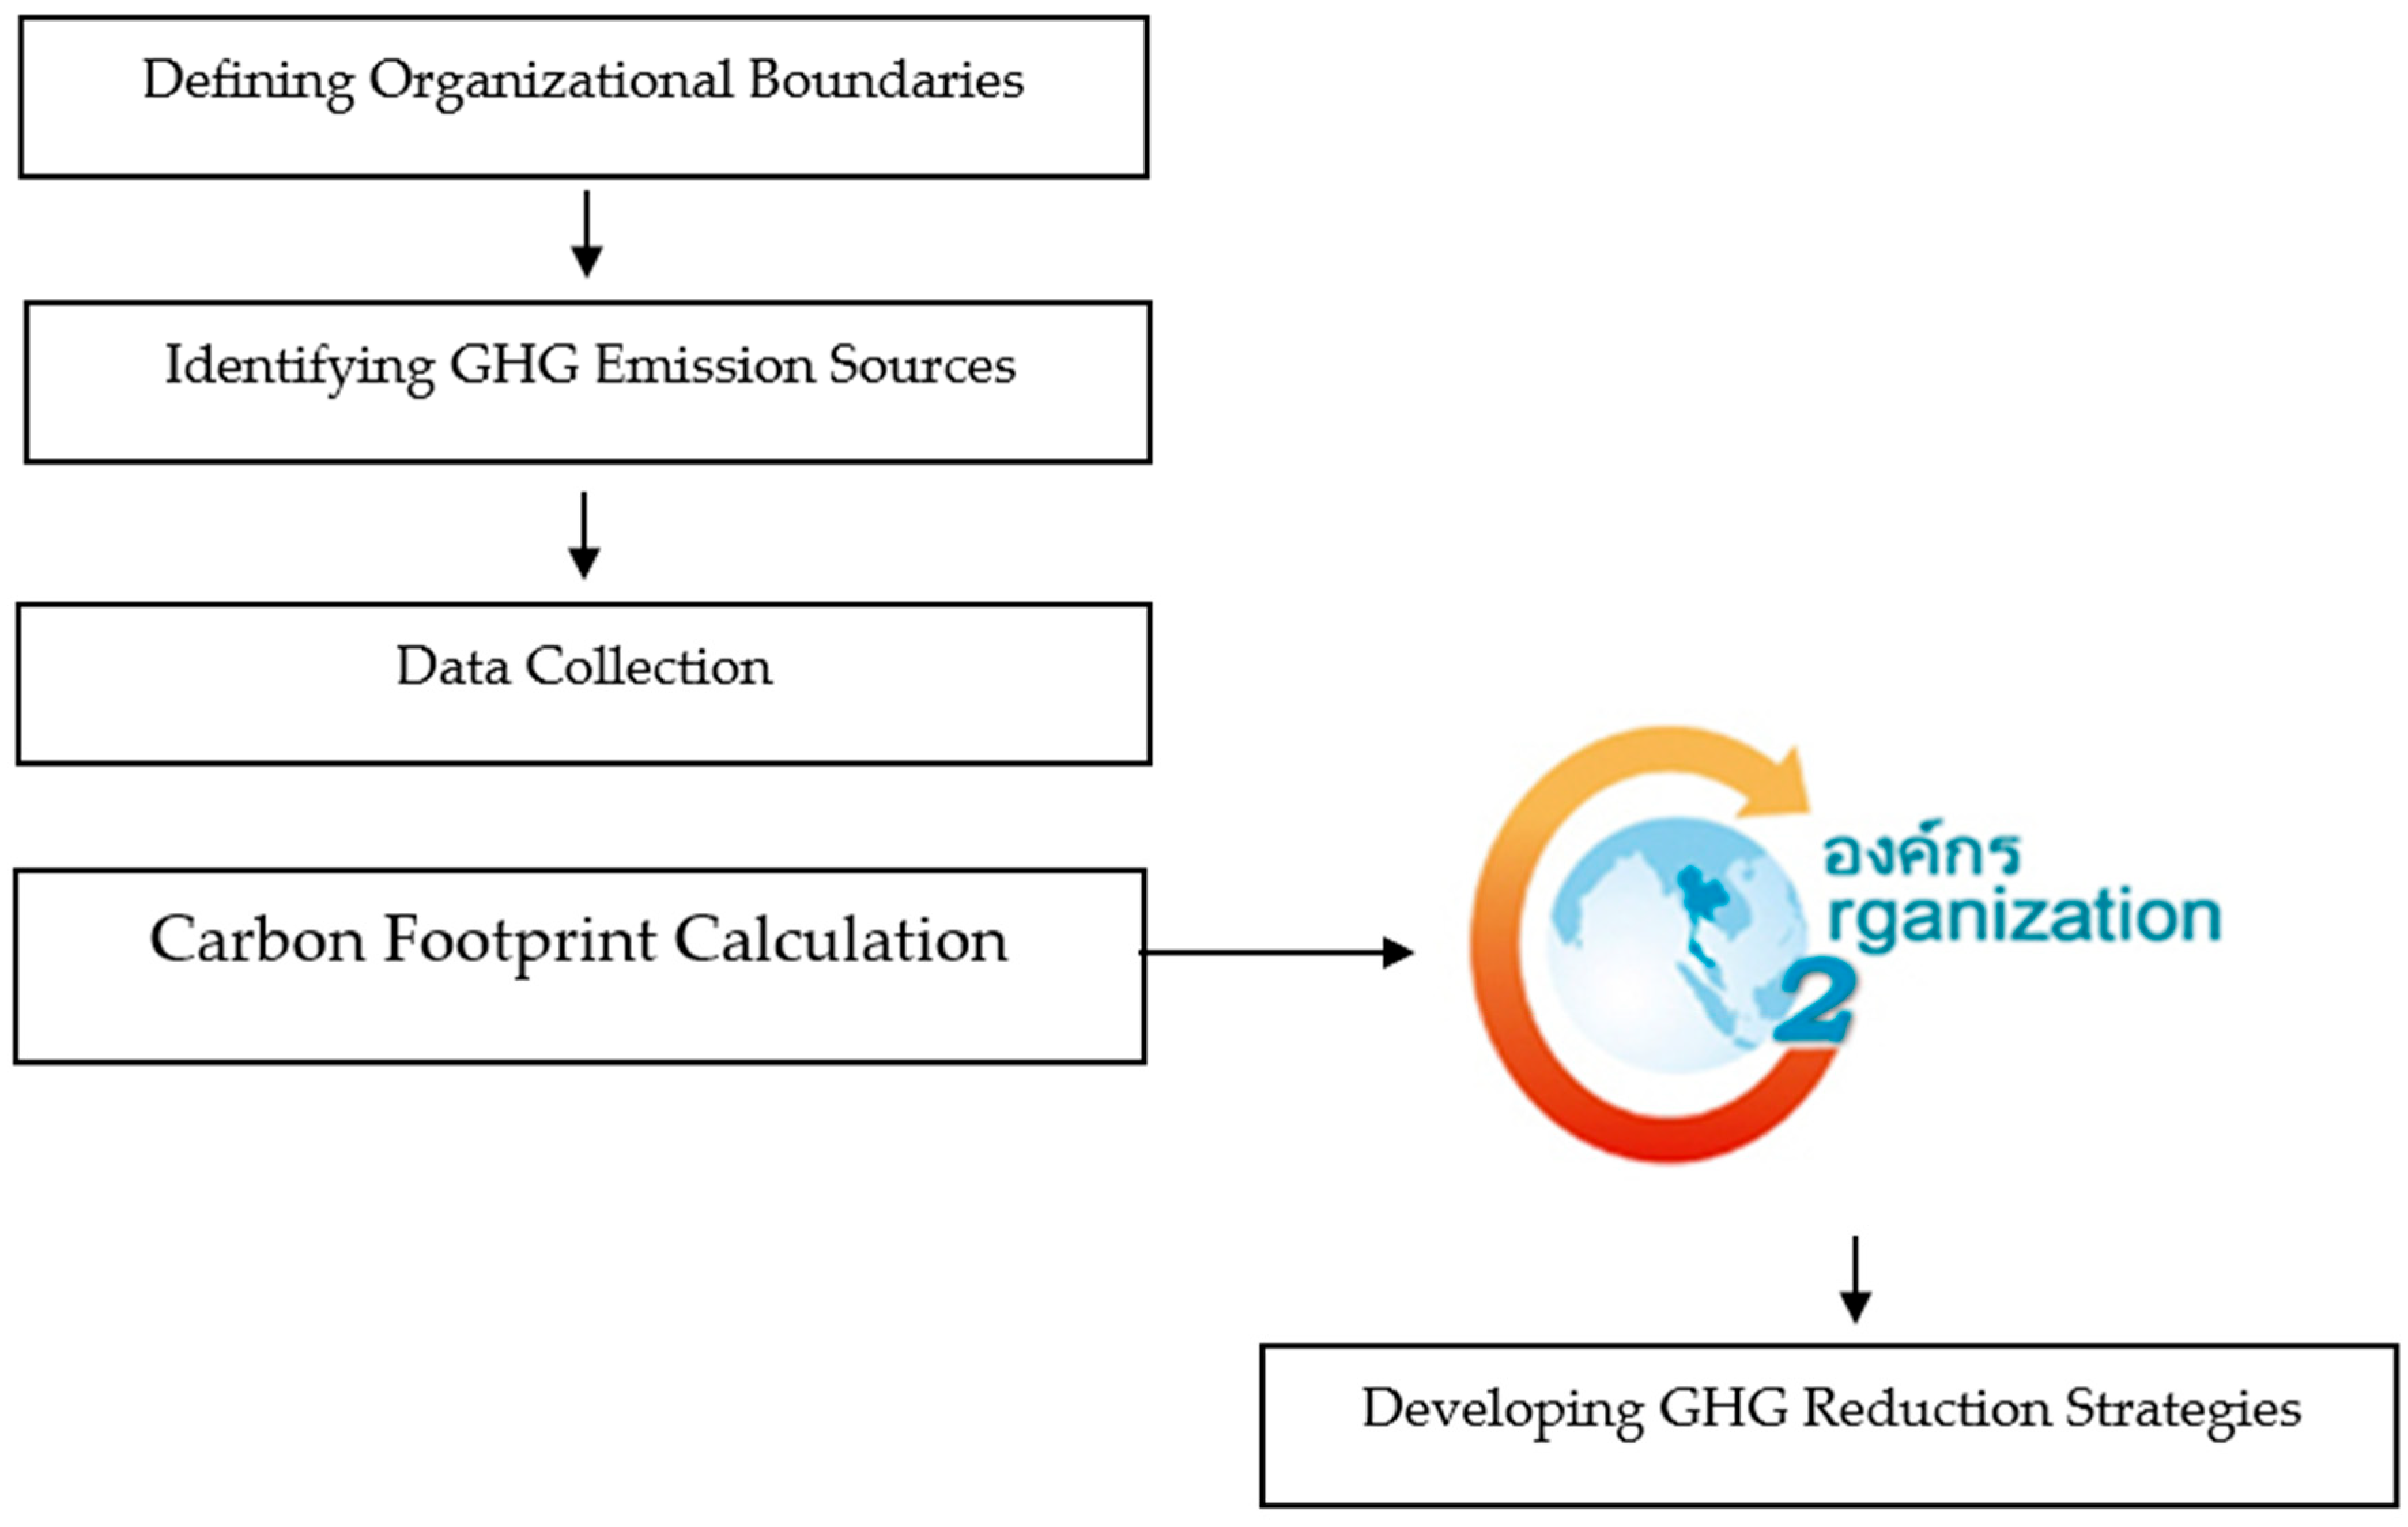
  • Defining Organizational Boundaries. This study adopts a control approach, focusing on operational control, as outlined in the factory operation license No.009000000125295. This includes subsidiaries and nearby facilities that fall under the organization’s operational control.
  • Identifying GHG Emission Sources. A site survey was conducted to analyze all organizational activities and categorize emissions into three scopes. Scope 1 (Direct Emissions): Emissions directly generated by the organization, including fuel combustion, industrial processes, and refrigerant leaks. Scope 2 (Indirect Emissions from Energy Use): Emissions from purchased electricity, steam, heating, cooling, and compressed air. Scope 3 (Other Indirect Emissions): Emissions from upstream and downstream activities, including supply chain operations, transportation, and employee commuting.
  • Data Collection. Resource usage data was collected from 1 January to 31 December 2024, with primary data recorded monthly. Supporting documents, such as inventory requests, receipts, and fuel consumption reports, were used for verification.
  • Carbon Footprint Calculation. The Carbon Footprint for Organization was calculated using activity data (AD) and the emission factor (EF), based on the formula from the Thailand Greenhouse Gas Management Organization (Public Organization), 2022) [11]
    GHGi = ADi × EFi
    where:
    GHGi = Greenhouse gas emissions from activity i, measured in tons of CO2eq.
    ADi = Activity data related to GHG emissions, measured in appropriate units.
    EFi = Emission factor for activity i, aligned with the corresponding activity data.
  • Developing GHG Reduction Strategies. The carbon footprint data was analyzed to identify significant emission sources, focusing on activities contributing at least 10% of total emissions. The percentage of emissions for each activity was calculated using the equation:
    P e r c e n t = G H G   a d i G H D   a d t × 100
    where:
    Percent = Percentage of total GHG emissions from a specific activity.
    GHG_adi = GHG emissions from the activity of interest (tons of CO2eq).
    GHG_adt = Total GHG emissions from all activities (tons of CO2eq).

1.4. Research Findings

The carbon footprint assessment of the frozen processed seafood manufacturing plant was conducted using the Carbon Footprint for Organization evaluation methodology established by the Thailand Greenhouse Gas Management Organization (Public Organization). This organization is responsible for certifying the use of carbon footprint labels for organizations in Thailand. The results indicate that carbon footprint values vary based on the organizational boundary and activities contributing to greenhouse gas (GHG) emissions. In 2024, the carbon footprint assessment of the manufacturing plant revealed the following emissions. Scope 1 (Direct Emissions): 12,685 tons of CO2eq. Scope 2 (Indirect Emissions from Energy Use) 15,403 tons of CO2eq. Scope 3 (Other Indirect Emissions) 31,564 tons of CO2eq. The total GHG emissions across all three scopes amounted to 59,652 tons of CO2eq, with other GHG emissions recorded at 34,027 tons of CO2eq (Figure 2). These findings highlight the significant contribution of indirect emissions, particularly from energy consumption and supply chain activities, underscoring the need for targeted GHG reduction strategies.
From the proportion of greenhouse gas emissions in Scope 1, the findings indicate that R507 refrigerant use in the production cooling system is the highest contributor to greenhouse gas (GHG) emissions, accounting for 9907 tons of CO2eq equivalent or 78.10% of Scope 1 emissions (Figure 3).
From the proportion of greenhouse gas emissions in Scope 2, the findings indicate that electricity consumption is the only activity contributing to indirect energy-related emissions, totaling 15,403 tons of CO2eq, (Figure 4) which represents 100% of Scope 2 emissions.
From the proportion of greenhouse gas emissions in Scope 3, the findings indicate that the most significant contributor is the procurement of surimi (processed fish meat), which generates 20,844 tons of CO2eq, representing 66.04% of total Scope 3 emissions. Other notable contributors include electricity procurement at 3042 tons of CO2eq (9.63%), soybean oil procurement at 1824 tons of CO2eq (5.78%), wood procurement at 1555 tons of CO2eq (4.92%), white butter procurement at 1217 tons of CO2eq (3.85%), and other sources at 2082 tons of CO2eq (6.60%) (Figure 5).
To effectively reduce GHG emissions, this study prioritizes mitigation measures for activities accounting for 10% or more of total emissions. These measures are summarized in Table 1, which categorizes activities based on their emission percentages and identifies appropriate reduction strategies (Table 1).
The assessment of greenhouse gas (GHG) emissions from the frozen processed seafood manufacturing plant identified key activities contributing significantly to emissions across all three scopes.
In Scope 1 (Direct Emissions), the highest contribution was the use of R507 refrigerant in the production cooling system, emitting 9907 tons of CO2eq (78.10%), followed by LPG consumption at 932 tons of CO2eq (7.34%) and diesel consumption for product transportation trucks at 841 tons CO2eq (6.63%).
In Scope 2 (Indirect Emissions from Energy Use), electricity consumption was the sole contributor, generating 15,403 tons of CO2eq (100%) of emissions.
In Scope 3 (Other Indirect Emissions), the most significant source was the procurement of surimi (processed fish meat) at 20,844 tons of CO2eq (66.04%), followed by procurement of electricity at 3042 tons of CO2eq (9.63%) and procurement of soybean oil at 1824 tons of CO2eq (5.78%). When considering total emissions across all scopes, the top three sources were surimi procurement (20,844 tons of CO2eq, 34.34%), electricity consumption (15,403 tons of CO2eq, 25.82%), and use of R507 refrigerant (9907 tons of CO2eq, 16.61%). Given their significant contributions, these activities should be prioritized in GHG reduction strategies, such as transitioning to alternative refrigerants with lower GHG emissions, optimizing energy efficiency through renewable energy integration, and sourcing raw materials from suppliers with certified low-carbon practices. To effectively reduce greenhouse gas (GHG) emissions, immediate action should be taken across all three emission scopes. The urgent GHG reduction strategies proposed for each scope are as follows (Table 2):

2. Conclusions and Discussion

The organizational carbon footprint assessment serves as a crucial tool for identifying the amount and sources of greenhouse gas (GHG) emissions within an organization. By analyzing this data, businesses can develop practical and effective strategies to mitigate emissions, particularly from high-impact activities. To ensure the successful implementation of these strategies, it is essential to engage stakeholders and employees in discussions and decision-making processes to establish feasible and sustainable emission reduction measures.
Achieving significant GHG reduction targets requires collaboration from all sectors, including governments, businesses, and the public (Figure 6).
Governments must implement clear policies, enforce regulations, provide financial and educational support, ensure access to relevant data, and continuously update emissions reduction targets to encourage all stakeholders to assess their GHG emissions, control their emissions, and implement carbon taxes.
Businesses must take responsibility for accurately assessing and managing their emissions, setting clear reduction targets and prioritizing real emissions reductions within their operations, rather than relying solely on purchasing carbon credits as a replacement. This requires a budget to conduct an organization’s carbon footprint assessment, obtain certification from a verification body, and report to stakeholders.
At the same time, the public should increase awareness and actively select carbon-labeled products to support businesses’ commitment to reducing their GHG emissions, such as by choosing carbon-labeled products or choosing products that emit less GHGs. In addition, individuals should make lifestyle changes that reduce carbon emissions, such as separating waste and switching to electric vehicles instead of diesel vehicles, to support a more sustainable and environmentally responsible future.

Author Contributions

Conceptualization.; methodology, P.I.; validation, S.S.; formal analysis, T.P.; investigation, S.I. and S.S.; data curation, P.I.; writing—original draft preparation.; writing—review and editing, S.I.; supervision, S.S.; project administration, P.I. All authors have read and agreed to the published version of the manuscript.

Funding

This research is funded by Pacific Fish Processing Company Ltd.

Data Availability Statement

Data is contained within the article.

Conflicts of Interest

The authors declare no conflicts of interest.

References

  1. Climate Change Institute; The Federation of Thai Industries. Basic Knowledge of Evaluating an Organization’s Carbon Footprint; Climate Change Institute: Bangkok, Thailand; The Federation of Thai Industries: Bangkok, Thailand, 2023. [Google Scholar]
  2. Thailand Greenhouse Gas Management Organization (Public Organization). Measures to Reduce Greenhouse Gas Emissions in the Industrial Sector; Thailand Greenhouse Gas Management Organization: Bangkok, Thailand, 2019.
  3. Office of Natural Resource and Environment Policy and Planning. Thailand’s Fourth Biennial Update Report; Office of Natural Resource and Environment Policy and Planning: Bangkok, Thailand, 2022. [Google Scholar]
  4. Pisit Wongsahasri. Freezing Technology; Fisheries Industrial Technology Research and Development Division, Department of Fisheries: Bangkok, Thailand, 2020. [Google Scholar]
  5. Management System Certification Institute (Thailand). Carbon Footprint for Organization–TGO (CFO). 2024. Available online: https://www.masci.or.th/service/carbon-footprint-for-organization-cfo/ (accessed on 22 June 2024).
  6. ISO 14064-1:2018; Greenhouse Gases-Part1: Specification with Guidance at the Organization Level for Quantification and Reporting of Greenhouse Gas Emissions and Removals. CH-1223 Vernier: Geneva, Switzerland, 2018.
  7. Patcharee Srirod. Carbon Footprint for Organization and Sustainability Reduction of Greenhouse Gas Emissions for Regional Environment Office. Master’s Thesis, National Institute of Development Administration, Bangkok, Thailand, 2019. Available online: https://repository.nida.ac.th/handle/662723737/5000 (accessed on 22 June 2024).
  8. Sommana, C.; Sampattagul, S. Assessing and Managing Greenhouse Gases using Carbon Footprint for Organization of Electronic Manufacturing Company. 2021; pp. 1–9.
  9. Tian, G.; Yang, Y.; Xu, X.; Chen, Y.; Yang, B.; Wu, X.; Wang, X. The Net Zero Emissions Decision Model of the Sustainable Path of Chinese Business Parks. Buildings 2023, 13, 2638. [Google Scholar] [CrossRef]
  10. Safaa, L.; Atalay, A.; Makutėnienė, D.; Perkumienė, D.; Bouazzaoui, I.E. Assessment of Carbon Footprint Negative Effects for Nature in International Traveling. Sustainability 2023, 15, 12510. [Google Scholar] [CrossRef]
  11. Thailand Greenhouse Gas Management Organization (Public Organization). Requirements for Calculating and Reporting an Organization’s Carbon Footprint; Thailand Greenhouse Gas Management Organization: Bangkok, Thailand, 2022.
Figure 1. The research process.
Processes 13 01990 g001
Figure 2. Organizational greenhouse gas emissions.
Processes 13 01990 g002
Figure 3. Proportion of greenhouse gas emissions Scope 1.
Processes 13 01990 g003
Figure 4. Proportion of greenhouse gas emissions Scope 2.
Processes 13 01990 g004
Figure 5. Proportion of greenhouse gas emissions Scope 3.
Processes 13 01990 g005
Figure 6. Key success factors.
Processes 13 01990 g006
Table 1. Greenhouse gas emission percentages.
ItemGreenhouse Gas Emissions (Tons of CO2eq)Proportion
(%)
Proportion (%)
1 + 2
Proportion (%)
1 + 2 + 3
Scope 1: Stationary combustion
Wood chips/firewood/biomass (boiler)569.524.492.030.95
LPG (production process, R&D, bioreactor, and cooking boiler)931.117.343.321.56
Diesel (generator)12.420.100.040.02
Gasoline (lawnmower, chainsaw)2.070.020.010.00
Biogas (generator)0.190.000.000.00
Scope 1: Mobile combustion
Diesel (truck)840.726.632.991.41
Diesel (backhoe loader)3.580.030.010.01
Diesel (electric forklift)44.930.350.160.08
Gasoline (car)21.210.170.080.04
Gasoline (motorcycle)0.860.10.000.00
Scope 1: Fugitive emissions
R410a (large and small air conditioning units)130.411.030.460.22
R134a (large air conditioning units)11.050.090.040.02
R134a (large air conditioning units—container)35.100.280.120.06
R507 (refrigeration system for production process)9906.7178.1035.2716.61
CH4 (methane leakage from biogas system)0.290.000.000.00
CH4 (methane leakage from digesters)174.281.370.620.29
Total Scope 112,684.43100.0045.1621.26
Direct GHG emissions (separate reporting)
Wood chips/firewood/biomass (boiler)33,571.4698.66
Biogas (generator)191.040.56
R22 (refrigeration system for production process)264.000.78
Total separate reports34,026.50100.00
Scope 2: Energy consumption
Energy consumption15,402.46100.0054.8425.82
Total Scope 215,402.46100.0054.8425.82
Scope 3: The procurement of raw materials and services
Surimi (processed fish meat)20,843.9666.04 34.94
Soybean oil1823.955.78 3.06
Modified starch967.923.07 1.62
Shortening1216.103.85 2.04
Salt2.350.01 0.00
Modified starch K1762.232.41 1.28
Frozen white egg375.561.19 0.63
Sugar116.820.37 0.20
Corn starch139.320.44 0.23
Wheat starch (new)90.280.29 0.15
Scope 3: The procurement of fuel and energy
The procurement of wood1554.034.92 2.61
The procurement of LPG256.660.81 0.43
The procurement of diesel115.390.37 0.19
The procurement of electricity and electricity consumption4.360.01 0.01
Scope 3: Waste generated from production process
Waste (landfilling and incineration)252.580.80 0.42
Total Scope 331,563.55100.00 52.91
Table 2. Immediate greenhouse gas reduction measures.
ScopeActivityGHG Reduction Strategies
1Use of E507 in the refrigeration system of the production process
  • Maintain the refrigeration system to prevent leaks.
  • Modify the piping system to prevent refrigerant leakage.
  • Improve storage conditions and implement refrigerant replacement programs.
  • Transition to alternative refrigerants with lower or no greenhouse gas emissions.
2Electricity consumption
  • Encourage energy conservation practices among all personnel within the organization.
  • Maintain machinery and equipment in optimal condition to ensure high energy efficiency.
  • Install energy-efficient equipment, such as variable speed drives (VSD), and replace conventional motors with high-efficiency motors.
  • Utilize electricity generated from renewable energy sources, such as solar power.
3Procurement of
raw materials
  • Source raw materials from suppliers that implement sustainable food production and have received environmental certifications.
  • Procure raw materials from local production sources to reduce greenhouse gas emissions associated with transportation.
Disclaimer/Publisher’s Note: The statements, opinions and data contained in all publications are solely those of the individual author(s) and contributor(s) and not of MDPI and/or the editor(s). MDPI and/or the editor(s) disclaim responsibility for any injury to people or property resulting from any ideas, methods, instructions or products referred to in the content.

