1. Introduction
The challenges of climate change have led to significant impacts, including global warming, increased risks of natural disasters, and loss of biodiversity. In response, Thailand has set ambitious targets to achieve carbon neutrality by 2050 and net-zero greenhouse gas (GHG) emissions by 2065, in alignment with the Paris Agreement. These commitments have driven countries worldwide to implement regulations requiring businesses to reduce GHG emissions, utilizing economic mechanisms such as Carbon Pricing Instruments (CPIs), including Carbon Tax and Emission Trading Schemes (ETS), as management tools. Consequently, businesses must actively engage in GHG reduction efforts to remain competitive and compliant with emerging environmental policies.
The industrial sector is a major contributor to GHG emissions, primarily from fuel combustion (burning fossil fuels such as coal, oil, and natural gas for heat and electricity) and manufacturing processes (chemical reactions in industries like cement, steel, and chemical production) (Thailand Greenhouse Gas Management Organization, 2014) [
1]. The growth of Thailand’s industrial sector has been evident in recent years, particularly following the post-COVID-19 economic recovery. In 2023, 1743 new and expanded factories were registered, marking a 4% increase from the previous year, while industrial employment rose by 22% to 72,733 jobs. Moreover, industrial investments reached THB 269.8 billion, reflecting a 44% growth compared to the prior year (Matichon Online, 2024) [
2].
In Thailand, there are many processed seafood factories. This industry’s freezing process often uses refrigerants to reduce the temperature of the product in the center of the piece to below −18 degrees Celsius and also utilizes cold storage, so it uses a lot of electricity. Therefore, the carbon footprint of this type of industry should be assessed.
GHG emissions include carbon dioxide (CO
2), a greenhouse gas that is mainly produced by human activities, such as the burning of fossil fuels such as coal, natural gas, and oil. Methane (CH
4) is produced by geological and biological processes, such as anaerobic wastewater treatment. Nitrous oxide (N
2O) is produced naturally and by humans, such as through the use of fertilizers. Hydrofluorocarbons (HFCs) are a group of man-made compounds, found in, for example, refrigerants in refrigeration, air conditioning, and fire suppression systems. Perfluorocarbons (PFCs) are a group of chemical compounds used in the aluminum manufacturing industry as refrigerants and solvents. Sulfur hexafluoride (SF
6) is used in the electrical industry as an insulator for devices such as breakers and switches. Nitrogen trifluoride (NF
3) is found in the manufacturing of electronic components, such as display screens, solar panels, and LEDs. GHGs are continuously generated from human activities such as energy consumption, industrial expansion, agriculture, transportation, deforestation, and environmental degradation. The escalating severity of global warming has prompted governments and industries worldwide to seek solutions for reducing these emissions. One widely adopted approach is the Carbon Footprint for Organization (CFO) or Corporate Carbon Footprint (CCF) approach, which quantifies an organization’s GHG emissions based on their operations. This methodology provides essential data for establishing effective GHG management and reduction strategies at corporate, industrial, and national levels (Thailand Greenhouse Gas Management Organization (Public Organization), 2020) [
3].
Efforts to reduce GHG emissions have been a global priority, given their direct link to climate change and the widespread economic, social, and environmental consequences. Achieving carbon neutrality requires a balance between emitted and absorbed GHGs through three key mechanisms: (1) reducing emissions by transitioning to renewable energy and improving energy efficiency; (2) carbon sequestration via enhancing natural carbon sinks such as forests, mangroves, and carbon capture technologies; and (3) carbon offsetting, which entails compensating for remaining emissions through carbon credit purchases. For example, if an entity emits 100 million tons of CO
2eq but can only absorb 80 million tons, it must offset the remaining 20 million tons via carbon credits (Office of Natural Resources and Environmental Policy and Planning, 2023) [
4].
Thailand’s commitment to carbon neutrality and net-zero emissions was reinforced by Prime Minister General Prayut Chan-o-cha at the COP26 Summit, where he pledged to achieve the carbon neutrality target by 2050 and the net-zero emissions target by 2065. Achieving these goals requires significant reductions across key sectors, including energy, transportation, industry, and agriculture, alongside enhanced carbon sequestration efforts. The current carbon absorption capacity in Thailand stands at 90 million tons of CO
2eq, with plans to expand this to 120 million tons of CO
2eq through reforestation, mangrove restoration, and green infrastructure projects. By achieving this balance, Thailand aims to fully offset its emissions and reach carbon neutrality by 2050 (Office of National Higher Education Science Research and Innovation Policy Council, 2022) [
5].
2. Literature Review
Syafrudin et al. (2020) [
6] conducted a study on the Carbon Footprint for Organization of an educational institution, using Diponegoro University (Undip) in Indonesia as a case study. Their research found that the university’s total carbon footprint amounted to 16,345.83 tons of CO
2eq, with electricity consumption being the largest contributor, followed by transportation activities, which generated 13,953.22 tons of CO
2eq and 1449.99 tons of CO
2eq, respectively. Their study suggested energy conservation measures, efficiency improvements, and increasing green spaces on campus as effective strategies to reduce GHG emissions.
Perez-Lopez, Orro, and Novales (2021) [
7] examined the environmental footprint of A Coruña University in Spain, focusing on staff-commuting emissions between 2008 and 2016, as well as during the COVID-19 pandemic in 2020. Their findings revealed that 92% of the university’s total emissions were generated by private car travel, with commuting activity increasing by 17% between 2008 and 2020. Based on this analysis, the study emphasized the need for sustainable transportation policies aimed at reducing private car usage among university personnel to mitigate environmental impacts.
Nikolay et al. (2023) [
8] also conducted a study on carbon footprint reduction and climate change mitigation. It was found that, since the industrial revolution, the use of natural resources in various human activities (such as the use of fossil fuels), deforestation, land use, and changes in marine ecosystems have all caused greenhouse gas emissions, resulting in an increase in greenhouse gases in the atmosphere, causing the temperature to rise by about one degree Celsius. Therefore, it is necessary to reduce greenhouse gas emissions and limit the temperature increase by changing the production processes that lead to greenhouse gas emissions, such as by using modern innovative science and technology approaches to control temperature, reduce greenhouse gas emissions, and help promote sustainable development.
Safaa et al. (2023) [
9] conducted a study entitled ‘Assessment of Carbon Footprint Negative Effects for Nature in International Traveling’, concluding that human traveling is considered the biggest source of carbon dioxide emissions, and climate change is considered the most important part of this problem. On the other hand, the tourism sector is one of the sectors that facilitates intense human mobility and travel. The aim of their research was to estimate the carbon footprint of aircraft and road transportation due to international and domestic touristic trips to Marrakech/Morocco between 2010 and 2018. In their research, the preferred means of transportation and the distances traveled by the tourists who visited Marrakech/Morocco between 2010 and 2018 were used as a data set. Carbon footprint calculations were made according to each transportation vehicle preference. The total carbon footprint was calculated at the same time. In general, the average nine-year carbon footprint of touristic trips to Morocco from different parts of the world was found to be 7148.90 tons in total. The per capita carbon footprint of all visitors from different countries of the world was determined to be 0.416 kg. Tourism, due to its transport intensity, particularly regarding air transport, is a growing source of greenhouse gas emissions. It should be taken into account in the definition of climate policies following the Paris Agreement.
Alıc et al. (2024) [
10] carried out a carbon footprint analysis including process-level calculations and an analysis of process-influencing factors for a sustainable low-carbon textile factory, which found that climate change is global problem caused by greenhouse gases. Therefore, greenhouse-gas-emitting processes must be studied by studying the sources, emissions, and environmental impacts of GHGs. It was found that carbon dioxide (CO
2), methane (CH
4), nitrous oxide (N
2O), and fluoride gas are the most common greenhouse gases. Each type comes from different sources. The textile sector produces greenhouse gas emissions from energy consumption, water consumption, and waste management. Therefore, the emissions from the factory’s operations were analyzed. Energy consumption, especially regarding emissions from fuels used in the production of electricity and heat, was also analyzed. In addition, emissions from other major sources, such as refrigerant gas leakage, waste management, and transportation, were also analyzed. The study proposes a systematic approach for calculating the company’s carbon emissions by collecting data according to national and international standards. It was found that the company had a total of 1350 employees. The organization’s carbon emissions in 2023 were 68,746.86 tons of CO
2eq. Each employee emitted 50.92 tons of CO
2eq. When compared to the production in 2023 of 4,427,082 tons, the authors concluded that 1 ton of production emits 15.53 tons of CO
2eq. Therefore, strategies are proposed to reduce greenhouse gas emissions through energy efficiency measures, using factory energy sources to reduce the carbon footprint and minimize environmental impacts.
Filonchyk et al. (2024) [
11] conducted a study on greenhouse gas emissions and reduction strategies for the world’s largest greenhouse gas emitters; they concluded that, in response to climate change, it is imperative to measure greenhouse gas emissions at a national level. The study examined emissions from 1970 to 2022 for the United States, China, India, Russia, Brazil, Indonesia, Japan, Iran, Mexico, and Saudi Arabia, which together account for about 64% of the total greenhouse gas emissions, in order to understand the impacts on different economic sectors such as industry, energy, agriculture, and transportation. Their analysis found that greenhouse gas emissions per capita varied, with large and small oil-producing countries in the Persian Gulf, such as Qatar and the United Arab Emirates, having higher emissions per capita, while more populous countries, such as the United States and South Korea, had lower emissions per capita. The results suggest that transitioning to renewable energy, improving energy efficiency in industry, and promoting sustainable agriculture, reforestation, and electrified transportation systems are key to achieving the United Nations Sustainable Development Goals (UN SDGs), such as supporting technological innovation, implementing strong government regulations and standards, and securing support for greenhouse gas reduction programs from governments, financial institutions, and the business sector, underscoring the urgent need to combat climate change to ensure a sustainable future.
Haoyang Liu and Jiangtao Zhai (2025) [
12] completed a study entitled ‘Carbon Emission Modeling for High-Performance Computing Based AI in New Power Systems with Large-Scale Renewable Energy Integration’. This research uses a newly developed carbon emission model (CEM) to calculate two types of carbon emissions, namely integrated and operational, in HPC systems. The CEM includes parameters such as energy intensity coefficient, load distribution model, and renewable energy shortage rate, which provides a comprehensive view of the life cycle of greenhouse gas emissions in HPC-based AI applications for power systems. It was found that operational greenhouse gas emissions account for the majority, accounting for 87% of the total life-cycle greenhouse gas emissions. Different regions have different greenhouse gas emissions. Increasing the use of renewable energy from 20% to 50% can reduce greenhouse gas emissions by up to 43%. If all renewable energy is switched to renewable energy, the greenhouse gas emissions can be reduced by 92%. Circular economic practices, including hardware recycling and sustainable design, are also highlighted to mitigate embodied emissions. This study offers quantitative evidence and actionable insights for power industry stakeholders, enabling the balance between high-performance AI computations and ambitious carbon neutrality goals in renewable-integrated systems.
Dinara et al. (2025) [
13] conducted a study on the environmental sustainability and carbon footprint of tourism by researching nature parks in the northeast of Kazakhstan. These authors assessed the environmental sustainability and carbon emissions of tourism in the Bayanaul State National Park (Kazakhstan) using the GSTC criteria and the Greenhouse Gas Emissions Protocol. Their research surveyed and interviewed representatives of the tourism industry, administrative officials, and environmental organizations in order to analyze awareness of the principles of sustainable tourism, existing barriers, and opportunities to increase sustainability. The results of the study revealed that greenhouse gas emissions of 530 tons of CO
2eq were indirectly emitted, with procurement and transportation accounting for 57%, and 20.5% arising from the use of coal for heating. According to their expert assessment, the main contributions were energy efficiency, the use of renewable energy, waste separation and recycling, transparency in financial management, and educational programs for tourists and employees. A sustainable tourism management model adapted to the specifics of each region was developed. This model involves the state, businesses, and local communities and provides a mechanism for reducing greenhouse gas emissions and increasing environmental sustainability. This research makes a theoretical contribution by adapting the GSTC standards to the Kazakhstani environment and developing a sustainable tourism management model that takes into account local characteristics, reducing environmental impacts and increasing environmental sustainability.
3. Research Objective
The present study aims to assess the Carbon Footprint for Organization of a frozen processed seafood manufacturing plant and propose strategies to reduce the organization’s greenhouse gas (GHG) emissions in alignment with the Net-Zero Pathway.
3.1. Research Methodology
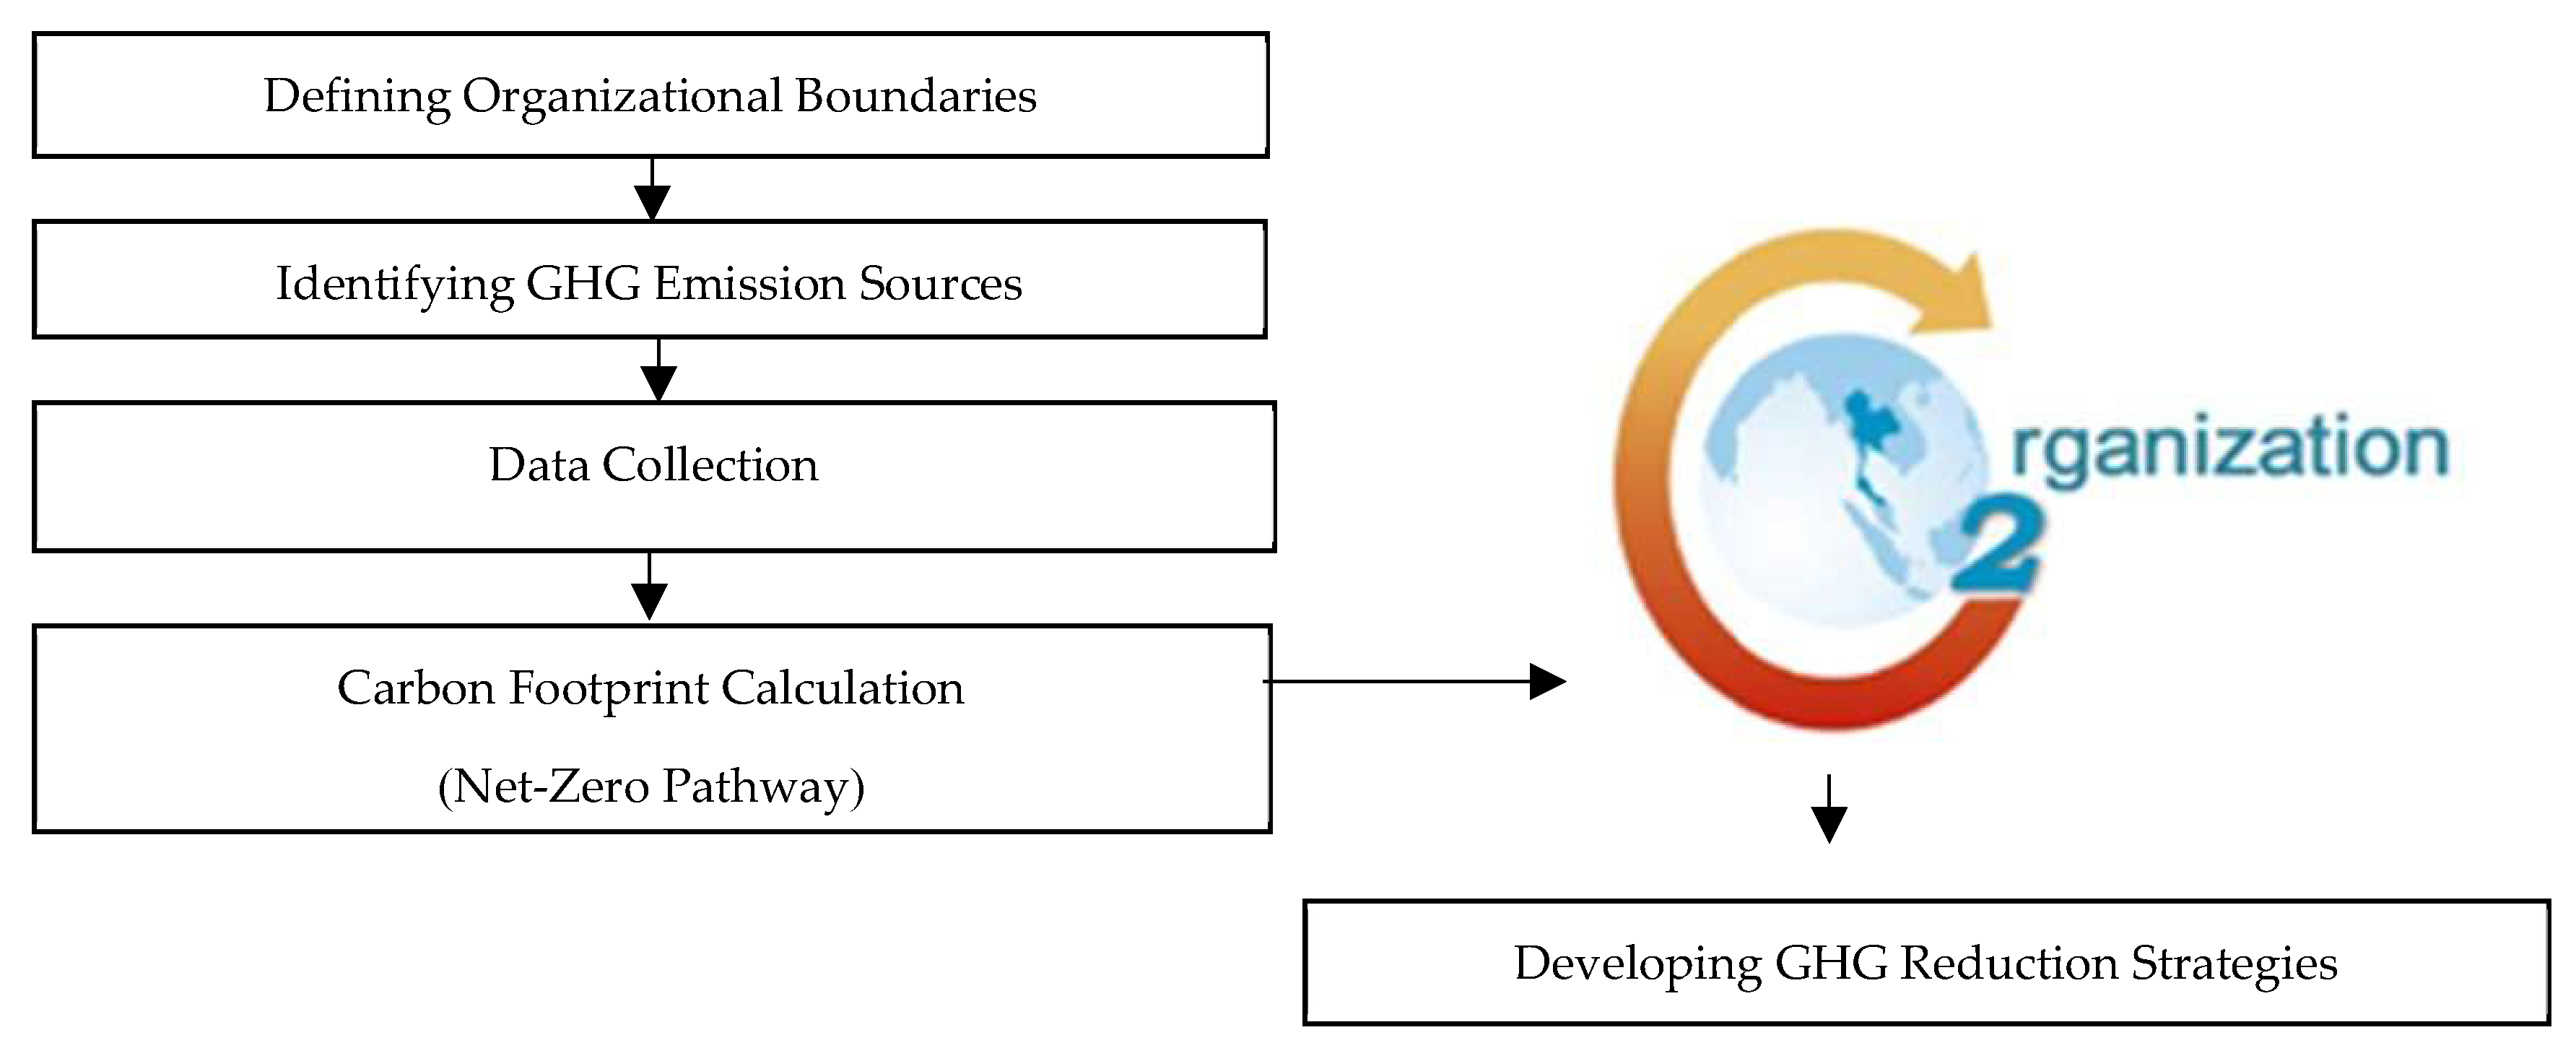
The research process for evaluating the Carbon Footprint for Organization and developing GHG reduction strategies under the Net-Zero Pathway consists of the following steps (
Figure 1):
Defining Organizational Boundaries: Establishing the scope of assessment using the Control Approach, focusing on operational control with the factory operating license number 009000000125295 as a document confirming the organization’s scope to determine the facilities and subsidiaries included in the evaluation.
Identifying GHG Emission Sources: Conducting an on-site assessment to classify emissions into three scopes, including Direct Emissions, Indirect Emissions from Energy Consumption, and Other Indirect Emissions.
Data Collection: Gathering activity data related to resource consumption and GHG emissions from 1 January 2024 to 31 December 2024, with supporting documentation such as utility bills, fuel usage reports, and procurement records.
Carbon Footprint Calculation: Using activity data and emission factors from recognized sources to calculate the carbon footprint based on the following formula (Thailand Greenhouse Gas Management Organization (Public Organization), 2022) [
14]:
GHGi = greenhouse gas emissions from activity i, measured in tons of CO2eq
ADi = activity data related to GHG emissions, measured in appropriate units;
EFi = emission factor for activity i, aligned with the corresponding activity data.
Developing GHG Reduction Strategies: Applying the Absolute Contraction method based on the Science-Based Targets (SBT) Initiative, ensuring a consistent annual reduction rate. The time frame between the base year and the target year must not exceed 21 years, with a fixed annual reduction rate. The annual GHG reduction percentage (%ER) is calculated using the following equation (Thailand Greenhouse Gas Management Organization (Public Organization), 2023) [
15]:
where
%ER = annual percentage reduction in GHG emissions;
GHG EmissionBY = GHG emissions in the base year (tons of CO2eq);
GHG EmissionTY = GHG emissions in the target year (tons of CO2eq);
BY (Base Year) = starting year for emission reduction calculations;
TY (Target Year) = year by which the reduction goal is to be achieved.
3.2. Research Findings
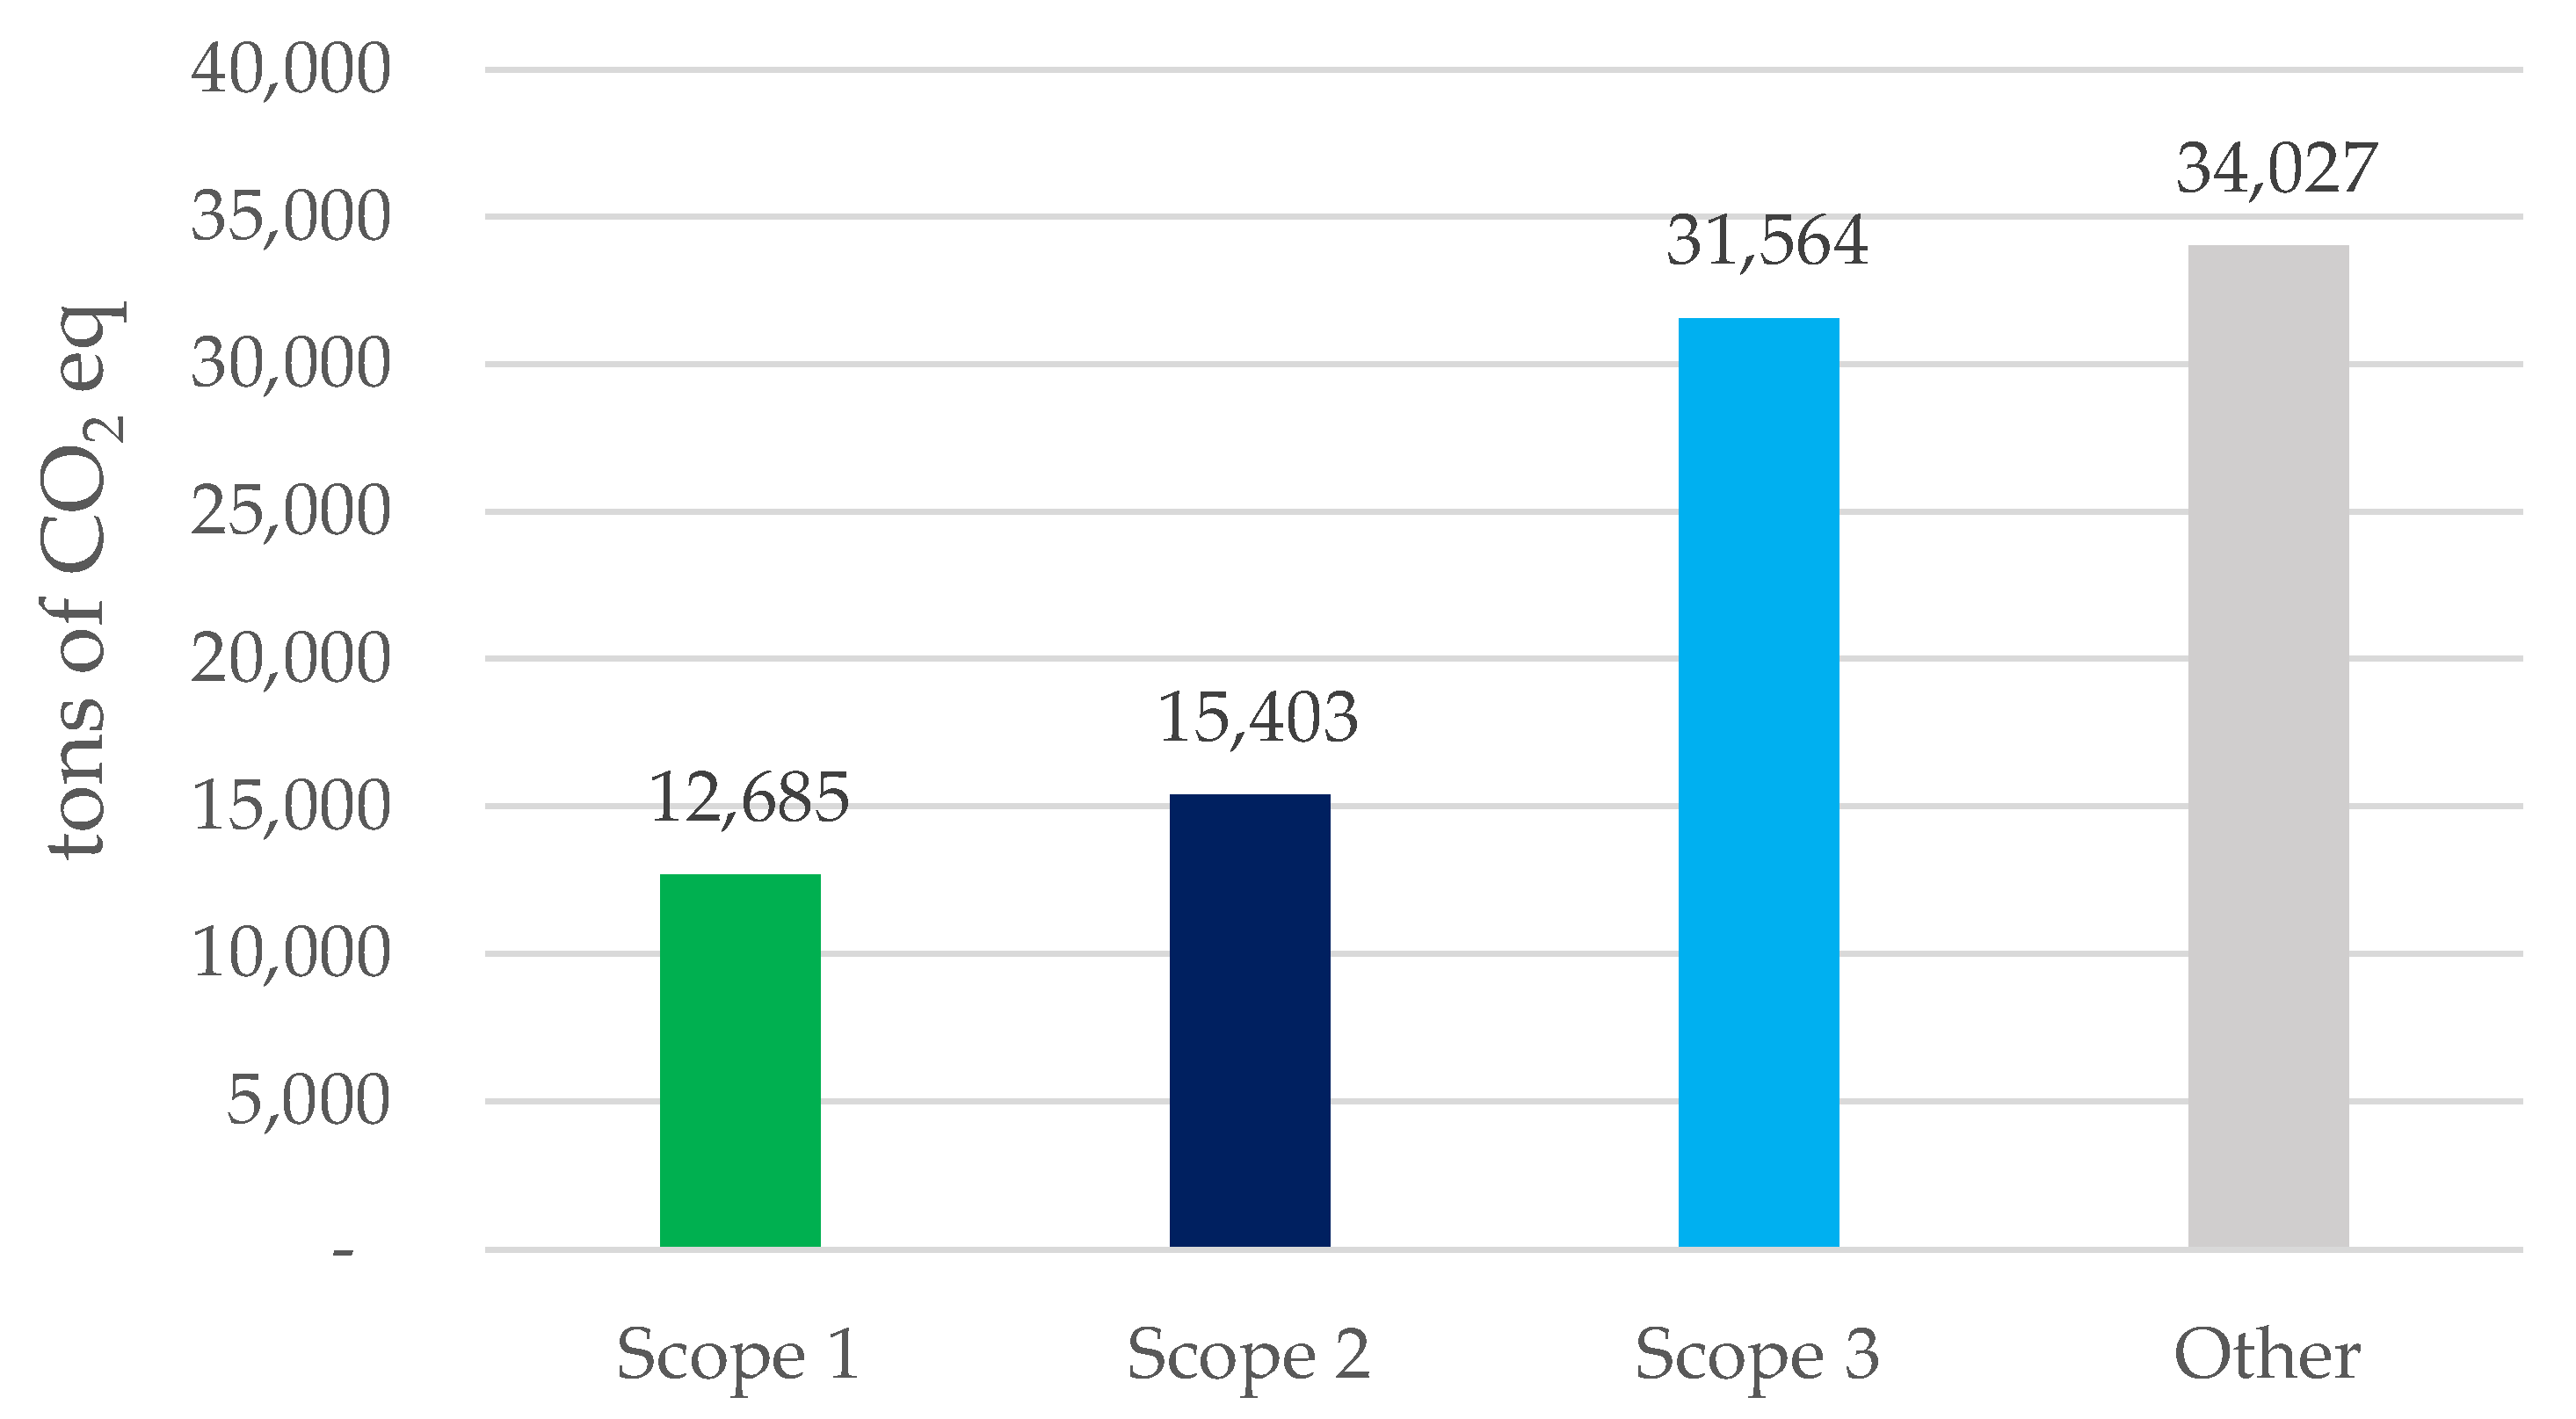
The Carbon Footprint for Organization assessment of the frozen processed seafood manufacturing plant in 2024 revealed the following greenhouse gas (GHG) emissions: Scope 1 (Direct Emissions) accounted for 12,685 tons of CO
2eq; Scope 2 (Indirect Emissions from Energy Consumption) amounted to 15,403 tons of CO
2eq; and Scope 3 (Other Indirect Emissions) reached 31,564 tons of CO
2eq. The total GHG emissions across all three scopes were 59,652 tons of CO
2eq, with additional GHG emissions recorded at 34,027 tons of CO
2eq. Greenhouse gas emissions reported separately include carbon dioxide, which is caused by the combustion of boilers, which must be reported separately from stationary combustion in Scope 1 because, normally, the growth of trees accumulates carbon dioxide. When there is combustion, the accumulated carbon dioxide is released back into the atmosphere. R22 will be reported in this section as well because it is an important part of controlling and reducing the use of R22, in accordance with the Montreal Convention. These results highlight the significant contribution of indirect emissions, particularly from electricity consumption and supply chain activities, reinforcing the need for targeted emission reduction strategies to align with the Net-Zero Pathway (
Figure 2).
Each scope of greenhouse gas emissions is detailed and proportional in
Table 1.
The Net-Zero Pathway establishes a structured plan to reduce greenhouse gas (GHG) emissions progressively (
Table 1).
The aim is to achieve net-zero emissions by 2050 (
Table 2).
The base year for assessment is 2024.
There is a GHG retention allowance of 10% in the target year.
The monitoring period for the initial phase of the Net-Zero Pathway spans from 2024 to 2027.
To achieve net-zero emissions, the annual GHG reduction rate is set at 3.46% per year for each emission category. This systematic reduction ensures that by 2050, the organization will have successfully minimized its carbon footprint while maintaining operational sustainability. Therefore, in order to successfully reduce each category’s GHG emissions, it is necessary to consider each GHG emission category individually to determine the method for reducing its GHGs (
Figure 3).
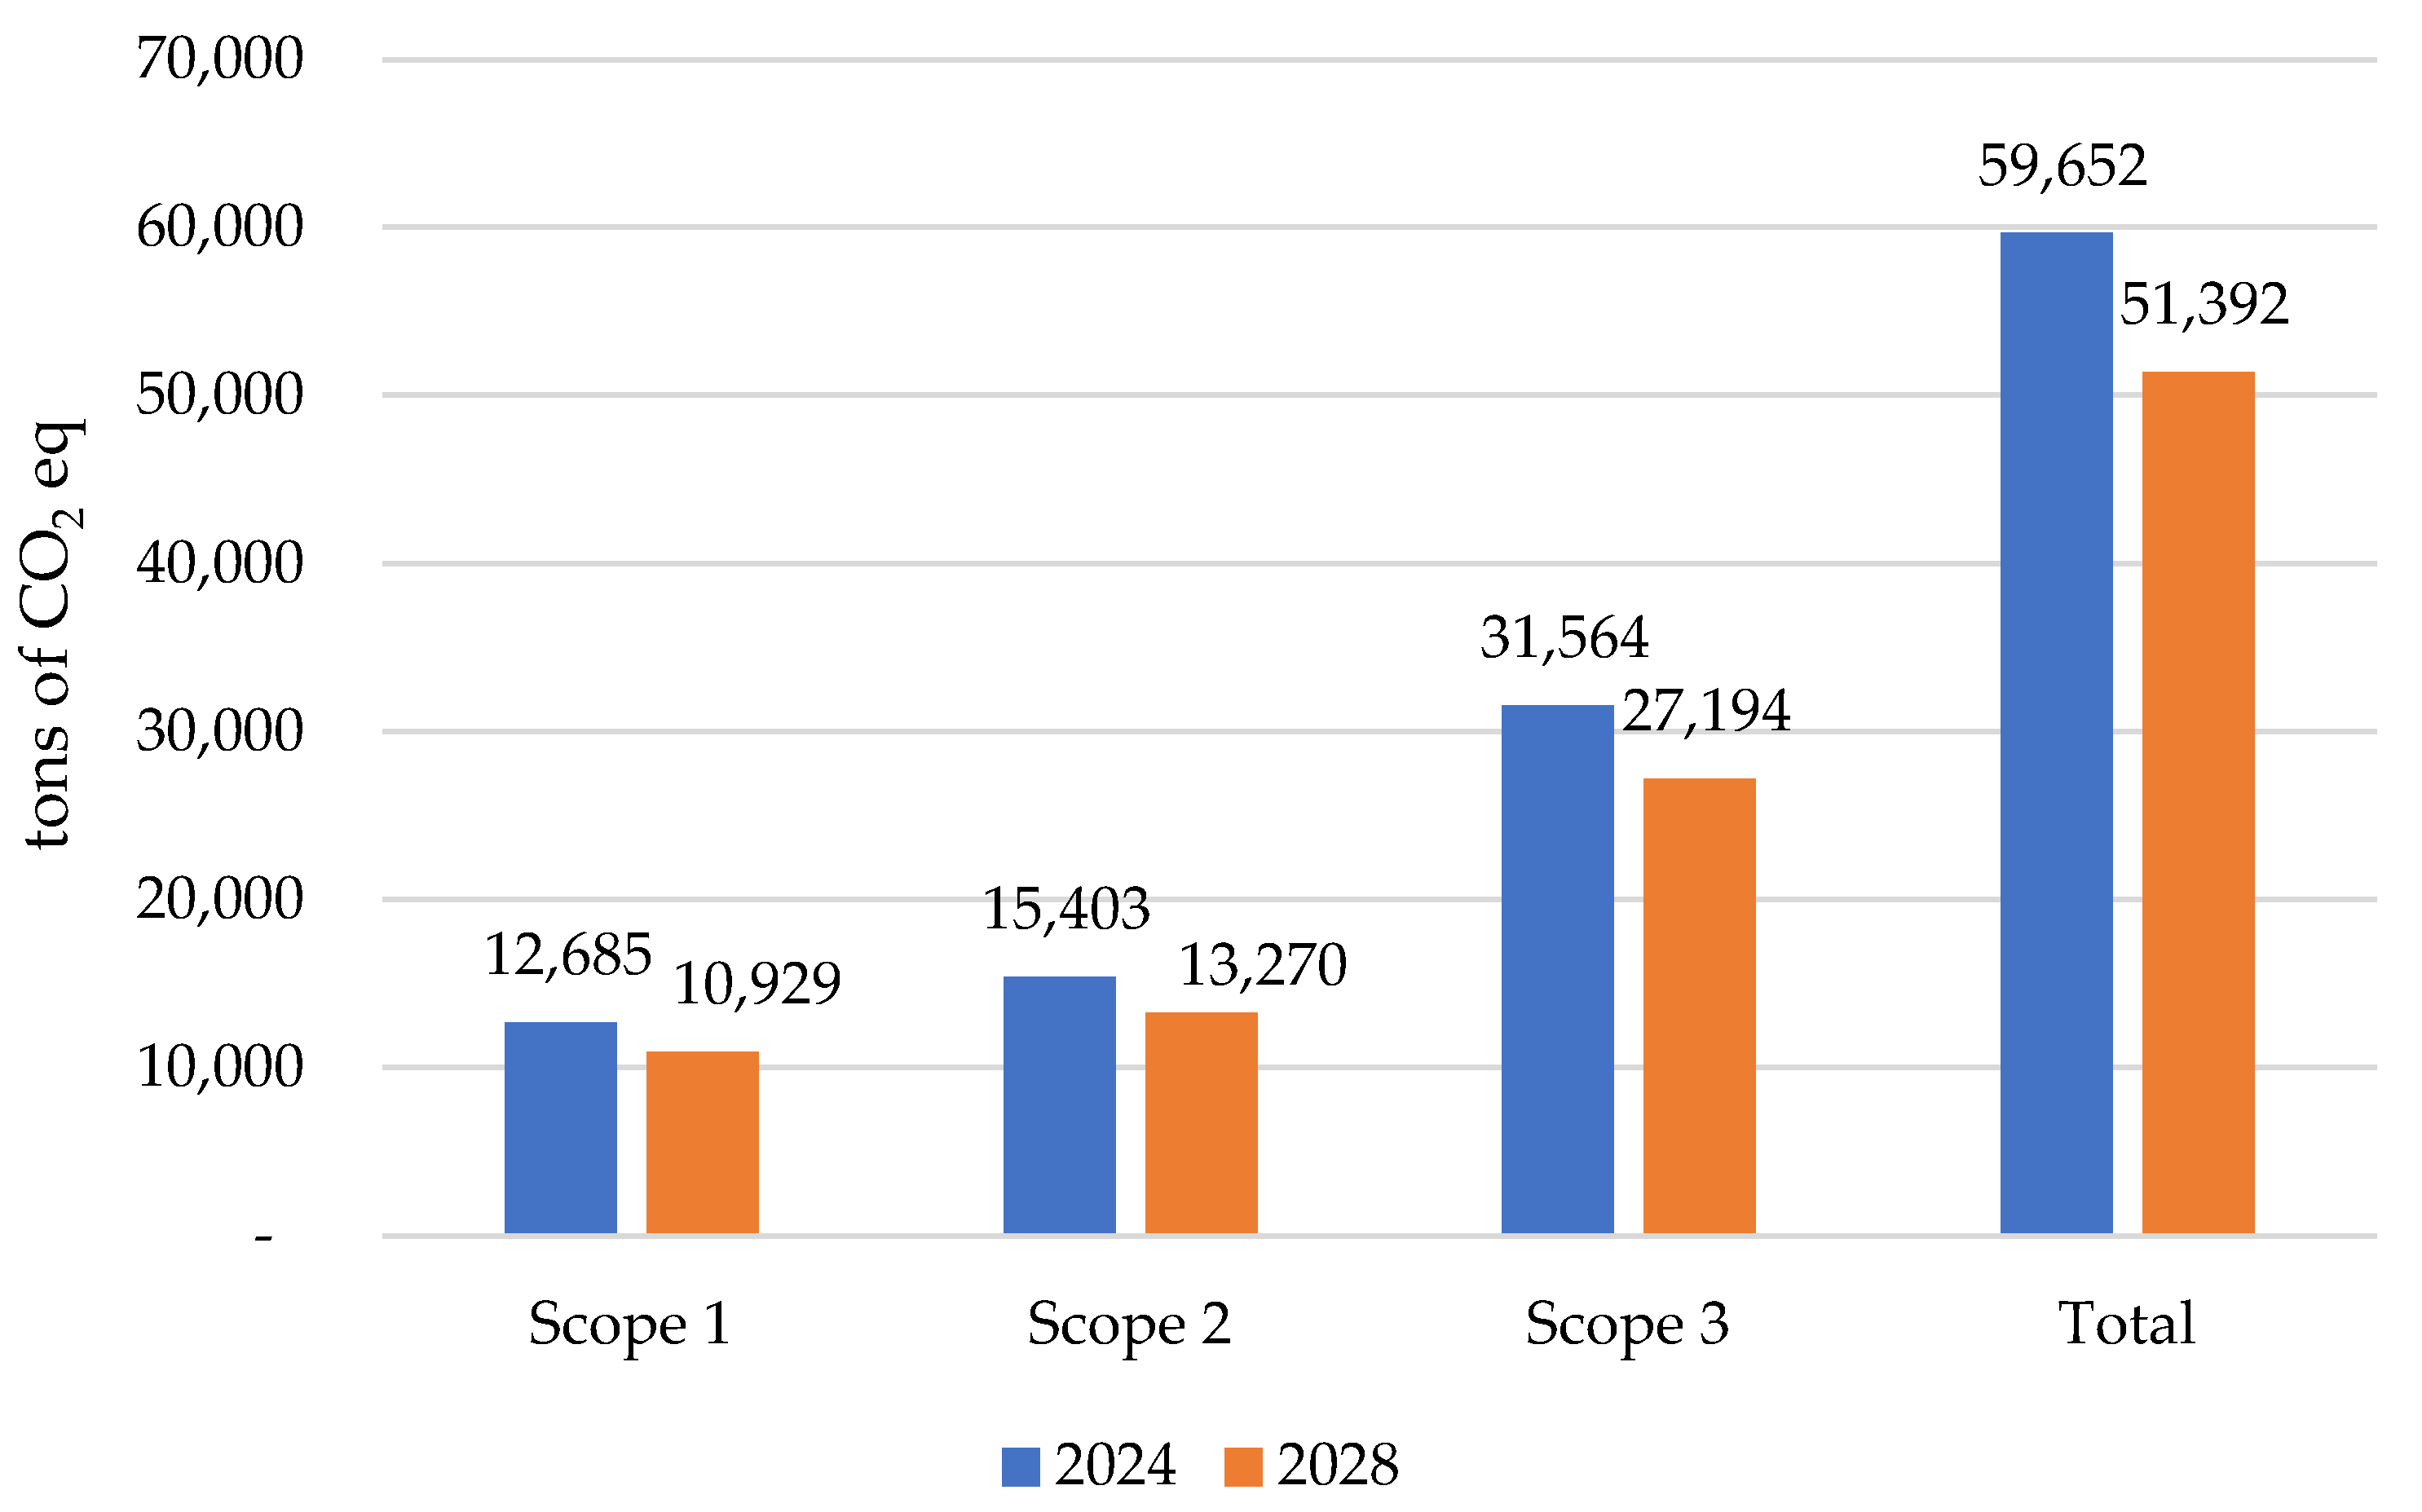
Under the five-year Net-Zero Pathway target, greenhouse gas emissions must be reduced to 10,929 tons of CO
2eq for Scope 1, 13,270 tons of CO
2eq for Scope 2, and 27,194 tons of CO
2eq for Scope 3, with the total emissions across all three scopes being reduced to 51,392 tons of CO
2eq (
Figure 4).
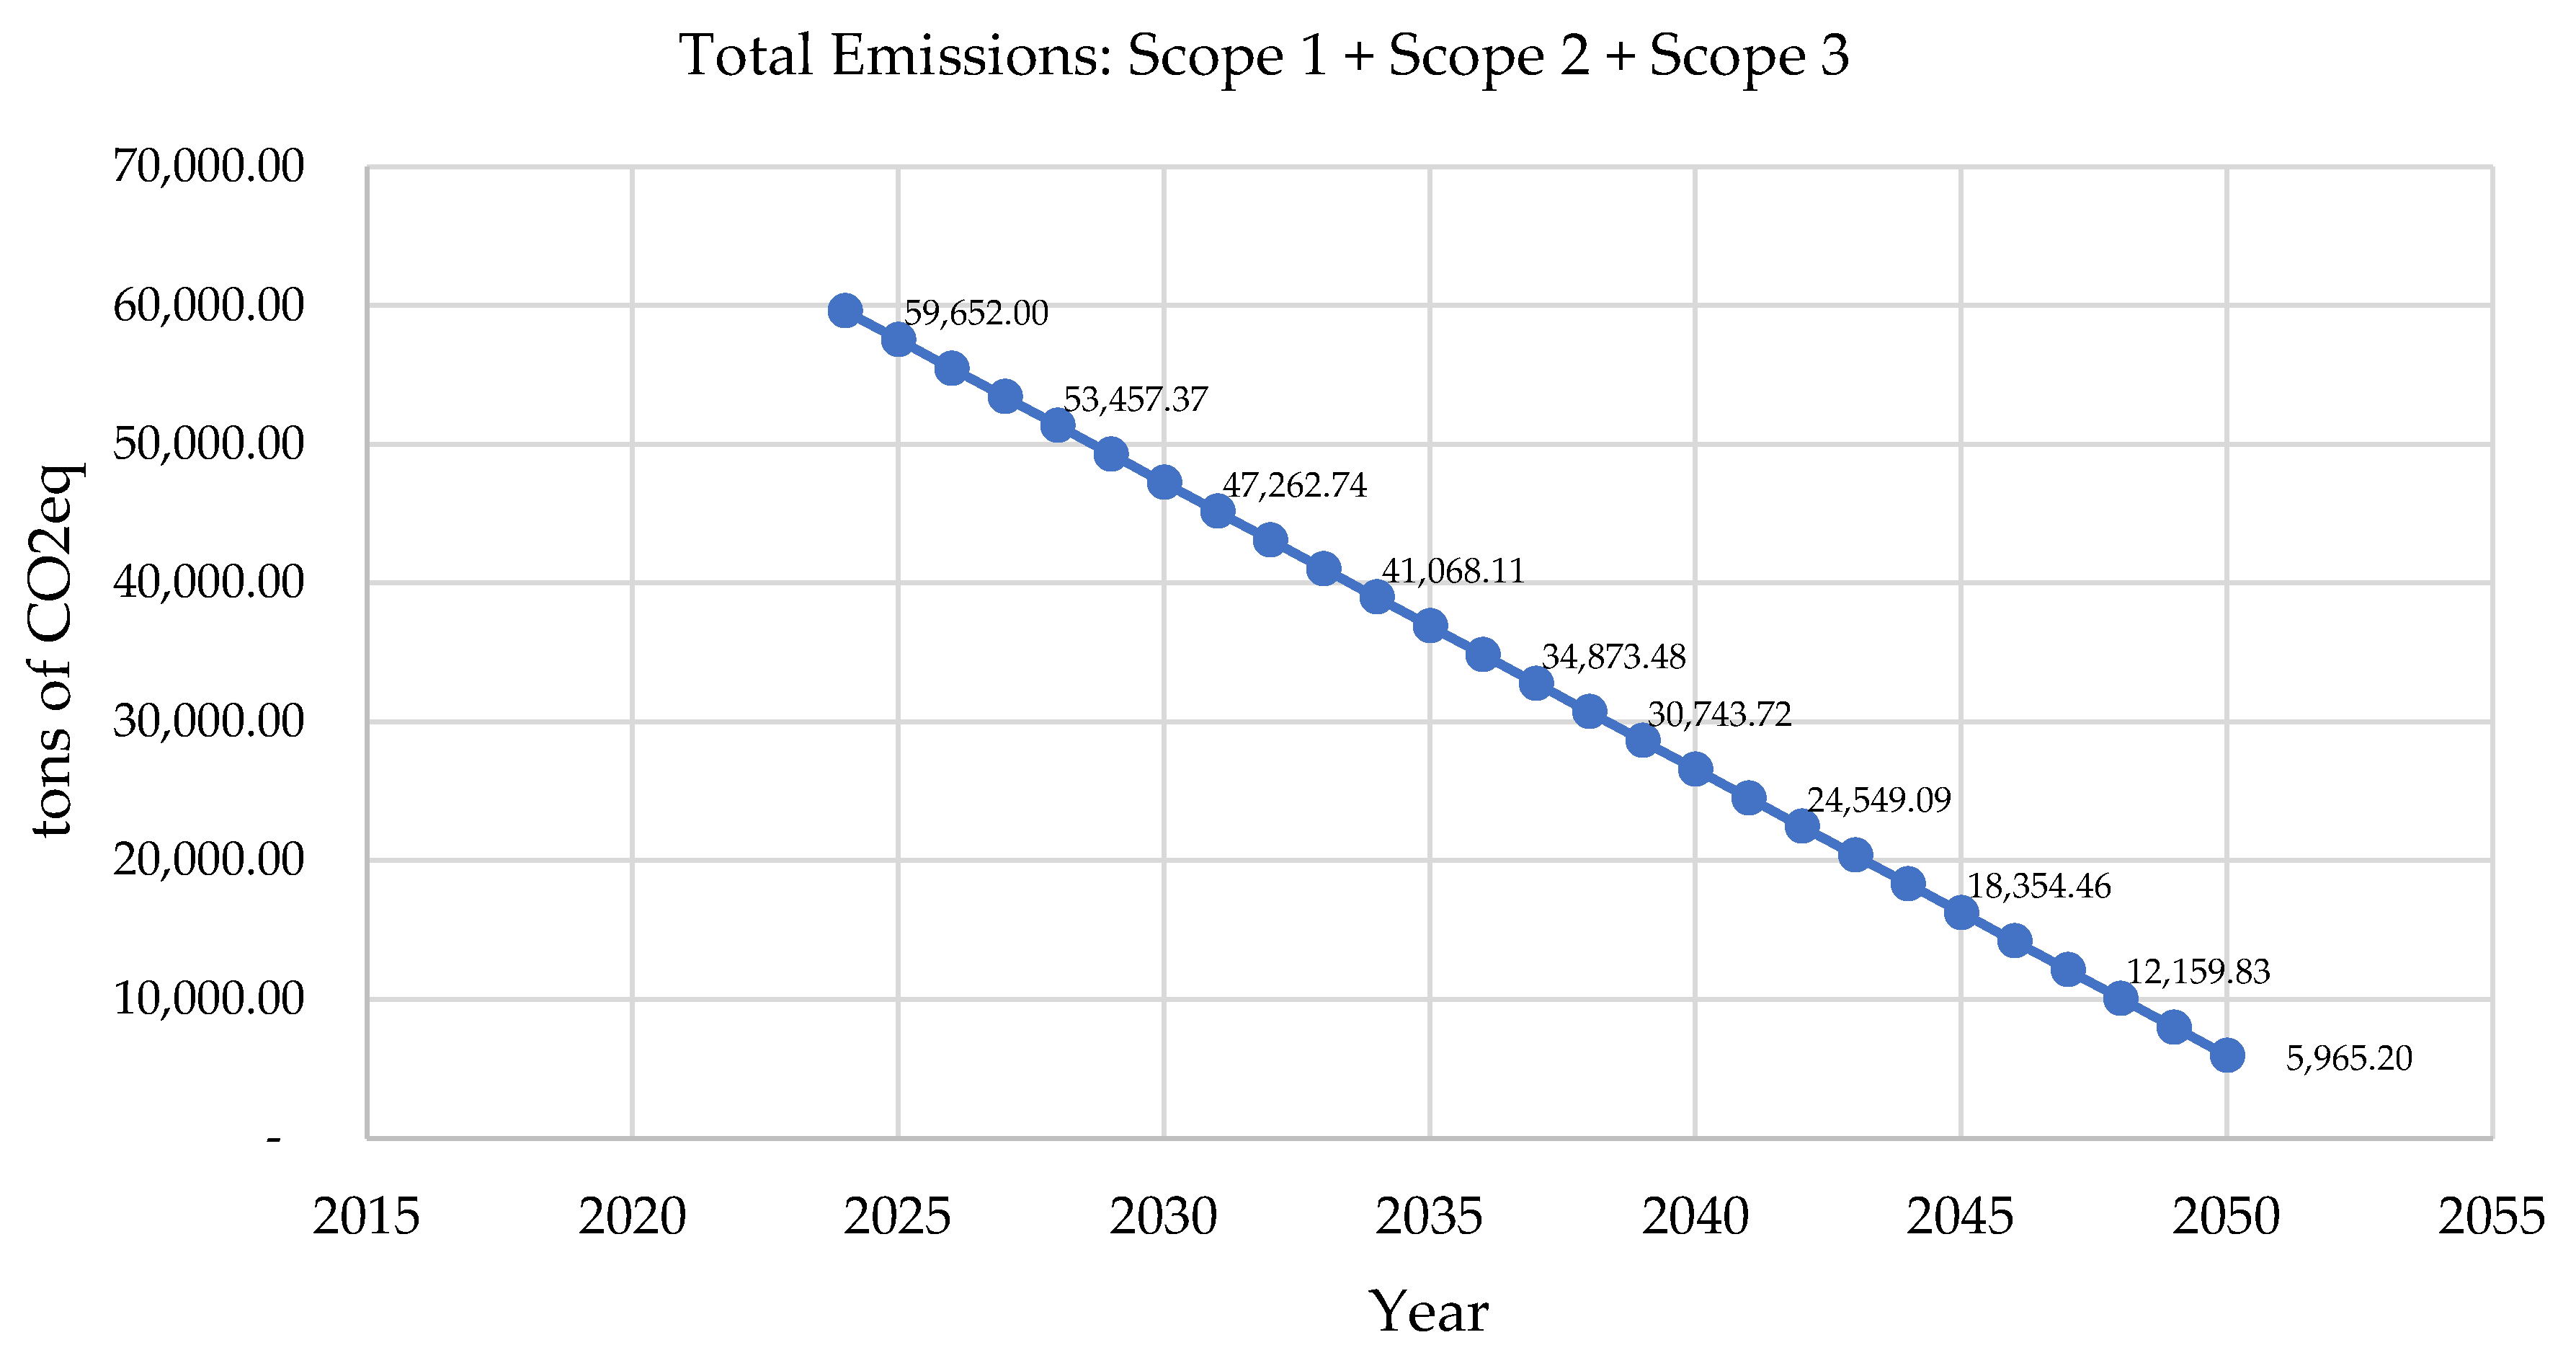
Under the Net-Zero Pathway target for 2050, greenhouse gas emissions must be reduced to 1269 tons of CO
2eq for Scope 1, 1540 tons of CO
2eq for Scope 2, and 5194 tons of CO
2eq for Scope 3, with the total emissions across all three scopes being reduced to 5965 tons of CO
2eq (
Figure 5).
An analysis of greenhouse gas (GHG) emissions across all three scopes identified the three highest-emitting activities: surimi procurement, which generated 20,844 tons of CO2eq (34.34%), followed by electricity consumption at 15,403 tons of CO2eq (25.82%), and the use of R507 refrigerant in the cooling system, contributing 9907 tons of CO2eq (16.61%). Therefore, the following strategies are proposed to reduce greenhouse gas (GHG) emissions across all three categories:
From the review of the current requirements, laws, and the possibility of reducing the organization’s greenhouse gas emissions, it was found that the organization can reduce their greenhouse gas emissions under Scope 1 by gradually changing the machinery and equipment in the freezing system and switching to ammonia instead of R507, which will not emit greenhouse gases. The plan allows five years for this change, which accounts for budget flexibility and ensures that the change does not affect production capacity.
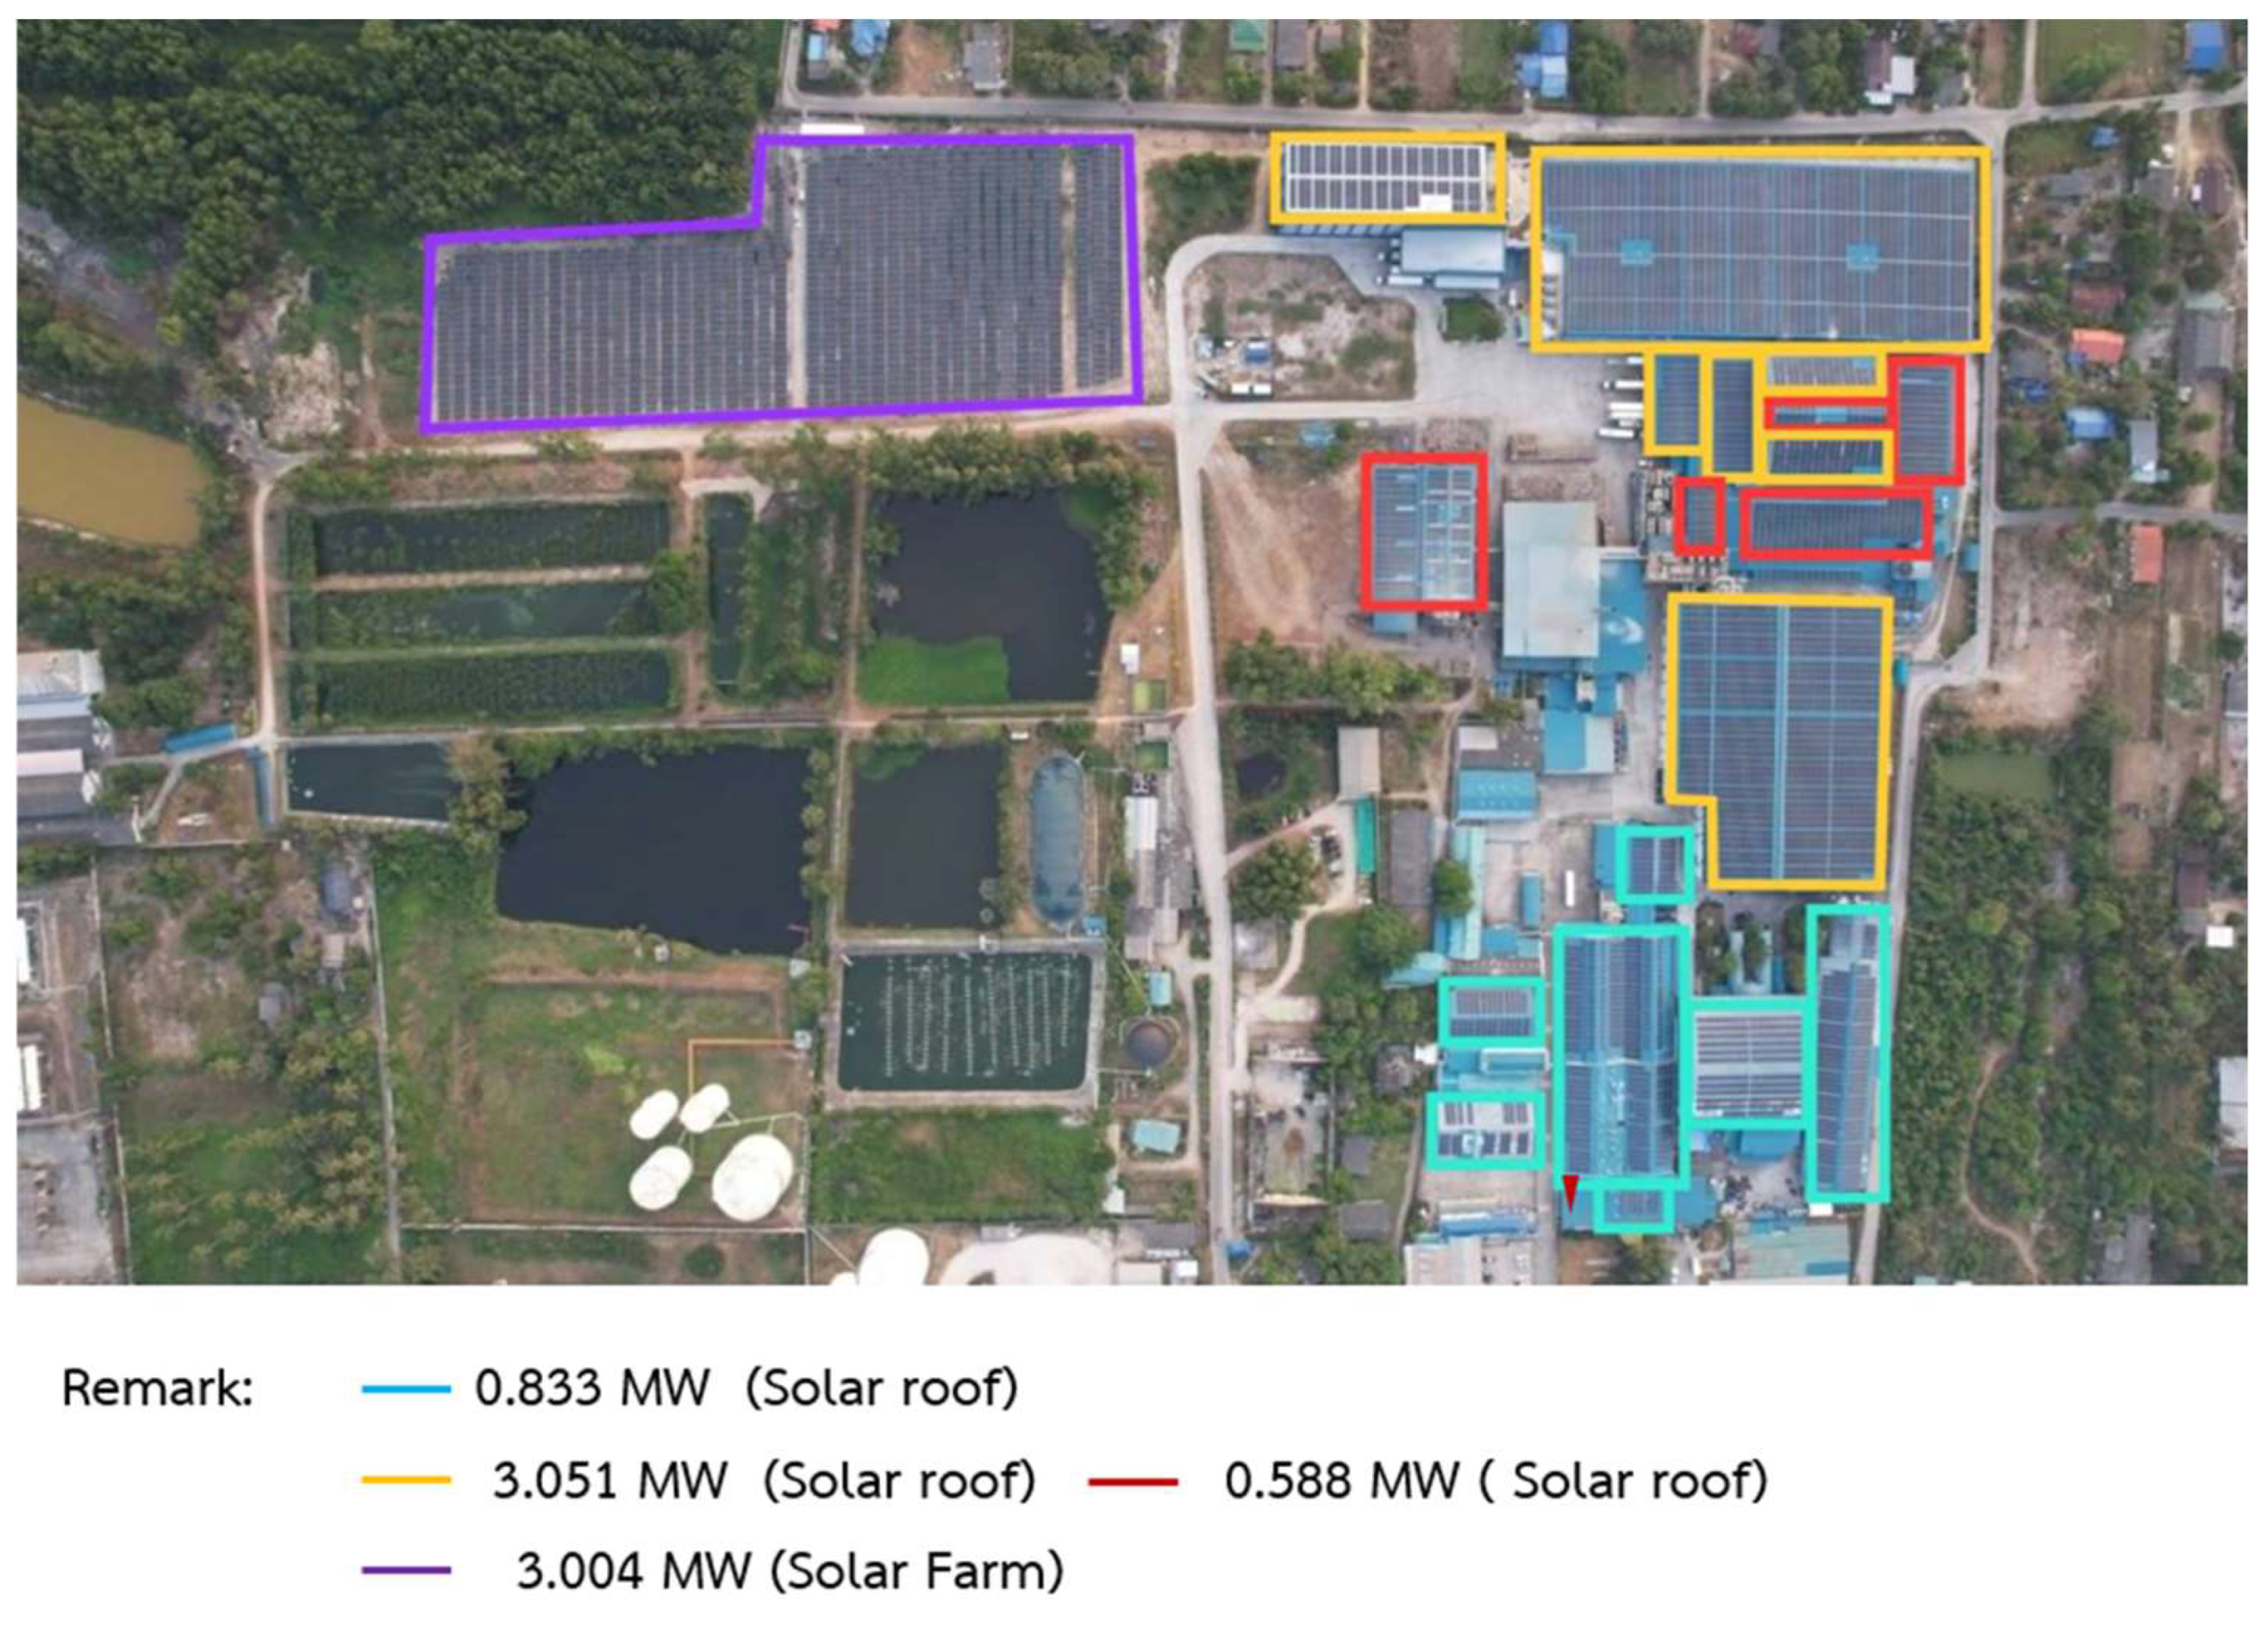
For Scope 2, greenhouse gas emission reduction can be achieved by using solar power. The organization has a roof area for installing rooftop solar power generators of 4.472 megawatts and a land area for installing ground-mounted solar power generators of 3.004 megawatts, totaling 7.476 megawatts. This can replace fossil-fuel-generated electricity by approximately 30 percent, reducing greenhouse gas emissions by 5000 tons of CO
2eq per year (
Table 3).
For Scope 3, greenhouse gas reduction mostly comes from purchasing the main raw material in the production process, which is minced fish. Therefore, it is necessary for the organization to cooperate with manufacturers in analyzing and reducing greenhouse gas emissions in the minced fish production process to reduce greenhouse gas emissions at the source (
Figure 6).
4. Conclusions and Discussion
This Carbon Footprint for Organization assessment serves as a crucial tool for identifying GHG emission sources and quantities from various activities. This study utilized 2024 as the base year and set the target year as 2050, with the goal of reducing GHG emissions to only 10% of the baseline level. The findings indicate that to achieve net-zero emissions, the organization must reduce emissions by 3.46% annually, allowing only 5965 tons of CO2eq to be emitted by 2050. To compensate for these remaining emissions, the organization will need to purchase carbon credits equivalent to 5965 tons of CO2eq.
This research on greenhouse gas emissions from a frozen seafood processing factory can also be applied to similar factories because they also have refrigeration processes and use a lot of electricity in their production and storage processes.
Developing GHG reduction strategies requires collaboration among all stakeholders to ensure long-term sustainability. If the organization is unable to achieve the required emission reductions through internal measures, it must consider enhancing its carbon sequestration efforts and offsetting its emissions through carbon credit mechanisms.
Proposals for further research should explore ways to reduce Category 3 greenhouse gas emissions, as these are not directly caused by the organization’s operational activities.


