Article

Analysis of Fluidization Quality in Oscillating Gas–Solid Fluidized Beds with Variable Diameter Structures

1
School of Chemical Engineering, Hebei University of Technology, Tianjin 300132, China
2
National and Local Joint Laboratory of Chemical Energy Saving Process Integration and Resource Utilization, Tianjin 300130, China
*
Authors to whom correspondence should be addressed.
Processes 2025, 13(6), 1778; https://doi.org/10.3390/pr13061778
Submission received: 9 May 2025 / Revised: 29 May 2025 / Accepted: 31 May 2025 / Published: 4 June 2025
(This article belongs to the Special Issue Multiphase Mass Transfer and Phase Equilibrium in Chemical Processes)

Abstract

In this study, the optimization of a gas–solid fluidized bed structure under oscillating conditions is carried out, and the traditional equal-diameter structure is improved to a variable-diameter structure. In this paper, a 300 mm diameter equal-diameter fluidized bed is taken as the benchmark model, and the research team uses numerical simulation to analyze the changing law of bubble size and the percentage of non-fluidized area. It is found that under the condition of the same gas volume, the “cone-contraction” fluidized bed with variable-diameter structure can reduce the bubble size by about 25% and the percentage of non-fluidized area by about 11%. The effects of the specific operating parameters are as follows: the operation of increasing the gas volume will lead to an increase in bubble size but will lead to a decrease in the percentage of non-fluidized area; the increase in the initial bed height will simultaneously increase the bubble size and the percentage of non-fluidized area; the increase in the amplitude of the oscillation will lead to an increase and then a decrease in the bubble size, and will lead to a continuous expansion of the percentage of non-fluidized area; and the change in the oscillation period will not have a significant effect on the two. A comparison of the experimental data shows that the overall performance of the variable-diameter fluidized bed is better than that of the equal-diameter fluidized bed, as shown in the following: the bubble size is reduced by 24~32%, and the percentage of non-fluidized area is reduced by 6~12%. This study provides an effective direction for the structural optimization of fluidized beds.

1. Introduction

China has vast sea areas and abundant marine oil and gas resources, and promoting their development and utilization is significant for ensuring energy security. Exposing offshore oil and gas resources to land for processing faces issues of long-distance transportation facilities and costs. Marine floating platforms represented by FPSO have strong adaptability to sea conditions and flexible mobility, making them suitable for deep sea, shallow sea, and marginal oil and gas field development. The direct cracking of crude oil and heavy oil to produce chemicals is a new trend in refining technology, and gas–solid fluidized bed reactors are key equipment. Applying corresponding processes and gas–solid fluidized bed technology to offshore floating platforms can not only expand platform functions and enhance the ability to develop and utilize offshore oil and gas resources but also achieve on-site conversion of raw materials, save transportation cycles and costs, and provide flexible energy supply for power equipment such as ocean-going ships.
Under the marine environment, the floating platform and its fluidized bed device are subjected to wave action, which generates undulation, translation, and oscillation, among which the platform oscillation has the most significant effect on the gas–solid flow [1,2,3,4,5]. Hao [6] revealed that the bubbles showed the characteristics of “wall aggregation” during the rising process through image analysis. Tian [7] experimentally confirmed the existence of a multi-fluid zoning phenomenon within the inclined bed. Huang [8] further found that the “intra-particle circulation” law in an oscillating bed/wall aggregation leads to the formation of large bubbles on the upper wall of the bed, and the multi-fluid partitioning and the internal circulation phenomenon together cause the non-fluidized zone on the lower wall, which combined significantly reduces the quality of the gas–solid fluidization and affects the efficiency of the reaction. Therefore, reducing the percentage of non-fluidized area, reducing the bubble size, and improving the fluidization quality of the whole bed are the key issues for applications in the marine environment.
To solve the above problems, internal components can be added to the fluidized bed, secondary air supply can be carried out to the fluidized bed, and the bed structure can be changed. Xu [9] simulated a swinging fluidized bed with added longitudinal internal components. The results showed that the longitudinal internal components’ horizontal support plate and cover hole structure could effectively break bubbles, promote radial mixing of gas–solid fluids, roll in rows inside and outside the curved surface, and suppress the aggregation behavior of gas–solid fluids on both sides of the vibration plane. Sarbanha [10] analyzed the fluid dynamics of a two-dimensional oscillating fluidized bed under different structural forms of internal components and found that a benchmark fluidized bed without internal components exhibited significant disturbances and uneven bubble distribution. The diamond-shaped inner component improves the distribution of porosity and reduces the size of bubbles, thereby enhancing overall stability. Vertical baffle internals improve gas distribution but reduce gas–solid mixing efficiency. The herringbone-shaped internal components enhance vertical mixing through complex flow patterns and maintain robust performance under different conditions. For the phenomenon that particles gather along the lower wall of the inclined bed, blowing secondary gas into the particle accumulation area is the most direct method [11,12], but the device attitude will change dynamically at any time. The position and volume of secondary air need to be adjusted accordingly, which is difficult to control in industrial applications. Hu [13] revealed that when the bottom angle of the conical section is small, the bubble splitting is significant and the size is reduced, and the gas–solid contact area is increased; if the bottom angle is too large, it exacerbates the mixing of particles back to the side wall and increases the probability of bubble merging. Numerical simulation by Chen [14] shows that the particle accumulation at the bottom of the bed decreases under supercritical gas velocity, and more particles enter into the middle and upper reaction section, and the percentage of non-fluidized area decreases. Theoretical studies by Zhao [15] showed that the conical bed cross-sectional area increases with height resulting in an axial decrease in apparent gas velocity. This flow rate gradient causes bubbles to undergo shear splitting in the variable-size region; the high-flow rate region of the conical bed can fully fluidize large particles, and the low-flow rate region can inhibit the carry-over of fine particles, thus realizing full-bed fluidization. Sau [16] pointed out that a smaller cone angle can reduce the fluctuation of the local pressure drop and inhibit the tendency of bubble merging through the establishment of an empirical correlation equation of the maximum pressure drop of the conical bed.
This article addresses the problem of reduced gas–solid fluidization quality in oscillating fluidized beds operating in marine environments. Leveraging the unique advantages of variable-diameter fluidized beds [17,18,19], this study employs numerical simulation methods. These methods are used to compare the fluidization quality between variable-diameter and equal-diameter-structured fluidized beds, and to determine the specific structural configurations and underlying mechanisms of the variable-diameter design. The influence of operating conditions on the fluidization quality of variable-diameter fluidized beds is explored. The findings aim to provide insights and guidance for the structural design of gas–solid fluidized beds, thereby enhancing their operational efficiency and stability in complex marine environments.

2. Simulation Model

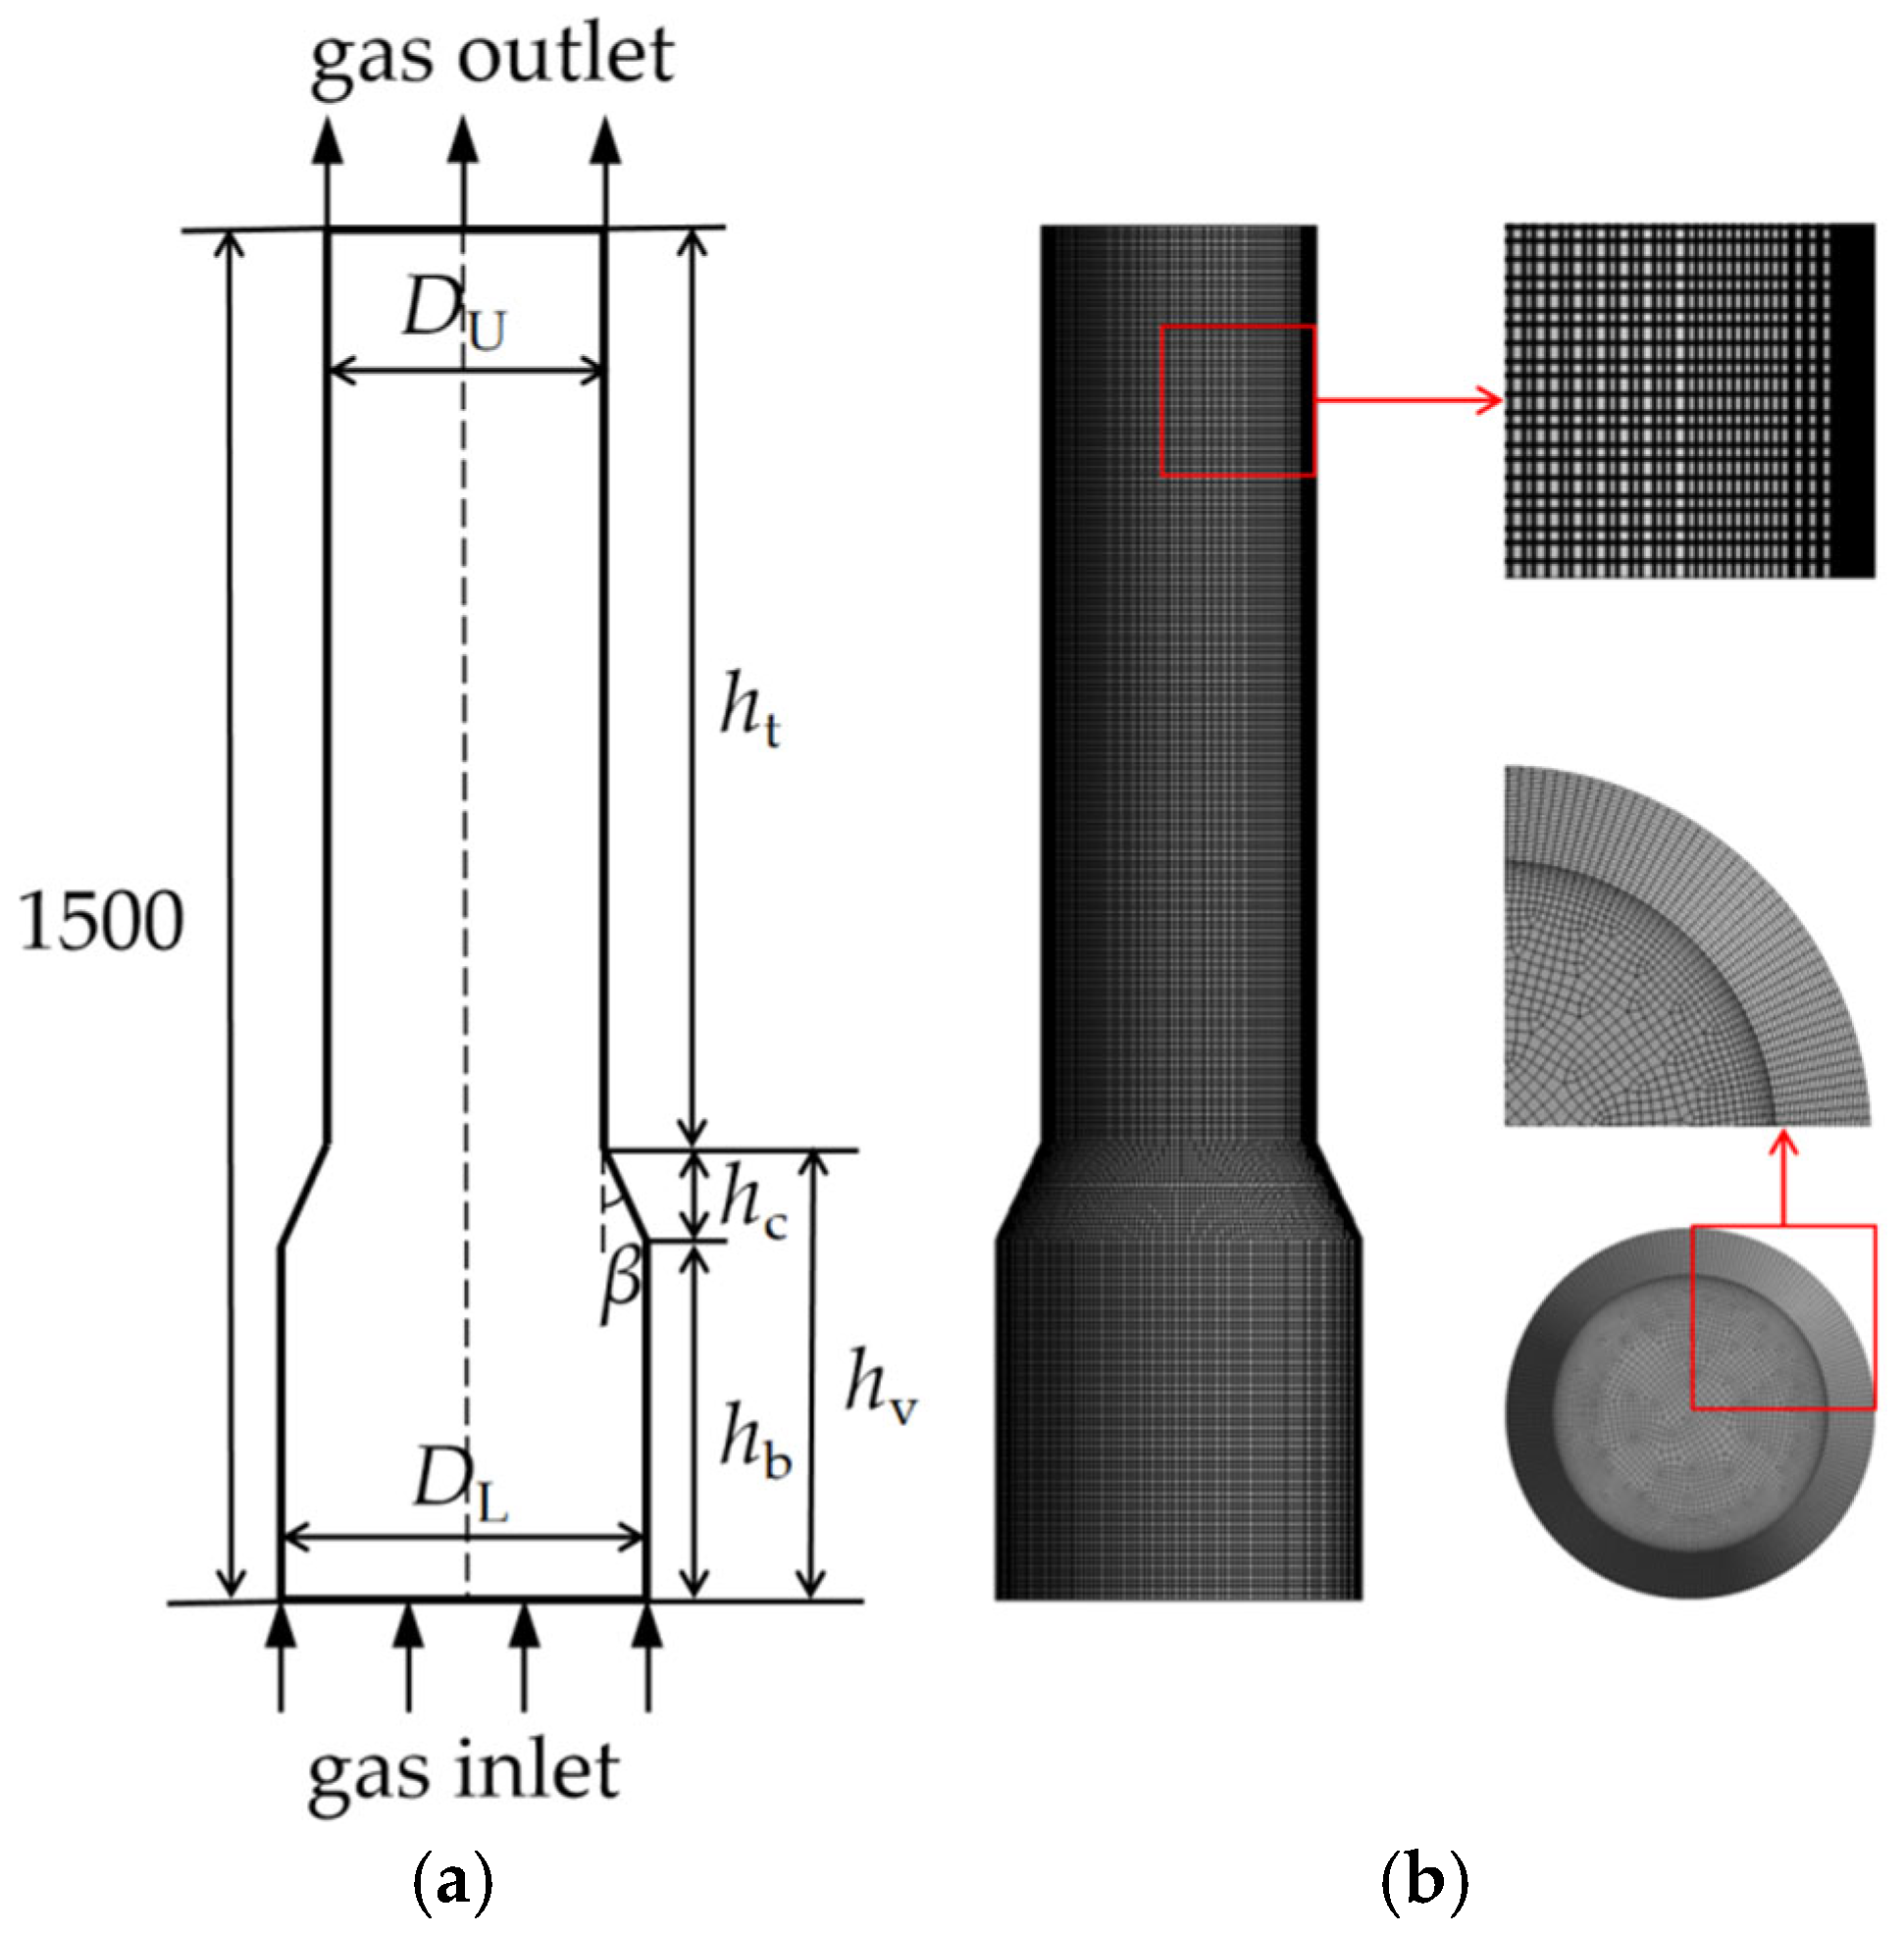
2.1. Geometric Model and Grid Division

The geometric model and mesh division were completed using Ansys Workbench, as shown in Figure 1. Figure 1a is a schematic diagram of the geometric model of a variable-diameter fluidized bed. The lower section of the bed is the gas inlet, and the upper section is the gas outlet, with an overall height of 1500 mm. The diameter of the lower section of the variable-diameter fluidized bed is DL = 400 mm, the diameter of the upper section is DU = 300 mm, the height of the lower equal-diameter section is hb = 293 mm, the height of the middle cone section is hc = 107 mm, the height of the upper equal-diameter section is ht = 1100 mm. The angle between the cone generatrix and the vertical direction is β = 25°. The grid division is shown in Figure 1b; a hexahedral structured grid is selected, and the boundary layer of the model wall is densified. The bottom grid height of the boundary layer is 1 mm, the growth rate is 1.2, and the number of layers is 8. The modeling and meshing methods for fluidized beds with other structural dimensions in this article are the same as those in this example and will not be further introduced here.

2.2. Mathematical Model

2.2.1. Control Equation

This study uses the Euler two-fluid theory framework and the ANSYS Fluent 19.2 numerical simulation platform to conduct multiphase flow simulations. In this model, the gas phase is treated as a continuous medium. In contrast, the discrete particle phase is equivalent to a continuous quasi-fluid medium that permeates with the gas phase through a quasi-fluidization method. This modeling method is based on the following core assumptions: the macroscopic physical quantities of the particle quasi-fluid (including velocity field, temperature field, pressure field, etc.) exhibit continuous distribution characteristics in the spatial domain, and their spatiotemporal evolution process satisfies local equilibrium conditions. Based on this assumption of dual continuous media, gas–solid two-phase systems can be coupled and solved through a unified system of conservation equations (including mass conservation Equation (1) and momentum conservation Equation (2)) to obtain the spatiotemporal distribution characteristics of flow parameters for each phase.
ρ i ε i t + ρ i ε i u i = 0
ε i ρ i u i t + ε i ρ i u i u i = ε i p K g s u i u j + τ i ¯ ¯ + ε i ρ i f
In the formula, subscripts i = g and s represent the gas phase and solid phase, respectively; ρ is the density; ε is the volume fraction; u is the speed; j = g, s, jI; Kgs is the interphase drag coefficient; f is a gravity control function, the swing is achieved by adjusting the direction and magnitude of gravity; τ ¯ ¯ represents the stress–strain tensor, which can be calculated by Equation (3).
τ i ¯ ¯ = ε i μ i u i + u i T + ε i λ i 2 3 μ i u i I ¯ ¯
This study focuses on the investigation of B-class particles. When determining the calculation model for the drag force between gas–solid phases, existing research results [20,21,22] were referenced, and the Gidaspow model was selected as the calculation basis for the two-phase interaction force, as shown in Equations (4)–(6).
K g s = 3 ε s ε g 2.65 ρ g 4 d p C D μ s μ g , ε g > 0.8 150 ε s 1 ε s μ g ε g d p 2 + 1.75 ε s ρ g μ s μ g d p , ε g 0.8
Re s = ρ g d p u s u g μ g
C D = 24 α g Re s 1 + 0.15 ( ε s Re s ) 0.687 , Re s 1000 0.44 , Re s > 1000

2.2.2. Gravity Control Function

Before numerical simulation, determining the fluidized bed’s oscillation direction is necessary. Here, the bed is set to oscillate left and right along the x direction, with the starting point of oscillation t = 0 s being the moment when the bed is at an instantaneous oscillation angle of 0°. The instantaneous oscillation angle θ of the bed, when it is in a proper leaning posture, is defined as “+”, and when it is in a left-leaning posture, it is defined as “−”; When the bed moves to the right, the instantaneous angular velocity ω is “+”, and when it moves to the left, it is “−”, as shown in Figure 2a. The oscillation trajectory of the fluidized bed is as follows: from upright right to maximum angle → left back upright → continue to swing left to maximum angle → right back upright.
Equations (7) and (8) show the equations for instantaneous swing angle and instantaneous angular velocity, and Figure 2b illustrates the corresponding relationship between the curve changes of the two during each cycle.
θ t = Θ sin 2 π T t
ω t = 2 π T Θ cos 2 π T t
Considering that the ship’s roll and pitch motions significantly impact the flow characteristics of the medium inside the upper equipment, in contrast, the bow and translational motions have relatively small effects and can be ignored; this study will focus on the simulation analysis of fluidized bed roll or pitch oscillation conditions. In the simulation process, changing the gravity term is used to achieve the bed-swinging effect equivalently, specifically by writing user-defined functions (UDF) and adding corresponding programs in the ADJUST module to set parameters for swing conditions. Simultaneously combining the calculation formulas for instantaneous swing angle and instantaneous angular velocity (Equations (7) and (8)), derive the calculation formula for the gravity term in the momentum conservation equation (Equation (9)) to accurately simulate the flow field characteristics under swing conditions.
f = f x = g sin θ t = g sin Θ sin 2 π T t f z = g cos θ t = g cos Θ sin 2 π T t

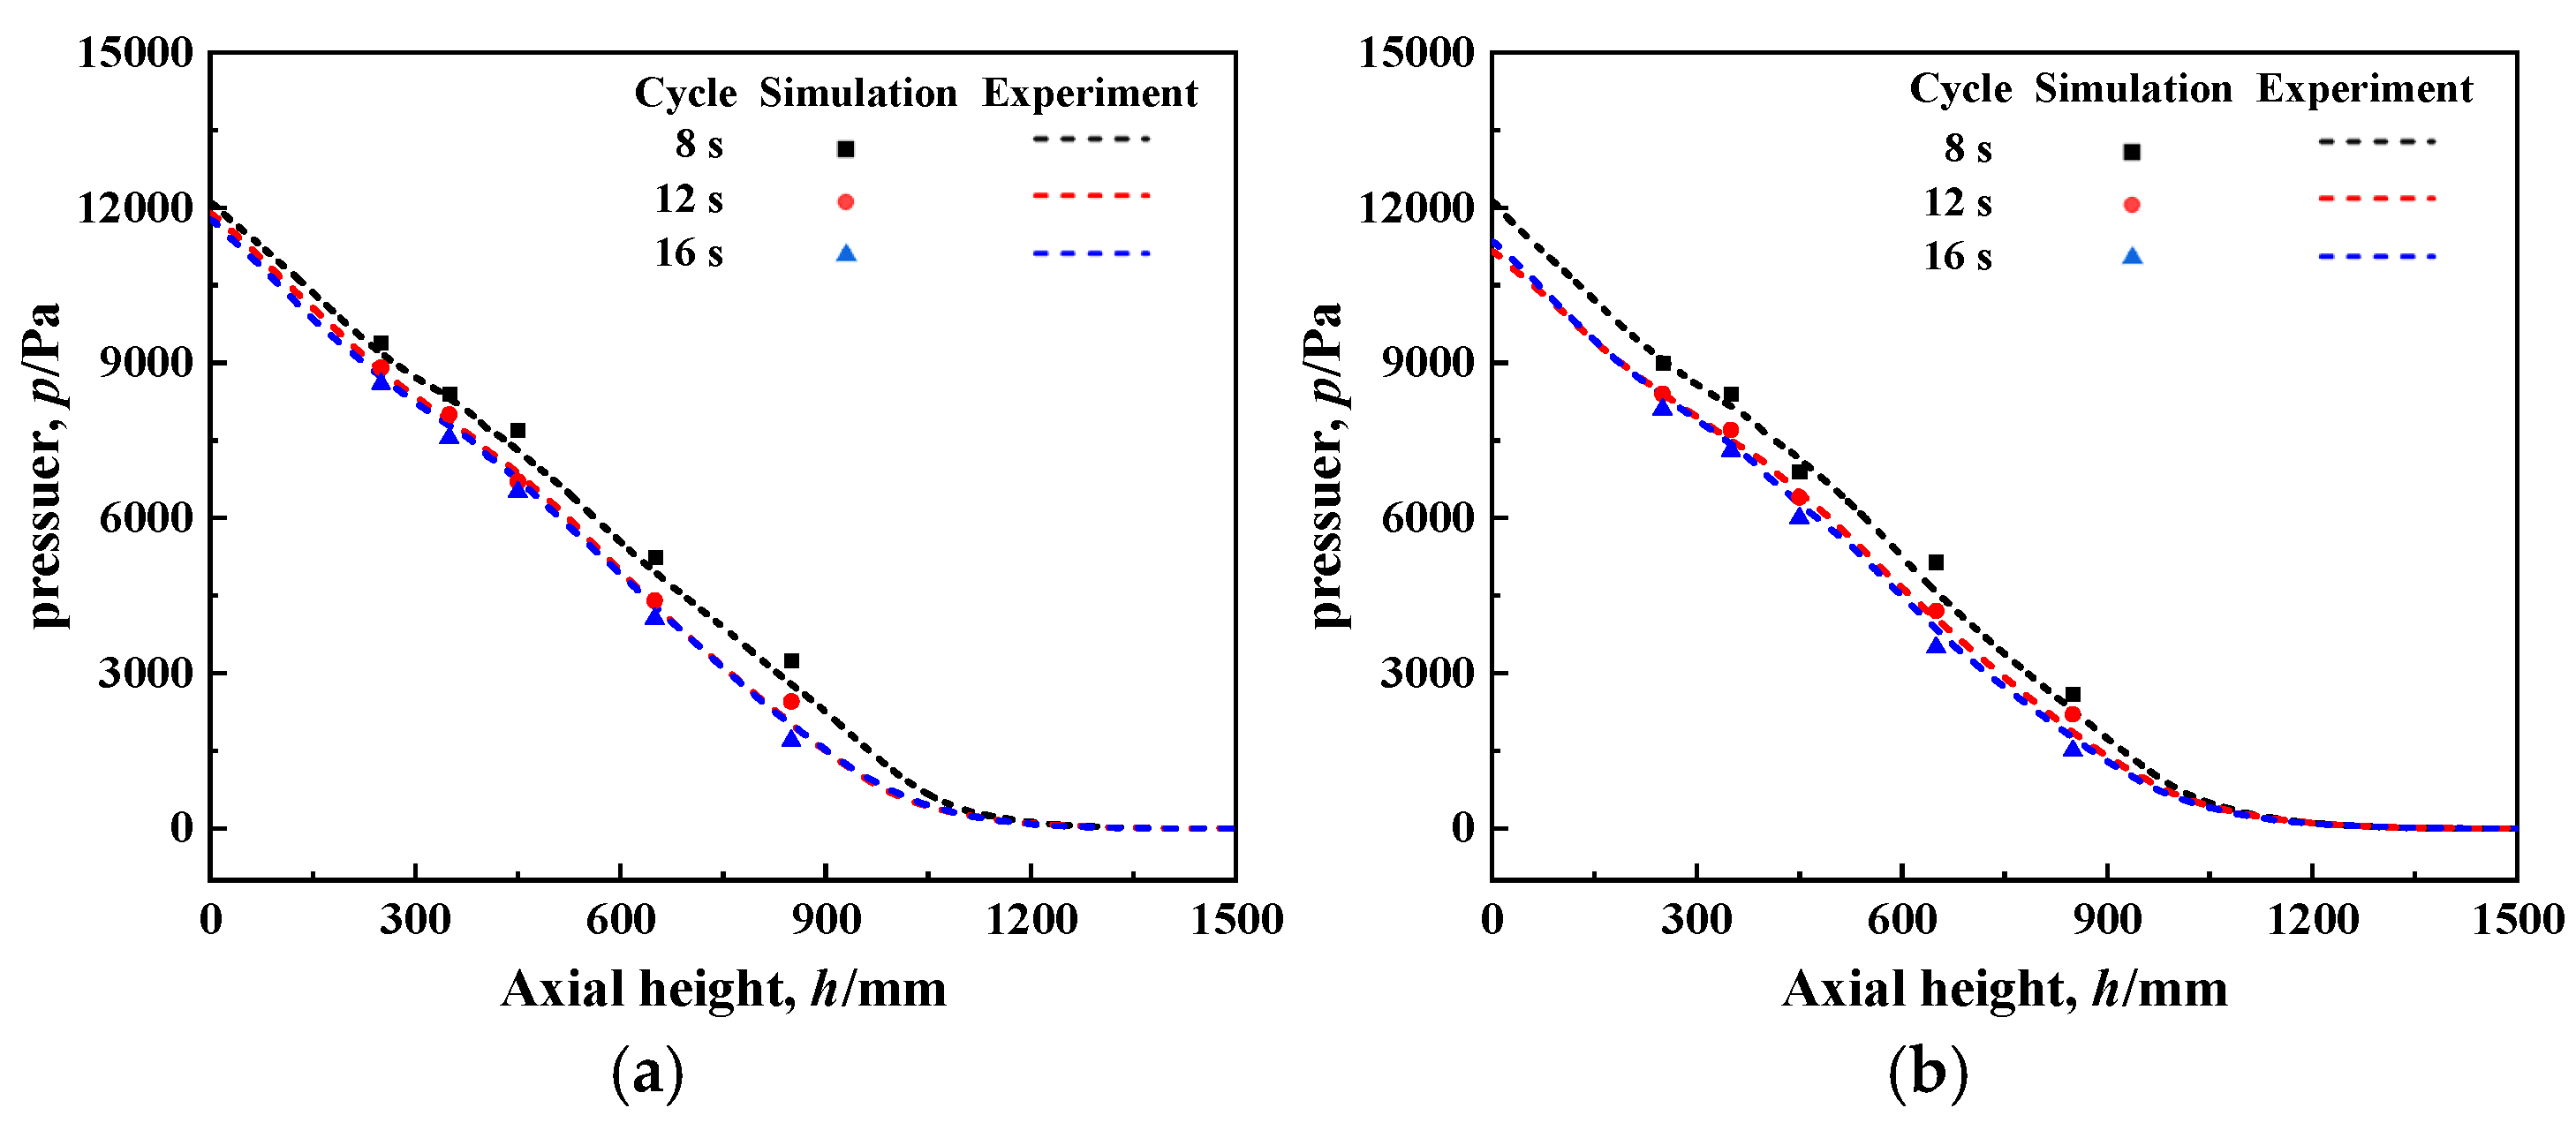
2.3. Grid Independence Verification and Model Validation

On the basis of the group’s previous study [9], members of the group experimentally verified the flow field distribution and axial pressure change characteristics of an equal-diameter fluidized bed (EDFB) under different oscillation periods and amplitude conditions. In this study, we focus on experiments conducted in a variable-diameter fluidized bed (VDFB) system, performing comparative validations between the experimental setup and its corresponding equal-scale numerical model. The experimental system employed ambient air (density ρg = 1.205 kg/m3, dynamic viscosity μg = 1.79 × 10⁻⁵ Pa∙s) and Geldart B spherical glass beads (particle density ρp = 2496 kg/m3, bulk density ρb = 1523 kg/m3, mean diameter dp = 0.57 mm). Operating parameters were configured with gas flow rate Q = 136 m3/h (yielding superficial velocities ug = 0.53 m/s in the equal-diameter bed, ugl = 0.30 m/s in the lower equal-diameter section, and ugu = 0.53 m/s in the upper equal-diameter section of the variable-diameter bed), oscillation period T = 8 s, amplitude Θ = 10°, and initial bed height H = 800 mm. Grid independence analysis was performed for both configurations using mesh sizes from 5.0 to 7.5 mm. The equal-diameter bed exhibited mesh counts of 1,634,702, 1,122,488, 813,124, 627,880, 534,435, and 459,726, while the variable-diameter bed showed 1,804,258, 1,459,964, 1,027,686, 907,076, 667,164, and 578,952 meshes corresponding to these grid sizes. Figure 3 demonstrates that pressure drop fluctuations stabilized at 6.0 mm grid size for the equal-diameter bed and 6.5 mm for the variable-diameter bed. Based on the optimal balance between computational accuracy and resource demands, these critical grid resolutions (6.0 mm for equal-diameter and 6.5 mm for variable-diameter configurations) were adopted for subsequent simulations.
In the experimental study, five pressure measurement points were set up sequentially along the axial direction of the bed with the corresponding axial heights of 250, 350, 450, 650, and 850 mm based on the above model and method and the numerical simulation of the gas–solid oscillating fluidized bed with variable-diameter structure was carried out, and the experimental data of the axial distribution of the bed pressures under different oscillation conditions were compared and analyzed with the simulation results (Figure 4). The experimental data of bed pressure distribution along the axial direction under different oscillation conditions were compared with the simulation results (Figure 4). As can be seen from Figure 4, under the conditions of different oscillation amplitudes and periods, the axial pressure trends obtained from experiments and simulations are consistent with each other, showing a decreasing law with the increase in height, and the relative errors of the two are kept within ±10%. The deviation between the experimental and simulation results mainly comes from the measurement system error and model simplification processing, and the error range is in the conventional interval of gas–solid fluidized bed research (usually 10%~15%), which is in line with the acceptable standards in the field.
In order to facilitate the comparison of the position and shape of bubbles under different swing conditions, the solids cloud map obtained from the simulation is color-simplified, and a suitable solids threshold is selected (generally defining the region of solids less than 0.15 in the bulging bed as a bubble) [23,24,25] to obtain the blue and yellow bicolor map as shown in Figure 5.
Figure 5 shows the moment when the bed is at the maximum moment of the instantaneous swing angle to the right, and the flow characteristics presented by the bed include the particle aggregation and accumulation region on the right side and the gas-phase aggregation region on the left side. By comparing the experimental and simulated images of the gas–solid fluidized bed under different swing parameters (period/amplitude), the results show that the bubbles are gathered along the upper wall of the bed, and the size increases with the increase in the axial height; there are no bubbles in the lower wall area, which confirms that the particles are in the state of dense accumulation. It can also be clearly observed by comparison that the location and shape of the large bubbles in the experimental images are similar to the simulation results, and therefore, the experiments and simulations are consistent for the typical gas–solid flow phenomena in an oscillating fluidized bed.
Therefore, from the combined viewpoint of Figure 4 and Figure 5, the above model can be used in this study to simulate the gas–solid two-phase flow characteristics in a variable-diameter fluidized bed under oscillating conditions, and the results meet the accuracy requirements.

2.4. Establishment of Quality Evaluation Indicators for Oscillating Fluidized Bed Fluidization

The main reason for the decrease in fluidization quality is the accumulation of large bubbles on the upper wall of the inclined bed due to the gas phase in the oscillating fluidized bed and particles on the lower wall of the inclined bed to form non-fluidized areas. Therefore, bubble size and the percentage of non-fluidized area are selected as quantitative indicators for measuring and comparing fluidization quality.

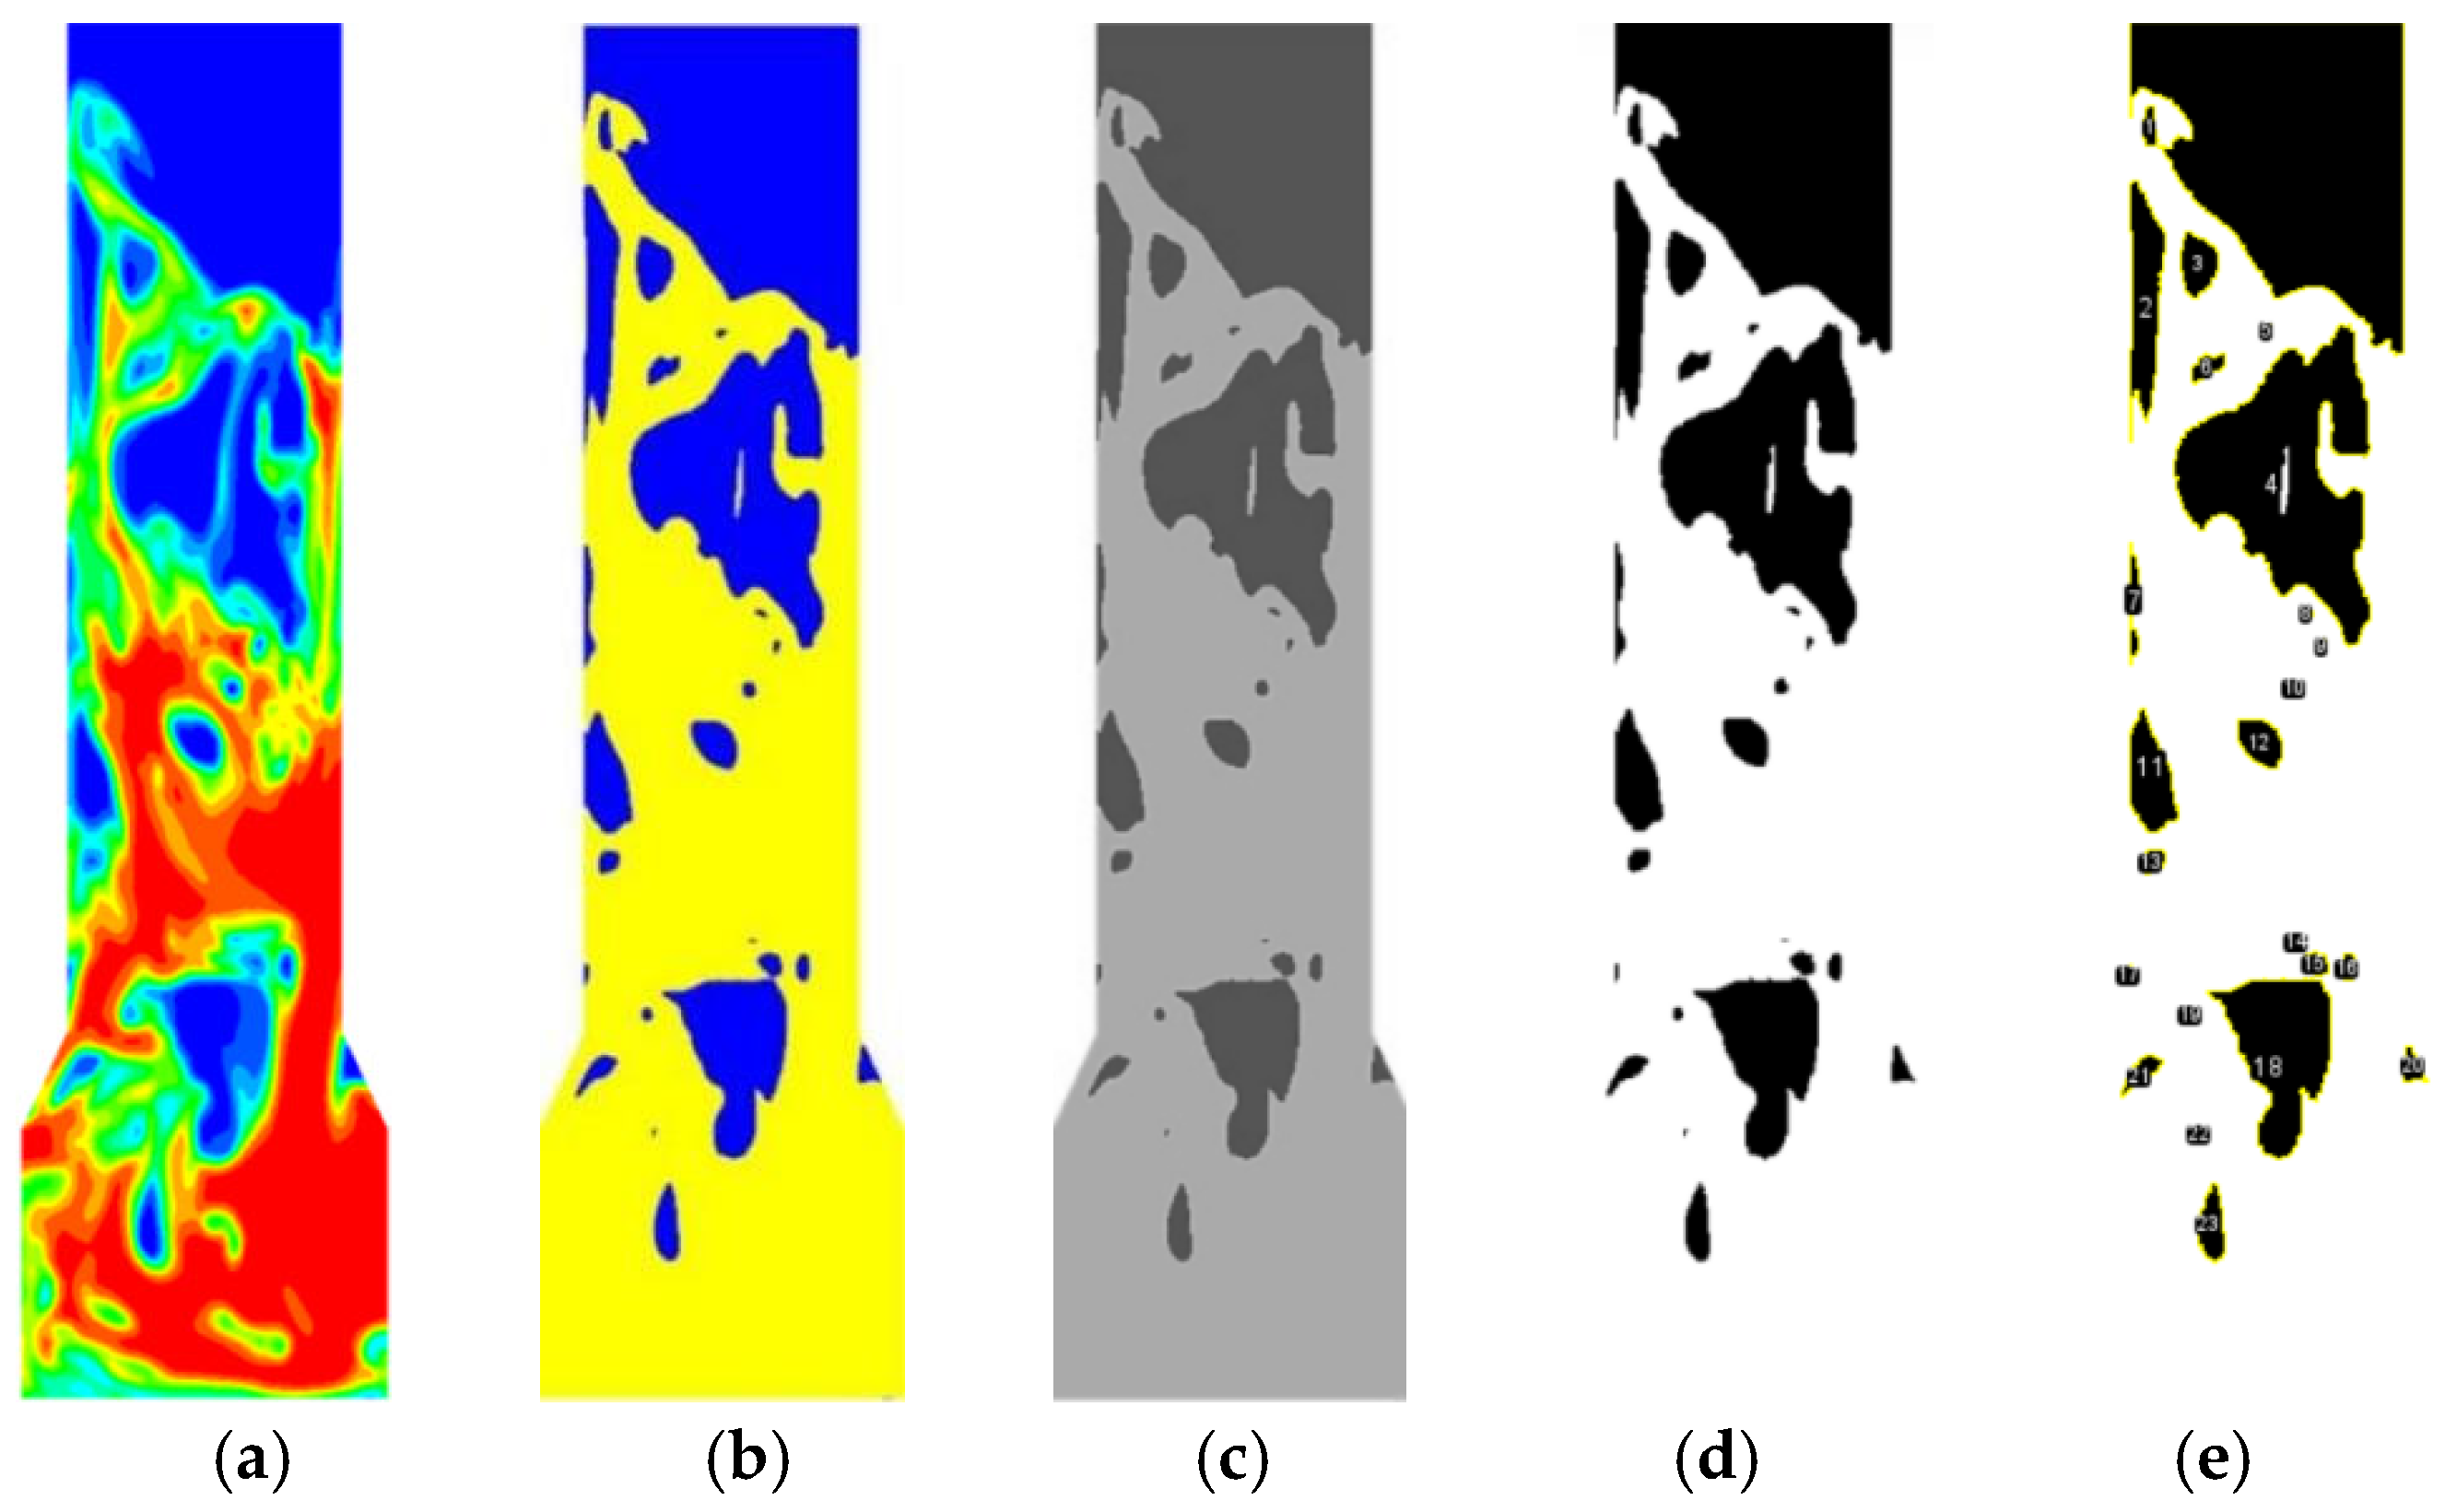
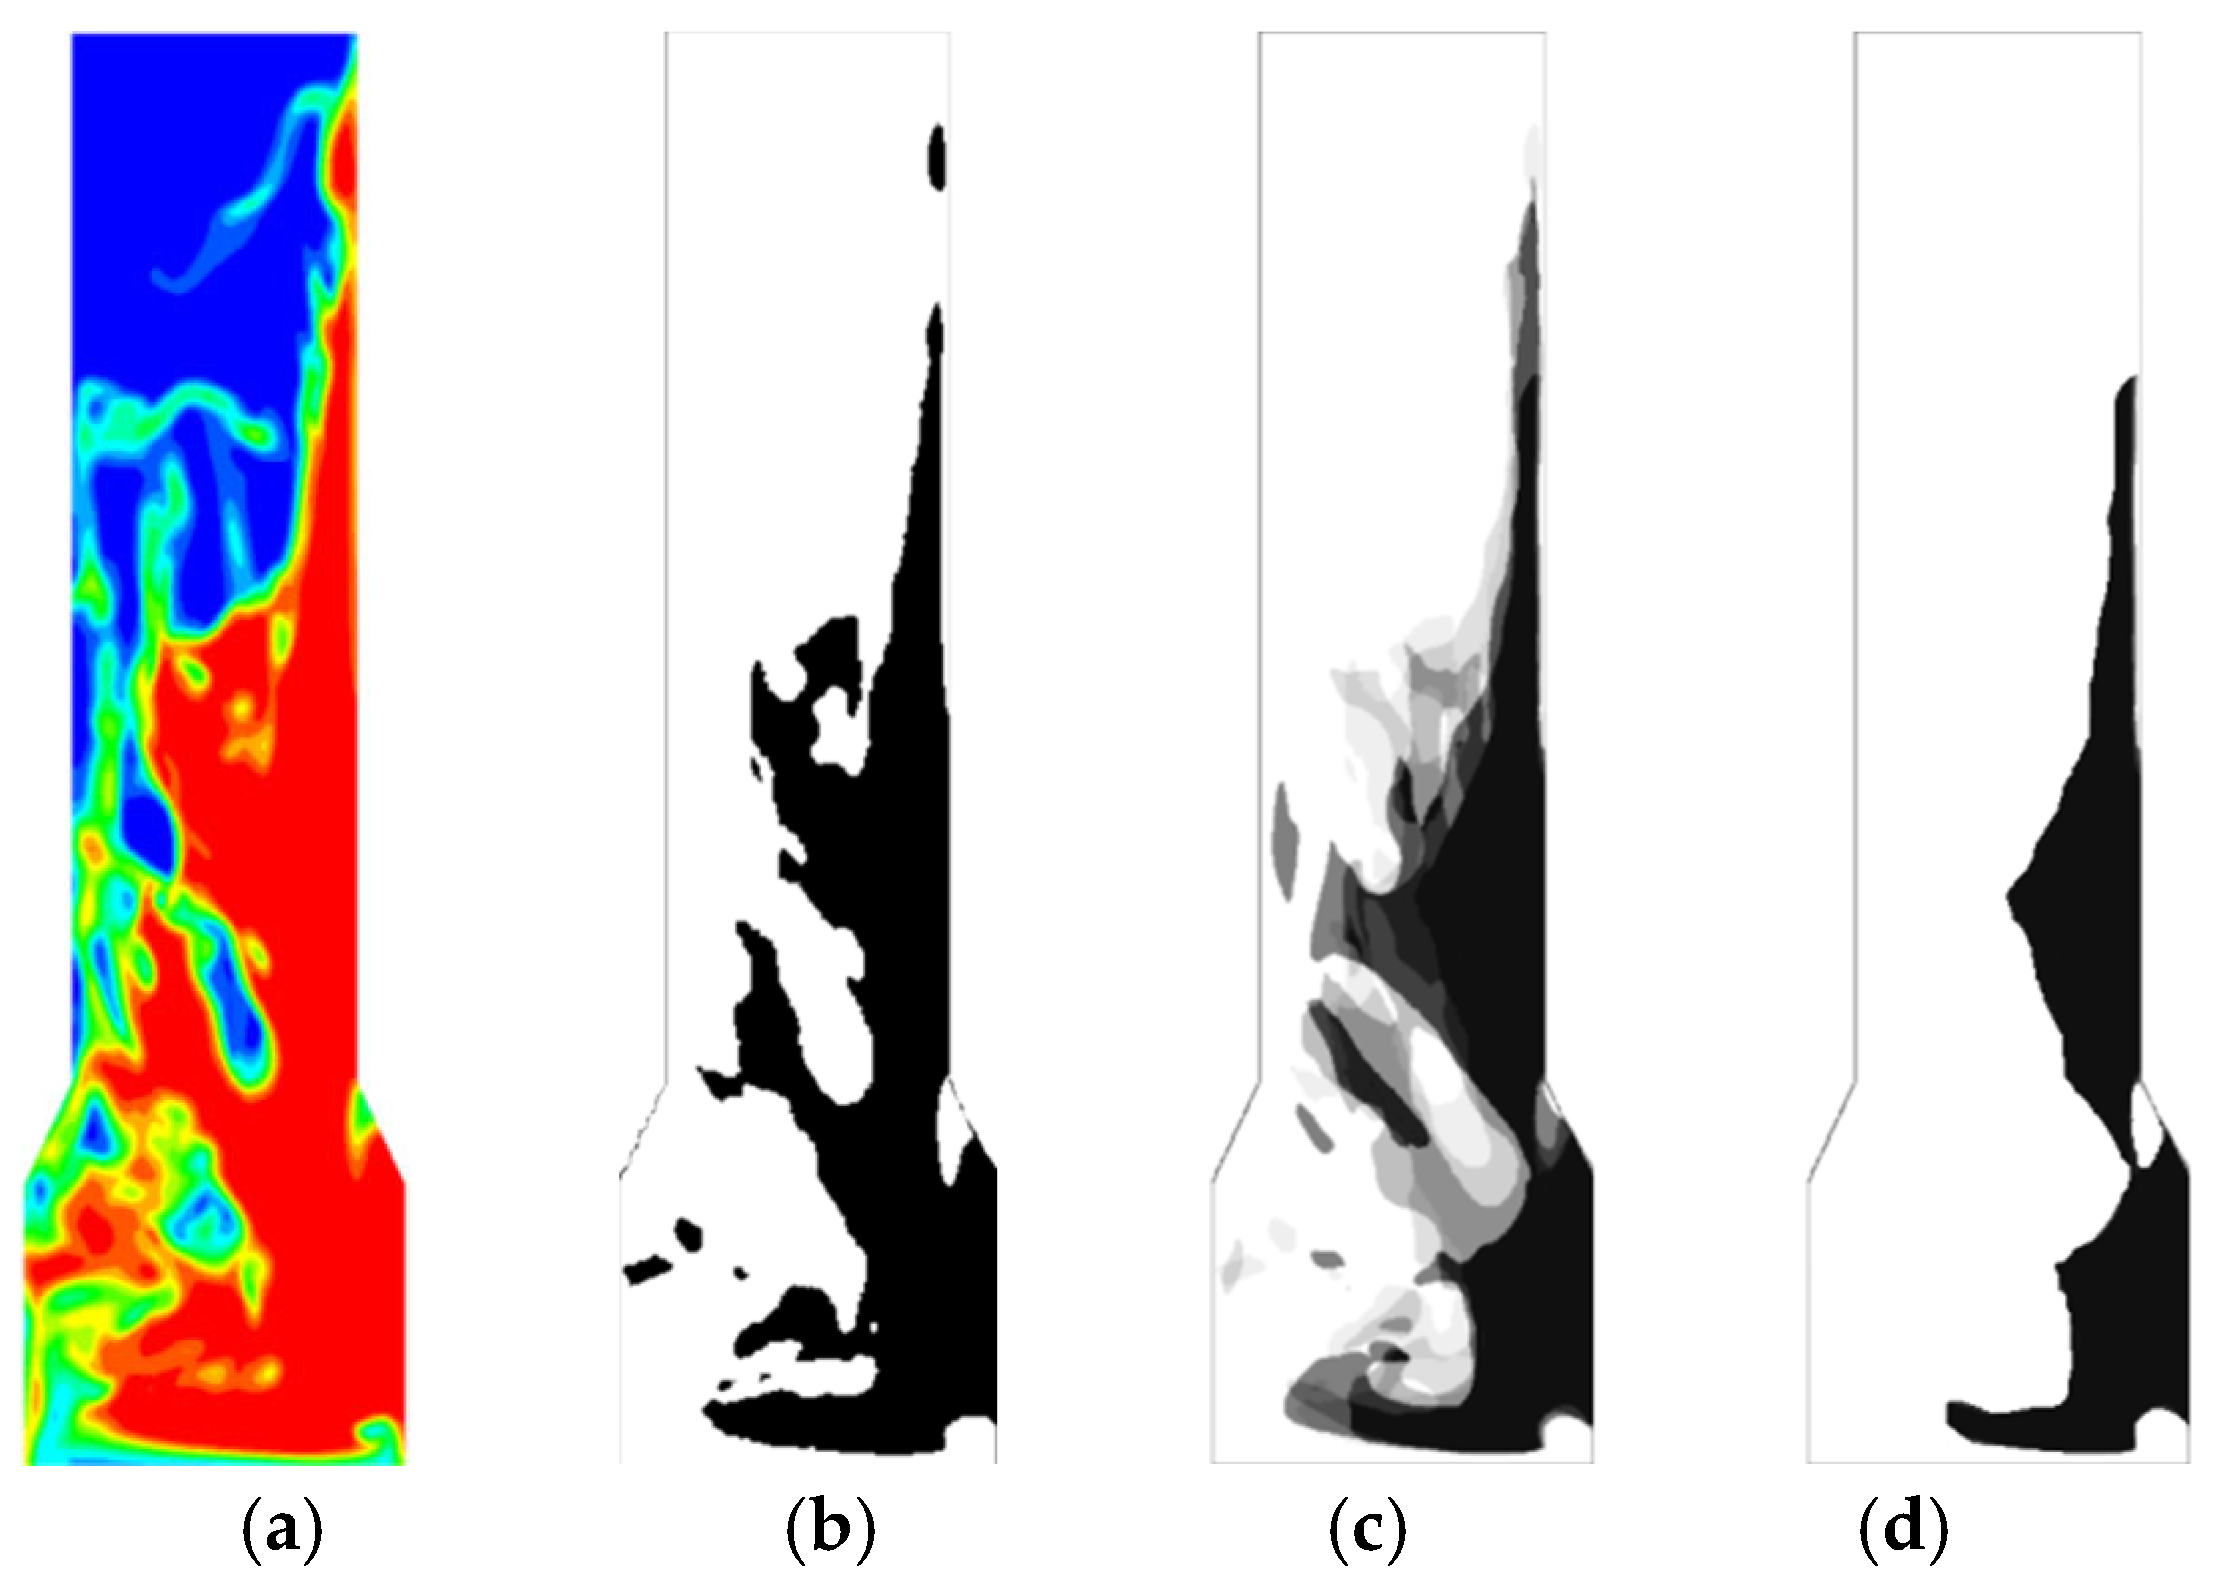
2.4.1. Method for Determining Bubble Size

Quantitative analysis was conducted on bubbles’ size, shape, and position to investigate the influence of bubble characteristics on fluidization quality in oscillating gas–solid fluidized beds. Tecplot and Image software were used to batch-process the images. The specific steps are as follows: (1) Select a suitable solid content threshold from the solid content distribution map shown in Figure 6a (generally defining the area with a solid content less than 0.15 in the bubbling bed as bubbles), and obtain a two-color chart as shown in Figure 6b; (2) Import the dual color image into Image for image recognition, perform grayscale processing on the image as shown in Figure 6c, and then adjust the appropriate grayscale values (set the grayscale values of the pixels on the image to 0 or 255) to obtain a binary image as shown in Figure 6d; (3) By using edge detection algorithms to determine the edges of bubbles, the total number n of bubbles and the area Si of the i-th (n = 1, 2, 3, …, n) bubble can be obtained, as shown in Figure 6e.
Next, calculate the average bubble diameters in each image. The specific steps are as follows: (1) Calculate the total area: the number of bubbles in an image is n, and the area of the i-th bubble is Si. The total area of this batch of bubbles is obtained by adding up the areas of all individual bubbles, as shown in Equation (10). (2) Calculate the area ratio: After obtaining the total area, calculate the area ratio ωi of each bubble, as shown in Equation (11). (3) Convert the diameter of a single bubble: Perform spherical approximation on the bubble and characterize its size through the equivalent diameter of the bubble. The area equivalent diameter di of the bubble can be obtained by formula (12). (4) Calculate weighted average diameter: Based on the weighted average principle, each bubble’s diameter is weighted and summed according to its area proportion, as shown in Equation (13).
S t o t a l = i = 1 n S i
ω i = S i S t o t a l ( i = 1 , 2 , , n )
d i = 4 S i π
D ω = i = 1 n ω i d i
To improve the accuracy of the data, four characteristic moments (two for each cycle) with equal absolute values of the angle with the vertical direction were extracted when the bed swung from the right and left limit positions to the upright state during two complete swing cycles. For the numerically simulated solidity images of these four moments, the average diameter of the bubbles was calculated for each image using image processing methods. The four bubble mean diameters are then quadratically averaged to obtain Dave. Dave is the bubble mean diameter of the bed at the instantaneous pendulum angle θ. This is a key parameter to quantify the bubble size, which can intuitively reflect the overall size of bubbles under working conditions and provide core data for analyzing the quality of gas–solid fluidization in the bed, which will be studied in depth in the following section.

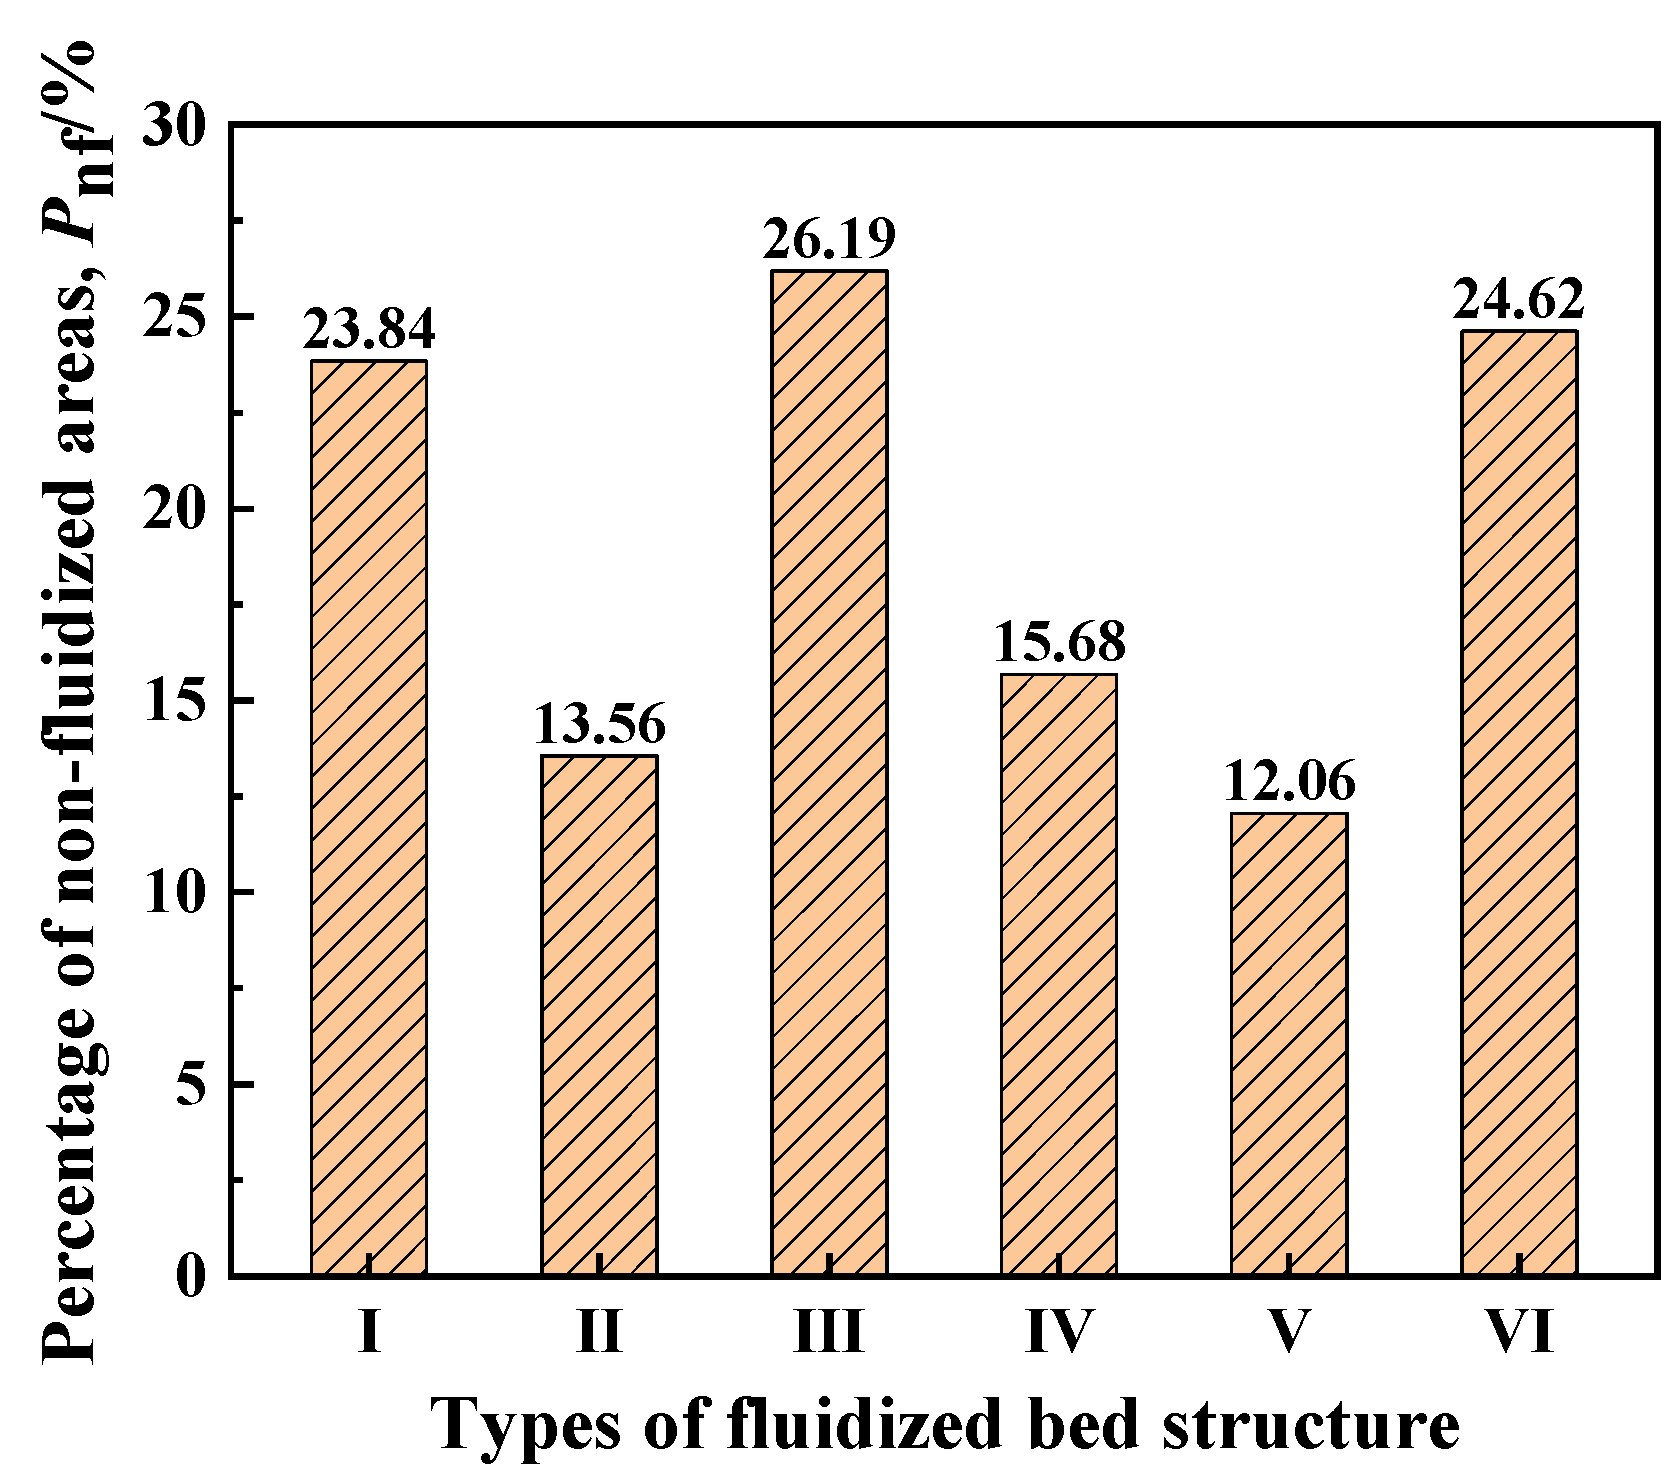
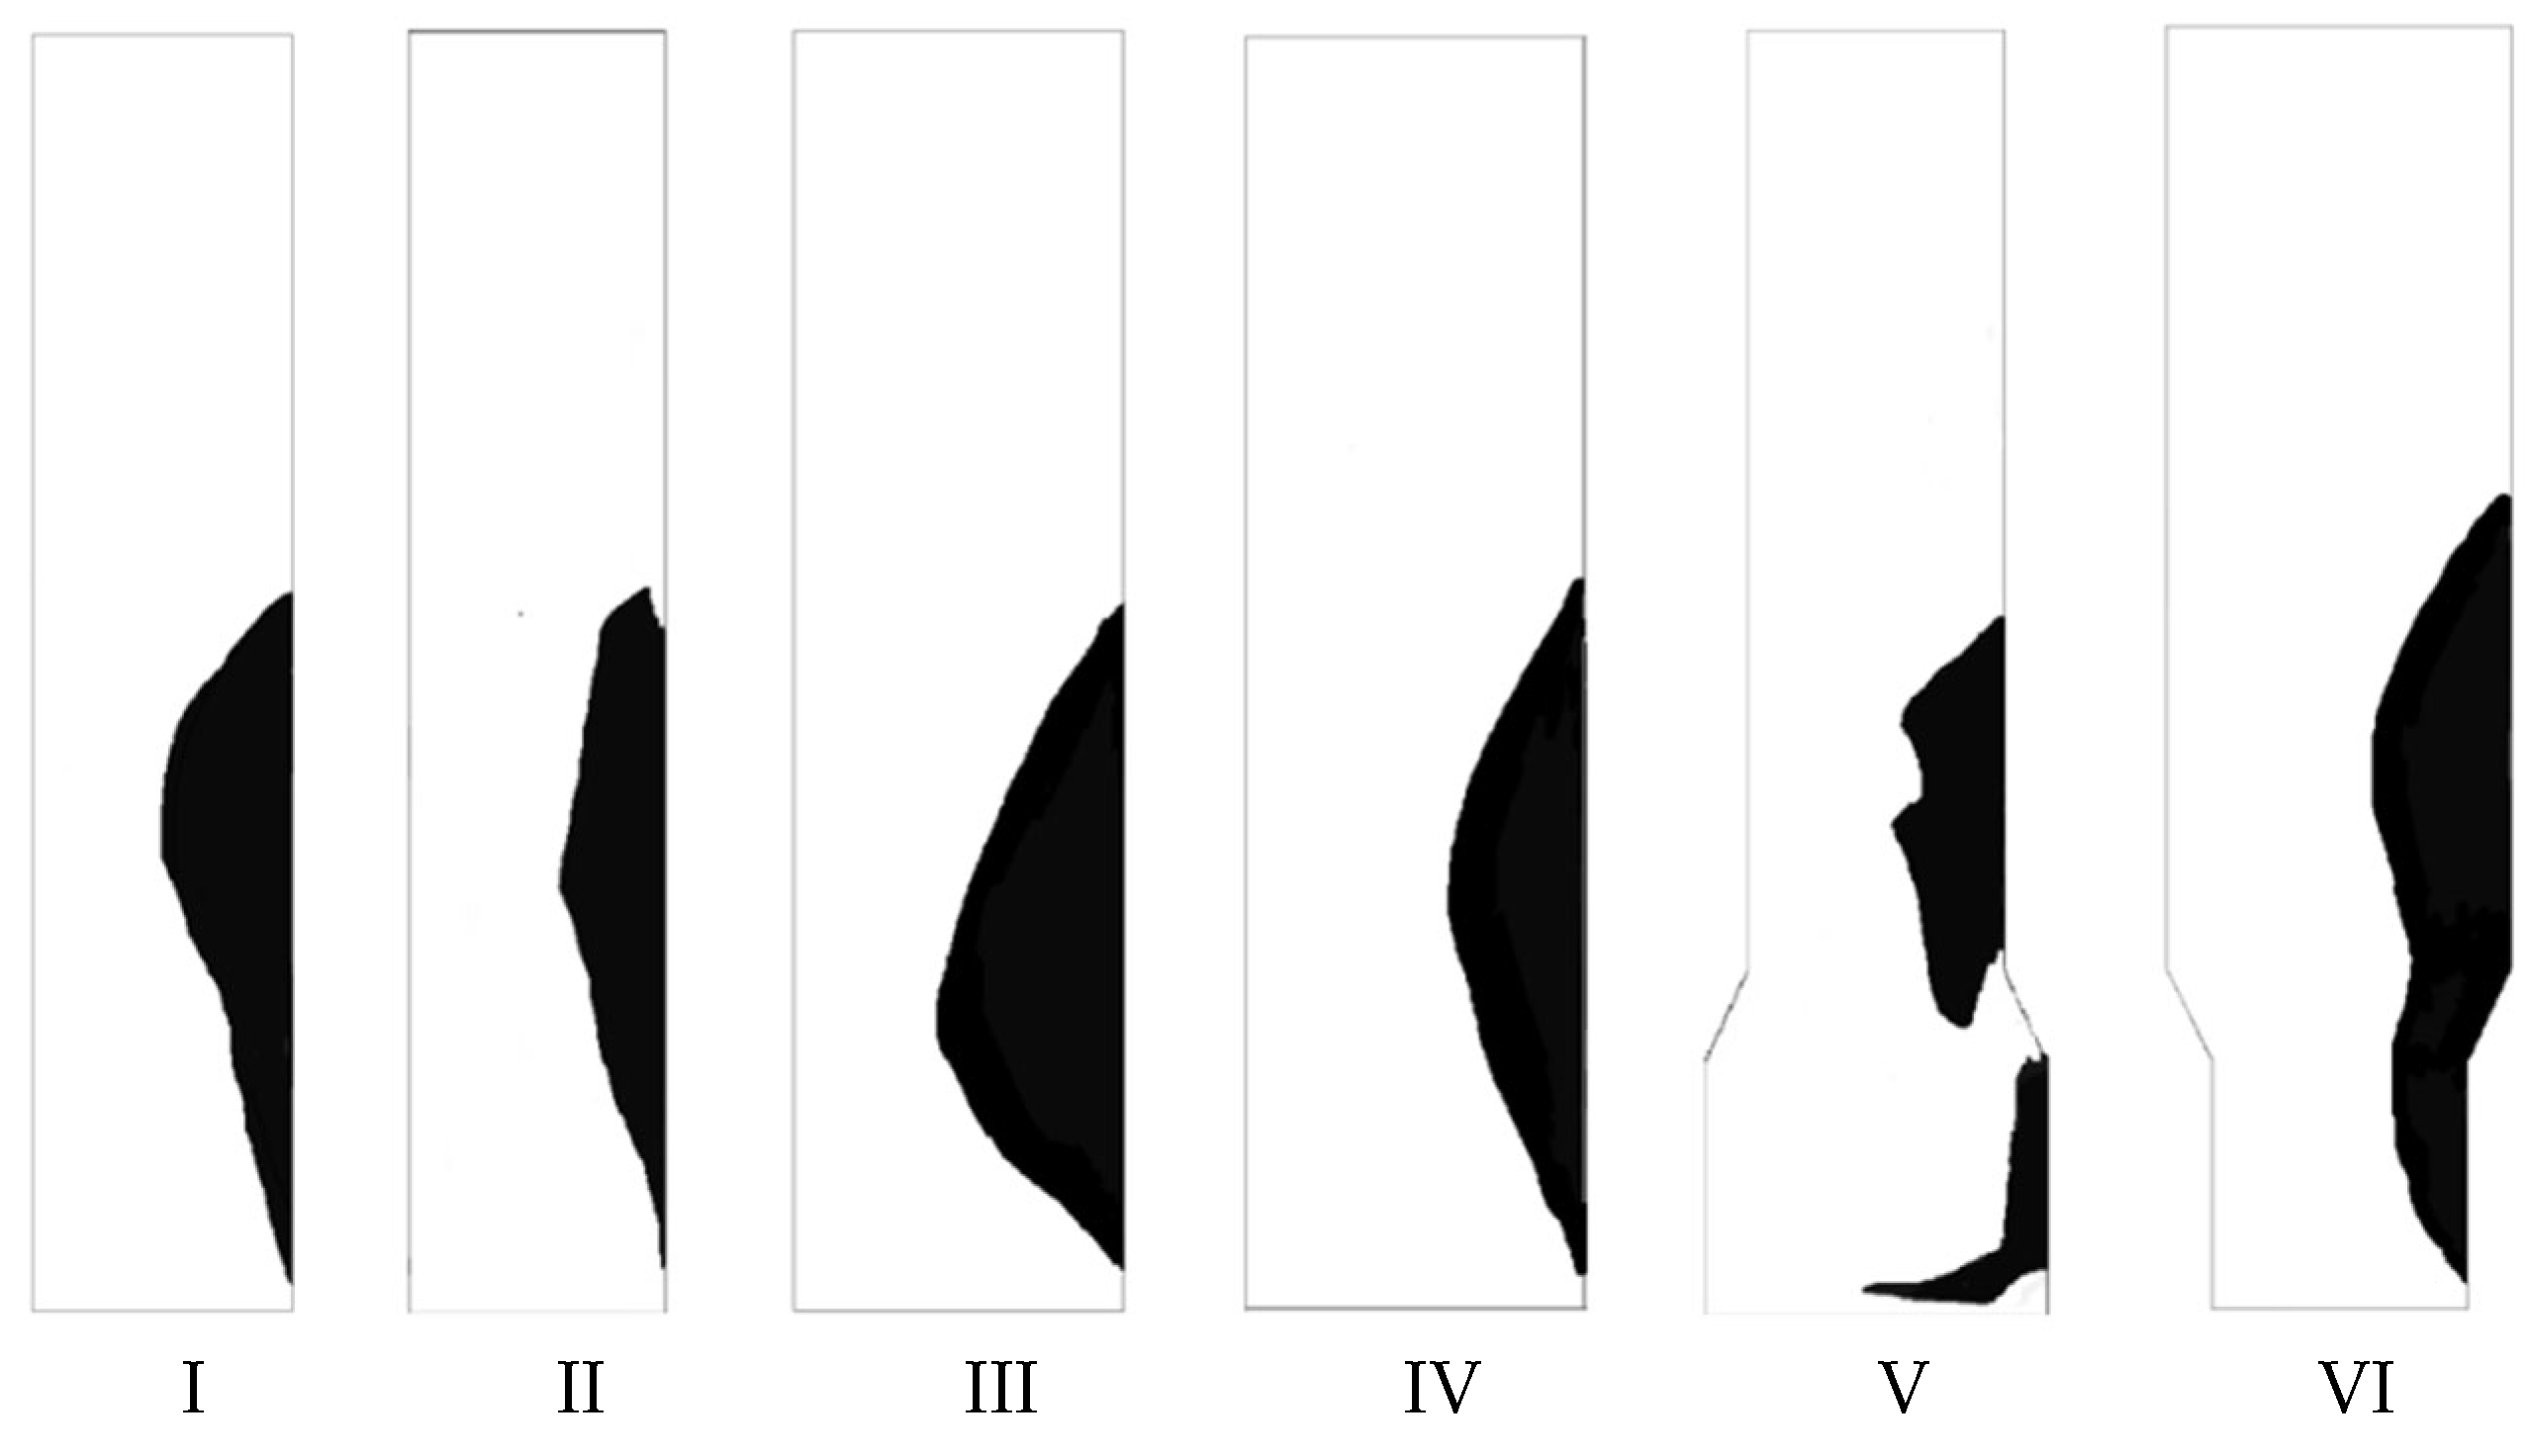
2.4.2. Method for Determining the Percentage of Non-Fluidized Area

The smaller the percentage of non-fluidized area in the fluidization process of an oscillating gas–solid fluidized bed, the better the quality of gas–solid fluidization and the more uniform the gas–solid contact. On the contrary, if the percentage of non-fluidized area is larger, it indicates that the fluidization quality is lower and the gas–solid contact is more uneven. In the experiment, the expansion ratio of the bed layer in the initial fluidized state was measured to be about 1.03, and the solid content was calculated to be 0.59 based on the expansion ratio. When the instantaneous swing angle of the fluidized bed is large, there are fixed bed areas and areas similar to moving bed flows close to the inclined bed’s lower wall where almost no particle flow occurs. These are collectively referred to as non-fluidized areas. Due to the initial fluidized state of particles with a solid content of 0.59, this article defines the region with a solid content greater than or equal to 0.59 as the non-fluidized region [26,27,28,29].
The specific steps for obtaining the non-fluidized areas range are as follows, taking the swing period T = 8 s and swing amplitude θ = 10° as an example: (1) Using the same method as the bubble processing method mentioned above, obtain a binary image with a solid content greater than or equal to 0.59, as shown in Figure 7b; (2) Overlay the binary images (4 in total) of the bed body at the instantaneous swing angle θ = 10° during two swing cycles to Figure 7c overlay images; (3) The darkest area in the overlay image is the non-fluidized area, and its range is drawn to obtain the result shown in Figure 7d.
The number of non-fluidized areas in the bed can directly reflect the quality of gas–solid fluidization. To quantify the non-fluidized areas in the bed, the percentage of non-fluidized area Pnf is introduced as a quantitative parameter to represent the percentage of non-fluidized area in the initial bed material area. The calculation formula for Pnf is shown in Equation (14):
P n f = Area   of   non - fluidized   areas Initial   bed   material   particle   areas
Among them, the bed material’s initial particle area is the particle area in the axial section when the bed reaches the initial fluidized state.

3. Results and Discussion

3.1. Determination of Variable-Diameter Oscillating Fluidized Bed Variants

The variable-diameter method and the structure and operating parameters of the equal-diameter fluidized bed used for comparative research are shown in Table 1. Among them, I, II, III, and IV are equal-diameter fluidized beds (EDFB), V and VI are “cone-contraction” and “cone-expansion” variable-diameter fluidized beds (VDFB), respectively. The inlet flow rate at the bottom of fluidized beds II, III, V, and VI is the same. (ug represents the apparent gas velocity of an equal-diameter fluidized bed, ugl represents the apparent gas velocity of an equal-diameter section in a variable-diameter fluidized bed, and ugu represents the apparent gas velocity of an equal-diameter section in a variable-diameter fluidized bed.) Fixed operating parameters were Θ = 10°, T = 8 s, H = 800 mm, and Q = 136 m3/h. The influence mechanism of variable-diameter structure in variable-diameter fluidized beds was explored.
Figure 8 shows the solid content distribution images of the six fluidized beds at the moment of the bed instantaneous swing angle θ = 10°. From the figure, it can be seen that the bubble aggregation phenomenon is obvious at the axial height h = 300~400 mm or so. Therefore, the cone section of the variable-diameter fluidized bed is set in this interval.
Figure 9 shows the average bubble diameters of six fluidized beds with different instantaneous swing angles θ (10°, 5°, 0°) during the complete swing cycle (T = 8 s, Θ = 10°). Figure 10 compares the percentage of non-fluidized area inside the fluidized bed when the bed’s instantaneous pendulum angle is at the maximum instantaneous pendulum angle.
Through the analysis of the specific data, it is found that the bed diameter of the equal-diameter fluidized bed II is the same as that of bed I (D = 300 mm), and the average diameter of the bubbles increases by about 44%, and the percentage of the non-fluidized areas decreases by about 43% when the ug is increased from 0.30 to 0.53 m/s. Similarly, the same pattern is observed in the equal-diameter fluidized bed IV compared with III. Similarly, equal-diameter fluidized bed IV shows the same pattern compared with III, with the average bubble diameter increasing by about 38% and the percentage of non-fluidized area decreasing by about 40%. When comparing the equal-diameter fluidized bed III with I, both of them have the same ug, but the bed diameter increases from 300 mm to 400 mm, in which the average bubble diameter slightly decreases, and the percentage of non-fluidized area slightly increases. The same trend was observed in the comparison of equal-diameter fluidized beds IV and II. The analysis shows that when the bed diameter is the same, increasing the apparent gas velocity can reduce the percentage of non-fluidized area, but it will lead to the increase in bubble size, and the two show opposite trends with the apparent gas velocity. Further analysis shows that when the apparent gas velocity is the same, increasing the bed diameter can reduce the bubble size but will lead to a higher percentage of non-fluidized area. Therefore, if the reduction in bubble size and the decrease in non-fluidized areas are to be taken into account, the variable-diameter structure may be a suitable choice.
Variable-diameter fluidized bed V’s lower equal-diameter section diameter and gas velocity are the same as that of equal-diameter fluidized bed III, and upper equal-diameter section diameter and gas velocity are the same as that of equal-diameter fluidized bed II. Variable-diameter fluidized bed VI’s lower equal-diameter section diameter and gas velocity are the same as that of equal-diameter fluidized bed II, and upper equal-diameter section diameter and gas velocity are the same as that of equal-diameter fluidized bed. As can be seen from Figure 9, in the whole range of bed height, the average bubble diameters in both variable-diameter structure fluidized beds are between D = 300 mm (I and II) and 400 mm (III and IV) in equal-diameter fluidized beds with the same gas volume. However, the percentage of non-fluidized area in the above two variable-diameter fluidized beds is quite different. As shown in Figure 10, for the “cone-contraction” variable-diameter fluidized bed V, the percentage of non-fluidized area is only 12.06%, which is 53.95% lower than that of the equal-diameter fluidized bed III and 11.06% lower than that of the equal-diameter fluidized bed II under the same gas volume. The percentage of non-fluidized area of variable-diameter fluidized bed VI is 24.62%, which is 5.99% lower than that of equal-diameter fluidized bed III and 81.56% higher than that of equal-diameter fluidized bed II under the same gas volume.
The results of the above analyses show that, for the same inlet air intake at the bottom of the bed, the average bubble diameters in both the “cone-contraction” and “cone-expansion” variable-diameter fluidized beds are intermediate between the two single-equal-diameter fluidized beds and are closer to those in the large diameter/low gas velocity equal-diameter fluidized bed with small bubble sizes. The average bubble diameters in the “cone-contraction” and “cone-expansion” variable-diameter fluidized beds were between the two single equal-diameter fluidized beds, and both were closer to the large diameter/low gas velocity equal-diameter fluidized beds with small bubble sizes. In the large diameter/low gas velocity equal-diameter fluidized bed, the percentage of non-fluidized area in the “cone-contraction” variable-diameter fluidized bed was lower than that in either of the single equal-diameter fluidized beds.
Therefore, the “cone-contraction” variable-diameter structure fluidized bed combines the advantages of a smaller average bubble diameter and a lower percentage of non-fluidized area so that it can be used to improve the fluidization quality of an oscillating fluidized bed.
Figure 11, Figure 12 and Figure 13 show the bubble distribution, the non-fluidized regional distribution, and the particle velocity vector distribution for the six fluidized beds at the moment of the instantaneous bed swing angle θ = 10°.
Further analysis of the mechanism of the “cone-contraction” variable-diameter fluidized bed shows that as can be seen from the bubble distribution diagram in Figure 11, in an equal-diameter fluidized bed, the gas begins to gather from the bottom of the bed and gradually forms larger-sized bubbles. In the “cone-contraction” variable-diameter fluidized bed, the gas bubbles are mainly aggregated at the variable-diameter position and above and form large bubbles. As can be seen from the ratio of non-fluidized areas in Figure 12, the non-fluidized areas of the equal-diameter fluidized bed are uninterruptedly distributed along the lower wall of the inclined bed, and the radial width of the non-fluidized areas shows a trend of increasing and then decreasing along the axial direction from the bottom to the top. For the “cone-contraction” variable-diameter fluidized bed, the non-fluidized areas are distributed along the lower wall of the inclined bed, and there is a discontinuous phenomenon in the cone section of the bed, which indicates that the gas–solid mobility in the cone section of the bed and in the lower equal-diameter section has been improved. Combined with the particle velocity vector diagram in Figure 13 (the size and direction of the arrows in the diagram indicate the velocity magnitude and direction of the particle movement, respectively), it is concluded that the introduction of the cone structure has significantly changed the trajectory of the gas–solid two-phase flow, which has caused an obvious deflection of the direction of the particles’ movement. While a macroscopic centripetal vortex is formed in the upper and lower parts of the baseline fluidized bed, the large-scale vortex in the lower part of the bed is effectively decomposed into a number of small-scale vortices while a single main vortex is maintained in the upper part of the cone section in the “cone-contraction” variable-size fluidized bed. The large-scale vortex is usually accompanied by the generation of large-diameter bubbles, which is prone to reduce the gas–solid contact area and fluidization quality; the cone structure effectively inhibits the bubble merger and growth by crushing the vortex, thus improving the gas–solid phase contact state. The results demonstrated that reasonable structural optimization can enhance the overall performance of a fluidized bed by regulating the vortex dynamics.
Thus, a comprehensive analysis at the macro- and micro-levels shows that the expansion of the diameter at the bottom of the “cone-contraction” variable-diameter fluidized bed reduces the gas velocity. This velocity reduction slows down the rate of gas concentration near the upper wall, thereby enhancing gas distribution in the lower region of the bed. In addition, the acceleration of the gas velocity through the conical section enhances the interactions between bubbles and particles in the upper equal-diameter section. This enhanced interaction significantly reduces the proportion of non-fluidized regions.

3.2. Influence of Operating Conditions on Fluidization Quality

The gas flow rate is a decisive parameter for the normal operation of the fluidized bed. The initial bed height directly affects the homogeneity of fluidization and operational safety. The swing amplitude and swing period belong to the dynamic optimization parameters, which are used to improve the mixing efficiency or mass transfer performance after the basic parameters (gas flow rate and initial bed height) are stabilized, and their influence on the system stability is relatively indirect. In order to investigate the influence of these operating conditions on the fluidization quality of the oscillating fluidized bed, an equal-diameter fluidized bed (D = 300 mm) was selected as the benchmark fluidized bed and compared with a “cone-contraction” variable-diameter fluidized bed (DL = 400 mm, DU = 300 mm).

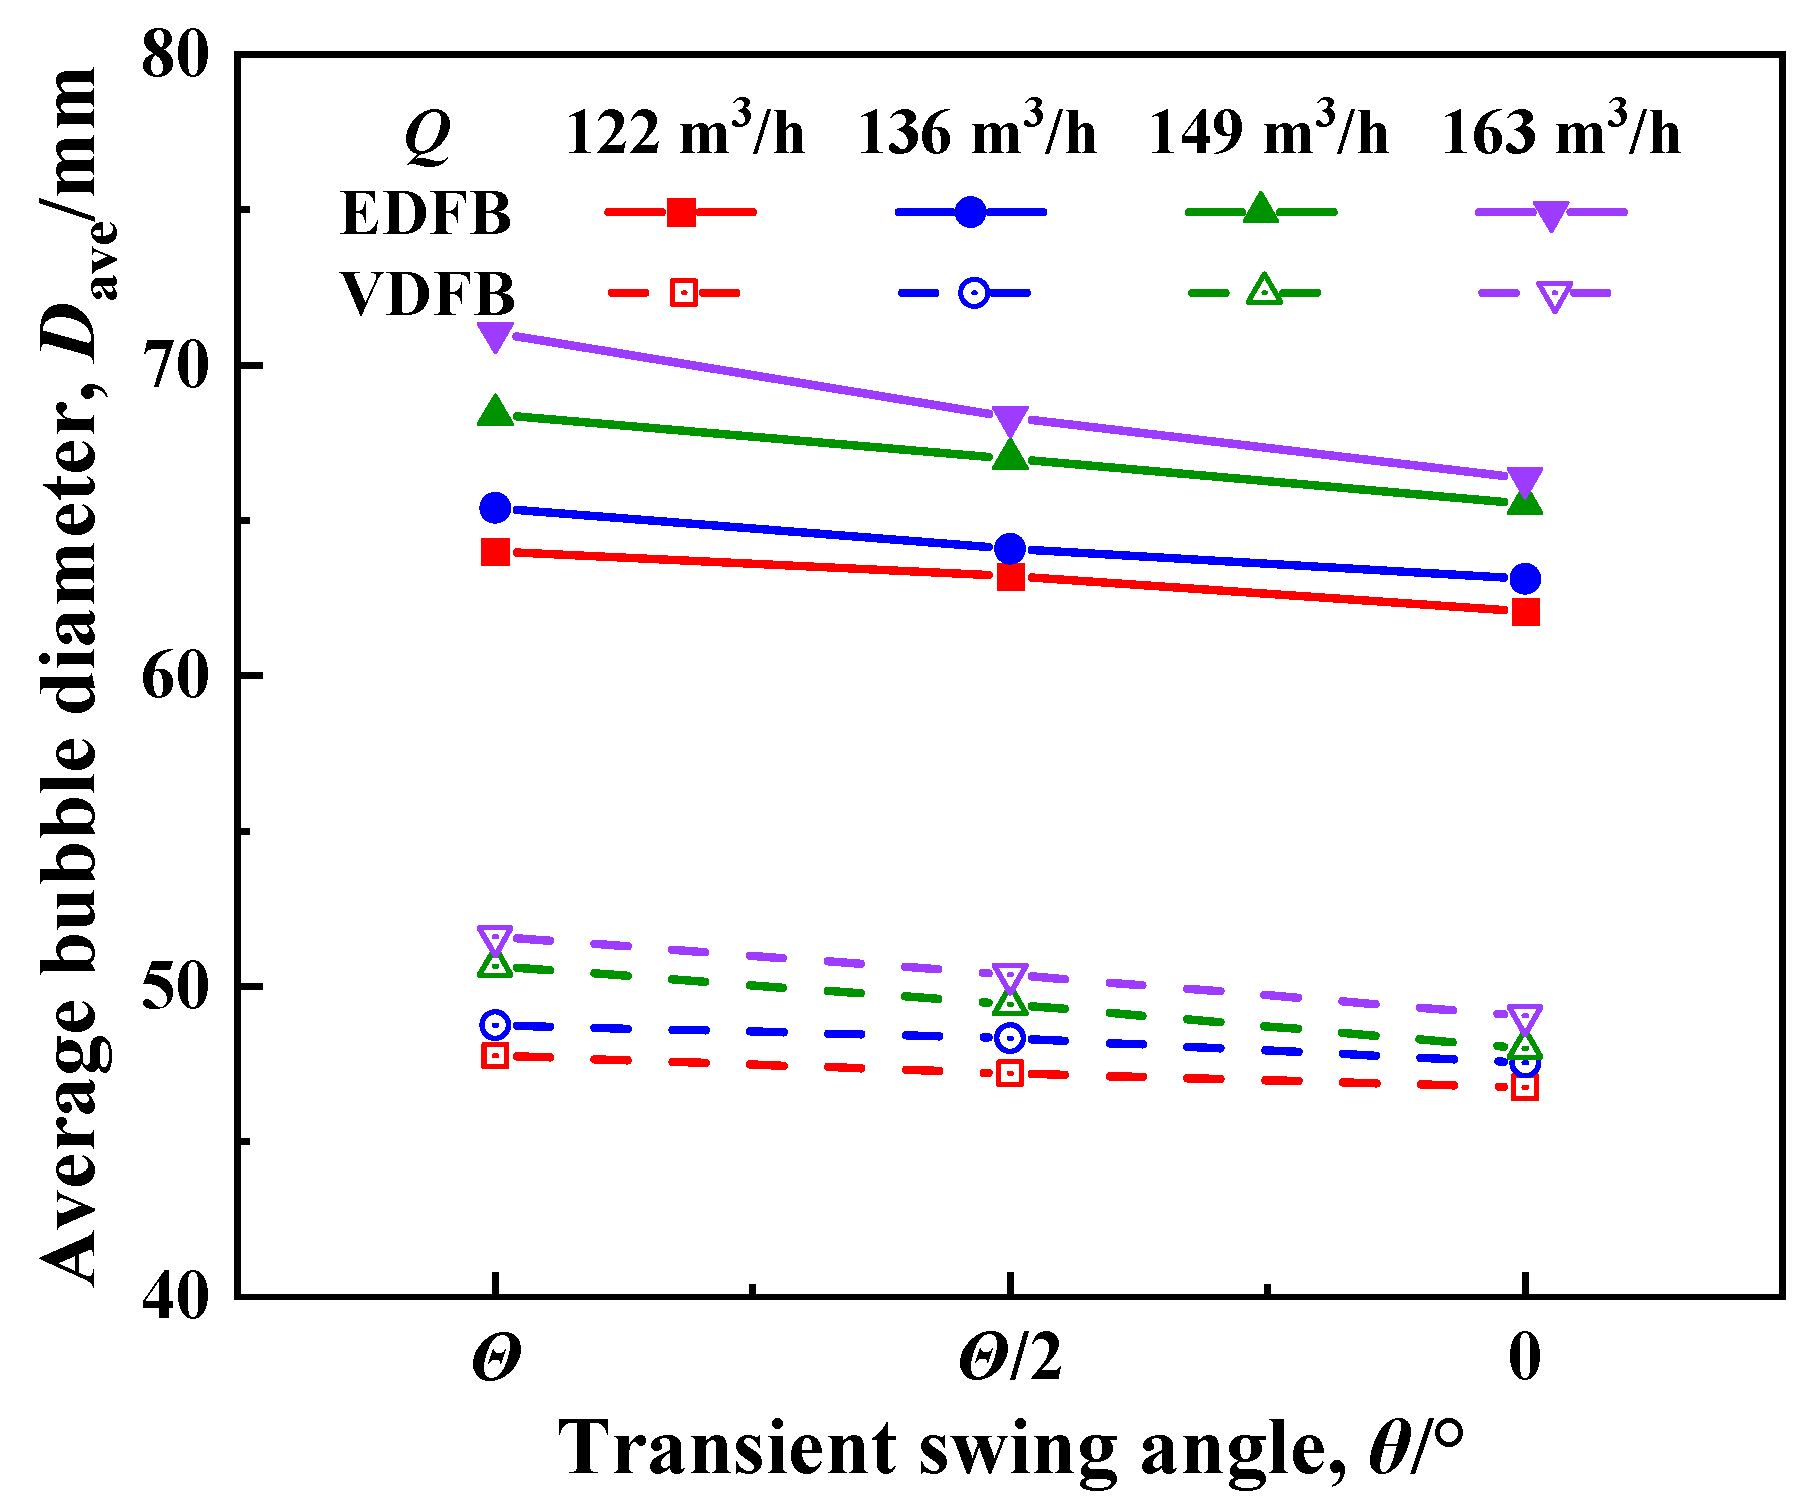
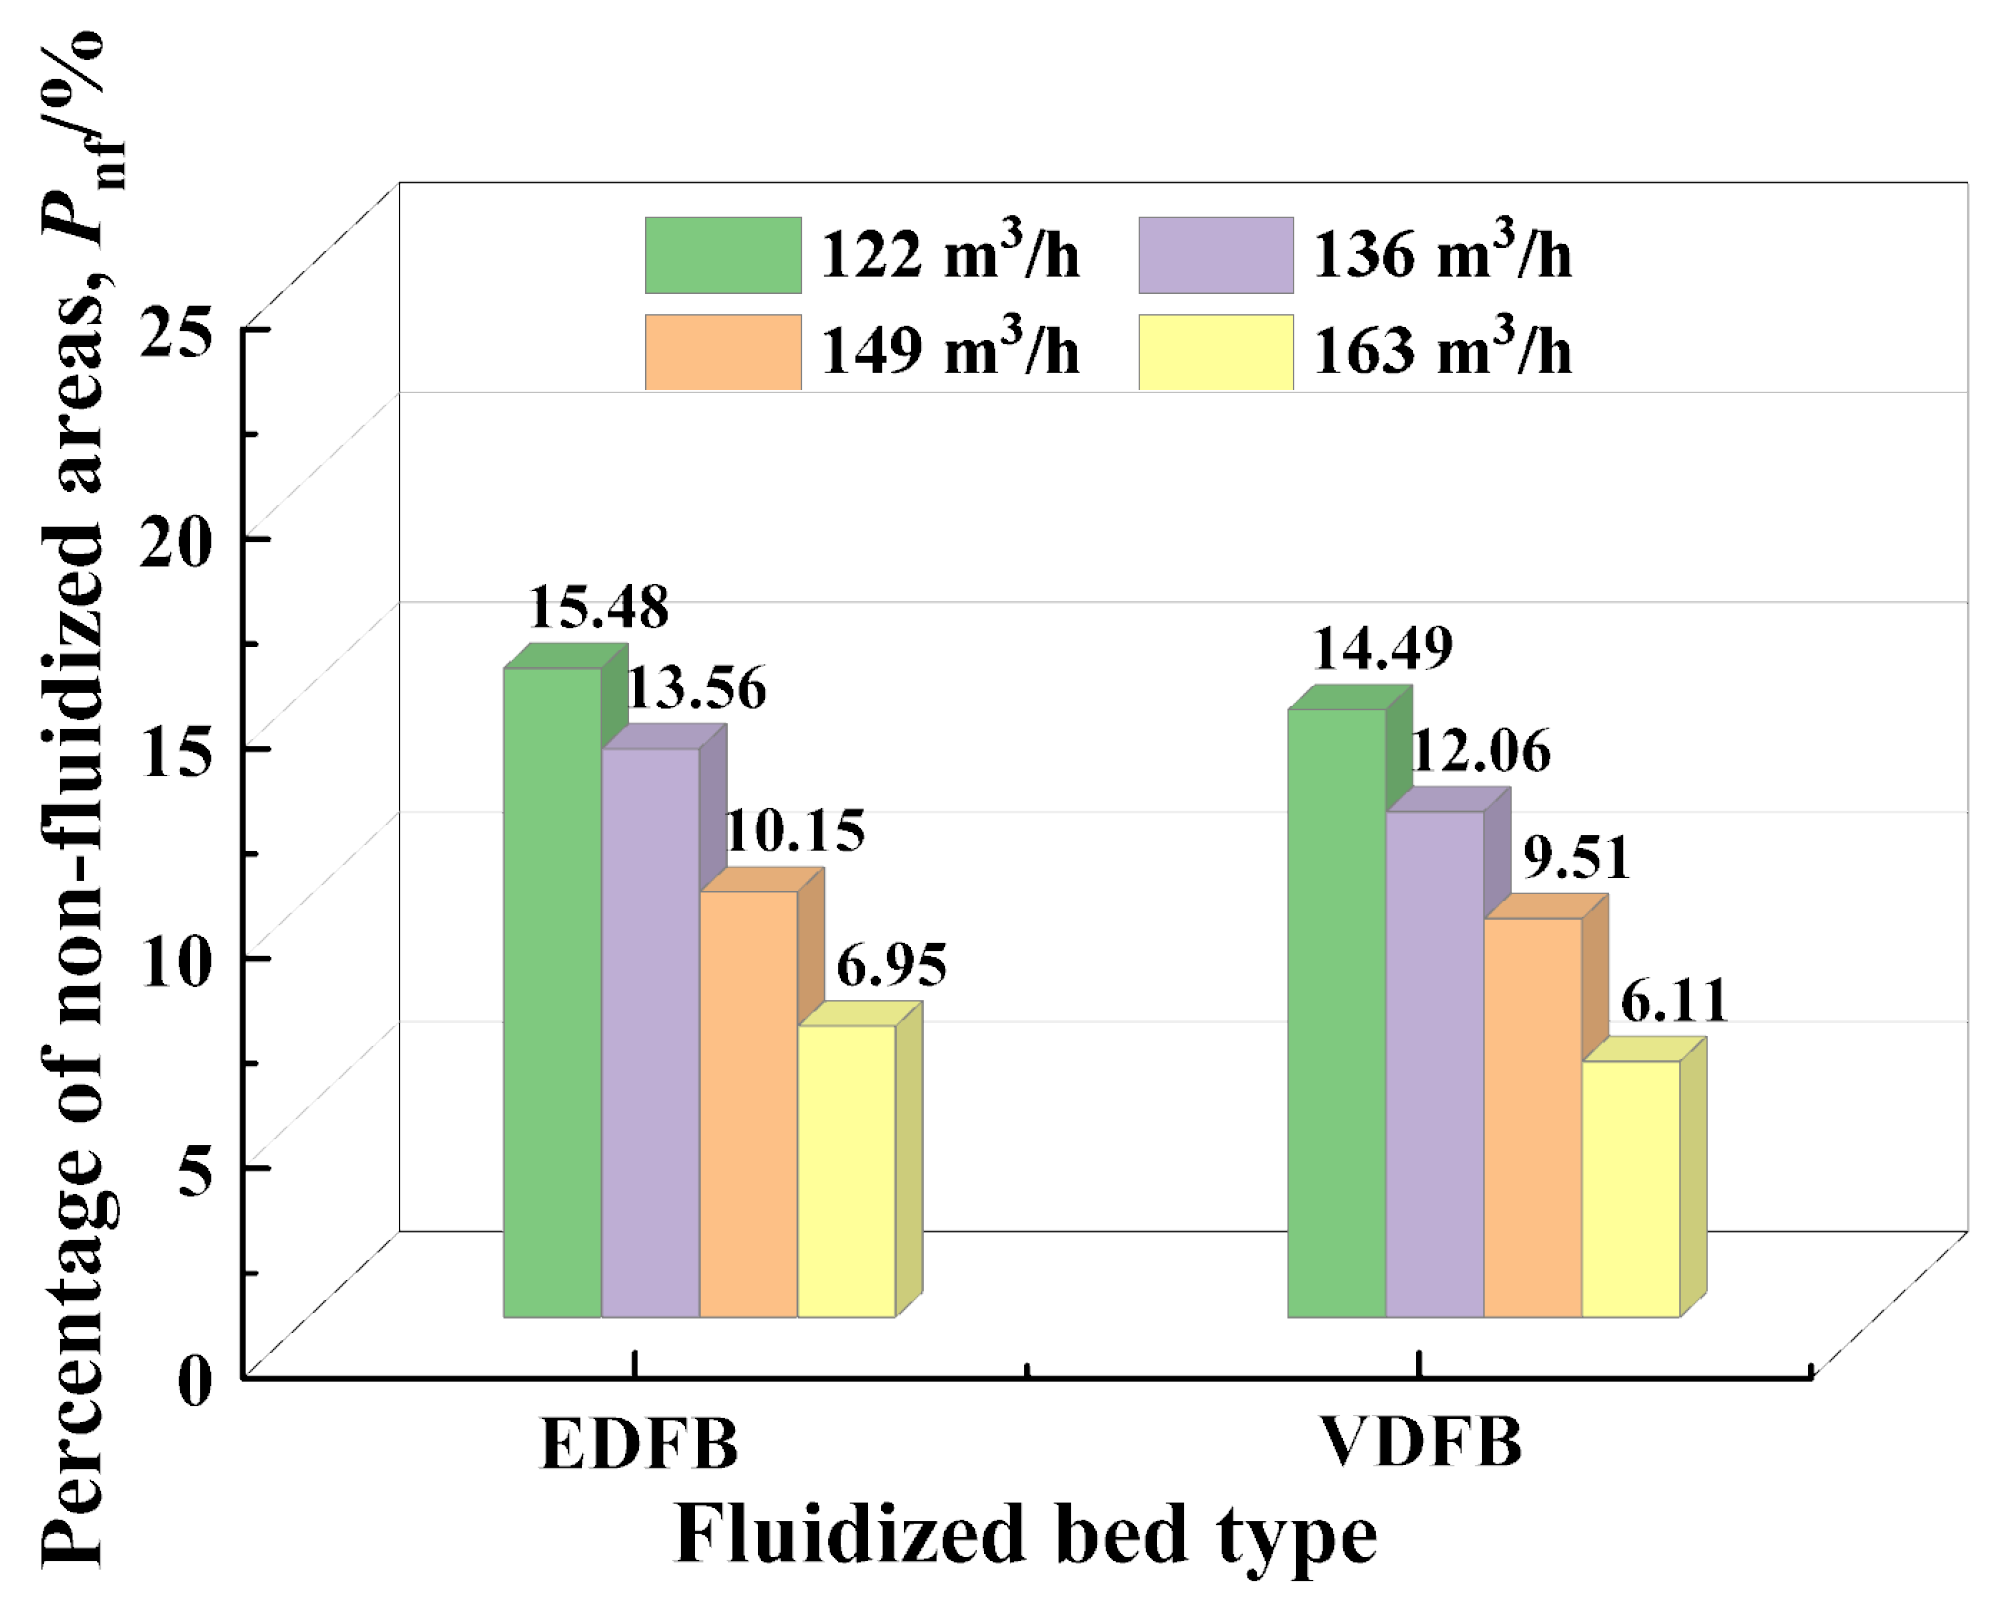
3.2.1. Effect of Gas Flow Rate Q on Fluidization Quality

In order to investigate the effect of gas flow rate on the bubble size and the size of the non-fluidized region in the variable-diameter fluidized bed (VDFB), the gas flow rates Q = 122 m3/h, 136 m3/h, 149 m3/h, 163 m3/h were selected in this section under the conditions of Θ = 10°, T = 8 s, and H = 800 mm. The corresponding apparent gas velocities in the equal-diameter section under the variable-diameter fluidized bed were 0.27 m/s, 0.30 m/s, 0.33 m/s, and 0.36 m/s. The corresponding apparent gas velocities in the equal-diameter fluidized bed (EDFB) were 0.48 m/s, 0.53 m/s, 0.59 m/s, and 0.64 m/s, respectively.
From the image of the average bubble diameters of two kinds of fluidized beds at different gas flow rates in Figure 14, it can be seen that with the gradual increase in the gas volume, variable-diameter fluidized bed and equal-diameter fluidized bed, the average bubble diameters in the bed all show a gradual increase in the trend. The reasons for this phenomenon are analyzed as follows: (1) When the gas flow rate (gas velocity) increases, the volume of gas entering the bed through the distributor per unit of time increases. The initial bubbles formed by the gas near the distributor plate will slightly increase in size due to the enhanced gas jet flow energy. (2) The increase in gas volume exacerbates the bed expansion (increase in inter-particle void ratio), providing more space for radial expansion and longitudinal extension of gas bubbles. Bubbles are more likely to expand during ascent due to the reduced resistance of the surrounding particles. (3) When the gas volume increases, the pressure difference between the bottom and the top of the bed increases, and the bubbles expand due to the gradual decrease in pressure during the rising process. This physical effect directly leads to an increase in bubble volume.
It is also found from Figure 14 that the increase in bubble size with the gas volume change in the variable-diameter fluidized bed is lower than that of the equal-diameter fluidized bed, taking Q = 122 m3/h as the base when the gas volume is increased to 136 m3/h, 149 m3/h, and 163 m3/h, the average diameter of the bubble of equal-diameter fluidized bed, the average bubble diameter increased by about 2%, 6%, and 9%, respectively. In contrast, the average bubble diameter of variable-diameter fluidized bed increased by about 2%, 4%, and 7%, respectively, which indicates that the effect of air volume change on the variable-diameter fluidized bed is more significant than that of the equal-diameter fluidized bed. This suggests that the variable-diameter design improves the uniform gas distribution and reduces local gas aggregation, inhibiting bubble consolidation.
Figure 15 shows the percentage of non-fluidized area inside the bed for equal-diameter fluidized beds and variable-diameter fluidized beds at different gas flow rates Q. From the figure, it can be clearly observed that the percentage of non-fluidized area inside the bed of both types of fluidized beds decreases significantly when the bed gas inlet volume increases. In the case of the same gas inlet, the percentage of non-fluidized area inside the variable-diameter fluidized bed decreases as compared to the equal-diameter fluidized bed, with decreases of 6.40%, 11.06%, 6.31%, and 12.09%, respectively.
With the increase in gas inlet, the percentage of non-fluidized area in the fluidized bed gradually decreases, mainly due to the following reasons. Firstly, gas is used as a fluidizing medium, and an increase in gas inlet means more gas enters the bed, providing greater fluidizing power. When these gases flow in the bed body, they will produce more substantial traction on solid particles, which makes the particles that were initially in a stationary or agglomerated state more easily driven up, thus reducing the non-fluidized areas. Second, the increased gas flow improves the gas distribution within the bed. The gas is more evenly dispersed throughout the bed, avoiding particle build-up and non-fluidization caused by insufficient gas in local areas, which in turn reduces the percentage of non-fluidized area.
The reduction in non-fluidized areas in the variable-diameter fluidized bed is greater under the same gas inlet volume. This phenomenon is closely related to the bed’s special structure. When gas flows through the reduced-diameter section, the cross-sectional area decreases, which results in a significant increase in flow velocity. This enhanced high-speed gas flow generates stronger shear forces. Consequently, particle agglomerates are subjected to a more substantial stripping effect, causing particles that were initially deposited due to insufficient traction to be re-suspended.

3.2.2. Effect of Initial Bed Height H on Fluidization Quality

Figure 16 shows the average bubble diameters of the equal-diameter fluidized bed and the variable-diameter fluidized bed at different instantaneous pendulum angles under the premise of Θ = 10°, T = 8 s, Q = 136 m3/h, and different initial bed heights of H = 700 mm, 800 mm, and 900 mm. The average bubble diameter in the variable-diameter fluidized bed was found to be significantly smaller than that in the equal-diameter fluidized bed. With the increase in the initial bed height, the bubble sizes of the two types of fluidized beds showed a gradual increase in the size of the bubbles. This is because when the bed material level surface rises with the increase in the initial bed material height, the traveling distance of the bubbles from the bottom of the bed body to the material level interface increases, and the longer traveling distance will make the bubbles have more chances to aggregate with other small bubbles, which further leads to the gradual increase in the bubble size.
Figure 17 shows the images of the percentage of the non-fluidized regions for equal-diameter fluidized beds and variable-diameter fluidized beds at different initial bed material heights H. The figure shows that the percentage of the non-fluidized areas within the fluidized bed shows an increasing trend as the initial bed material height increases. In a fluidized bed system, an increase in the initial bed material height within the bed means an increase in the particle content. The increase in particle content makes the interaction between particles more frequent and intense. From the force point of view, the pressure gradient force on the particles increases. The pressure gradient force is a force that occurs due to the uneven distribution of pressure in the fluid, and its direction points in the direction of decreasing pressure. In this case, more particles are squeezed against each other, which increases the unevenness of the pressure distribution, thus increasing the pressure gradient force. At the same time, the trailing force to which the particles are subjected for their movement increases, which is also a force due to the uneven pressure distribution in the fluid and is directed in the direction of the pressure decrease. The increase in these two forces can greatly impede the motion of the particles. The particles must overcome greater resistance during their movement, gradually decreasing their kinetic energy. When the particles’ kinetic energy is insufficient to maintain them in a fluidized state, they will gradually aggregate to form non-fluidized regions, which in turn leads to an increase in the percentage of non-fluidized area in the fluidized bed. Detailed comparative analysis of the data in Figure 17 reveals that the percentage of the non-fluidized areas of the variable-diameter fluidized bed is slightly lower than that of the equal-diameter fluidized bed under the same initial bed height and under the conditions of initial bed heights H of 700, 800, and 900 mm, the decreases are respectively 8.28%, 11.06%, and 6.59%. This result also shows that variable-diameter fluidized beds can improve the quality of gas–solid fluidization.

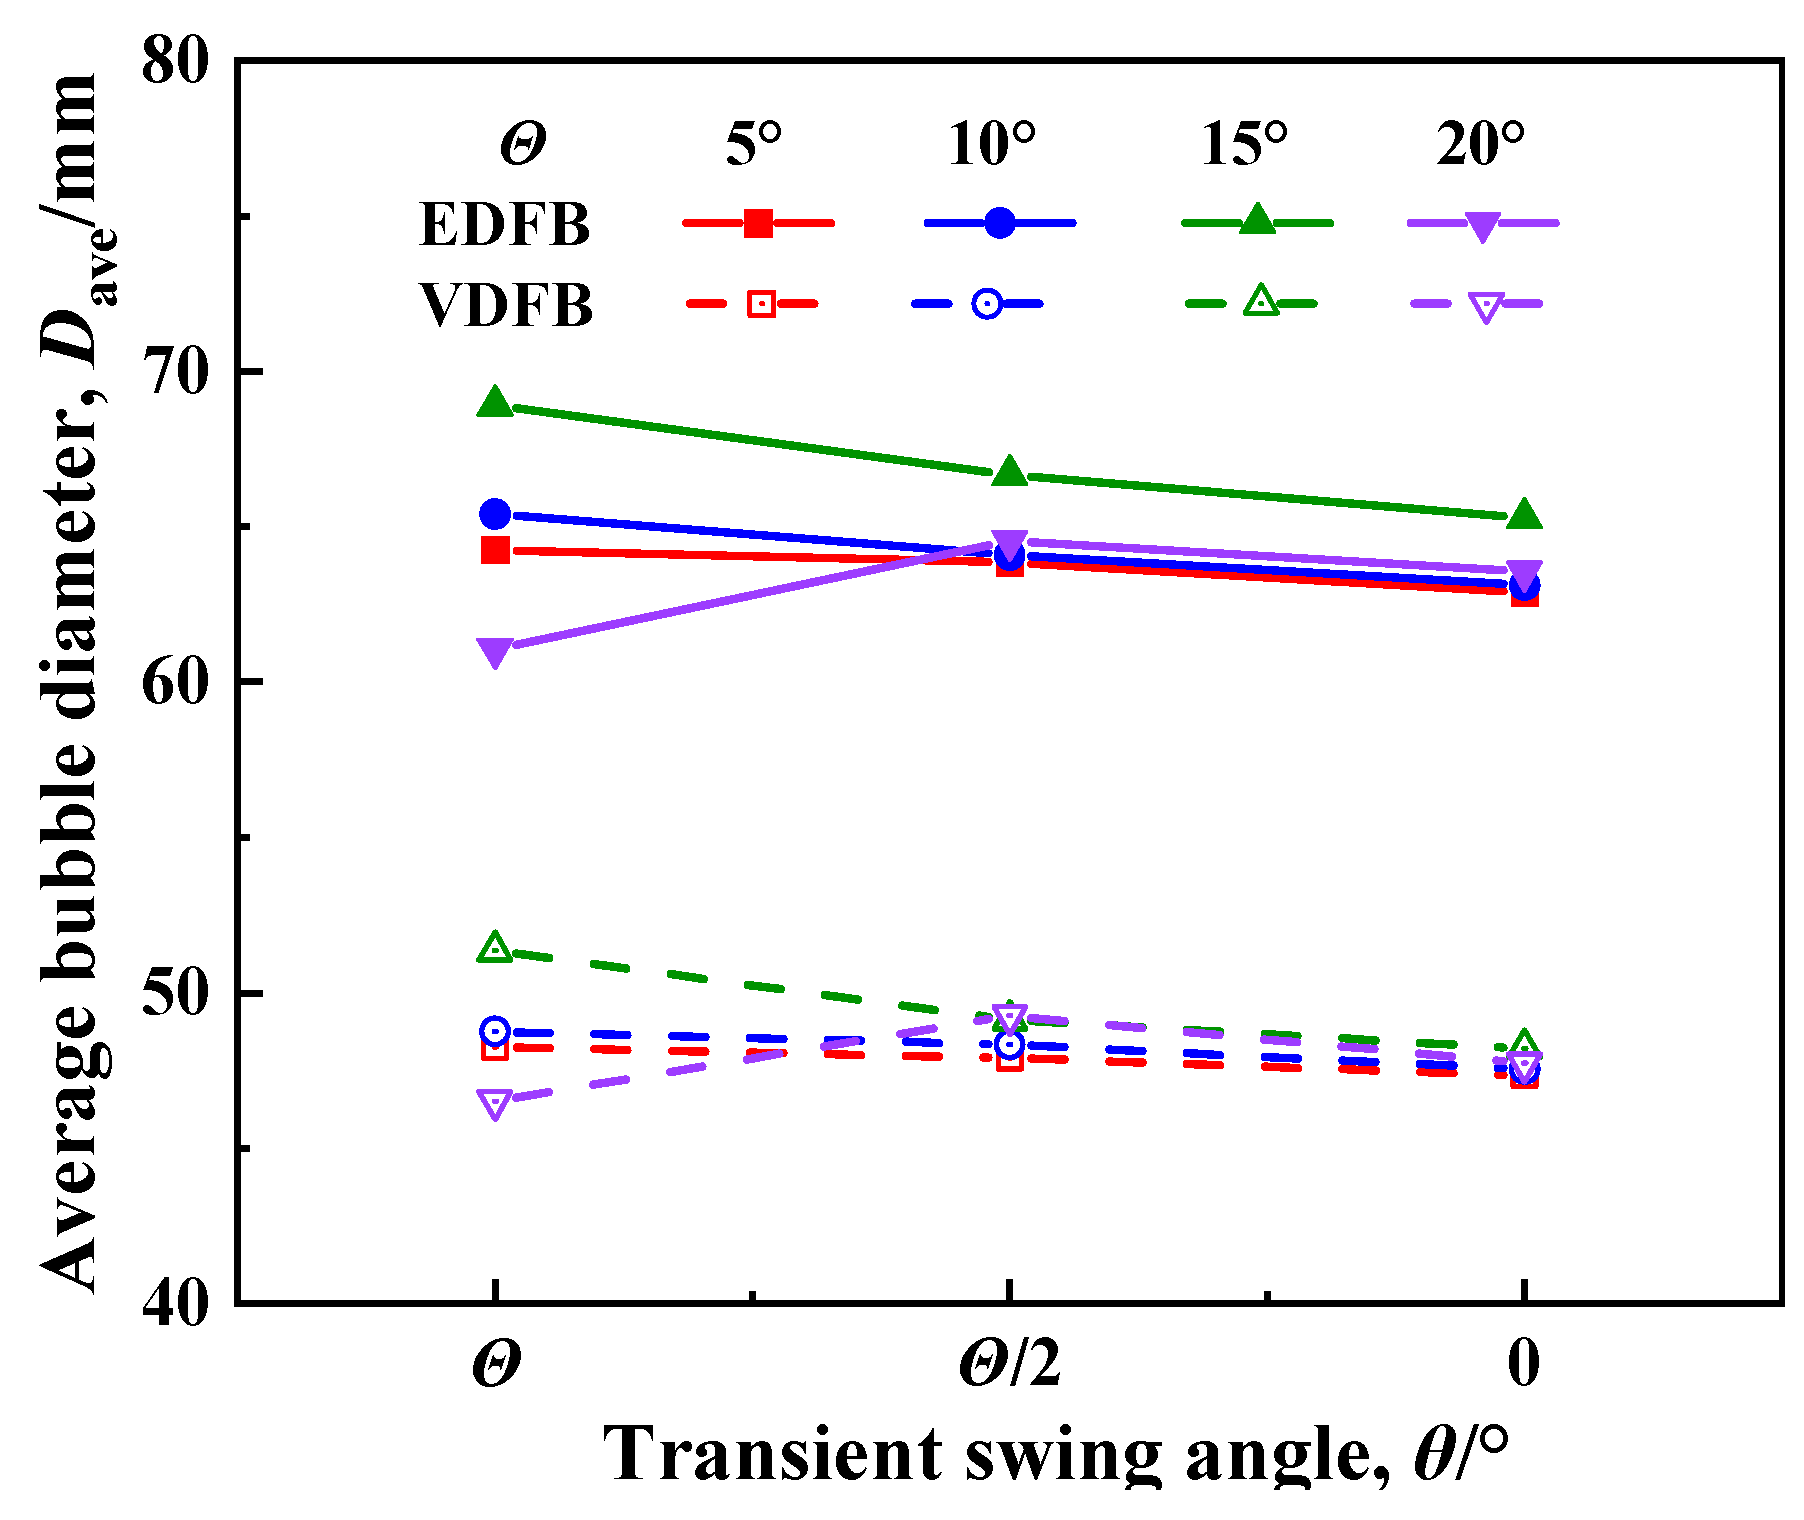
3.2.3. Effect of Oscillation Amplitude Θ on Fluidization Quality

Figure 18 presents the mean bubble diameters for both the equal-diameter fluidized bed and the variable-diameter fluidized bed under different oscillation amplitudes (Θ = 5°, 10°, 15°, 20°), with fixed operating conditions of T = 8 s, H = 800 mm, and Q = 136 m3/h. As shown in Figure 18, the mean bubble diameter in the variable-diameter fluidized bed is consistently smaller than that in the equal-diameter fluidized bed across all oscillation amplitudes Θ. This demonstrates the consistent effectiveness of the variable-diameter fluidized bed in reducing bubble size compared to the EDFB.
Quantitative comparisons of the bubble diameter reduction in the VDFB relative to the equal-diameter fluidized bed at specific oscillation points are summarized below:
At Θ = 5°: Reductions of 24.90% (at Θ), 24.97% (at Θ/2), and 24.74% (at 0°).
At Θ = 10°: Reductions of 25.46% (at Θ), 24.59% (at Θ/2), and 24.67% (at 0°).
At Θ = 15°: Reductions of 25.48% (at Θ), 26.30% (at Θ/2), and 26.14% (at 0°).
At Θ = 20°: Reductions of 23.80% (at Θ), 23.68% (at Θ/2), and 24.88% (at 0°).
Overall, the data indicate that the variable-diameter fluidized bed reduces the average bubble diameter by approximately 25% compared to the equal-diameter fluidized bed across the range of oscillation amplitudes and measurement points investigated.
It is also found from the figure that when the equal-diameter fluidized bed/variable-diameter fluidized bed is at the maximum instantaneous swing angle Θ, the average bubble diameter gradually increases with the increase in Θ in the interval 5° ≤ Θ ≤ 15°. This is because with the increase in the bed inclination angle, the height of the material level interface in the upper wall region of the bed is gradually reduced, resulting in the reduction in gas resistance in the upper wall region, the tendency of the gas phase to aggregate along the upper wall of the bed is enhanced, and the size of the gas bubbles increases. However, when Θ grows to 20°, the bubble size decreases. This is due to the fact that with the continuous decrease in the material level interface in the upper wall region of the bed, the distance of the gas bubbles rising along the upper wall region is shortened, and the time of detachment from the bed is accelerated, which in turn leads to a decrease in the size of the bubbles aggregated into large bubbles.
The percentage of non-fluidized area in the equal-diameter fluidized bed and the variable-diameter fluidized bed with different swing amplitudes Θ are compared, as shown in Figure 19. From the figure, it can be seen that the larger the oscillation amplitude is, the more serious the particle accumulation phenomenon is, and the higher the percentage of non-fluidized area is. This phenomenon is mainly caused by two reasons. Firstly, when the swing amplitude increases, the component of gravity on the particles along the bed inclination direction increases, resulting in some particles gathering to the lower part under the effect of gravity. The particles are more tightly packed at the bottom of the bed and in the lower wall area, resulting in the formation of a non-fluidized zone. Secondly, the increase in swing amplitude changes the gas flow path and distribution, biasing the rising gas towards the lower side of the material level, resulting in a lower gas flow rate on the other side. The trailing force in this low-flow region is not sufficient to maintain particle fluidization, further enlarging the non-fluidized zone. In addition, under the same swing amplitude, the percentage of the non-fluidized zone of the variable-diameter fluidized bed is significantly smaller than that of the equal-diameter fluidized bed. The experimental data show that when the swing amplitude is 5°, 10°, 15°, and 20°, the percentage of non-fluidized zone of the variable-diameter bed is reduced by 7.57%, 11.06%, 6.13%, and 6.92% than that of the equal-diameter bed, respectively. This indicates that the variable-diameter structure can continuously inhibit the particle accumulation behavior.

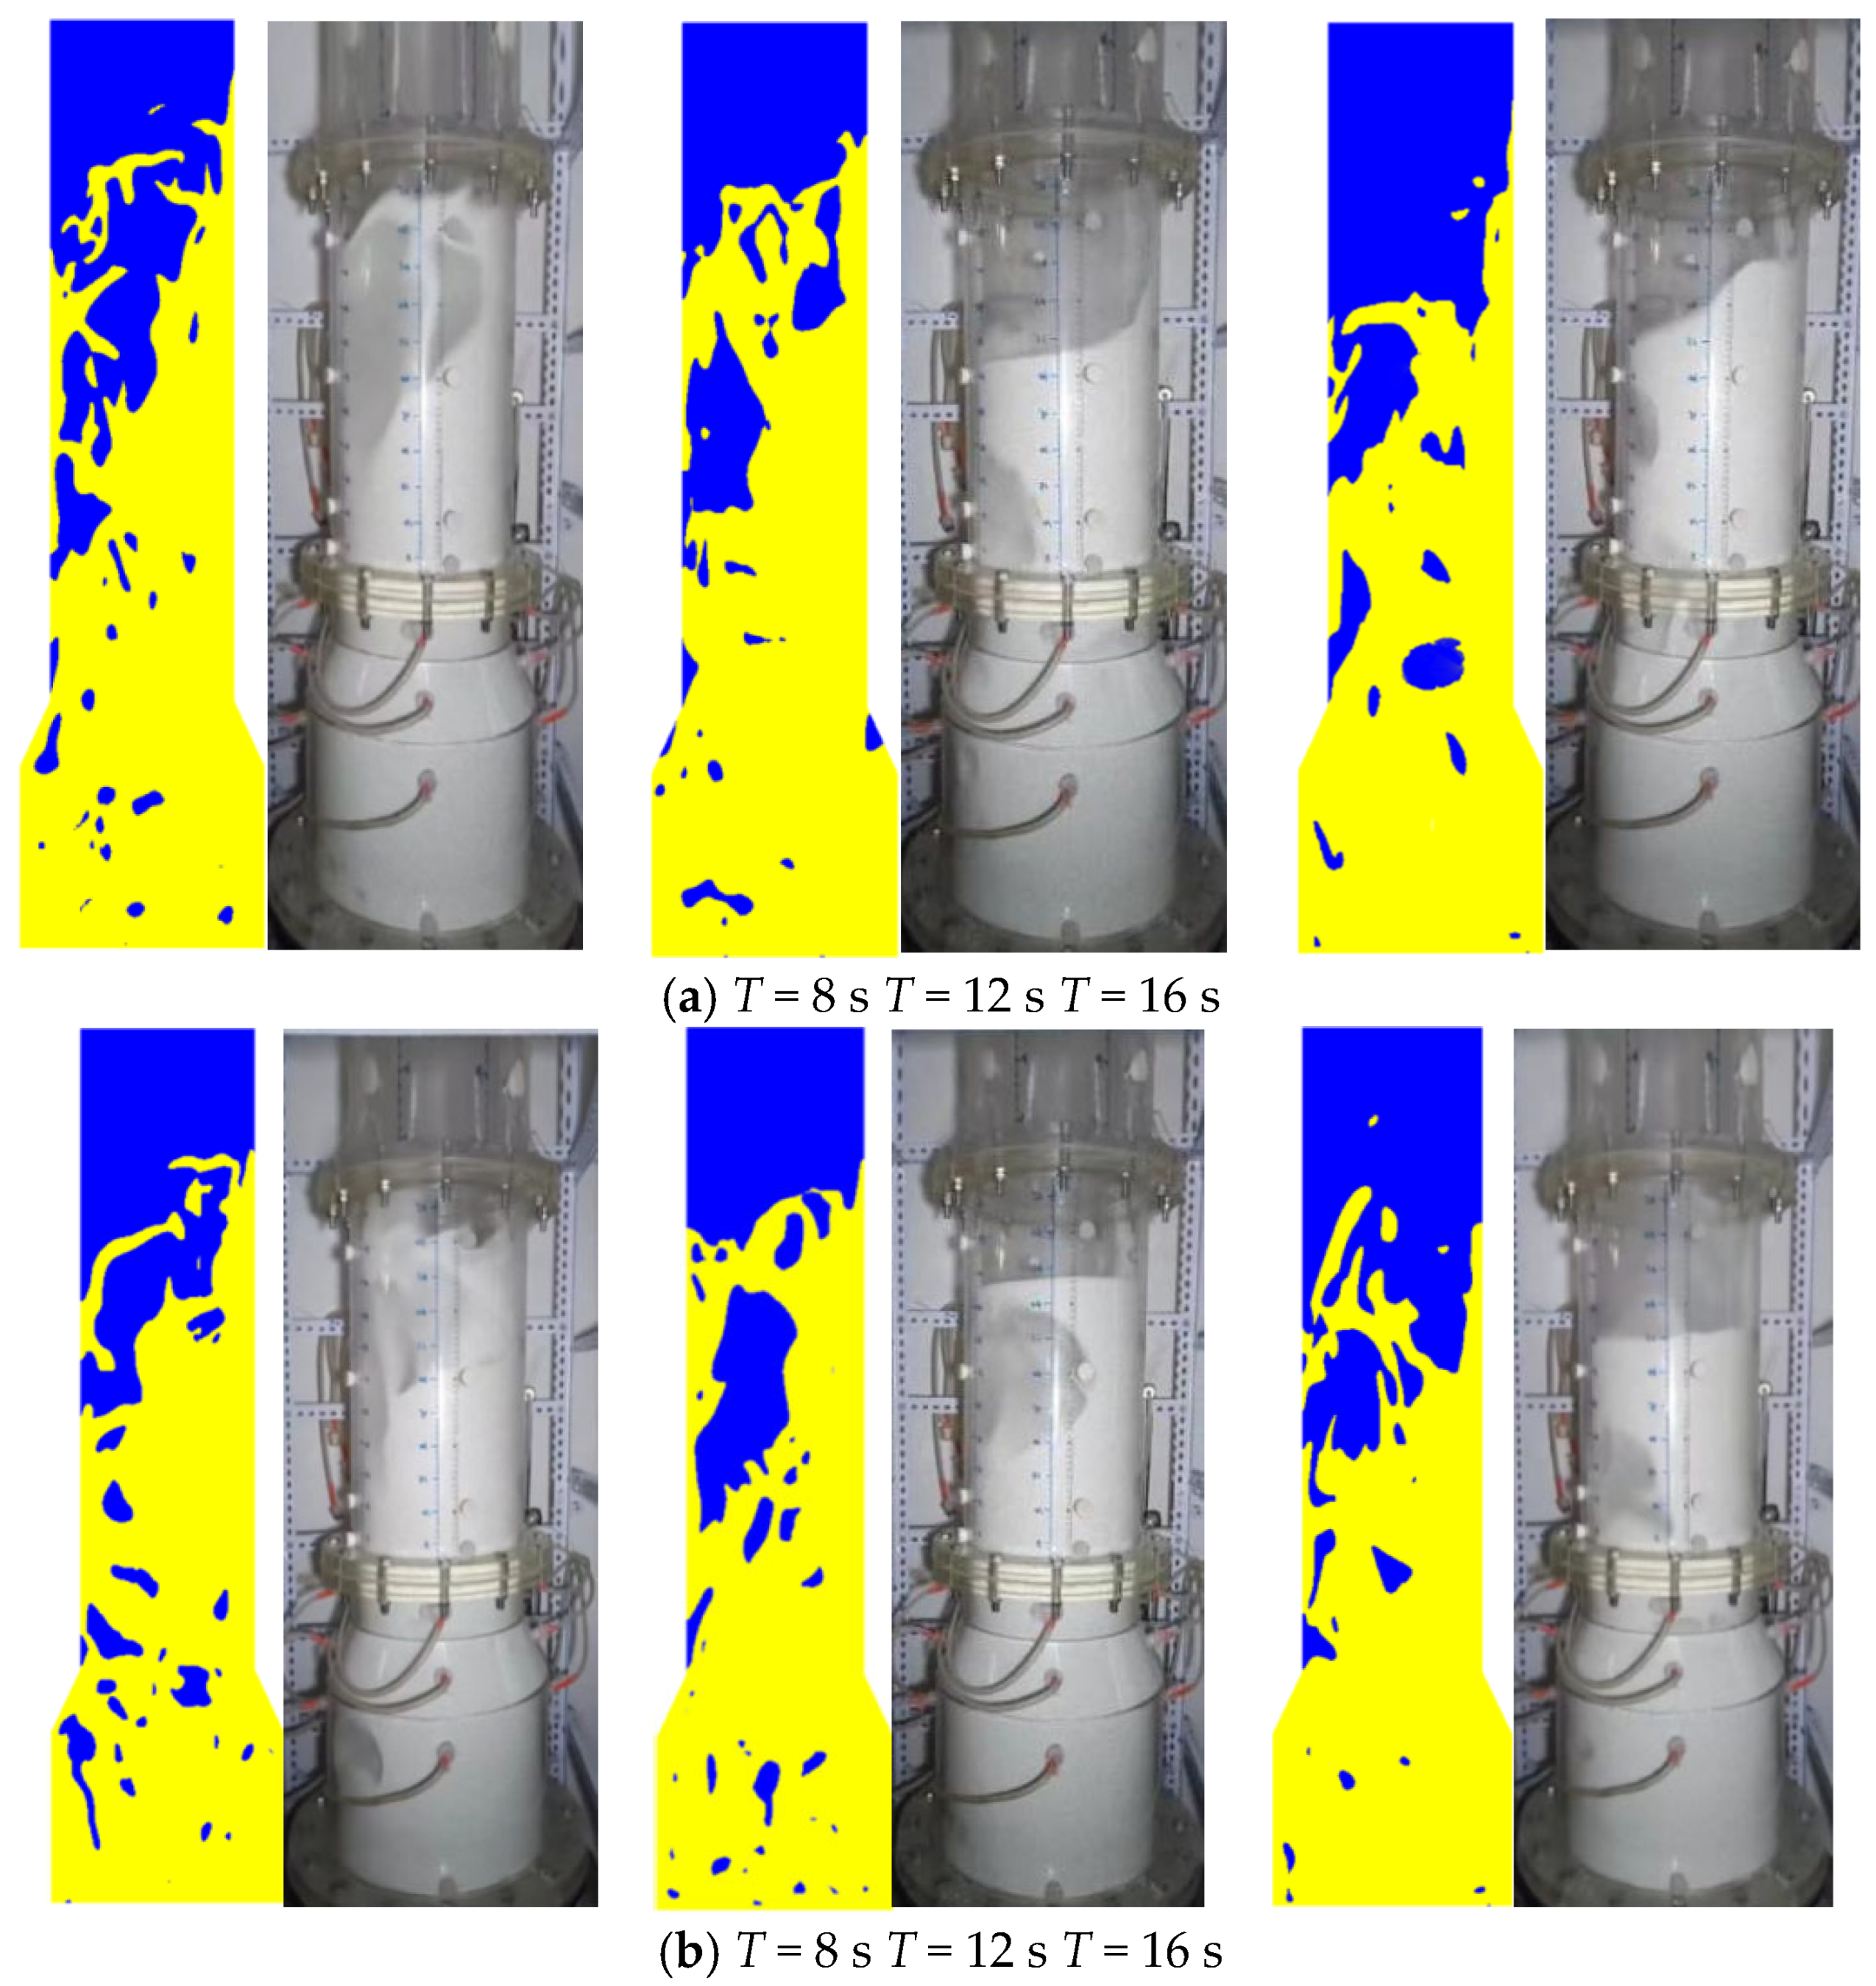
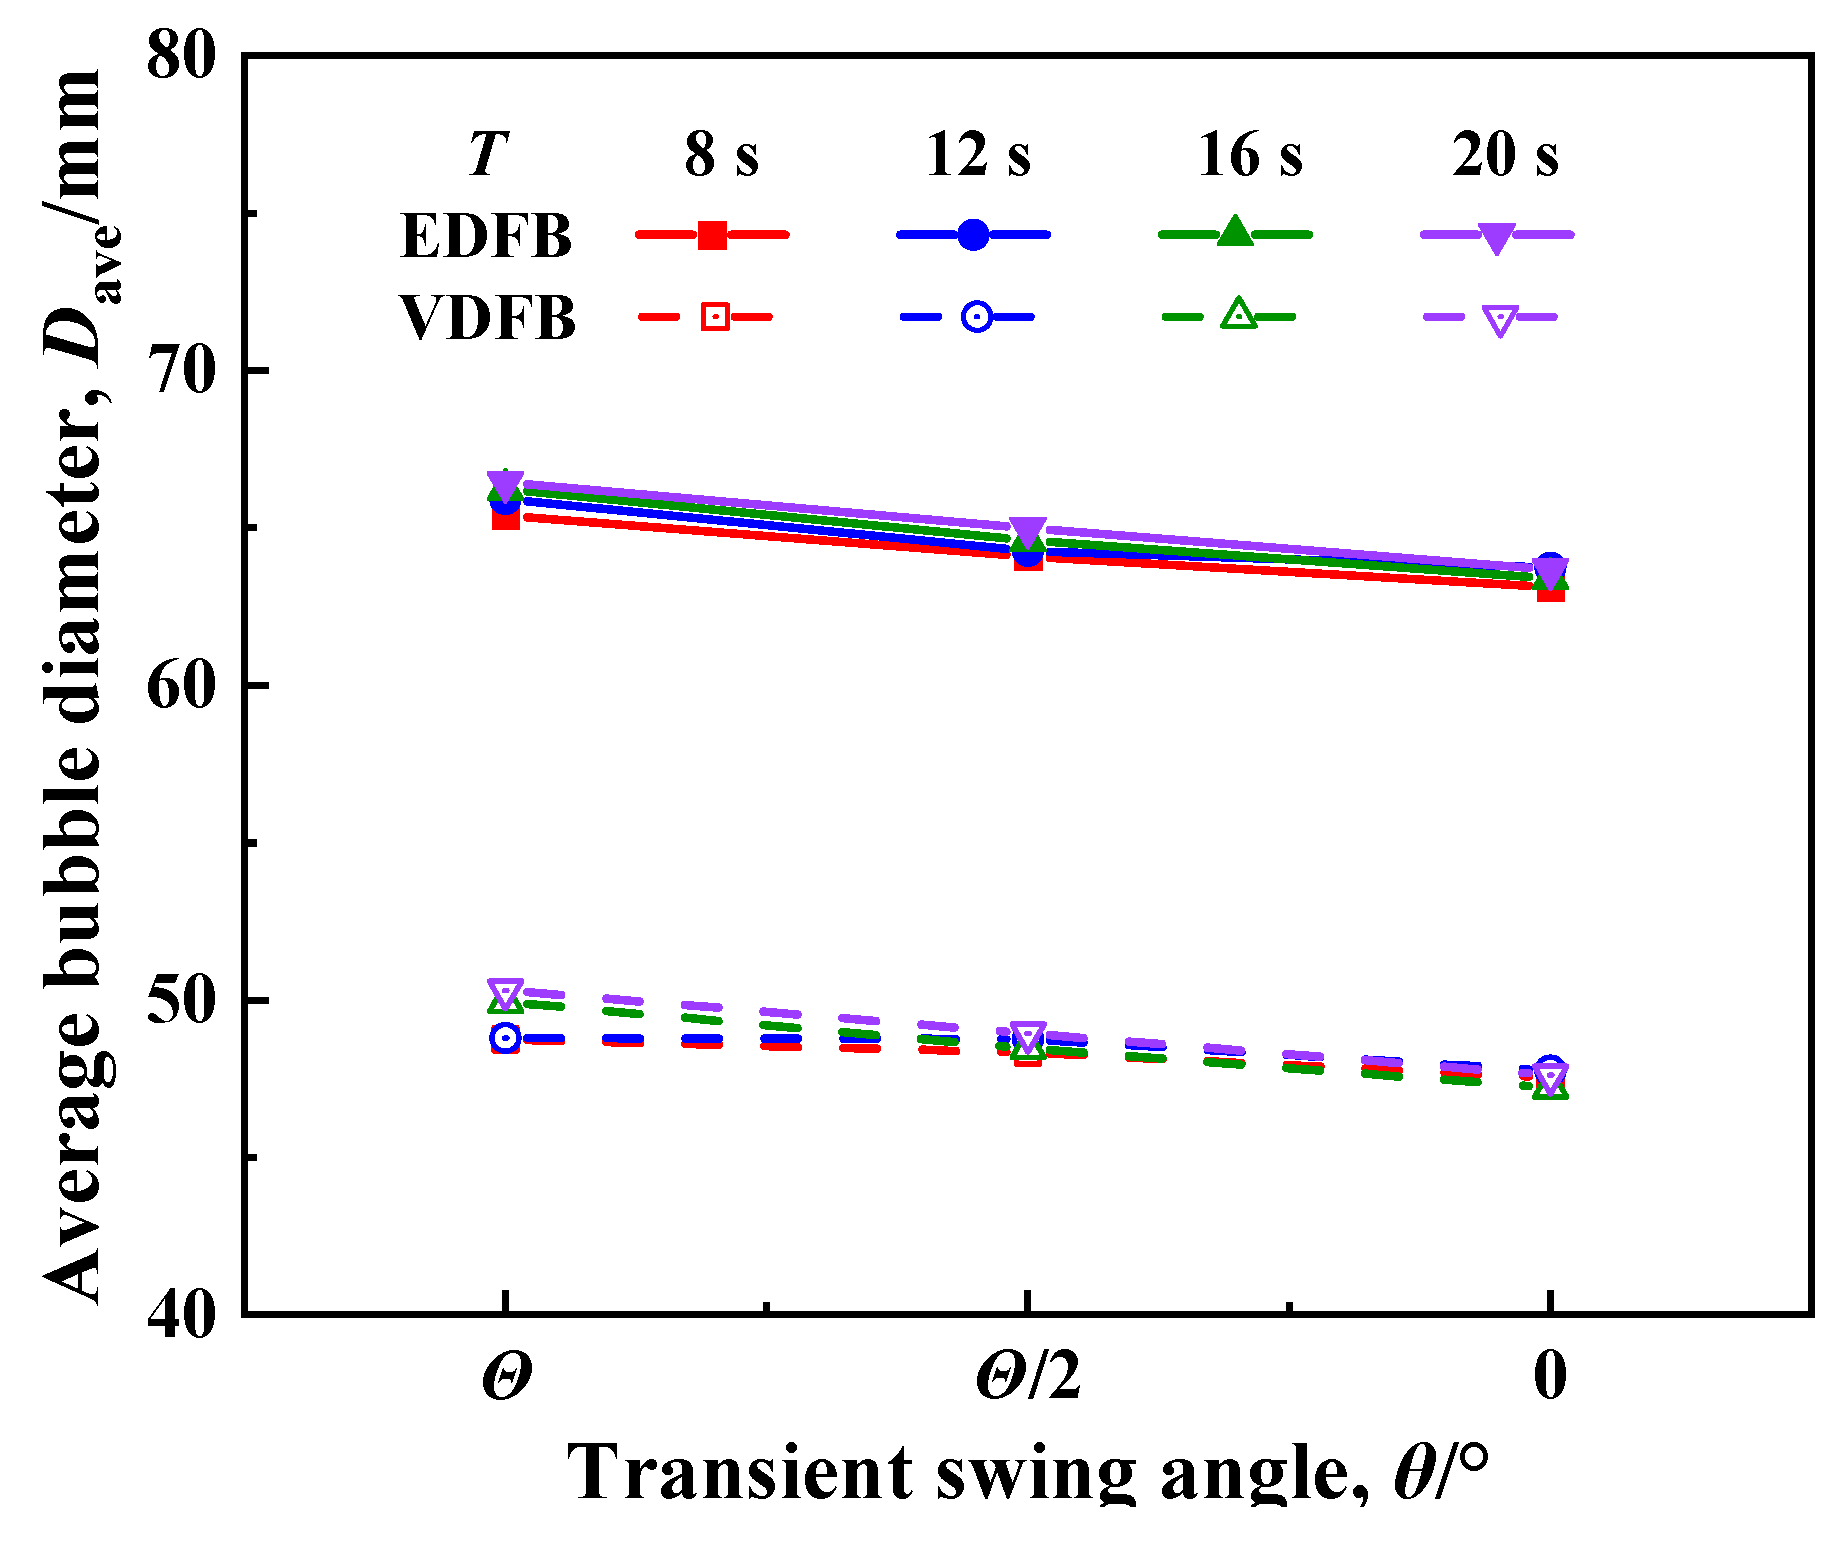
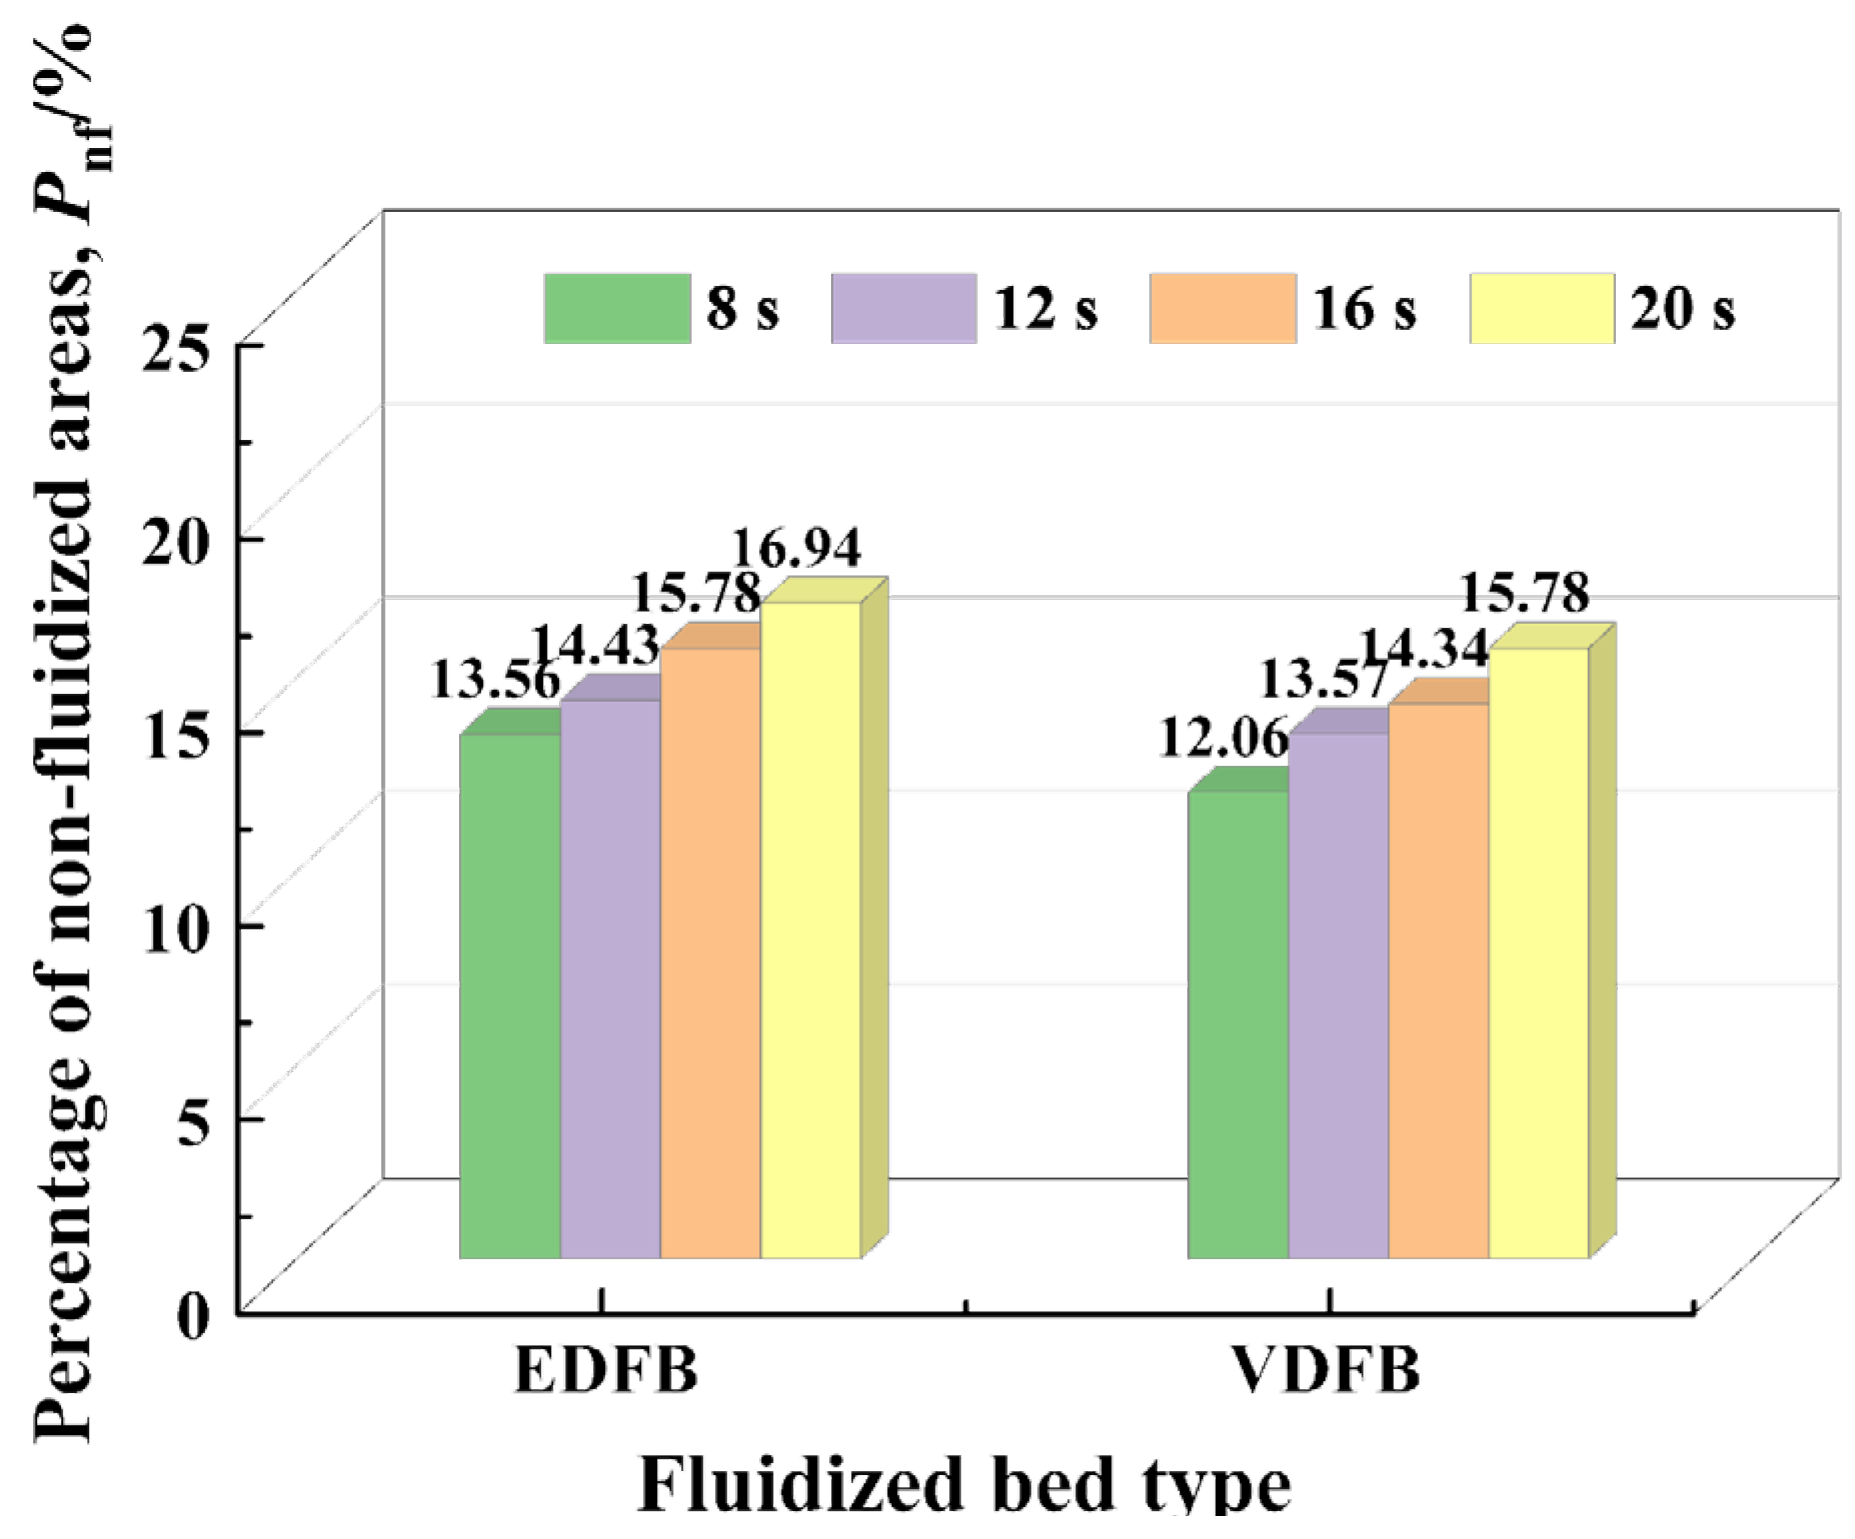
3.2.4. Effect of Oscillation Period T on Fluidization Quality

Figure 20 shows the bubble mean diameter distribution patterns of the equal-diameter fluidized bed and the variable-diameter fluidized bed under different oscillation periods (T = 8 s, 12 s, 16 s, 20 s) at Θ = 10°, H = 800 mm, Q = 136 m3/h. It was found that the variable-diameter fluidized bed showed a significant bubble refinement effect compared with the equal-diameter fluidized bed under different working conditions, and its average bubble diameter was reduced by about 25% compared with that of the equal-diameter fluidized bed. This indicates that the variable-diameter fluidized bed can effectively regulate the gas–solid two-phase flow field by designing a variable-diameter structure, which can inhibit the aggregation behavior of bubbles and enhance the fluidization efficiency in the fluidized bed. From the specific simulation data, when the swing period is gradually increased from T = 8 s to T = 20 s, the bubble mean diameter distribution of the equal-diameter fluidized bed fluctuates in the range of 63~67 mm. In contrast, the corresponding value of the variable-diameter fluidized bed is stable in the range of 47~51 mm. The change in the swing period significantly influences the bubble mean diameter of both beds. The effect of swing period change on the mean bubble diameter of both is small, and the maximum deviation is below 5%.
Figure 21 compares the percentage of non-fluidized area within the equal-diameter fluidized bed and the variable-diameter fluidized bed at different oscillation periods. The figure shows that the percentage of non-fluidized area in both bed structures increases gradually with increasing oscillation period. Quantitative analysis reveals that as the oscillation period increases from 8 s to 12 s, 16 s, and 20 s, the increase in non-fluidized areas for the equal-diameter fluidized bed is 6.42%, 16.37%, and 24.93%, respectively, and for the variable-diameter fluidized bed is 12.52%, 18.91%, and 30.85%, respectively. A comparison of these increases shows that the growth in non-fluidized areas is larger in the variable-diameter fluidized bed than in the equal-diameter fluidized bed. However, crucially, at the same oscillation period, the percentage of non-fluidized area in the variable-diameter fluidized bed is consistently lower than that in the equal-diameter fluidized bed. Analysis of the specific values confirms this reduction: at oscillation periods of 8 s, 12 s, 16 s, and 20 s, the non-fluidized areas in the variable-diameter fluidized bed are reduced by 11.06%, 5.96%, 9.13%, and 6.85%, respectively, compared to the equal-diameter fluidized bed.

4. Conclusions

In this paper, a numerical simulation method is used to compare the fluidization quality of variable-diameter- and equal-diameter-structured fluidized beds by taking the bubble size and the percentage of non-fluidized area as the measurement indexes. The study determines the specific structural form of the variable-diameter fluidized bed, on the basis of which the mechanism of the variable-diameter structure and the influence of the operating conditions on the fluidization quality of the variable-diameter fluidized bed are investigated, and the main conclusions are drawn as follows.
(1) Compared with the traditional equal-diameter fluidized bed, which has a bed diameter of 300 mm, the “cone-contraction” variable-diameter fluidized bed significantly improves the fluidization quality through structural innovation. Under the same gas flow rate, the bubble size is reduced by 25% on average, and the percentage of non-fluidized area is reduced by 11%, which is better than the comprehensive performance of the “cone-expansion” reducer structure and the single equal-diameter bed. The optimization mechanism of this structure consists of a double effect. Firstly, the dilatation and deceleration effect in the lower equal-diameter section reduces the bubble aggregation rate, which leads to the reduction in bubble size. At the same time, this effect creates more flow vortices in the lower part, which significantly promotes particle fluidization. Secondly, when the gas passes through the cone section to reduce the size, it generates a speed-up effect, which increases the particle velocity in the cone section. The speed-up effect enhances the momentum exchange between the particles, leading to more particles in the upper part to participate in fluidization. The synergistic effect of these two types of effects ultimately reduces the percentage of non-fluidized area.
(2) In this paper, the influence law of operating parameters on the fluidization quality of variable-diameter fluidized bed is derived from this study.
Gas flow rate (Q): Although increasing the gas flow rate will increase the bubble size due to bubble aggregation, the non-fluidized areas can be significantly reduced by enhancing the particle movement, reflecting the dual effect of flow rate control.
Initial bed height (H): Increasing the bed height will intensify the bubble aggregation and the formation of non-fluidized areas at the same time, resulting in the simultaneous increase in bubble size and the percentage of non-fluidized area.
Oscillation amplitude (Θ): With the increase in amplitude, the bubble size shows a non-monotonous trend of increasing and then decreasing, but the percentage of non-fluidized area increases significantly, resulting in the overall deterioration of fluidization quality.
Oscillation period (T): The change in period has a small effect on bubble size, and the percentage of non-fluidized area only increases slightly with the extension of period, which indicates that its sensitivity to fluidization quality is low.
(3) Under different operating conditions, the “cone-contraction” variable-diameter fluidized bed consistently demonstrated significant performance advantages over the reference equal-diameter fluidized bed, achieving bubble size reductions of 24%~32% and percentage of non-fluidized area reductions of 6%~12%. This demonstrates that the variable-diameter structure universally enhances the fluidization process in an oscillating fluidized bed, particularly by inhibiting bubble growth and activating particle motion.
The study of the above provides design ideas and directions for improving the fluidization quality of gas–solid fluidized beds in marine environments. Therefore, future work should improve the numerical simulation methods by incorporating key elements of the actual marine environment, such as multi-degree-of-freedom motion coupling and random waves. This will better align the research findings with real-world application scenarios and provide more reliable theoretical support for engineering design in marine environments.

Author Contributions

Conceptualization, D.Z., D.W., B.Z. and S.Z.; methodology, D.Z.; software, D.Z.; validation, D.Z., Q.Z., X.Y. and R.X.; formal analysis, D.W.; investigation, D.Z.; resources, X.Y. and R.X.; data curation, Q.Z.; writing—original draft preparation, D.Z.; writing—review and editing, D.Z.; visualization, R.W.; supervision, D.W.; project administration, X.Y.; funding acquisition, D.W. All authors have read and agreed to the published version of the manuscript.

Funding

This research was funded by the Natural Science Foundation of Hebei Province (B2022202003, B2024202061) and the Cooperative Project for Industry-University-Research between Universities in Hebei Province and Shijiazhuang City: (241790637A). The APC was funded by the Natural Science Foundation of Hebei Province.

Data Availability Statement

No new data were created.

Acknowledgments

This work was supported by the Natural Science Foundation of Hebei. No. B2022202003, B2024202061 and the Cooperative Project for Industry-University-Research between Universities in Hebei Province and Shijiazhuang City. No. 241790637A.

Conflicts of Interest

The authors declare no conflicts of interest.

Nomenclature

DEqual-diameter fluidized bed diametermm
DaveAverage bubble diametermm
DLThe diameter of the cross-section under the bedmm
DUThe diameter of the cross-section on the bedmm
gGravitational accelerationm/s2
HThe initial loading height of the bed layermm
hAxial height of the bedmm
hbThe height of the equal-diameter section under the bedmm
hcThe height of the cone section of the bedmm
htThe height of the equal-diameter section of the bedmm
PnfPercentage of non-fluidized area%
QGas flow ratem3/h
TOscillation cycles
ugApparent gas velocitym/s
uglApparent gas velocity in the lower diameter sectionm/s
uguApparent gas velocity in the upper diameter sectionm/s
xThe transverse direction of the bed
yThe longitudinal direction of the bed
zThe axial direction of the bed
ΘOscillation amplitude°
θInstantaneous swing angle°
βThe angle between the cone generatrix and the vertical direction°
ρbParticle packing densitykg/m3
ρgGas densitykg/m3
ρpParticle densitykg/m3
μgGas viscositykg/(m∙s)
μsParticle viscositykg/(m∙s)
εgGas volume fraction
εsSolid volume fraction
ωInstantaneous swing angular velocityrad/s
αωInstantaneous angular acceleration of bed swingrad/s2
Subscript
gGas phase
sParticle phase

References

  1. Zhang, Y.; Lu, D.; Wang, Z.; Wang, J.; Pan, Q.; Su, S. Modeling and simulation of six degrees of freedom marine stable platform. In Proceedings of the International Conference on Mechatronic Engineering and Artificial Intelligence (MEAI 2023), Shenyang, China, 28 February 2024. [Google Scholar] [CrossRef]
  2. Yang, W.; Zhou, X.; Lv, H.; Zhang, G.; Hou, Z.; Wang, W. Design and Simulation of Measurement and Control System for Six Degree of Freedom Active Wave Compensation Device. Integr. Technol. 2021, 10, 50–62. [Google Scholar] [CrossRef]
  3. Sarbanha, A.A.; Larachi, F.; Taghavi, S.M. Bubble and particle dynamics in a thin rectangular bubbling fluidized bed under emulated marine instabilities. Chem. Eng. Sci. 2023, 280, 119041. [Google Scholar] [CrossRef]
  4. Su, B.; Lin, M.; Wang, Q. Study on the flow mixing of hot and cold fluids in the T-junction under rolling motion condition. Nucl. Eng. Des. 2023, 403, 112126. [Google Scholar] [CrossRef]
  5. Li, Z.; Wang, M.; Fan, G.; Zeng, X.; Yan, Y.; Ma, F. Effects of rolling motion on flow and heat transfer characteristics in a tube bundle channel. Appl. Therm. Eng. 2023, 220, 119696. [Google Scholar] [CrossRef]
  6. Hao, X.; Tang, M.; Wang, R.; Wang, D.; Zhang, S. Bubble motion characteristics of gas-solid oscillating fluidized bed. J. Process Eng. 2023, 23, 512–522. [Google Scholar] [CrossRef]
  7. Tian, P.; Wang, D.; Wang, R.; Tang, M.; Hao, X.; Zhang, S. Gas solid flow characteristics of oscillating fluidized bed. J. Chem. Eng. 2021, 72, 5102–5113. [Google Scholar] [CrossRef]
  8. Huang, J. The Spatiotemporal Dynamic Characteristics of Gas-Solid Flow in Oscillating Fluidized Beds. Master’s Thesis, Hebei University of Technology, Tianjin, China, 2023. [Google Scholar]
  9. Xu, R.; Wang, R.; Wu, B.; Yuan, X.i.; Wang, D.; Liu, Y.; Zhang, S. Simulation of bubble behavior characteristics in a rolling fluidized bed with the addition of longitudinal internal members. Processes 2024, 12, 1130. [Google Scholar] [CrossRef]
  10. Sarbanha, A.A.; Larachi, F.; Taghavi, S.M. Strategizing internals’ geometry to improve resilience of marinized bubbling fluidized beds to roll-induced maldistribution. Chem. Eng. Sci. 2025, 302, 120817. [Google Scholar] [CrossRef]
  11. Jiang, K.; Wang, F.; Kong, Y.; Xu, C.; Du, X. Experimental investigation on the hydrodynamic characteristics of fluidized bed particle solar receiver with gas-solid countercurrent flow pattern. J. Therm. Sci. 2021, 30, 2241–2253. [Google Scholar] [CrossRef]
  12. Sirisomboon, K.; Arromdee, P. A computational fluid dynamics study of gas-solid distribution of Geldart Group B particles in a swirling fluidized bed. Powder Technol. 2021, 393, 734–750. [Google Scholar] [CrossRef]
  13. Hu, C. Experimental Study on Cold Model of Circulating Fluidized Bed Variable-Diameter Riser. Master’s Thesis, China University of Petroleum, Beijing, China, 2009. [Google Scholar] [CrossRef]
  14. Chen, Y.; Zhang, Y. Numerical simulation of gas-solid flow characteristics in the variable-diameter fluidized bed reactor. J. Jinan Univ. (Nat. Sci. Ed.) 2020, 34, 384–389+409. [Google Scholar] [CrossRef]
  15. Zhao, M. Research progress on conical bubbling fluidized bed. Chem. Eng. Equip. 2022, 10, 207–208. [Google Scholar] [CrossRef]
  16. Sau, D.C.; Mohanty, S.; Biswal, K.C. Minimum fluidization velocities and maximum bed pressure drops for gas-solid tapered fluidized beds. Chem. Eng. J. 2007, 132, 151–157. [Google Scholar] [CrossRef]
  17. Gong, W.; Hong, T.; Yan, H. Characteristics of local flow structure with different particle properties in a gas-solid diameter-varying fluidized bed. Powder Technol. 2024, 433, 119202. [Google Scholar] [CrossRef]
  18. Bahramian, A.; Olazar, M. Multi-stage agglomeration phenomena and properties of titania nanoparticle agglomerates in a lab-scale conical fluidized bed: Evaluation of CFD-DEM simulation by laser-based planar imaging and pressure fluctuation analysis. Powder Technol. 2025, 453, 120621. [Google Scholar] [CrossRef]
  19. Fang, S. Fluidisation Characterisation and Modelling Based on Pressure Signal Monitoring in a Conical Fluidised Bed. PhD’s Thesis, Zhejiang University, Hangzhou, China, 2021. [Google Scholar] [CrossRef]
  20. Ma, S. Numerical Simulation of Geldart A-Class Granular Turbulent Bed. Master’s Thesis, Hebei University of Technology, Tianjin, China, 2019. [Google Scholar] [CrossRef]
  21. Sun, M.; Yu, C.; Lv, D.; Wei, L. Adaptability of different liquid-solid momentum exchange coefficient models for numerical simulation of particle fluidization behavior. J. Cent. South Univ. (Nat. Sci. Ed.) 2019, 50, 1–8. [Google Scholar] [CrossRef]
  22. Bai, L.; Han, C.; Xu, Y.; Zhou, L.; Zhang, L.; Shi, W. Numerical simulation and experimental study of CFD-DEM for bubbling fluidized bed based on different drag models. J. Irrig. Drain. Mach. Eng. 2022, 40, 49–54. [Google Scholar] [CrossRef]
  23. Wu, C.; Gao, X.; Cheng, Y.; Wang, L.; Li, X. Experimental and numerical simulation of solid content distribution characteristics in the transition section of a turbulent fluidized bed. J. Chem. Eng. 2013, 64, 858–866. [Google Scholar] [CrossRef]
  24. Wu, Y.; Peng, L.; Gao, J.; Lan, X. Simulation of gas-solid bubbling bed based on EMMS model and analysis of bubble characteristics. J. Chem. Eng. 2016, 67, 3259–3267. [Google Scholar] [CrossRef]
  25. Chai, X.; Wang, A.; Fu, Z.; Duan, C.; Bi, X. Identification of the flow structure of dense phase in a gas-solid fluidized bed reactor in bubbling fluidization regime with Geldart B+A particles. Chem. Eng. Sci. 2025, 308, 121424. [Google Scholar] [CrossRef]
  26. Tu, N.; Wang, C.; Liu, X.; Liu, J.; Fang, J. Numerical simulation of the influence of multi-stage baffles on the residence time distribution of particles in a cross flow bubbling bed. J. Process Eng. 2024, 24, 1047–1057. [Google Scholar] [CrossRef]
  27. Xu, P. Numerical Simulation and Structural Optimization Design of Two-Phase Flow Characteristics in Gas-Solid Fluidized Beds. Master’s Thesis, Qingdao University of Science and Technology, Qingdao, China, 2020. [Google Scholar] [CrossRef]
  28. Wu, F.; Yang, C.; Che, X.; Ma, X.; Yan, Y.; Zhou, W. Numerical and experimental study of integral multi-jet structure impact on gas-solid flow in a 3D spout-fluidized bed. Chem. Eng. J. 2020, 393, 124737. [Google Scholar] [CrossRef]
  29. Wang, S. Euler Lagrange Numerical Simulation Study on Dense Gas-Solid Two-Phase Reactive Flow in Fluidized Bed. PhD Thesis, Zhejiang University, Hangzhou, China, 2019. [Google Scholar] [CrossRef]
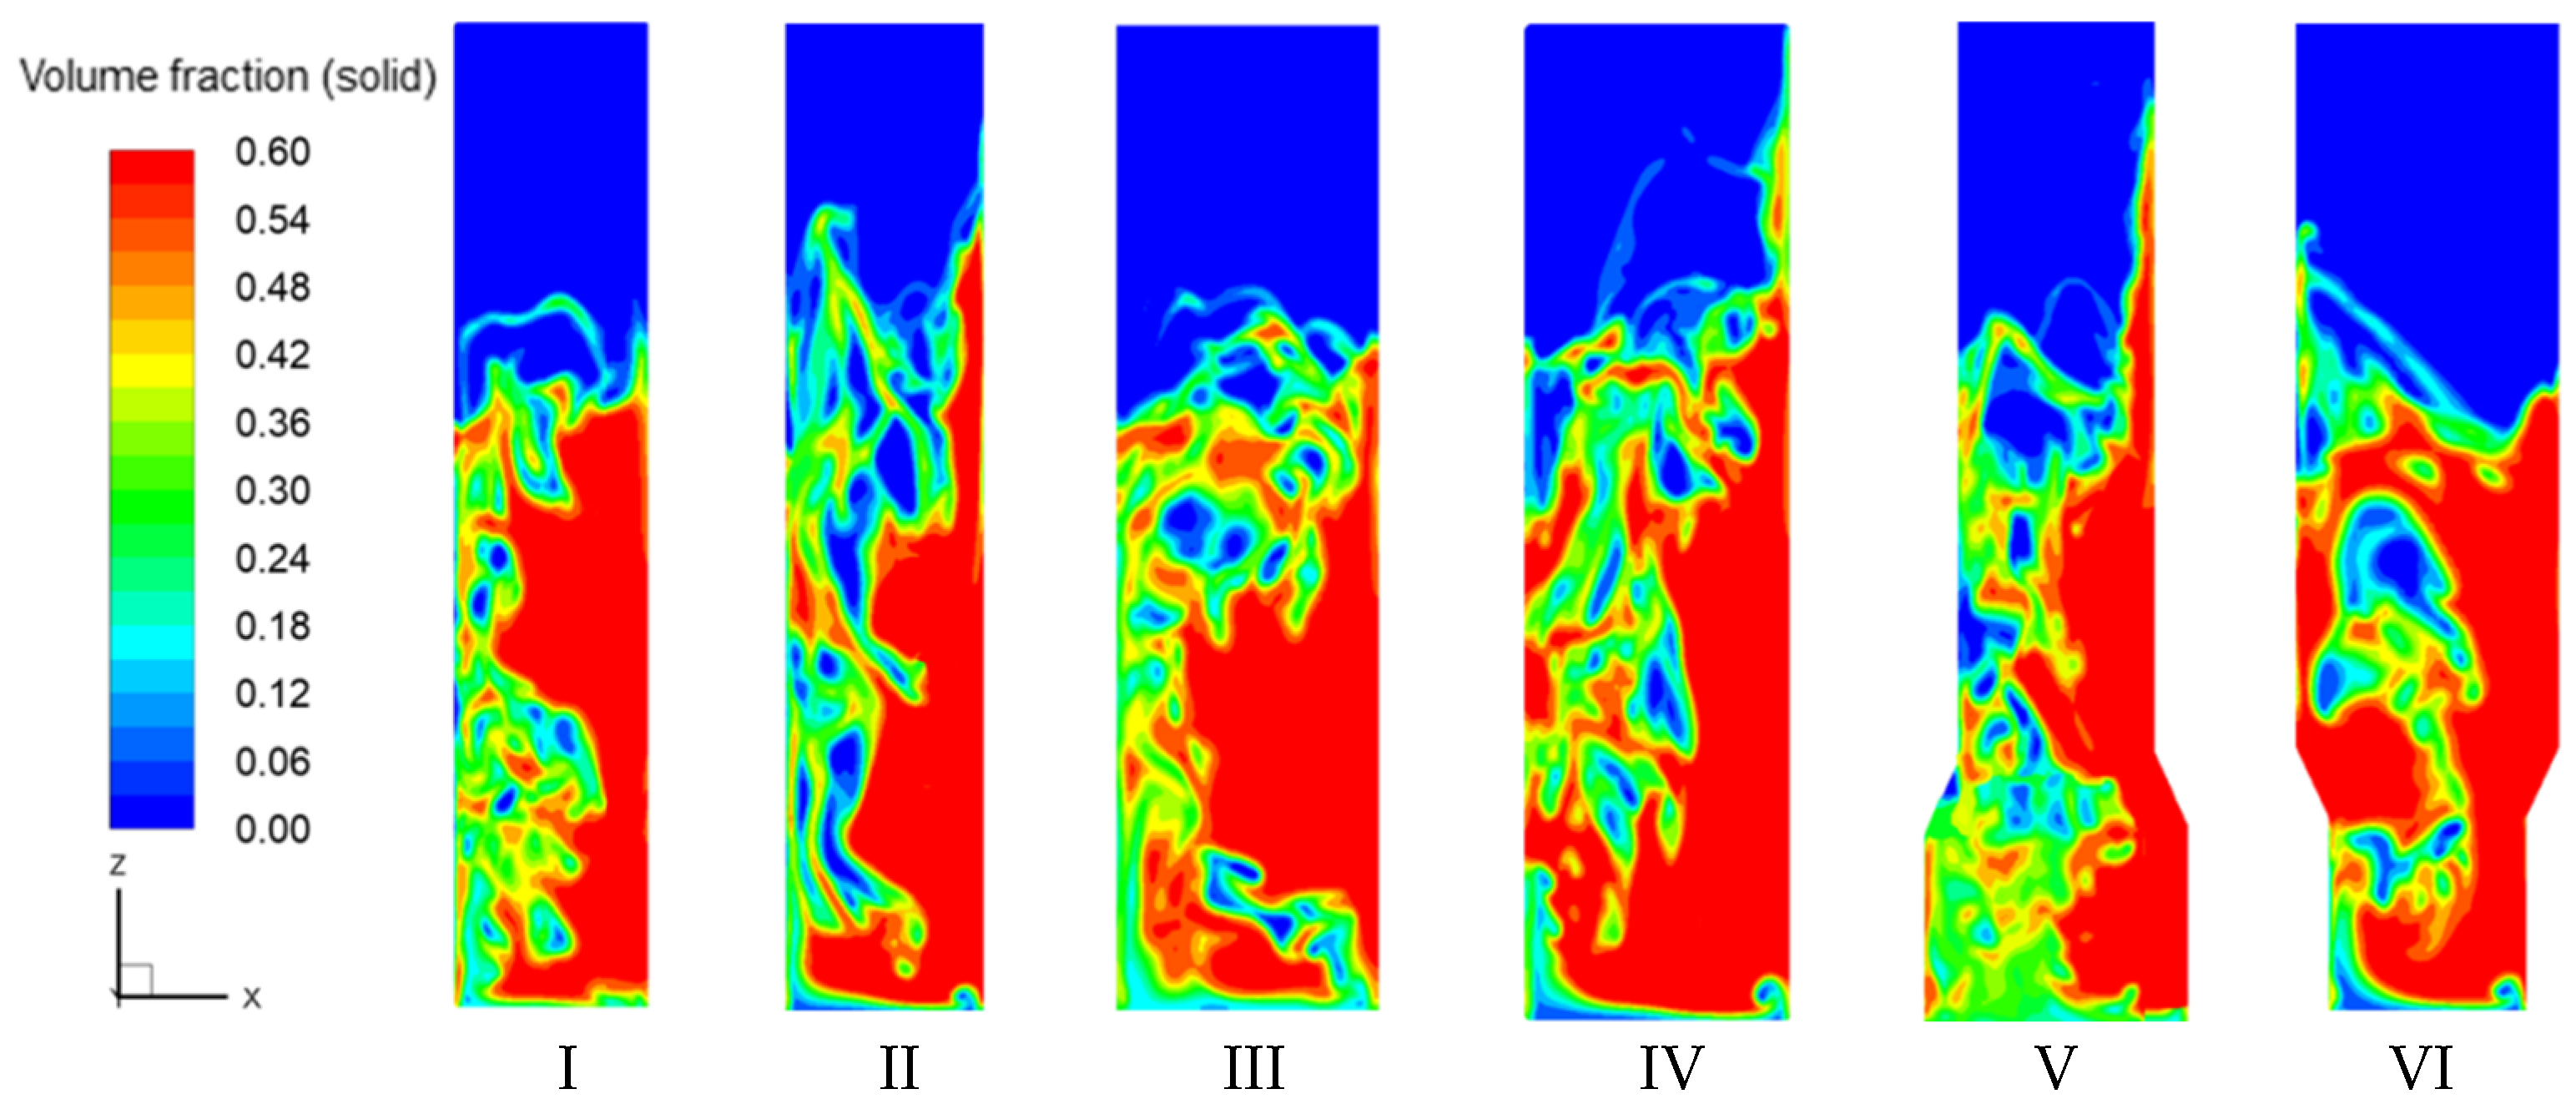
Figure 1. Geometric modeling and meshing (Unit: mm). (a) Geometric modeling; (b) meshing.
Processes 13 01778 g001
Figure 2. Changes in instantaneous swing angle and instantaneous angular velocity of a swinging bed. (a) Bed swing mode; (b) instantaneous pendulum angle and angular velocity over time.
Processes 13 01778 g002
Figure 3. Grid independence verification.
Processes 13 01778 g003
Figure 4. Comparison of experimental and simulated data on the variation in bed pressure along axial height under different oscillating conditions. (Q = 136 m3/h, T = 8 s, H = 800 mm) (a) Θ = 5°; (b) Θ = 10°.
Processes 13 01778 g004
Figure 5. Comparison of simulated and experimental flow field distribution inside fluidized bed under different oscillating conditions (t = T/4, Q = 136 m3/h, H = 800 mm) (a) Θ = 5°; (b) Θ = 10°.
Processes 13 01778 g005
Figure 6. Bubble extraction method. (a) Solids distribution; (b) two-color picture; (c) greyscale plot; (d) binarized plot; (e) resulting plot.
Processes 13 01778 g006
Figure 7. Methods for obtaining non-fluidized areas. (T = 8 s, Θ = 10°, θ = 10°) (a) Solids distribution; (b) binarized plot; (c) stacked plot; (d) resulting plot.
Processes 13 01778 g007
Figure 8. Solid content distribution (Θ = 10°, T = 8 s, H = 800 mm, Q = 136 m3/h, θ = 10°). (I: EDFB, D = 300 mm; II: EDFB, D = 300 mm; III: EDFB, D = 400 mm; IV: EDFB, D = 400 mm; V: “cone-contraction”VDFB, DL = 400 mm, DU = 300 mm; VI:“cone-expansion”VDFB, DL = 300 mm, DU = 400 mm).
Processes 13 01778 g008
Figure 9. The average bubble diameters in oscillating fluidized beds of different configurations (T = 8 s, Θ = 10°). (I: EDFB, D = 300 mm; II: EDFB, D = 300 mm; III: EDFB, D = 400 mm; IV: EDFB, D = 400 mm; V: “cone-contraction”VDFB, DL = 400 mm, DU = 300 mm; VI: “cone-expansion”VDFB, DL = 300 mm, DU = 400 mm).
Processes 13 01778 g009
Figure 10. Percentage of non-fluidized area in oscillating fluidized beds of different configurations (T = 8 s, Θ = 10°, θ = 10°). (I: EDFB, D = 300 mm; II: EDFB, D = 300 mm; III: EDFB, D = 400 mm; IV: EDFB, D = 400 mm; V: “cone-contraction”VDFB, DL = 400 mm, DU = 300 mm; VI:“cone-expansion”VDFB, DL = 300 mm, DU = 400 mm).
Processes 13 01778 g010
Figure 11. Bubble distribution (Θ = 10°, T = 8 s, H = 800 mm, Q = 136 m3/h, θ = 10°).(I: EDFB, D = 300 mm; II: EDFB, D = 300 mm; III: EDFB, D = 400 mm; IV: EDFB, D = 400 mm; V: “cone-contraction”VDFB, DL = 400 mm, DU = 300 mm; VI:“cone-expansion”VDFB, DL = 300 mm, DU = 400 mm).
Processes 13 01778 g011
Figure 12. Non-fluidized regional distribution (Θ = 10°, T = 8 s, H = 800 mm, Q = 136 m3/h, θ = 10°). (I: EDFB, D = 300 mm; II: EDFB, D = 300 mm; III: EDFB, D = 400 mm; IV: EDFB, D = 400 mm; V: “cone-contraction”VDFB, DL = 400 mm, DU = 300 mm; VI:“cone-expansion”VDFB, DL = 300 mm, DU = 400 mm).
Processes 13 01778 g012
Figure 13. Particle velocity vector distribution (Θ = 10°, T = 8 s, H = 800 mm, Q = 136 m3/h, θ = 10°). (I: EDFB, D = 300 mm; II: EDFB, D = 300 mm; III: EDFB, D = 400 mm; IV: EDFB, D = 400 mm; V: “cone-contraction”VDFB, DL = 400 mm, DU = 300 mm; VI:“cone-expansion”VDFB, DL = 300 mm, DU = 400 mm).
Processes 13 01778 g013
Figure 14. Average bubble diameter at different gas flow rates (Θ = 10°, T = 8 s, H = 800 mm).
Processes 13 01778 g014
Figure 15. The percentage of non-fluidized area inside the bed at different gas flow rates (Θ = 10°, T = 8 s, H = 800 mm, θ = 10°).
Processes 13 01778 g015
Figure 16. Average bubble diameter at different initial bed material height (Θ = 10°, T = 8 s, Q = 136 m3/h).
Processes 13 01778 g016
Figure 17. The percentage of non-fluidized area inside the bed at different initial bed material height (Θ = 10°, T = 8 s, Q = 136 m3/h, θ = 10°).
Processes 13 01778 g017
Figure 18. Effect of oscillation amplitude on the average bubble diameters in the variable-diameter fluidized bed (T = 8 s, H = 800 mm, Q = 136 m3/h).
Processes 13 01778 g018
Figure 19. Effect of oscillation amplitude on the percentage of non-fluidized area in the variable-diameter fluidized bed (T = 8 s, H = 800 mm, Q = 136 m3/h, θ = Θ).
Processes 13 01778 g019
Figure 20. Average bubble diameter at different swing cycles (Θ = 10°, H = 800 mm, Q = 136 m3/h).
Processes 13 01778 g020
Figure 21. The percentage of non-fluidized area inside the bed at different swing cycles (Θ = 10°, H = 800 mm, Q = 136 m3/h, θ = 10°).
Processes 13 01778 g021
Table 1. Variable-diameter methods and comparison of equal-diameter fluidized bed structures and operating parameter settings.
Serial NumberFluidized Bed Structure and DiameterSuperficial Gas Velocity (m/s)
IEDFB D = 300 mmug = 0.30
IIEDFB D = 300 mmug = 0.53
IIIEDFB D = 400 mmug = 0.30
IVEDFB D = 400 mmug = 0.53
V“cone-contraction” VDFB
DL = 400 mm, DU = 300 mm
ugl = 0.30, ugu = 0.53
VI“cone-expansion” VDFB
DL = 300 mm, DU = 400 mm
ugl = 0.53, ugu = 0.30
Disclaimer/Publisher’s Note: The statements, opinions and data contained in all publications are solely those of the individual author(s) and contributor(s) and not of MDPI and/or the editor(s). MDPI and/or the editor(s) disclaim responsibility for any injury to people or property resulting from any ideas, methods, instructions or products referred to in the content.

