Article

Analyzing the Nitrate Content in Various Bell Pepper Varieties Through Non-Destructive Methods Using Vis/NIR Spectroscopy Enhanced by Metaheuristic Algorithms

by
Meysam Latifi-Amoghin
1,*,
Yousef Abbaspour-Gilandeh
1,*,
Mohammad Tahmasebi
1,
Asma Kisalaei
1,
José Luis Hernández-Hernández
2,*,
Mario Hernández-Hernández
3 and
Eduardo De La Cruz-Gámez
4
1
Department of Biosystems Engineering, College of Agriculture and Natural Resources, University of Mohaghegh Ardabili, Ardabil 5619911367, Iran
2
National Technological of México, Technological Institute of Chilpancingo, Chilpancingo 39070, Guerrero, Mexico
3
Faculty of Engineering, Autonomous University of Guerrero, Chilpancingo 39070, Guerrero, Mexico
4
National Technology of Mexico, Technological Institute of Acapulco, Acapulco 39905, Guerrero, Mexico
*
Authors to whom correspondence should be addressed.
Processes 2025, 13(6), 1731; https://doi.org/10.3390/pr13061731
Submission received: 14 May 2025 / Revised: 27 May 2025 / Accepted: 30 May 2025 / Published: 31 May 2025

Abstract

Destructive methods, though traditionally used to evaluate fruit safety, frequently do not deliver complete and detailed information. Non-destructive methods, especially spectroscopy, provide an effective solution for fast, efficient, and non-invasive assessments of quality and safety. This study utilized visible and near-infrared (Vis-NIR) spectroscopy to quantify the nitrate content in three cultivars of bell pepper—orange, yellow, and red—across a spectral range spanning 350 to 1150 nanometers. The nitrate content was assessed destructively, and spectral data were examined through partial least squares regression (PLSR). Model efficacy was measured using the root mean square error (RMSE) and coefficient of determination (R2). The R2 values, indicative of the model’s predictive efficacy, were determined to be 0.77, 0.85, and 0.81 for the yellow, red, and orange types, respectively. To optimize wavelength selection and improve model performance, a hybrid approach was utilized, integrating a support vector machine (SVM) with four meta-heuristic algorithms: particle swarm optimization (PSO), genetic algorithm (GA), imperialistic competitive algorithm (ICA), and ant colony optimization (ACO). The SVM-PSO approach proved to be the most efficient in pinpointing 15 key wavelengths. Following this, three modeling techniques—PLSR, multiple linear regression (MLR), and artificial neural network (ANN)—were utilized with the identified wavelengths. Among these, ANN represented the best performance, achieving validation R2 values of 0.99, 0.97, and 0.92 for the yellow, red, and orange varieties, respectively. Compared to traditional PLSR and MLR models, which reached validation R2 values up to 0.93, the ANN model demonstrated a significant improvement in prediction accuracy. This quantitative improvement highlights the advantage of combining hybrid meta-heuristic wavelength selection with ANN modeling. The results underscore the promise of visible/near-infrared (Vis/NIR) spectroscopy, integrated with sophisticated modeling approaches, as an effective non-invasive method for estimating nitrate concentrations in bell peppers. This technique represents a significant advancement in supporting food safety measures and quality assurance processes.

1. Introduction

Bell peppers (Capsicum annuum L.), belonging to the Solanaceae family, are non-climacteric vegetables that exhibit diverse shapes, sizes, and colors depending on their maturity stage [1]. Green bell peppers, harvested prior to full ripening, are of significant economic and social importance globally, serving as a staple in both domestic cuisine and industrial applications [2]. Beyond their nutritional value as a rich source of ascorbic acid, bell peppers also provide a substantial amount of flavonoids, carotenoids, phenols, vitamins, saponins, nitrogen compounds, and minerals [3]. The increasing global demand for high-quality and safe bell peppers and other crops has spurred the development of innovative technologies to maintain their quality and extend their shelf life.
Nitrates, naturally present in water and soil, are absorbed by plant roots and accumulate in various plant tissues. Excessive application of organic and chemical fertilizers, often used to maximize greenhouse yields, can lead to elevated nitrate levels in vegetables [4]. On the other hand, excessive accumulation of nitrate in agricultural products, including bell peppers, can have serious public health implications. High nitrate intake leads to its conversion into nitrite in the digestive system. Nitrite can react with amines to form nitrosamines, which are recognized as carcinogenic compounds. This process may increase the risk of cancers in the gastrointestinal tract, stomach, and esophagus [5]. Additionally, high nitrate consumption can cause methemoglobinemia, or “blue baby syndrome,” a condition where nitrite oxidizes the iron in hemoglobin to form methemoglobin. Methemoglobin is unable to transport oxygen to body tissues, resulting in hypoxia and clinical symptoms such as bluish discoloration of the skin. Infants under six months old are particularly vulnerable to this condition due to their immature digestive systems [6]. To mitigate these risks, international organizations such as the European Commission have established maximum allowable nitrate levels in drinking water and food products. These standards are primarily designed to prevent methemoglobinemia in infants, but long-term risks, including cancer, have also been taken into consideration in their formulation [7]. A balanced approach involving nutrient-specific fertilizer application, informed by comprehensive plant monitoring, can help regulate nitrate levels within acceptable limits [8]. While stricter regulations on fertilizer use and expert recommendations could potentially reduce nitrate accumulation, traditional greenhouse practices often struggle to precisely determine optimal nitrogen fertilization without compromising yield. Despite numerous assessments in Iran demonstrating compliance with national nitrate standards in agricultural products, concerns persist regarding potential nitrate accumulation in greenhouse produce due to information gaps [9].
Extensive research has been conducted on destructive and non-destructive techniques for assessing fruit quality. However, most existing methods fall short of providing comprehensive information on fruit quality and ripeness. Non-destructive detection, particularly near-infrared spectroscopy (NIR), offers a promising approach for rapid, efficient, and non-invasive sorting of industrial fruits [10]. Fruit quality can be evaluated based on various physical and chemical properties, including optical, electromagnetic, acoustic, and chemical characteristics. A range of non-destructive techniques, such as magnetic resonance imaging, image processing, electronic nose, ultrasonic methods, and near-infrared spectroscopy have been developed to assess these properties. Among these techniques, NIR spectroscopy has emerged as the most widely adopted method due to its speed, simplicity, and accuracy.
Numerous studies have explored the application of spectroscopic techniques for non-destructive evaluation of nitrate accumulation in various fruits and vegetables. Notable examples include the non-destructive screening of cucumbers based on nitrate maximum limits [11], the determination of nitrate content in pineapple [12], and the estimation of nitrate content in Japanese radish using VIS-NIR spectroscopy [13]. Additionally, chemometric strategies have been employed for the rapid assessment of nitrate content in harvested spinach using NIR/Vis spectroscopy [14] and for online NIRS analysis during spinach processing [15].
Beyond nitrate content, spectroscopic techniques have been used to analyze other quality parameters, such as the sugar content of citrus fruits [16], the properties of lemon cultivars [17], and the soluble solids content of peaches [18]. Furthermore, chlorophyll fluorescence measurements have been utilized to determine ripening stages and sort bell pepper fruits [19].
Despite advancements in spectroscopy and chemometric modeling, challenges remain in optimal wavelength selection and achieving more accurate predictive models. Traditional methods such as partial least squares regression (PLSR) and multiple linear regression (MLR) have been widely used, but to improve prediction accuracy and reduce model complexity, combining metaheuristic optimization algorithms with advanced models like artificial neural networks (ANNs) has emerged as a novel approach. These hybrid methods can select important spectral features and reduce data dimensionality, significantly enhancing predictive performance and enabling more practical applications in agriculture and food industries.
Given the demonstrated potential of infrared spectroscopy in non-destructively assessing the qualitative characteristics of agricultural products, this research aims to leverage this technique for the non-destructive evaluation of nitrate content in bell peppers.

2. Materials and Methods

2.1. Sample Preparation

In this study, three commercially important bell pepper cultivars—yellow (Kaliroy RZ F1), red (Pasarella RZ F1), and orange (Bachata RZ F1)—were used, all of which were sourced from a local greenhouse in Ardabil Province, Iran. These cultivars were selected based on their widespread cultivation, market relevance, and diversity in pigment composition and phenotypic traits that may influence nitrate accumulation patterns. Therefore, they serve as suitable representatives of common agricultural practices and provide a practical foundation for developing generalized non-destructive detection models.
A total of 90 fruit samples were used, with 30 uniformly sized, shaped, and colored fruits selected from each cultivar. All samples were visually inspected to ensure the absence of mechanical damage and signs of fungal decay. Prior to spectral measurements, the samples were equilibrated at 25 °C for two hours to reach thermal equilibrium with the ambient environment [20].

2.2. Vis/NIR Spectroscopy

Spectral data within the wavelength range of 350 to 1100 nm were collected using a PS-100 spectrometer (Apogee Instruments, Logan, UT, USA) equipped with a CCD detector and a halogen-tungsten light source, providing a spectral resolution of 1 nm. To ensure data accuracy and consistency, sensor calibration was performed prior to each measurement session.
This calibration involved capturing a dark spectrum with the light source turned off to record the detector noise, as well as acquiring a white reference spectrum using a standardized Teflon disc as a reflectance standard.
These baseline spectra were used to normalize the raw sample data, thereby minimizing the effects of ambient light variations, instrument drift, and detector noise. Additionally, multiple spectra were recorded from different points on each sample, and their average was taken to reduce random noise and account for sample heterogeneity.
Together with the use of SpectraWiz software V6.32 for data acquisition and processing, this calibration protocol ensured high-quality, reliable, and repeatable spectral measurements throughout the study.

2.3. Nitrate Evaluations

Nitrate content in bell peppers was quantified using a complexometric method. Samples were dried at 60 °C for 48 h, ground, and sieved to a 40-mesh particle size. A 10 mg aliquot of each sample was extracted with 10 mL deionized water at 45 °C for 1 h. After centrifugation at 5000 g for 15 min, the supernatant was collected for analysis. A 0.2 mL aliquot of the extract was reacted with 0.8 mL of 5% (w/v) salicylic acid in concentrated H2SO4 for 20 min at room temperature. Subsequently, 19 mL of 2N NaOH was added to raise the pH above 12. A standard curve was constructed using known concentrations of NO3−-N (1–60 µg/0.2 mL) and processed similarly. Absorbance of both samples and standards was measured at 410 nm using a spectrophotometer (Cecil CE 3041, Cecil Instruments Ltd., Cambridge, England). The nitrate content in the samples was determined by interpolation from the standard curve [21].

2.4. Data Analysis

2.4.1. PLSR and Finding the Effective Wavelength

The practical application of spectroscopy-based non-destructive methods across the entire wavelength spectrum is often hindered by high costs and time constraints. Consequently, an effective strategy is necessary to identify optimal wavelengths and minimize the required spectral range. In this study, a PLSR model was initially applied to the full dataset. To assess the model’s predictive capability, the data were randomly partitioned into calibration (70%) and prediction (30%) sets. Model performance was quantified using R2 and RMSE (Equations (1) and (2)).
R 2 = 1 i = 1 N ( p i d i ) 2 i = 1 N ( p ¯ i d i ) 2
R M S E = i = 1 N d i p i N
Here, di represents the true observed value for the i-th component, while pi denotes the corresponding predicted value. The symbol p ¯ i signifies the mean of all predicted values, and N represents the total number of components being considered.
To identify optimal wavelengths for spectroscopic analysis, various hybrid approaches combining support vector machines (SVM) with meta-heuristic optimization algorithms were explored. These techniques, including ant colony optimization (ACO), genetic algorithms (GAs), imperialistic competitive algorithm (ICA), and particle swarm optimization (PSO) were employed to effectively reduce feature dimensionality and improve model performance [22].
SVM, a robust supervised machine learning algorithm, is well suited for classification and regression tasks in spectroscopy. However, the performance of SVM can be significantly impacted by the quality and quantity of input features. To address this, meta-heuristic algorithms can be integrated to efficiently search the feature space and select the most informative wavelengths.
GAs mimic natural selection to evolve optimal solutions. By iteratively applying genetic operators such as crossover and mutation, GAs can effectively explore the vast search space of potential wavelength combinations [23].
PSO simulates the social behavior of bird flocks and fish schools. By adjusting the positions and velocities of particles, PSO can efficiently converge to optimal solutions in the feature space [24].
ACO is inspired by the foraging behavior of ants. By depositing pheromones on promising paths, ACO can guide the search process towards optimal wavelength selections [25].
ICA models the competition and cooperation between countries. By simulating imperialist influence and colonial activities, ICA can identify dominant wavelength features [26].
By incorporating these meta-heuristic algorithms, the proposed hybrid approaches aim to 1. reduce feature dimensionality: minimizing the number of input features to the SVM model, leading to simplified model complexity and improved computational efficiency, and 2. enhance model performance: improving the classification and prediction accuracy of the SVM model by selecting the most relevant and informative wavelengths. The specific parameter settings for the employed meta-heuristic algorithms are as follows:
GA (number of population: 120, generation: 10, crossover rate: 30, mutation rate: 30); PSO (number of particles: 40, episode: 10, number of p best: 8); ACO (number of ants: 40, episode: 10, evaporation rate: 4); ICA (number of countries: 40, number of imperialists: 11).

2.4.2. Modeling by Effective Wavelengths

A multi-layer perceptron (MLP) ANN, trained using backpropagation, was employed to predict nitrate content. The network’s input layer mirrored the number of effective wavelengths, and the output layer predicted nitrate concentration. One or two hidden layers, each with ten neurons, were included. The Levenberg–Marquardt algorithm was used to optimize network weights, improving training efficiency and accuracy [27,28]. Data analysis and modeling were performed using Unscrambler X version 10.4 and MATLAB version 2022a (MathWorks Inc., Natick, MA, USA) on a Windows 10 operating system with an Intel Core i7 processor and 12 GB of RAM. In order to examine the stability of the models and increase the reliability of the results, the process of randomly dividing the data into training and testing sets was repeated 10 times with different random seeds. Finally, the iteration that had the best performance (highest R2 and lowest RMSE) was reported as the final model. The spectral data and nitrate values were saved in Excel file format.
To identify the most suitable model for correlating significant spectral wavelengths with nitrate content in bell peppers, PLSR, MLR, and ANNs were employed. Model efficacy was assessed using the R2 and RMSE as performance metrics.

3. Results and Discussion

Table 1 presents the measured nitrate concentrations in the three bell pepper cultivars. Among the studied varieties, the yellow bell pepper exhibited the highest nitrate content. This finding underscores the importance of selecting cultivars with diverse pigmentation and phenotypic traits, as these characteristics can significantly influence nitrate accumulation. Therefore, the choice of cultivars in this study—yellow, red, and orange—was intentional to reflect commercial diversity and to enhance the generalizability of the results to a wide range of real-world agricultural products.
When compared to global studies on a fresh weight basis, the obtained nitrate levels fall within acceptable ranges and, in some cases, are lower than those reported internationally. For example, Amer Zamrik (2013) reported an average nitrate concentration of 54.09 mg/kg for green bell pepper [29], while Terbe et al. (2006) documented a range of 21–276 mg/kg [30].
As shown in Table 1, the mean nitrate content in yellow bell pepper was 78.77 mg/kg, the highest among the three cultivars, while the orange cultivar had the lowest mean value at 45.98 mg/kg. The wide range observed in the yellow cultivar suggests a greater sensitivity to environmental conditions or inherent physiological differences, which further supports the significance of including diverse cultivars in nitrate monitoring studies.
The absorption spectra extracted from Vis/NIR spectroscopy data of three bell pepper varieties—red, yellow, and orange—were presented in the study by Latifi Amoghin et al. (2024) (figure 1 in reference [20]). These spectra were recorded over different wavelength ranges for each variety, selected based on the presence of noise at the spectral edges and intrinsic differences in the quality attributes and absorption characteristics of the samples. Specifically, the examined wavelength ranges were 580–980 nm for red, 525–1000 nm for yellow, and 565–960 nm for orange bell peppers. In the referenced figure, each curve represents the absorbance intensity of different samples as a function of wavelength, expressed as a percentage.
The results reported in the aforementioned study indicate significant quantitative differences among the spectral profiles of the three varieties. The maximum absorbance observed in red bell peppers is approximately 3.5%, which is higher than that of the other varieties, being approximately 2.5% for yellow and 1.7% for orange. Additionally, the wavelengths corresponding to peak absorption vary among the varieties; red peppers exhibit higher absorbance at longer wavelengths (close to 980 nm), whereas the yellow and orange varieties show their peak absorbance at shorter wavelengths, following distinct patterns. Notably, considerable differences in absorbance intensity in the 600–700 nm region were also reported, which may be attributed to variations in the composition of optical pigments, such as chlorophylls, carotenoids, and other light-absorbing compounds.
Therefore, the presented spectral data provide a fundamental basis for identifying key wavelengths and developing non-destructive methods for distinguishing between varieties and assessing bell pepper quality.

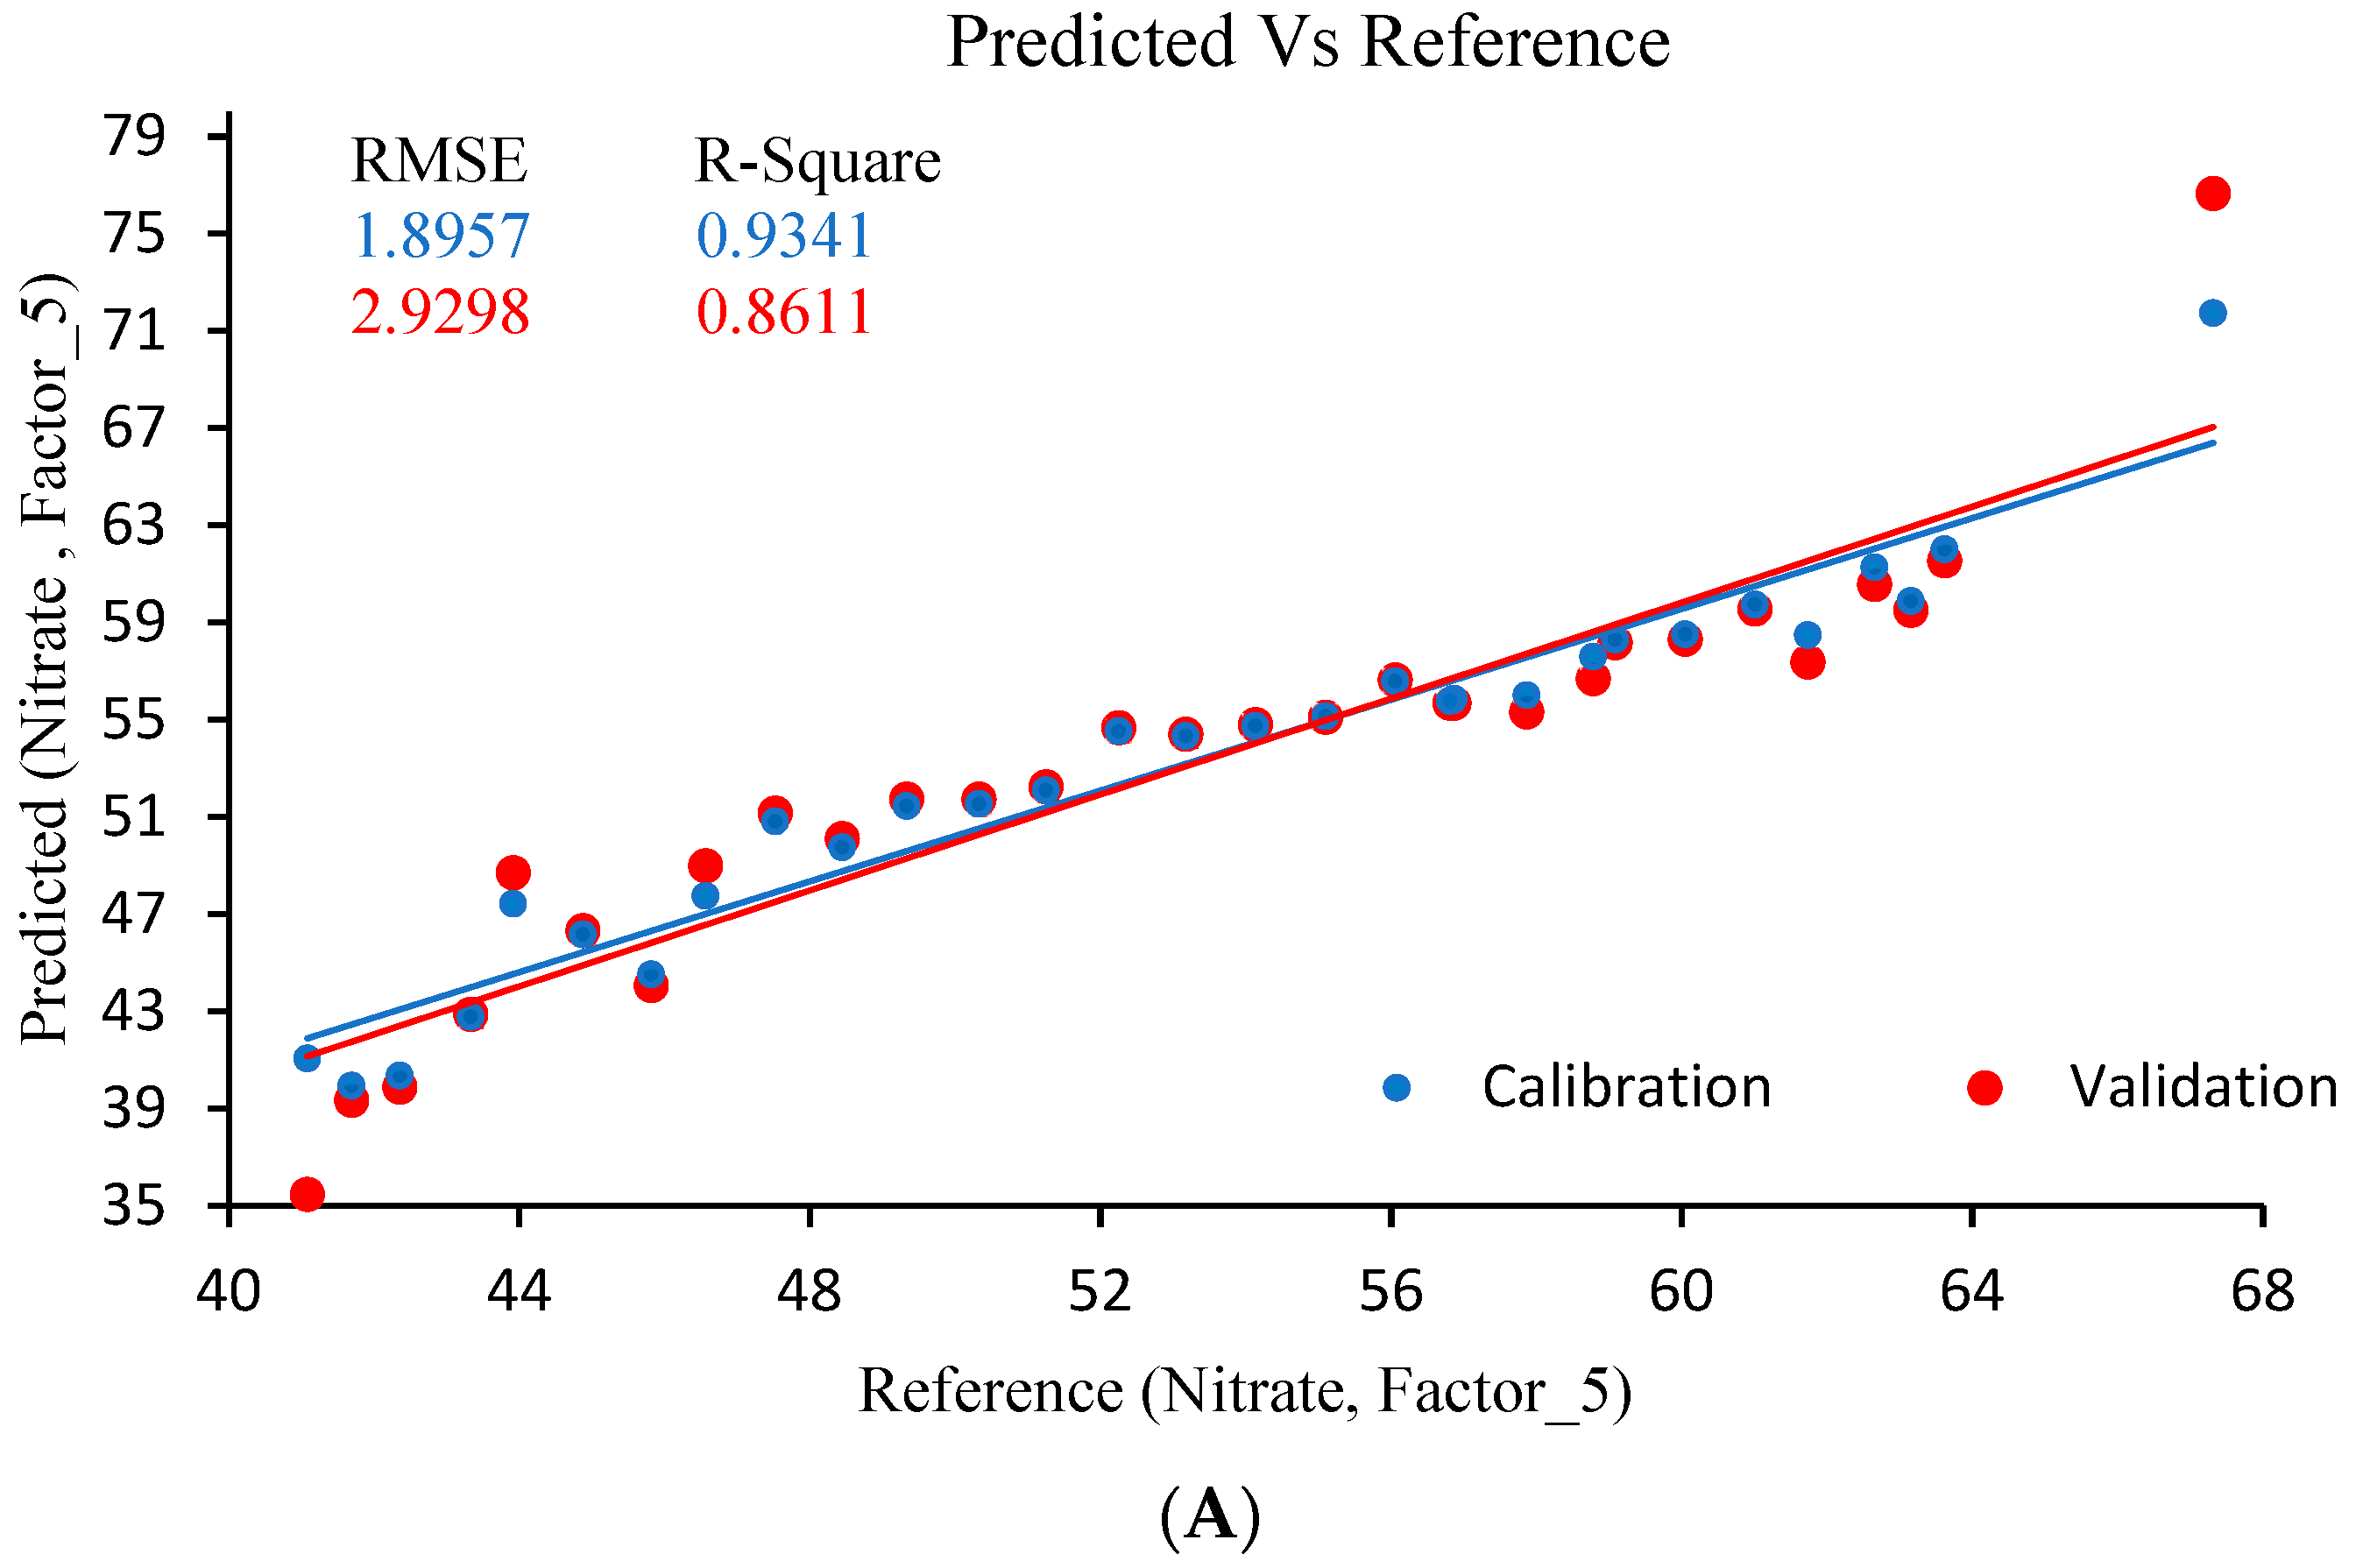
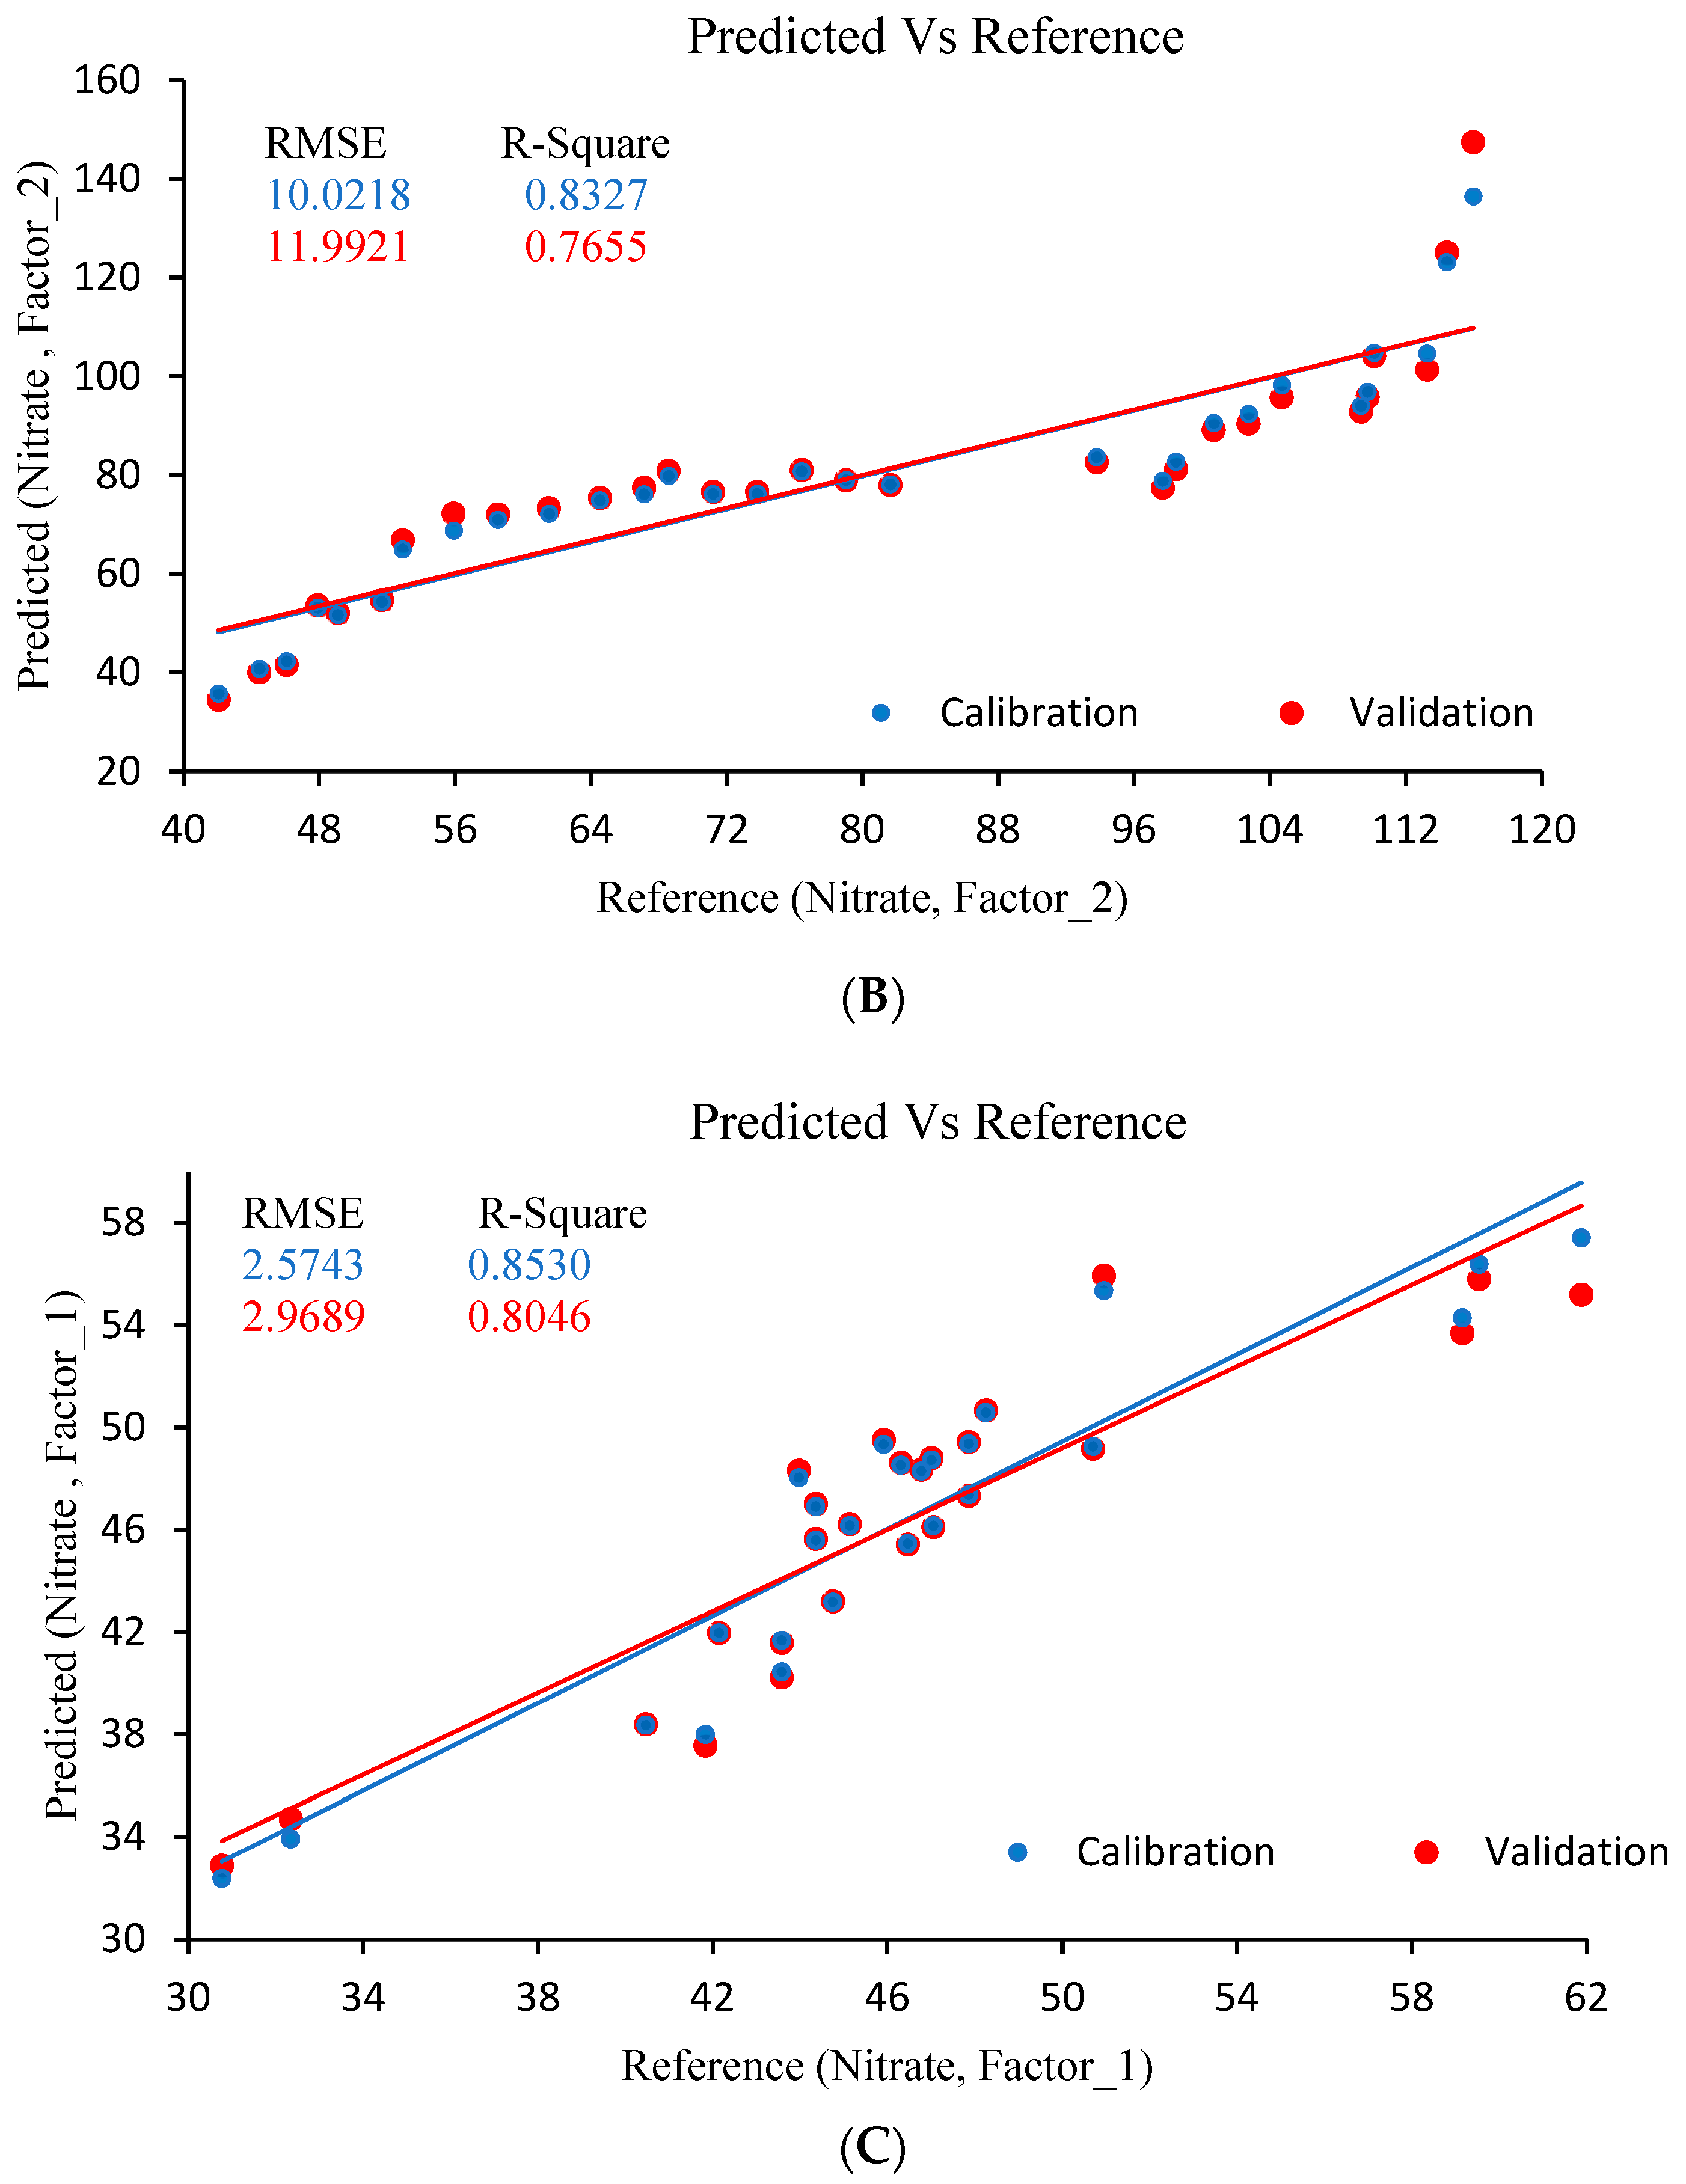
3.1. Partial Least Squares Regression (PLSR)

PLSR was utilized to evaluate the relationship between recorded spectral data and measured nitrate concentrations in yellow, red, and orange bell peppers. The model, developed using the entire dataset, yielded R2 values of 0.77, 0.85, and 0.81, respectively, for the three cultivars. As depicted in Figure 1, the PLSR model effectively captured the spectral data trends. In a separate study, Vis/NIR spectroscopy was employed to assess the impact of fruit temperature on malic acid content in sapodilla. PLSR, coupled with various spectral pre-processing techniques (Savitzky–Golay smoothing, normalization, Savitzky–Golay first and second derivatives, standard normal variate (SNV), and multiple scattering correction (MSC)), was applied to construct the calibration models. The findings validated the potential of Vis/NIR spectroscopy for determining malic acid content in sapodilla. Additionally, the results indicated that both storage temperature and fruit temperature significantly influenced the performance of PLSR models developed using Vis/NIR spectroscopy [31].
A non-invasive, budget-friendly technique utilizing visible and near-infrared spectroscopy was explored to swiftly evaluate nitrate concentrations in cucumbers. This approach aims to facilitate the screening of samples against permissible nitrate accumulation limits. Vis/NIR spectra were acquired from whole cucumbers, encompassing both field-grown and greenhouse-cultivated specimens with varying nitrate concentrations. PLSR models were developed using pre-processed spectral data and reference nitrate measurements. Furthermore, principal component analysis-discriminant analysis (PCA-DA) models, incorporating linear and quadratic methods, were constructed to classify samples based on nitrate thresholds established by the Iranian National Standards Organization (INSO) and the World Health Organization (WHO), as well as by cucumber cultivar. The optimal PLS model, achieved through D2 pre-processing, demonstrated strong predictive performance (rp = 0.87, SEP = 60.92 mg/kg, RPD = 2.07) for nitrate concentration in cucumbers. These findings indicate that Vis/NIR spectroscopy offers a potential solution for the rapid, non-destructive evaluation of nitrate content in cucumbers [11].
In a recent study, Vis-NIR spectroscopy was employed to assess nitrate levels in pineapples. A spectrophotometer was utilized to acquire the spectra of 75 pineapples across a wavelength range of 400 to 2500 nm. Twelve spectral scans were collected from various positions on each pineapple. In the following step, the actual nitrate concentration in the pineapple flesh was quantified through high-performance liquid chromatography (HPLC) analysis. To establish calibration models, both raw and pre-processed spectra were subjected to PLSR analysis. Optimal model performance was achieved using the average pre-processed spectrum, incorporating a first-derivative transformation within the 600–1200 nm wavelength range. The resulting model demonstrated strong predictive capabilities, exhibiting a high R2 of 0.95 and a low root mean square error of prediction (RMSEP) of 1.77 ppm between predicted and actual nitrate content. These findings suggest that Vis-NIR spectroscopy holds significant potential as a rapid, non-destructive technique for preliminary screening of nitrate levels in intact pineapples [12].

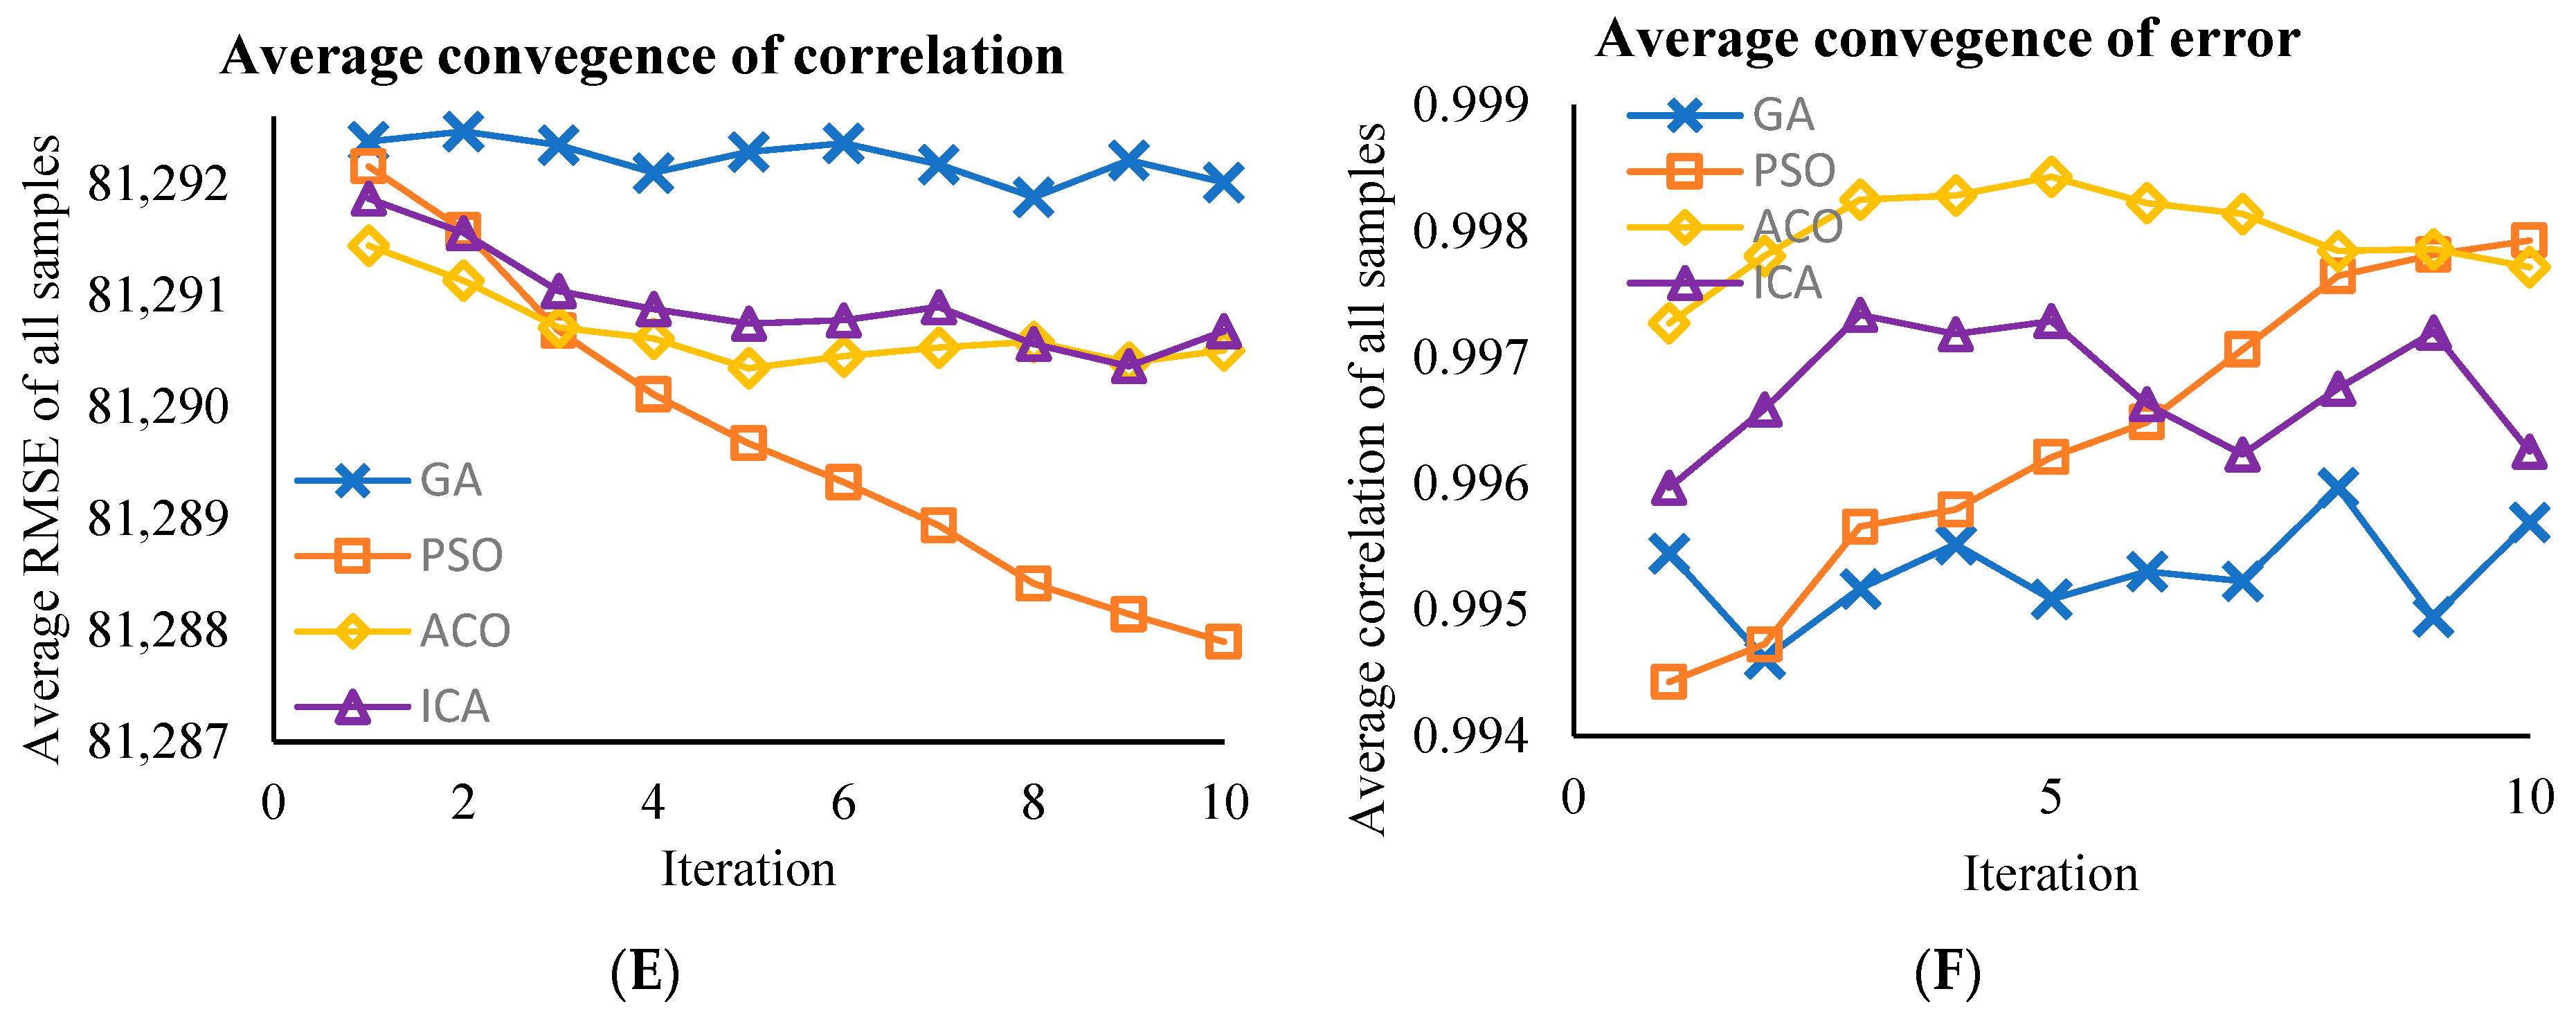
3.2. Effective Wavelengths

A hybrid approach, combining SVM with GA, PSO, ACO, and ICA, was employed to select the most influential wavelengths. Each method independently identified approximately 15 key wavelengths, summarized in Table 2.
The optimized algorithms were evaluated by examining the average convergence of their RMSE and correlation coefficient across all samples. The results indicate that potential for further enhancement in performance may be realized by extending the number of iterations or the computational resources assigned to the algorithms.
Figure 2 presents a comparative analysis of nitrate content prediction for three apple cultivars using the SVM model combined with the GA, PSO, ACO, and ICA algorithms. By displaying accuracy and error metrics, these graphs clearly demonstrate the performance of each algorithm. Considering the decreasing trend in RMSE and the acceptable range of average correlation for the PSO and ACO algorithms over increasing iterations, these two methods achieve lower prediction errors and higher accuracy. However, in terms of computational efficiency, the PSO algorithm emerges as a more suitable choice for detecting effective wavelengths due to its significantly shorter execution time compared to ACO. The execution time of the ACO algorithm is approximately 63 s, which is considerably longer than the execution time of less than 5 s for the other algorithms. This longer duration is attributed to the inherently more complex nature of the ACO algorithm and its greater number of iterations and optimization steps, which is justifiable given the accuracy achieved. These findings are consistent with the study by Masoudi et al. (2019), where software development for feature selection was conducted using 11 metaheuristic algorithms [22]. Their evaluation of accuracy and execution time revealed that the ACO algorithm is more complex and requires more execution time than PSO.
A study by Hu et al. (2019) employed a modified PSO algorithm to select optimal wavelengths from Vis-NIR spectra for predicting four quality parameters in soy sauce [32]. The selected wavelengths were subsequently used to develop an SVM regression (SVM-R) model. The PSO-SVM model demonstrated superior performance compared to full-spectral SVM-R and adaptive weighted resampling-based SVM, suggesting the potential of Vis-NIR spectroscopy coupled with PSO-based wavelength selection for the non-destructive quality assessment of soy sauce [32].
Another study [33] employed a hybrid approach, combining ACO with support vector regression (SVR) to identify optimal spectral bands for predicting wheat grain hardness using near-infrared (NIR) hyperspectral analysis. This strategic band selection is crucial for enhancing the efficiency and accuracy of NIR-based models. By integrating interval partial least squares (IPLS) with the ACO-SVR-selected bands, the researchers aimed to further optimize the model’s performance, reducing the number of variables while improving predictive capability and accuracy. The resulting waveband model demonstrated practical utility for predicting wheat grain hardness, surpassing the performance of traditional full-spectrum PLS models.
Liu et al. (2022) introduced a novel approach that leverages negentropy-ordered kernel independent component analysis (NS-kICA) for feature optimization in food safety assessments via infrared spectroscopy. This method was rigorously evaluated across four diverse datasets encompassing agricultural product variety, brand, origin, and adulteration. Empirical results unequivocally demonstrated the superiority of NS-kICA over conventional feature selection techniques. Moreover, the SVM model outperformed both backpropagation artificial neural networks and partial least squares models. The synergistic combination of NS-kICA and SVM emerged as the optimal methodology, consistently delivering robust and efficient detection performance. Extensive research within the domain of near-infrared spectroscopy has validated the efficacy of employing support vector machines in conjunction with optimized algorithms for effective wavelength selection. These methodologies hold significant promise for future applications in near-infrared spectroscopic experiments [18].

3.3. Model Development Using Representative Wavelengths

MLR, PLSR, and ANN models were employed to predict nitrate content using the effective wavelengths selected by the SVM-PSO algorithm. The performance of these models was evaluated based on R2 and RMSE values for both training and validation datasets (Table 3 and Table 4). Although the PLSR model generally outperformed the MLR model by exhibiting higher R2 values and lower RMSE across all three bell pepper cultivars, the ANN model demonstrated superior prediction accuracy and robustness, particularly during validation. The validation R2 values of the ANN model were 0.97, 0.99, and 0.92 for red, yellow, and orange cultivars, respectively, with corresponding RMSE values of 1.57, 3.17, and 4.37, confirming its outstanding performance. This superiority is attributed to the artificial neural network’s ability to capture the complex and nonlinear relationships inherent in spectral data, which traditional linear regression models like MLR and PLSR cannot fully represent. Therefore, the ANN model was selected as the preferred predictive approach due to its higher accuracy and greater adaptability to complex data patterns, making it a more reliable tool for accurately estimating nitrate content in bell peppers.
This study aimed to develop non-destructive models to assess the quality of frozen food. NIR spectroscopy was employed to acquire spectral data from frozen samples. Subsequently, various chemometric methods were utilized to establish correlations between the spectral data and key quality indicators: droplet loss, hardness, chewiness, gumminess, and gel strength. Principal component regression (PCR), SVMR, PLSR, and backpropagation artificial neural network (BP-ANN) models were developed and evaluated. The results demonstrated that BP-ANN models exhibited superior performance in predicting the aforementioned quality parameters, as evidenced by higher R2 values and lower root mean square error (RMSE) compared to the other methods [34].
In a recent study, Lapcharoensuk et al. (2023) investigated the feasibility of employing NIR spectroscopy coupled with machine learning algorithms for the detection of chlorpyrifos residues on bok choy. Specifically, they utilized PLS-DA, SVM, ANN, and principal component artificial neural network (PC-ANN) models. Their findings suggest that the proposed portable NIR spectrometer, combined with these machine learning techniques, offers a promising approach for the rapid and non-destructive detection of chlorpyrifos contamination in bok choy [35].
Taghinezhad et al. employed hyperspectral imaging (HSI) and visible/near-infrared spectroscopy (VNS) technologies in the spectral range of 400 to 1000 nm to non-destructively predict starch gelatinization (SG) and head rice yield (HRY) during the parboiling process. Spectral data were collected from rice samples subjected to various soaking, steaming, and drying conditions. Five pre-processing techniques—including Savitzky–Golay smoothing (SG), first derivative, second derivative, normalization, and moving average—were applied to reduce noise in the spectral data. Among these, the Savitzk–Golay method was identified as the most effective pre-processing approach based on its performance in modeling with partial least squares regression (PLSR). To select the most informative wavelengths, eleven metaheuristic algorithms were evaluated in combination with a decision tree (DT), including learning automata (LA), world competitive competition (WCC), particle swarm optimization (PSO), imperialist competitive algorithm (ICA), ant colony optimization (ACO), league championship algorithm (LCA), discrete symbiotic organism search (DSOS), heat transfer search (HTS), cuckoo optimization algorithm (CUK), forest optimization algorithm (FOA), and genetic algorithm (GA). Among these, the DT-LA (decision tree-learning automata) algorithm achieved the best performance in terms of shortest execution time, highest accuracy, and the smallest number of selected wavelengths (14 effective wavelengths). To build predictive models for SG and HRY, two machine learning methods—artificial neural network (ANN) and PLSR—were employed using the selected wavelengths. Model performance was evaluated using statistical indicators such as R2, RMSE, and RPD. Results showed that the ANN model outperformed PLSR, achieving very high accuracy with R2 = 0.99 for SG and R2 = 0.98 for HRY [36].
Based on the conducted research, the effectiveness of the artificial neural network (ANN) method, the use of metaheuristic algorithms, and modeling using effective wavelengths was proven.

4. Conclusions

This study explored the potential of Vis/NIR spectroscopy for non-destructive nitrate content assessment in three bell pepper cultivars. Absorbance spectra were acquired within the 350–1150 nm range. PLSR modeling was directly applied to the full spectral data without any pre-processing or manipulation. The results demonstrated the suitability of PLSR for nitrate content prediction in bell peppers. To pinpoint the wavelengths with the greatest impact, we merged the power of SVM with four nature-inspired optimization techniques (GA, PSO, ACO, and ICA). On average, 15 significant wavelengths were selected by each algorithm. The optimal algorithm was determined based on the mean RMSE and average correlation across all samples. PSO emerged as the superior method, exhibiting the lowest RMSE and a favorable correlation range. Subsequently, three modeling techniques (PLSR, MLR, and ANN) were applied to the SVM-PSO-selected wavelengths. PLSR outperformed MLR, while ANN demonstrated the highest predictive accuracy. Validation R2 values for the PLSR model were 0.87, 0.79, and 0.75 for red, yellow, and orange peppers, respectively. ANN achieved superior performance with R2 values of 0.97, 0.99, and 0.92. In conclusion, the ANN model, coupled with SVM-PSO-selected wavelengths, was deemed the most effective approach for predicting nitrate content in bell peppers.
Beyond academic implications, the findings offer promising practical applications. The integration of ANN models with SVM-PSO wavelength selection can serve as a robust framework for real-time quality control systems in greenhouse operations and post-harvest handling lines. This approach can enable rapid and non-invasive nitrate screening without damaging the produce, contributing to safer and more sustainable crop production.
For broader adoption, future research should focus on developing portable or on-line Vis/NIR sensor systems embedded with ANN models for in-field use. Additionally, expanding the method to other vegetables or leafy greens, which are often prone to nitrate accumulation, would increase its utility in precision agriculture. Integration with Internet of Things (IoT) platforms for continuous monitoring and automation of fertilization strategies also represents a practical and impactful direction for future advancements.

Author Contributions

Conceptualization, M.L.-A., Y.A.-G., and M.T.; methodology, M.L.-A., Y.A.-G., A.K., and M.T.; software, M.L.-A., A.K., and M.T.; validation, M.L.-A., Y.A.-G., and A.K.; formal analysis Y.A.-G.; investigation, Y.A.-G. and M.L.-A.; resources, M.L.-A., M.T., and A.K.; data curation, M.L.-A., Y.A.-G., M.T., and A.K.; writing—original draft preparation, M.L.-A., M.T., and A.K.; writing—review and editing, Y.A.-G., J.L.H.-H., M.H.-H., and E.D.L.C.-G.; visualization, M.L.-A., M.H.-H., and E.D.L.C.-G.; supervision, Y.A.-G.; project administration, Y.A.-G. and J.L.H.-H.; funding acquisition, Y.A.-G., J.L.H.-H., M.H.-H., and E.D.L.C.-G. All authors have read and agreed to the published version of the manuscript.

Funding

This research received no external funding.

Data Availability Statement

The datasets used and/or analyzed during the current study are available from the corresponding authors on reasonable request.

Conflicts of Interest

The authors declare that they have no known competing financial interest or personal relationship that could have appeared to influence the work reported in this paper.

References

  1. Lahbib, K.; Dabbou, S.; Bok, S.E.; Pandino, G.; Lombardo, S.; Gazzah, M.E. Variation of biochemical and antioxidant activity with respect to the part of Capsicum annuum fruit from Tunisian autochthonous cultivars. Ind. Crops Prod. 2017, 104, 164–170. [Google Scholar] [CrossRef]
  2. Rawat, S.; Pullagurala, V.L.; Hernandez-Molina, M.; Sun, Y.; Niu, G.; Hernandez-Viezcas, J.A.; Peralta-Videa, J.R.; Gardea-Torresdey, J.L. Impacts of copper oxide nanoparticles on bell pepper (Capsicum annum L.) plants: A full life cycle study. Environ. Sci. Nano 2018, 5, 83–95. [Google Scholar] [CrossRef]
  3. Sarker, M.; Hasan, S.; Aziz, M.; Islam, M.; Azam, S.; Roy, S.; Ibrahim, M. The Effect of Processing Treatments on the Shelf Life and Nutritional Quality of Green Chilli (Capsicum annuum L.) Powder. Pertanika J. Trop. Agric. Sci. 2012, 35, 855–864. [Google Scholar]
  4. Colla, G.; Kim, H.-J.; Kyriacou, M.C.; Rouphael, Y. Nitrate in fruits and vegetables. Sci. Hortic. 2018, 237, 221–238. [Google Scholar] [CrossRef]
  5. Njeze, G.; Dilibe, U.; Ilo, C. Nitrate and drinking water from private wells: Will there be an epidemic of cancers of the digestive tract, urinary bladder and thyroid? Niger. J. Clin. Pract. 2014, 17, 178–182. [Google Scholar] [CrossRef] [PubMed]
  6. Martin, K.R. Dietary nitrates, nitrites, and food safety: Risks versus benefits. Acta Sci. Nutr. Health 2021, 5, 65–76. [Google Scholar] [CrossRef]
  7. Levallois, P.; Phaneuf, D. Contamination of drinking water by nitrates: Analysis of health risks. Can. J. Public Health Rev. Can. De Sante Publique 1994, 85, 192–196. [Google Scholar]
  8. Liang, X.; Gao, Y.; Zhang, X.; Tian, Y.; Zhang, Z.; Gao, L. Effect of optimal daily fertigation on migration of water and salt in soil, root growth and fruit yield of cucumber (Cucumis sativus L.) in solar-greenhouse. PLoS ONE 2014, 9, e86975. [Google Scholar] [CrossRef]
  9. Tabande, L.; Zarei, M. Overview of Nitrate Concentration in Some Vegetables Produced in Zanjan Province. Iran. J. Soil Res. 2018, 32, 373–381. [Google Scholar]
  10. Fodor, M.; Matkovits, A.; Benes, E.L.; Jókai, Z. The Role of Near-Infrared Spectroscopy in Food Quality Assurance: A Review of the Past Two Decades. Foods 2024, 13, 3501. [Google Scholar] [CrossRef]
  11. Jamshidi, B.; Yazdanfar, N. Development of a spectroscopic approach for non-destructive and rapid screening of cucumbers based on maximum limit of nitrate accumulation. J. Food Compos. Anal. 2022, 110, 104513. [Google Scholar] [CrossRef]
  12. Srivichien, S.; Terdwongworakul, A.; Teerachaichayut, S. Quantitative prediction of nitrate level in intact pineapple using Vis–NIRS. J. Food Eng. 2015, 150, 29–34. [Google Scholar] [CrossRef]
  13. Ito, H.; Horie, H.; Ippoushi, K.; Azuma, K. Potential of Visible-Near Infrared (VIS-NIR) Spectroscopy for Non-destructive Estimation of Nitrate Content Oin Japanese Radishes. In Proceedings of the International Conference on Quality in Chains. An Integrated View on Fruit and Vegetable Quality 604, Wageningen, The Netherlands, 6 July 2003; pp. 549–552. [Google Scholar]
  14. Mahanti, N.K.; Chakraborty, S.K.; Kotwaliwale, N.; Vishwakarma, A.K. Chemometric strategies for nondestructive and rapid assessment of nitrate content in harvested spinach using Vis-NIR spectroscopy. J. Food Sci. 2020, 85, 3653–3662. [Google Scholar] [CrossRef] [PubMed]
  15. Vega-Castellote, M.; Pérez-Marín, D.; Torres, I.; Sánchez, M.-T. Online NIRS analysis for the routine assessment of the nitrate content in spinach plants in the processing industry using linear and non-linear methods. LWT 2021, 151, 112192. [Google Scholar] [CrossRef]
  16. Kim, S.-Y.; Hong, S.-J.; Kim, E.; Lee, C.-H.; Kim, G. Application of ensemble neural-network method to integrated sugar content prediction model for citrus fruit using Vis/NIR spectroscopy. J. Food Eng. 2023, 338, 111254. [Google Scholar] [CrossRef]
  17. Ruggiero, L.; Amalfitano, C.; Di Vaio, C.; Adamo, P. Use of near-infrared spectroscopy combined with chemometrics for authentication and traceability of intact lemon fruits. Food Chem. 2022, 375, 131822. [Google Scholar] [CrossRef]
  18. Liu, S.; Huang, W.; Lin, L.; Fan, S. Effects of orientations and regions on performance of online soluble solids content prediction models based on near-infrared spectroscopy for peaches. Foods 2022, 11, 1502. [Google Scholar] [CrossRef]
  19. Kasampalis, D.S.; Tsouvaltzis, P.; Ntouros, K.; Gertsis, A.; Gitas, I.; Siomos, A.S. The use of digital imaging, chlorophyll fluorescence and Vis/NIR spectroscopy in assessing the ripening stage and freshness status of bell pepper fruit. Comput. Electron. Agric. 2021, 187, 106265. [Google Scholar] [CrossRef]
  20. Latifi Amoghin, M.; Abbaspour-Gilandeh, Y.; Tahmasebi, M.; Kaveh, M.; El-Mesery, H.S.; Szymanek, M.; Sprawka, M. VIS/NIR Spectroscopy as a Non-Destructive Method for Evaluation of Quality Parameters of Three Bell Pepper Varieties Based on Soft Computing Methods. Appl. Sci. 2024, 14, 10855. [Google Scholar] [CrossRef]
  21. Cataldo, D.; Maroon, M.; Schrader, L.E.; Youngs, V.L. Rapid colorimetric determination of nitrate in plant tissue by nitration of salicylic acid. Commun. Soil Sci. Plant Anal. 1975, 6, 71–80. [Google Scholar] [CrossRef]
  22. Masoudi-Sobhanzadeh, Y.; Motieghader, H.; Masoudi-Nejad, A. FeatureSelect: A software for feature selection based on machine learning approaches. BMC Bioinform. 2019, 20, 170. [Google Scholar] [CrossRef] [PubMed]
  23. McCall, J. Genetic algorithms for modelling and optimisation. J. Comput. Appl. Math. 2005, 184, 205–222. [Google Scholar] [CrossRef]
  24. Marini, F.; Walczak, B. Particle swarm optimization (PSO). A tutorial. Chemom. Intell. Lab. Syst. 2015, 149, 153–165. [Google Scholar] [CrossRef]
  25. Dorigo, M.; Bonabeau, E.; Theraulaz, G. Ant algorithms and stigmergy. Future Gener. Comput. Syst. 2000, 16, 851–871. [Google Scholar] [CrossRef]
  26. Atashpaz-Gargari, E.; Lucas, C. Imperialist competitive algorithm: An algorithm for optimization inspired by imperialistic competition. In Proceedings of the 2007 IEEE Congress on Evolutionary Computation, Singapore, 25–28 September 2007; pp. 4661–4667. [Google Scholar]
  27. Tahmasebi, M.; Tabatabaei-kolor, R. Measuring of Paddy mass flow using capacitive sensor and modeling with using multiple regression, ANN, and ANFIS models. Iran. J. Biosyst. Eng. 2017, 48, 221–227. [Google Scholar]
  28. Amoghin, M.L.; Abbaspour-Gilandeh, Y.; Tahmasebi, M.; Arribas, J.I. Automatic non-destructive estimation of polyphenol oxidase and peroxidase enzyme activity levels in three bell pepper varieties by Vis/NIR spectroscopy imaging data based on machine learning methods. Chemom. Intell. Lab. Syst. 2024, 250, 105137. [Google Scholar] [CrossRef]
  29. Amer Zamrik, M. Determination of nitrate and nitrite contents in pepper (capsicum) and their derived products in Syrian market. Int. J. Pharm. Sci. Rev. Res. 2013, 19, 16–20. [Google Scholar]
  30. Terbe, I.; Szabó, Z.; Kappel, N. Macronutrient accumulation in green pepper (Capsicum annuum L.) as affected by different production technologies. Int. J. Hortic. Sci. 2006, 12, 13–19. [Google Scholar] [CrossRef]
  31. Rahmia, D.; Pratiwi, E.; Pahlawan, M.; Amanah, H.; Masithoh, R. Non-destructive measurement of malic acid content of sapodilla fruit using visible near infrared (VisNIR) spectroscopy with variations in storage temperature. In Proceedings of the IOP Conference Series: Earth and Environmental Science, Banda Aceh, Indonesia, 9–10 August 2022; p. 012027. [Google Scholar]
  32. Hu, L.; Yin, C.; Ma, S.; Liu, Z. Vis-NIR spectroscopy combined with wavelengths selection by PSO optimization algorithm for simultaneous determination of four quality parameters and classification of soy sauce. Food Anal. Methods 2019, 12, 633–643. [Google Scholar] [CrossRef]
  33. Zhang, H.; Gu, B.; Mu, J.; Ruan, P.; Li, D. Wheat hardness prediction research based on NIR hyperspectral analysis combined with ant colony optimization algorithm. Procedia Eng. 2017, 174, 648–656. [Google Scholar] [CrossRef]
  34. Jiang, Q.; Zhang, M.; Mujumdar, A.S.; Wang, D. Non-destructive quality determination of frozen food using NIR spectroscopy-based machine learning and predictive modelling. J. Food Eng. 2023, 343, 111374. [Google Scholar] [CrossRef]
  35. Lapcharoensuk, R.; Fhaykamta, C.; Anurak, W.; Chadwut, W.; Sitorus, A. Nondestructive detection of pesticide residue (Chlorpyrifos) on bok choi (Brassica rapa subsp. Chinensis) using a portable NIR spectrometer coupled with a machine learning approach. Foods 2023, 12, 955. [Google Scholar] [CrossRef] [PubMed]
  36. Taghinezhad, E.; Szumny, A.; Figiel, A.; Amoghin, M.L.; Mirzazadeh, A.; Blasco, J.; Mazurek, S.; Castillo-Gironés, S. The Potential Application of HSI and VIS/NIR Spectroscopy for Non-Invasive Detection of Starch Gelatinization and Head Rice Yield during Parboiling and Drying Process. J. Food Compos. Anal. 2025, 142, 107443. [Google Scholar] [CrossRef]
Figure 1. Correlation between the actual and PLSR-predicted nitrate contents for (A) red, (B) yellow, and (C) orange varieties.
Processes 13 01731 g001aProcesses 13 01731 g001b
Figure 2. Diagrams plotted for the nitrate dataset of three varieties using SVM. These diagrams compare the performance of algorithms in terms of their accuracy and error score. RMSE variations and average correlation of (A) and (B) red, (C) and (D) yellow, and (E) and (F) orange varieties.
Processes 13 01731 g002aProcesses 13 01731 g002b
Table 1. Nitrate content (NO3−1 mg/kg FW) of three bell pepper varieties based on their fresh weight (FW).
VariableMeanStDevMinimumMaximum
Red53.207.5141.0867.31
Yellow78.7724.9242.07115.95
Orange45.987.5327.6361.87
Table 2. Effective wavelengths determined by different algorithms.
ParameterSpectral Range (nm)MethodsNo.Selected EWs (nm)
Red580–980GA13743, 683.5, 684.5, 967, 945.5, 980, 965, 861, 948, 904, 868.5, 957, 974.5
PSO15974, 970, 980.5, 960, 977, 975, 613.5, 970.5, 886, 964, 965.5, 949, 843, 951, 967.5
ACO14817.5, 961, 704, 945, 967, 973.5, 929.5, 932.5, 977, 631, 955, 922.5, 974, 907.5
ICA15951.5, 958, 802.5, 801.5, 979, 705, 969.5, 734, 961, 653.5, 954.5, 979.5, 973, 956.5, 965
Yellow525–1000GA15922.5, 907, 570, 997.5, 995, 841, 999.5, 762, 996, 722, 854, 996.5, 717, 986.5, 636
PSO15981.5, 557.5, 951.5, 999.5, 995.5, 960.5, 998, 822.5, 990.5, 983.5, 549, 997.5, 996.5, 940, 992
ACO15603, 776, 901.5, 964, 993, 898.5, 997.5, 979, 995, 740, 750.5, 549, 957.5, 998, 999
ICA15797, 561.5, 763.5, 952.5, 974, 989.5, 996, 777.5, 996.5, 998, 1000, 978, 589.5, 967, 806
Orange565–960GA15578, 830.5, 827.5, 781.5, 609, 752.5, 617, 733.5, 813.5, 565.5, 737.5, 886.5, 565, 902.5, 946.5
PSO14750, 810, 799, 673.5, 565.5, 733.5, 836, 716.5, 860, 795, 708.5, 957.5, 565, 710.5
ACO15578, 954, 585, 713, 778.5, 718, 709.5, 627.5, 565.5, 790.5, 565, 670, 958.5, 614.5, 728.5
ICA14782, 697, 798, 730, 565.5, 572.5, 574, 706.5, 775.5, 776, 711.5, 601.5, 565, 592.5
Table 3. R2 and RMSE values for calibration and validation sets of PLSR and MLR models developed by effective wavelengths.
VarietyPLSRMLR
CalibrationValidationCalibrationValidation
R2RMSER2RMSER2RMSER2RMSE
Red0.91552.14580.87662.68180.96042.1477NA15.0105
Yellow0.810110.67430.795211.46860.92879.57430.510217.4386
Orange0.81423.18160.75283.81640.92893.025NA10.7465
Table 4. R2 and RMSE values for training, validation, and testing sets of ANN model developed by effective wavelengths.
VarietyTrainingValidationTest
R2RMSER2RMSER2RMSE
Red0.99820.28510.97141.57180.99240.8841
Yellow0.98862.67900.99103.17250.96164.3529
Orange0.89572.37090.92934.37230.94255.7650
Disclaimer/Publisher’s Note: The statements, opinions and data contained in all publications are solely those of the individual author(s) and contributor(s) and not of MDPI and/or the editor(s). MDPI and/or the editor(s) disclaim responsibility for any injury to people or property resulting from any ideas, methods, instructions or products referred to in the content.

