Article

Multi-Objective Optimization of the Dip-Coating Parameters for Polylactic Acid Plus Bone Screws Using Taguchi Method, Response Surface Methodology, and Non-Dominated Sorting Genetic Algorithm II

by
Saufik Luthfianto
,
Eko Pujiyanto
*,
Cucuk Nur Rosyidi
and
Pringgo Widyo Laksono
Department of Industrial Engineering, Faculty of Engineering, Universitas Sebelas Maret, Surakarta 57126, Indonesia
*
Author to whom correspondence should be addressed.
Processes 2025, 13(6), 1690; https://doi.org/10.3390/pr13061690
Submission received: 11 March 2025 / Revised: 12 May 2025 / Accepted: 16 May 2025 / Published: 28 May 2025
(This article belongs to the Special Issue Additive Manufacturing of Materials: Process and Applications)

Abstract

:
Orthopedic implants are essential for treating severe fractures and incomplete bone regeneration. However, metal-based implants often suffer from corrosion and biocompatibility issues. This study developed 3D-printed Polylactic Acid Plus (PLA+) bone screws coated with molybdenum and zirconia (ZrO2) nanocomposites using the dip-coating method. The Taguchi method optimized five coating parameters: molybdenum weight, zirconia weight, ethanol volume, incubation time, and coating duration. The Taguchi method and Response Surface Methodology (RSM) were used for data analysis, while NSGA-II and TOPSIS determined the optimal parameters. Molybdenum weight significantly increased compressive strength (35.45%), while coating time had the greatest effect on density (25.88%). Optimization improved compressive strength/Ec (Modulus of elasticity) to 315.808 MPa and density to 1.141 g/cm3. Compressive strength was significantly improved through optimized coating parameters; however, the achieved value of 315.808 MPa requires validation due to its relatively high magnitude compared to typical PLA materials reported in the literature. The study concludes that combining the Taguchi and NSGA-II methods effectively enhances the mechanical performance and biocompatibility of biodegradable bone screws. The optimal dip-coating parameters were 0.101 g molybdenum, 0.100 g zirconia, 59.523 mL ethanol, 6.025 h of incubation, and 7.907 min of coating time. However, the study is limited to in vitro mechanical testing, and further in vivo evaluations are necessary to confirm long-term biocompatibility and performance.

1. Introduction

Orthopedic implants are crucial when bones fail to regenerate completely or when severe fractures require alignment for proper healing [1]. These implants replicate the biomechanical characteristics of bone and integrate with the surrounding tissue, preserving its integrity for the necessary period [2,3]. A 2006 survey revealed that 56 million people experienced fractures, with 2.9 million annual femoral shaft fractures caused by automotive accidents [4,5]. The WHO estimates that approximately 20 million trauma cases are hospitalized annually, and by 2040, the high-risk population for fractures is projected to rise to 316 million [6,7].
The development of orthopedic implants aims to prevent complications associated with bone fractures. However, early-stage implants made from metallic compounds faced significant challenges, particularly corrosion upon exposure to bodily fluids due to blood’s physicochemical properties [8]. Over time, metallic implants must be surgically removed to prevent complications, necessitating additional procedures and post-operative care. To address these issues, researchers have explored biodegradable and biocompatible materials for implants, emphasizing biocompatibility, mechanical and surface properties, chemical characteristics, and failure resistance to ensure optimal performance.
Polylactic Acid (PLA) is one of the most widely used biopolymers, with applications in packaging, agriculture, disposable items, and biomedical engineering [9,10]. PLA is biodegradable, renewable, and environmentally friendly. PLA exhibits favorable biological safety and processability, although its mechanical strength remains moderate. Nonetheless, these attributes render it a viable candidate for various biomedical applications, including degradable sutures, bone fixation devices, surgical implants, drug delivery systems, and scaffolds for tissue engineering [11]. Clinically, PLA-based medical products, including bone screws, have been used in oral and maxillofacial surgery and orthopedic applications. However, orthopedic implants often suffer from poor wear resistance, weak mechanical properties, and diminished fatigue strength, limiting their long-term effectiveness.
The selection of PLA+ in this study is supported by various reports demonstrating that modifying pure PLA with specific additives can significantly enhance its mechanical and thermal properties, making it more suitable for biomedical applications. According to ref. [12], reinforcing PLA with natural Cryptostegia grandiflora fibers resulted in considerable improvements in tensile strength and thermal stability. Similarly, ref. [13] found that PLA scaffolds reinforced with zinc particles exhibited greater compressive strength and promoted bone cell proliferation, highlighting their potential in tissue engineering. The incorporation of magnesium into PLA improved interfacial shear strength and corrosion resistance, while also demonstrating good biocompatibility [14]. Consistent with these findings, ref. [15] reported that PLA+ achieved a tensile strength of up to 24 MPa and a Young’s modulus of 3.22 GPa, along with a smoother and more stable surface finish. These enhancements position PLA+ as a more reliable material than pure PLA for biomedical devices such as bone screws and orthopedic implants, where mechanical durability and biological stability are critical.
Nanocomposites offer a solution to these limitations by enhancing implant performance, particularly in terms of compressive strength and density. The incorporation of nanocomposites improves the compatibility and integration of the implant with surrounding tissues, enhancing cellular responses [16,17]. Researchers have increasingly focused on biodegradable polymer-based nanocomposites to reduce dependence on metal and alloy implants, which present long-term biocompatibility issues and higher costs.
This study focuses on the development of degradable PLA+ bone screws, designed in accordance with standard human specifications for metallic medical screws. Using SolidWorks 2020, precise 3D models of the implants were created, ensuring accurate representation of complex geometries. The 3D-printed implant underwent surface enhancement through the dip-coating technique, where the implants were immersed in a coating solution to improve their mechanical properties [18,19,20,21].
Despite extensive research on coating techniques, researchers have not systematically optimized process parameters using the Taguchi method. A study chemically treated zirconia–alumina nanocomposites to enhance apatite formation and improve bioactivity [22]. Another study synthesized PMMA-ZrO2-TiO2 nanocomposites via sol–gel to enhance thermal and optical stability but did not optimize dip-coating parameters [23]. Similarly, research on PLA flexibility involved melt-blending with epoxidized palm olein to improve mechanical properties without refining coating conditions [24]. Other studies have explored dip-coating, PECVD, and FEA simulations for biomedical applications [25,26,27,28,29], but they lacked structured optimization methodologies.
The comparative evaluation of coating methods highlights dip-coating as a practical choice for PLA-based implants due to its low-temperature process, simplicity, and polymer compatibility. While its coating uniformity and adhesion are moderate, these limitations can be addressed through post-treatment strategies. In comparison, electrophoretic deposition (EPD) yields highly uniform and bioactive coatings but is less scalable and equipment-intensive [30,31]. Plasma spraying offers excellent adhesion and porosity control but is unsuitable for PLA due to high processing temperatures [32]. Thus, dip-coating presents an optimal balance of feasibility and functionality, though future studies should directly compare these methods under consistent conditions to determine their clinical advantages. While these studies contribute to material advancements, none have systematically optimized dip-coating parameters for bone screws. Compared to electrophoretic and plasma spray coatings frequently used for biomedical implants, dip-coating offers the advantage of simplicity, cost-effectiveness, and uniform thin-film deposition. Nevertheless, systematic optimization of dip-coating parameters has been limited, motivating the current investigation.
This study offers a novel and impactful contribution by developing an integrated optimization framework for manufacturing PLA+-based bone screws via dip-coating. Unlike prior research focused on injection molding [33] or thermal simulations [34], this work combines Taguchi design, RSM, and NSGA-II in a structured, multi-stage approach. Earlier studies [35,36] applied only partial methods in conventional settings. The focus on dip-coating for biomedical PLA+ and the optimization of both compressive strength and density reinforces the study’s originality and relevance for sustainable medical device fabrication.
A critical gap in current research is the absence of a comprehensive multi-objective optimization framework tailored for the dip-coating process of PLA+ bone screws. Existing studies primarily focus on empirical experimentation or single-objective optimization, often neglecting the balance between compressive strength and density. This study addresses this gap by introducing a systematic multi-objective optimization approach for dip-coated PLA+ bone screws. The novelty of this research lies in the integration of compressive strength and density as key performance indicators, optimized through a mathematical model incorporating multiple decision variables.
Furthermore, this study pioneers the application of Gamultiobj (MATLAB R2020a, MathWorks, Natick, MA, USA) and NSGA-II in tandem, representing a novel computational approach in this context. This dual-algorithm strategy enables a more efficient trade-off analysis between mechanical properties and material efficiency, significantly improving parameter selection precision compared to traditional trial-and-error methods. The findings of this research provide a systematic and optimized methodology for enhancing the structural and mechanical performance of PLA+ bone screws, addressing a crucial gap in the field and advancing the development of next-generation biodegradable orthopedic implants.

2. Materials and Methods

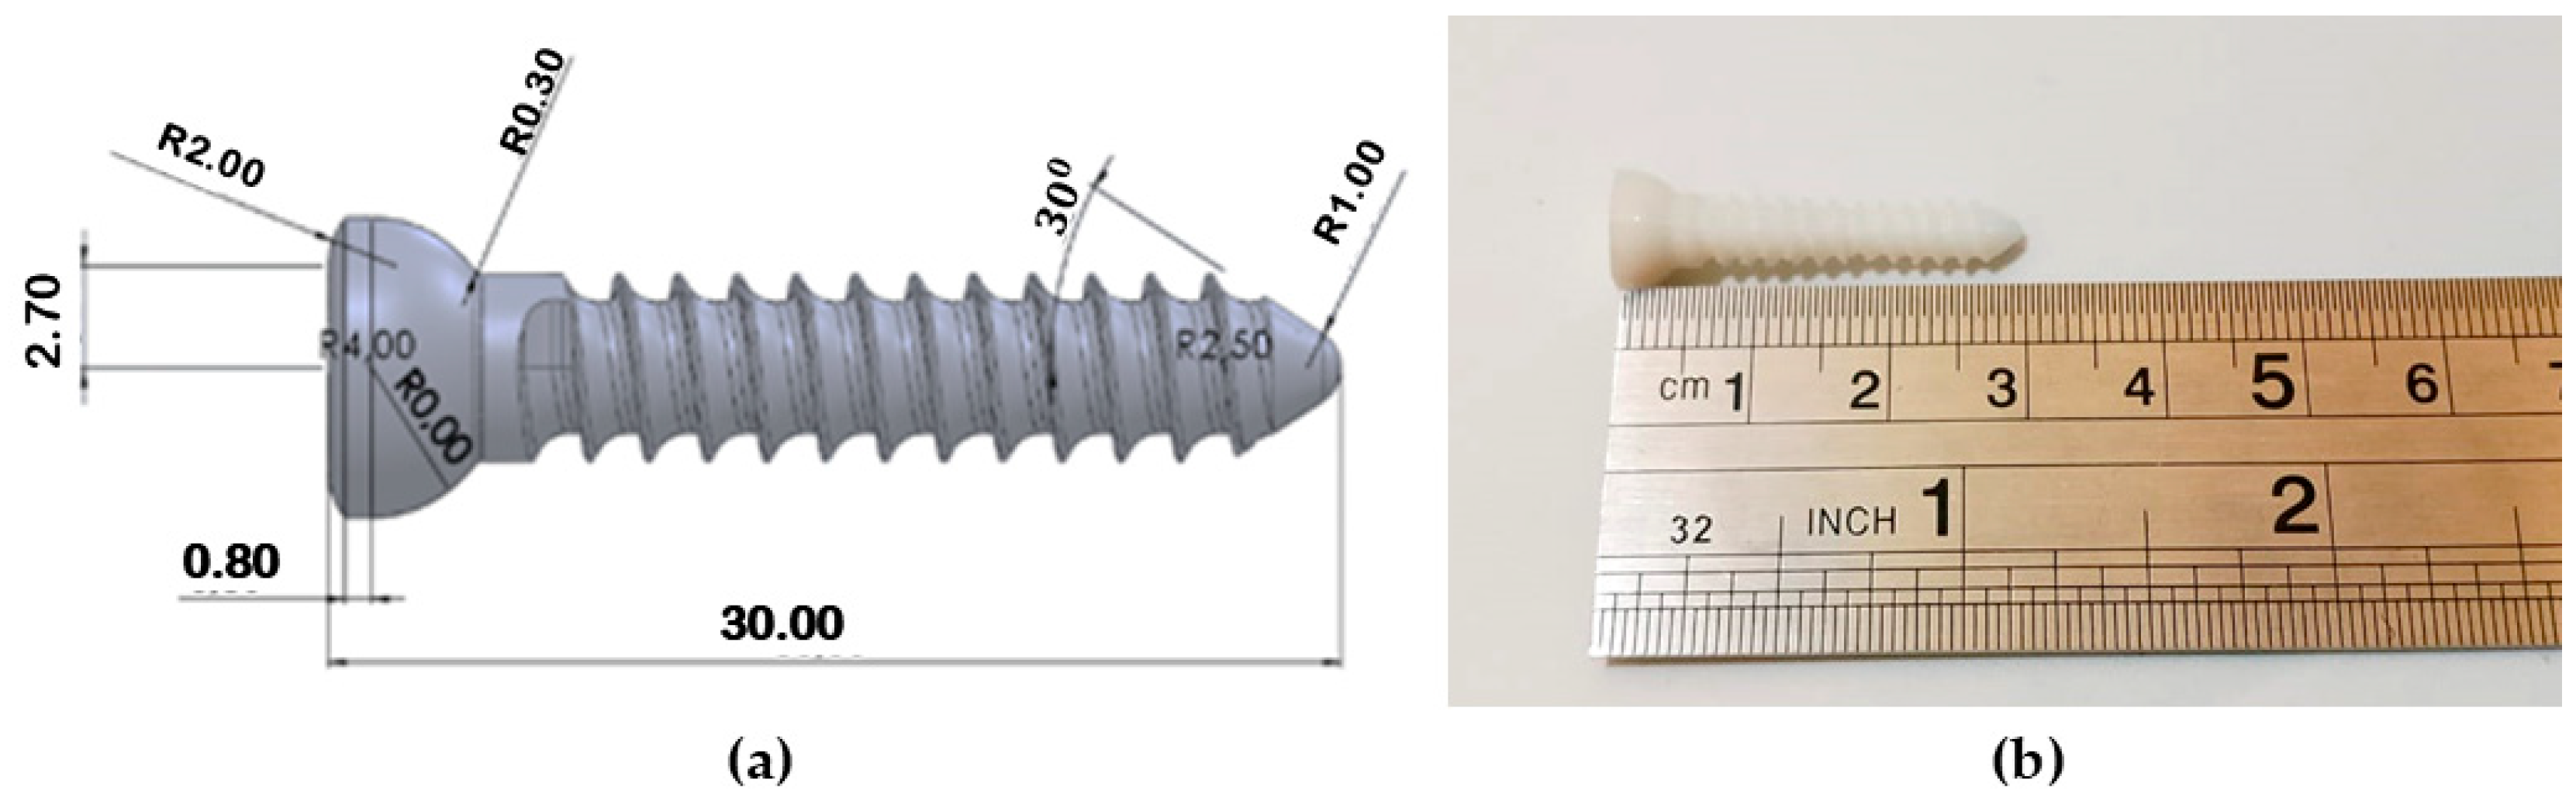
2.1. Design of 3D Model Bone Screws

The “Creality Ender 3 Pro” 3D printer (Shenzhen Creality 3D Technology Co., Ltd., Shenzhen, China) was selected for this research due to its precise control over the print process, enabled by its Cartesian coordinate system and a build volume of 220 × 220 × 250 mm [37]. This printer’s compatibility with 1.75 mm PLA+ filament and its ability to work with G-Code generated from SolidWorks 2020 (Dassault Systèmes, Vélizy-Villacoublay, France) and Ultimaker Cura 5.2.2 (Ultimaker B.V., Utrecht, The Netherlands) made it an ideal choice for fabricating Polylactic Acid Plus (PLA+) bone screws using eSUN PLA+ in Bone White.
Bone screws were designed using SolidWorks software, adhering to the standard dimensions of non-self-tapping screw (NSTS) implant geometry. These screws were produced using a 3D printing machine. An optimal solution study determined the best 3D printing settings, including a 99.99% infill density, a nozzle temperature of 215 °C, a printing speed of 69.27 mm/s, a layer thickness of 0.3 mm, and a bed temperature of 45 °C. Figure 1a presents the implant design created using SolidWorks software, while Figure 1b displays the designs of the implants produced through 3D printing. The screw design was fabricated using PLA+ material through the use of a 3D printer, focusing on creating a precise and functional prototype.

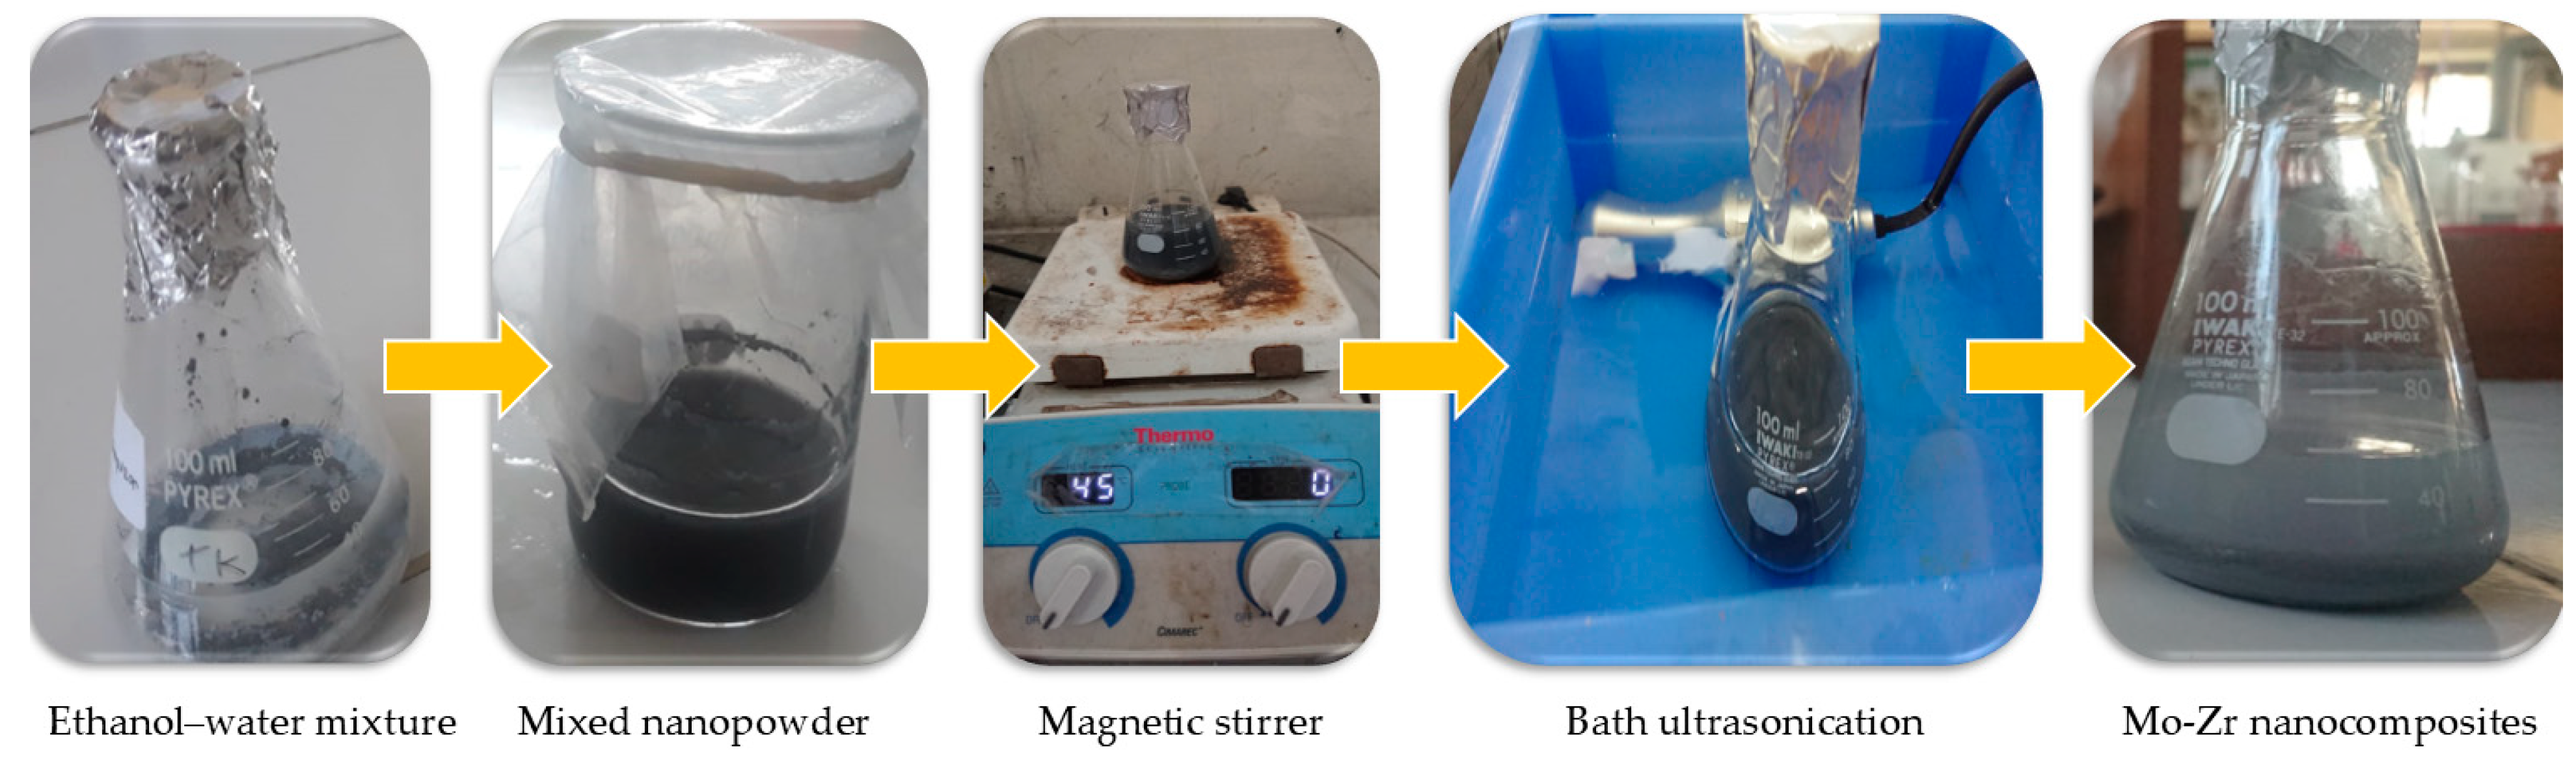
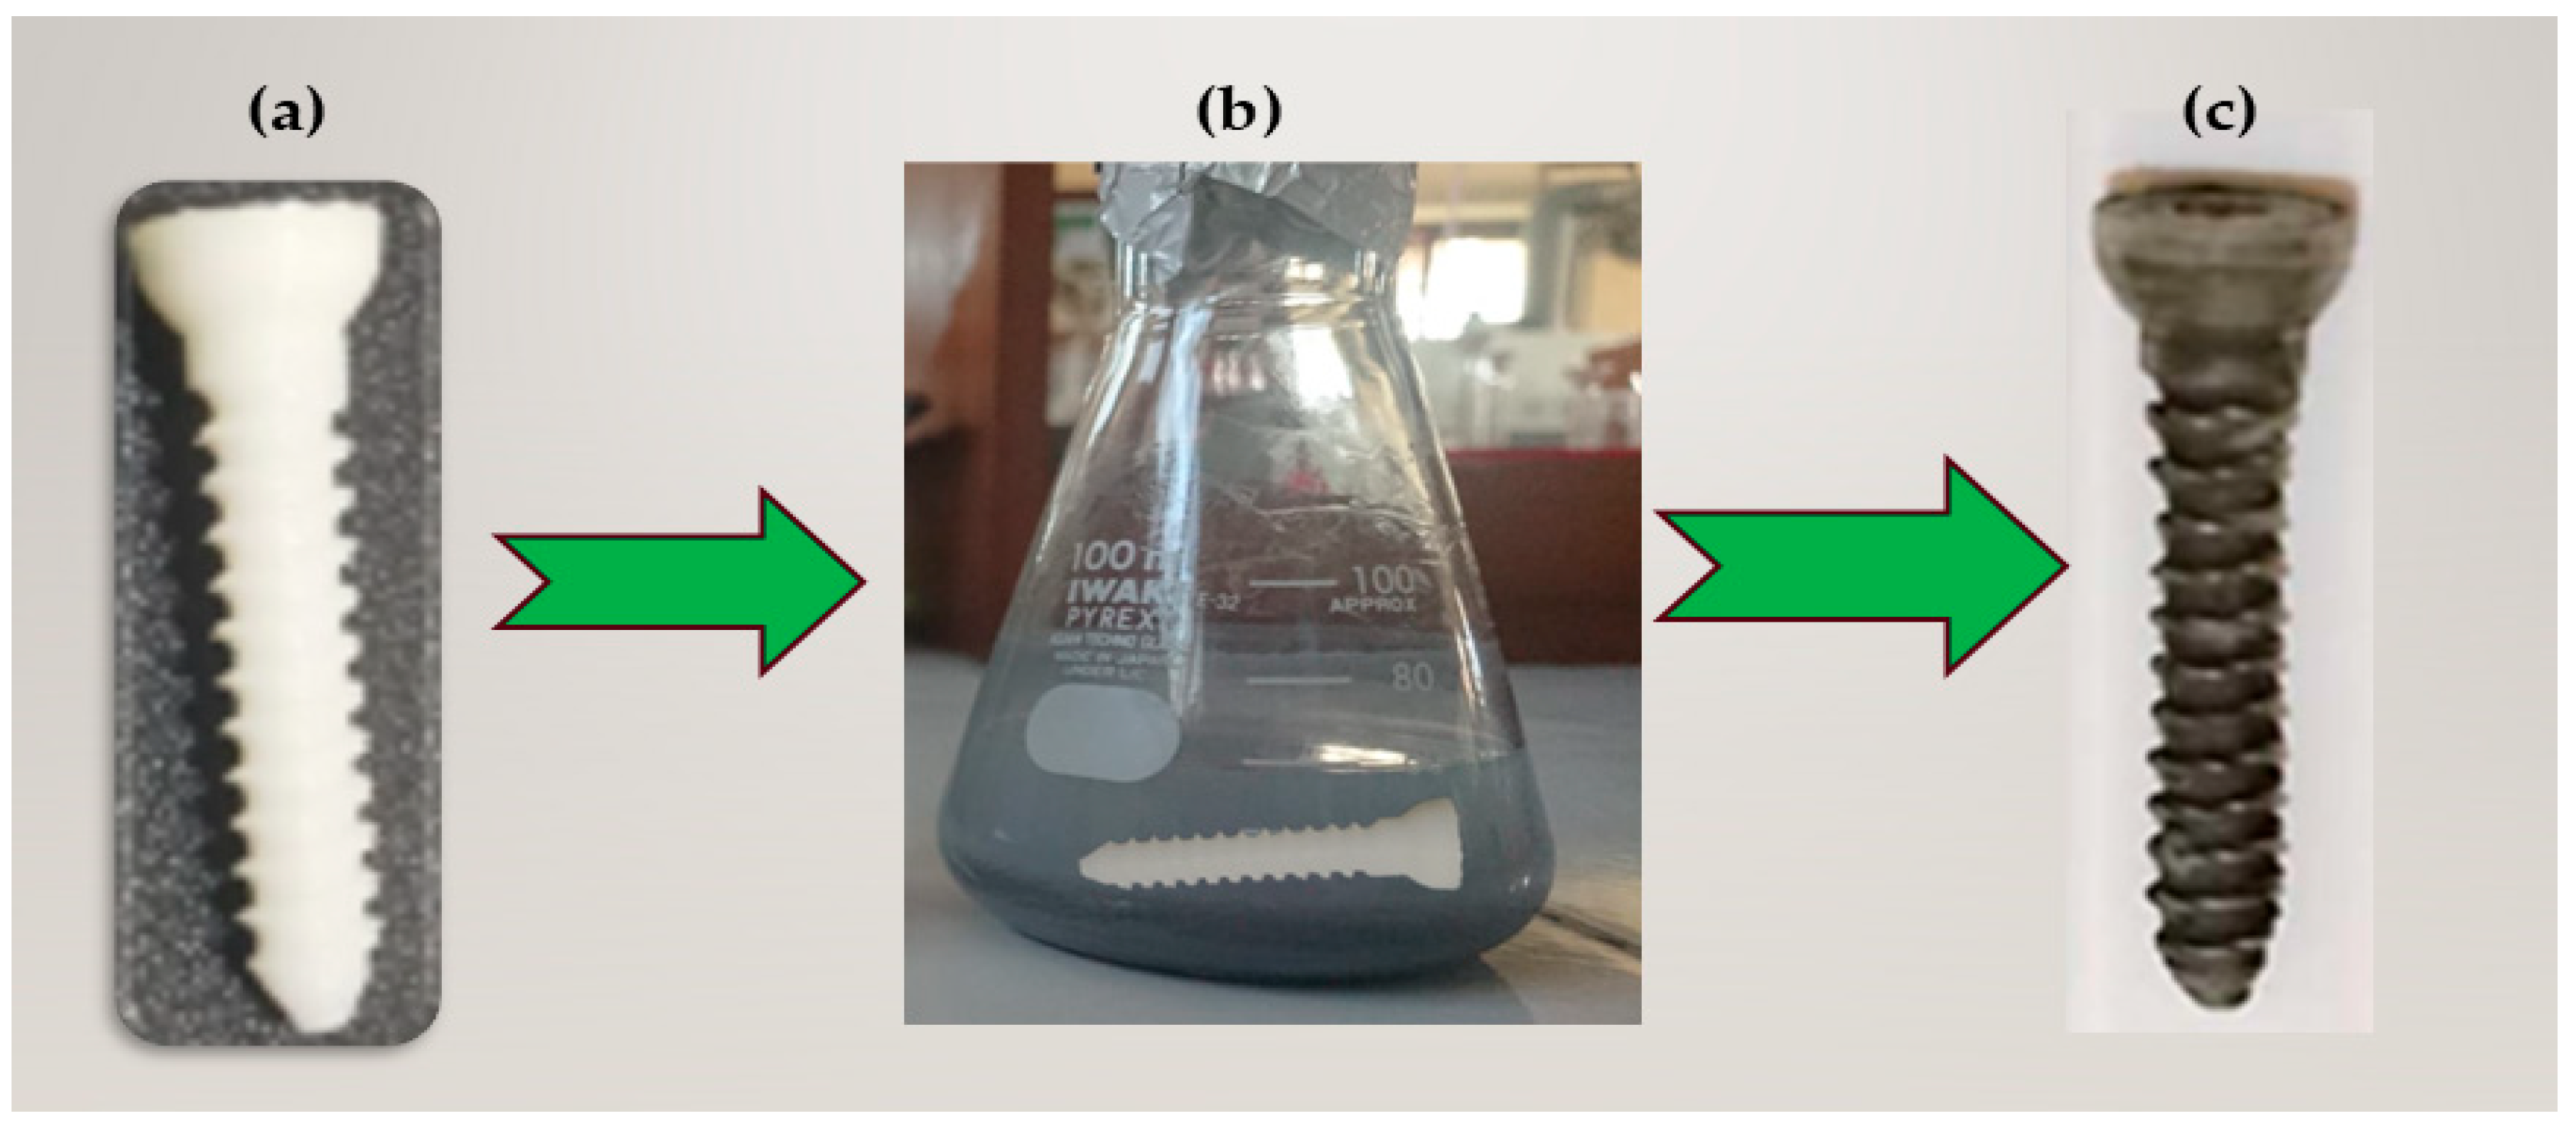
2.2. Preparation of Nanocomposites

PLA+ filament (99% purity) was procured from Gunatek, an authorized supplier of 3D printing equipment and materials in Indonesia. Molybdenum (Mo) and Zirconia (ZrO2) were obtained from commercial sources, specifically from Sigma Aldrich Chem Com, Jakarta, Indonesia. Zirconia nanoparticles with an average particle size of 40 ± 10 nm and molybdenum nanoparticles (<100 nm) were used as nanofillers in the PLA+ matrix. Both powders were obtained in their agglomerated form and subsequently dispersed via ultrasonication. Nanocomposites were prepared through the method of wet chemical synthesis, which involves chemical reactions occurring in a liquid solution to form the desired material. To prepare the molybdenum solution, Mo nanopowders were combined with an ethanol–water mixture in a 100 mL beaker. Similarly, the zirconia solution was prepared by mixing ZrO2 nanopowders with an ethanol–water mixture in a separate 100 mL beaker. The two solutions were then combined, stirred using a magnetic stirrer, ultrasonicated to enhance dispersion, and subsequently incubated in a hot air oven for further processing. The nanocomposite suspension was initially stirred for 30 min and then subjected to ultrasonication for 20 min to ensure uniform dispersion of nanoparticles and obtain a homogeneous solution prior to dip-coating. In this study, the Taguchi L16 orthogonal array approach was applied, focusing on five key factors: Molybdenum Material Weight, Zirconia Material Weight, Ethanol Volume, Incubation Time, and Coating Time. For each factor, four distinct levels were considered, as detailed in Table 1.
The selection of parameter levels in Taguchi experimental design was guided by relevant literature in order to ensure scientific validity and contextual relevance. Specifically, the molybdenum material weight levels were adapted from the study by [38], which explored concentration-dependent effects of molybdenum-based coatings on polymeric substrates. The level ranges for zirconia and ethanol volume were based on findings reported by [29], who examined the influence of zirconia dispersion and solvent ratios on coating homogeneity. Incubation time levels were informed by the experimental protocols outlined by [26], which investigated time-dependent interactions during sol–gel-based coating processes. Lastly, the coating time levels were adopted from [21], whose work highlighted the role of deposition duration in determining coating thickness and adhesion on biodegradable materials.
The 3D-printed bone screws were coated with nanocomposites through the dip-coating technique. The nanocomposite material was placed in a beaker, and the bone screws were submerged in the solution for 2, 5, and 10 min, respectively, following the dip-coating technique to investigate the effect of immersion time on coating thickness and surface morphology [21]. After coating, the samples were dried and subjected to heat treatment in a hot air oven at 60 °C for 20 min to ensure the thermal stability of the nanocomposites on the implants, as shown in Figure 2. Subsequently, the samples were characterized for further analysis. Figure 3 illustrates the bone screw coating process using nanocomposites composed of molybdenum and zirconia, optimized through the Taguchi experimental design method. In Figure 3a, an uncoated bone screw serves as the initial substrate. The screw is then immersed in the nanocomposite solution, as shown in Figure 3b, where molybdenum and zirconia are mixed with ethanol to create a homogeneous suspension. Coating parameters including the weight of molybdenum and zirconia (0.1–0.4 g), ethanol volume (30–60 mL), incubation time (6–24 h), and coating time (2–15 min) were optimized using the Taguchi method to ensure uniform coating distribution. The incubation process involved maintaining the coated screws at controlled temperature (50 °C) to ensure uniform solvent evaporation and enhanced particle substrate interactions. Figure 3c presents the final coated bone screw, where the nanocomposite layer is designed to enhance corrosion resistance and promote bone integration. The Taguchi approach effectively identified optimal parameter combinations, resulting in high-quality coatings while minimizing both experimental time and resource consumption.

2.3. Compression and Density Tester

The compressive strength of the PLA+ bone screws was evaluated using a Zwick Z020 Universal Testing Machine (maximum capacity: 20 kN) was sourced from ZwickRoell GmbH & Co. KG, Ulm, Germany. Each specimen was positioned between two flat platens, and the load was applied under displacement control to simulate compressive loading conditions. The test speed was configured through the TestXpert III, Version 1.5 software, developed by ZwickRoell GmbH & Co. KG, Ulm, Germany, based on the materials’ viscoelastic behavior, and data were acquired at a sampling rate sufficient to capture real-time deformation responses. Key mechanical parameters, including ultimate compressive strength, displacement at failure, and stiffness, were extracted from the force-displacement curves for further analysis.
Material density was assessed using a Vibra Density Tester to investigate changes in mass-to-volume ratio following surface modification. Prior to testing, the device was calibrated automatically to ensure accuracy. Samples were weighed and subjected to controlled vibrational motion to determine volumetric displacement indirectly, thereby enabling precise density calculation. This measurement was essential for evaluating coating uniformity, porosity, and material compactness after dip-coating treatment.

2.4. Analysis Methods

The research began with a Taguchi experiment conducted using MINITAB 22 (Minitab LLC, State College, PA, USA) software was developed and sourced from Minitab LLC, State College, PA, USA. Afterward, the data were analyzed using Response Surface Methodology (RSM) to understand the relationships between the decision variables and the objective function. The data obtained from the Taguchi experimental design were fitted into a quadratic regression equation using RSM. The adequacy of the regression models was validated using standard statistical indicators, including R2, Adjusted R2, and Predicted R2. Analysis of Variance (ANOVA) was also used to determine the statistical significance of each parameter, identifying the most influential factors affecting compressive strength and density. The objective function was then optimized using the NSGA II algorithm, which provided multiple alternative solutions. Finally, the TOPSIS method was applied to select the best solution from these alternatives, as it ranks options based on their proximity to the ideal solution, ensuring an objective and systematic selection of the most optimal parameters. Coating thickness and homogeneity were evaluated through Scanning Electron Microscopy (SEM), where cross-sectional analyses of the coating were evaluated using the standard scratch test method (ASTM D7027) [39], ensuring reliable mechanical integration.

3. Results and Discussion

The dip-coated bone screws, produced via 3D printing were subjected to compression and density tests. Table 2 presents the experimental data.
The analysis of variance and percent contribution of the factors influencing the density test, as well as compression strength, are calculated from Table 3 and Table 4. The weight of the molybdenum material is one of the main factors contributing to the increase in compression strength, while the coating time is one of the main factors contributing to the increase in the density test results. This shows that the weight of the molybdenum material has the greatest influence on the compression strength, with a value of 35.40%, while the coating time has the greatest influence on the density test, with a value of 25.88%. The next greatest influence is the incubation time on the compression strength, with a value of 27.72%, and the volume of ethanol on the density test, with a value of 20.65%. The ethanol volume is the third factor affecting compression strength, contributing 15.01%. The weight of the molybdenum material is the third component affecting the density test, contributing 17.42%. When considering other aspects, the weight of the zirconia material and coating time have the smallest impact on the compression strength value compared to other parameters, while the incubation time and the weight of the zirconia material have the smallest impact on the density test value.
Figure 4 depicts the contour plots for the results of the compression strength. The contour plot illustrates the relationship between molybdenum material weight (Mo Material Weight) on the x-axis and incubation time on the y-axis in relation to the material’s compression strength, represented by green color gradients. Darker green shades indicate higher compression strength (up to 550 MPa), while lighter green shades represent lower strength (below 350 MPa). The plot shows that increasing the molybdenum weight generally enhances compression strength, especially when the weight exceeds 0.3 g. Additionally, incubation time has a significant impact, with the highest compression strength achieved at incubation times between 20 and 30 h, particularly when combined with higher molybdenum weights. In contrast, shorter incubation times (0–10 h) result in lower compression strength, even with the same molybdenum weight. Other parameter values, such as zirconia material weight (0.25 g), ethanol volume (45 mL), and coating time (8.5 min), are held constant to ensure that the primary effects come from molybdenum weight and incubation time.
Figure 5 depicts the contour plots for the results of the density test. The contour plot illustrates how ethanol volume (x-axis) and coating time (y-axis) influence the material’s density test outcomes, as shown by the color gradients ranging from blue to green. Darker blue regions represent lower density values (<1.165 g/cm3), while lighter green areas indicate higher density values (up to 1.190 g/cm3). The plot demonstrates that the interaction between ethanol volume and coating time significantly affects the density results. Optimal density values are observed when the ethanol volume ranges between 40 and 60 mL, and the coating time is approximately 15 to 20 min. In contrast, lower density values occur with ethanol volumes below 30 mL or coating times shorter than 10 min, regardless of the ethanol volume. Other parameters, such as molybdenum material weight (0.25 g), zirconia material weight (0.25 g), and incubation time (15 h), remain constant to isolate the effects of ethanol volume and coating time. This visualization offers useful insights for optimizing these parameters to achieve the desired material density.
The “% Contribution” column in Table 3 represents the percentage of variance in the compression test results attributed to each factor, relative to the total variance. It indicates how much each factor influences the observed outcomes, summing to 100% of the total contribution. According to the table, the Molybdenum Material Weight is the most influential factor, accounting for 35.40% of the total variation, making it the primary driver of the compression test results. The second most significant factor is Incubation Time, contributing 27.72%, highlighting its critical role. Ethanol Volume accounts for 15.01%, indicating a moderate influence, while Zirconia Material Weight contributes 13.14%, reflecting a slightly smaller but still meaningful impact. Coating Time has the least influence, with a contribution of 8.60%, suggesting a minor effect on the results. The “Error” term shows a contribution of 0.13%, signifying that the included factors explain nearly all variability, indicating a well-controlled experimental design with minimal unexplained variation.
The substantial contribution of Molybdenum Material Weight 35.40% to the compression test results is largely attributed to its exceptional mechanical properties, which significantly enhance the structural integrity and strength of the material. Known for its high tensile strength and modulus of elasticity, molybdenum effectively improves the mechanical performance of composite coatings under compressive stress [40]. Its ability to evenly distribute stress within the composite reduces the risk of structural failure, thereby boosting the system’s overall load-bearing capacity [41]. Moreover, molybdenum’s compatibility with materials like PLA and zirconia enhances molecular bonding, further increasing the mechanical stability observed in the tests [42]. Additionally, the molybdenum weight is directly linked to the density and thickness of the coating, which are critical in resisting compressive forces [43]. These factors underscore why molybdenum material weight is a key determinant of compression test outcomes.
Compared to previous studies, this research offers a more comprehensive approach to understanding the role of molybdenum in nanocomposites. Prior studies have primarily explored the mechanical properties of molybdenum in its bulk form without considering its effects within a nanocomposite system incorporating PLA and zirconia [38]. Other studies that focused on enhancing the mechanical properties of PLA through zirconia addition did not evaluate the simultaneous impact of molybdenum and zirconia [44]. Furthermore, research applying molybdenum in biomedical coatings has not systematically optimized the process parameters [45,46].
The “% Contribution” column in Table 4 represents the percentage of total variation in the density test results attributed to each factor, summing to 100%. This helps pinpoint the factors with the greatest influence on density. According to the table, Coating Time has the highest impact, contributing 25.88% of the total variance, making it the most significant factor. Ethanol Volume follows with a contribution of 20.65%, indicating a strong effect on density. Molybdenum Material Weight accounts for 17.42%, reflecting a moderate influence, while Incubation Time contributes 10.20%, showing a smaller but notable impact. Zirconia Material Weight has the least influence, with a contribution of 6.76%, suggesting it has the smallest effect on density. The “Error” term, contributing 19.09%, represents the unexplained portion of the total variation, likely due to unaccounted factors or experimental noise. This level of error highlights opportunities for further research to reduce variability and improve the model.
The substantial contribution of Coating Time (25.88%) to the density test results is largely attributed to its critical role in determining the uniformity and thickness of the coating layer. Longer coating durations facilitate a gradual and consistent material deposition, producing a denser and more compact layer that enhances the composite’s overall density [42]. Extended coating periods also improve the interaction between coating materials and the substrate, leading to better adhesion and reduced porosity, both of which directly contribute to increased density [43]. Additionally, sufficient coating time ensures complete solvent evaporation and solidification, minimizing voids and defects within the coating structure, key factors in achieving higher density [44]. This relationship is particularly evident in systems using molybdenum and PLA, where optimized coating times enhance the interaction kinetics, resulting in a well-integrated and durable coating [40]. These aspects highlight why coating time is the most significant factor influencing material density.
The ANOVA results for the compressive strength response (Table 5) demonstrate that the RSM model developed in this study is statistically significant (F = 11.99, p = 0.029), confirming that the selected process parameter have a meaningful impact on mechanical performance of PLA+ bone screws. Among the linear factors, coating time, zirconia content, and ethanol volume emerged as the most influential, with F-values of 17.31, 16.89, and 15.87, respectively. These findings suggest that optimizing surface treatment conditions and nanoparticle composition can lead to substantial improvements in compressive strength. The significance of quadratic terms such as coating time2 and molybdenum2 indicates that the relationship between the input variables and the response is not purely linear. This reinforces the appropriateness of using a response surface methodology rather than relying on simpler linear models. Furthermore, several two-way interactions were found to be statistically significant, including the interaction between molybdenum content and coating time (F = 14.13, p = 0.008) and between ethanol volume and incubation time (F = 13.58, p = 0.015). These interactions highlight that the effect of a single parameter is not independent, but rather influenced by the levels of other variables in the system.
The ANOVA results for the density response (Table 6) demonstrate that the RSM model significantly explains the variation in density of PLA+ nanocomposite coatings (F = 14.32, p < 0.001). Among the linear terms, incubation time, zirconia content, and ethanol volume had the most substantial effects, highlighting their importance in achieving optimal coating compactness. Significant quadratic terms confirm non-linear behavior, suggesting that excessive increases in variables like ethanol or molybdenum may reduce density due to poor dispersion or oversaturation. Furthermore, two-way interactions, particularly between molybdenum and coating time, were statistically significant, revealing that variable effects are not independent but interrelated. These findings support the use of RSM to capture complex behavior in multi-parameter systems.
Compared to previous studies, the findings of this research are consistent with those of ref. [47] on dip-coated biopolymer composites, which demonstrated that extended coating durations promote more effective solvent evaporation and stronger polymer chain entanglement, thereby reducing void formation and enhancing coating density. Similarly, ref. [48] reported that optimizing coating time in metal–polymer nanocomposites significantly improves both density and mechanical performance due to enhanced molecular interactions. Unlike earlier studies, which primarily focused on single-layer coatings or employed empirical approaches without systematic parameter optimization, this research adopts a more structured methodology by integrating coating time as a key process variable. Moreover, while prior research has largely provided qualitative assessments of coating properties, this study quantitatively establishes the relationship between coating time and material density using statistical modeling and optimization techniques such as RSM and NSGA-II.
The response surface methodology generated the regression equation from the experimental data in Table 2. Equations (1) and (2) display the regression equations for compression strength and density test, respectively.
Ct = 16 − 874 A + 1536 B − 0.3 C + 24.1 D + 20.3 E + 1217 A2 − 442 B2 + 0.051 C2 − 0.193 D2 + 1.382 E2 + 578 A × B +
  14.3 A × C + 14.0 A × D − 70.1 A × E − 4.9 B × C − 1.6 B × D − 33.7 B × E − 0.471 C × D − 0.185 C × E + 0.122 D × E
(1)
Dt = 1.2433 − 0.181 A + 0.014 B − 0.00288 C − 0.00052 D − 0.00062 E + 0.260 A2 + 0.066 B2 + 0.000015 C2 +
  0.000003 D2 + 0.000065 E2 − 0.236 A × B + 0.00292 A × C + 0.00255 A × D − 0.00160 A × E + 0.00153 B × C
  − 0.00347 B × D + 0.00032 B × E + 0.000035 C × D − 0.000003 C × E − 0.000016 D × E
(2)
where
Ct: Compression strength (MPa)
Dt: Density test (g/cm3)
A: Molybdenum material weight (g)
B: Zirconia material weight (g)
C: Ethanol volume (mL)
D: Incubation time (h)
E: Coating time (min)
The next step involves simultaneous optimization using MATLAB’s NSGA II. For the dip-coating parameter model, the objective functions are compression strength (f1; Equation (1)) and density test (f2; Equation (2)). The best settings for the dip-coating method must match the constraint functions, which are the weight of the molybdenum material, the weight of the zirconia material, the volume of ethanol, the time of incubation, and the time of coating. These constraints are integral to the dip-coating process and are compatible with the proposed model. Equations outline the objective function and constraints.
Objective function (Max Ct, Min Dt)
0.1 ≤ A ≤ 0.4
0.1 ≤ B ≤ 0.4
30 ≤ C ≤ 60
6 ≤ D ≤ 24
2 ≤ E ≤ 15
The objective function in this optimization model is to maximize compression strength (Ct) and minimize density (Dt), which can be mathematically expressed as (Max Ct, Min Dt), where Ct (Compression Strength) represents the material’s ability to withstand compressive forces before deformation, measured in MPa (Megapascal). A higher Ct value indicates a stronger material with enhanced mechanical durability. Meanwhile, Dt (Density Test) refers to the material’s density in g/cm3, which measures mass per unit volume.
The constraint function in this model ensures that the dip-coating process parameters remain within experimentally feasible limits to achieve optimal mechanical properties. The constraints are defined as follows: 0.1 ≤ A ≤ 0.4; 0.1 ≤ B ≤ 0.4; 30 ≤ C ≤ 60; 6 ≤ D ≤ 24; 2 ≤ E ≤ 15. Here, A (molybdenum weight, g) [38] and B (zirconia weight, g) [29] are restricted to 0.1–0.4 g to prevent particle agglomeration and maintain the stability of the nanocomposite layer. C (ethanol volume, mL) [29] is set between 30 and 60 mL to ensure the proper viscosity of the coating solution. D (incubation time, h) [26] is controlled within 6–24 h to promote adhesion and particle interaction without causing structural degradation. E (coating time, min) [21] is limited to 2–15 min to regulate the thickness and uniformity of the coating.
The Pareto point, which defines the Pareto front, is illustrated in Figure 6 with examples of the objective functions of the compression strength and density test. Table 7 lists all 18 points on the Pareto front, each representing potential solutions. These points are associated with the values of the decision variables and objective functions. The TOPSIS method is applied to identify the optimal single solution, which is detailed in Table 8 and corresponds to alternative 17 in Table 2.
With the Gamultiobj algorithm having found a non-dominated solution (Pareto front), the next step is to use the TOPSIS method to find the best solution. The TOPSIS method identifies the optimal solution, highlighting 18 points associated with the Pareto front. This study’s TOPSIS approach is based on research [49] and involves a seven-step process to arrive at a single optimal solution. Table 8 presents the results of the TOPSIS-determined optimal solution. Below are the seven steps used to find this optimal solution.
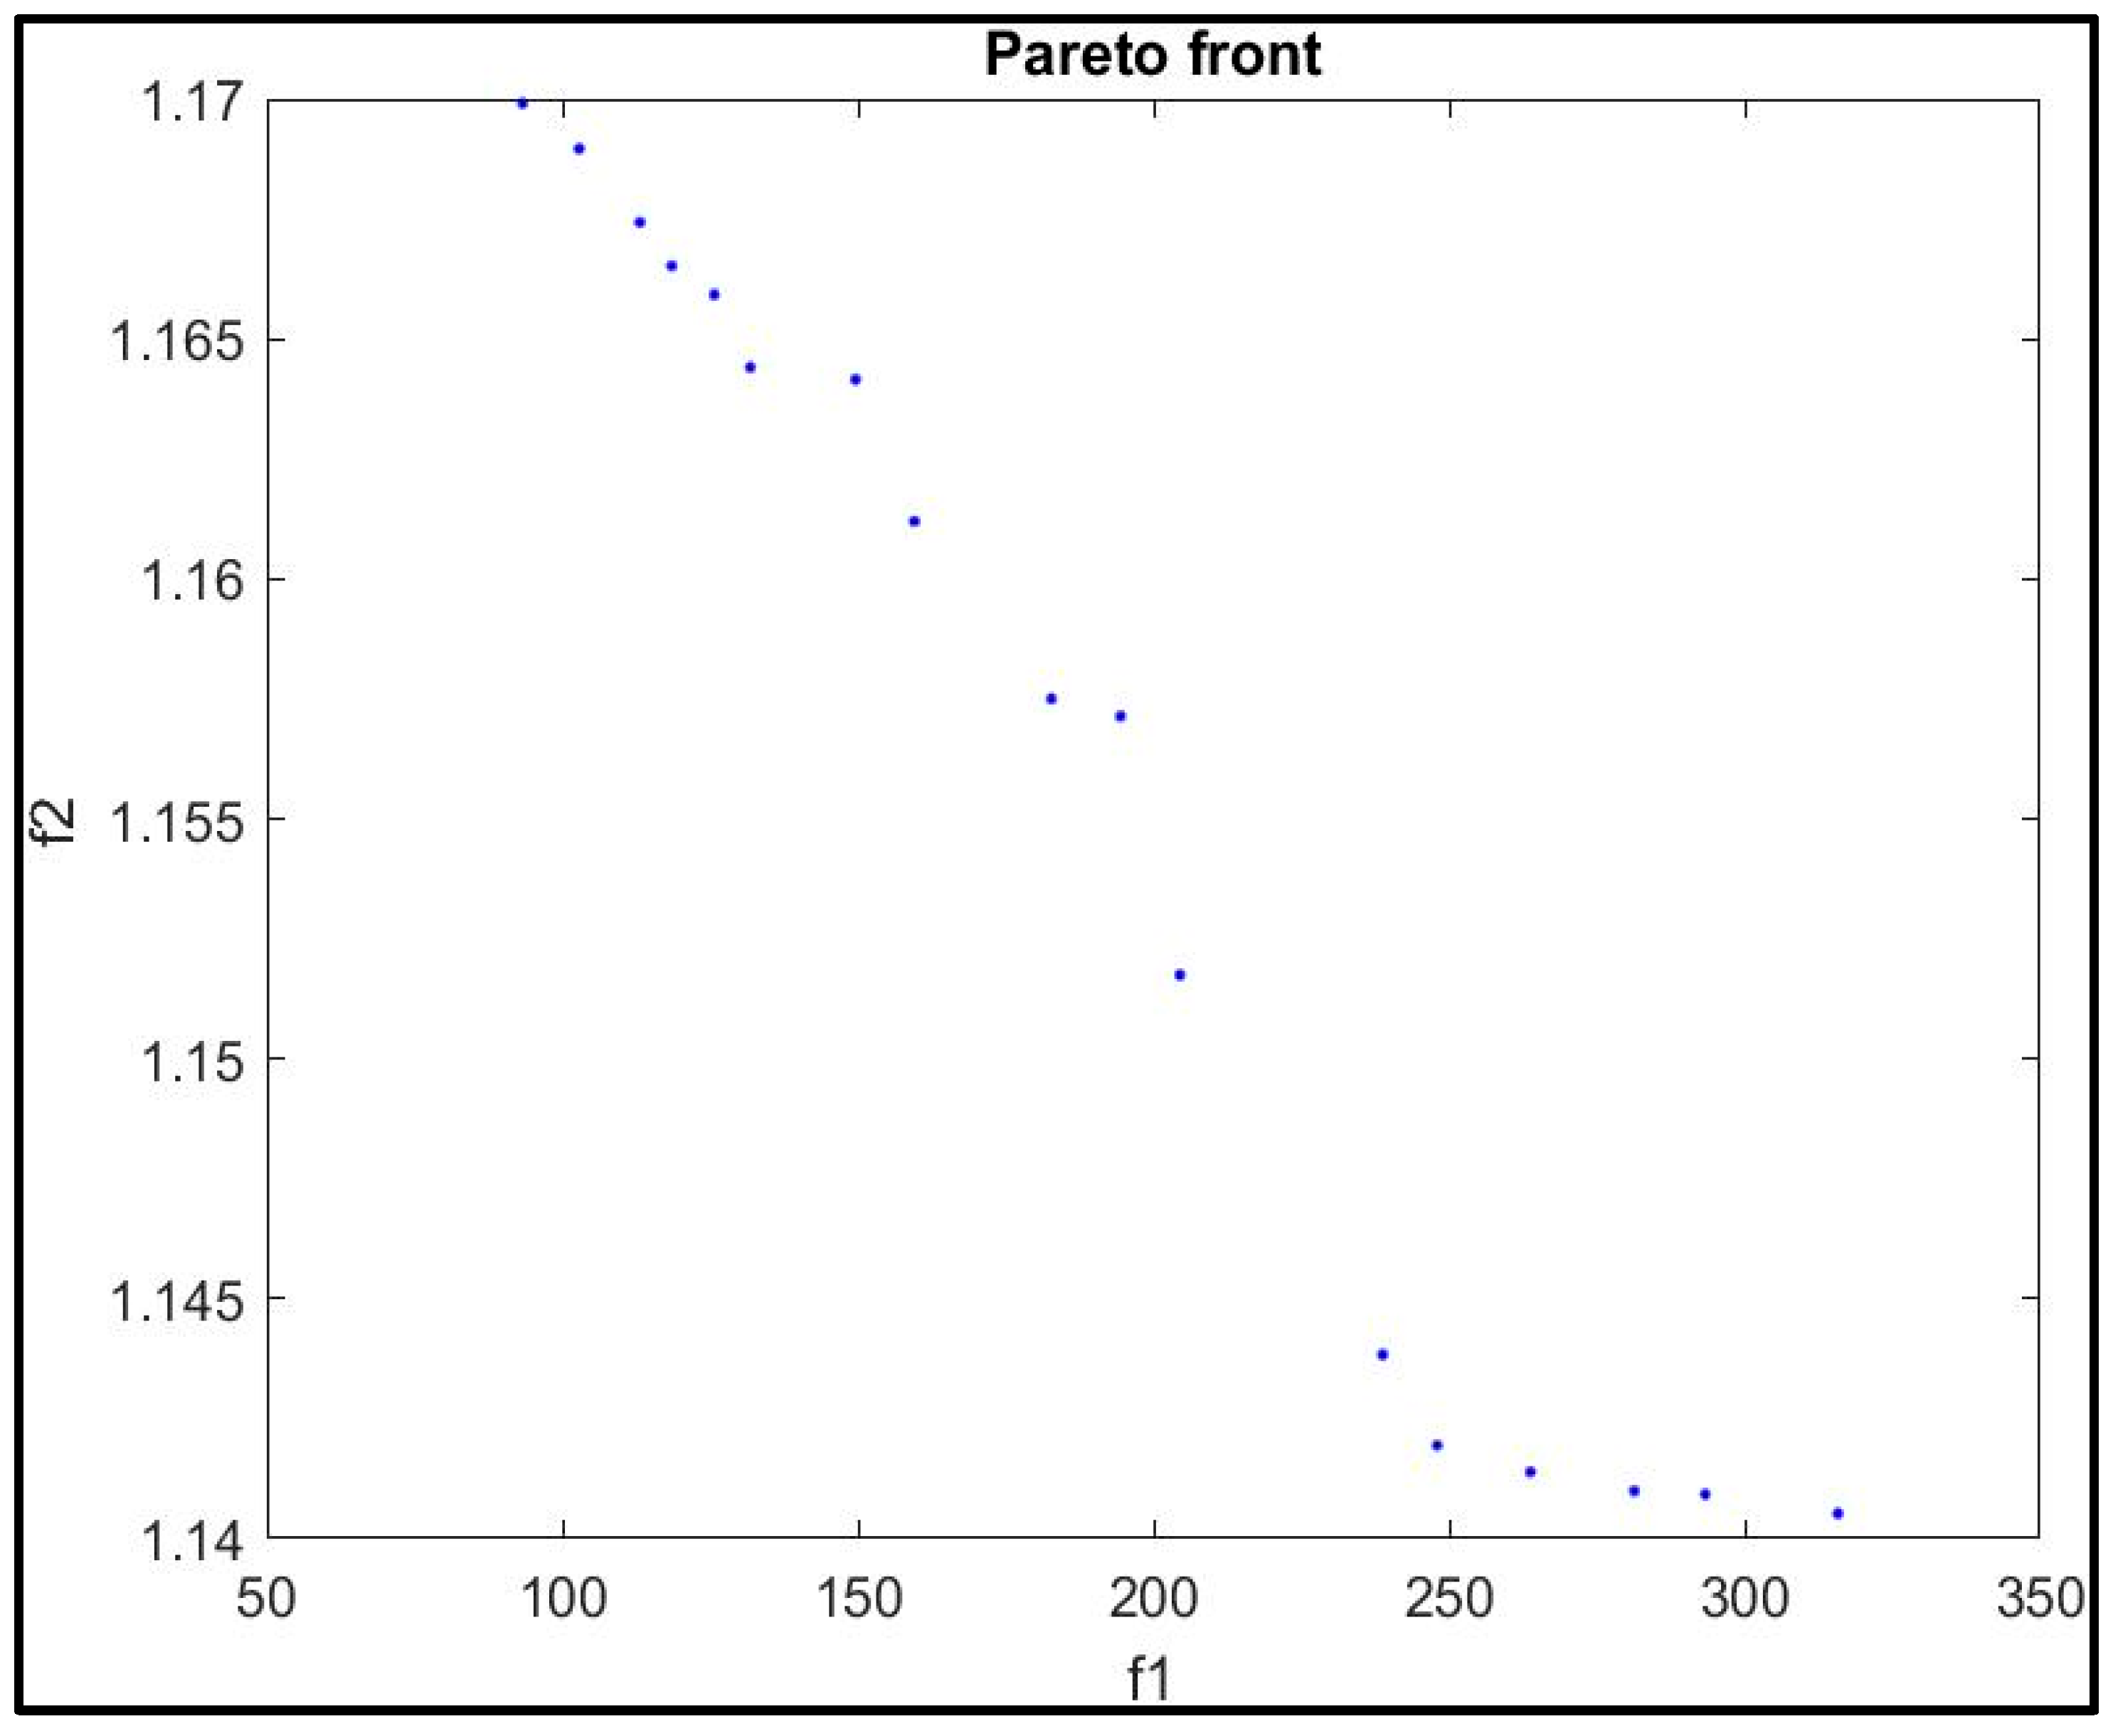
  • Construct an evaluation matrix, (aij) A × f, where A represents the 18 non-dominated solution points and f denotes the objective functions.
  • To normalize this evaluation matrix, use the formula a i j = a i j i = 1 18 ( a i j ) 2
    where a i j represents the normalized values of the matrix.
3
Next, calculate the normalized weighted decision matrix, x i j = a i j × ω j , where ω j = ω j j = 1 2 ω j , j = 1 2 ω j = 1 , with weights assigned as f1 = 0.60 and f2 = 0.40.
In this matrix, xij is the normalized weighted value, aij is the normalized value from the evaluation matrix, and ω j is the weight of response j .
4
Identify the maximum ( A j + ) and the minimum ( A j ) of A j + = m a x i = 1 18 x i j , A j = m i n i = 1 18 x i j for each criterion, denoted as A j + is a maximum alternative for each criterion, A j is a minimum alternative for each criterion, respectively.
5
Then, calculate the Euclidean distances between each alternative and the ideal solutions (both positive and negative), where ( d i + ) represents the distance from the positive ideal solution and ( d i ) from the negative ideal solution: d i + = j = 1 2 ( x i j x j + ) 2 , d i = j = 1 2 ( x i j x j + ) 2
where d i + is the distance of the i-th experiment from the ideal solution (positive ideal solution) has been calculated, and d i is the distance of the i-th experiment from the ideal solution (negative ideal solution) has been calculated.
6
For each alternative, calculate the similarity to the minimum alternative using the formula S i = d i d i + d i + , resulting in the TOPSIS scores.
where S i denotes the TOPSIS value, and the highest score indicates the optimal solution.
7
In this case, alternative A3 yields the highest TOPSIS scores of 315.808 and 1.141, identifying it as the optimal single solution.
Another set of parameter combinations is evaluated using a similar method and steps. The initial phase focuses on determining the Pareto front, followed by the second phase, which seeks to identify a single optimal solution through the TOPSIS approach.
The Taguchi method can only optimize the data in Table 2 for a single objective function at a time. To do this, the values of the decision variables (level factors) must be changed. In contrast, this research optimizes multiple objectives simultaneously and extends the scope from discrete to continuous solutions. For instance, the decision variables for ethanol volume and coating time are adjusted to 59.523 mL and 7.907 min, respectively. The optimized PLA+ bone screws demonstrated superior compressive strength compared to uncoated PLA screws, with previously reported typical values ranging from 548 MPa [18] to 270 MPa [50]. In terms of material density, commercial biodegradable bone screws such as BIOSURE HA from Smith & Nephew Healthcare Ltd. are generally reported to exhibit densities around 1.31 g/cm3. A slightly lower value of 1.25 g/cm3 has also been reported [51], whereas ref. [52] documented a density of 1.00 g/cm3. In comparison, the density measured in the present study was 1.141 g/cm3, which falls within a reasonable range and suggests an appropriate balance between material compactness and potential biodegradability. Clinically, improved compressive strength and density may enhance the structural integrity of PLA-based implants. Nevertheless, practical aspects, including cost-effectiveness, scalability, and long-term biocompatibility, require further exploration through clinical studies and economic analyses.
Figure 7a,b represents SEM images at magnifications of ×3000 and ×5000, respectively, showing that the surface of PLA+ coated with molybdenum and zirconia via the dip-coating method exhibits a uniform, dense morphology free from defects such as cracks or delamination, with a coating thickness ranging from 3 to 6 µm. This structure indicates good adhesion and the successful execution of the coating process. The red rectangles indicate the areas selected for EDS analysis. Figure 7c EDS spectrum corresponding to the area marked in (a), shown in red; (d) EDS spectrum corresponding to the area marked in (b), shown in blue. Grey lines indicate the reference X-ray emission peaks for the detected elements (C, O, Mo, and Zr). EDX analysis in Figure 7c,d reveals the consistent presence of Mo, Zr, and O elements throughout the observed areas, confirming the formation of a stable and clean Mo and ZrO2 layer without contamination. The dominant C element originates from the PLA+ substrate, while the uniform distribution of elements supports the morphological findings from SEM. Scratch adhesion tests indicated good coating adherence, achieving adhesion levels classified as 4B according to the ASTM D3359 standard [53].

4. Conclusions

This study utilized the Taguchi method to develop a multi-objective optimization model for determining dip-coating parameters, aiming to enhance compression strength while maintaining optimal density. Key factors analyzed include the composition of molybdenum and zirconia, ethanol volume, incubation time, and coating duration. By applying the Non-dominated Sorting Genetic Algorithm II (NSGA-II) and the Gamultiobj algorithm in MATLAB, the study identifies an optimal parameter combination that significantly improves mechanical performance. The results highlight that precise control of material composition and process conditions leads to a well-balanced coating with enhanced structural integrity and durability.
Although the developed optimization method demonstrated significant improvements in the mechanical properties of PLA+ bone screws, several limitations must be acknowledged. This study did not include evaluations of long-term in vivo biocompatibility, degradation behavior under physiological conditions, or economic feasibility. Moreover, all experiments were conducted under controlled laboratory conditions, which may not accurately reflect the complexity of real biological environments. Therefore, further research is needed to incorporate cost–benefit analyses and comparative assessments with commercially available PLA+ implants to determine the clinical and economic viability of this approach. Additionally, the integration of more compressive material characterization techniques and an assessment of the scalability of the coating process in an industrial context are expected to enhance the practical relevance and applicability of the findings. Addressing these aspects would allow for further refinement of the findings. Addressing these aspects would allow for further refinement of the proposed optimization framework to support the development of more robust, application-specific coating materials for use in biomedical and structural engineering fields.

Author Contributions

Methodology, E.P. and C.N.R.; Software, P.W.L.; Writing—original draft, S.L. All authors have read and agreed to the published version of the manuscript.

Funding

This research received no external funding.

Data Availability Statement

The original contributions presented in this study are included in the article. Further inquiries can be directed to the corresponding author.

Conflicts of Interest

The authors declare no conflict of interest.

References

  1. Langer, R.; Cima, L.G.; Tamada, J.A.; Wintermantel, E. Future directions in biomaterials. Biomaterials 1990, 11, 738–745. [Google Scholar] [CrossRef] [PubMed]
  2. Biswal, T. Biopolymers for tissue engineering applications: A review. Mater. Today Proc. 2021, 41, 397–402. [Google Scholar] [CrossRef]
  3. Jiang, Y.; Torun, T.; Maffioletti, S.M.; Serio, A.; Tedesco, F.S. Bioengineering human skeletal muscle models: Recent advances, current challenges and future perspectives. Exp. Cell Res. 2022, 416, 113133. [Google Scholar] [CrossRef] [PubMed]
  4. Proctor, D.W.; Goodall, R.; Borsky, K.; Salciccioli, J.D.; Marshall, D.C.; Shalhoub, J. Trends in the incidence of rib and sternal fractures: A nationwide study of the global burden of disease database, 1990–2019. Injury 2024, 55, 111404. [Google Scholar] [CrossRef]
  5. Wasserman, H.; Gordon, C.M. Bone Mineralization and Fracture Risk Assessment in the Pediatric Population. J. Clin. Densitom. Assement Manag. Musculoskelet. Health 2017, 20, 389–396. [Google Scholar] [CrossRef]
  6. Kanis, J.A.; Johansson, H.; McCloskey, E.V.; Liu, E.; Åkesson, K.E.; Anderson, F.A.; Azagra, R.; Bager, C.; Beaudart, C.; Bischoff-Ferrari, H.A.; et al. Previous fracture and subsequent fracture risk: A meta-analysis to update FRAX. Osteoporos. Int. 2023, 34, 2027–2045. [Google Scholar] [CrossRef] [PubMed]
  7. Odén, A.; McCloskey, E.V.; Kanis, J.A.; Harvey, N.C.; Johansson, H. Burden of high fracture probability worldwide: Secular increases 2010–2040. Osteoporos. Int. 2015, 26, 2243–2248. [Google Scholar] [CrossRef]
  8. Nazari, G.; Diep, D.; MacDermid, J.C. The state of trial registrations in the field of Orthopaedics in years 2015–2020. A meta-epidemiological study. Osteoarthr. Cart. Open 2021, 3, 100215. [Google Scholar] [CrossRef]
  9. Meng, L.; Xie, F.; Zhang, B.; Wang, D.K.; Yu, L. Natural Biopolymer Alloys with Superior Mechanical Properties. ACS Sustain. Chem. Eng. 2018, 7, 2792–2802. [Google Scholar] [CrossRef]
  10. Yakimets, I.; Paes, S.S.; Wellner, N.; Smith, A.C.; Wilson, R.H.; Mitchell, J.R. Effect of Water Content on the Structural Reorganization and Elastic Properties of Biopolymer Films: A Comparative Study. Biomacromolecules 2007, 8, 1710–1722. [Google Scholar] [CrossRef]
  11. Brzeziński, M.; Basko, M. Polylactide-Based Materials: Synthesis and Biomedical Applications. Molecules 2023, 28, 1386. [Google Scholar] [CrossRef] [PubMed]
  12. Arumaiselvan, U.; Kalimuthu, M.; Nagarajan, R.; Mohan, M.; Ismail, S.O.; Mohammad, F.; Al-Lohedan, H.A.; Krishnan, K. Mechanical, physical and thermal properties of polylactic acid filament composite reinforced with newly isolated Cryptostegia grandiflora fiber. BioResources 2024, 2, 3740–3754. [Google Scholar] [CrossRef]
  13. González-Rodríguez, L.; Pérez-Davila, S.; Lama, R.; López-Álvarez, M.; Serra, J.; Novoa, B.; Figueras, A.; González, P. 3D printing of PLA:CaP:GO scaffolds for bone tissue applications. RSC Adv. 2023, 13, 15947–15959. [Google Scholar] [CrossRef]
  14. Butt, M.S.; Bai, J.; Xue, F. Biodegradable Mg Strengthened Poly-Lactic Acid Composite through Interfacial Properties. Mater. Sci. Forum 2017, 900, 7–11. [Google Scholar] [CrossRef]
  15. Kadhum, A.H.; Al-Zubaidi, S.; AlKareem, S.S.A. Optimization of Mechanical Properties and Surface Characteristics of PLA+ 3D Printing Materials. Int. J. Chem. Eng. 2023, 2023, 8887905. [Google Scholar] [CrossRef]
  16. Sen, M. (Ed.) Nanocomposite Materials. In Nanotechnology and the Environment; IntechOpen: London, UK, 2020; Chapter 6; Volume 1, pp. 1–12. [Google Scholar]
  17. Basova, T.V.; Vikulova, E.S.; Dorovskikh, S.I.; Hassan, A.; Morozova, N.B. The use of noble metal coatings and nanoparticles for the modification of medical implant materials. Mater. Des. 2021, 204, 109672. [Google Scholar] [CrossRef]
  18. Dhandapani, R.; Krishnan, P.D.; Zennifer, A.; Kannan, V.; Manigandan, A.; Arul, M.R.; Jaiswal, D.; Subramanian, A.; Kumbar, S.G.; Sethuraman, S. Additive manufacturing of biodegradable porous orthopaedic screw. Bioact. Mater. 2020, 5, 458–467. [Google Scholar] [CrossRef]
  19. Rouf, S.; Malik, A.; Raina, A.; Haq, M.I.U.; Naveed, N.; Zolfagharian, A.; Bodaghi, M. Functionally graded additive manufacturing for orthopedic applications. J. Orthop. 2022, 33, 70–80. [Google Scholar] [CrossRef]
  20. Ahirwar, H.; Zhou, Y.; Mahapatra, C.; Ramakrishna, S.; Kumar, P.; Nanda, H.S. Materials for Orthopedic Bioimplants: Modulating Degradation and Surface Modification Using Integrated Nanomaterials. Coatings 2020, 10, 264. [Google Scholar] [CrossRef]
  21. Ganjali, M.; Asl, S.M.; Alizadeh, M.; Shahlaei, M.; Jam, A.S. Synthesis and characterization of nHA-PLA composite coating on stainless steel 316L by dip-coating process for biomedical applications. J. Interfaces 2017, 2, 57–64. [Google Scholar]
  22. Uchida, M.; Kim, H.; Kokubo, T.; Nawa, M.; Asano, T.; Tanaka, K.; Nakamura, T. Apatite-forming ability of a zirconia/alumina nano-composite induced by chemical treatment. J. Biomed. Mater. Res. 2002, 60, 277–282. [Google Scholar] [CrossRef] [PubMed]
  23. Wang, Y.; Zhang, D.; Shi, L.; Li, L.; Zhang, J. Novel transparent ternary nanocomposite films of trialkoxysilane-capped poly(methyl methacrylate)/zirconia/titania with incorporating networks. Mater. Chem. Phys. 2008, 110, 463–470. [Google Scholar] [CrossRef]
  24. Silverajah, V.S.G.; Ibrahim, N.A.; Zainuddin, N.; Yunus, W.M.Z.W.; Hassan, H.A. Mechanical, thermal and morphological properties of poly(lactic acid)/epoxidized palm olein blend. Molecules 2012, 17, 11729–11747. [Google Scholar] [CrossRef]
  25. Mohan, L.; Babu, P.D.; Kumar, P.; Anandan, C. Influence of zirconium doping on the growth of apatite and corrosion behavior of DLC-coated titanium alloy Ti-13Nb-13Zr. Surf. Interface Anal. 2013, 45, 1785–1791. [Google Scholar] [CrossRef]
  26. Vaizogullar, A.İ.; Balci, A.; Ugurlu, M.; Karaoglu, M.H. Synthesis of TiO2 and ZrO2/TiO2 Composite Microspheres and Their Photo-Catalytic Degradation of Methylene Blue. Afyon Kocatepe Univ. J. Sci. Eng. 2016, 16, 54–60. [Google Scholar]
  27. Lung, Y.K. Surface coatings of titanium and zirconia. Adv. Mater. Sci. 2017, 2, 1–3. [Google Scholar] [CrossRef]
  28. Dini, F.W.; Helmiyati, H.; Krisnandi, Y.K. Cellulose and TiO2–ZrO2 Nanocomposite as a Catalyst for Glucose Conversion to 5-EMF. Bull. Chem. React. Eng. Catal. 2021, 16, 320–330. [Google Scholar] [CrossRef]
  29. Hari Raj, K.; Gnanavel, S.; Ramalingam, S. Investigation of 3D printed biodegradable PLA orthopedic screw and surface modified with nanocomposites (Ti–Zr) for biocompatibility. Ceram. Int. 2023, 49, 7299–7307. [Google Scholar] [CrossRef]
  30. Boccaccini, A.R.; Keim, S.; Ma, R.; Li, Y.; Zhitomirsky, I. Electrophoretic deposition of biomaterials. J. R. Soc. Interface 2010, 7, S581–S613. [Google Scholar] [CrossRef]
  31. Cordero-Arias, L.; Cabanas-Polo, S.; Goudouri, O.; Misra, S.; Gilabert, J.; Valsami-Jones, E.; Sanchez, E.; Virtanen, S.; Boccaccini, A. Electrophoretic deposition of ZnO/alginate and ZnO-bioactive glass/alginate composite coatings for antimicrobial applications. Mater. Sci. Eng. C 2015, 55, 137–144. [Google Scholar] [CrossRef]
  32. Heimann, R.B. Plasma-Sprayed Osseoconductive Hydroxylapatite Coatings for Endoprosthetic Hip Implants: Phase Composition, Microstructure, Properties, and Biomedical Functions. Coatings 2024, 14, 787. [Google Scholar] [CrossRef]
  33. Wulandari, R.T.; Triyono, J.; Pujiyanto, E. Multi-response Optimization in Injection Molding Process of PLA Bone Screw using Taguchi Method and Response Surface Methodology. In AIP Conference Proceedings; American Institute of Physics Inc.: College Park, MD, USA, 2023; pp. 1–6. [Google Scholar]
  34. Tran, C.C.; Nguyen, V.T. Optimization of Filling Time and Volumetric Shrinkage Rate in Simulation of Plastic Product Injection Molding Process Using RSM and NSGA-II. Jordan J. Mech. Ind. Eng. 2024, 19, 67–77. [Google Scholar]
  35. Pangestu, P.; Pujiyanto, E.; Rosyidi, C.N. Multi-objective cutting parameter optimization model of multi-pass turning in CNC machines for sustainable manufacturing. Heliyon 2021, 7, e06043. [Google Scholar] [CrossRef]
  36. Rosyidi, C.N.; Budiaji, A.; Pujiyanto, E. Multiresponse optimization on the process of roof tiles manufacture using the taguchi and pcr-topsis method. J. Teknol. 2022, 84, 11–18. [Google Scholar] [CrossRef]
  37. Naranbat, D.; Phelps, B.; Murphy, J.; Tripathi, A. How to convert a 3D printer to a personal automated liquid handler for life science workflows. SLAS Technol. 2025, 30, 100239. [Google Scholar] [CrossRef] [PubMed]
  38. Piçarra, S.; Lopes, E.; Almeida, P.L.; De Lencastre, H.; Aires-De-Sousa, M. Novel coating containing molybdenum oxide nanoparticles to reduce Staphylococcus aureus contamination on inanimate surfaces. PLoS ONE 2019, 14, e0213151. [Google Scholar] [CrossRef] [PubMed]
  39. ASTM D7027; Test Method for Evaluation of Scratch Resistance of Polymeric Coatings and Plastics Using an Instrumented Scratch Machine. ASTM International: West Conshohocken, PA, USA, 2020.
  40. Redlich, C.; Quadbeck, P.; Thieme, M.; Kieback, B. Molybdenum—A biodegradable implant material for structural applications? Acta Biomater. 2020, 104, 241–251. [Google Scholar] [CrossRef]
  41. Zhu, Z.; Wu, H.; Ye, C.; Fu, W. Enhancement on Mechanical and Thermal Properties of PLA Biocomposites Due to the Addition of Hybrid Sisal Fibers. J. Nat. Fibers 2017, 14, 875–886. [Google Scholar] [CrossRef]
  42. Ismail, K.B.M.; Kumar, M.A.; Mahalingam, S.; Kim, J.; Atchudan, R. Recent Advances in Molybdenum Disulfide and Its Nanocomposites for Energy Applications: Challenges and Development. Materials 2023, 16, 4471. [Google Scholar] [CrossRef]
  43. Castañeda-Rodríguez, S.; González-Torres, M.; Ribas-Aparicio, R.M.; Del Prado, M.L.; Leyva, G.; Gürer, E.S.; Sharifi, J. Recent advances in modified poly (lactic acid) as tissue engineering materials. J. Biol. Eng. 2023, 17, 21. [Google Scholar] [CrossRef]
  44. Zidan, S.; Silikas, N.; Alhotan, A.; Haider, J.; Yates, J. Investigating the Mechanical Properties of ZrO2-Impregnated PMMA Nanocomposite for Denture-Based Applications. Materials 2019, 12, 1344. [Google Scholar] [CrossRef] [PubMed]
  45. Mosas, K.K.A.; Chandrasekar, A.R.; Dasan, A.; Pakseresht, A.; Galusek, D. Recent Advancements in Materials and Coatings for Biomedical Implants. Gels 2022, 8, 323. [Google Scholar] [CrossRef] [PubMed]
  46. Adamiak, S.; Bochnowski, W.; Dziedzic, A.; Szyller, Ł.; Adamiak, D. Characteristics of the structure, mechanical, and tribological properties of a mo-mo2n nanocomposite coating deposited on the ti6al4v alloy by magnetron sputtering. Materials 2021, 14, 6819. [Google Scholar] [CrossRef] [PubMed]
  47. Zare, Y.; Shabani, I. Polymer/metal nanocomposites for biomedical applications. Mater. Sci. Eng. C 2016, 60, 195–203. [Google Scholar] [CrossRef]
  48. Zhang, Z.; Peng, F.; Kornev, K.G. The Thickness and Structure of Dip-Coated Polymer Films in the Liquid and Solid States. Micromachines 2022, 13, 982. [Google Scholar] [CrossRef]
  49. Pujiyanto, E.; Rosyidi, C.N.; Hisjam, M.; Liquddanu, E. Sustainable multi-objective optimization of a machining parameter model for multi-pass turning processes. Cogent Eng. 2022, 9, 2108154. [Google Scholar] [CrossRef]
  50. Agarwal, R.; Mehtani, H.K.; Singh, J.; Gupta, V. Post-yielding fracture mechanics of 3D printed polymer-based orthopedic cortical screws. Polym. Compos. 2022, 43, 6829–6837. [Google Scholar] [CrossRef]
  51. Jamari, J.; Fitriyana, D.; Ramadhan, P.S.; Nugroho, S.; Ismail, R.; Bayuseno, A. Interference screws 3D printed with polymer-based biocomposites (HA/PLA/PCL). Mater. Manuf. Process. 2022, 38, 1093–1103. [Google Scholar] [CrossRef]
  52. Ismail, R.; Fitriyana, D.F.; Bayuseno, A.P.; Munanda, R.; Muhamadin, R.C.; Nugraha, F.W.; Rusiyanto; Setiyawan, A.; Bahatmaka, A.; Firmansyah, H.N.; et al. Design, Manufacturing and Characterization of Biodegradable Bone Screw from PLA Prepared by Fused Deposition Modelling (FDM) 3D Printing Technique. J. Adv. Res. Fluid Mech. Therm. Sci. 2023, 103, 205–215. [Google Scholar] [CrossRef]
  53. ASTM D3359; Test Methods for Rating Adhesion by Tape Test. ASTM International: West Conshohocken, PA, USA, 2023.
Figure 1. (a) Design of bone screw using SolidWorks software and (b) 3D-printed design model of bone screws.
Processes 13 01690 g001
Figure 2. A diagrammatic representation showing the process of preparing Mo-Zr nanocomposites.
Processes 13 01690 g002
Figure 3. (a) Uncoated bone screw, (b) process using nanocomposite, and (c) coated bone screws.
Processes 13 01690 g003
Figure 4. Contour plot of compression test.
Processes 13 01690 g004
Figure 5. Contour plot of the density test.
Processes 13 01690 g005
Figure 6. Pareto front of the compression test and the density test.
Processes 13 01690 g006
Figure 7. (a,b) SEM images of nanocomposite-coated bone screws and (c,d) EDX spectrum of nanocomposite-coated bone screws.
Processes 13 01690 g007
Table 1. Factor and level in the Taguchi experiment.
ParameterLevel
1234
Molybdenum material weight (g)0.10.20.30.4
Zirconia material weight (g)0.10.20.30.4
Ethanol volume (mL)30405060
Incubation time (h)681224
Coating time (min)251015
Table 2. Experimental data for compression and density tests.
RunA (g)B (g)C
(mL)
D (h)E (min)Compression Test/Ec (Modulus of Elasticity) (MPa) Density Test (g/cm3)
1234 X ¯ SD1234 X ¯ SD
10.10.13062572573571570571.501.291.231.271.231.241.240.09
20.10.24085325324325321323.751.891.161.181.181.171.170.01
30.10.350121010201023102210181020.752.221.151.161.151.161.150.01
40.10.4602415502504503502502.750.961.141.131.151.161.140.01
50.20.1401215220221222218220.251.711.131.131.151.141.140.01
60.20.2302410514512513512512.750.961.161.161.171.181.170.01
70.20.36065241240243239240.751.711.161.161.161.161.160.00
80.20.45082318319320317318.501.291.151.171.181.161.160.01
90.30.150245721720719720720.000.821.191.181.161.191.180.01
100.30.260122621620619618619.501.291.171.211.191.181.180.01
110.30.330815545543544542543.501.291.191.181.161.181.170.01
120.30.440610315314313312313.501.291.161.181.191.171.170.01
130.40.160810220221222219220.501.291.161.211.181.191.180.02
140.40.250615169168167169168.250.961.171.171.171.181.170.01
150.40.340242521522520519520.501.291.171.181.171.191.170.01
160.40.43085378377379376377.501.291.201.191.191.181.190.01
where A: Molybdenum material weight (g); B: Zirconia material weight (g); C: Ethanol volume (mL); D: Incubation time (h); E: Coating time (min).
Table 3. ANOVA and percentage contribution of Taguchi design for the compression test.
FactorsDFSumSqrMeanSqrF ValueProb > F% Contributionp-Value
Molybdenum material weight (g)3817,553272,518140,277035.400.000
Zirconia material weight (g)3292,14197,38050,126013.140.000
Ethanol volume (mL)3589,345196,448101,121015.010.000
Incubation time (h)3810,847270,282139,127027.720.000
Coating time (min)3257,85685,95244,243.408.600.000
Error48932 0.13
Total63 100.00
Model summary
SR-sqR-sq (adj)R-sq (pred)
1.3938198.98%96.98%94.88%
Table 4. ANOVA and percentage contribution analysis of Taguchi design for the density test.
FactorsDFSumSqrMeanSqrF ValueProb > F% Contributionp-Value
Molybdenum material weight (g)30.00550.0018312.9017.420.000
Zirconia material weight (g)30.002830.000946.640.0016.760.001
Ethanol volume (mL)30.004970.0016611.67020.650.000
Incubation time (h)30.003640.001218.55010.200.000
Coating time (min)30.009130.0030421.44025.880.000
Error480.006820.00014 19.09
Total63 100.00
Model summary
SR-sqR-sq (adj)R-sq (pred)
0.0119280.91%74.95%66.07%
Table 5. ANOVA analysis of RSM for the compression test.
SourcedfAdj SSAdj MSF-Valuep-Value
Model208,665,900433,29511.990.029
   Linear52,558,570511,71414.160.004
Mo material weight (g)1381,979381,97910.570.045
Zr material weight (g)1610,371610,37116.890.012
Ethanol volume (mL)1573,510573,51015.870.020
Incubation time (h)1367,523367,52310.170.018
Coating time (min)1625,549625,54917.310.010
   Square52,083,356416,67111.530.022
Mo material weight (g) × Mo material weight (g)1405,468405,46811.220.026
Zr weight (g) × Zr material weight (g)1367,162367,16210.160.001
Ethanol volume (mL) × Ethanol volume (mL)1368,969368,96910.210.005
Incubation time (h) × Incubation time (h)1375,835375,83510.400.002
Coating time (min) × Coating time (min)1561,223561,22315.530.003
   2-way interaction104,025,773402,57711.140.035
Mo material weight (g) × Zr material weight (g)1366,801366,80110.150.001
Mo material weight (g) × Ethanol volume (mL)1394,627394,62710.920.004
Mo material weight (g) × Incubation time (h)1372,944372,94410.320.006
Mo material weight (g) × Coating time (min)1510,630510,63014.130.008
Zr material weight (g) × Ethanol volume (mL)1397,157397,15710.990.025
Zr material weight (g) × Incubation time (h)1361,380361,38010.000.048
Zr material weight (g) × Coating time (min)1395,711395,71110.950.004
Ethanol volume (mL) × Incubation time (h)1490,754490,75413.580.015
Ethanol volume (mL) × Coating time (min)1371,860371,86010.290.025
Incubation time (h) × Coating time (min)1362,826362,82610.040.003
Error431,553,93836,138
Cor total632,993,383
Table 6. ANOVA analysis of RSM for the density test.
SourcedfAdj SSAdj MSF-Valuep-Value
Model200.1858740.009293714.320.000
   Linear50.0548730.010974616.910.000
Mo material weight (g)10.0080540.008054112.410.027
Zr material weight (g)10.0158750.015874524.460.000
Ethanol volume (mL)10.0142070.014206621.890.000
Incubation time (h)10.0164980.016497625.420.000
Coating time (min)10.0103840.010384016.000.000
   Square50.0410820.008216312.660.000
Mo material weight (g) × Mo material weight (g)10.0210470.021047132.430.000
Zr weight (g) × Zr material weight (g)10.0178730.017873527.540.000
Ethanol volume (mL) × Ethanol volume (mL)10.0241230.024123337.170.000
Incubation time (h) × Incubation time (h)10.0067690.006769110.430.002
Coating time (min) × Coating time (min)10.0065220.006522510.050.032
   2-way interaction100.1137050.011370517.520.000
Mo material weight (g) × Zr material weight (g)10.0175810.017581427.090.000
Mo material weight (g) × Ethanol volume (mL)10.0121880.012188218.780.000
Mo material weight (g) × Incubation time (h)10.0139790.013979521.540.000
Mo material weight (g) × Coating time (min)10.0172110.017211526.520.000
Zr material weight (g) × Ethanol volume (mL)10.0070030.007002710.790.002
Zr material weight (g) × Incubation time (h)10.0071910.007190911.080.004
Zr material weight (g) × Coating time (min)10.0064900.006490010.000.045
Ethanol volume (mL) × Incubation time (h)10.0071910.007190911.080.004
Ethanol volume (mL) × Coating time (min)10.0064900.006490010.000.045
Incubation time (h) × Coating time (min)10.0065160.006516010.040.036
Error430.0278890.0006490
Cor total630.039975
Table 7. Pareto points correspond to the values of decision variables and objective functions.
Pareto PointDecision VariablesObjective Function
Molybdenum Material Weight (g)Zirconia Material Weight (g)Ethanol Volume (mL)Incubation Time (h)Coating Time (min)Compression Test/Ec (Modulus of Elasticity) (MPa)Density Test (g/cm3)
A10.1010.10059.56123.8802.39093.2951.170
A20.1010.10059.9236.0257.907316.8181.132
A30.1010.10059.9236.0257.907315.8081.141
A40.1010.10159.8186.1414.896263.7781.141
A50.1020.10159.79312.2532.643204.4811.152
A60.1020.10159.61923.7763.262102.8571.169
A70.1020.10159.8446.0643.447248.0111.142
A80.1020.10159.68020.3842.449131.8311.164
A90.1020.10159.64721.9182.759118.5361.167
A100.1020.10259.8496.1026.758293.3561.141
A110.1020.11459.66316.1764.151194.4621.157
A120.1030.10259.8926.0386.042281.3421.141
A130.1040.10759.78516.1603.320182.7551.158
A140.1020.10159.8127.1573.008238.8051.144
A150.1010.10059.61222.7633.180113.1311.167
A160.1020.10359.60621.7683.206125.7381.166
A170.1010.10159.77821.5345.040149.6451.164
A180.1020.10059.69219.1303.978159.5821.161
Table 8. The single optimal solution.
Decision Variables
Molybdenum Material Weight (g)Zirconia Material Weight (g)Ethanol Volume (mL)Incubation Time (h)Coating Time (min)
0.1010.10059.5236.0257.907
Optimal value of objective function
Compression Test/Ec (Modulus of elasticity) (MPa)Density Test (g/cm3)
315.8081.141
Disclaimer/Publisher’s Note: The statements, opinions and data contained in all publications are solely those of the individual author(s) and contributor(s) and not of MDPI and/or the editor(s). MDPI and/or the editor(s) disclaim responsibility for any injury to people or property resulting from any ideas, methods, instructions or products referred to in the content.

