Article

Study on Coal Particle Properties and Critical Velocity Model in Coalbed Methane Horizontal Wells

1
Key Laboratory of Deep CBM Exploration and Production Technology, SINOPEC, Zhengzhou 450007, China
2
Petroleum Engineering Technology Research Institute, Sinopec North China E & P Company, Zhengzhou 450007, China
3
State Key Laboratory of Petroleum Resources and Engineering, China University of Petroleum (Beijing), Beijing 102249, China
4
College of Petroleum Engineering, China University of Petroleum (Beijing), Beijing 102249, China
*
Author to whom correspondence should be addressed.
Processes 2025, 13(5), 1550; https://doi.org/10.3390/pr13051550
Submission received: 14 April 2025 / Revised: 13 May 2025 / Accepted: 15 May 2025 / Published: 17 May 2025
(This article belongs to the Special Issue Coalbed Methane Development Process)

Abstract

During the drainage process of coalbed methane (CBM) horizontal wells, wellbore fluctuations exert a significant influence on gas–liquid–solid three-phase flow behavior and coal particle migration. This study investigates the effects of wellbore inclination, gas–liquid flow rates, and coal particle sizes on migration characteristics through laboratory-scale experiments, based on an initial analysis of coal particle physical properties. A critical velocity model accounting for wellbore fluctuations is developed and refined. The migration states of coal particles under various operational conditions are examined, and the corresponding critical velocities and movement patterns are analyzed. The results show that coal particle migration is predominantly governed by the liquid phase, while the presence of particles has limited impact on the overall gas–liquid flow regime. Under different wellbore inclinations, the critical velocity increases with particle size; however, the influence of inclination is more pronounced than that of particle size. Coal particle entrainment follows three distinct stages: hopping, rolling, and suspension. The velocity during the rolling stage is identified as the critical velocity. At steeper inclination angles, particles are more easily entrained by the flow, and the associated critical velocity is higher. Based on the fitted experimental data, the model is revised to improve its predictive capability for coal particle transport in CBM wells. Finally, the model is validated using field data from a CBM well in the Ordos Basin. The results confirm the model’s ability to predict coal particle accumulation trends within the wellbore. This study provides new insights into coal particle migration mechanisms under fluctuating wellbore conditions, offering both experimental and theoretical support for understanding gas–liquid–solid flow behavior. It also presents technical guidance for optimizing drainage performance, controlling particle deposition, and formulating wellbore cleaning strategies.

1. Introduction

During coalbed methane (CBM) drainage, fluctuations in formation pressure and hydraulic scouring can cause coal particles to detach from the formation and enter the wellbore, particularly in horizontal wells. Coal particle accumulation can lead to significant blockages, reducing gas migration, altering two-phase flow characteristics, and reducing the effective flow area. Accumulated particles may also bury perforated intervals, restrict gas and water inflow, or even jam production tubing [1]. These blockages degrade pump performance, increase equipment wear, and shorten service life. Conventional cleaning techniques often fail to fully remove these deposits, leading to the use of high-pressure water flushing, tubing-assisted extraction, or sand pumps. The effectiveness of these methods is governed by the fluid’s carrying capacity. Therefore, investigating the critical startup conditions for coal particle entrainment, including the minimum flow velocity required for suspension, is crucial for optimizing wellbore cleaning, improving production stability, and reducing operational costs [2].
Research on particle transport in wellbores has largely focused on cuttings and sand transport, with fewer studies on coal particle transport. Several studies have investigated the initiation conditions for sand particle transport. Tomren et al identified wellbore inclination, fluid velocity, and rheology as key factors influencing cuttings transport [3]. Doron et al developed a two-layer model for stratified solid–liquid flow in horizontal pipes, incorporating momentum and continuity equations for the moving bed and suspension layers [4]. Ford et al proposed a minimum velocity model for cuttings transport in annuli, predicting the minimum transport velocity under suspension and rolling conditions [5]. Doron and Barnea introduced the concept of solid particle initiation velocity and developed a three-layer model for inclined wellbore sections [6]. Nguyen and Rahman advanced this model by incorporating flow characteristics, geometry, and cuttings size [7]. Wang and Wang proposed a method to calculate the terminal settling velocity of spherical particles [8]. Bai et al designed an experimental setup for solid–liquid pipeline transport and developed a two-phase flow resistance model [9]. King et al conducted experiments using a 120 m acrylic pipe with a downward section, bend, and upward section [10]. Li et al derived settling laws for sand particles in various fluids and validated sedimentation characteristics [11]. Li et al simulated liquid–sand flow in vertical wellbores and analyzed sand production behavior [12]. Shi et al proposed a three-phase drift model for oil–gas–water multiphase flow in wellbores [13]. Wang et al developed a two- and three-layer dynamic cuttings transport model for highly deviated and extended-reach wells [14,15,16]. Wang et al investigated sand particle transport, determining the critical carrying flow rates in inclined wellbores [17]. Jiao et al proposed a correction factor for irregular particles based on sedimentation theory [18]. Najmi studied particle transport in single-phase and multiphase flows, considering parameters such as viscosity, particle concentration, and size. He developed a semi-mechanistic model for predicting critical velocity in single-phase flow and extended it to multiphase systems [19]. Najmi et al also compared the migration behavior of irregular sand grains and regular glass beads in horizontal pipelines, finding that the critical initiation velocity was higher for irregular particles [20]. Padsalgikar focused on gas–liquid-solid stratified flow, studying particle migration in both low- and high-concentration flows [21]. Dabirian observed various sand grain morphologies in stratified flow, identifying transition boundaries between them [22]. Sajeev et al showed that at high concentrations, the critical velocity increases with particle concentration, but the effect diminishes when the concentration falls below a threshold [23]. Kareepadath Sajeev studied particle transport threshold concentrations in horizontal pipes, developing a mechanistic model to predict critical velocity and concentration [24]. Leporini et al researched gas–water–sand three-phase flow, finding that the critical deposition velocity depends on gas–liquid flow patterns and sand concentration [25]. Sun Xiaofeng et al developed a transient model for solid–liquid two-phase transport in the annulus based on the drift flow model, using a finite volume method and projection technique to determine the stable particle bed height [26].
Overall, current research on the physical properties of coal particles remains limited. Most existing critical initiation models are developed based on single-phase or simplified two-phase flow conditions and primarily focus on the transport behavior of high-density particles such as drill cuttings, sand grains, or glass beads. In contrast, coal fines generated in coalbed methane (CBM) wells exhibit lower density, pronounced stratification, and strong synchronization with the liquid phase during transport, making it difficult for conventional models to accurately capture their initiation and migration behavior. To address this gap, this study conducted a series of experiments on coal particles with different size ranges, including density measurements, stratification behavior observations, and flow pattern tests. A revised critical velocity model was subsequently established, providing theoretical support for understanding the physical properties and transport mechanisms of coal particles.

2. Coal Particle Property Analysis

2.1. Coal Particle Size Classification

Based on actual field conditions, coal blocks collected from production sites were pulverized using a crusher, and the resulting mixed coal powder was sequentially screened through a set of pre-prepared standard sieves with varying mesh sizes to obtain six distinct particle size groups: 20–40 mesh, 40–60 mesh, 60–80 mesh, 80–100 mesh, 100–120 mesh, and greater than 120 mesh. The detailed experimental procedure is as follows:
(1)
The coal blocks collected from the field were thoroughly pulverized using a crusher to produce mixed coal powder with as uniform a particle size distribution as possible.
(2)
A sieving system was assembled using standard sieves ranging from 20 mesh to 180 mesh to classify the coal particles into specific size fractions.
(3)
Approximately 200 g of the mixed coal powder was placed on the top (20-mesh) sieve, and screening was carried out using a vibrating device for about 10 min to ensure adequate separation of particles by size.
(4)
After screening, coal particles retained on each sieve layer were collected separately and stored in sealed containers labeled with their corresponding particle size range.
(5)
The sieving process was repeated as needed until sufficient quantities of coal particle samples were obtained for each size group. The classified coal samples are shown in Figure 1.

2.2. Measurement of Coal Particle Density

To facilitate analysis, the density of coal particles was determined using the “mass/volume method”. Water was used as the medium for larger coal blocks, while kerosene was used for smaller coal particles. The primary experimental equipment included a high-precision electronic balance and a graduated cylinder.
Using the aforementioned tools and method, the density of both coal blocks and coal particles was measured. The experimental results are as follows:

2.2.1. Density Measurement of Dried Coal Blocks

The density of dry coal blocks was determined using the water displacement method. First, the mass of each coal block was measured using an electronic balance. Then, 30 mL of distilled water was added to a 50 mL graduated beaker, and the initial water level was recorded. The coal block was carefully immersed in the water, and the new water level after displacement was noted. The volume of the coal block was calculated based on the change in water level, and the density was obtained by dividing the mass by the displaced volume. Multiple measurements were conducted, and the average density of the dry coal blocks was determined to be approximately 1.32 g/cm3.

2.2.2. Density Measurement of Coal Particles

Using a similar method, the density of coal particles of different mesh sizes was measured after complete settlement in kerosene. The detailed experimental data are shown in Table 1.
During the density measurement of coal blocks, their relatively large specific surface area and the coexistence of hydrophobic and hydrophilic regions result in minimal gas adhesion, allowing the measured density to closely approximate the actual value. However, for coal particles, surface tension causes significant gas adhesion to the particle surface, leading to partial floating in water and affecting the accuracy of the density measurement.
To address this issue, the experiment utilizes an oil medium for density measurement. Compared to water, oil has a smaller contact angle with coal particles, facilitating gas desorption from the particle surface, preventing floating, and ensuring a more reliable density measurement.
Moreover, as coal particle size decreases, the specific surface area increases, leading to a higher proportion of adsorbed gas. During the density measurement, even if the same volume of gas is released, fine coal particles retain a larger proportion of residual gas on their surface, resulting in a relatively lower measured density. As a result, the deviation of the measured density from the actual value increases with decreasing particle size, exhibiting a trend of reduced density as particle size decreases.

2.3. Experimental Study on the Layering Characteristics of Coal Particles

Coal particles exhibit significant variations in physical properties such as particle size and density. To investigate the floating and settling behavior of coal particles with different sizes in water, it is necessary to first classify the particles by mesh size, followed by a layering experiment. This experiment reveals the settling patterns of coal particles of varying sizes and also facilitates the further separation of particles with substantial density differences, reducing experimental errors and minimizing external interference. This approach improves the accuracy of subsequent coal particle transport experiments, ensuring that the results are more representative and reliable.

2.3.1. Layering Experiment Procedure

Coal particles exhibit significant differences in size and composition, resulting in high heterogeneity. Due to variations in composition and surface properties, different coal particles may exhibit distinct layering behaviors in water.
In this experiment, coal particles are first classified by size using a screening device consisting of sieves with different mesh sizes. Subsequently, a layering experiment is conducted based on the density differences of coal particles. The primary experimental apparatus includes graduated cylinders, which are used to observe the layering behavior of coal particles with different densities in water.
The experimental procedure is as follows:
(1)
Equal masses of coal powder samples with different mesh sizes were separately added into six clean 50 mL graduated cylinders, and each cylinder was labeled with the corresponding particle size range.
(2)
A fixed volume of distilled water was added to each cylinder. After sealing the openings, the cylinders were manually shaken for approximately 30 s to ensure full dispersion of the coal particles and formation of a uniform suspension.
(3)
The cylinders were then allowed to stand at room temperature. The sedimentation process was observed and recorded at 5 min intervals until the stratification state became stable.
(4)
After 24 h of static settling, the stratification condition of the coal particles was observed and experimental data were recorded.

2.3.2. Layering Experiment Results

The layering of coal particles in the graduated cylinder is shown in Figure 2. From the figure, it can be observed that coal particles of different mesh sizes exhibit different layering characteristics in water.
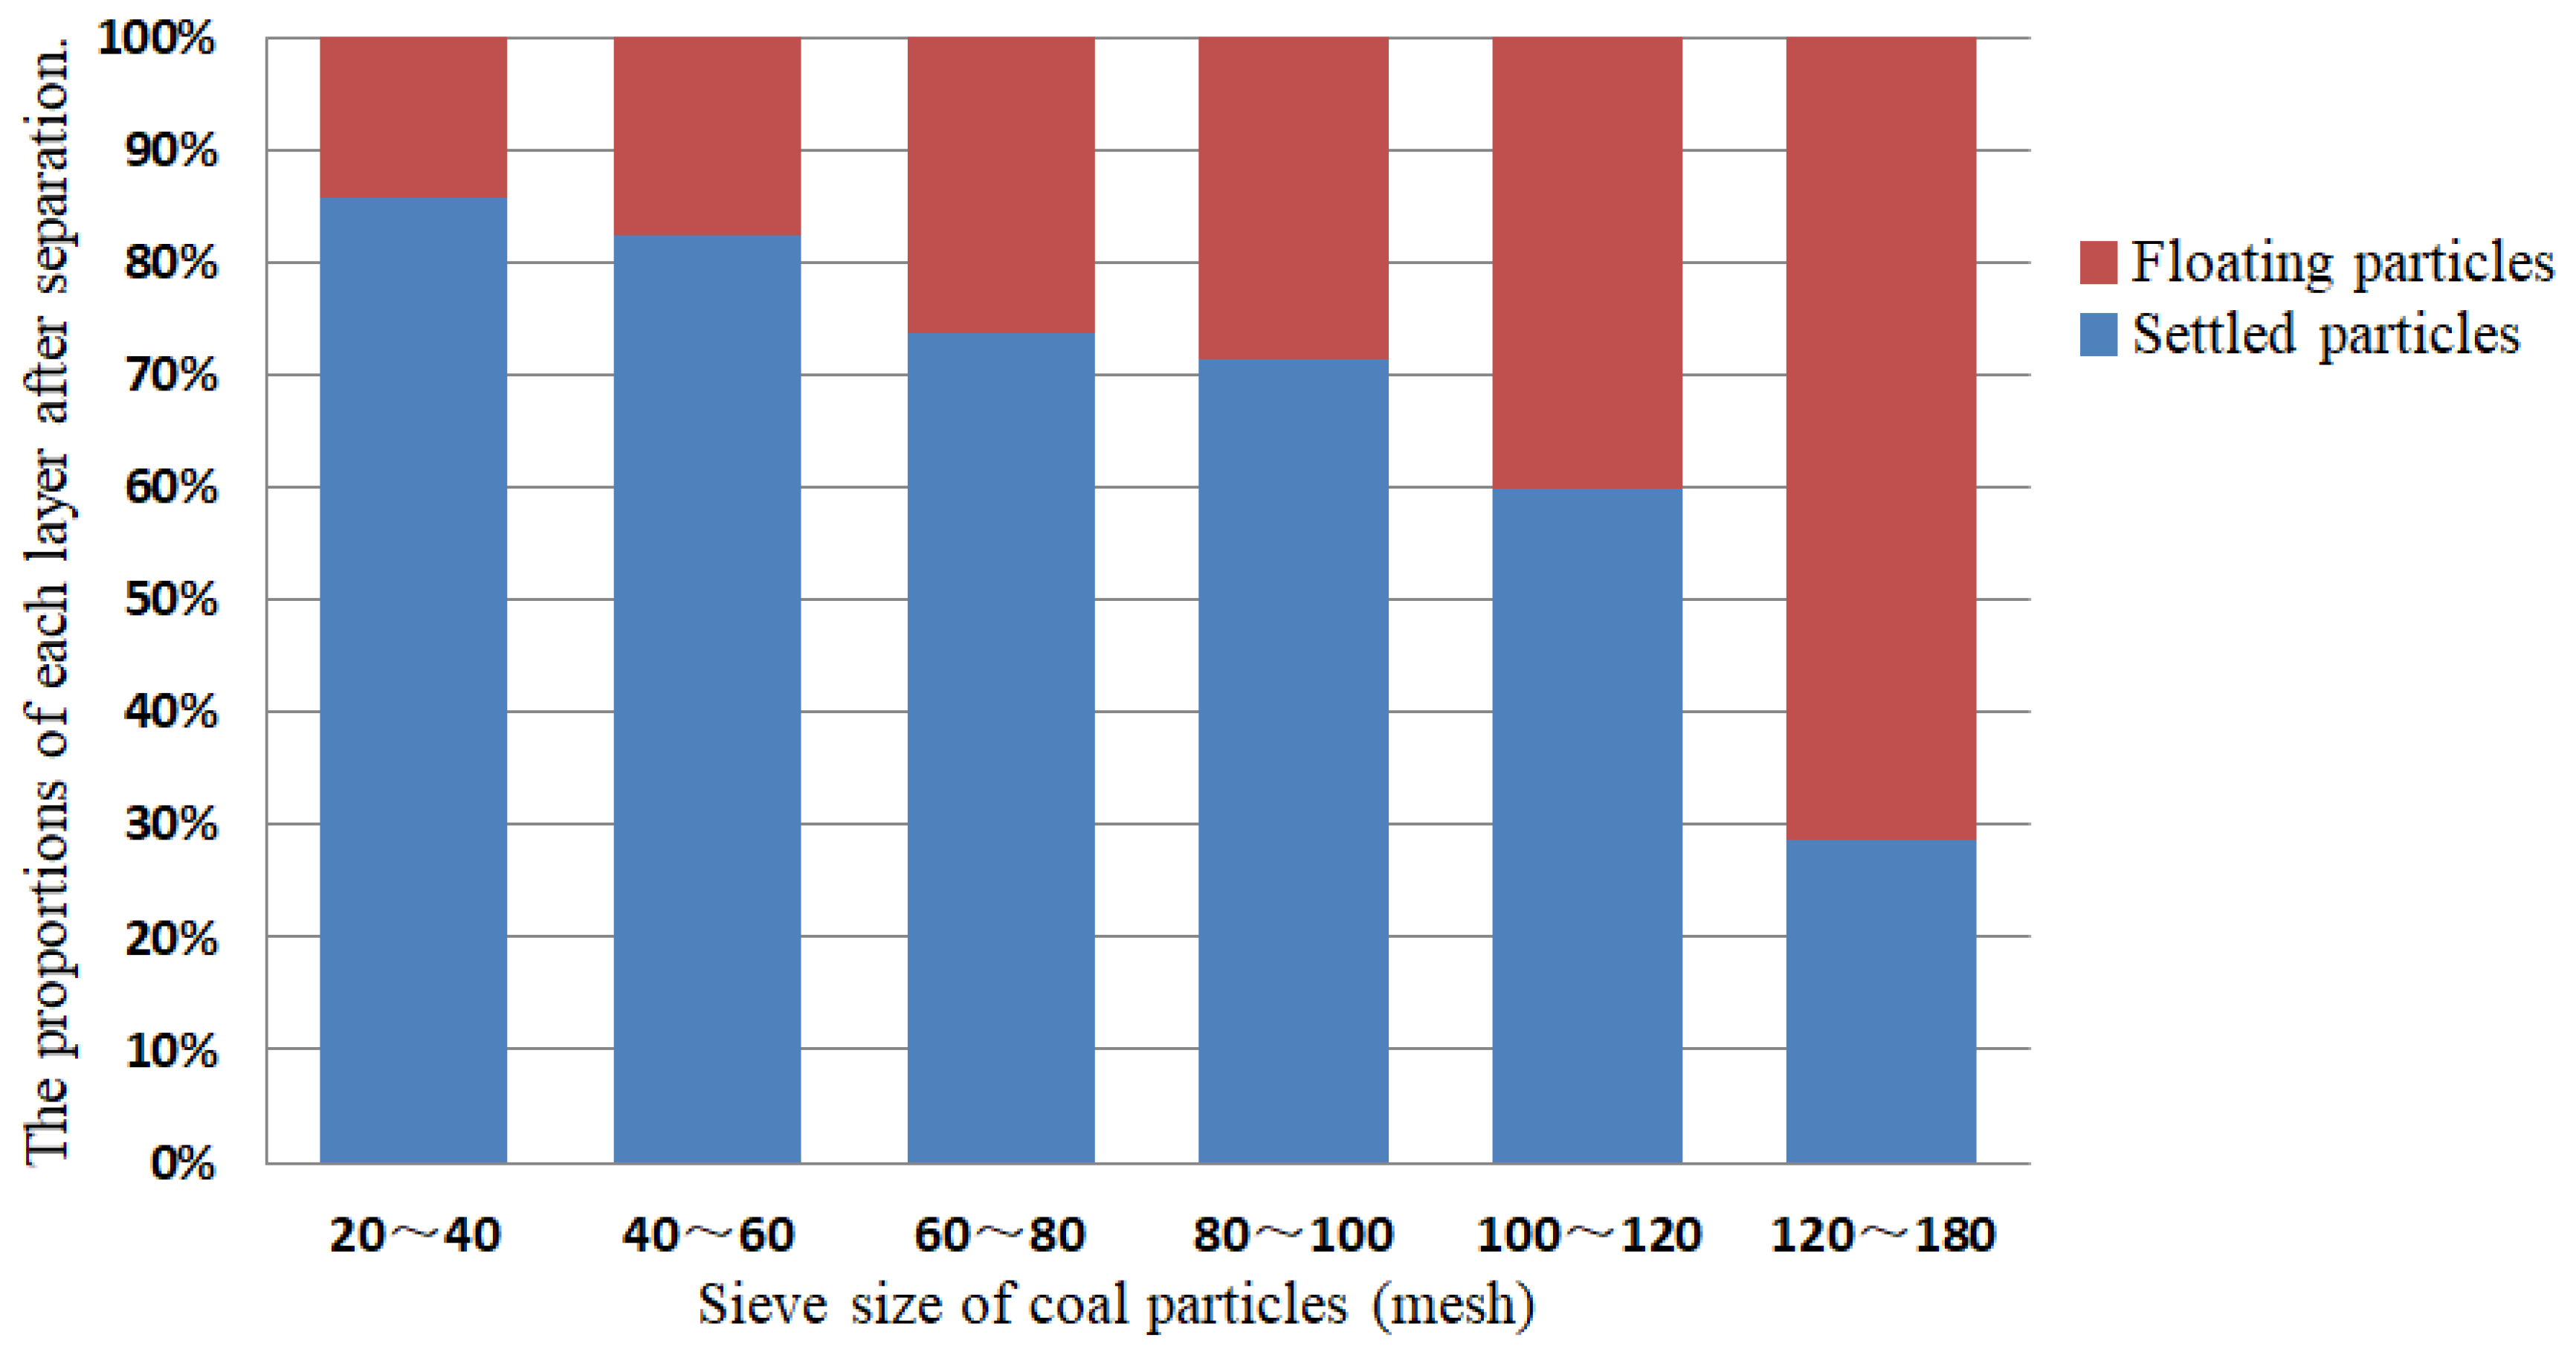
The experimental results were analyzed, and the layering data of coal particles with different mesh sizes after standing for 24 h in the cylinder were obtained. Based on the layering situation, relevant data were extracted, organized, and listed in Table 2. Based on the data from Table 2, the layered experimental data analysis graph shown in Figure 3 was created to visually present the layering characteristics of the coal particles.
The experimental results show a distinct layering phenomenon in coal particles after a period of settling, with the degree of layering varying according to particle size. Generally, coal particles with larger sizes have a higher proportion of settled particles, while smaller particles tend to have a greater proportion of floating particles, making the layering effect more pronounced. This suggests that coal particles exhibit significant physical property differences, particularly in terms of density, under the same particle size conditions.
Coal particles are composed of complex and heterogeneous components. The density of inorganic minerals in coal typically ranges from 2.5 to 2.7 g/cm3, while the density of organic matter usually does not exceed 1.5 g/cm3, often falling below 1.2 g/cm3. Consequently, coal particles with a higher content of inorganic minerals tend to have a higher density and settle under the influence of gravity. Additionally, the hydrophilicity of the coal particle surface plays a crucial role in its layering behavior. When the surface is highly hydrophilic, water can completely wet the particles, leading to their settlement. On the other hand, if the surface is hydrophobic or weakly hydrophobic, surface tension causes the coal particles to float. These findings offer valuable insights for further studies on the migration behavior of coal particles in the wellbore.

3. Critical Velocity Experiment of Coal Particles

This experiment was designed to simulate the transport behavior and rolling characteristics of coal fines in the near-wellbore section under gas–liquid two-phase flow conditions. The goal was to observe the critical onset of particle rolling for coal fines of various sizes within the pipeline and to provide empirical validation for the theoretical model. Fluid injection was carried out using a pump and a compressed air tank. Although this setup differs from the negative-pressure drainage conditions typically seen in coalbed methane (CBM) field operations, it allows for the precise regulation of gas and liquid flow rates under controlled laboratory conditions, enabling systematic observation and parameter measurement. It should be noted that this study primarily focuses on the flow behavior of fluids once they enter the pipeline, and the differences between positive-pressure injection and field-scale negative-pressure formation flow are intentionally disregarded.

3.1. Experimental Setup and Procedure

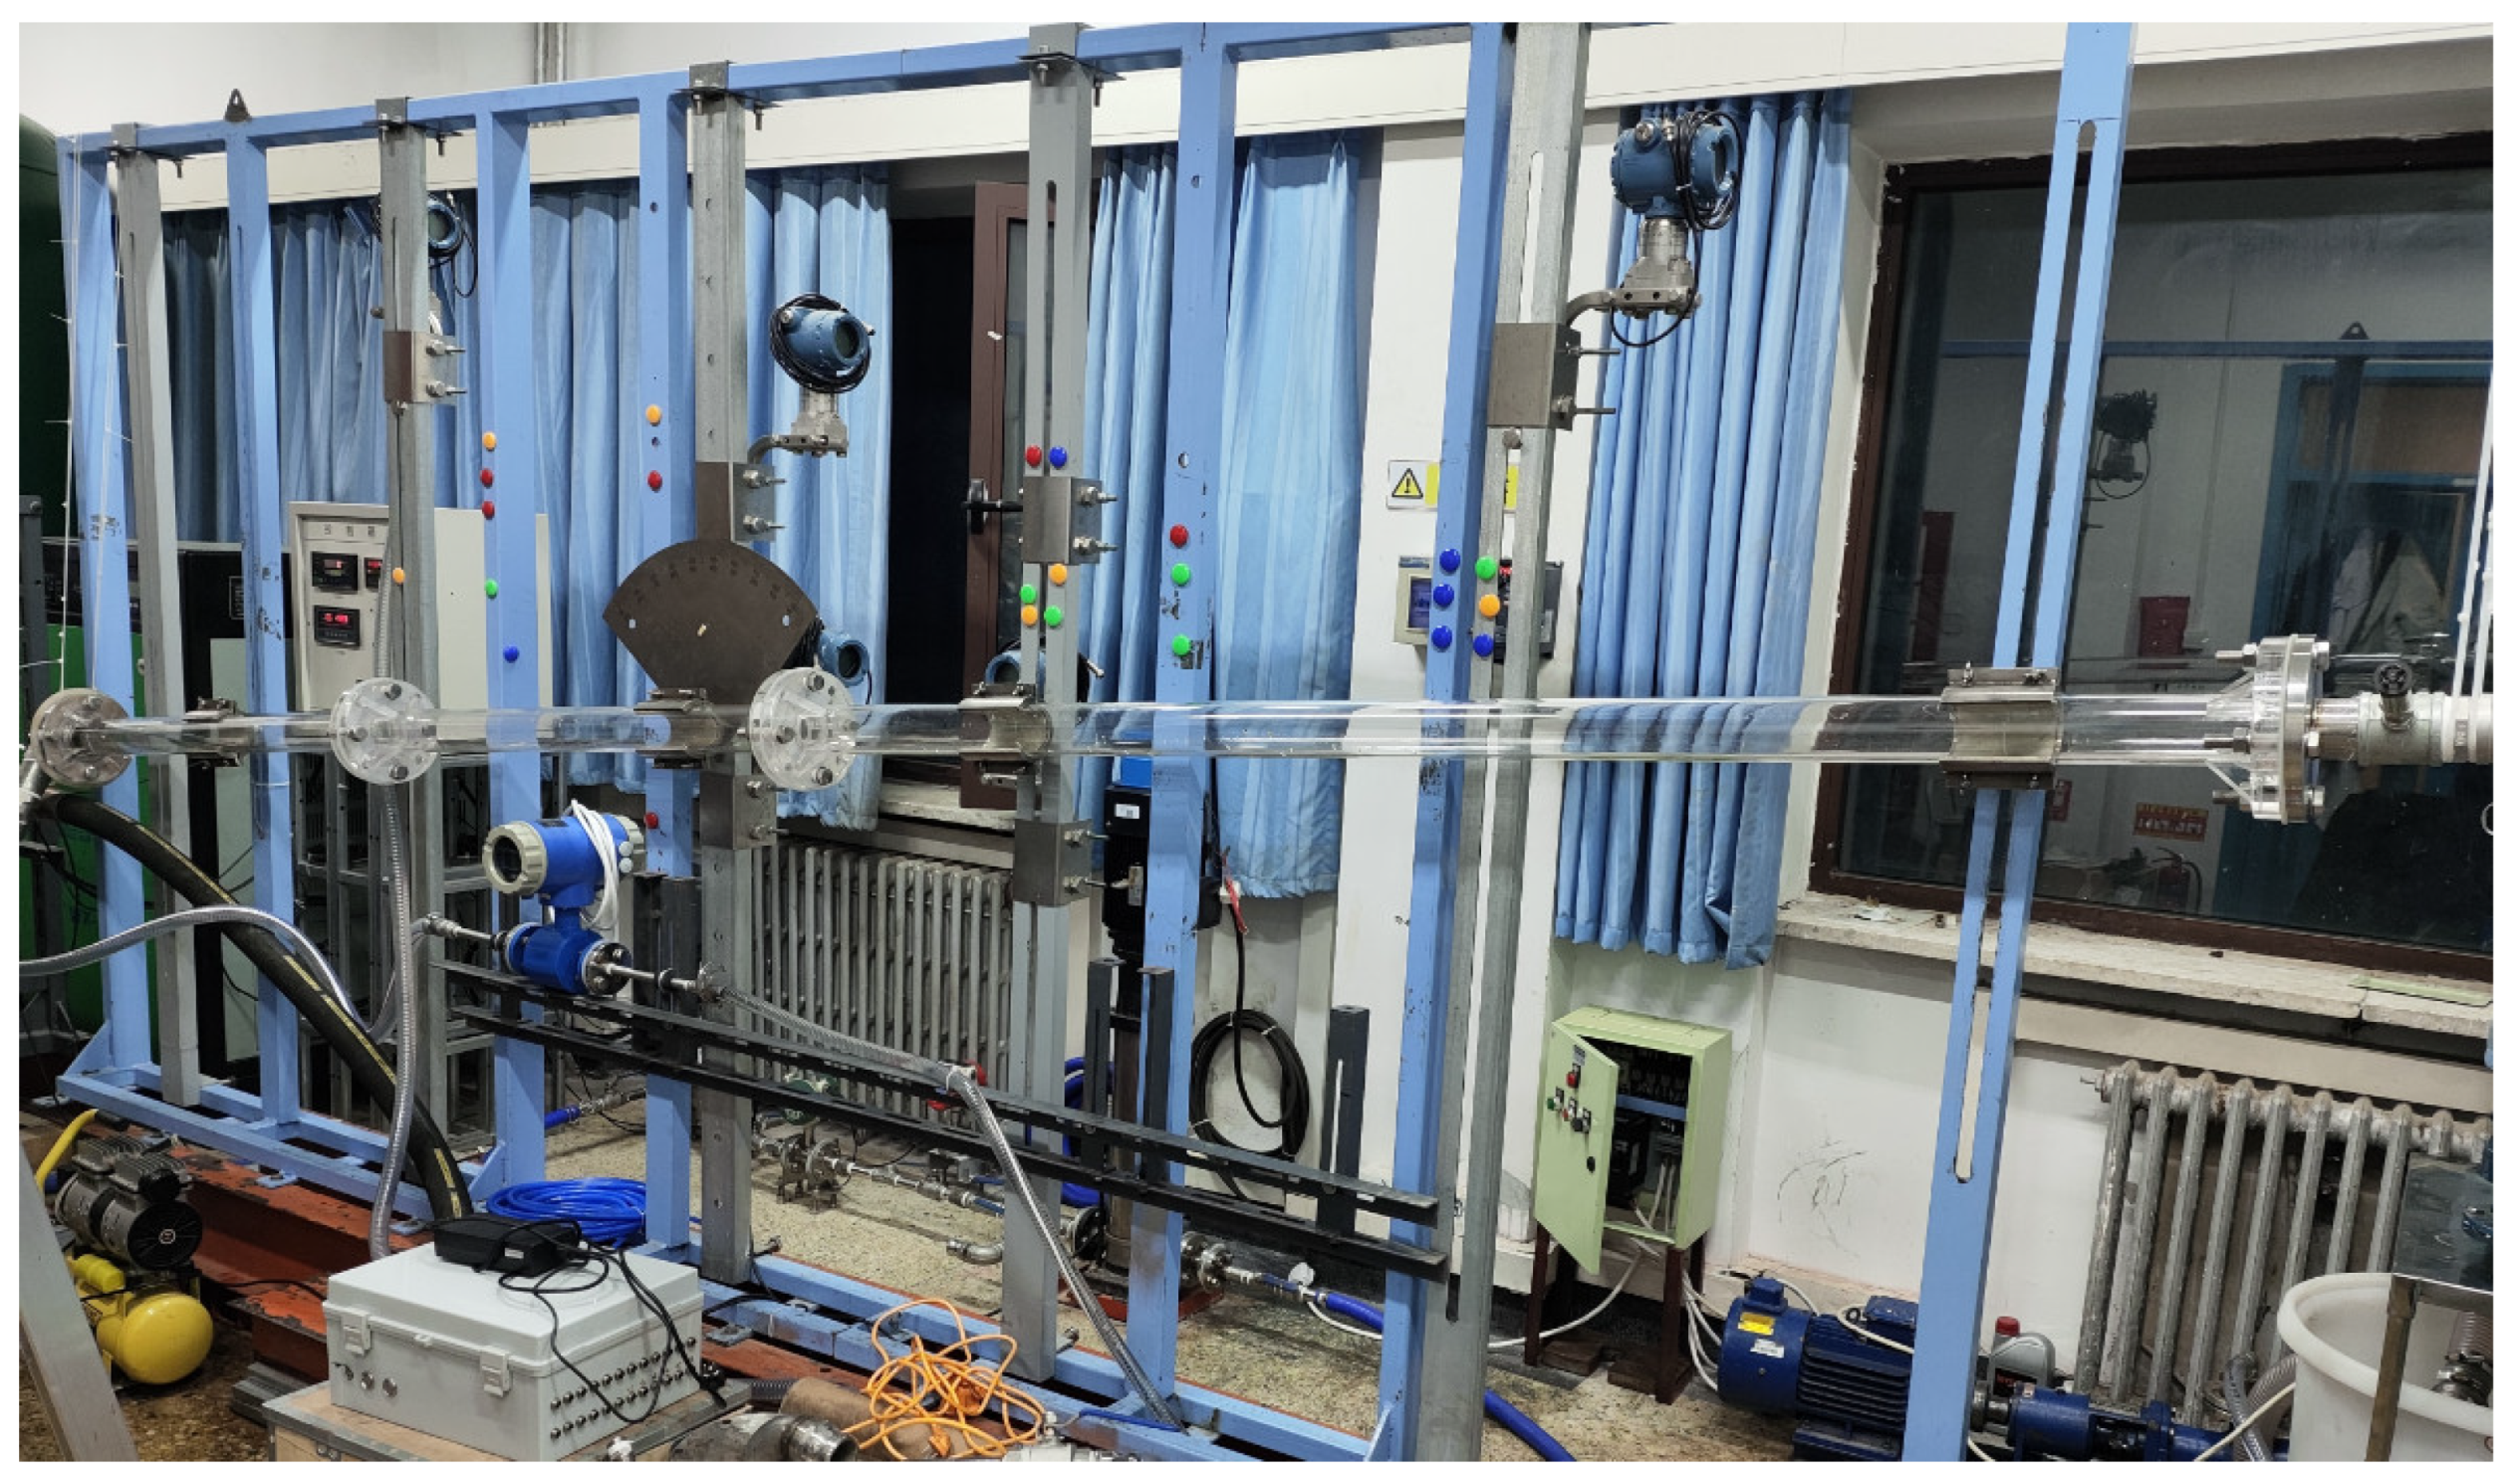
The experimental setup for the critical velocity experiment of coal particles consists of three main systems: a fluid supply and metering system, a wellbore simulation system, and a data acquisition and processing system. The fluid supply and metering system includes a water storage tank, screw pump, and check valve. The wellbore simulation system is composed of an organic glass pipe with an inner diameter of 64 mm and an outer diameter of 74 mm. The data acquisition and processing system features an electromagnetic flowmeter, turbine flowmeter, pressure gauge, and high-speed imaging system. The experimental setup flowchart and wellbore simulation system are shown in Figure 4 and Figure 5.
Experimental procedure:
(1)
Add the test coal particles into a beaker, mix thoroughly with clean water, let it settle, remove floating coal particles and impurities, and filter out the settleable coal particles.
(2)
Connect the experimental setup, adjust the pipeline inclination according to the test parameters, and check the system for airtightness.
(3)
Soak coal particles of a specific mesh size for 24 h; then, lay a coalbed at the bottom of the wellbore.
(4)
Open the water flow control valve, gradually increase the wellbore flow velocity, observe and record experimental phenomena, and determine the initiation and transport velocities of coal particles under the given wellbore inclination.
(5)
Replace coal particles with different mesh sizes and repeat steps (3)–(4) to obtain the transport characteristics of coal particles of various sizes.

3.2. Experimental Results and Analysis

The experimental results indicate that, regardless of wellbore inclination, gas–liquid flow rates, or coal particle sizes, the transport of coal particles is primarily governed by the liquid phase. The movement velocity and trajectory of coal particles show minimal correlation with the gas phase. Furthermore, the gas–liquid flow pattern within the wellbore remains stable and unaffected by coal particles, regardless of particle size and concentration. This suggests that the overall flow regime is mainly controlled by gas–liquid flow characteristics, while coal particles are predominantly transported by the liquid phase, without significantly altering the gas–liquid flow pattern.
In the inclined wellbore experiments, four distinct flow regimes—slug flow, transitional flow, plug flow, and intermittent flow—were observed based on the geometric characteristics of the two phases within the pipe. These flow patterns were identified through direct visual observation, supplemented by photographic analysis.
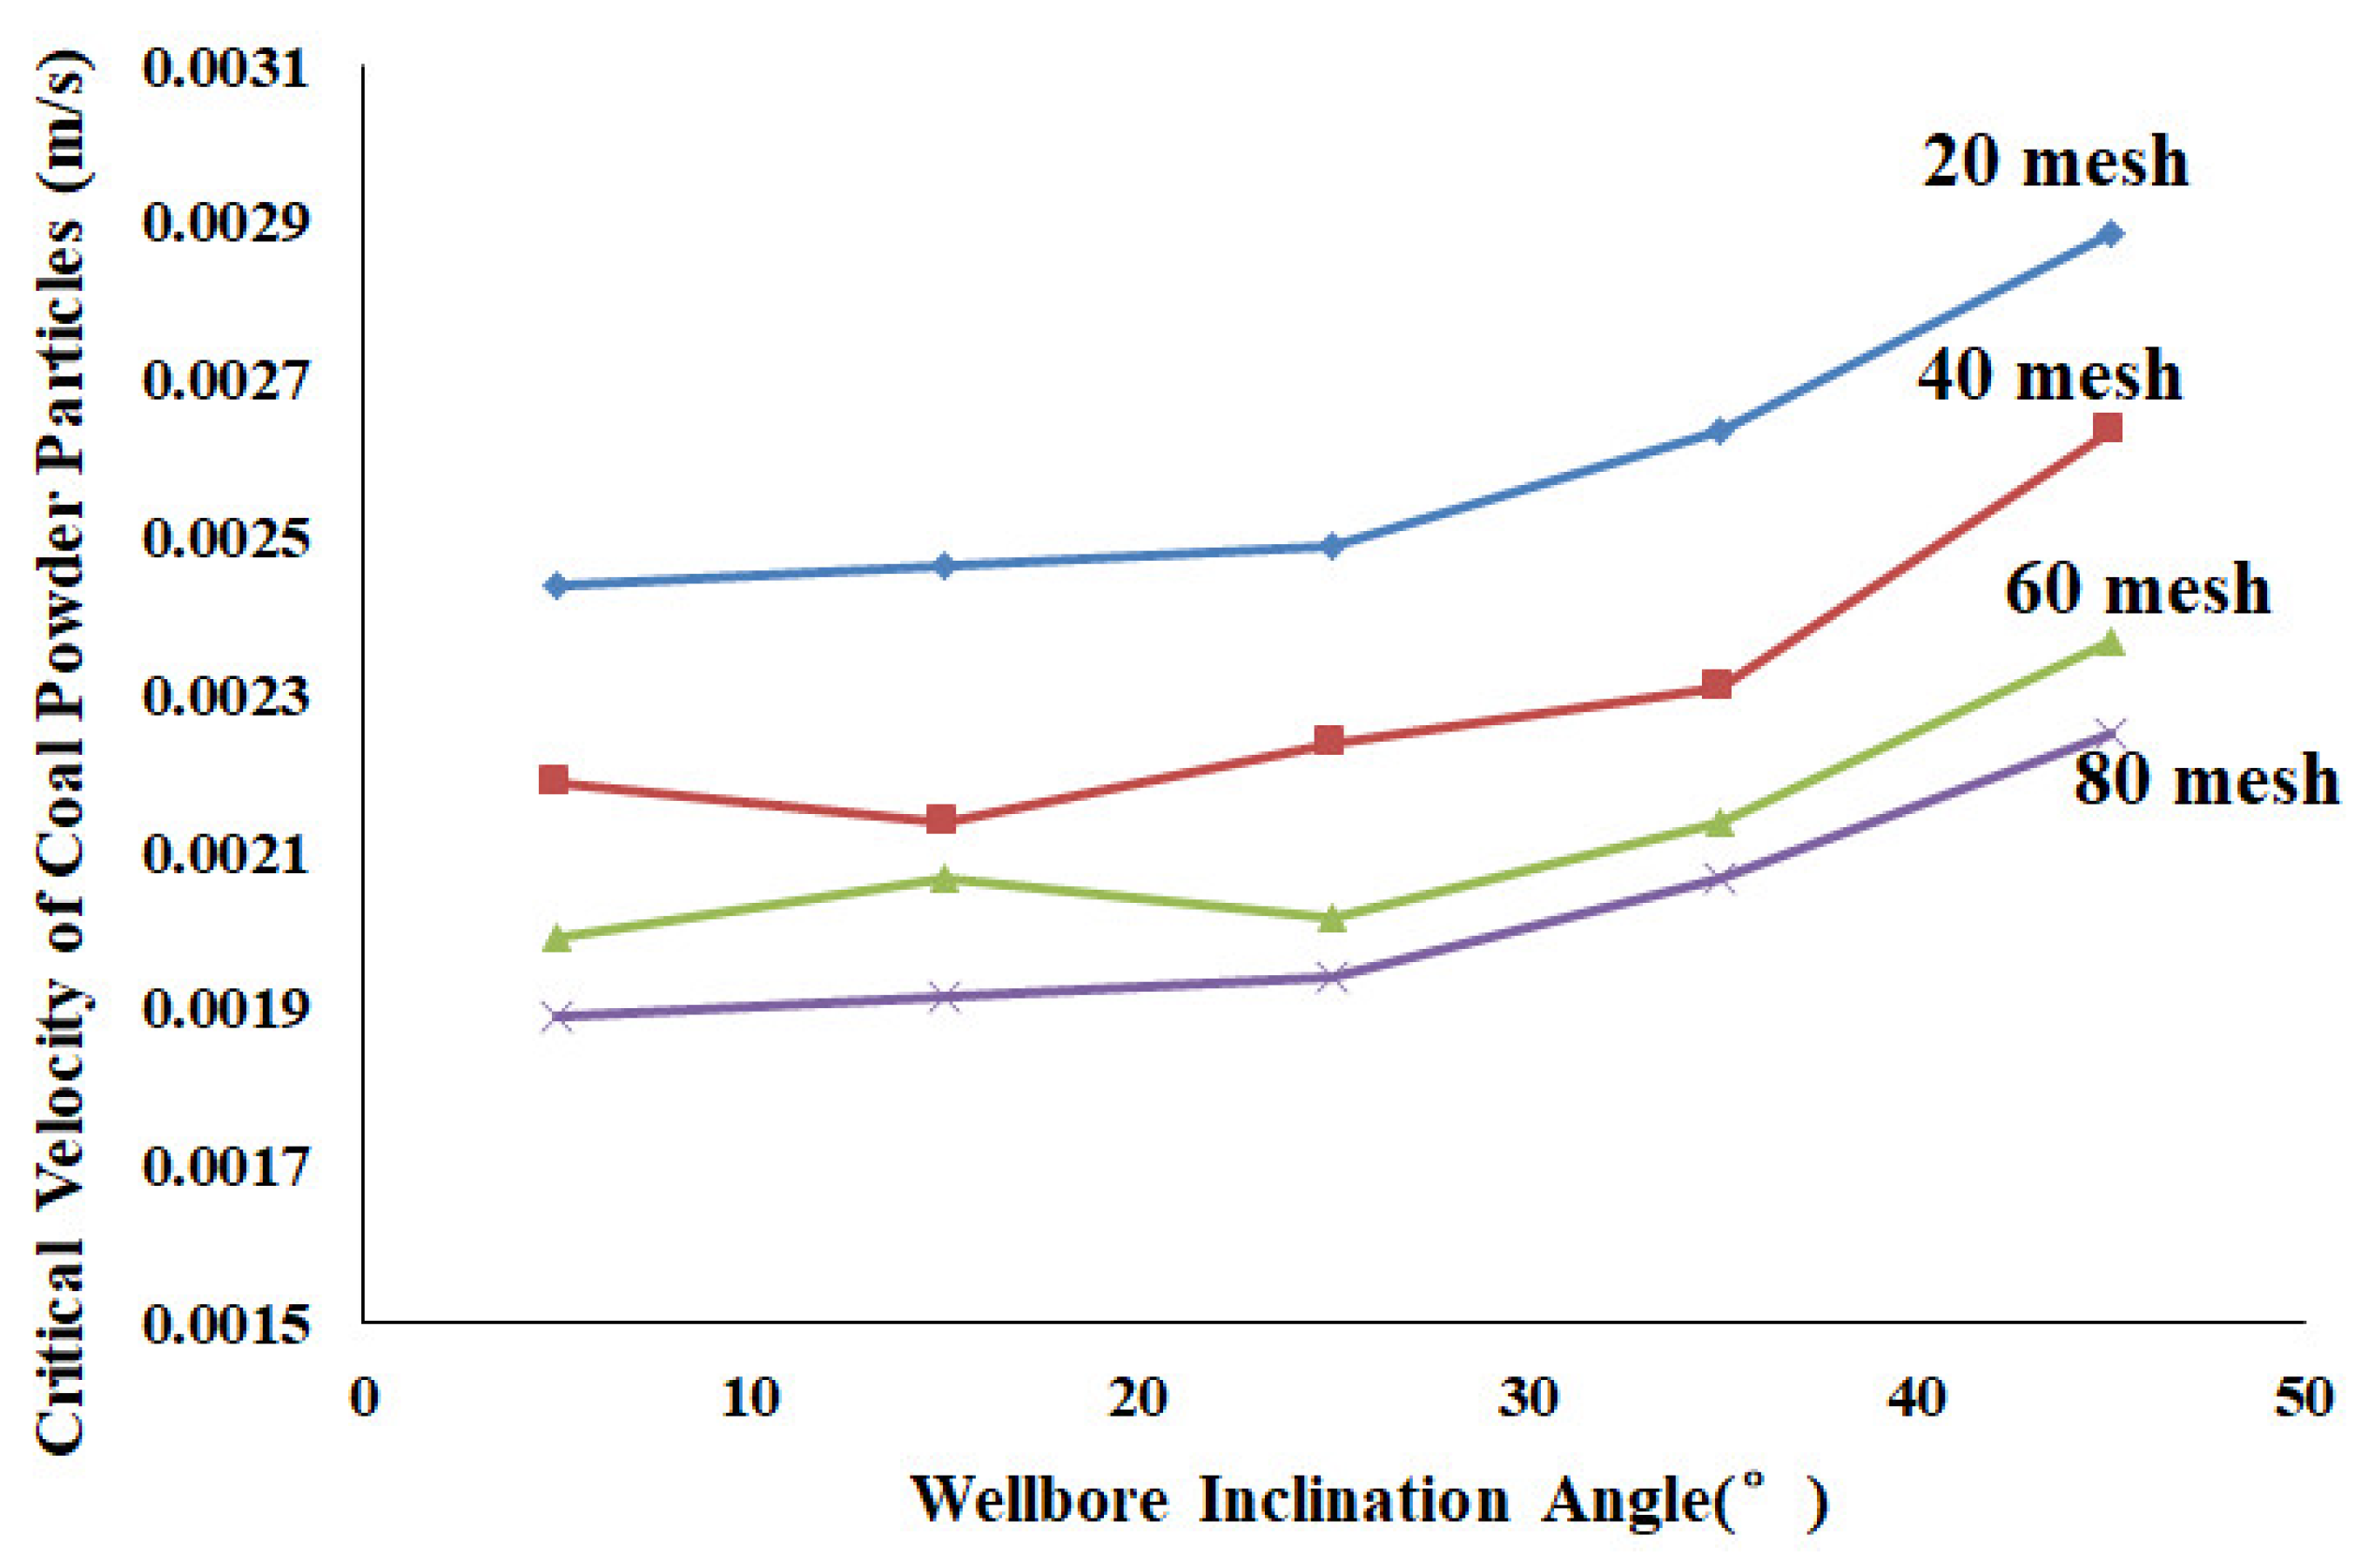
Table 3 and Figure 6 present the startup velocities of coal particles with different particle sizes under various wellbore angles. In these experiments, the wellbore angle was adjusted, and the particle size of the coal fines was controlled to collect data on the startup velocity under different operating conditions. The experimental results indicate that, for the same wellbore angle, larger coal particles require higher startup velocities. This can be attributed to the greater inertia of larger particles, which necessitates a higher gas velocity to overcome their stationary state and initiate movement. Furthermore, the surface roughness and morphological characteristics of the larger particles may also influence their interaction with the gas flow, thereby affecting their startup velocity.
Figure 7 shows the critical velocity of coal particles at different wellbore angles. The experimental results indicate that for the same particle size, the critical velocity of coal particles increases with an increase in wellbore inclination angle. When the wellbore angle is small, the effect of angle change on the critical velocity is minimal; however, as the angle increases, the impact on critical velocity becomes more significant.

4. Critical Velocity Model Correction

Mathematical modeling holds significant value in petroleum engineering, as it helps reveal the physical mechanisms underlying complex processes while providing theoretical support and predictive tools for the efficient development of oil and gas resources. For example, mathematical modeling can be employed to reveal the sand production mechanisms in ultradeep high-pressure gas reservoirs and alternating injection-production gas storage reservoirs, and elucidate the dynamics of particle transport during the production process [27,28]. In areas such as multiphase flow, reservoir numerical simulation, and wellbore dynamics analysis, mathematical models have become indispensable technical tools. Based on this, this paper will employ mathematical modeling methods to refine the coal powder critical startup model.
As the wellbore flow rate gradually increases to 0.007 m3/s, coal particles at the bottom of the wellbore begin to bounce but do not move in the direction of the fluid flow. When the flow rate reaches 0.0082 m3/s, the coal particles start rolling and move forward with the fluid, although the coalbed remains stationary. Once the flow rate reaches 0.014 m3/s, the coalbed begins to move, and a significant number of coal particles begin migrating forward. As the flow rate increases further to 0.028 m3/s, the coal particles are completely discharged. The critical velocity of coal particles corresponds to the velocity at which they begin to move. As the fluid velocity increases, coal particles undergo successive stages of bouncing, rolling, and floating. During the bouncing stage, the coal particles do not move forward, so the critical velocity should be considered the velocity at the rolling stage.

4.1. Critical Velocity Derivation

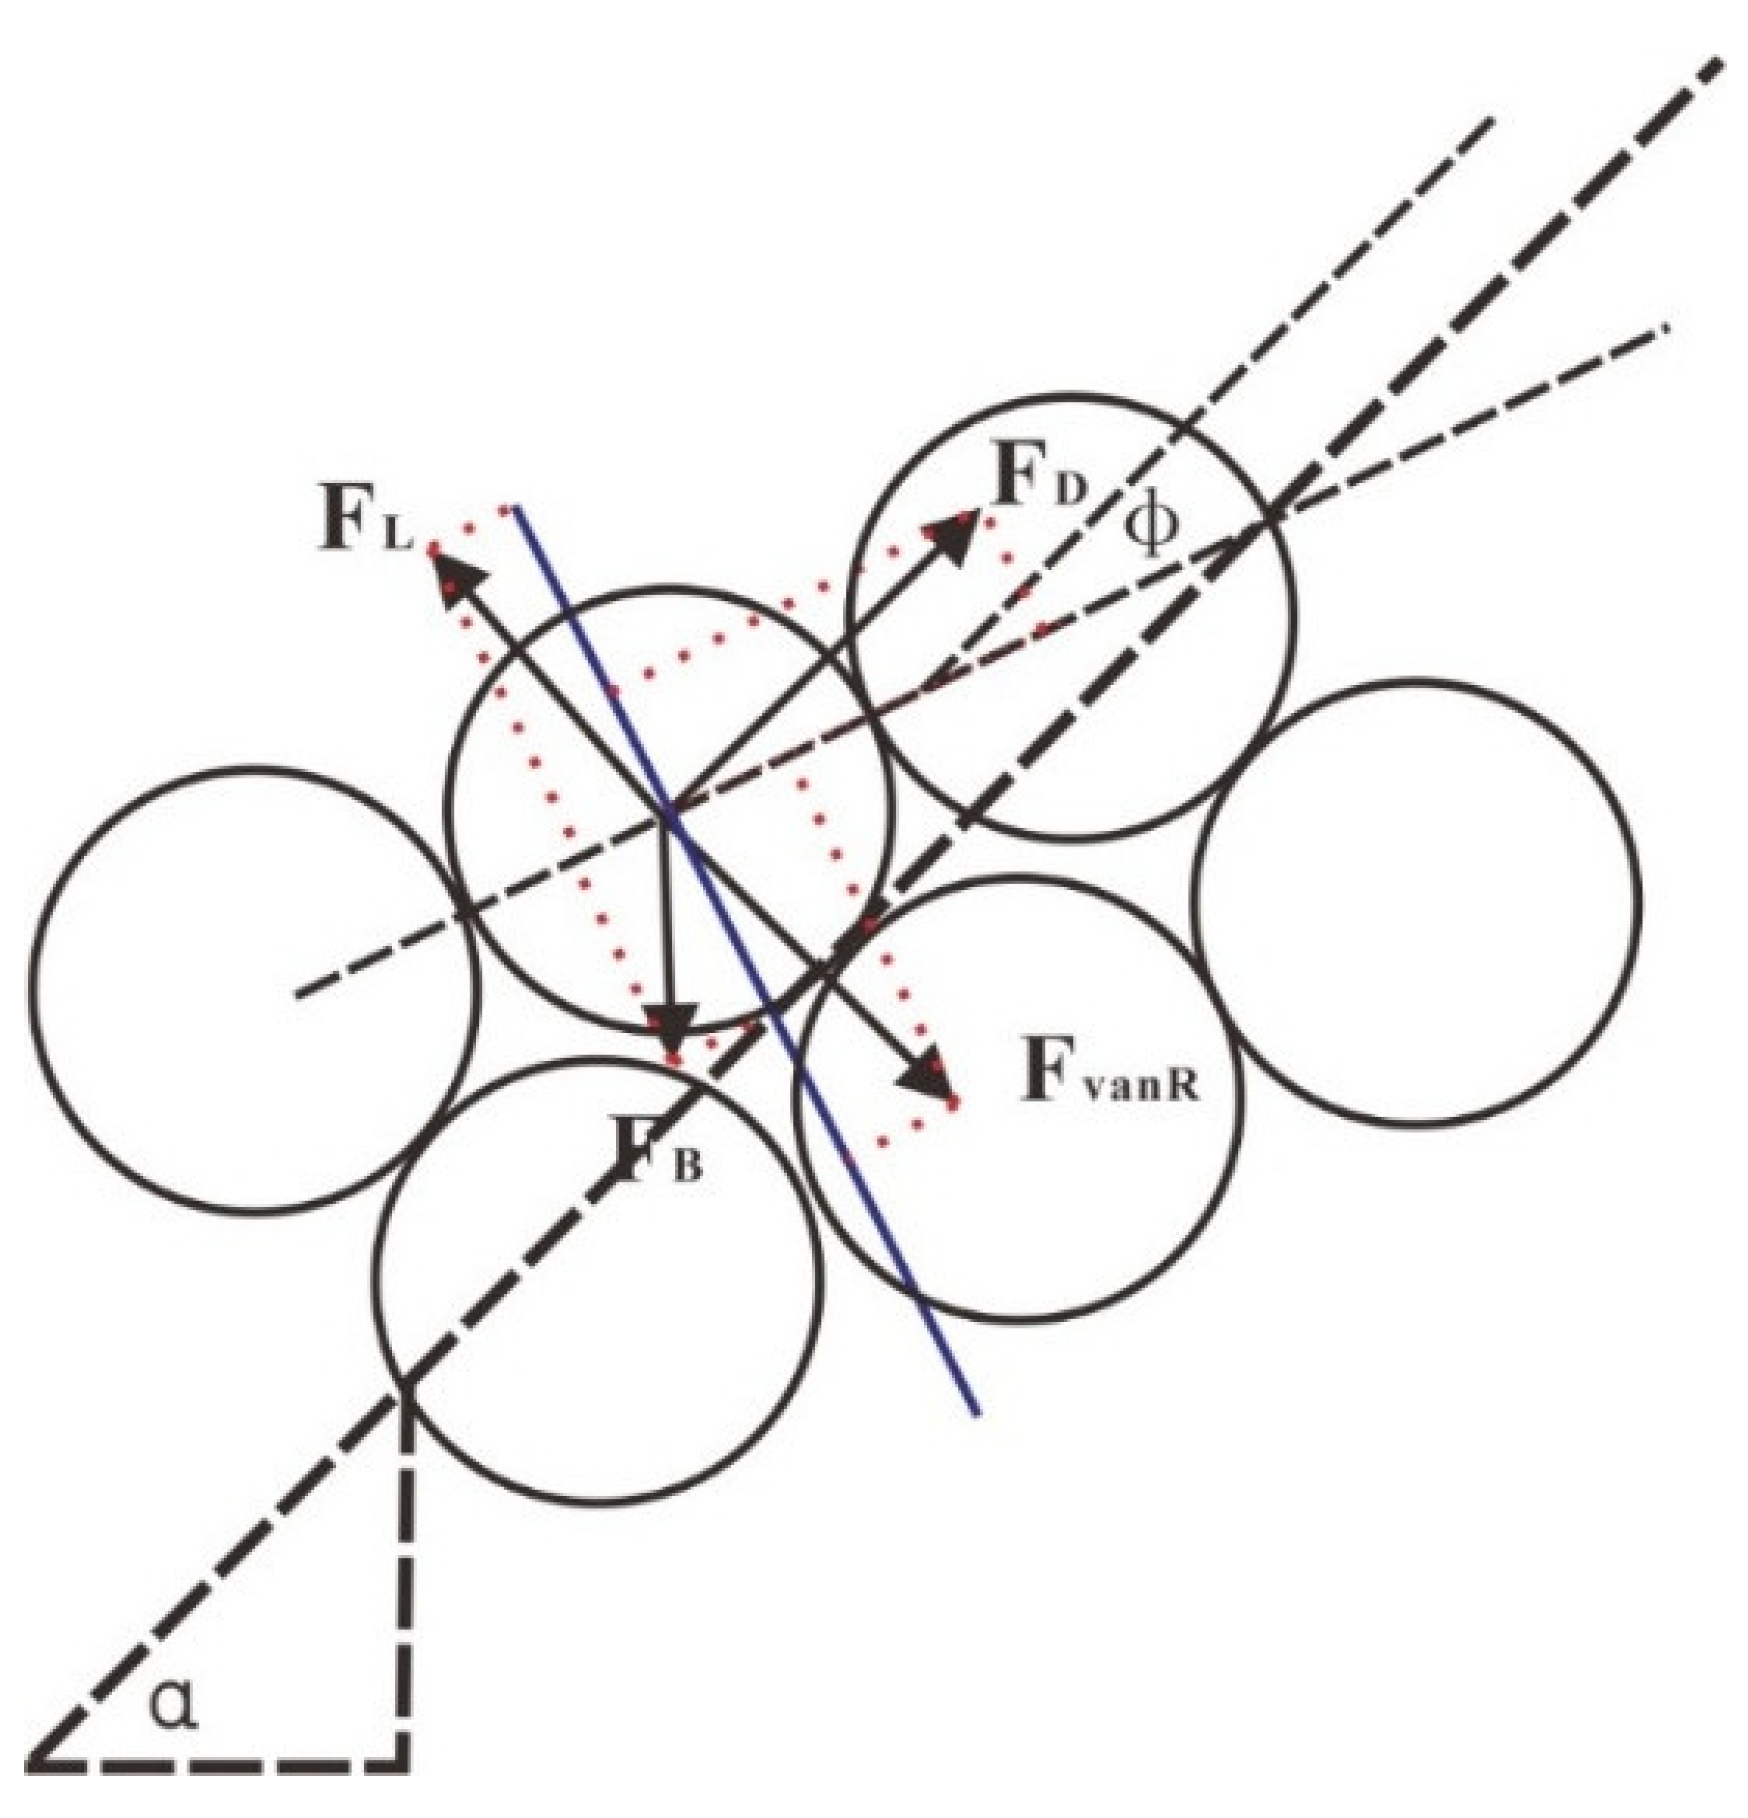
To reduce the complexity of model solving, this study conducts a force analysis on idealized spherical particles and assumes that the particles are relatively uniform in density and composition. As shown in Figure 8, the forces acting on coalbed particles include buoyant weight (the difference between gravity and buoyancy), drag force, lift force, and van der Waals force.
① Buoyant weight (FB)
The buoyant weight of coal particles is the difference between the gravitational force and the buoyant force acting on the particles, which can be expressed as follows:
F B = π d 3 6 ( ρ s ρ f ) g
where d is the particle diameter, ρs is the particle density, and ρf is the fluid density.
② Drag force (FD)
F D = 1 2 C D ρ f v 2 A
where CD is the drag coefficient, v is the fluid velocity, and A is the projected area of the particle.
③ Lift force (FL)
F L = 1 2 C L ρ f v 2 A
where CL is the lift coefficient.
④ van der Waals force (FvanR)
When the distance between coal particles is smaller than the particle diameter, the van der Waals force is
F v a n = A H d 24 s 2
According to the particle arrangement pattern, it can be inferred that
F v a n R = 6 F v a n sin ϕ
where s = 1.78 × 10 5 d 0.77 , A H = 4.14 × 10 20 N m , ϕ is the repose angle of the particles.
Assuming that the coal particles undergo rolling migration around the particle connection point P, the moment acting on the coal particles is greater than or equal to the static moment:
F D sin ϕ d 2 + F L cos ϕ d 2 F B cos ( α ϕ ) d 2 + F v a n R cos ϕ d 2
Substituting the expressions for the different forces, we obtain
v 2 d 3 ( ρ s ρ f ) g cos ( α ϕ ) + A H 4 π d s 2 sin 2 ϕ ρ f ( C D sin ϕ + C L cos ϕ )

4.2. Calculation Procedure

According to experimental studies, under complex flow conditions, the introduction of the gas phase alters the in situ liquid velocity, which is the key to enabling the liquid phase to carry particles. The method for calculating the critical velocity required to initiate the motion of a single particle in liquid was discussed earlier. In practical applications, the model calculation steps are as follows: (1) based on the particle diameter, particle density, pipe inclination, and pipe diameter, the critical in situ liquid velocity vl1 required to initiate particle rolling is calculated using the modified single-particle model proposed in this paper; (2) according to parameters such as pressure, gas flow rate, gas density, gas viscosity, compressibility factor, liquid flow rate, liquid density, liquid viscosity, and pipe diameter, the in situ liquid velocity vl2 under current conditions is calculated using a multiphase flow model; (3) let vl1 = vl2, and the critical production rate under actual flow conditions in the corresponding well section can then be determined; (4) calculate the critical production rate for the entire wellbore, and take the maximum value as the critical production rate of the well.

4.3. Formula Correction Results

The detailed process of model modification is provided in the Appendix A.
Using MATLAB_R2022b programming, the specific values of the parameters to be fitted in the drag coefficient and lift coefficient are obtained as follows:
( c ( 1 ) , c ( 2 ) , c ( 3 ) , c ( 4 ) , c ( 5 ) , c ( 6 ) ) = [ 0 . 2 , 0 . 6 , 0 . 4 , 1600 , 1 . 1 , 36 ]
The fitted formula is
C D ( c ( 1 ) , c ( 2 ) , c ( 3 ) , c ( 4 ) , c ( 5 ) ) = 24 R e p ( 1 + 0.2 R e p 0.6 ) + 0.4 1 + 1600 R e p 1.1
and
C L ( c ( 6 ) ) = 36 Δ p μ R e p h p v p
The sum of squared residuals is 3.644895264409938 × 10⁻⁷.
From the value of the sum of squared residuals, it is relatively small. This indicates that the fitting result has a high correlation with the experimental data, meeting the required precision.
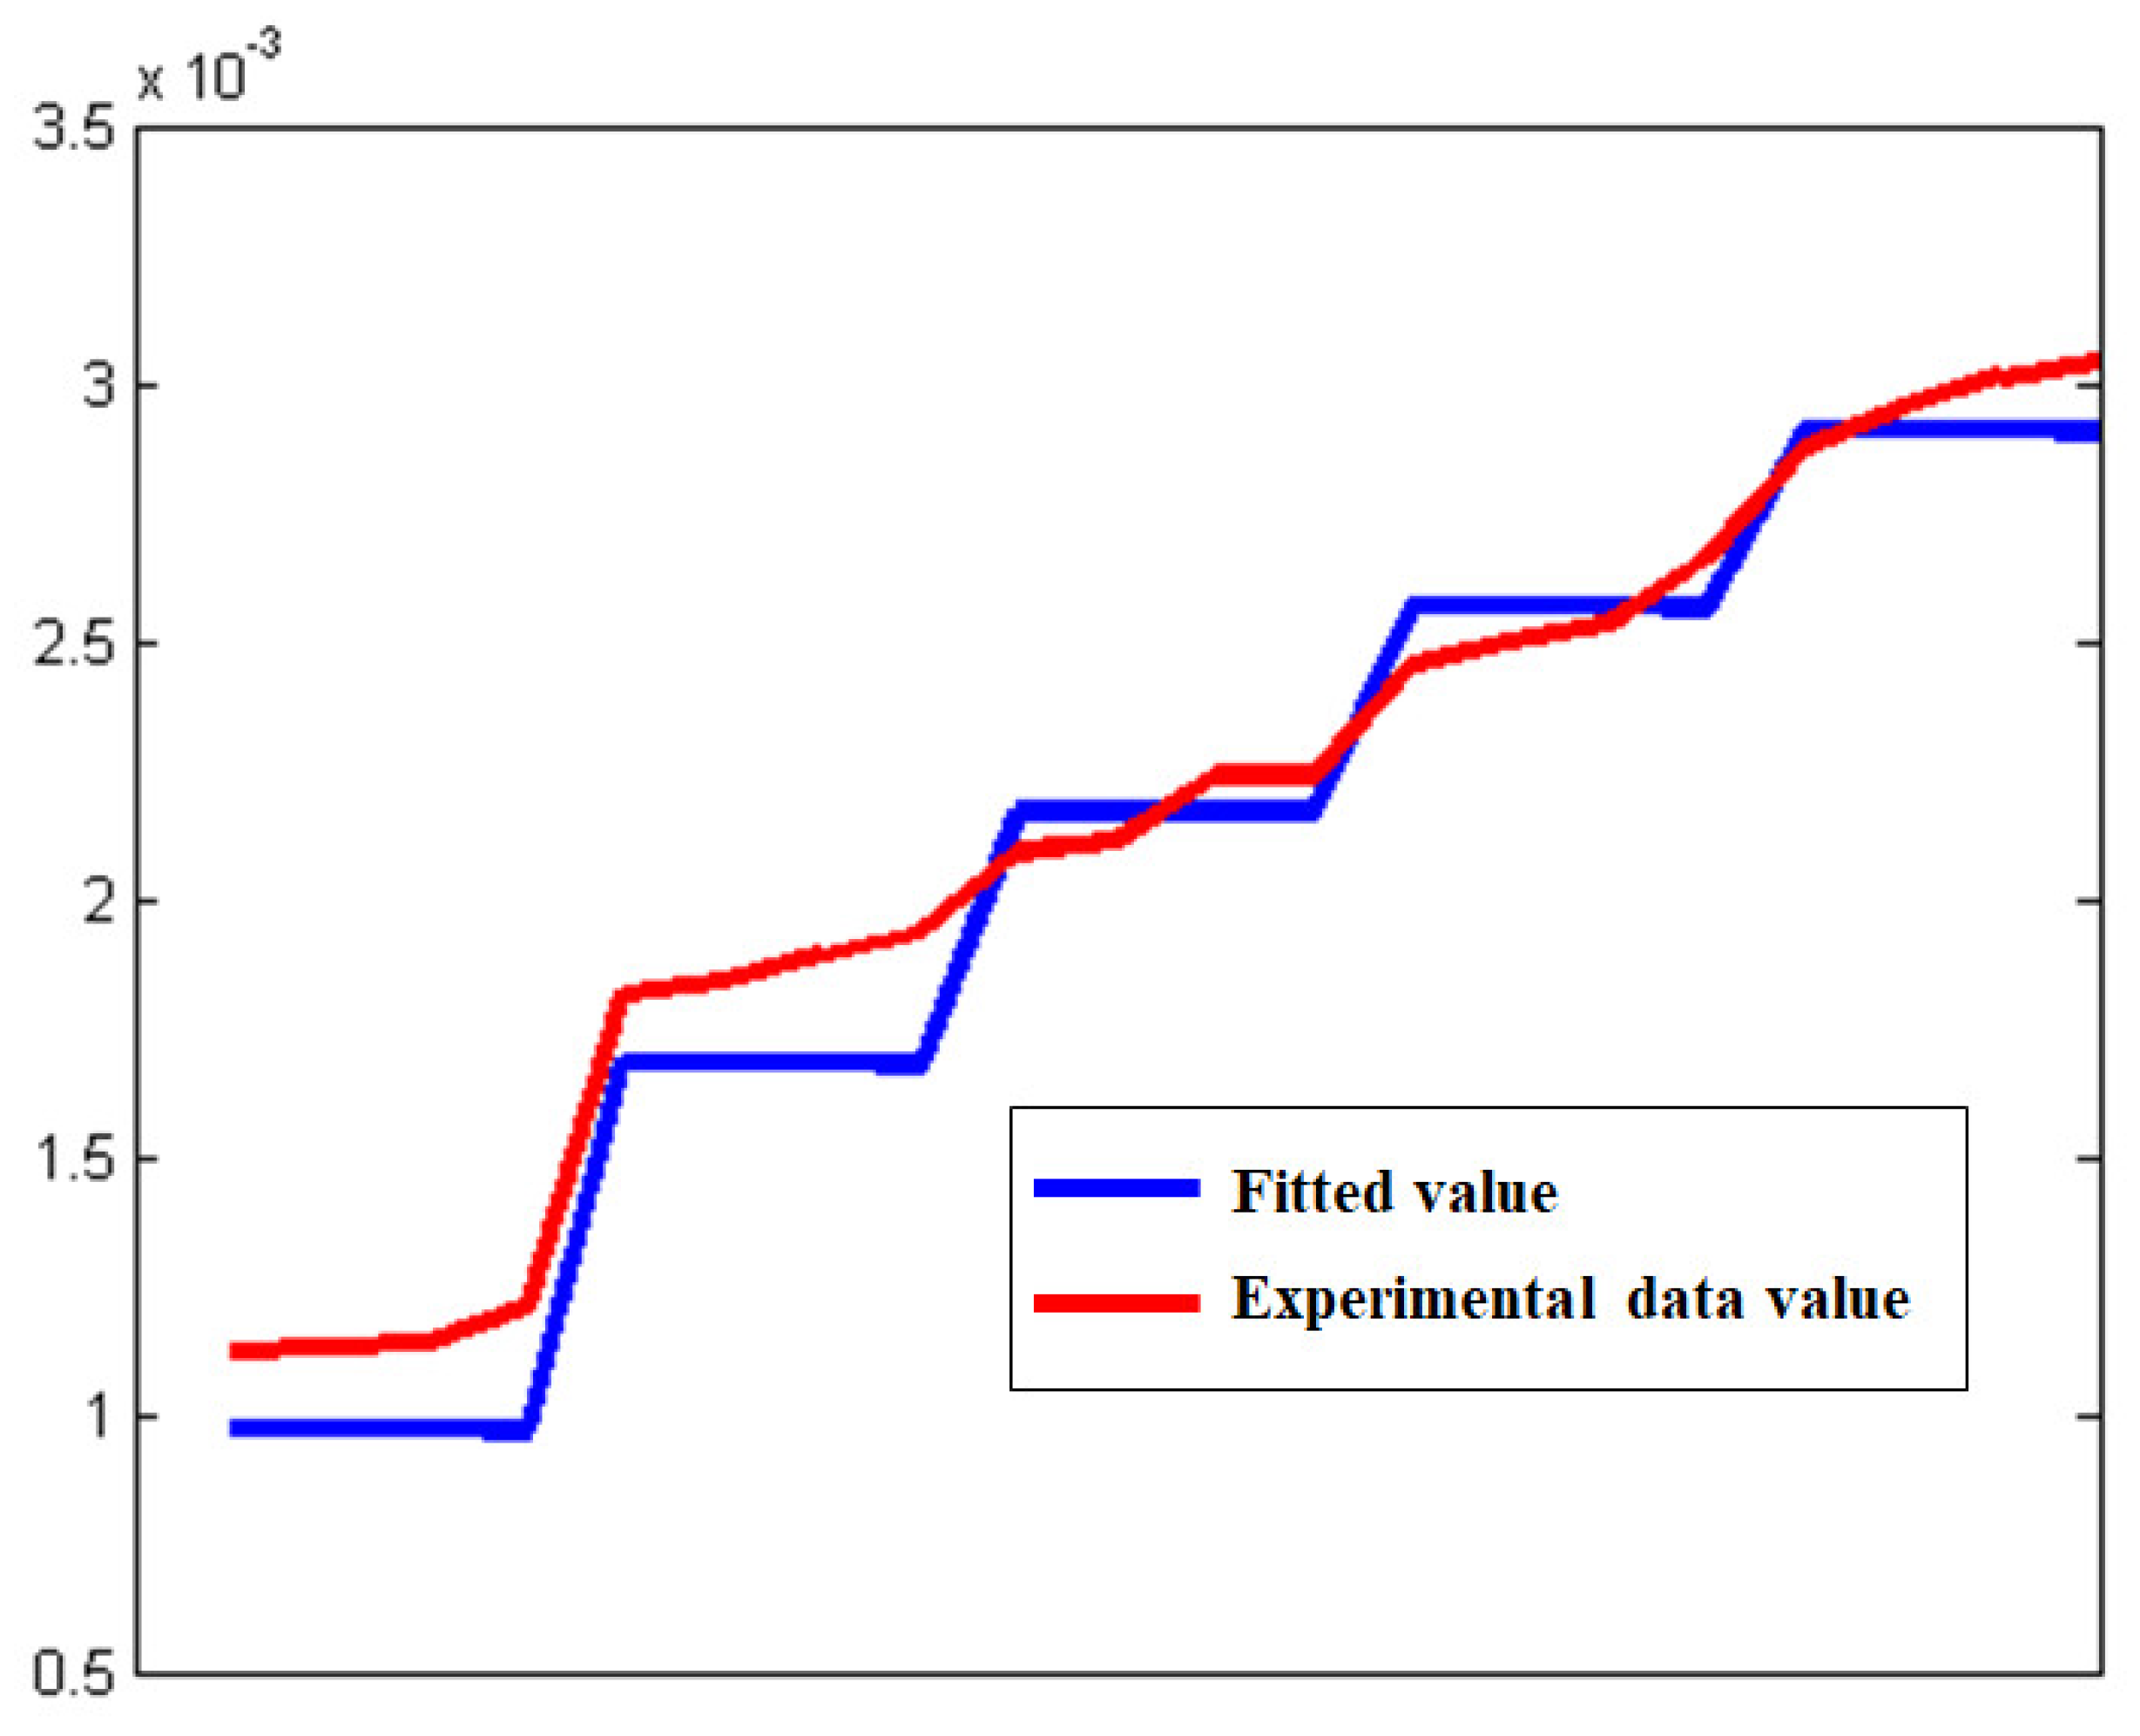
As shown in Figure 9, the correlation between the experimental data and the fitted values is strong, with an overall consistent trend. The fit is more accurate in the initial section, while the error slightly increases in the later section. For the same angle, the critical velocities of coal particles with different sizes exhibit noticeable fluctuations compared to the fitted values. This is primarily due to the formation of a cone-shaped area, caused by the influence of gravity on the small-sized coal particles in the inclined section of the wellbore. The particle velocity at the tip of the cone is difficult to accurately record, leading to fluctuations in the data. These recording deviations result in some data points being higher than expected, showing a downward trend. Although the fitted values capture the general trend of critical velocity changes for coal particles of different sizes, their variation range is narrower, making it challenging to capture the subtle fluctuations of the experimental data on the same scale.
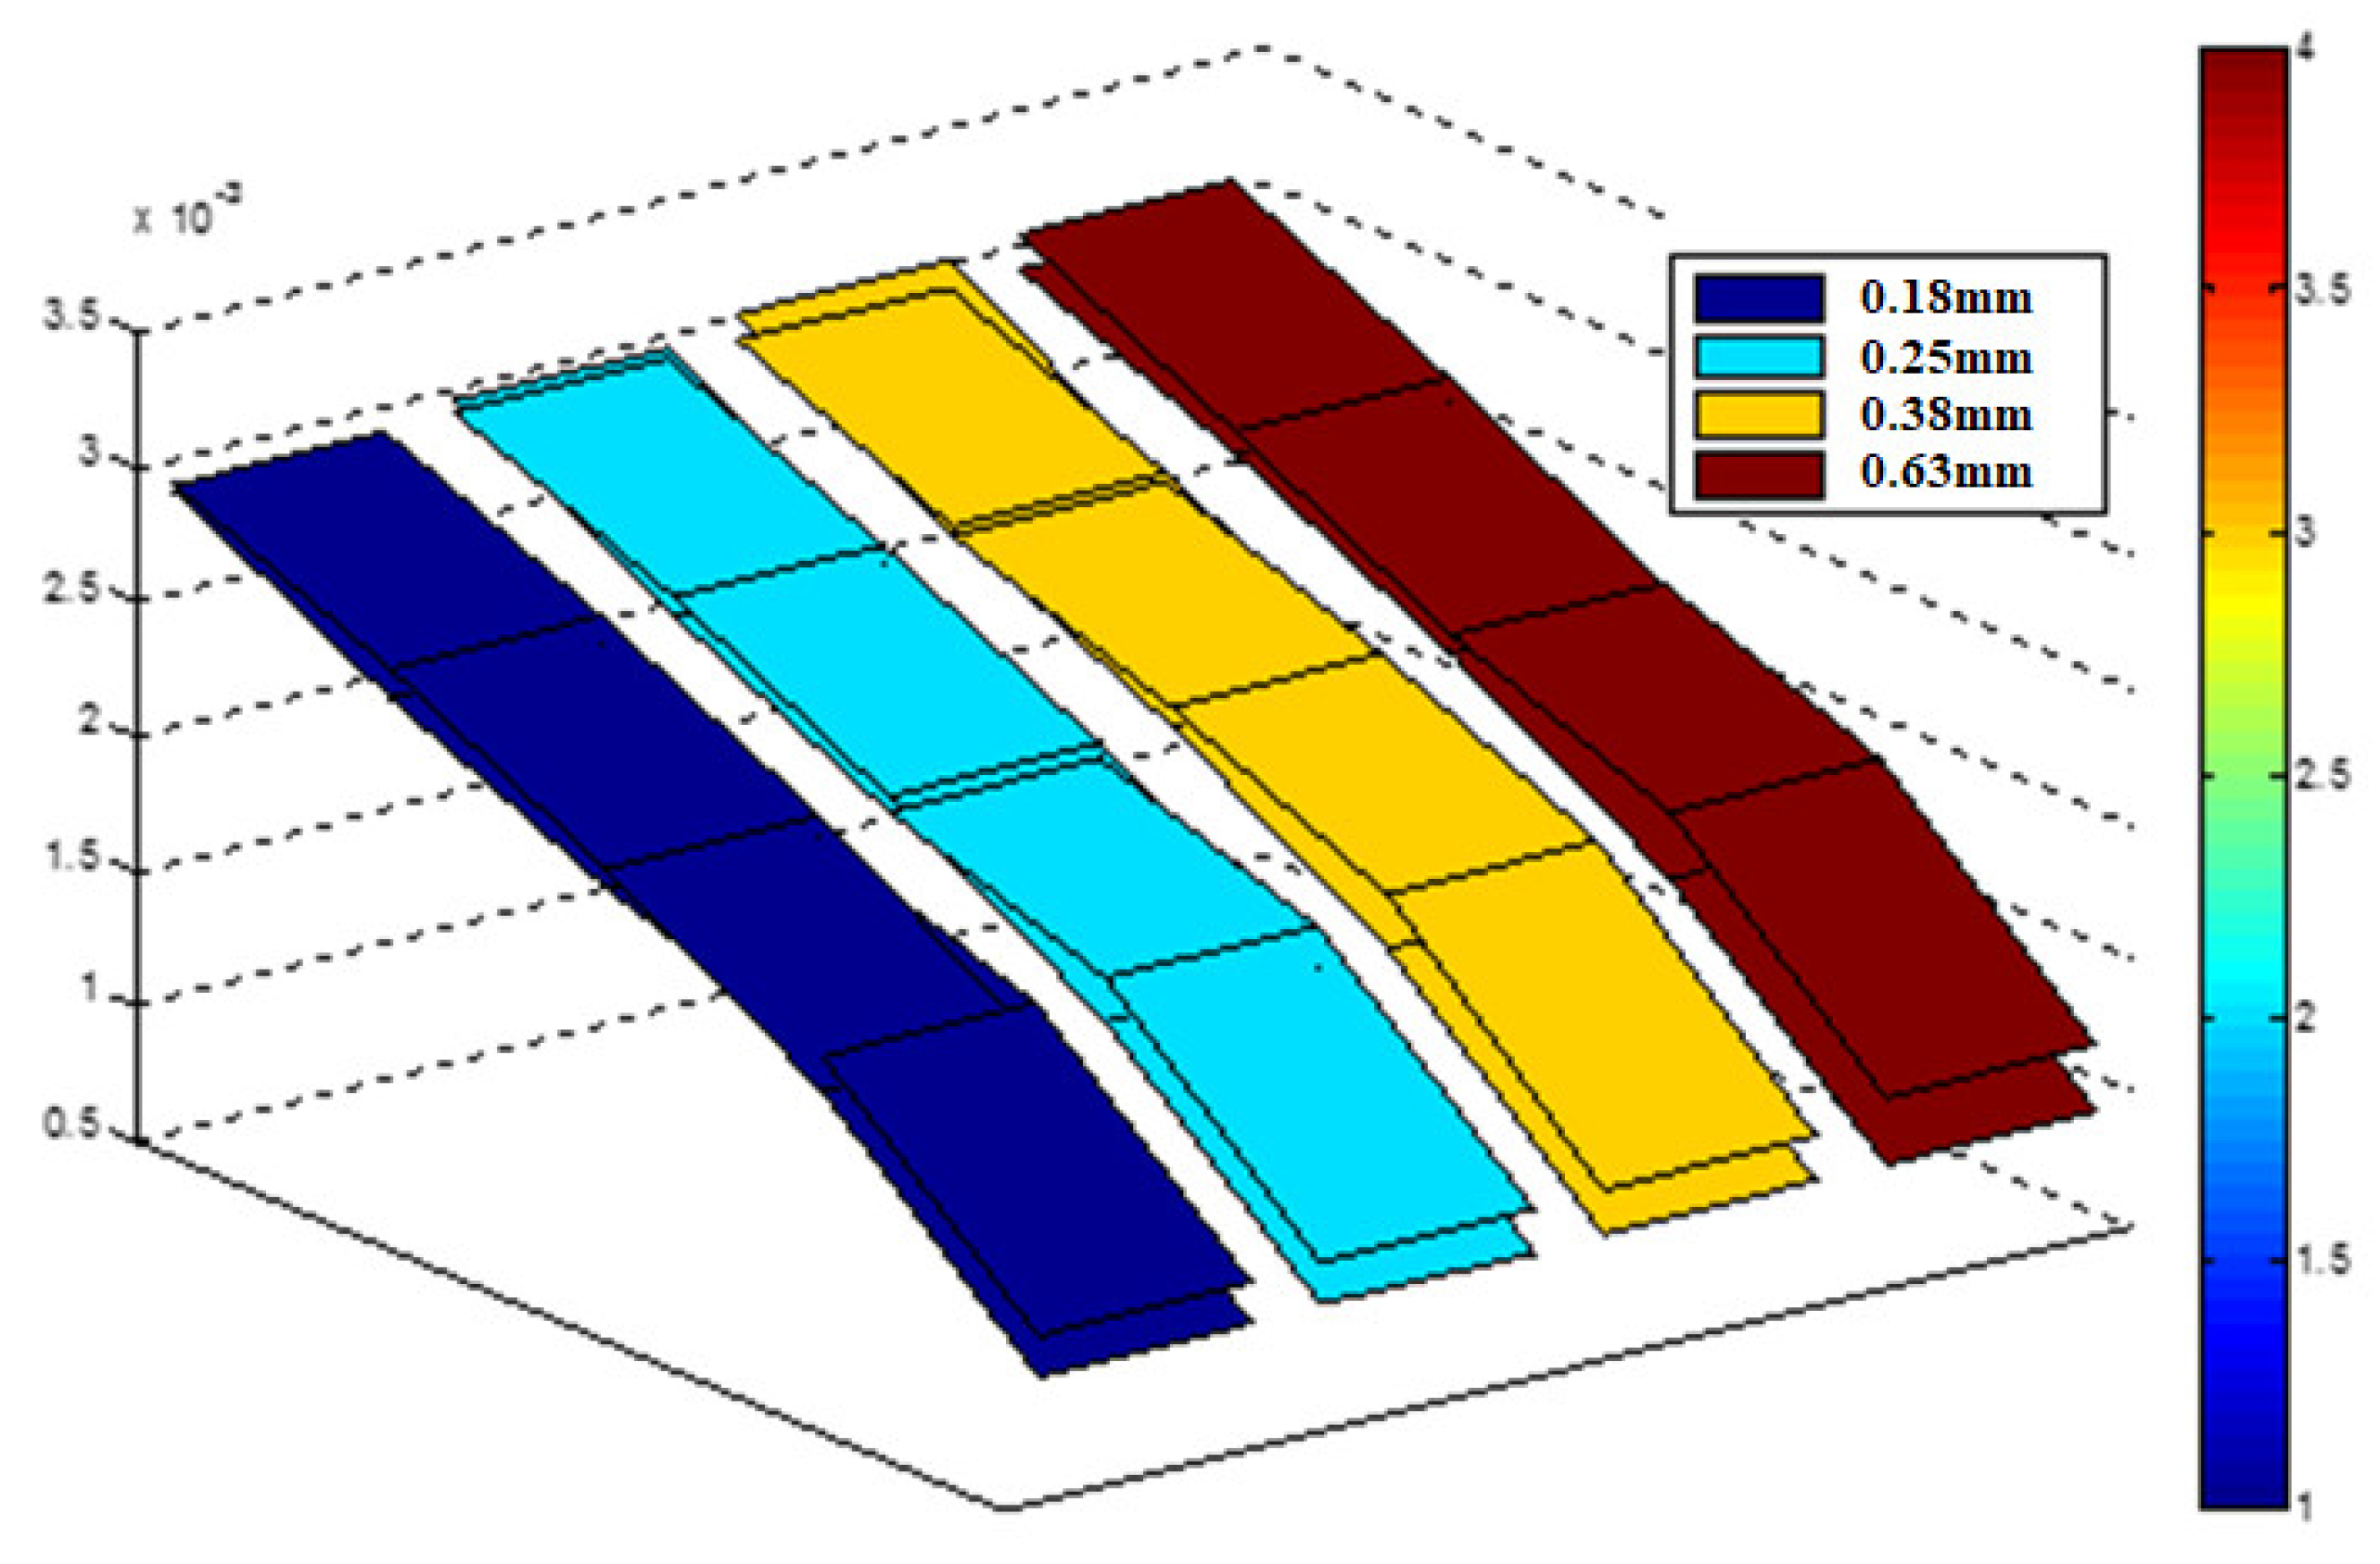
As shown in Figure 10, it can be observed that for the same wellbore angle, the gradient of both the experimental and fitted values for coal particles with different sizes is identical, indicating that as particle size increases, the critical velocity also increases. Similarly, under the same particle size conditions, an increase in the wellbore angle leads to a corresponding rise in the critical velocity. Whether for experimental data or fitted values, the change in wellbore angle has a more significant impact on the critical velocity than the change in particle size. This is because smaller coal particles are influenced more by the van der Waals force and the lifting force from the fluid, with gravity having a weaker effect. The change in the wellbore angle notably affects the flow velocity of the main fluid, which, in turn, has a more pronounced effect on the lifting force acting on the particles. Therefore, the wellbore angle exerts a greater influence on the critical velocity of coal particles than the particle size.

5. Field Application Case

During the development of a coalbed methane (CBM) well in a specific block of the Ordos Basin, several wells experienced abnormal coal fine production in the early drainage stage. These anomalies were accompanied by unstable gas production, severe fluctuations in wellbore pressure differentials, and frequent issues such as pump failure and gas–water short-circuiting due to coal fine accumulation. To investigate this phenomenon, a field study was conducted on Well Shi-X, in which production data and bottomhole pressure at various stages were collected and analyzed to evaluate the relationship between coal fines transport behavior and critical gas velocity. The key parameters of Well Shi-X are summarized as Table 4.
Based on the proposed critical transport velocity model for coal fines, the predicted critical superficial gas velocity under typical drainage conditions of Well Shi-X (bottomhole pressure of 1.0 MPa) is 2.57 m/s, corresponding to a daily gas production rate of approximately 2370 m3/d. Field monitoring data indicate that when the daily gas production falls below 2200 m3/d, significant fluctuations in bottomhole pressure are observed, suggesting a rapid increase in coal fine concentration. At this stage, wellbore cleaning and pump flushing operations should be promptly carried out. The onset of coal fine accumulation observed in the field closely aligns with model predictions, with a deviation of less than 10%, thereby validating the model’s effectiveness and engineering applicability.

6. Conclusions

(1)
The migration of coal is primarily controlled by the liquid phase, with minimal influence from the gas–liquid flow pattern. Regardless of variations in the wellbore angle, gas–liquid flow rate, or coal particle size, the movement of coal particles is weakly correlated with the gas phase. Furthermore, the presence of coal does not significantly alter the gas–liquid flow pattern, indicating that the flow pattern is determined by the characteristics of the gas–liquid interface.
(2)
The wellbore inclination angle has a greater effect on the critical velocity of coal than the particle size. As the wellbore angle increases, the critical velocity of coal increases significantly. However, at smaller angles, the impact of angle changes on the critical velocity is minimal. This is because an increase in the wellbore angle enhances the velocity of the main fluid, thereby improving its ability to transport coal.
(3)
The movement of coal in the fluid occurs in three distinct stages: hopping, rolling, and drifting. During the hopping stage, coal displacement is brief, and it does not continuously move in the direction of the fluid. In the rolling stage, stable migration begins, and the velocity at this stage corresponds to the critical velocity. In the drifting stage, coal becomes fully suspended and moves at high speed with the fluid.
(4)
The existing critical velocity model for coal has been refined using experimental data, making it more suitable for predicting coal migration in coalbed methane wells. The experimental results demonstrate that the corrected model can accurately predict the critical velocity of coal, offering a reliable computational method for gas–liquid-solid three-phase flow studies.
(5)
During coalbed methane production, it is crucial to monitor the relationship between actual production and the critical flow rate. If the production rate falls below the critical threshold, fluctuations in bottomhole pressure may occur. To prevent wellbore blockage and pump sticking, timely interventions such as wellbore cleaning and pump flushing should be conducted to ensure stable and continuous production.

7. Suggestions

To facilitate model development and solution, this study assumes idealized spherical particles. However, in practice, coal fines exhibit irregular shapes and heterogeneous compositions. Future research should focus on the influence of particle heterogeneity and more complex flow patterns on the critical transport velocity, in order to further improve the model’s applicability. In addition, although coalbed methane wells are typically produced under negative pressure in the field, laboratory experiments often adopt a pump-driven supply system to ensure precise control of flow rate and parameter stability. Further investigations are warranted to rigorously assess the potential impact of these differing fluid supply methods on experimental outcomes.

Author Contributions

Methodology, R.Z.; Conceptualization, T.H.; Investigation, Y.L.; Data curation, P.M.; Writing—original draft, R.Z.; Funding acquisition, G.H. All authors have read and agreed to the published version of the manuscript.

Funding

This research was funded by Technology and Application of Deep Coalbed Methane Exploitation, grant number [P24042].

Data Availability Statement

The original contributions presented in this study are included in the article. Further inquiries can be directed to the corresponding author.

Conflicts of Interest

Authors Ruili Zhou and Yuxiang Liu were employed by the Key Laboratory of Deep CBM Exploration and Production Technology at SINOPEC and Petroleum Engineering Technology Research Institute of Sinopec North China E & P Company. The remaining authors declare that the research was conducted in the absence of any commercial or financial relationships that could be construed as a potential conflict of interest.

Appendix A

Appendix A.1. Empirical Formulas for the Drag Coefficient and Lift Coefficient

(1)
Calculation formula for the drag coefficient
For spherical rigid particles, the drag coefficient is usually calculated using the particle Reynolds number. Based on previous empirical formulas, Turton combined empirical formulas with experiments and, through a comparative analysis, derived a new empirical formula for calculating the drag coefficient:
C D = 24 R e p ( 1 + 0.173 R e p 0.657 ) + 0.413 1 + 16300 R e p 1.09
(2)
Calculation formula for the lift coefficient
According to Saffman’s lift theory, the expression is given by
F L = 1.616 v p d 2 μ υ d v p d r
The formula is modified and corrected to
C L = 2.466 d R e p v p d v p d r

Appendix A.2. Derivation of the Shear Rate d v p d r

Since the motion trajectory of the particles is similar to a parabolic motion, the velocity is the resultant of the radial and fluid flow directions. When considering the velocity gradient in the radial direction, it is sufficient to perform a force analysis in the radial direction. Based on the force relationship, the equation of forces in the radial direction is
F L F B cos α F v a n R = m d v p y d t
Substituting the corresponding expressions and rearranging, we obtain
d v p y d t = 3 d C L v 2 ( ρ s ρ f 1 ) g cos α 3 A H 2 π d 2 s 2 sin ϕ
Taking the derivative in the radial direction,
6 d C L L d v d r = d v p y d r
From the velocity distribution of the fluid in the circular pipe, it is known that
d v d r = Δ p 2 μ L r
Substituting Equation (A7) into Equation (A6) gives
d v p y d r = 3 C L Δ p μ d r
From this, it can be concluded that the lift coefficient is
C L = 36 . 49 Δ p μ R e p r v p
Since coal particles begin moving from the top layer, the radial distance used to calculate the lift coefficient should be the thickness of the coalbed, as follows:
C L = 36 . 49 Δ p μ R e p h p v p

Appendix A.3. Empirical Formula Modification

Both the drag coefficient and the lift coefficient are calculated using empirical formulas, which are applied to determine the drag force and lift force for rock debris particles. However, compared to coal particles, rock debris particles differ in the particle size, physical properties, and forces acting on them. Therefore, the aforementioned empirical formulas are not suitable for calculating the critical velocity of the coalbed. In this study, based on theoretical derivations and experimental data, the empirical formulas from previous studies are modified to enhance their practicality and guidance for calculating the critical velocity of the coalbed.
Specifically, the coefficients in Equations (A1) and (A10) are modified, and the modified formulas are expressed as
C D ( c ( 1 ) , c ( 2 ) , c ( 3 ) , c ( 4 ) , c ( 5 ) ) = 24 R e p ( 1 + c ( 1 ) R e p c ( 2 ) ) + c ( 3 ) 1 + c ( 4 ) R e p c ( 5 )
and
C L ( c ( 6 ) ) = c ( 6 ) Δ p μ R e p h p v p
(1)
Modification Method:
Since this problem involves solving a system of nonlinear equations, and the coefficient matrix is derived from the same mathematical expression with only parameter variations, there is a possibility that the coefficient matrix may become singular during computation. To prevent errors caused by singular nonlinear equations, the Levenberg-Marquardt (L-M) method is employed to solve this problem.
A nonlinear fitting problem refers to the nonlinear relationship between the fitting function model f ( x ; C ) ( C R n , x R ) and the fitting coefficients C .
Given a function model with a nonlinear relationship concerning the unknown coefficient C = ( c 1 , c 2 , , c n ) T , it can be expressed as
f ( x ; C ) ( C R n , x R )
The goal is to use function f ( x ; C ) to fit a given set of m data points (m > n) ( x i , y i ) ( i = 1 , 2 , , m ) , minimizing the sum of squared errors, which is given by
R 2 = i = 1 m ϖ i [ y i f ( x i ; C ) ] 2 = min
where ϖ i   ( i = 1 , 2 , , m ) is the weighting factor for the fitting process.
The nonlinear least squares problem involves solving Equation (A15) to determine the unknown coefficient C = ( c 1 , c 2 , , c n ) T , ultimately obtaining the fitted function y = f ( x ; C ) .
(2)
Levenberg-Marquardt (L-M) method
Rewriting Equation (A13) in the form of a nonlinear equation system for C = ( c 1 , c 2 , , c n ) T R , we obtain
f 1 ( x 1 ; C ) = y 1 f 2 ( x 2 ; C ) = y 2 f m ( x m ; C ) = y m
Given an initial value C 0 = ( c 1 0 , c 2 0 , , c n 0 ) T , performing a Taylor expansion of y = f ( x ; C ) at this point, the component form can be expressed as
f i f i 0 + f i c 1 Δ c 1 + f i c 2 Δ c 2 + + f i c n Δ c n ( i = 1 , 2 , , m )
Substituting into i = 1 m ϖ i [ y i f ( x i ; C ) ] 2 , we obtain ϖ i = 1   ( i = 1 , 2 , , m ) , and the approximate expression is
R ( c 1 , c 2 , , c n ) = i = 1 m [ y i f i 0 ( f i c 1 Δ c 1 + f i c 2 Δ c 2 + + f i c n Δ c n ) ] 2
Based on the necessary conditions for extremum, setting R c j = 0 ( j = 1 , 2 , , n ) and considering c j 0 as a given constant, we obtain R c j = R Δ c j , leading to
i = 1 m f i c j ( f i c 1 Δ c 1 + f i c 2 Δ c 2 + + f i c n Δ c n ) = i = 1 m ( y i f i 0 ) f i c j ( j = 1 , 2 , , n )
That is,
i = 1 m k = 1 n f i c k f i c j Δ c k = i = 1 m ( y i f i 0 ) f i c j ( j = 1 , 2 , , n )
Setting a i j = f i c j , we then obtain an m × n matrix:
A = ( a i j ) m × n = f 1 c 1 f 1 c 2 f 1 c n f 2 c 1 f 2 c 2 f 2 c n   f m c 1 f m c 2 f m c n R m × n
Let Y = ( y 1 , y 2 , , y m ) T , F = ( f 1 0 , f 2 0 , , f m 0 ) T , and Equation (A20) can be expressed as
A T A Δ C = A T ( Y F )
At step K, we have p k = Δ C ( k ) , g k = F ( k ) Y = g k ( C k ) , and Equation (A21) can be expressed as
A k T A k p k = A k T g k
From the basic properties of matrices, for a semidefinite matrix A k T A k , when μ > 0 , A k T A k + μ I is guaranteed to be a strictly positive definite matrix. Therefore, an appropriate adjustment of μ > 0 can be made as
p k ( μ ) = ( A k T A k + μ I ) 1 A k T g k
After solving for Δ C , the value of C is obtained as
C = C 0 + Δ C
This gives the solution to the nonlinear least squares problem.

References

  1. Zhong, Z.Y. Study on Coal Fine Particle Deposition and Accumulation in Undulating Wellbore. Ph.D. Thesis, China University of Petroleum, Beijing, China, 2019. [Google Scholar]
  2. Han, G.Q.; Gao, F.; Zhu, B.; Guo, H.F. Superficial transport mechanisms of coal particles in the coal-bed methane well. J. China Coal Soc. 2013, 38, 365–369. [Google Scholar]
  3. Tomren, P.H.; Lyoho, A.W.; Azar, J.J. Experimental Study of Cuttings Transport in Directional Wells. SPE Drill. Eng. 1986, 1, 43–56. [Google Scholar] [CrossRef]
  4. Doron, P.; Granica, D.; Barnea, D. Slurry flow in horizontal pipes—Experimental and modeling. Int. J. Multiph. Flow 1987, 13, 535–547. [Google Scholar] [CrossRef]
  5. Ford, J.T.; Peden, J.M.; Oyeneyin, M.B.; Gao, E.H.; Zarrough, R. Experimental Investigation of Drilled Cuttings Transport in Inclined Boreholes. In Proceedings of the SPE Annual Technical Conference and Exhibition, New Orleans, LA, USA, 23–26 September 1990. [Google Scholar]
  6. Doron, P.; Barnea, D. Flow pattern maps for solid-liquid flow in pipes. Int. J. Multiph. Flow 1996, 22, 273–283. [Google Scholar] [CrossRef]
  7. Nguyen, D.; Rahman, S.S. A Three-Layer Hydraulic Program for Effective Cuttings Transport and Hole Cleaning in Highly Deviated and Horizontal Wells. SPE Drill. Complet. 1998, 13, 182–189. [Google Scholar] [CrossRef]
  8. Wang, B.H.; Wang, X.Z. New Method for Calculation of Settling Velocity of a Spherodial Particle. Powder Sci. Technol. 1996, 2, 30–39. [Google Scholar]
  9. Bai, X.N.; Hu, S.G.; Zhang, D.F.; Jiang, X.P.; Qin, H.B. Design of the solid-liquid two-phase flow pipeline experimental apparatus. J. Univ. Shanghai Sci. Technol. 2001, 23, 95–101. [Google Scholar]
  10. King, M.; Fairhurst, C.; Hill, T. Solids Transport in Multiphase Flows—Application to High-Viscosity Systems. J. Energy Resour. Technol. 2000, 123, 200–204. [Google Scholar] [CrossRef]
  11. Li, A.F.; Wang, S.H.; Wang, W.L. Study on settling rule of formation sand in the liquid fluids. Oil Gas Recovery Technol. 2001, 8, 70–73. [Google Scholar]
  12. Li, M.Z.; Wang, W.Y.; He, Y.F.; Yuan, M. Research on the Sand-Carrying Law in Vertical Wellbores. J. Univ. Pet. China (Nat. Sci. Ed.) 2000, 2, 33–35+43–9+8. [Google Scholar]
  13. Shi, H.; Holmes, J.A.; Durlofsky, L.J.; Aziz, K.; Diaz, L.R.; Alkaya, B.; Oddie, G. Drift—Flux Modeling of Two-Phase Flow in Wellbores. SPE J. 2005, 10, 24–33. [Google Scholar] [CrossRef]
  14. Wang, Z.M.; Zhang, Z. Research on Cuttings Transport Behavior in a Two-Layer Stable Model for Highly Deviated Wells. Oil Drill. Prod. Technol. 2003, 25, 8–11+83. [Google Scholar]
  15. Wang, Z.M.; Zhang, Z. A two-layer time-dependent model for cuttings transport in extended-reach horizontal wells. Chin. J. Hydrodyn. 2004, 19, 676–681. [Google Scholar]
  16. Guo, X.L.; Wang, Z.M. The hydraulic extended limit of mega-extended-reach well at Liuhua Field in South China Sea. Oil Drill. Prod. Technol. 2009, 31, 10–13. [Google Scholar]
  17. Wang, Z.Z.; Deng, J.G.; Sun, F.J.; Zhou, J.L.; Liu, A.P. Experimental study on sand grain migration in wellbore. Acta Pet. Sin. 2006, 27, 130–132+138. [Google Scholar]
  18. Jiao, Y.H.; Deng, J.G.; Mou, S.B. Calculation of Minimum Sand-Carrying Velocity for Sand Production in Vertical Wellbores. West-China Explor. Eng. 2010, 22, 101–103. [Google Scholar]
  19. Najmi, K. Particle Transport in Single—Phase and Multiphase Horizontal Pipes with Emphasis on the Effect of Viscosity. Ph.D. Dissertation, The University of Tulsa, Tulsa, OK, USA, 2015. [Google Scholar]
  20. Najmi, K.; McLaury, B.S.; Shirazi, S.A.; Cremaschi, S. Experimental study of low concentration sand transport in wet gas flow regime in horizontal pipes. J. Nat. Gas Sci. Eng. 2015, 24, 80–88. [Google Scholar] [CrossRef]
  21. Padsalgikar, A. Particle Transport in Stratified Gas-Liquid-Solid Flow. Ph.D. Dissertation, The University of Tulsa, Tulsa, OK, USA, 2015. [Google Scholar]
  22. Dabirian, R. Modeling and Experimental Investigation of Sand Transport in Gas-Liquid Stratified Flow. Ph.D. Dissertation, The University of Tulsa, Tulsa, OK, USA, 2016. [Google Scholar]
  23. Sajeev, S.; McLaury, B.S.; Shirazi, S.A. Threshold Particle Concentration in Single-Phase and Multiphase Flow Sand Transport in Pipelines. In Proceedings of the 11th North American Conference on Multiphase Production Technology, Banff, AB, Canada, 6–8 June 2018. [Google Scholar]
  24. Kareepadath Sajeev, S. Particle Transport in Horizontal Pipes for Single-Phase and Multiphase Flows at Very Low Concentrations Including the Threshold Concentration. Ph.D. Dissertation, The University of Tulsa, Tulsa, OK, USA, 2019. [Google Scholar]
  25. Leporini, M.; Marchetti, B.; Corvaro, F.; di Giovine, G.; Polonara, F.; Terenzi, A. Sand transport in multiphase flow mixtures in a horizontal pipeline: An experimental investigation. Petroleum 2019, 5, 161–170. [Google Scholar] [CrossRef]
  26. Sun, X.F.; Yao, D.; Sun, S.H.; Ji, G.D.; Yu, F.R.; Sun, M.H.; Zhao, Y.Z.; Tao, L. A new transient calculation method of cuttings bed thickness based on drift flow model. Nat. Gas Ind. 2022, 42, 85–92. [Google Scholar]
  27. Jiang, B.B.; Zhang, G.Q.; Wang, D.; Liu, J.B.; Yang, Q.L.; Xu, X.H. Prediction of critical drawdown pressure of sand production in ultra-deep high pressure sandstone gas reservoirs. Xinjiang Oil Gas 2024, 20, 11–20. [Google Scholar]
  28. Tian, S.C.; Zhang, W.H.; Weng, J.T.; Guan, Z.Y.; Wang, J.B.; Liu, D.Q. The mechanism of sand production under the alternating injection-production mode of gas storage in Xinjiang MH gas reservoir. Xinjiang Oil Gas 2024, 20, 56–62. [Google Scholar]
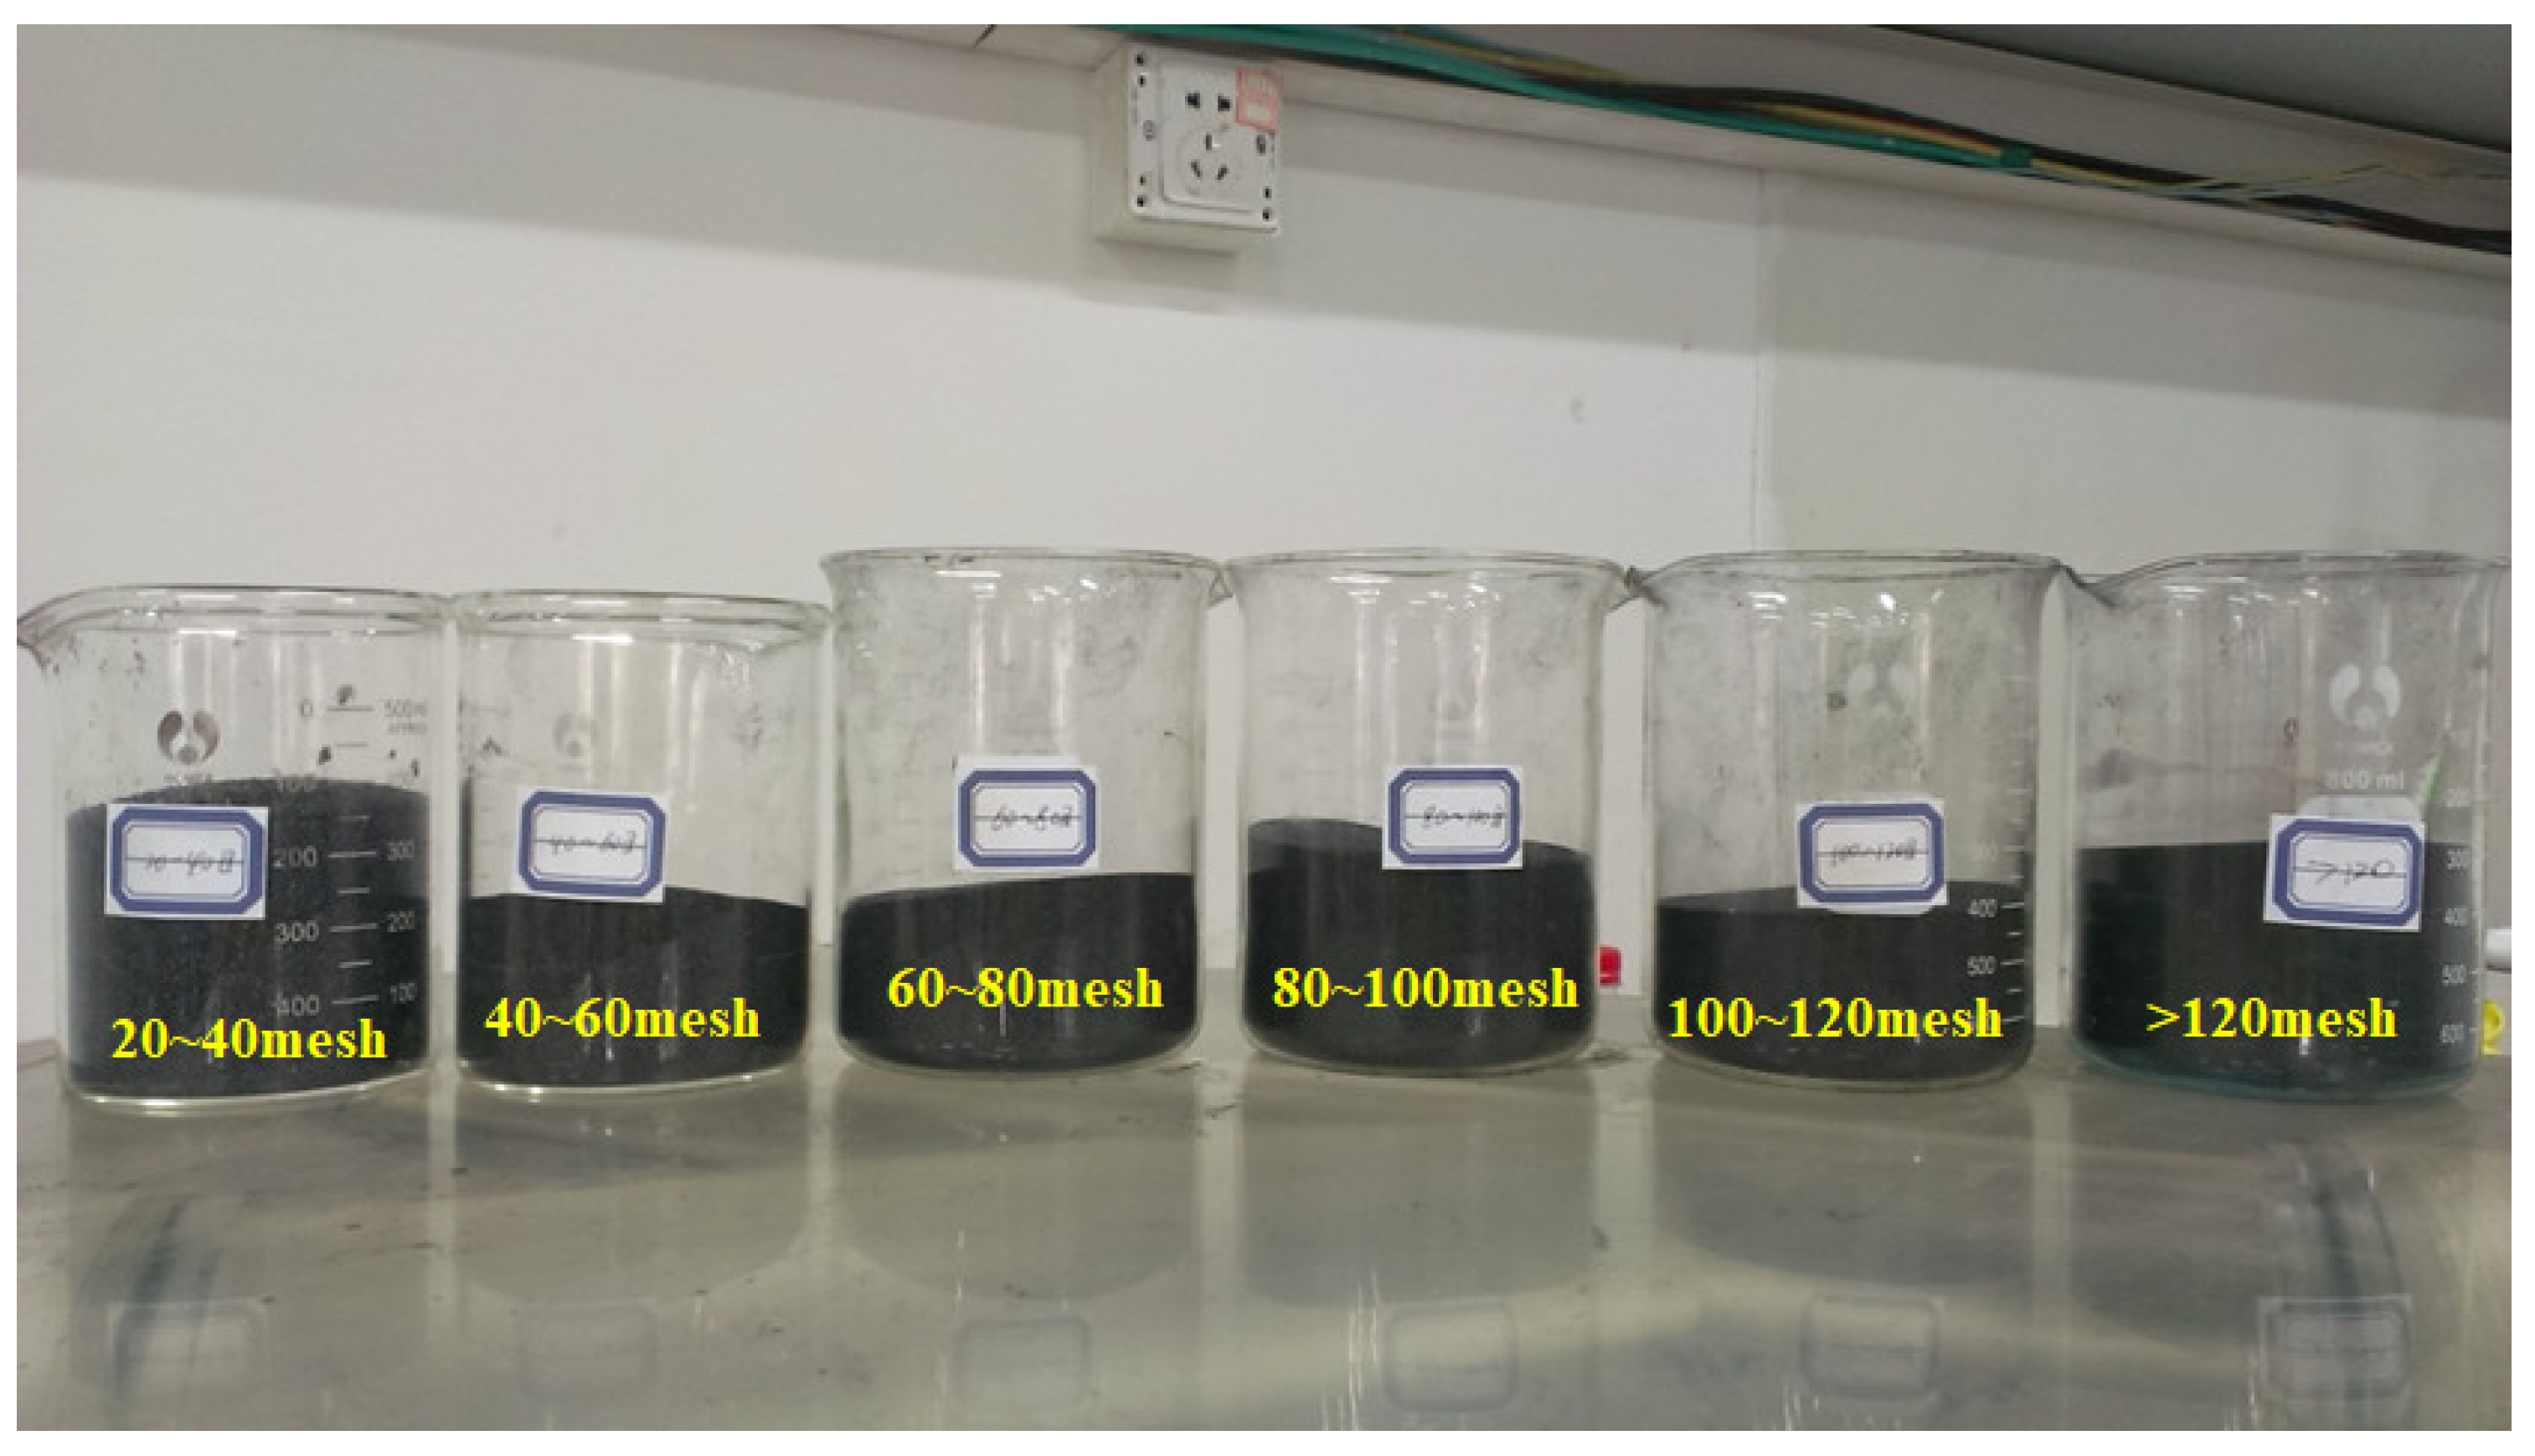
Figure 1. Sorted coal particles.
Processes 13 01550 g001
Figure 2. Layering behavior of coal particles.
Processes 13 01550 g002
Figure 3. Coal particle layering experimental data analysis chart.
Processes 13 01550 g003
Figure 4. Experimental setup flowchart.
Processes 13 01550 g004
Figure 5. Wellbore simulation system.
Processes 13 01550 g005
Figure 6. Critical velocity of coal particles at different wellbore angles.
Processes 13 01550 g006
Figure 7. Critical velocity of wellbore angles at different coal particles.
Processes 13 01550 g007
Figure 8. Force analysis of coal particles.
Processes 13 01550 g008
Figure 9. Fitting of critical velocity of coal particles with different particle sizes under different angle conditions.
Processes 13 01550 g009
Figure 10. Three-dimensional fitting of critical velocity of coal particles with different particle sizes under different angle conditions.
Processes 13 01550 g010
Table 1. Density of coal particles.
Mesh Size (mesh)Mass (g)Volume (mL)Density (g/cm3)
20–402.121.601.325
40–601.941.501.293
60–802.282.001.140
80–1001.881.701.106
100–1201.971.801.094
Table 2. Layering experimental data of coal particles.
Sieve Size (mesh)Settled Proportion (%)Floating Proportion (%)
20~400.85714 0.14286
40~600.82353 0.17647
60~800.73684 0.26316
80~1000.71429 0.28571
100~1200.60000 0.40000
120~1800.28571 0.71429
Table 3. Critical velocity of coal particles with different sizes under various wellbore inclination angles.
Inclination Angle (°)Superficial Velocity (m/s)
80 Mesh60 Mesh40 Mesh20 Mesh
50.0011210.0011300.0011380.001210
150.0018150.0018390.0018900.001931
250.0020890.0021140.0022380.002240
350.0024560.0024980.0025310.00266
450.0028730.0029530.0030110.003045
Table 4. The key parameters of Well Shi-X.
ParameterValueUnit
True vertical depth (TVD)820m
Horizontal section length580m
Casing sizeΦ114mm
Daily gas production1200–2400m3/d
Daily water production0.6–1.1m3/d
Measured bottomhole pressure range0.8–1.4MPa
Coal fines particle size distributionD50 ≈ 65 μm, range: 10–300μm
Disclaimer/Publisher’s Note: The statements, opinions and data contained in all publications are solely those of the individual author(s) and contributor(s) and not of MDPI and/or the editor(s). MDPI and/or the editor(s) disclaim responsibility for any injury to people or property resulting from any ideas, methods, instructions or products referred to in the content.