

Business Cases for Digital Twins in Biopharmaceutical Manufacturing—Market Overview, Stakeholders, Technologies in 2025 and Beyond


Abstract
1. The State of the Industry
- Over the past decade, the industry has come to recognize a positive return on investment (ROI) in modeling and, by extension, digital twin technology, which is a positive development;
- There is, however, still a need for clear definitions as they are crucial for clarity and precision and are still frequently misused:
- As stated right in the introduction, a digital twin refers specifically to a comprehensive digital representation of a physical object (the physical twin) that is capable of bidirectional communication with that object [1]. This definition is common and is also prevalent in the process automation community, where it includes modifying the behavior of a manufacturing asset in response to its physical state. Udugama et al. suggest a five-step implementation strategy, from simple balance equations to fully validated process models, that allows real-time process optimization through model-based advanced process control [42,47];
- A digital shadow (DS), meanwhile, involves a validated, mechanistic model with at least one real-time interface for process data acquisition [48,49,50]. However, it lacks a direct feedback interface to the physical process, limiting its use for real-time advanced process control with direct feedback loops [51,52];
- Mechanistic models, also known as physico-chemical or rigorous models, form the foundation of DT and DS and are precisely defined to distinguish the effects of different phenomena such as fluid dynamics, phase equilibrium, and mass transfer. Properly considering fluid dynamics differences enables effective scale-up from laboratory to manufacturing scale;
- Distinguishing between mechanistic, hybrid, and data-driven models is useful. However, care must be taken to prevent overlap in statistical hybrid models, which could compromise the basic mechanistic structure, rendering them purely data-driven;
- Model calibration refers to the process of determining model parameters using experimental data. In the biopharmaceutical industry, there appears to be a lack of familiarity with fundamental chemical engineering practices, which have established these concepts, including quantitative model validation, for decades;
- Plant modeling, often referred to as flowsheet simulations, routinely involves cost estimations and scheduling, as seen in tools like SuperPro and Aspen Plus. Flowsheet modeling tools also include software such as gPROMS, which is more process model-focused.
- Implementing a digital shadow as a recommender system with no direct control on the process can be an effective initial step in introducing technology and increasing familiarity [3,53]. The usefulness of a digital shadow is demonstrated in [54], where real-time data during a chromatography run enhanced model prediction so that precise differentiation between two overlapping components was possible;
- The estimated requirement for 3–4 subject matter experts must consider the number of projects, workload, and interdisciplinary expertise needed:
- Process engineering for modeling, experimental plans for model validation, and parameter determination;
- Mathematics and informatics for sensor interfaces, models, process control systems, and statistics for PAT applications and data management;
- Analytical knowledge for validating inline PAT with offline QA (quality assurance) methods;
- Understanding the QbD approach, including risk analysis and robust statistical methodologies;
- Regulatory considerations require each type of expert to be represented by three individuals to account for absences and ensure continuity.
- Regulatory approval follows established guidelines, with process models categorized as type III high-level models that influence product quality. Model validation with small-scale experiments, followed by validation runs comparing outcomes with and without digital twins, is a feasible approach.
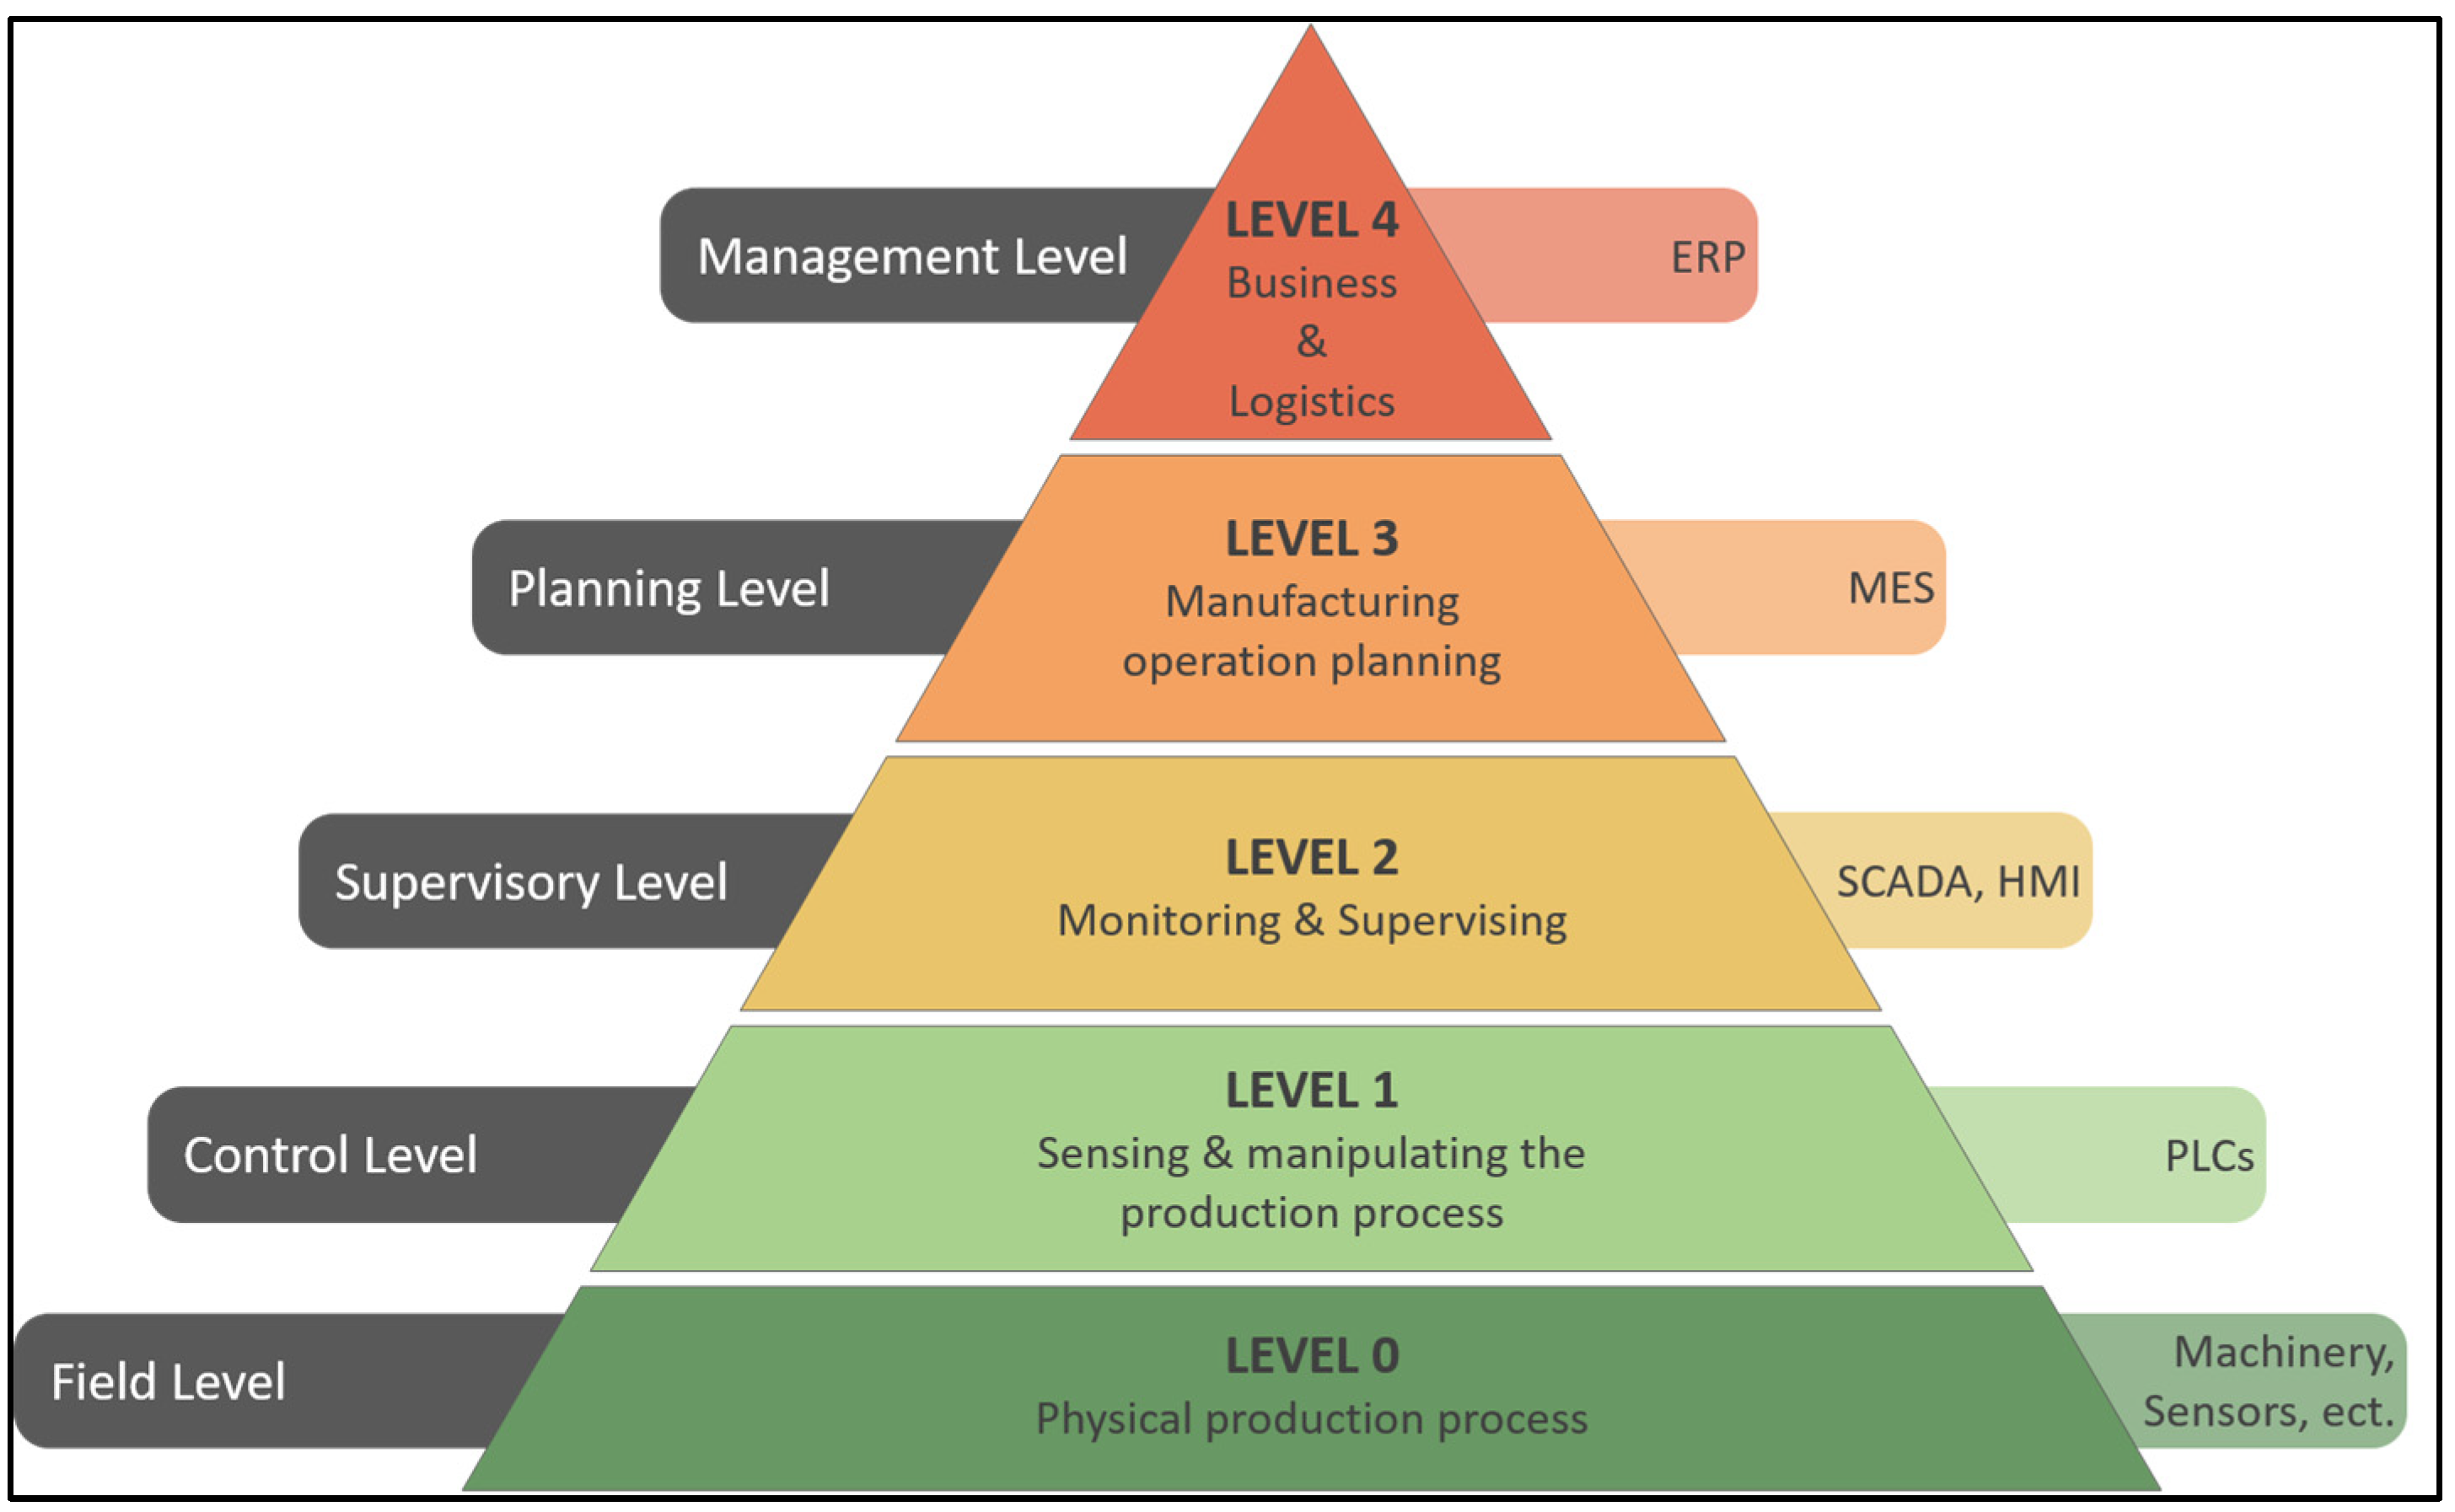
2. The Automation Pyramid
3. Digital Twin Validation
4. Business Case and Models
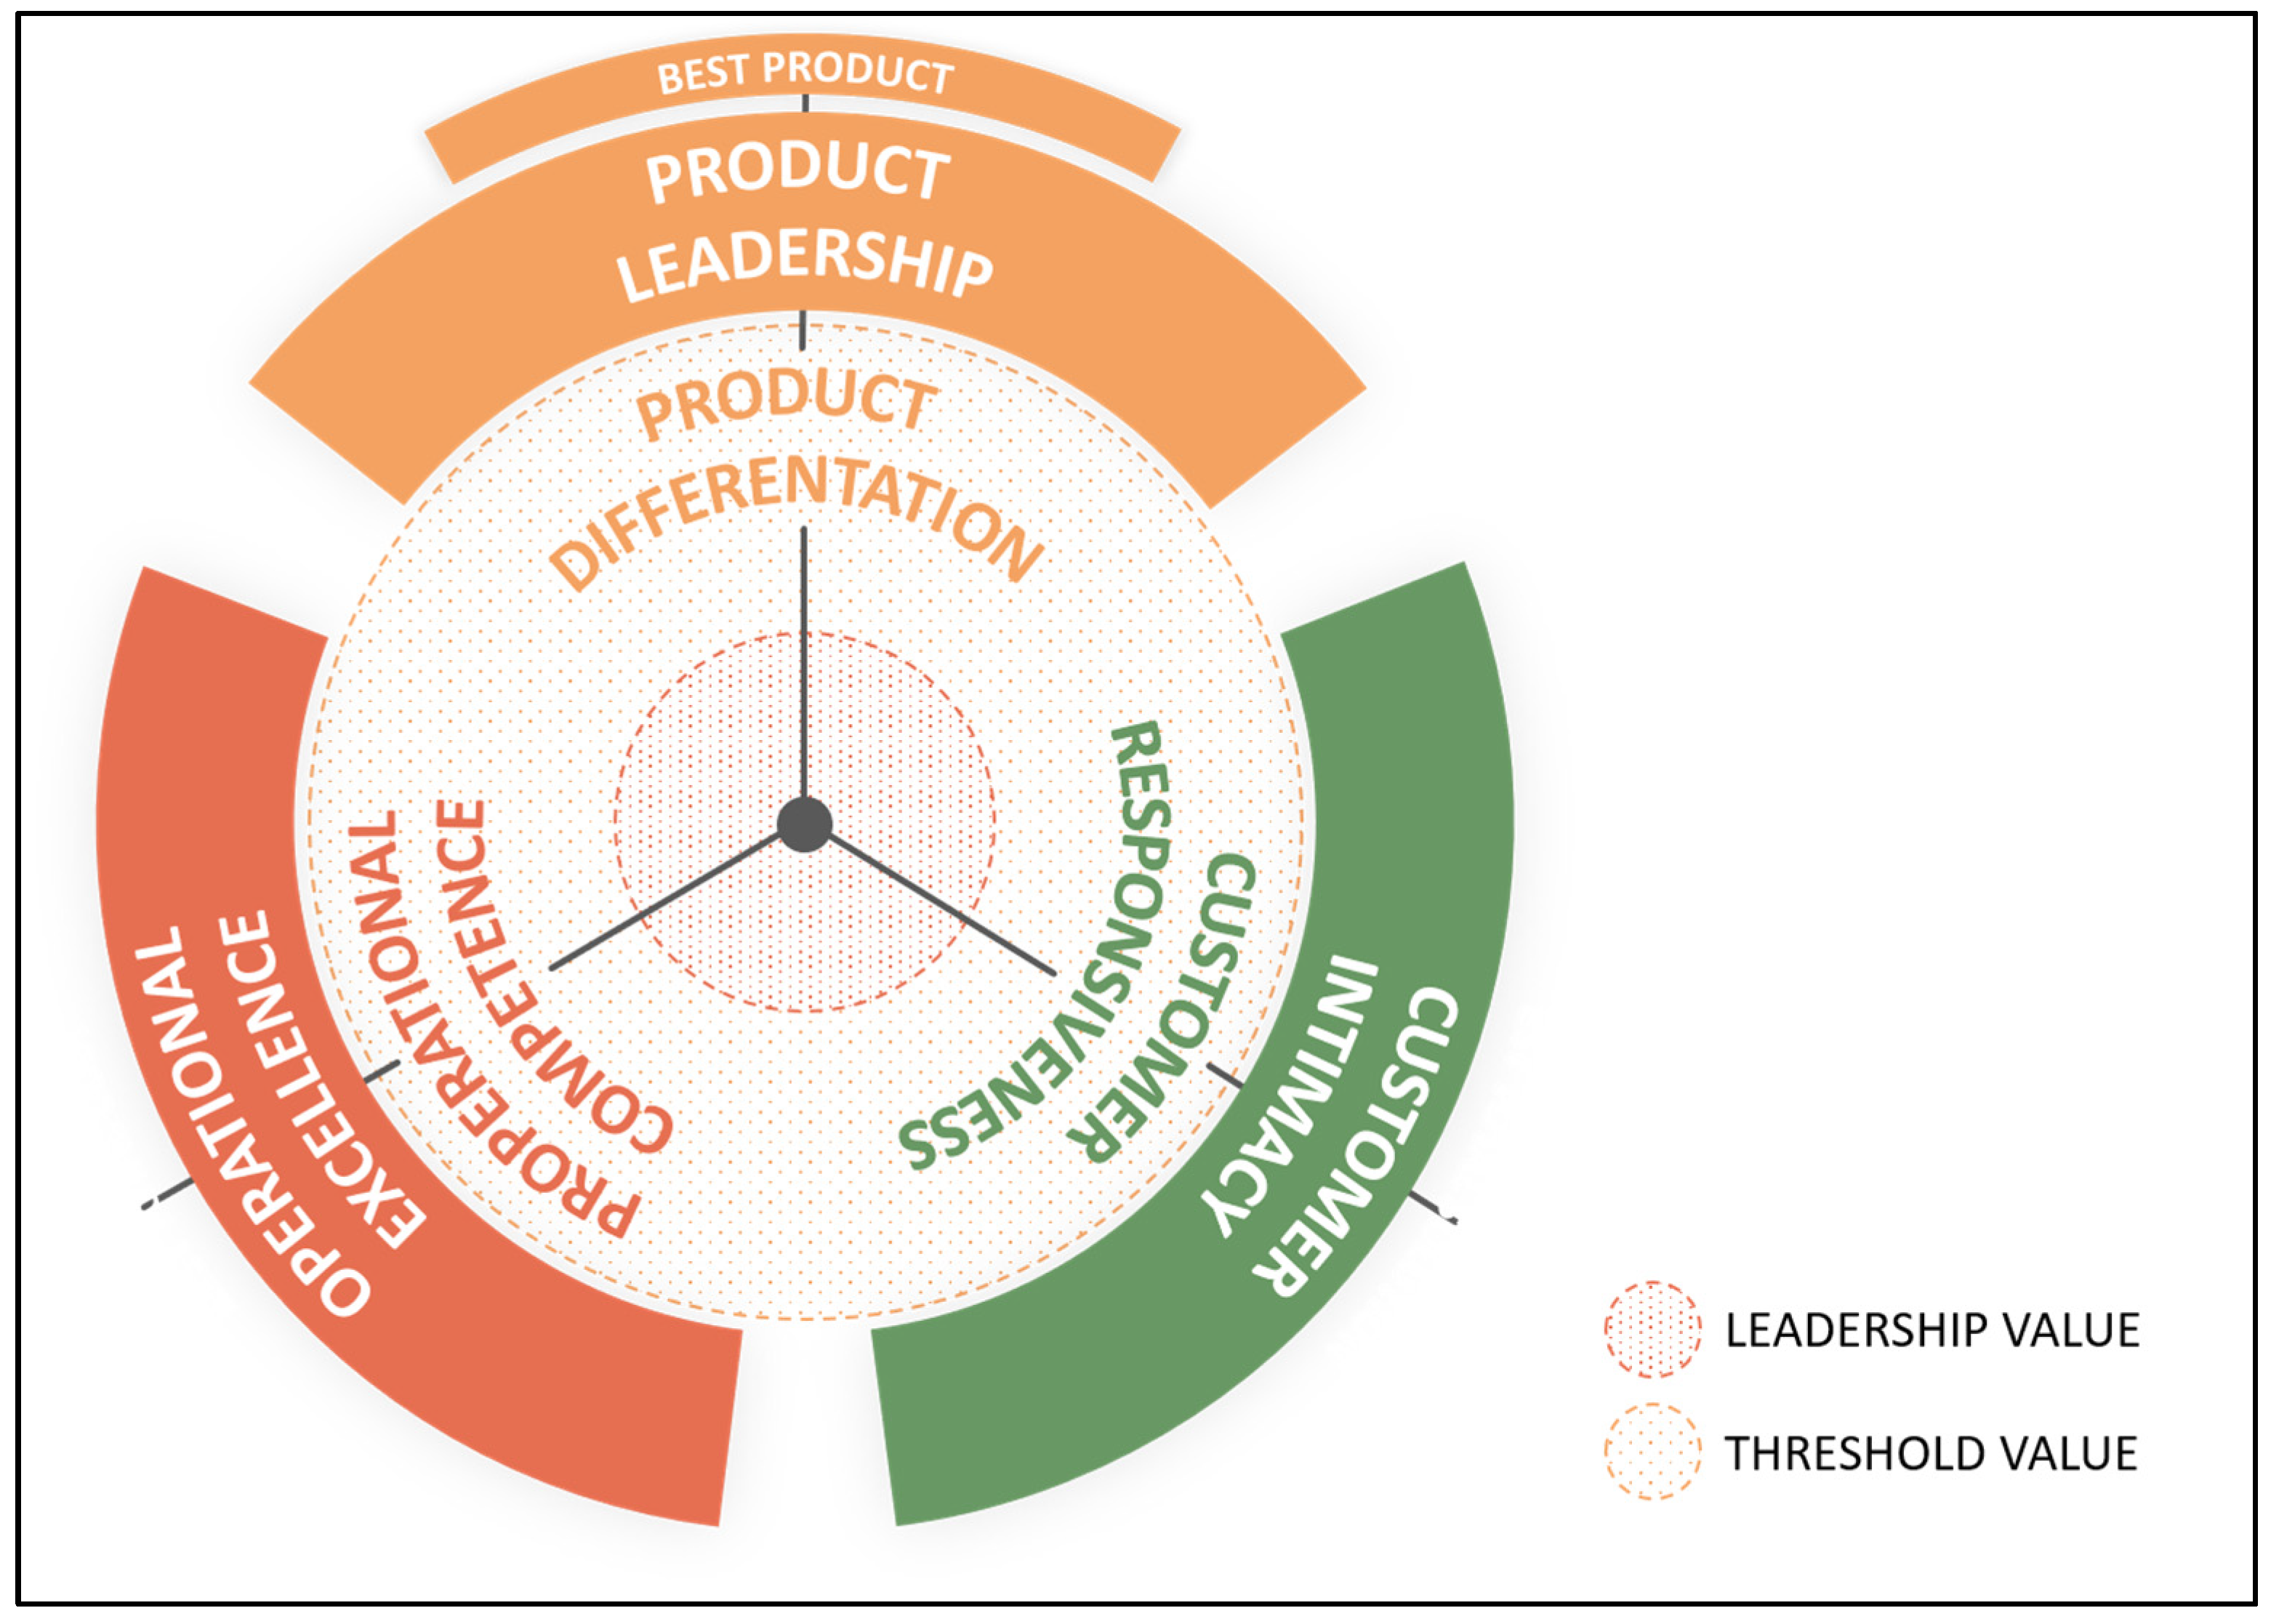
4.1. The Value Discipline Model
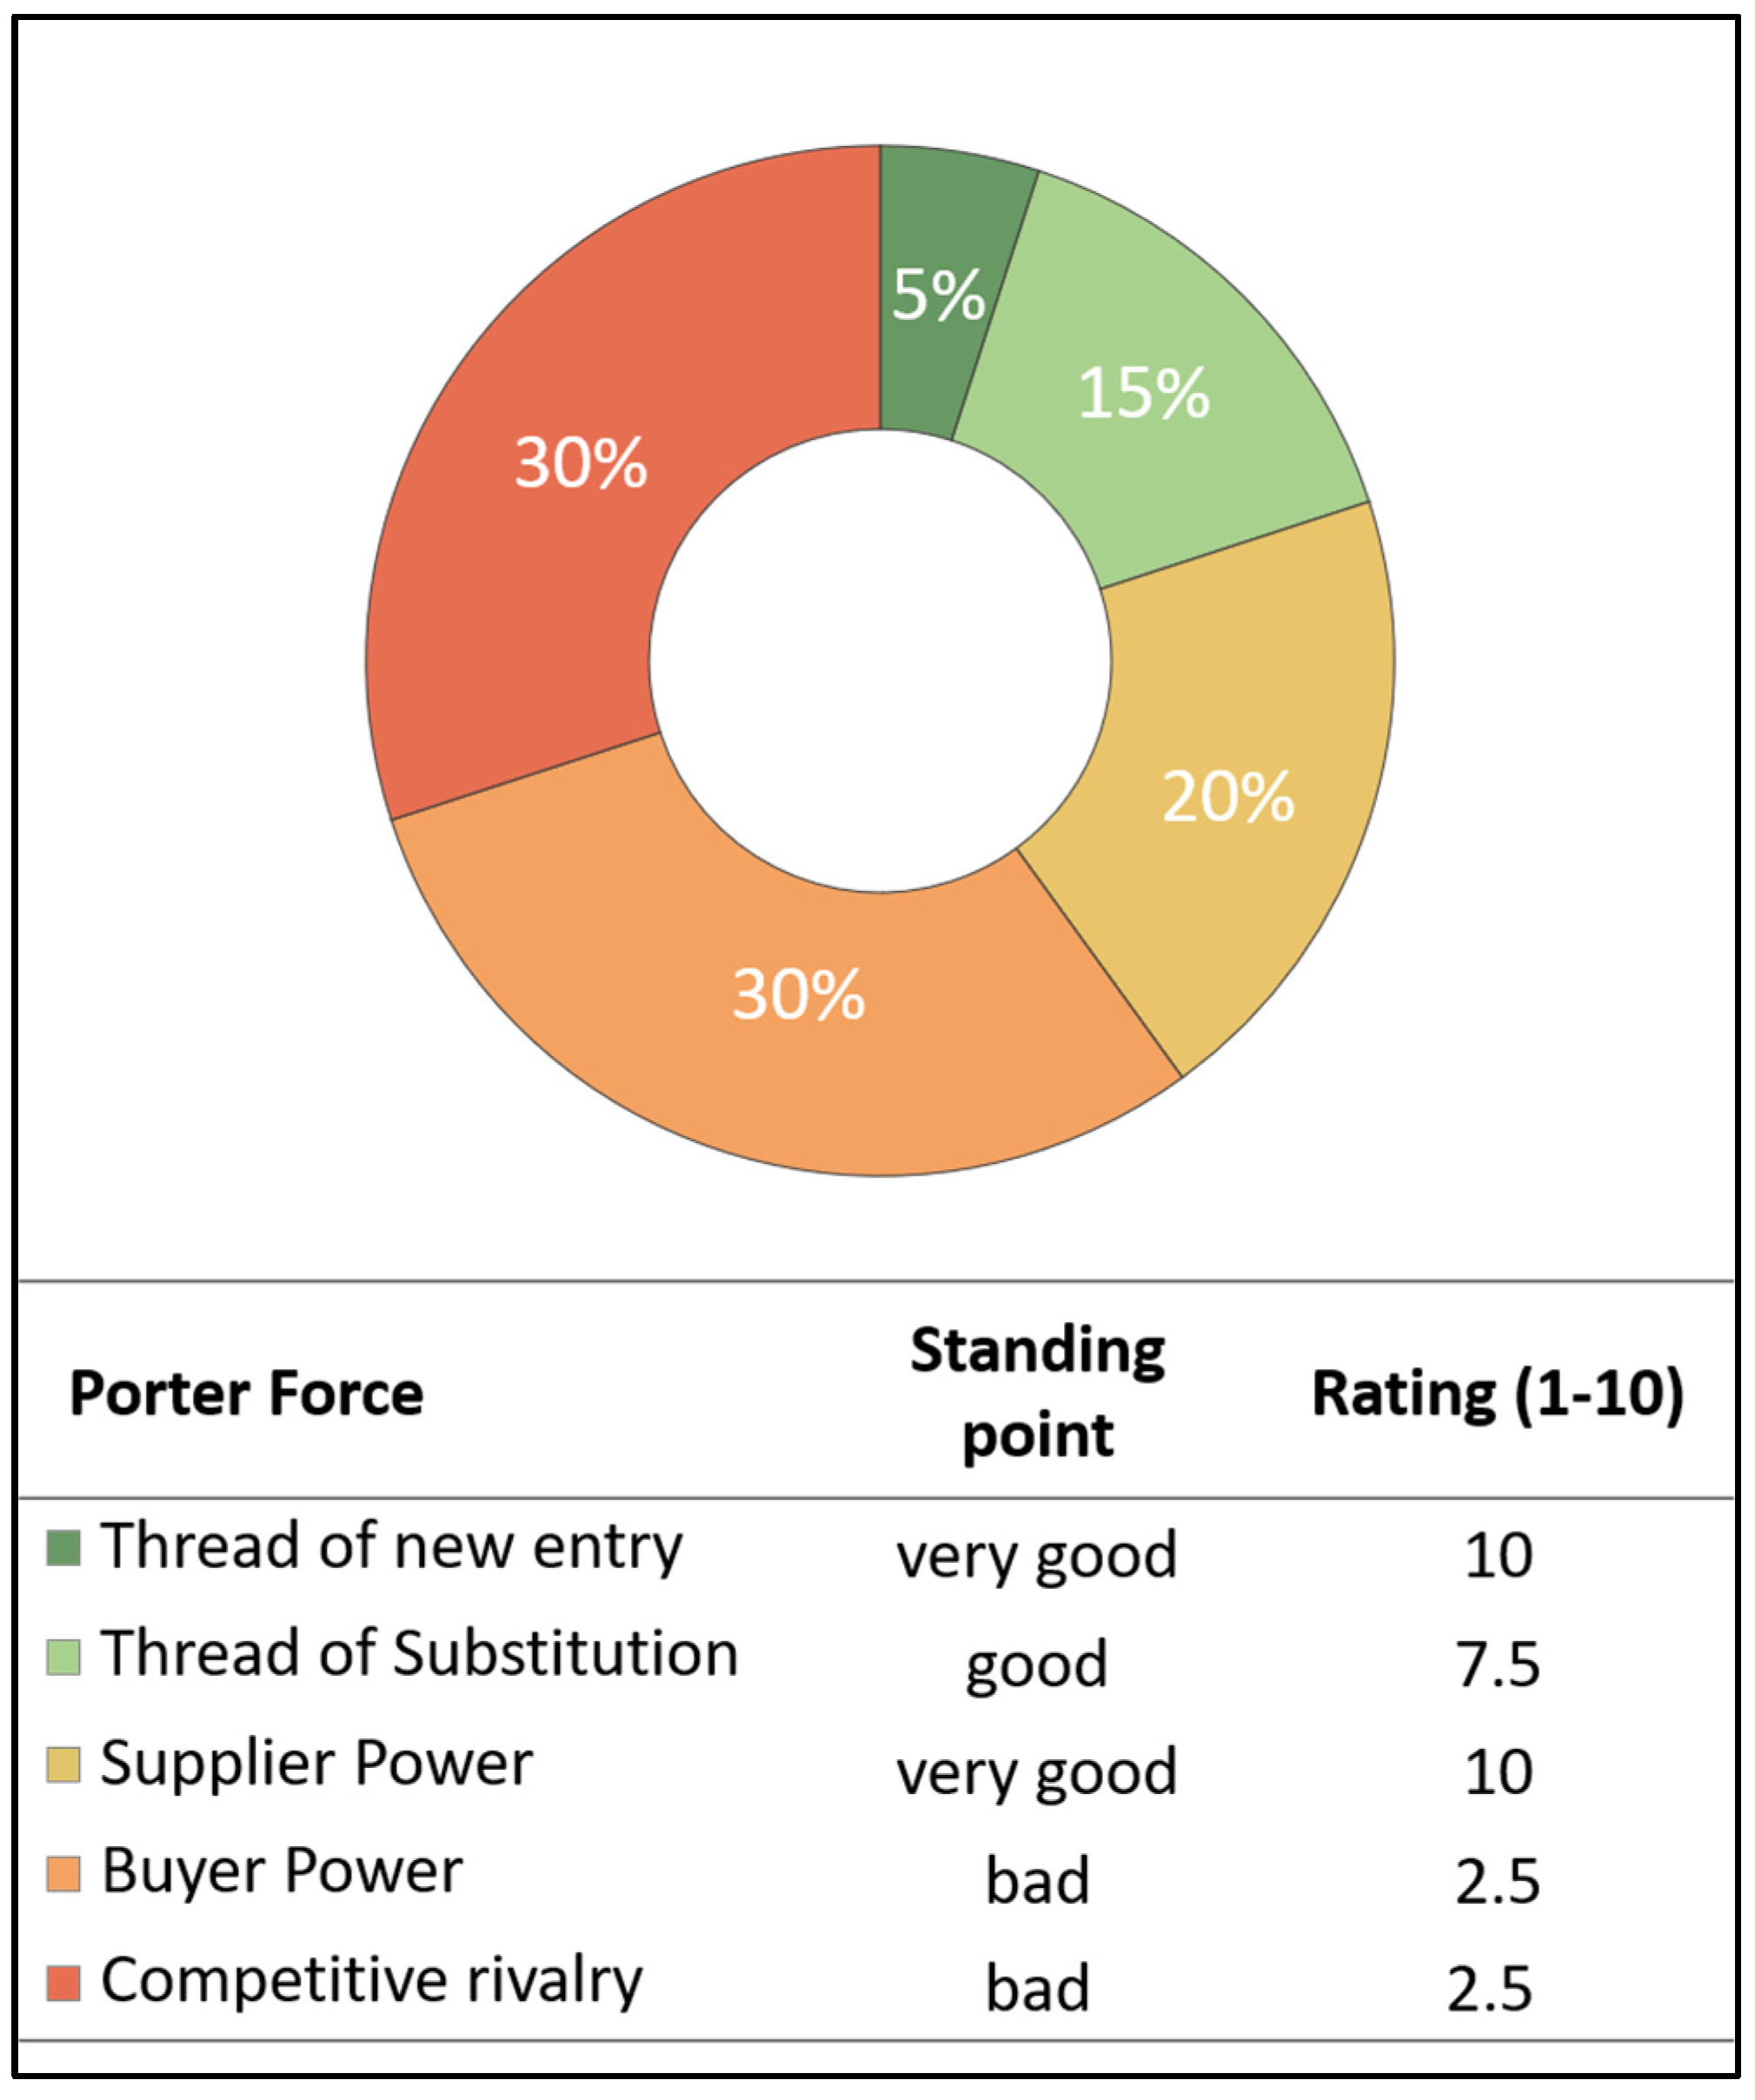
4.2. Porters 5 Forces Model
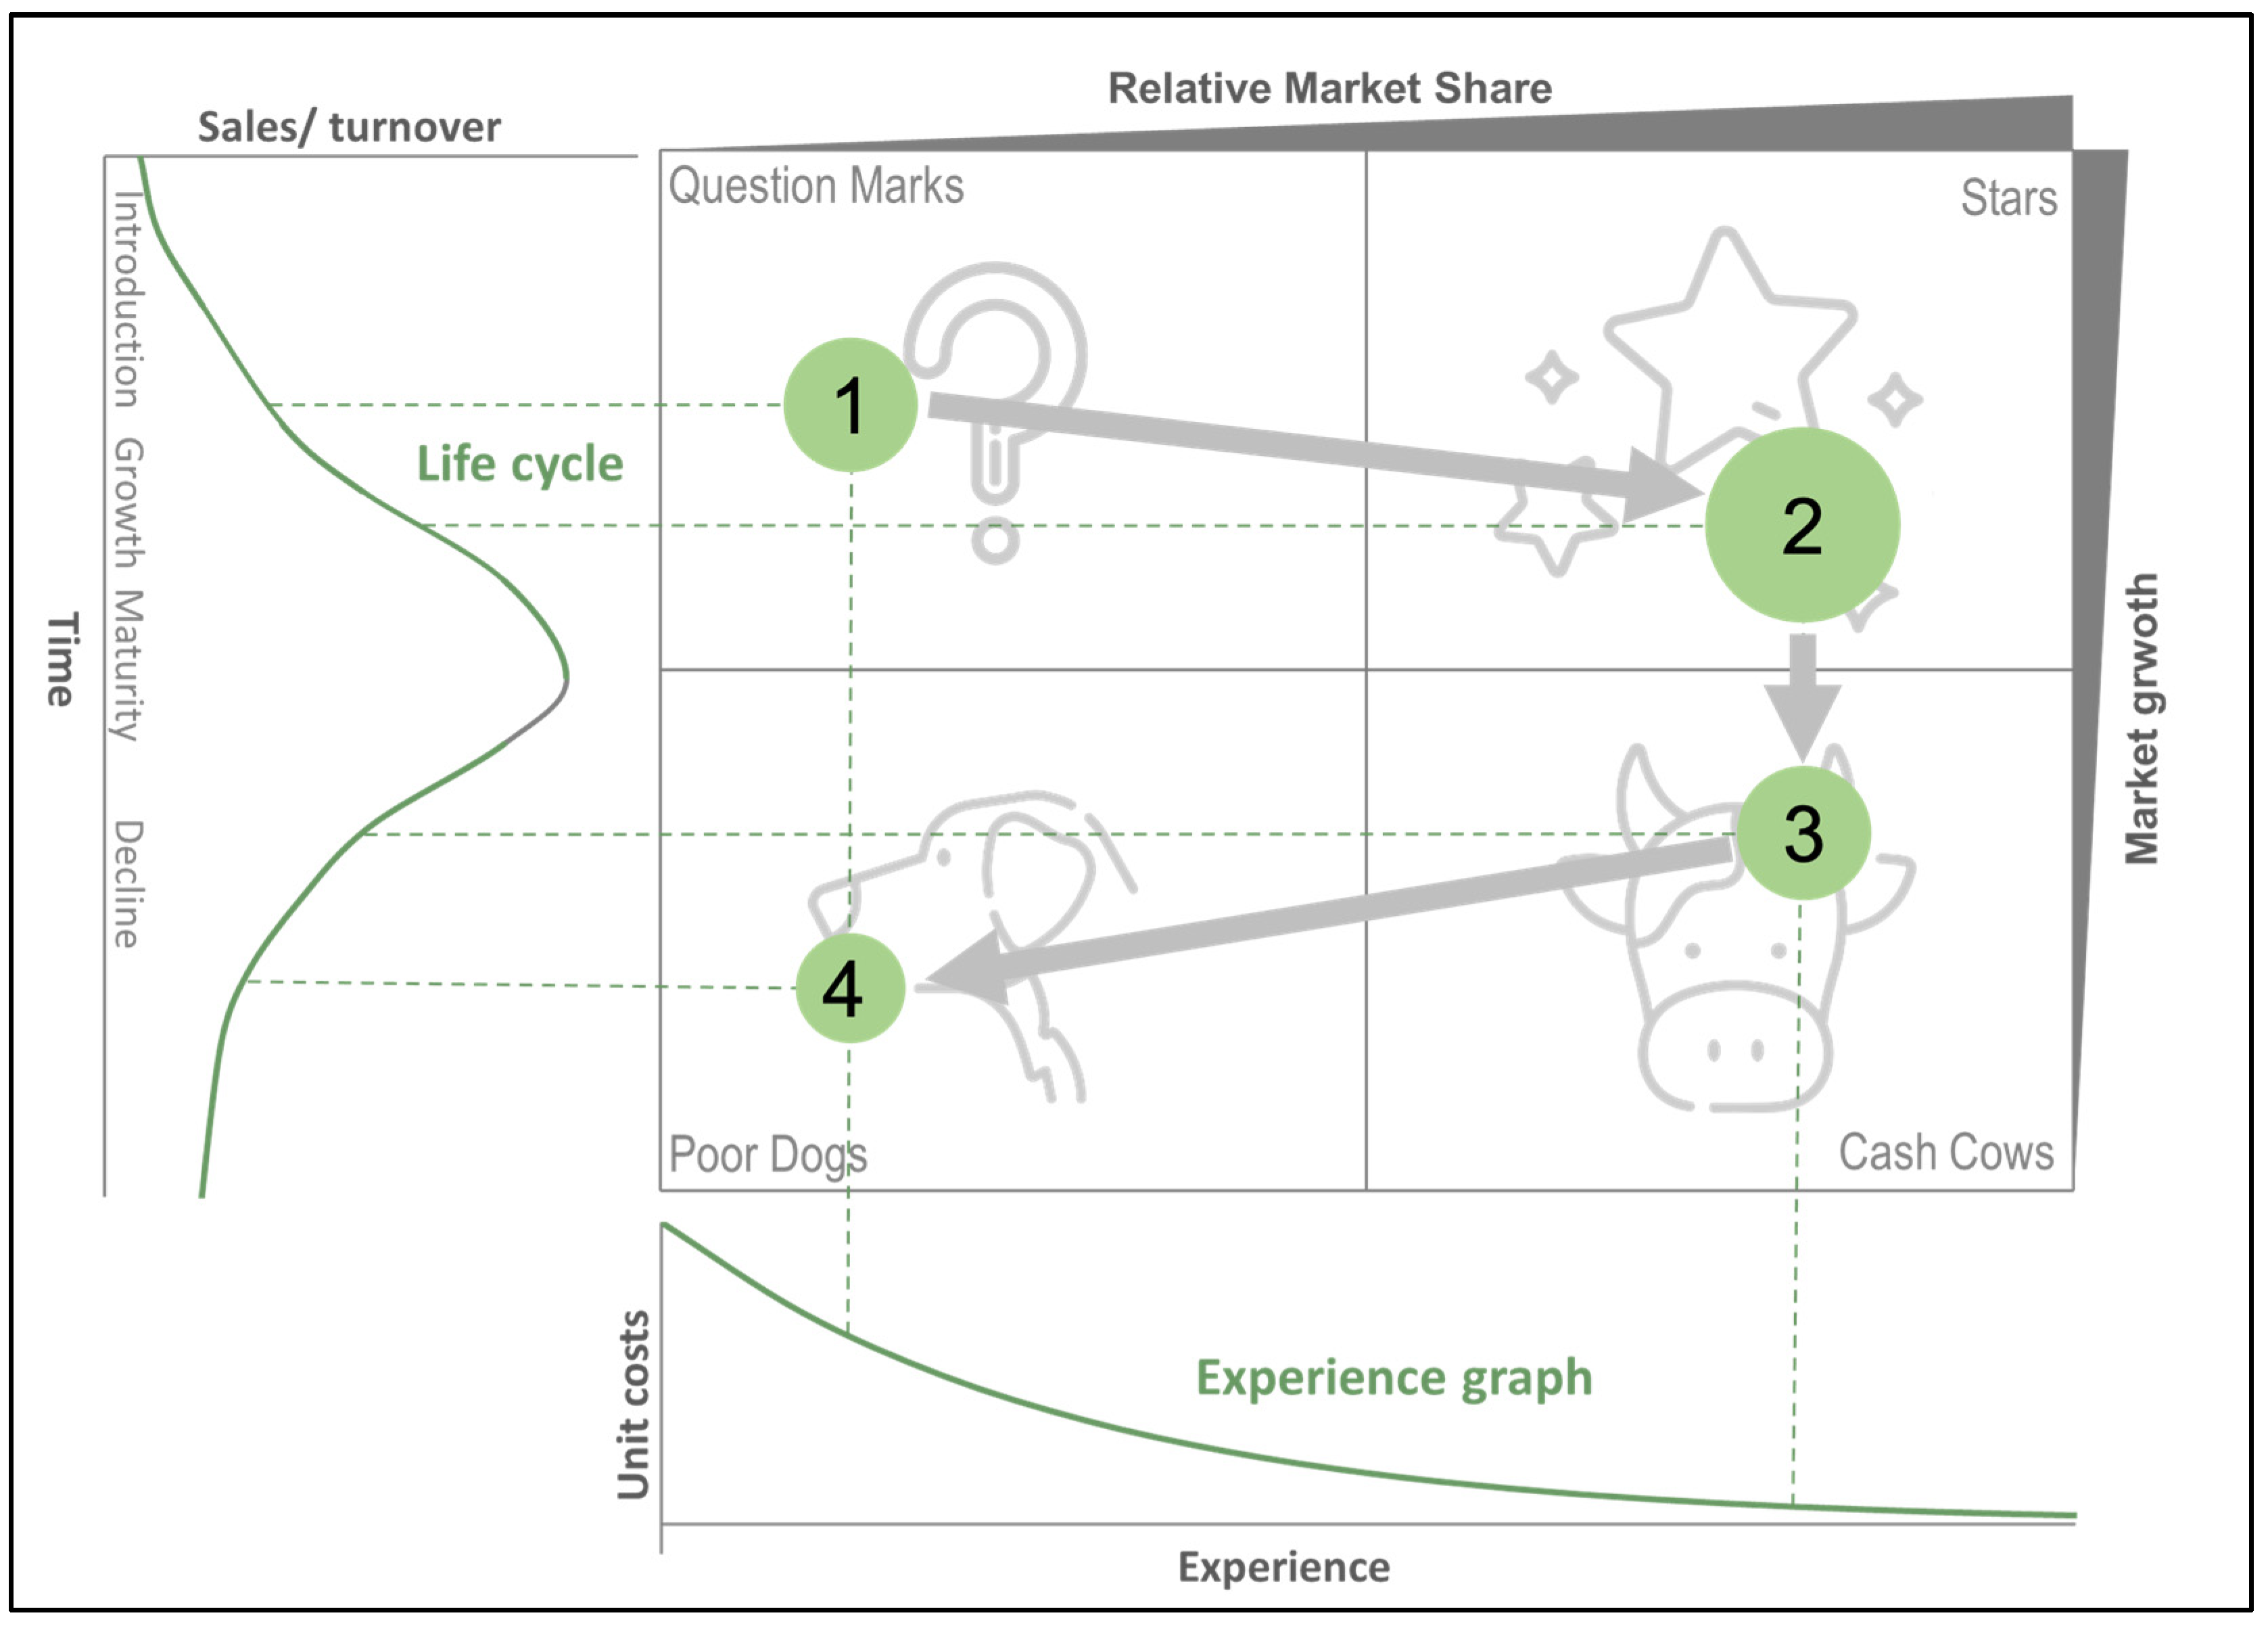
4.3. Growth-Share Matrix (BCG Matrix)
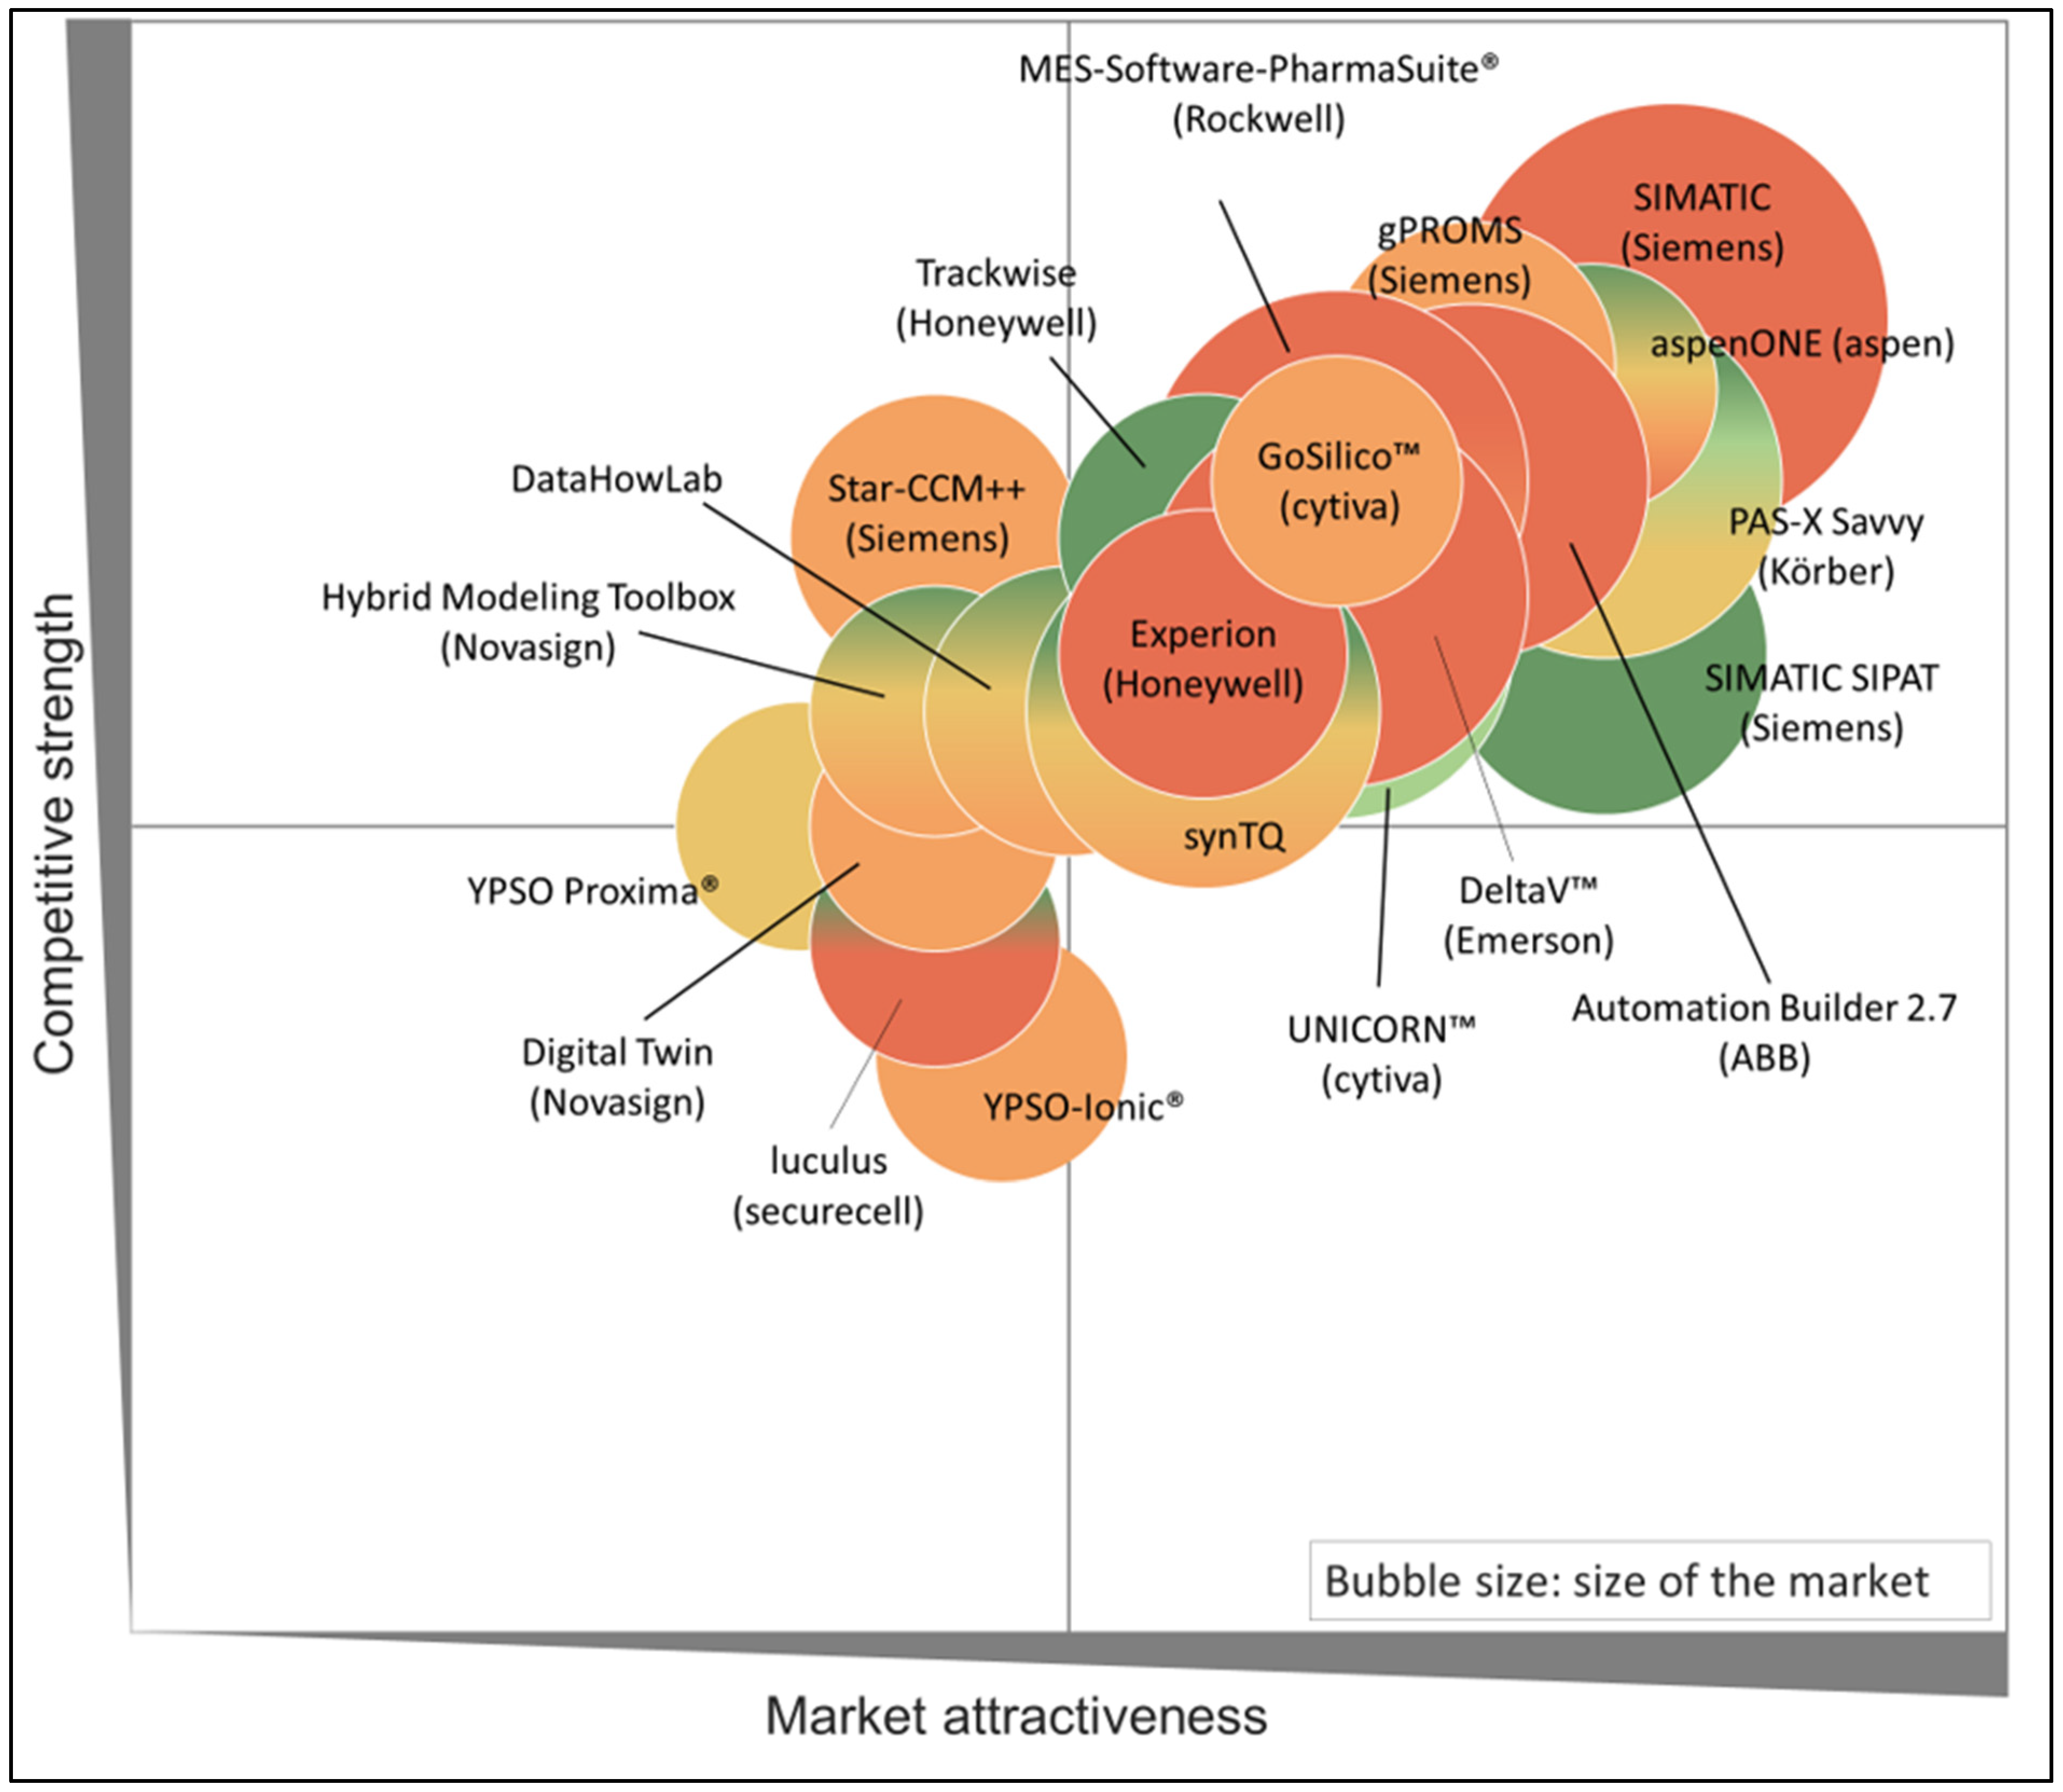
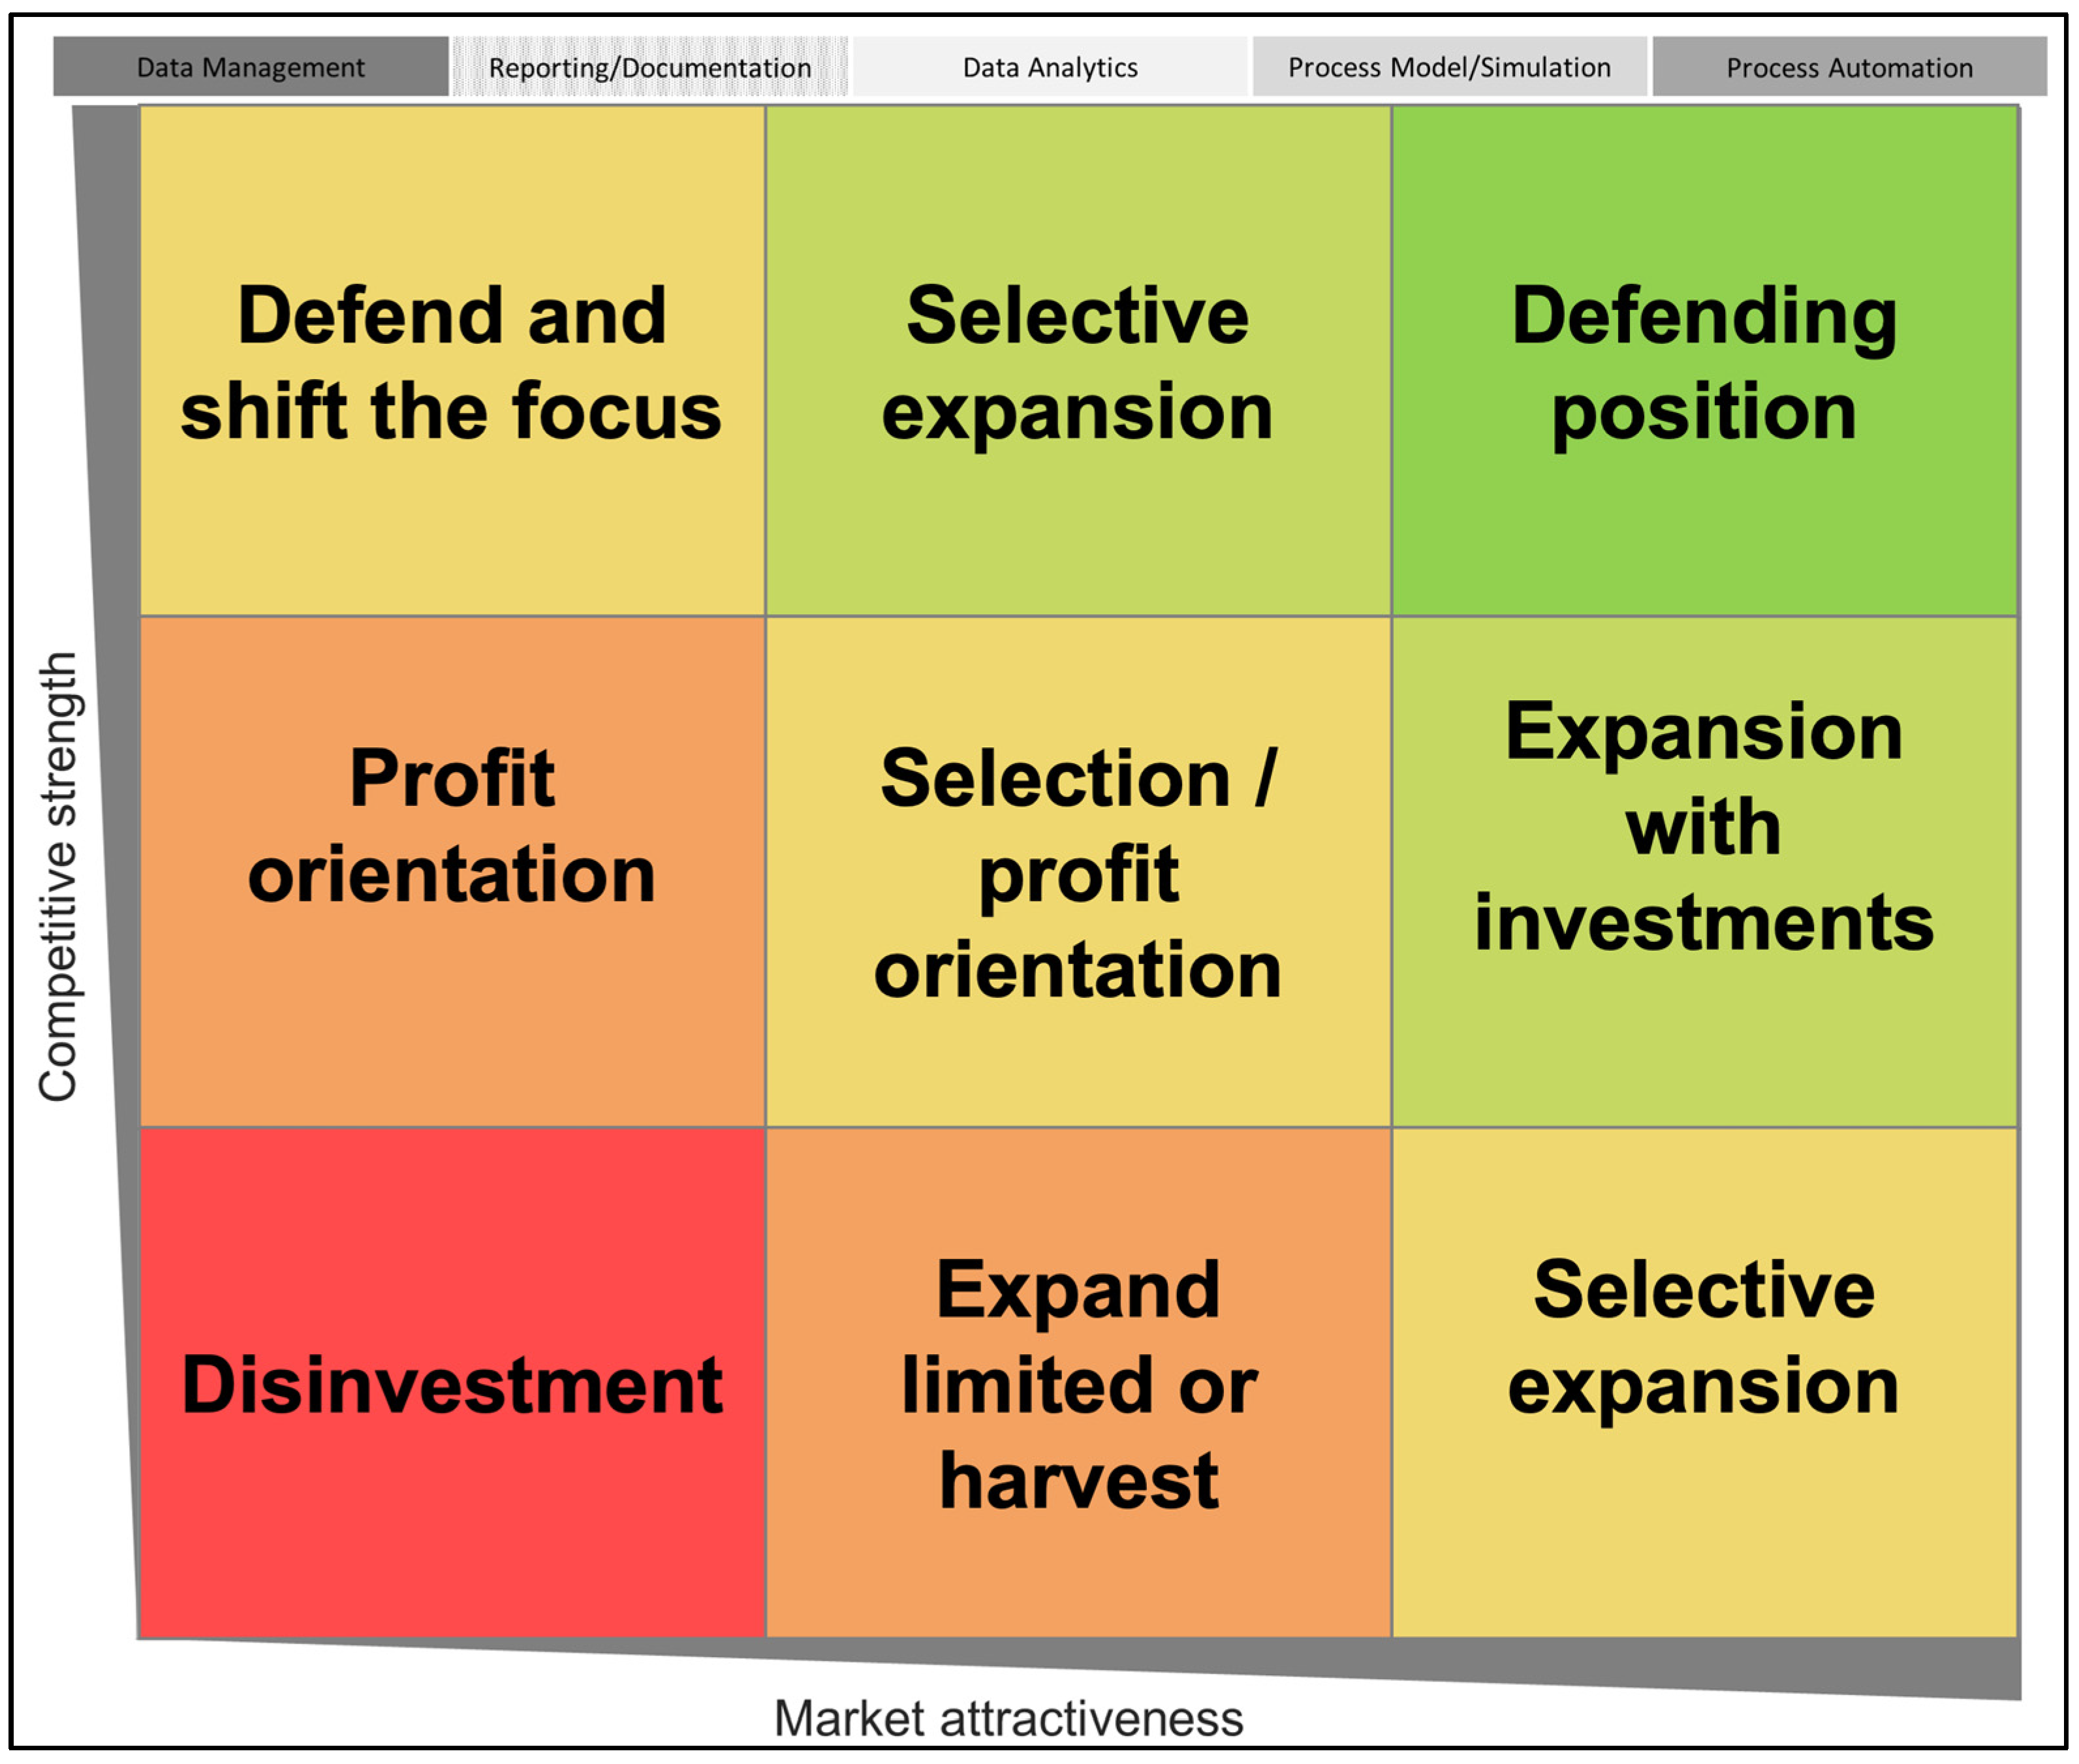
4.4. McKinsey Matrix
4.5. 7-S-Model (McKinsey)
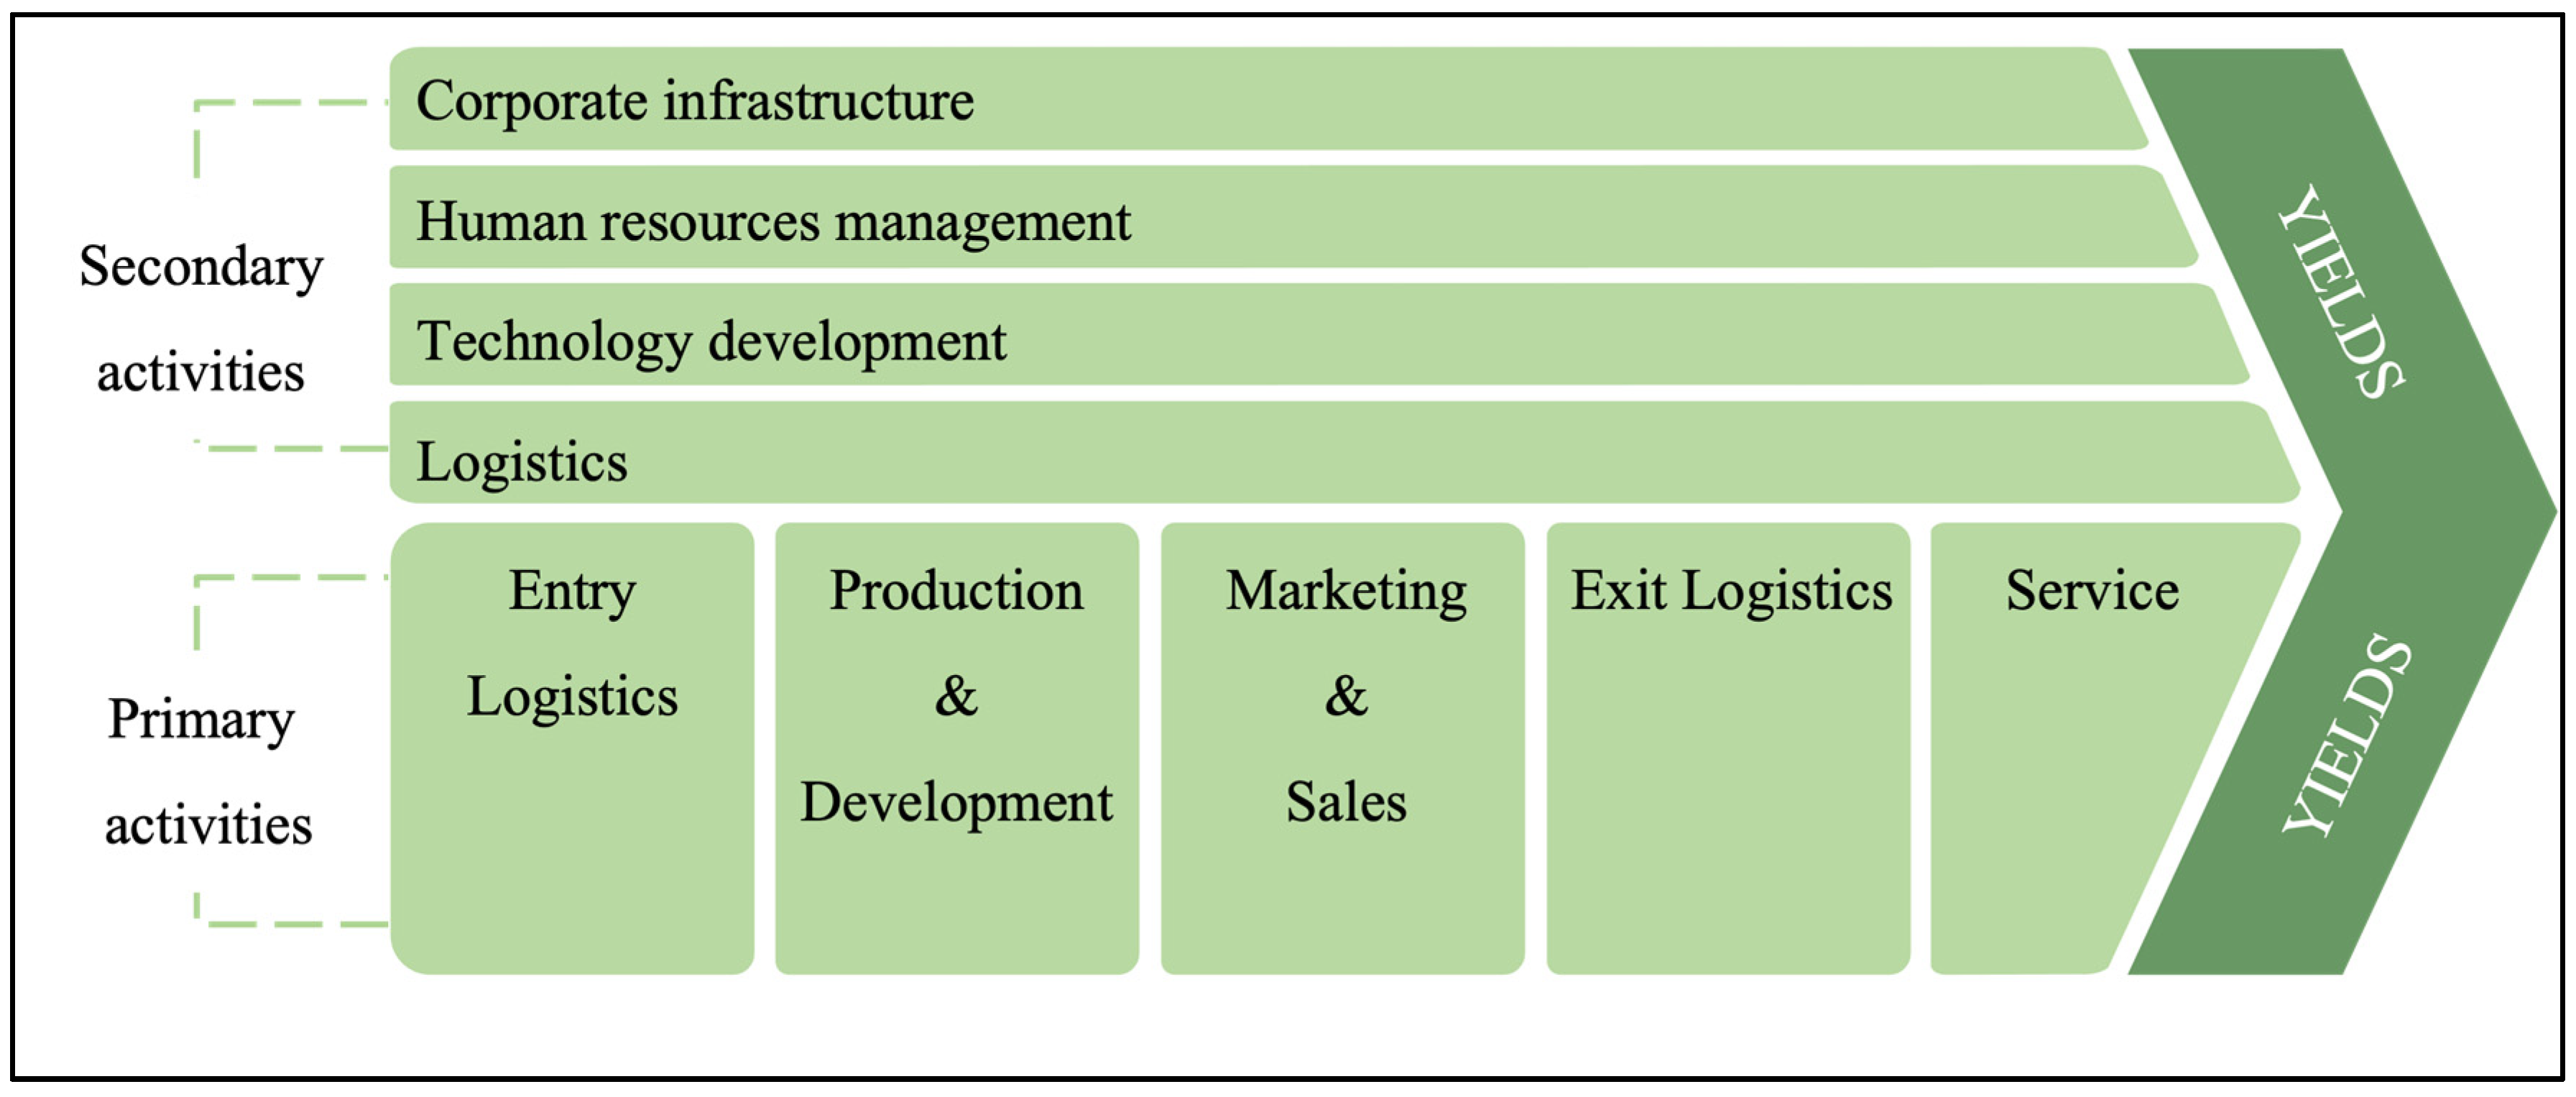
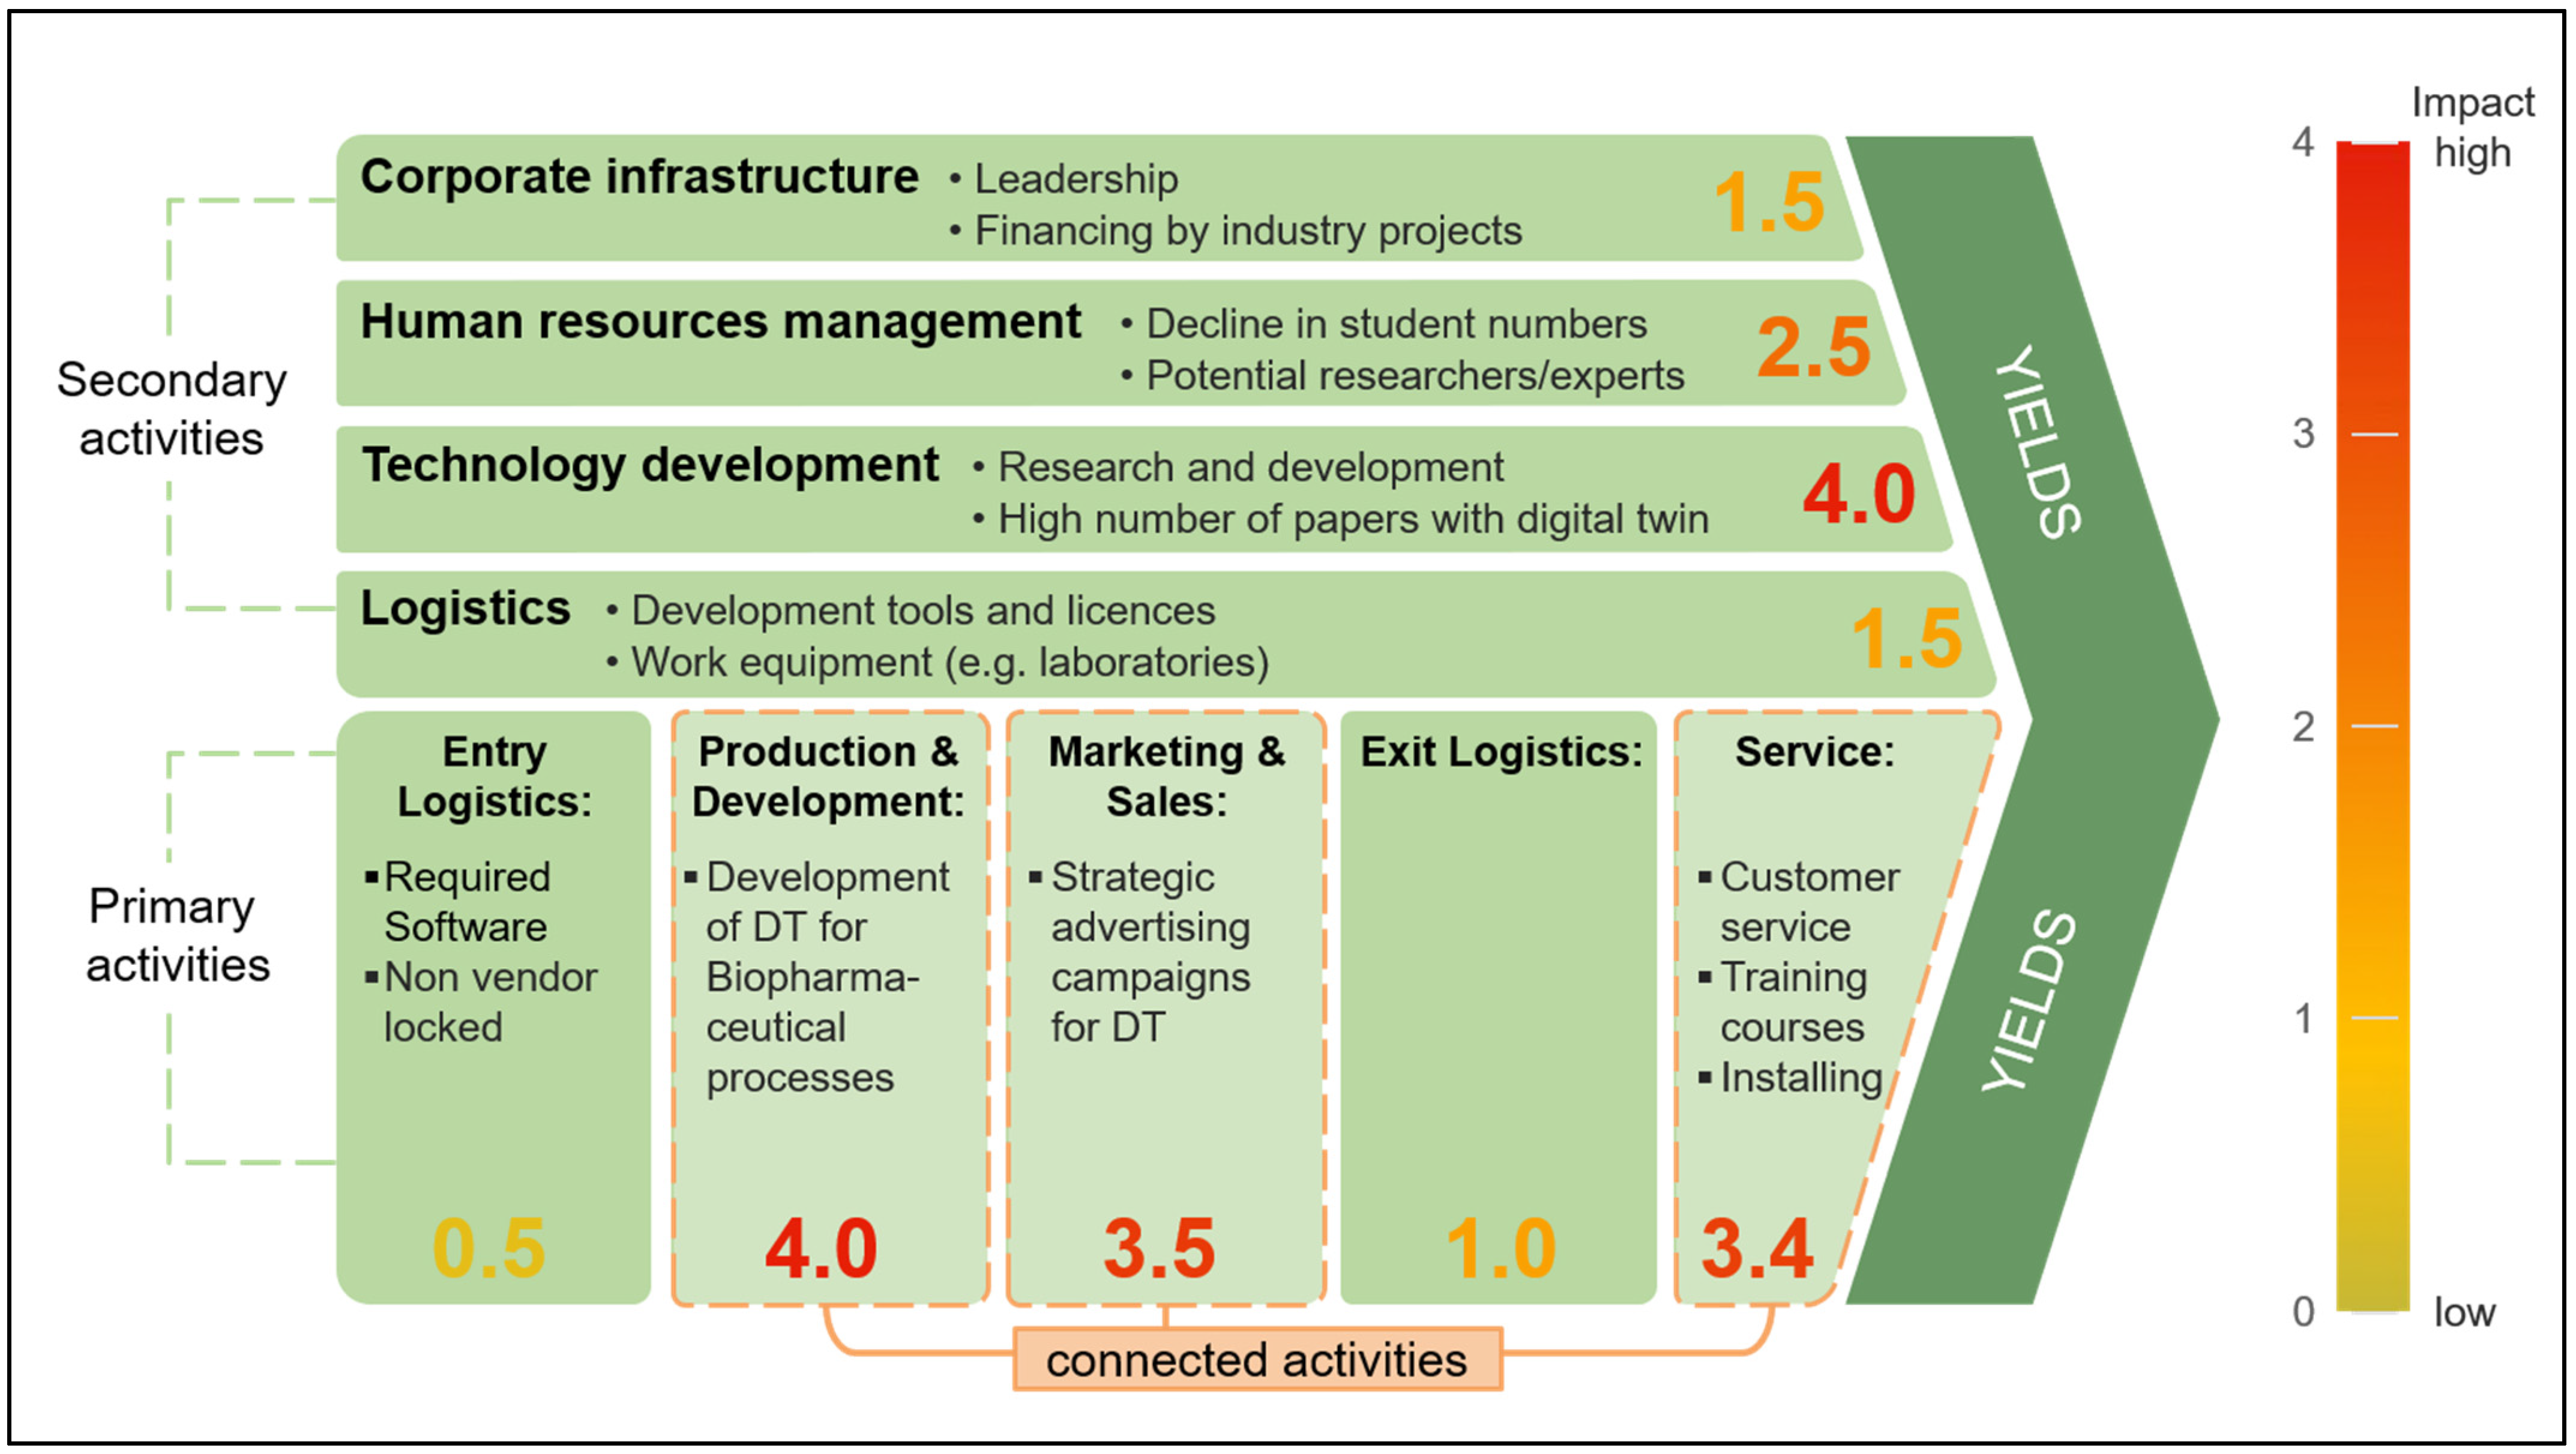
4.6. Value Chain Analysis Method (Porter)
5. Results
5.1. Analysis Environment
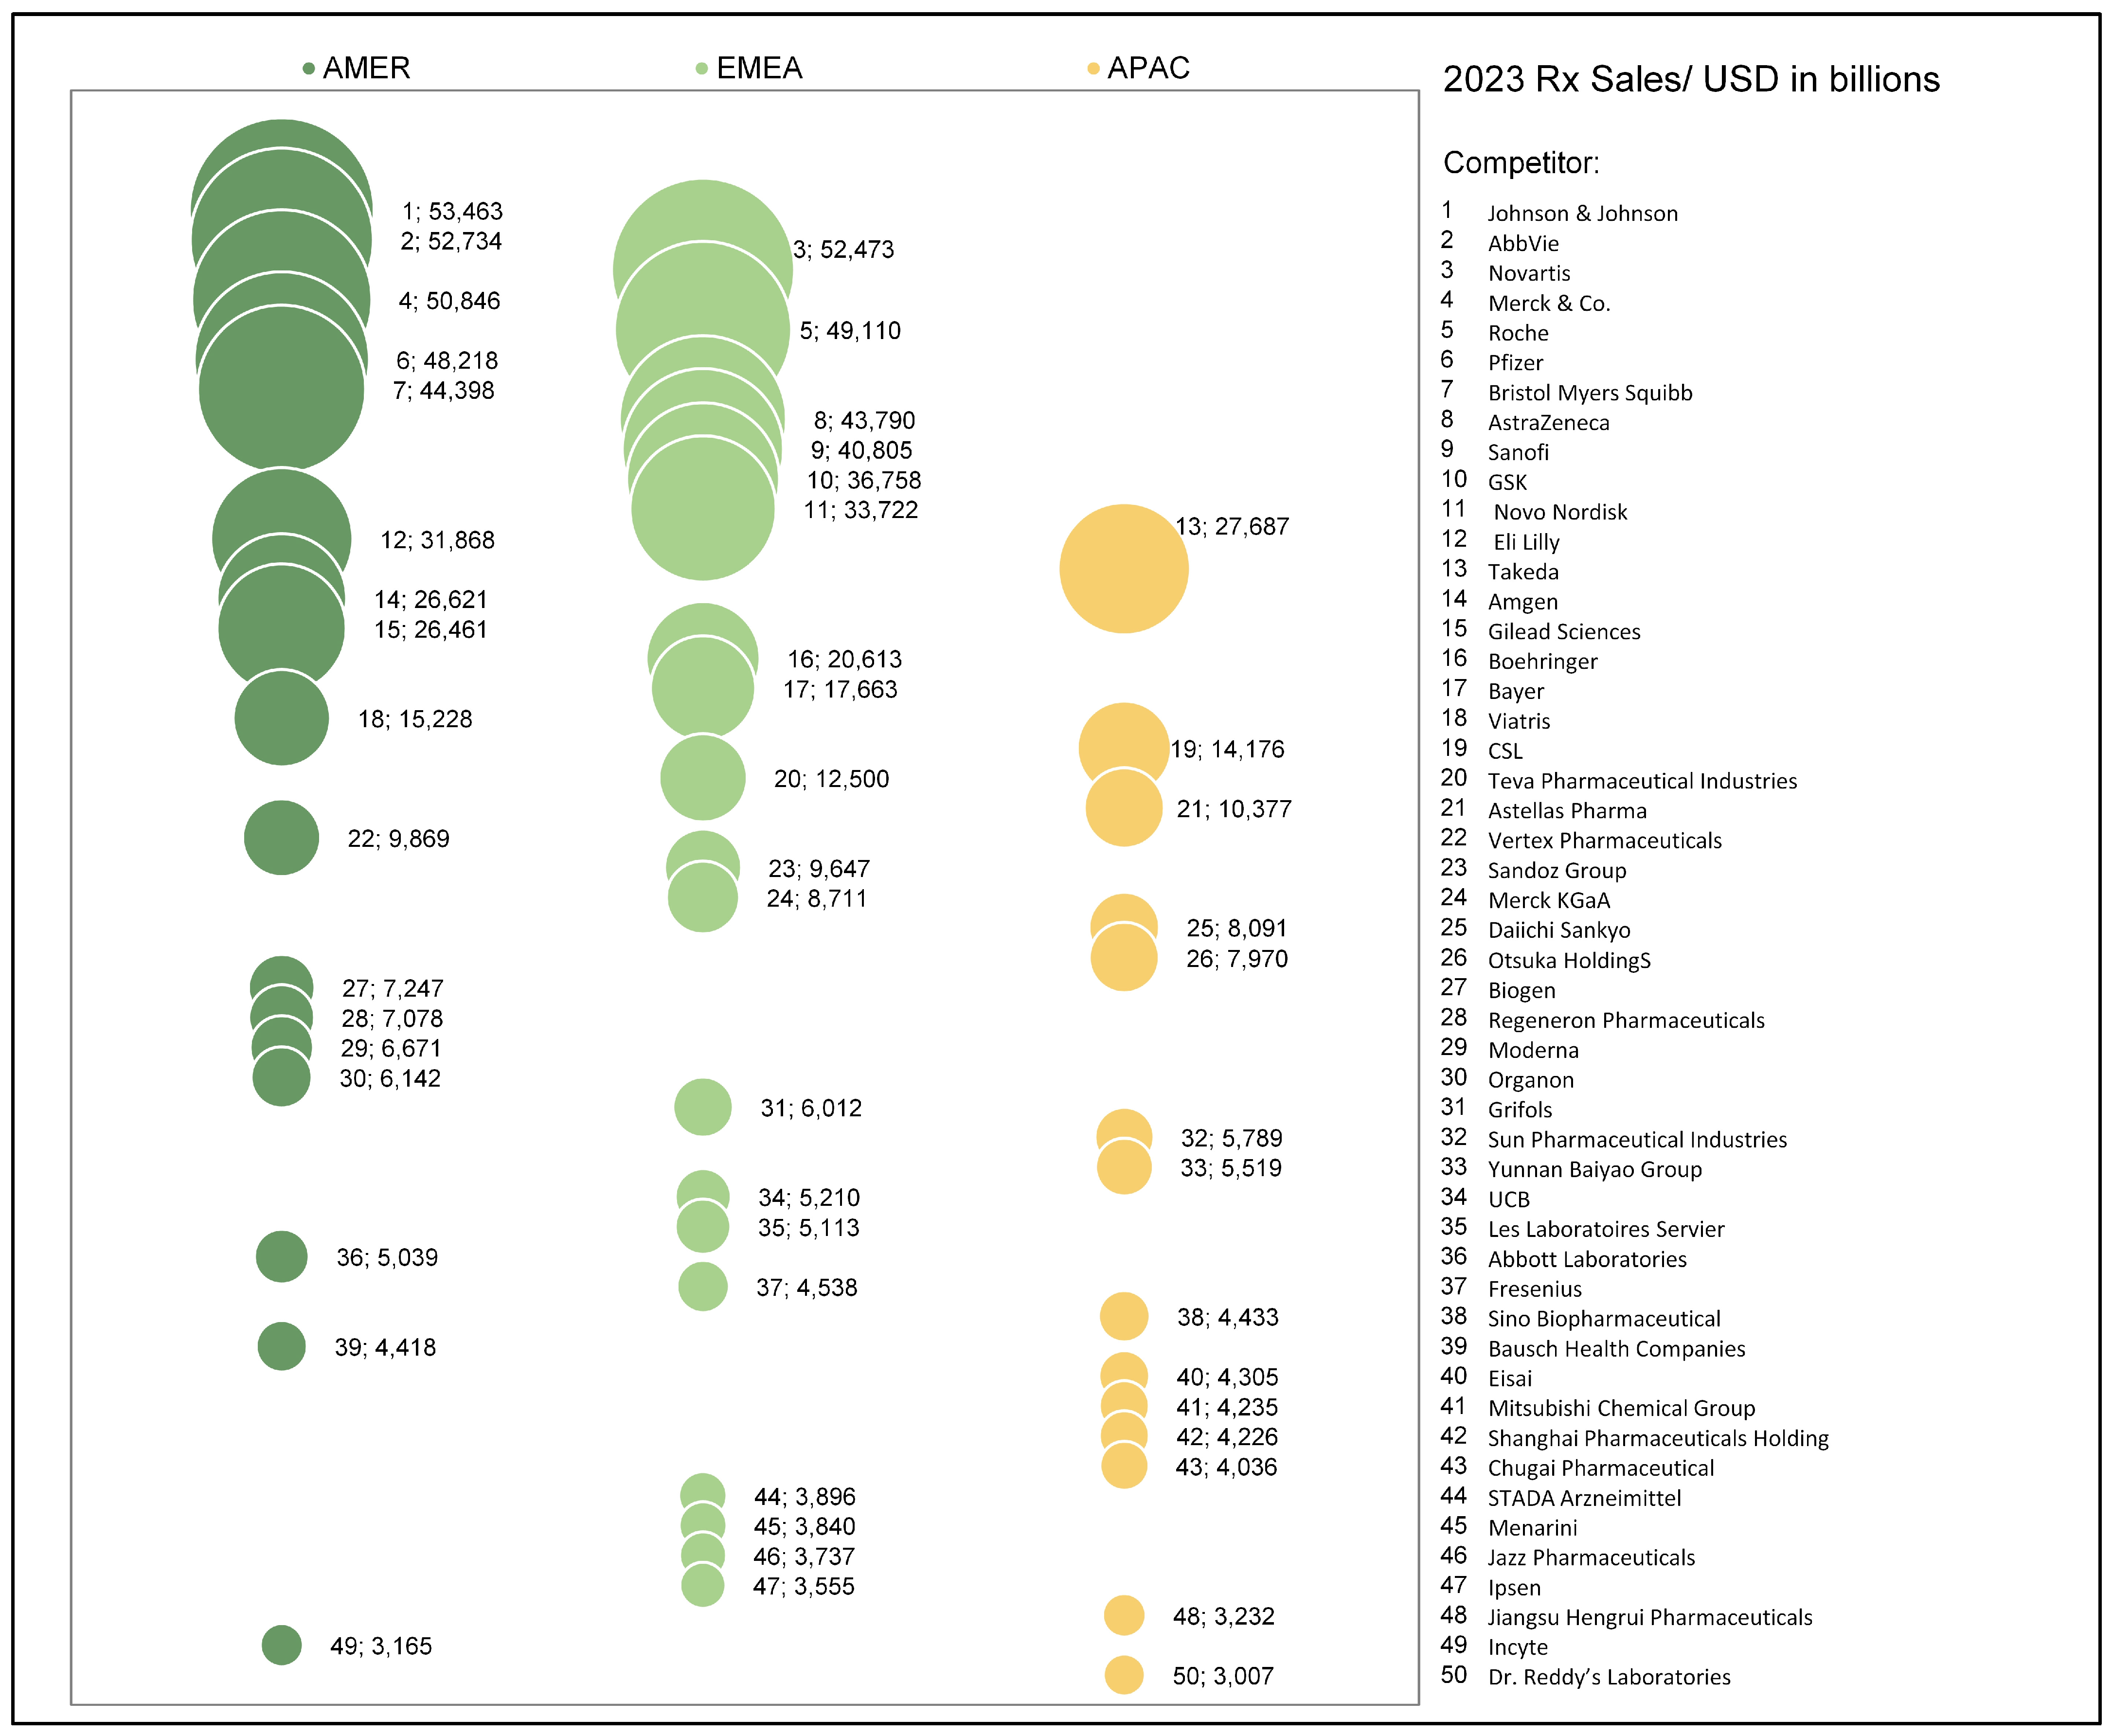
5.2. Analysis Industry
5.3. Analysis Company
5.3.1. Results of Value Chain Analysis (Porter)
5.3.2. BCG Market Growth–Share Matrix
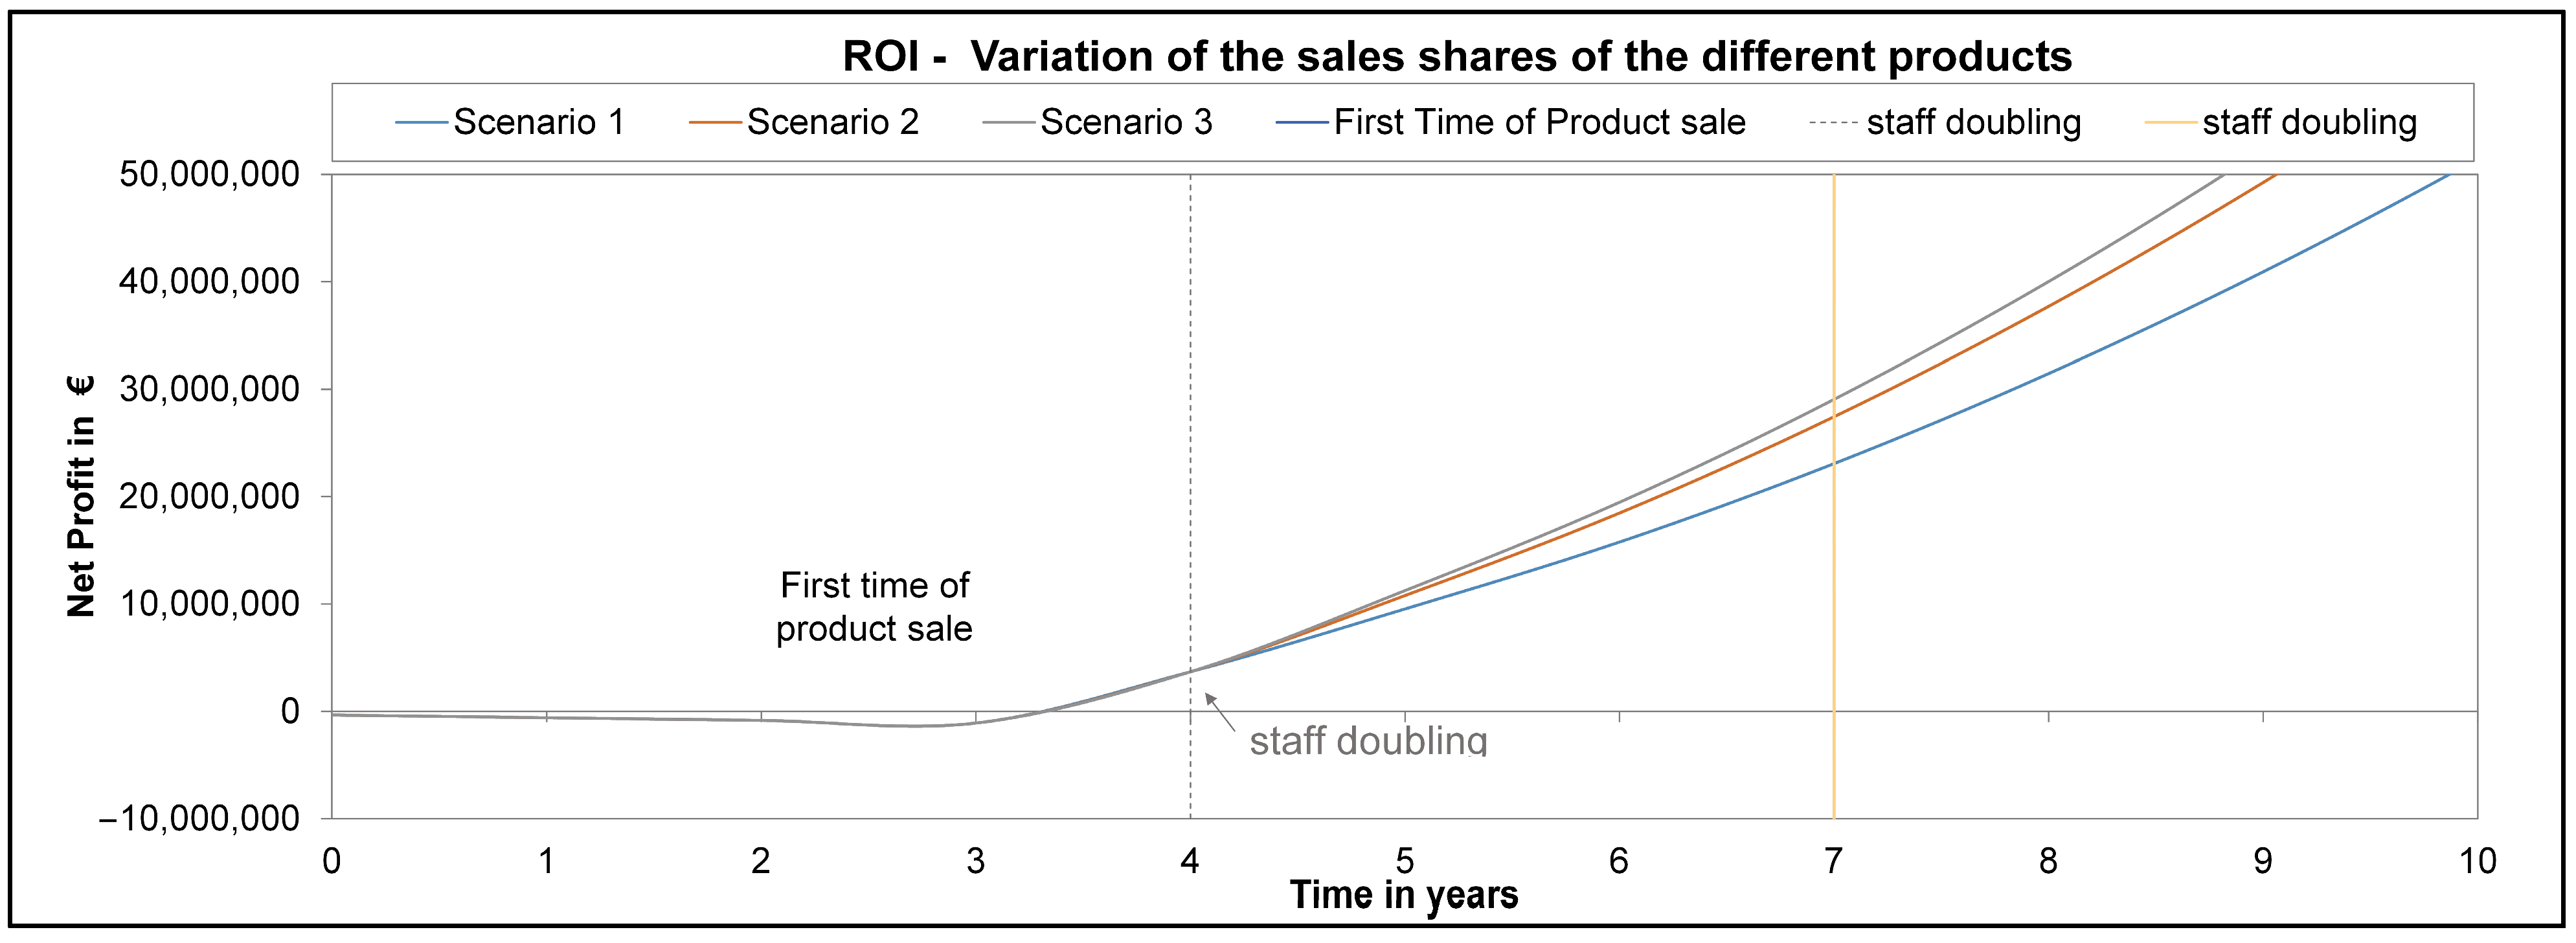
5.3.3. Return on Investment Studies
- “DS package”, which is a digital shadow package to implement at first a DS to get used to the technology, engineering, and consultant efforts, is either directly paid without any license strategy or with a license strategy;
- “DS package+” is the service above, but with an additional quality by design (QbD) control strategy without any PAT implemented, but a dedicated process control space, again with and without any license strategy options;
- “DT package” the final digital twin for model predictive control in order to automate operation, including the PAT approach under QbD, and 3 additional batches for validation of such
- −
- Scenario 1: No Market Growth
- In this scenario, the group begins with 4 employees, with staffing doubling after 4 and 7 years. There is no initial funding, and the first product sale occurs in year 4. Product distribution is 20% DS digital shadow Package, 60% DS Package+ (plus), and 20% DT digital twin Package, focusing on “DS Package+” due to market interest. The sale of five licenses annually results in a profit from the first year, with a Weighted Average Cost of Capital (WACC) of 6.5%.
- −
- Scenario 2: Market Growth and Decline of Product Type Demands
- This scenario considers a 20% growth in “DS Package+”, a 40% growth in “DT Package”, but a 20% decline in “DS Package”. Profit is achieved from the first year, with results showing a 13.08% to 20.8% increase in annual revenue compared to Scenario 1.
- −
- Scenario 3: Significant Growth for “DT Package”
- Here, “DT Package” experiences 100% growth, while sales of “DS Package” and “DS Package+” remain steady. Profit increases with each year, assuming regulatory approval for digital twins, making it a realistic scenario attractive to the industry. This results in a 17.87% to 28.63% increase in annual revenue compared to Scenario 2.
6. Conclusions
Author Contributions
Funding
Data Availability Statement
Acknowledgments
Conflicts of Interest
Abbreviations
| AMER | America |
| APAC | Asia Pacific |
| ASME | American Society of Mechanical Engineers |
| BCG | Boston Consulting Group |
| BLA | Biologics license application |
| CDMO | contract development and manufacturing organizations |
| COG | Cost-of-Goods |
| CPP | Critical process parameter |
| CSV | Computerized systems validation |
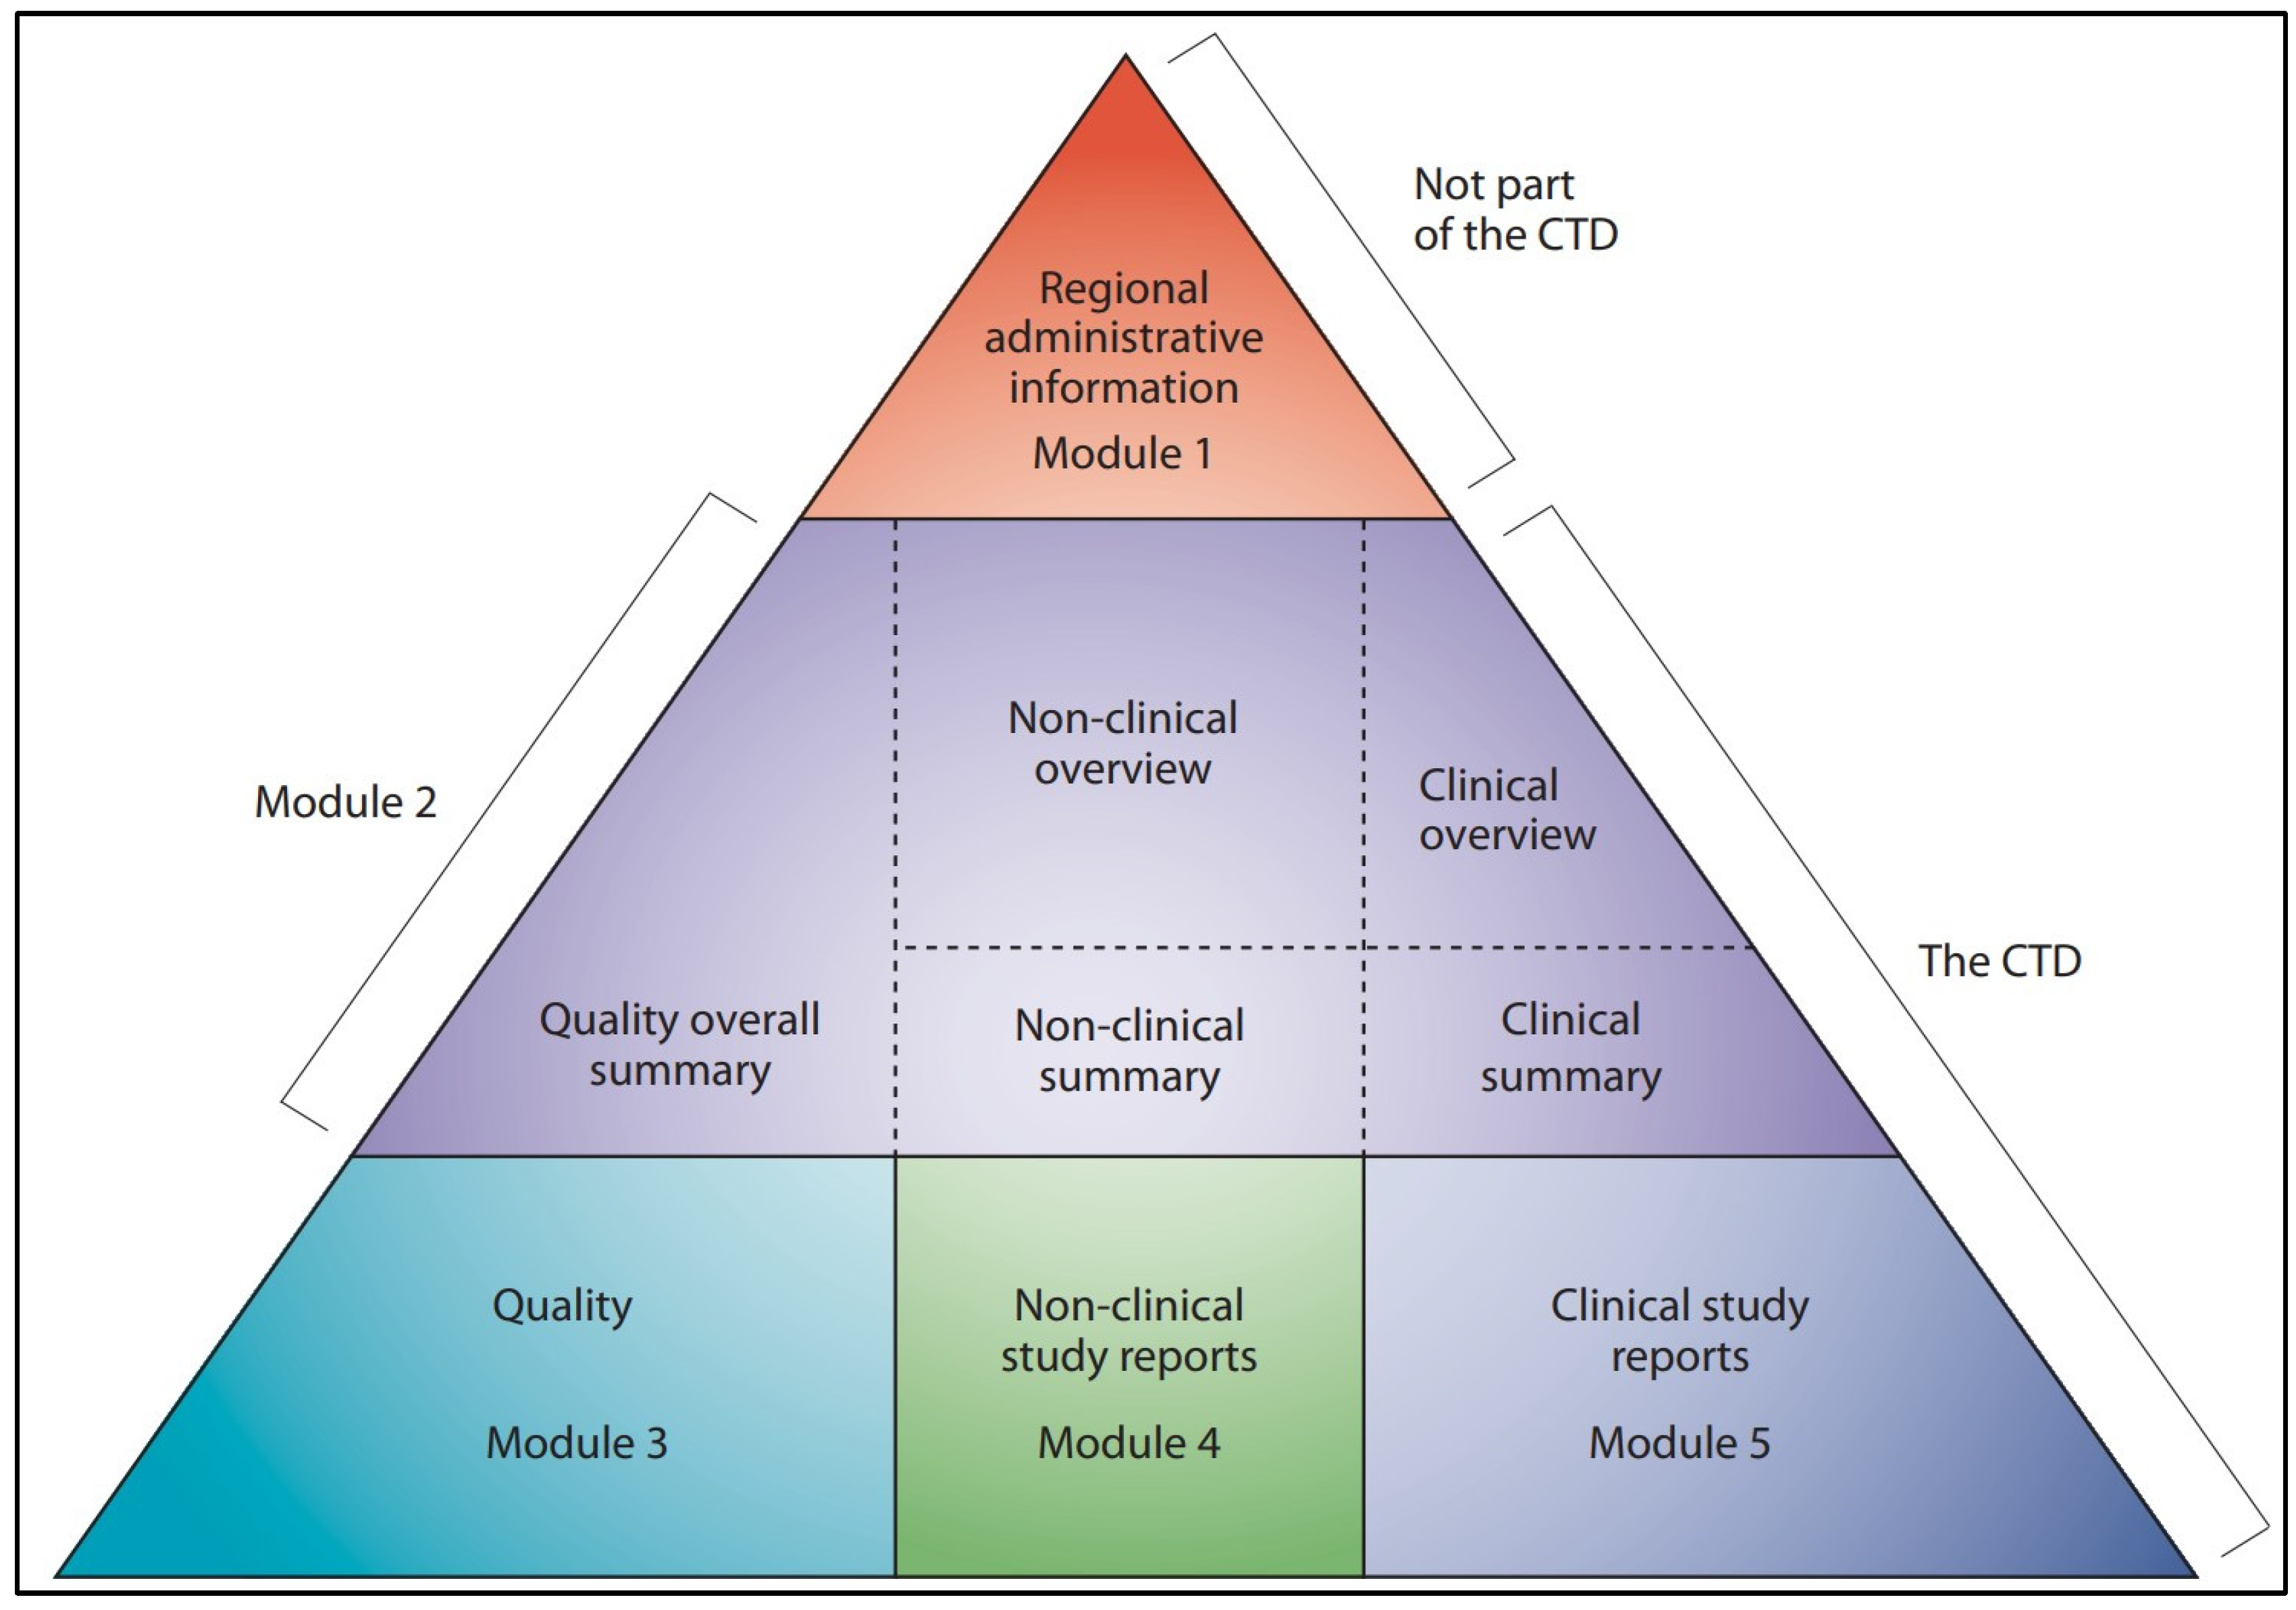
| CTD | Common technical document |
| DCS | Distributed control system |
| DS | Digital Shadow |
| DT | Digital Twin |
| EHC | Electrolysis of hydrogen and carbon dioxide |
| EMA | European Medicines Agency |
| EMEA | Europe, Middle East, and Africa |
| ERP | Enterprise resource planning |
| FDA | U.S. Food and Drug Administration |
| GAMP | Good Automated Manufacturing Practice |
| GWP | Global Warming Potential |
| HMI | Human–machine interface |
| ISPE | Society for Pharmaceutical Engineering |
| MES | Manufacturing execution system |
| MP | Methanol pyrolysis |
| NME | New molecular entity |
| OTC | Over-the-counter |
| PAT | Process Analytical Technology |
| PLC | Programmable logic controller |
| PMI | Process Mass Intensity |
| QA | Quality assurance |
| QbD | Quality-by-Design |
| R&D | Research and development |
| ROI | Return-of-Investment |
| Rx | Prescription drug |
| SBU | Strategic business unit |
| SCADA | Supervisory control and data acquisition |
| SME | Subject matter expert |
| SOP | Standard operating procedure |
| WACC | Weighted average cost of capital |
| WE | Water electrolysis |
References
- Grieves, M. Intelligent Digital Twins and the Development and Management of Complex Systems. Digit. Twin 2022, 2, 8. [Google Scholar] [CrossRef]
- Schmidt, A.; Zobel-Roos, S.; Helgers, H.; Lohmann, L.; Vetter, F.; Jensch, C.; Juckers, A.; Strube, J. Digital Twins for Continuous Biologics Manufacturing. In Process Control, Intensification, and Digitalisation in Continuous Biomanufacturing; Subramanian, G., Ed.; Wiley: Hoboken, NJ, USA, 2022; pp. 265–350. ISBN 978-3-527-34769-8. [Google Scholar]
- Herwig, C.; Pörtner, R.; Möller, J. (Eds.) Digital Twins: Applications to the Design and Optimization of Bioprocesses; Advances in Biochemical Engineering/Biotechnology; Springer International Publishing: Cham, Switzerland, 2021; Volume 177, ISBN 978-3-030-71655-4. [Google Scholar]
- Schmidt, A.; Helgers, H.; Vetter, F.L.; Juckers, A.; Strube, J. Fast and Flexible mRNA Vaccine Manufacturing as a Solution to Pandemic Situations by Adopting Chemical Engineering Good Practice—Continuous Autonomous Operation in Stainless Steel Equipment Concepts. Processes 2021, 9, 1874. [Google Scholar] [CrossRef]
- Evaluate. World Preview 2024—Pharma’s Growth Boost—eBook; Evaluate: London, UK, 2024. [Google Scholar]
- Christel, M. 2024 Pharm Exec Top 50 Companies 2024. EvaluatePharma. Available online: https://www.pharmexec.com/view/2024-pharm-exec-top-50-companies (accessed on 1 February 2025).
- A Complete Guide to Computer System Validation (CSV)—QbD Group—2023. Available online: https://id.scribd.com/document/665662650/A-Complete-Guide-to-Computer-System-Validation-CSV-QbD-Group-2023 (accessed on 1 February 2025).
- Data Integrity and Compliance with CGMP Guidance for Industry. Available online: https://www.qbdgroup.com/en/a-complete-guide-to-computer-system-validation/ (accessed on 1 February 2025).
- Pedro, F.; Veiga, F.; Mascarenhas-Melo, F. Impact of GAMP 5, Data Integrity and QbD on Quality Assurance in the Pharmaceutical Industry: How Obvious Is It? Drug Discov. Today 2023, 28, 103759. [Google Scholar] [CrossRef] [PubMed]
- Fitrio, Y. Case Study Risk Based Approach for Life Cycle Computerized System in Pharmaceutical Industry. J. Appl. Inf. Commun. Technol. 2019, 6, 61–73. [Google Scholar] [CrossRef]
- Guidelines to Aid Control Strategy Definition for Accelerated Programs November 2024. Available online: https://www.biophorum.com/download/guidelines-to-aid-control-strategy-definition-for-accelerated-programs/ (accessed on 1 February 2025).
- BioPhorum; Ulbrich, A.; Agnew, D.; Kierans, G.; Oliva, H.; Esencan, I.; Chen, K.-L.; Schmucki, M.; Prendergast, M.; Leggin, N.; et al. Playbook for the Digital Integration of Sponsor and Contract Organizations; BioPhorum: London, UK, 2025. [Google Scholar]
- BioPhorum; Lenich, B.; Carey, D.; Krüger, F.; Llewellyn, K.; Holcroft, M.; Cagol, M.; Knudsen, M.; Geldenhuis, P.; Wang, R.; et al. Managing Data as a Product for Digital Transformation in the Pharmaceutical Industry; BioPhorum: London, UK, 2024. [Google Scholar]
- PAT Monitoring and Control Roadmap September 2024. 2024. Available online: https://www.biophorum.com/download/pat-monitoring-and-control-roadmap/ (accessed on 1 February 2025).
- BioPhorum; O’Grady, D.; Insaidoo, F.; Shaver, J.; Cao, L.; Li, L.; Colella, M.; Rowland-Jones, R.; Kavanagh, T.; Cui, Y.; et al. In-Silico Modeling: Glossary of Key Terms and Abbreviations; BioPhorum: London, UK, 2024. [Google Scholar]
- Pörtner, R. (Ed.) Biopharmaceutical Manufacturing: Progress, Trends and Challenges, 1st ed.; Cell Engineering; Springer International Publishing: Cham, Switzerland, 2023; ISBN 978-3-031-45671-8. [Google Scholar]
- Kim, J.; Okamura, K.; Gaddem, M.R.; Hayashi, Y.; Badr, S.; Sugiyama, H. Impact of Modeling and Simulation on Pharmaceutical Process Development. Curr. Opin. Chem. Eng. 2025, 47, 101093. [Google Scholar] [CrossRef]
- Gernaey, K.V.; Gani, R. A Model-Based Systems Approach to Pharmaceutical Product-Process Design and Analysis. Chem. Eng. Sci. 2010, 65, 5757–5769. [Google Scholar] [CrossRef]
- Gerstweiler, L. Continuous Bioprocessing for Downstream. In Biopharmaceutical Manufacturing; Pörtner, R., Ed.; Cell Engineering; Springer International Publishing: Cham, Switzerland, 2023; Volume 11, pp. 159–178. ISBN 978-3-031-45668-8. [Google Scholar]
- Grossmann, C.; Ströhlein, G.; Morari, M.; Morbidelli, M. Optimizing Model Predictive Control of the Chromatographic Multi-Column Solvent Gradient Purification (MCSGP) Process. J. Process Control 2010, 20, 618–629. [Google Scholar] [CrossRef]
- Close, E.J.; Salm, J.R.; Bracewell, D.G.; Sorensen, E. A Model Based Approach for Identifying Robust Operating Conditions for Industrial Chromatography with Process Variability. Chem. Eng. Sci. 2014, 116, 284–295. [Google Scholar] [CrossRef]
- Andersson, N.; Fons, J.G.; Isaksson, M.; Tallvod, S.; Espinoza, D.; Sjökvist, L.; Andersson, G.Z.; Nilsson, B. Methodology for Fast Development of Digital Solutions in Integrated Continuous Downstream Processing. Biotechnol. Bioeng. 2023, 121, 2378–2387. [Google Scholar] [CrossRef]
- Aumann, L.; Morbidelli, M. A Continuous Multicolumn Countercurrent Solvent Gradient Purification (MCSGP) Process. Biotechnol. Bioeng. 2007, 98, 1043–1055. [Google Scholar] [CrossRef]
- Chen, Y.; Lu, H.; Wang, R.; Sun, G.; Zhang, X.; Liang, J.; Jungbauer, A.; Yao, S.; Lin, D. Standardized Approach for Accurate and Reliable Model Development of Ion-exchange Chromatography Based on Parameter-by-parameter Method and Consideration of Extra-column Effects. Biotechnol. J. 2024, 19, 2300687. [Google Scholar] [CrossRef]
- Richter, M.; Rudolph, F.; Schmidt, A.; Strube, J. Process for Purifying and Enriching Proteins, Nucleic Acids or Viruses Using an Aqueous Two-Phase System. U.S. Patent US20250065248A1, 24 January 2022. [Google Scholar]
- Schmidt, A.; Richter, M.; Rudolph, F.; Strube, J. Integration of Aqueous Two-Phase Extraction as Cell Harvest and Capture Operation in the Manufacturing Process of Monoclonal Antibodies. Antibodies 2017, 6, 21. [Google Scholar] [CrossRef] [PubMed]
- Teo, C.C.; Tan, S.N.; Yong, J.W.H.; Hew, C.S.; Ong, E.S. Pressurized Hot Water Extraction (PHWE). J. Chromatogr. A 2010, 1217, 2484–2494. [Google Scholar] [CrossRef] [PubMed]
- Tian, Y.; Demirel, S.E.; Hasan, M.M.F.; Pistikopoulos, E.N. An Overview of Process Systems Engineering Approaches for Process Intensification: State of the Art. Chem. Eng. Process.—Process Intensif. 2018, 133, 160–210. [Google Scholar] [CrossRef]
- Cao, L.; Wang, J.; Su, J.; Luo, Y.; Cao, Y.; Braatz, R.D.; Gopaluni, B. Comprehensive Analysis on Machine Learning Approaches for Interpretable and Stable Soft Sensors. IEEE Trans. Instrum. Meas. 2025, 74, 9517217. [Google Scholar] [CrossRef]
- Shahab, M.A.; Destro, F.; Braatz, R.D. Digital Twins in Biopharmaceutical Manufacturing: Review and Perspective on Human-Machine Collaborative Intelligence. arXiv 2025, arXiv:2504.00286. [Google Scholar]
- Ding, C.; Kujawa, M.; Bartkovsky, M.; Qadan, M.; Ierapetritou, M. Application of Flowsheet Modeling for Scheduling and Debottlenecking Analysis to Support the Development and Scale-up of a Plasma-Derived Therapeutic Protein Purification Process. Biochem. Eng. J. 2024, 212, 109501. [Google Scholar] [CrossRef]
- Cenci, F.; Diab, S.; Ferrini, P.; Harabajiu, C.; Barolo, M.; Bezzo, F.; Facco, P. Predicting Drug Solubility in Organic Solvents Mixtures: A Machine-Learning Approach Supported by High-Throughput Experimentation. Int. J. Pharm. 2024, 660, 124233. [Google Scholar] [CrossRef]
- Vandeputte, T.; Ghijs, M.; Van Hauwermeiren, D.; Dos Santos Schultz, E.; Schäfer, E.; Stauffer, F.; De Beer, T.; Nopens, I. Mechanistic Modeling of Semicontinuous Fluidized Bed Drying of Pharmaceutical Granules by Incorporating Single Particle and Bulk Drying Kinetics. Int. J. Pharm. 2023, 646, 123447. [Google Scholar] [CrossRef]
- Laky, D.J.; Casas-Orozco, D.; Destro, F.; Barolo, M.; Reklaitis, G.V.; Nagy, Z.K. Integrated Synthesis, Crystallization, Filtration, and Drying of Active Pharmaceutical Ingredients: A Model-Based Digital Design Framework for Process Optimization and Control. In Optimization of Pharmaceutical Processes; Fytopoulos, A., Ramachandran, R., Pardalos, P.M., Eds.; Springer Optimization and Its Applications; Springer International Publishing: Cham, Switzerland, 2022; Volume 189, pp. 253–287. ISBN 978-3-030-90923-9. [Google Scholar]
- Laboukhi-Khorsi, S.; Daoud, K.; Chemat, S. Efficient Solvent Selection Approach for High Solubility of Active Phytochemicals: Application for the Extraction of an Antimalarial Compound from Medicinal Plants. ACS Sustain. Chem. Eng. 2017, 5, 4332–4339. [Google Scholar] [CrossRef]
- Idris, A.; Chua, G.K.; Othman, M.R. Incorporating Potential Environmental Impact from Water for Injection in Environmental Assessment of Monoclonal Antibody Production. Chem. Eng. Res. Des. 2016, 109, 430–442. [Google Scholar] [CrossRef]
- Amelio, A.; Genduso, G.; Vreysen, S.; Luis, P.; Van Der Bruggen, B. Guidelines Based on Life Cycle Assessment for Solvent Selection during the Process Design and Evaluation of Treatment Alternatives. Green Chem. 2014, 16, 3045–3063. [Google Scholar] [CrossRef]
- Geres, R.; Kohn, A.; Lenz, S.C.; Ausfelder, F.; Bazzanella, A.; Möller, A. Roadmap Chemie 2050: Auf dem Weg zu Einer treibhausgasneutralen Chemischen Industrie in Deutschland: Eine Studie von DECHEMA und FutureCamp für den VCI; DECHEMA Gesellschaft für Chemische Technik und Biotechnologie e.V: Frankfurt am Main, Germany, 2019; ISBN 978-3-89746-223-6. [Google Scholar]
- Guidance for Industry PAT—A Framework for Innovative Pharmaceutical Development, Manufacturing, and Quality Assurance. Available online: https://www.fda.gov/media/71012/download (accessed on 1 February 2025).
- ICH. Guideline Q8 (R2) on Pharmaceutical Development: EMA/CHMP/ICH/167068/2004; European Medicines Agency: London, UK, 2006. [Google Scholar]
- Matić, J.; Stanković-Brandl, M.; Bauer, H.; Lovey, J.; Martel, S.; Herkenne, C.; Paudel, A.; Khinast, J. Pharmaceutical Hot Melt Extrusion Process Development Using QbD and Digital Twins. Int. J. Pharm. 2023, 631, 122469. [Google Scholar] [CrossRef]
- Udugama, I.A.; Lopez, P.C.; Gargalo, C.L.; Li, X.; Bayer, C.; Gernaey, K.V. Digital Twin in Biomanufacturing: Challenges and Opportunities towards Its Implementation. Syst. Microbiol. Biomanufacturing 2021, 1, 257–274. [Google Scholar] [CrossRef]
- Uhl, A.; Schmidt, A.; Hlawitschka, M.W.; Strube, J. Autonomous Liquid–Liquid Extraction Operation in Biologics Manufacturing with Aid of a Digital Twin Including Process Analytical Technology. Processes 2023, 11, 553. [Google Scholar] [CrossRef]
- Schmidt, A.; Uhlenbrock, L.; Strube, J. Technical Potential for Energy and GWP Reduction in Chemical–Pharmaceutical Industry in Germany and EU—Focused on Biologics and Botanicals Manufacturing. Processes 2020, 8, 818. [Google Scholar] [CrossRef]
- Uhl, A.; Schmidt, A.; Jensch, C.; Köster, D.; Strube, J. Development of Concepts for a Climate-Neutral Chemical–Pharmaceutical Industry in 2045. Processes 2022, 10, 1289. [Google Scholar] [CrossRef]
- Wittkopp, F.; Welsh, J.; Todd, R.; Staby, A.; Roush, D.; Lyall, J.; Karkov, S.; Hunt, S.; Griesbach, J.; Bertran, M.; et al. Current State of Implementation of in Silico Tools in the Biopharmaceutical Industry—Proceedings of the 5th Modeling Workshop. Biotechnol. Bioeng. 2024, 121, 2952–2973. [Google Scholar] [CrossRef] [PubMed]
- Metcalfe, B.; Boshuizen, H.C.; Bulens, J.; Koehorst, J.J. Digital Twin Maturity Levels: A Theoretical Framework for Defining Capabilities and Goals in the Life and Environmental Sciences. F1000Research 2023, 12, 961. [Google Scholar] [CrossRef]
- Fatima, I.; Ruediger, L.; Christian, J.; Christof, H.; Michael, H. A Perspective on the Role of Digitalization Enablers in Sustainable Pharmaceutical Manufacturing. Chem. Eng. Trans. 2023, 105, 361–366. [Google Scholar] [CrossRef]
- Chen, Y.; Yang, O.; Sampat, C.; Bhalode, P.; Ramachandran, R.; Ierapetritou, M. Digital Twins in Pharmaceutical and Biopharmaceutical Manufacturing: A Literature Review. Processes 2020, 8, 1088. [Google Scholar] [CrossRef]
- Kritzinger, W.; Karner, M.; Traar, G.; Henjes, J.; Sihn, W. Digital Twin in Manufacturing: A Categorical Literature Review and Classification. IFAC-Pap. 2018, 51, 1016–1022. [Google Scholar] [CrossRef]
- Canzani, E.; Timmer, S.W. Beyond Building Predictive Models: TwinOps in Biomanufacturing 2021. TechRxiv 2021. [Google Scholar] [CrossRef]
- Liu, M.; Fang, S.; Dong, H.; Xu, C. Review of Digital Twin about Concepts, Technologies, and Industrial Applications. J. Manuf. Syst. 2021, 58, 346–361. [Google Scholar] [CrossRef]
- Körber Pharma. PAS-X CMC Innovation Consulting. 2025. Available online: https://www.koerber-pharma.com/en/services/pas-x-cmc-innovation-consulting (accessed on 1 February 2025).
- Using Digital Shadows To Reinforce Downstream Modeling. Available online: https://www.bioprocessonline.com/doc/using-digital-shadows-to-reinforce-downstream-modeling-0001 (accessed on 25 April 2025).
- Körner, M.-F.; Bauer, D.; Keller, R.; Rösch, M.; Schlereth, A.; Simon, P.; Bauernhansl, T.; Fridgen, G.; Reinhart, G. Extending the Automation Pyramid for Industrial Demand Response. Procedia CIRP 2019, 81, 998–1003. [Google Scholar] [CrossRef]
- Martinez, E.M.; Ponce, P.; Macias, I.; Molina, A. Automation Pyramid as Constructor for a Complete Digital Twin, Case Study: A Didactic Manufacturing System. Sensors 2021, 21, 4656. [Google Scholar] [CrossRef] [PubMed]
- Coito, T.; Viegas, J.L.; Martins, M.S.E.; Cunha, M.M.; Figueiredo, J.; Vieira, S.M.; Sousa, J.M.C. A Novel Framework for Intelligent Automation. IFAC-Pap. 2019, 52, 1825–1830. [Google Scholar] [CrossRef]
- Jelsch, M.; Roggo, Y.; Kleinebudde, P.; Krumme, M. Model Predictive Control in Pharmaceutical Continuous Manufacturing: A Review from a User’s Perspective. Eur. J. Pharm. Biopharm. 2021, 159, 137–142. [Google Scholar] [CrossRef]
- Backi, C.J.; Grimes, B.A.; Skogestad, S. A Control- and Estimation-Oriented Gravity Separator Model for Oil and Gas Applications Based upon First-Principles. Ind. Eng. Chem. Res. 2018, 57, 7201–7217. [Google Scholar] [CrossRef]
- Phalak, P.; Tomba, E.; Jehoulet, P.; Kapitan-Gnimdu, A.; Soladana, P.M.; Vagaggini, L.; Brochier, M.; Stevens, B.; Peel, T.; Strodiot, L.; et al. Digital Twin Implementation for Manufacturing of Adjuvants. Processes 2023, 11, 1717. [Google Scholar] [CrossRef]
- Schwenzer, M.; Ay, M.; Bergs, T.; Abel, D. Review on Model Predictive Control: An Engineering Perspective. Int. J. Adv. Manuf. Technol. 2021, 117, 1327–1349. [Google Scholar] [CrossRef]
- Hengelbrock, A.; Probst, F.; Baukmann, S.; Uhl, A.; Tschorn, N.; Stitz, J.; Schmidt, A.; Strube, J. Digital Twin for Continuous Production of Virus-like Particles toward Autonomous Operation. ACS Omega 2024, 9, 34990–35013. [Google Scholar] [CrossRef]
- Hermanto, M.W.; Braatz, R.D.; Chiu, M. Integrated Batch-to-batch and Nonlinear Model Predictive Control for Polymorphic Transformation in Pharmaceutical Crystallization. AIChE J. 2011, 57, 1008–1019. [Google Scholar] [CrossRef]
- Roggero, R. Breaking Down Computer Systems Validation in a Regulated Environment. 2021. Available online: https://www.pda.org/pda-letter-portal/home/full-article/breaking-down-computer-systems-validation-in-a-regulated-environment (accessed on 1 February 2025).
- General Principles of Software Validation. Final Guidance for Industry and FDA Staff. Available online: https://www.fda.gov/regulatory-information/search-fda-guidance-documents/general-principles-software-validation (accessed on 1 February 2025).
- ICH M4: The Common Technical Document. Available online: https://www.ich.org/page/ctd (accessed on 1 February 2025).
- O’Connor, T.F.; Chatterjee, S.; Lam, J.; De La Ossa, D.H.P.; Martinez-Peyrat, L.; Hoefnagel, M.H.N.; Fisher, A.C. An Examination of Process Models and Model Risk Frameworks for Pharmaceutical Manufacturing. Int. J. Pharm. X 2024, 8, 100274. [Google Scholar] [CrossRef] [PubMed]
- ICH Harmonised Guideline. 20 November 2019. Available online: https://database.ich.org/sites/default/files/E9-R1_Step4_Guideline_2019_1203.pdf (accessed on 1 February 2025).
- Assessing Credibility of Computational Modeling through Verification and Validation: Application to Medical Devices: ASME V&V 40—2018; The American Society of Mechanical Engineers: New York, NY, USA, 2018; ISBN 978-0-7918-7204-8.
- QbD Group A Complete Guide to Computer System Validation (CSV) 2024. Available online: https://www.qbdgroup.com/en/a-complete-guide-to-computer-system-validation/ (accessed on 1 February 2025).
- Uhl, A.; Knierim, L.; Tegtmeier, M.; Schmidt, A.; Strube, J. Is Regulatory Approval without Autonomous Operation for Natural Extract Manufacturing under Economic Competitiveness and Climate-Neutrality Demands Still Permissible? Processes 2023, 11, 1790. [Google Scholar] [CrossRef]
- Gsell, P.-S.; Giersing, B.; Gottlieb, S.; Wilder-Smith, A.; Wu, L.; Friede, M. Key Considerations for the Development of Novel mRNA Candidate Vaccines in LMICs: A WHO/MPP mRNA Technology Transfer Programme Meeting Report. Vaccine 2023, 41, 7307–7312. [Google Scholar] [CrossRef] [PubMed]
- Hengelbrock, A.; Schmidt, A.; Helgers, H.; Vetter, F.L.; Strube, J. Scalable mRNA Machine for Regulatory Approval of Variable Scale between 1000 Clinical Doses to 10 Million Manufacturing Scale Doses. Processes 2023, 11, 745. [Google Scholar] [CrossRef]
- Yokogawa Digital Transformation in the Process Industries 2024; Yokogawa Electric: Musashino, Japan, 2024.
- Porter, M.E. Competitive Strategy: Techniques for Analyzing Industries and Competitors: With a New Introduction, 1st ed.; Free Press: New York, NY, USA, 1998; ISBN 978-0-684-84148-9. [Google Scholar]
- Emerson’s Software Units, AspenTech to Merge in $11 Bln Deal; Reuters: London, UK, 2021; Available online: https://www.reuters.com/technology/emerson-plans-11-bln-merger-industrial-software-units-with-aspentech-wsj-2021-10-11/ (accessed on 1 February 2025).
- Valle, S.; Valle, S. Emerson to Buy Remaining Stake in AspenTech for $7.2 Billion; Reuters: London, UK, 2025. [Google Scholar]
- Siemens to Acquire Simulation Software Supplier CD-Adapco. Available online: https://press.siemens.com/global/en/pressrelease/siemens-acquire-simulation-software-supplier-cd-adapco (accessed on 26 February 2025).
- Siemens AG Siemens Plant Die Übernahme von Process Systems Enterprise 2019. Available online: https://press.siemens.com/global/en/pressrelease/siemens-plans-acquire-process-systems-enterprise (accessed on 1 February 2025).
- DataHow Secures Series A Investment for Its AI Bioprocessing Solutions. Available online: https://datahow.ch/news/datahow-secures-series-a-investment-for-its-ai-bioprocessing-solutions/ (accessed on 26 February 2025).
- Tuoi, N.T.; Son, N.P. Review of Agricultural Value Chain Analysis. Hcmcou J. Sci. 2022, 15. [Google Scholar] [CrossRef]
- Feidl, F. From Data to Insight: Impact of Digital Bioprocessing and the Role of DataHowLab. In Proceedings of the Conference Talk on the DataHow Symposium, Zurich, Switzerland, 20–21 June 2024. [Google Scholar]


| Competitive Strength | Market Attractiveness |
|---|---|
| Absolute position | Market profitability |
| Relative position | Market growth |
| Global market access | Porter 5F: Threat of new entry |
| Products | Porter 5F: Threat of Substitution |
| Value chain | Porter 5F: Supplier Power |
| Innovation | Porter 5F: Buyer Power |
| Economic position | Porter 5F: Competitive rivalry |
| Company | Relevant Software Products |
|---|---|
| Siemens | Star-CCM++, gPROMS |
| Körber Pharma | PAS-X Savvy |
| Cytiva | UNICORN™, GoSilico™ |
| DataHow | DataHowLab |
| Novasign | Hybrid Modeling Toolbox |
| YPSO-FACTO | YPSO Proxima®, YPSO-Ionic® |
| Rockwell | MES-Software-PharmaSuite |
| ABB | ABB suite, ABB Ability™ Expert Optimizer |
| Securecell | Lucullus® |
| Emerson | DeltaV™ |
| AspenTech | AspenONE Engineering software |
Disclaimer/Publisher’s Note: The statements, opinions and data contained in all publications are solely those of the individual author(s) and contributor(s) and not of MDPI and/or the editor(s). MDPI and/or the editor(s) disclaim responsibility for any injury to people or property resulting from any ideas, methods, instructions or products referred to in the content. |
© 2025 by the authors. Licensee MDPI, Basel, Switzerland. This article is an open access article distributed under the terms and conditions of the Creative Commons Attribution (CC BY) license (https://creativecommons.org/licenses/by/4.0/).
Share and Cite
Schmidt, A.; Lütge, J.; Uhl, A.; Köster, D.; Strube, J. Business Cases for Digital Twins in Biopharmaceutical Manufacturing—Market Overview, Stakeholders, Technologies in 2025 and Beyond. Processes 2025, 13, 1498. https://doi.org/10.3390/pr13051498
Schmidt A, Lütge J, Uhl A, Köster D, Strube J. Business Cases for Digital Twins in Biopharmaceutical Manufacturing—Market Overview, Stakeholders, Technologies in 2025 and Beyond. Processes. 2025; 13(5):1498. https://doi.org/10.3390/pr13051498
Chicago/Turabian StyleSchmidt, Axel, Jessica Lütge, Alexander Uhl, Dirk Köster, and Jochen Strube. 2025. "Business Cases for Digital Twins in Biopharmaceutical Manufacturing—Market Overview, Stakeholders, Technologies in 2025 and Beyond" Processes 13, no. 5: 1498. https://doi.org/10.3390/pr13051498
APA StyleSchmidt, A., Lütge, J., Uhl, A., Köster, D., & Strube, J. (2025). Business Cases for Digital Twins in Biopharmaceutical Manufacturing—Market Overview, Stakeholders, Technologies in 2025 and Beyond. Processes, 13(5), 1498. https://doi.org/10.3390/pr13051498