
Optimizing Hydrophobicity of Cu@Zn Foam Catalysts for Efficient CO2 Electroreduction in a Microchannel Reactor

 ,
, 

Abstract
1. Introduction
2. Materials and Methods
2.1. Materials and Chemicals
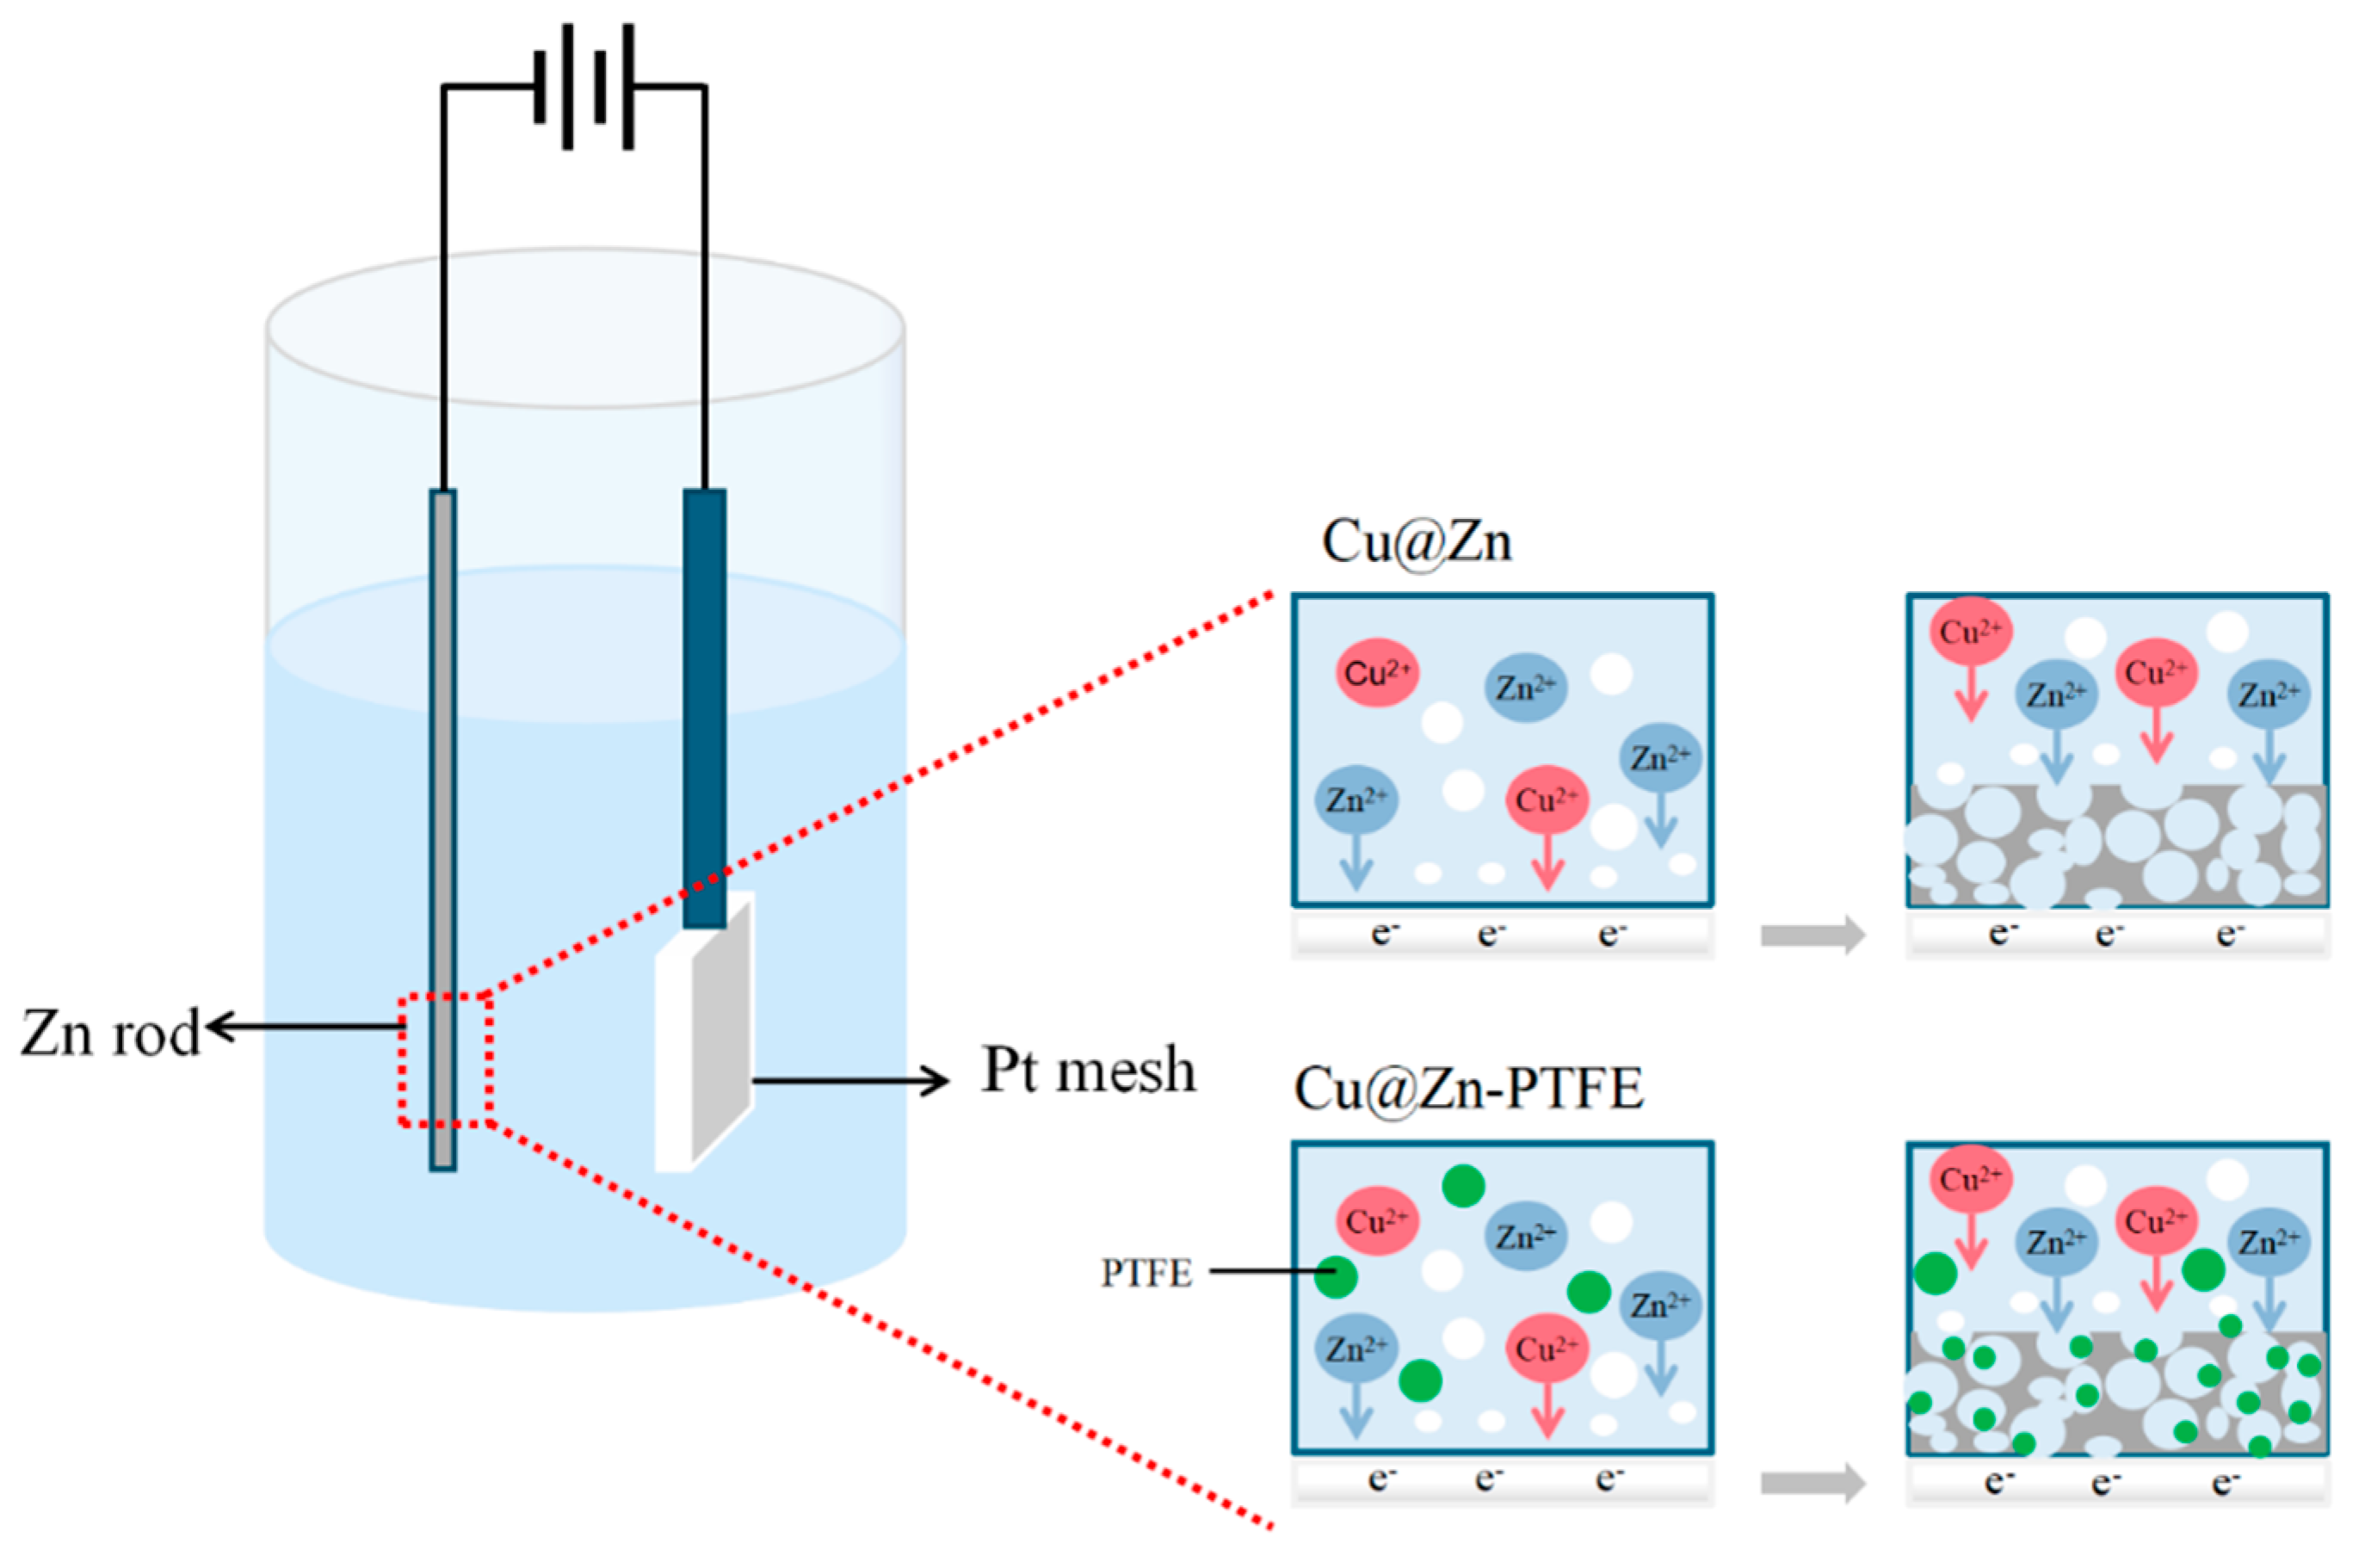
2.2. Preparation of Catalysts
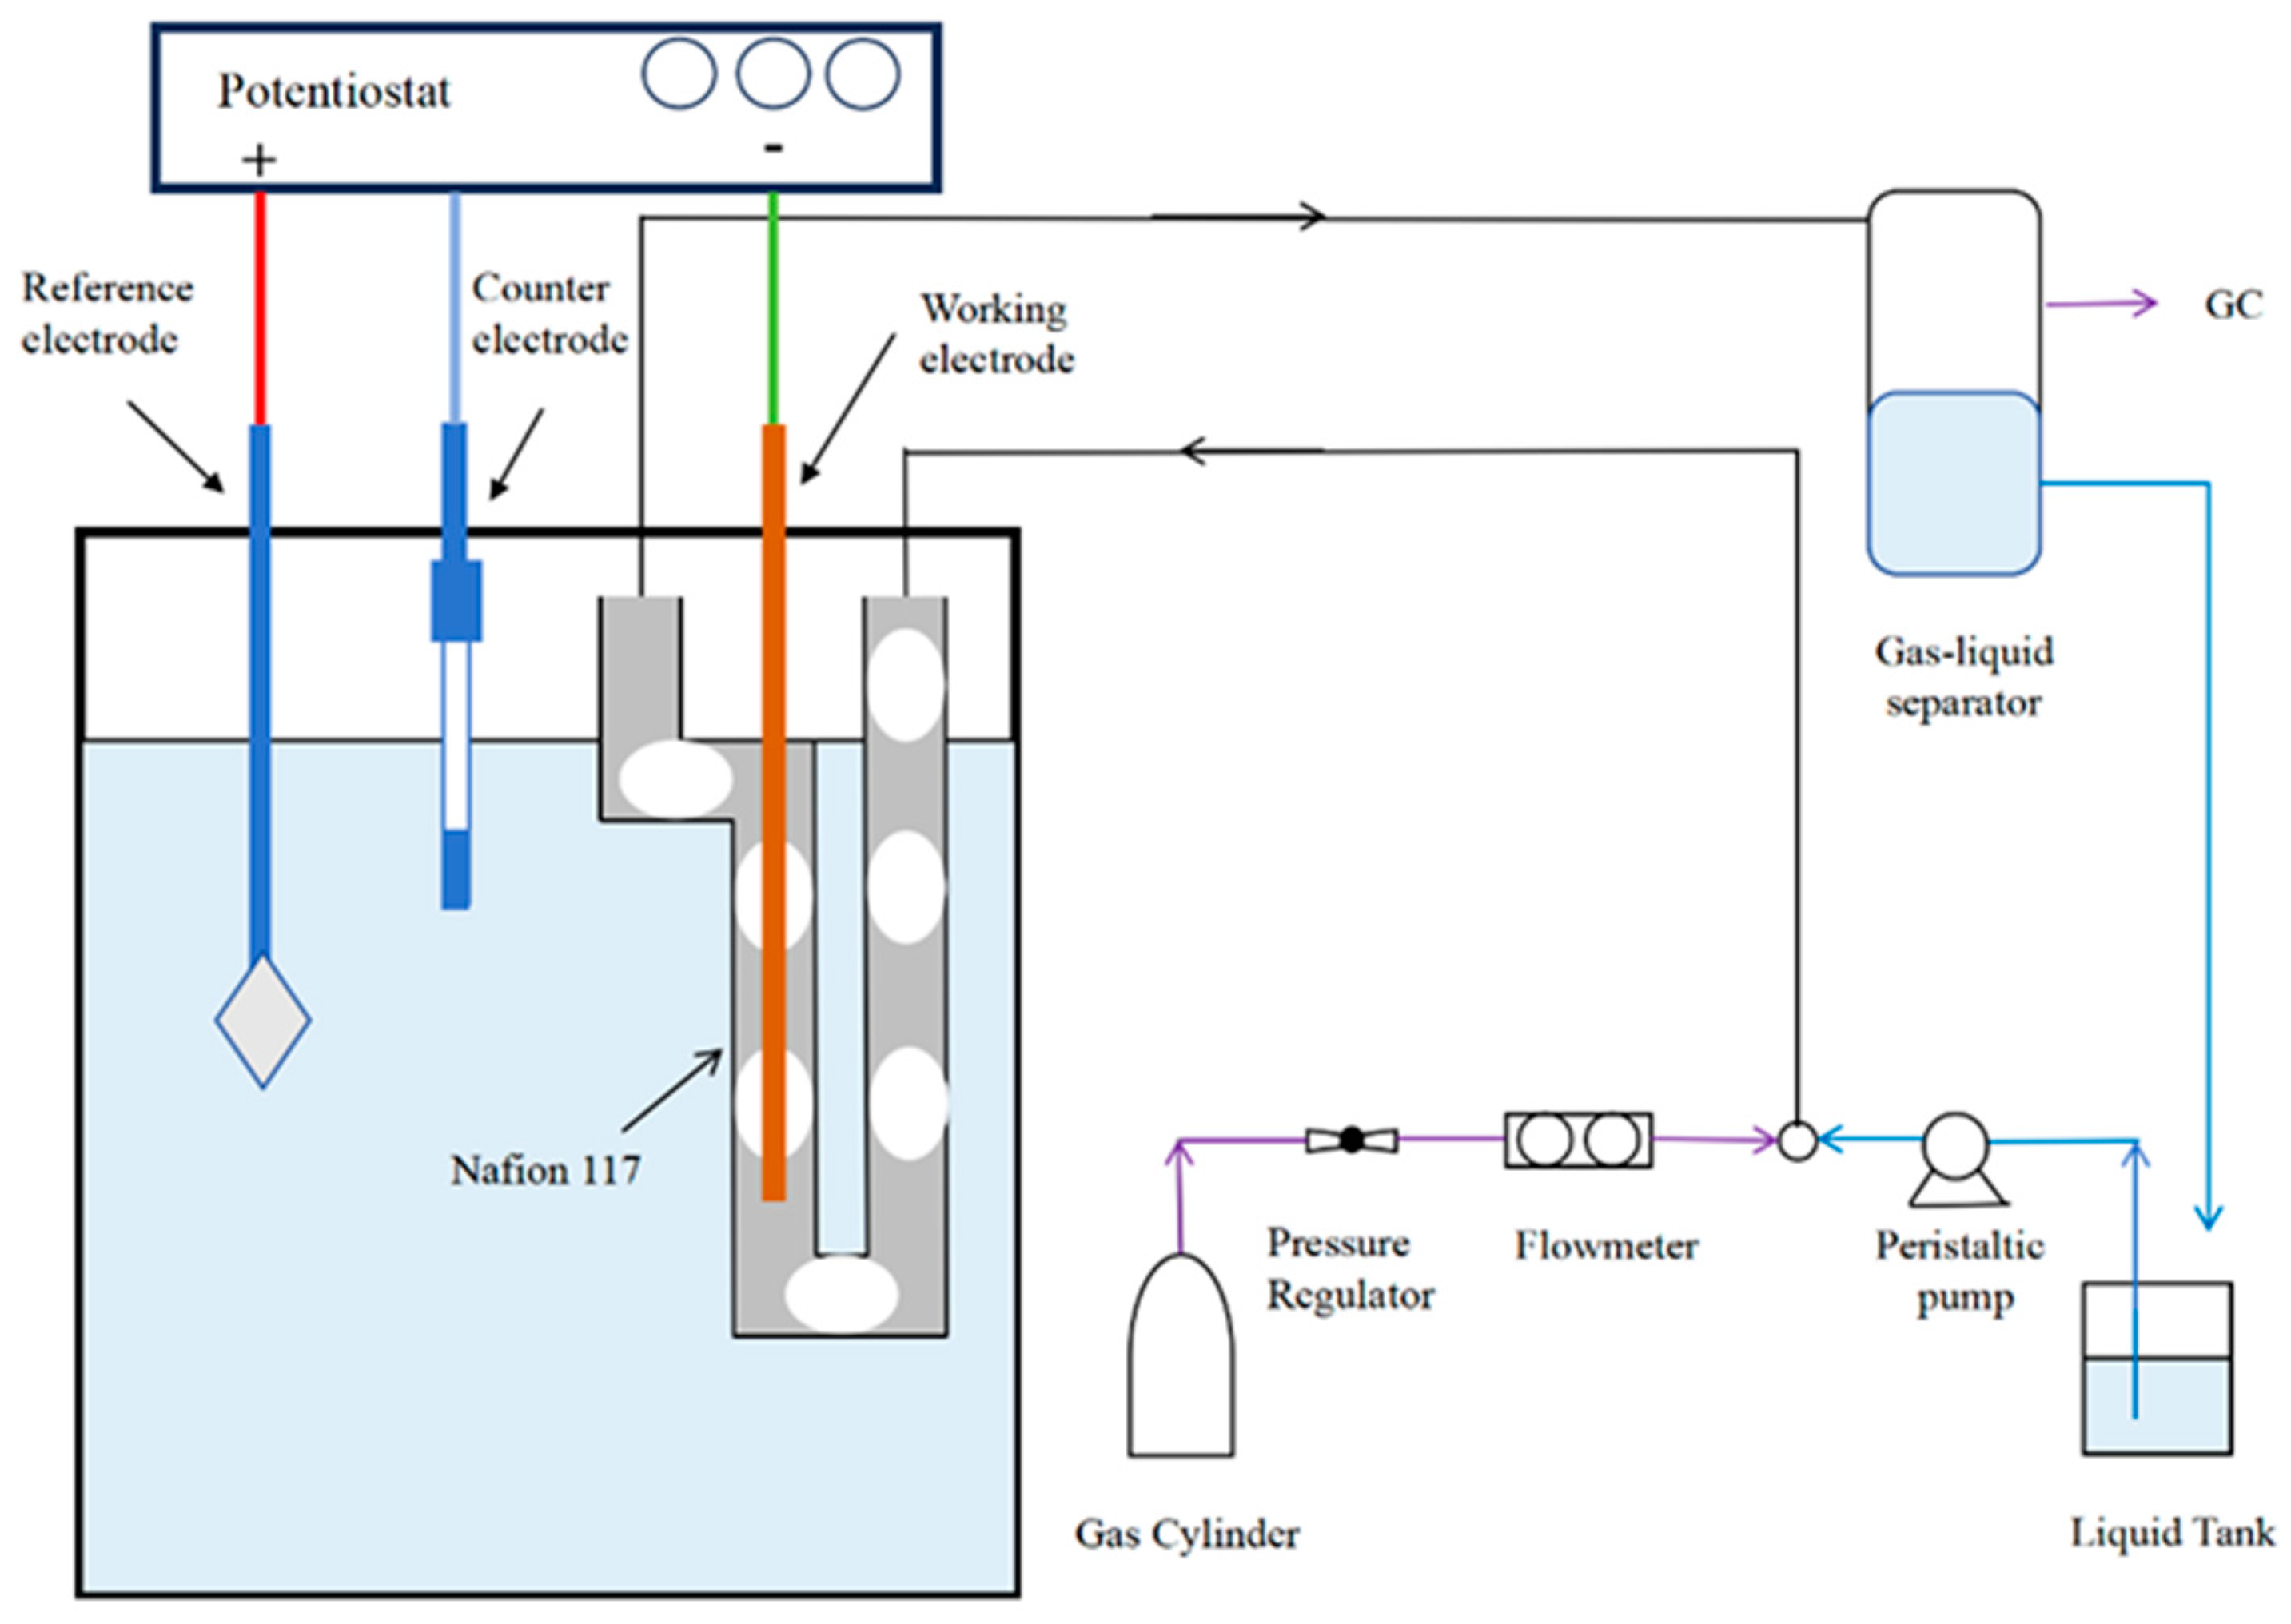
2.3. Electrocatalytic Measurements and Product Analysis
2.4. Computational Fluid Dynamics (CFD) Simulations
- (1)
- Continuity Equation
- (2)
- Momentum Equation
- (3)
- Surface Tension Force
2.5. Catalyst Characterization
3. Results and Discussion
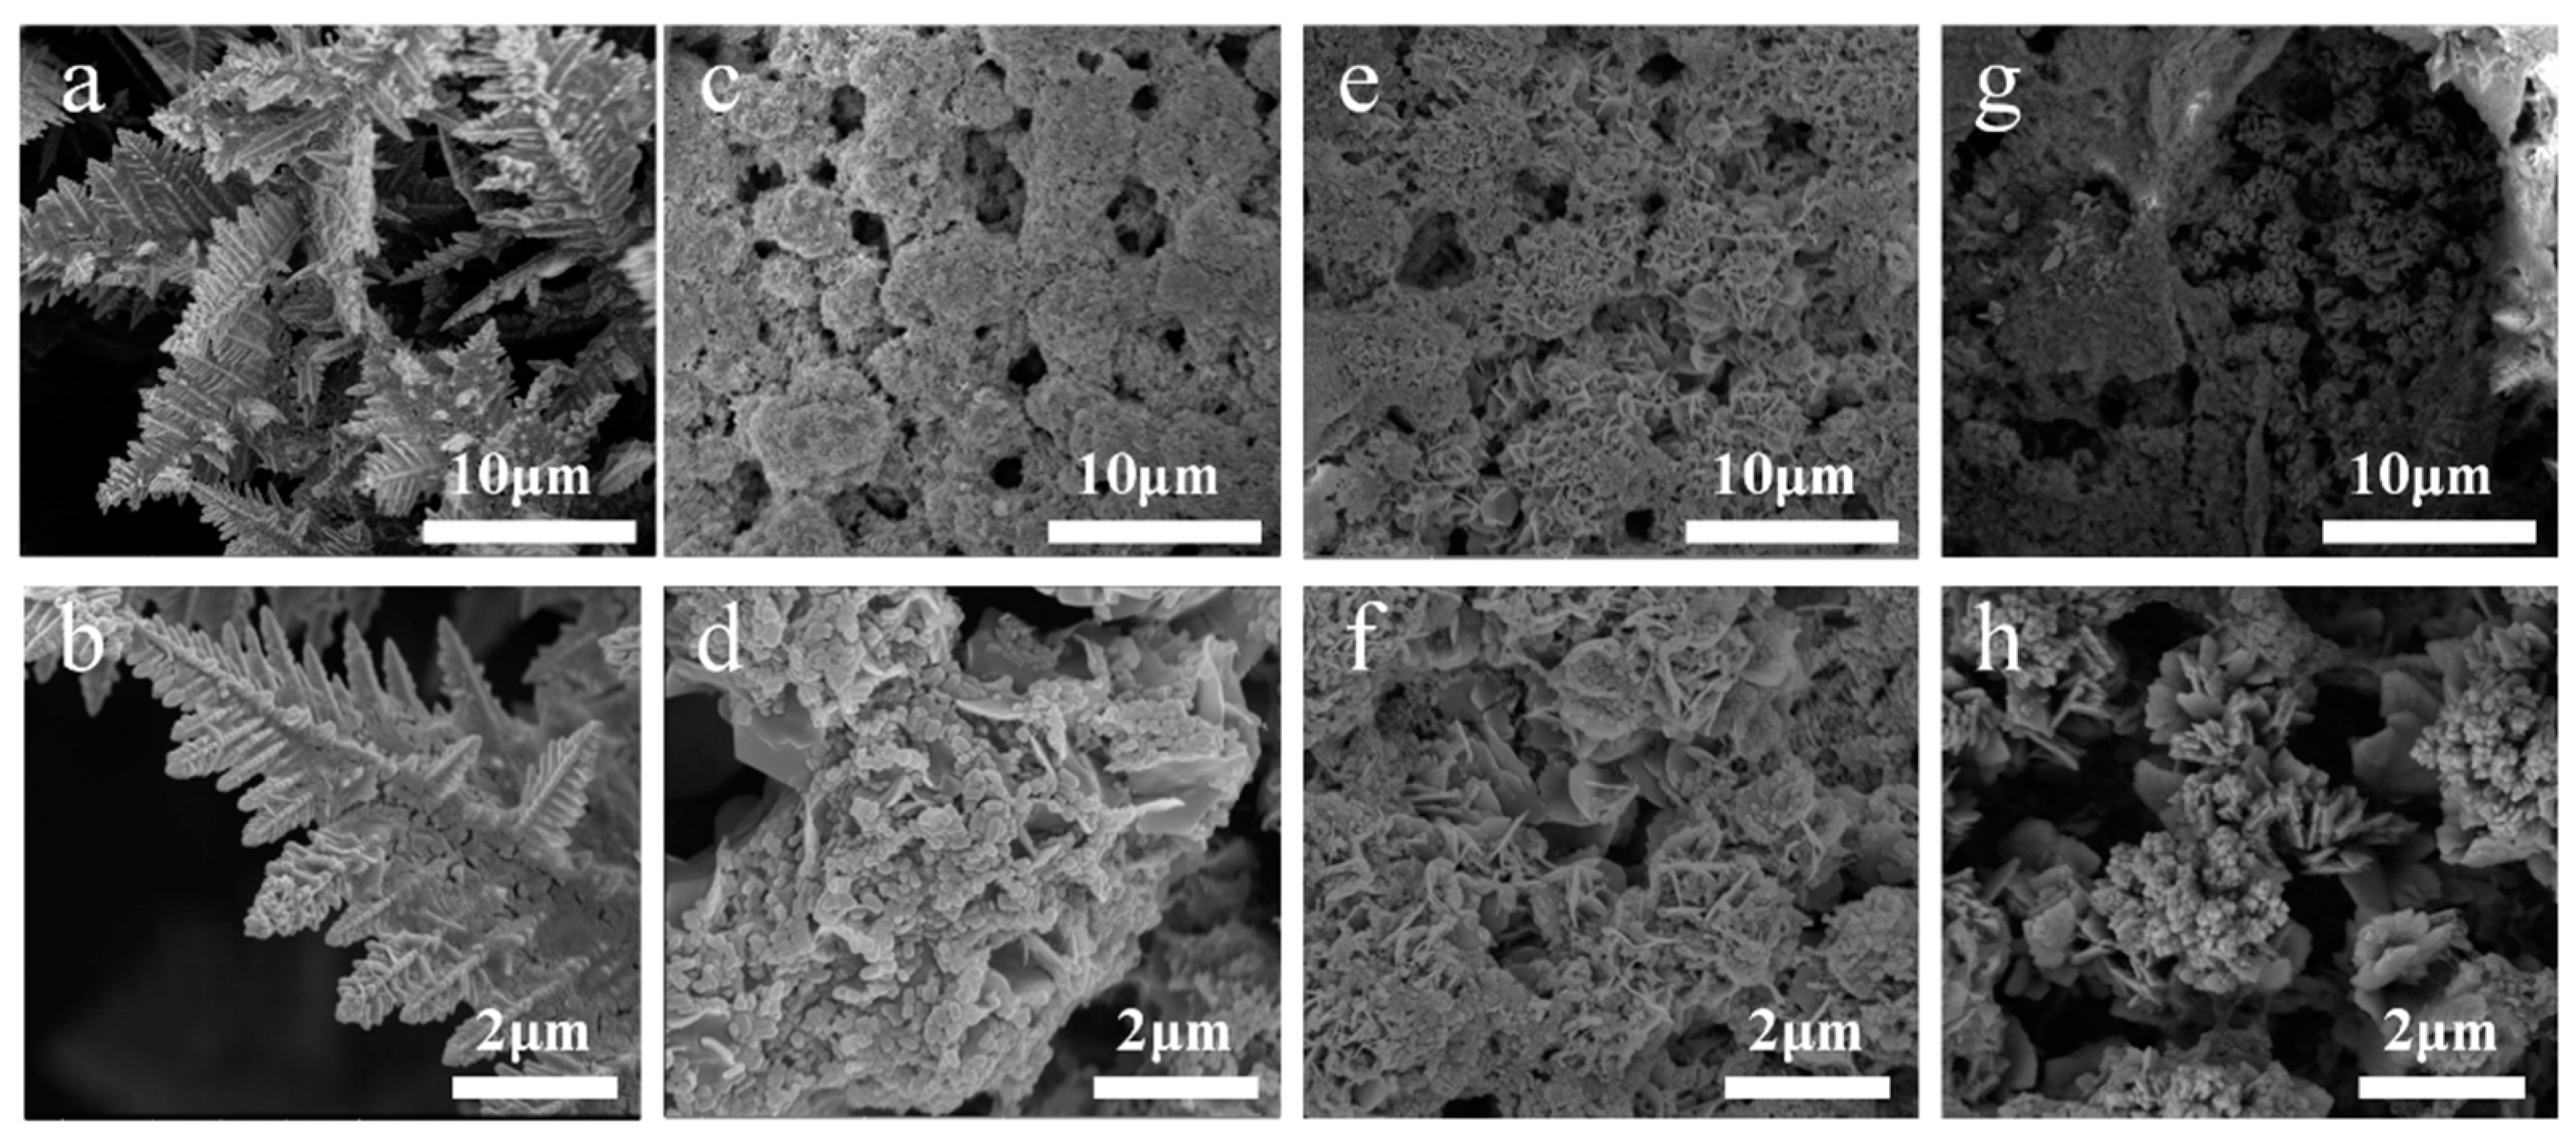
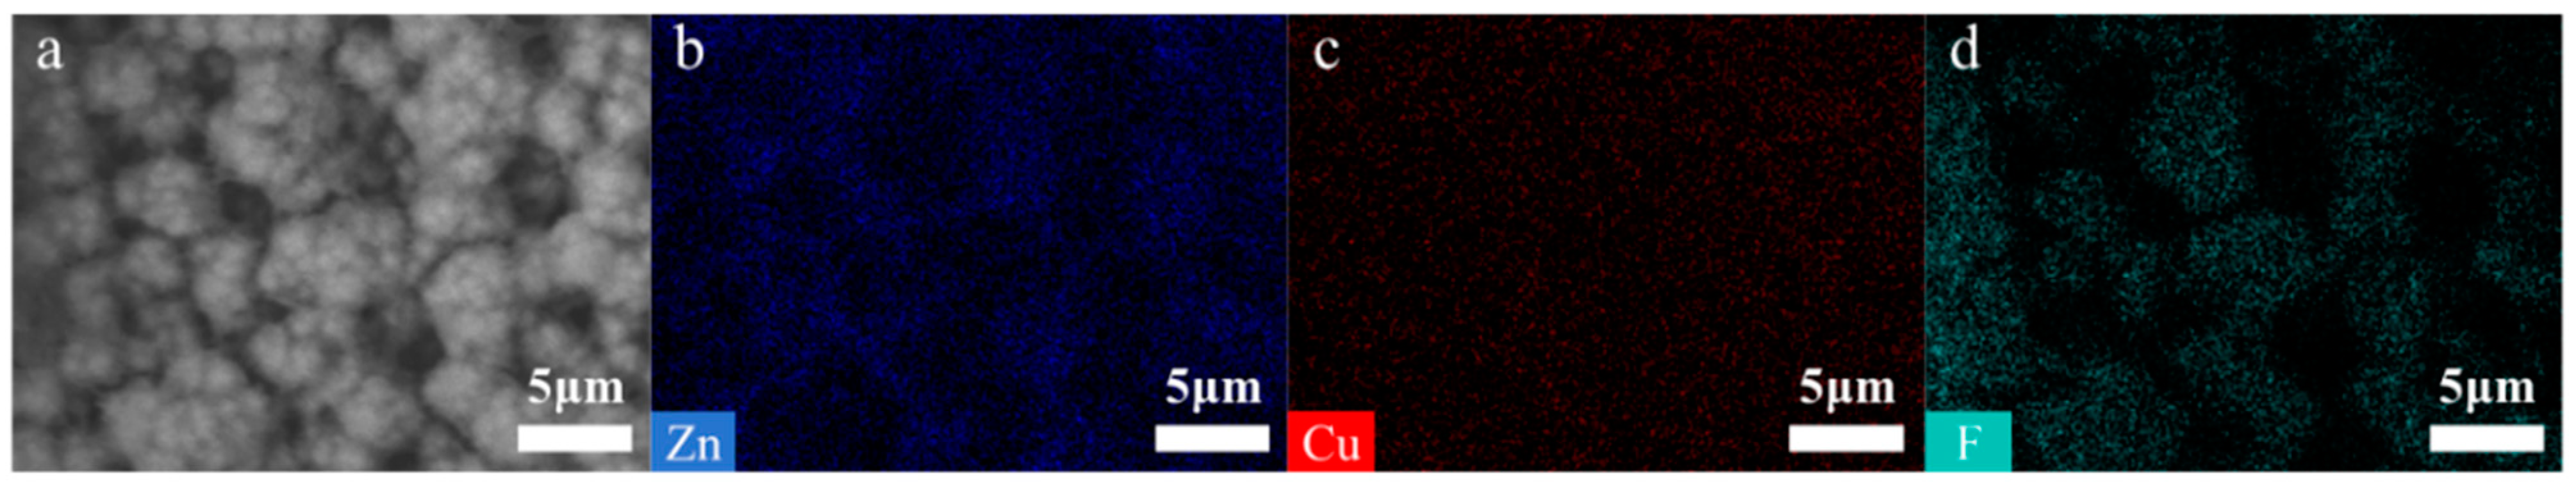
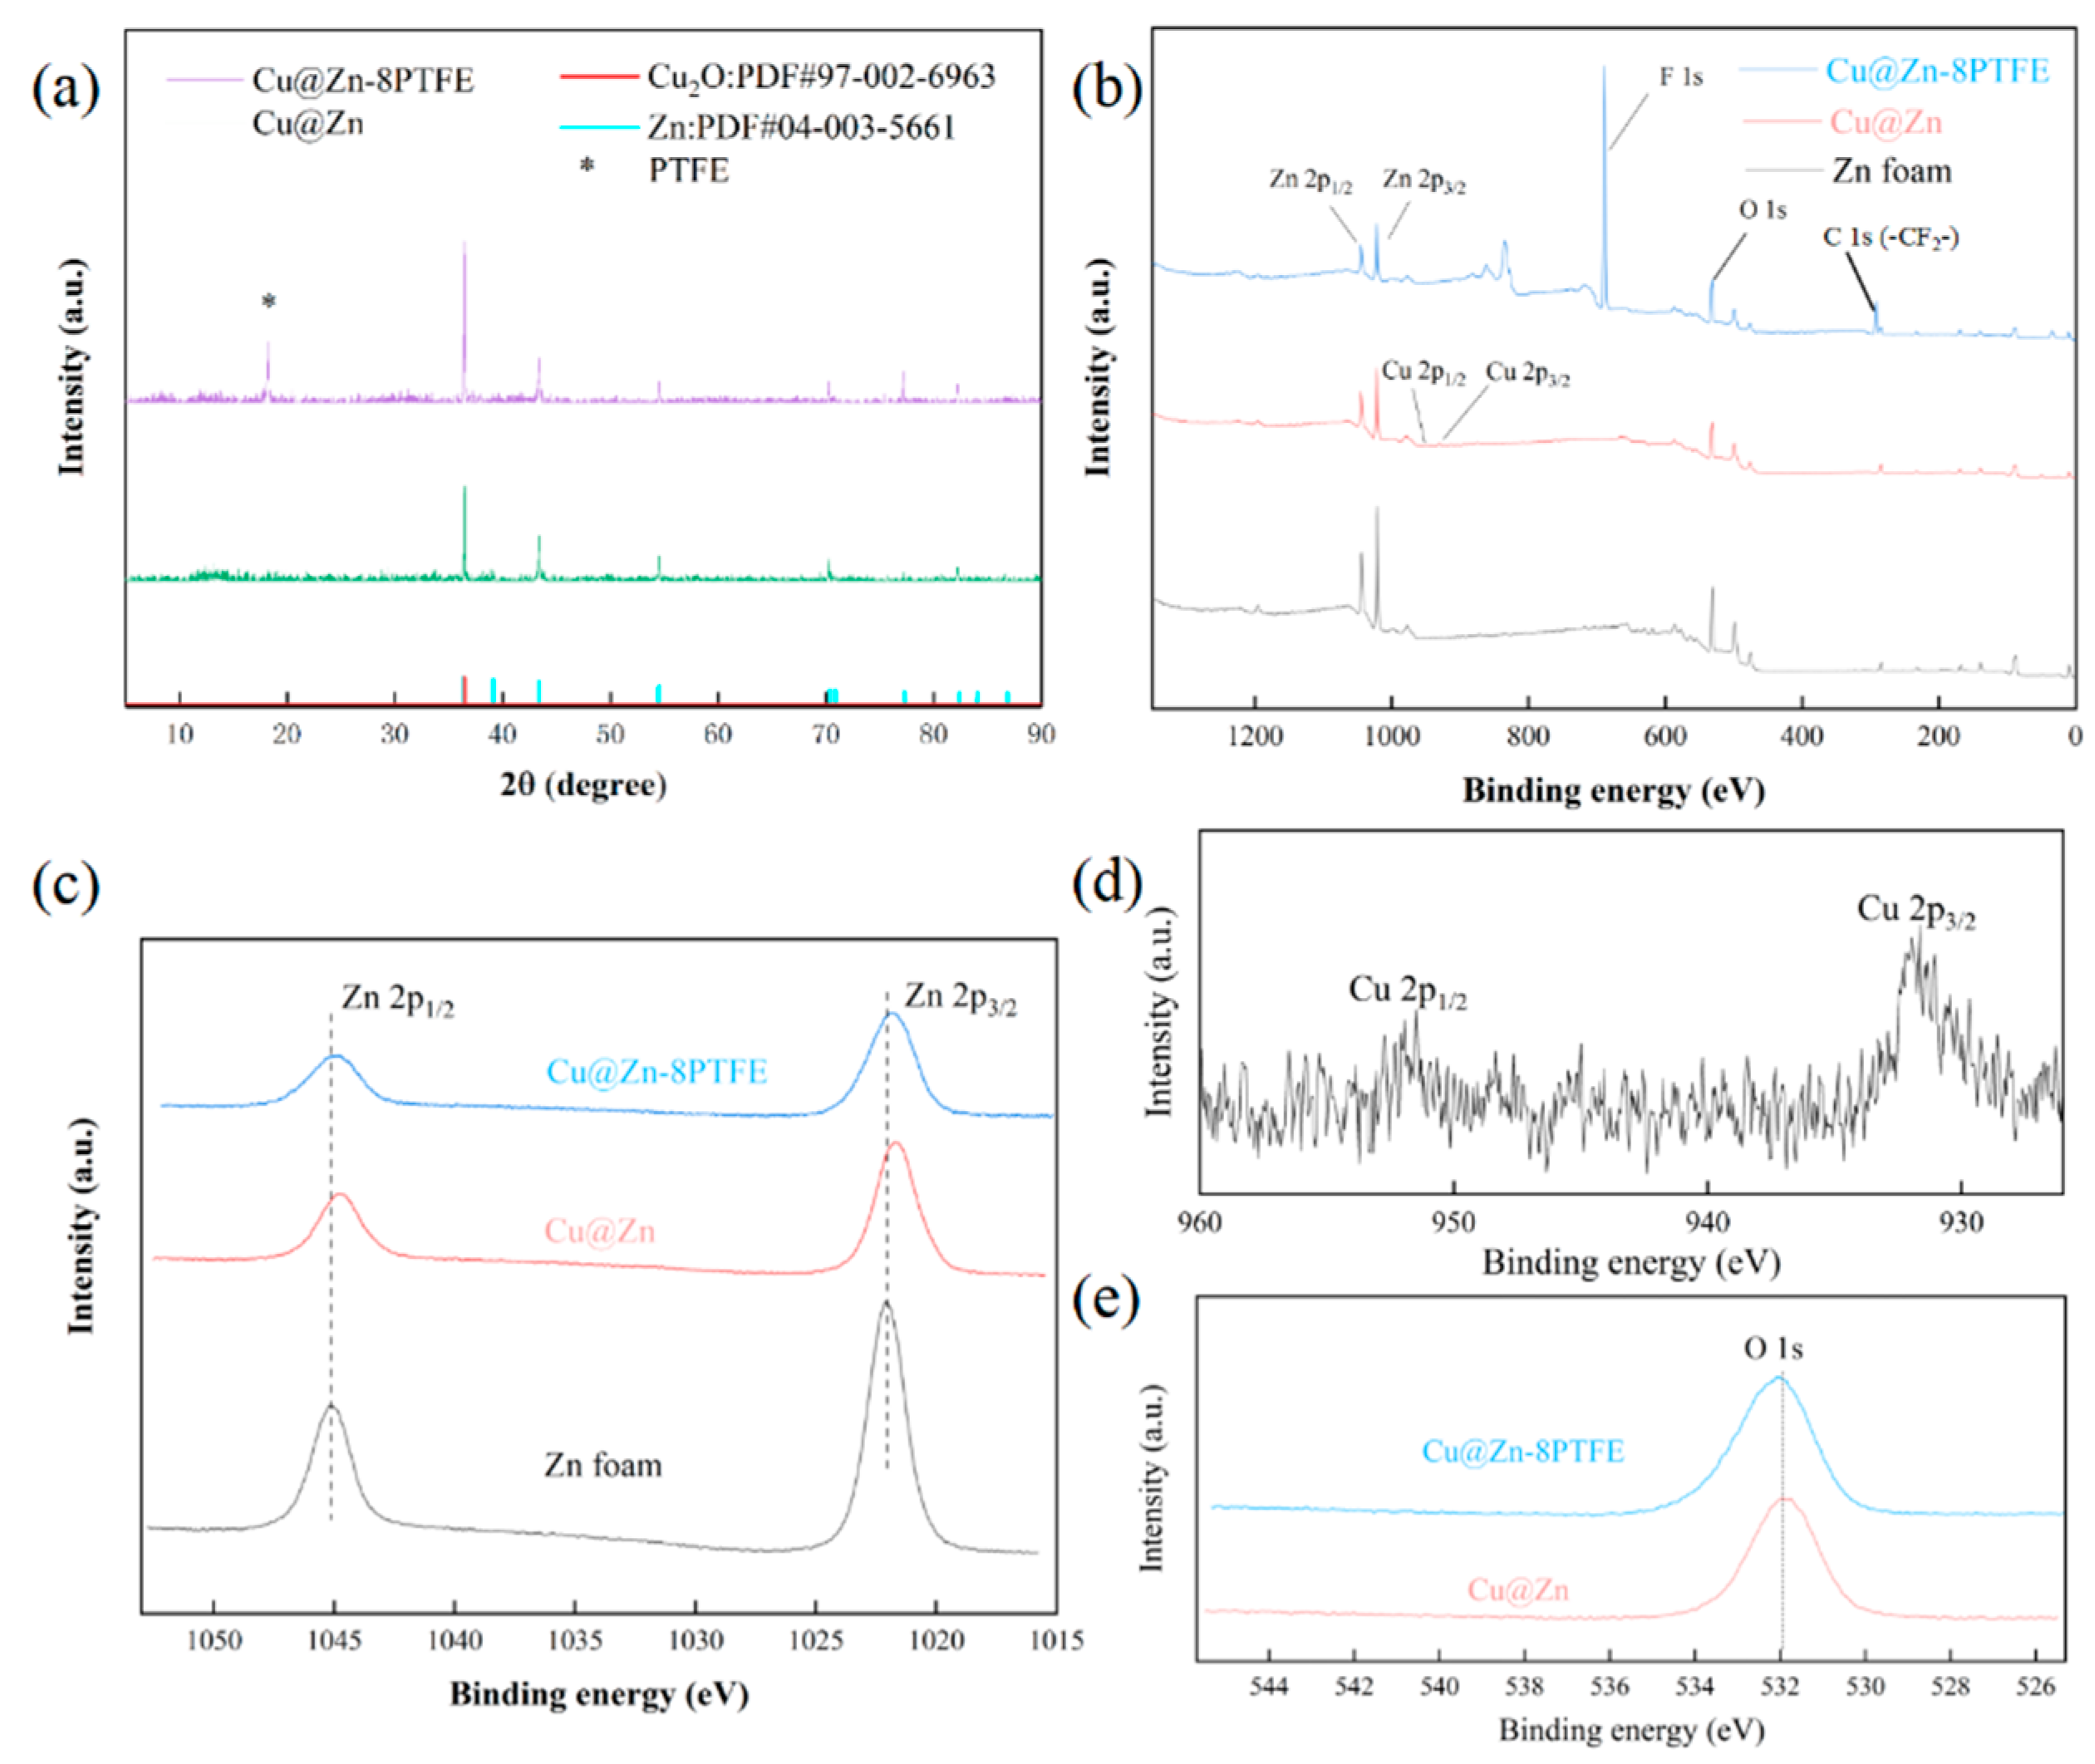
3.1. Characterization of Catalysts
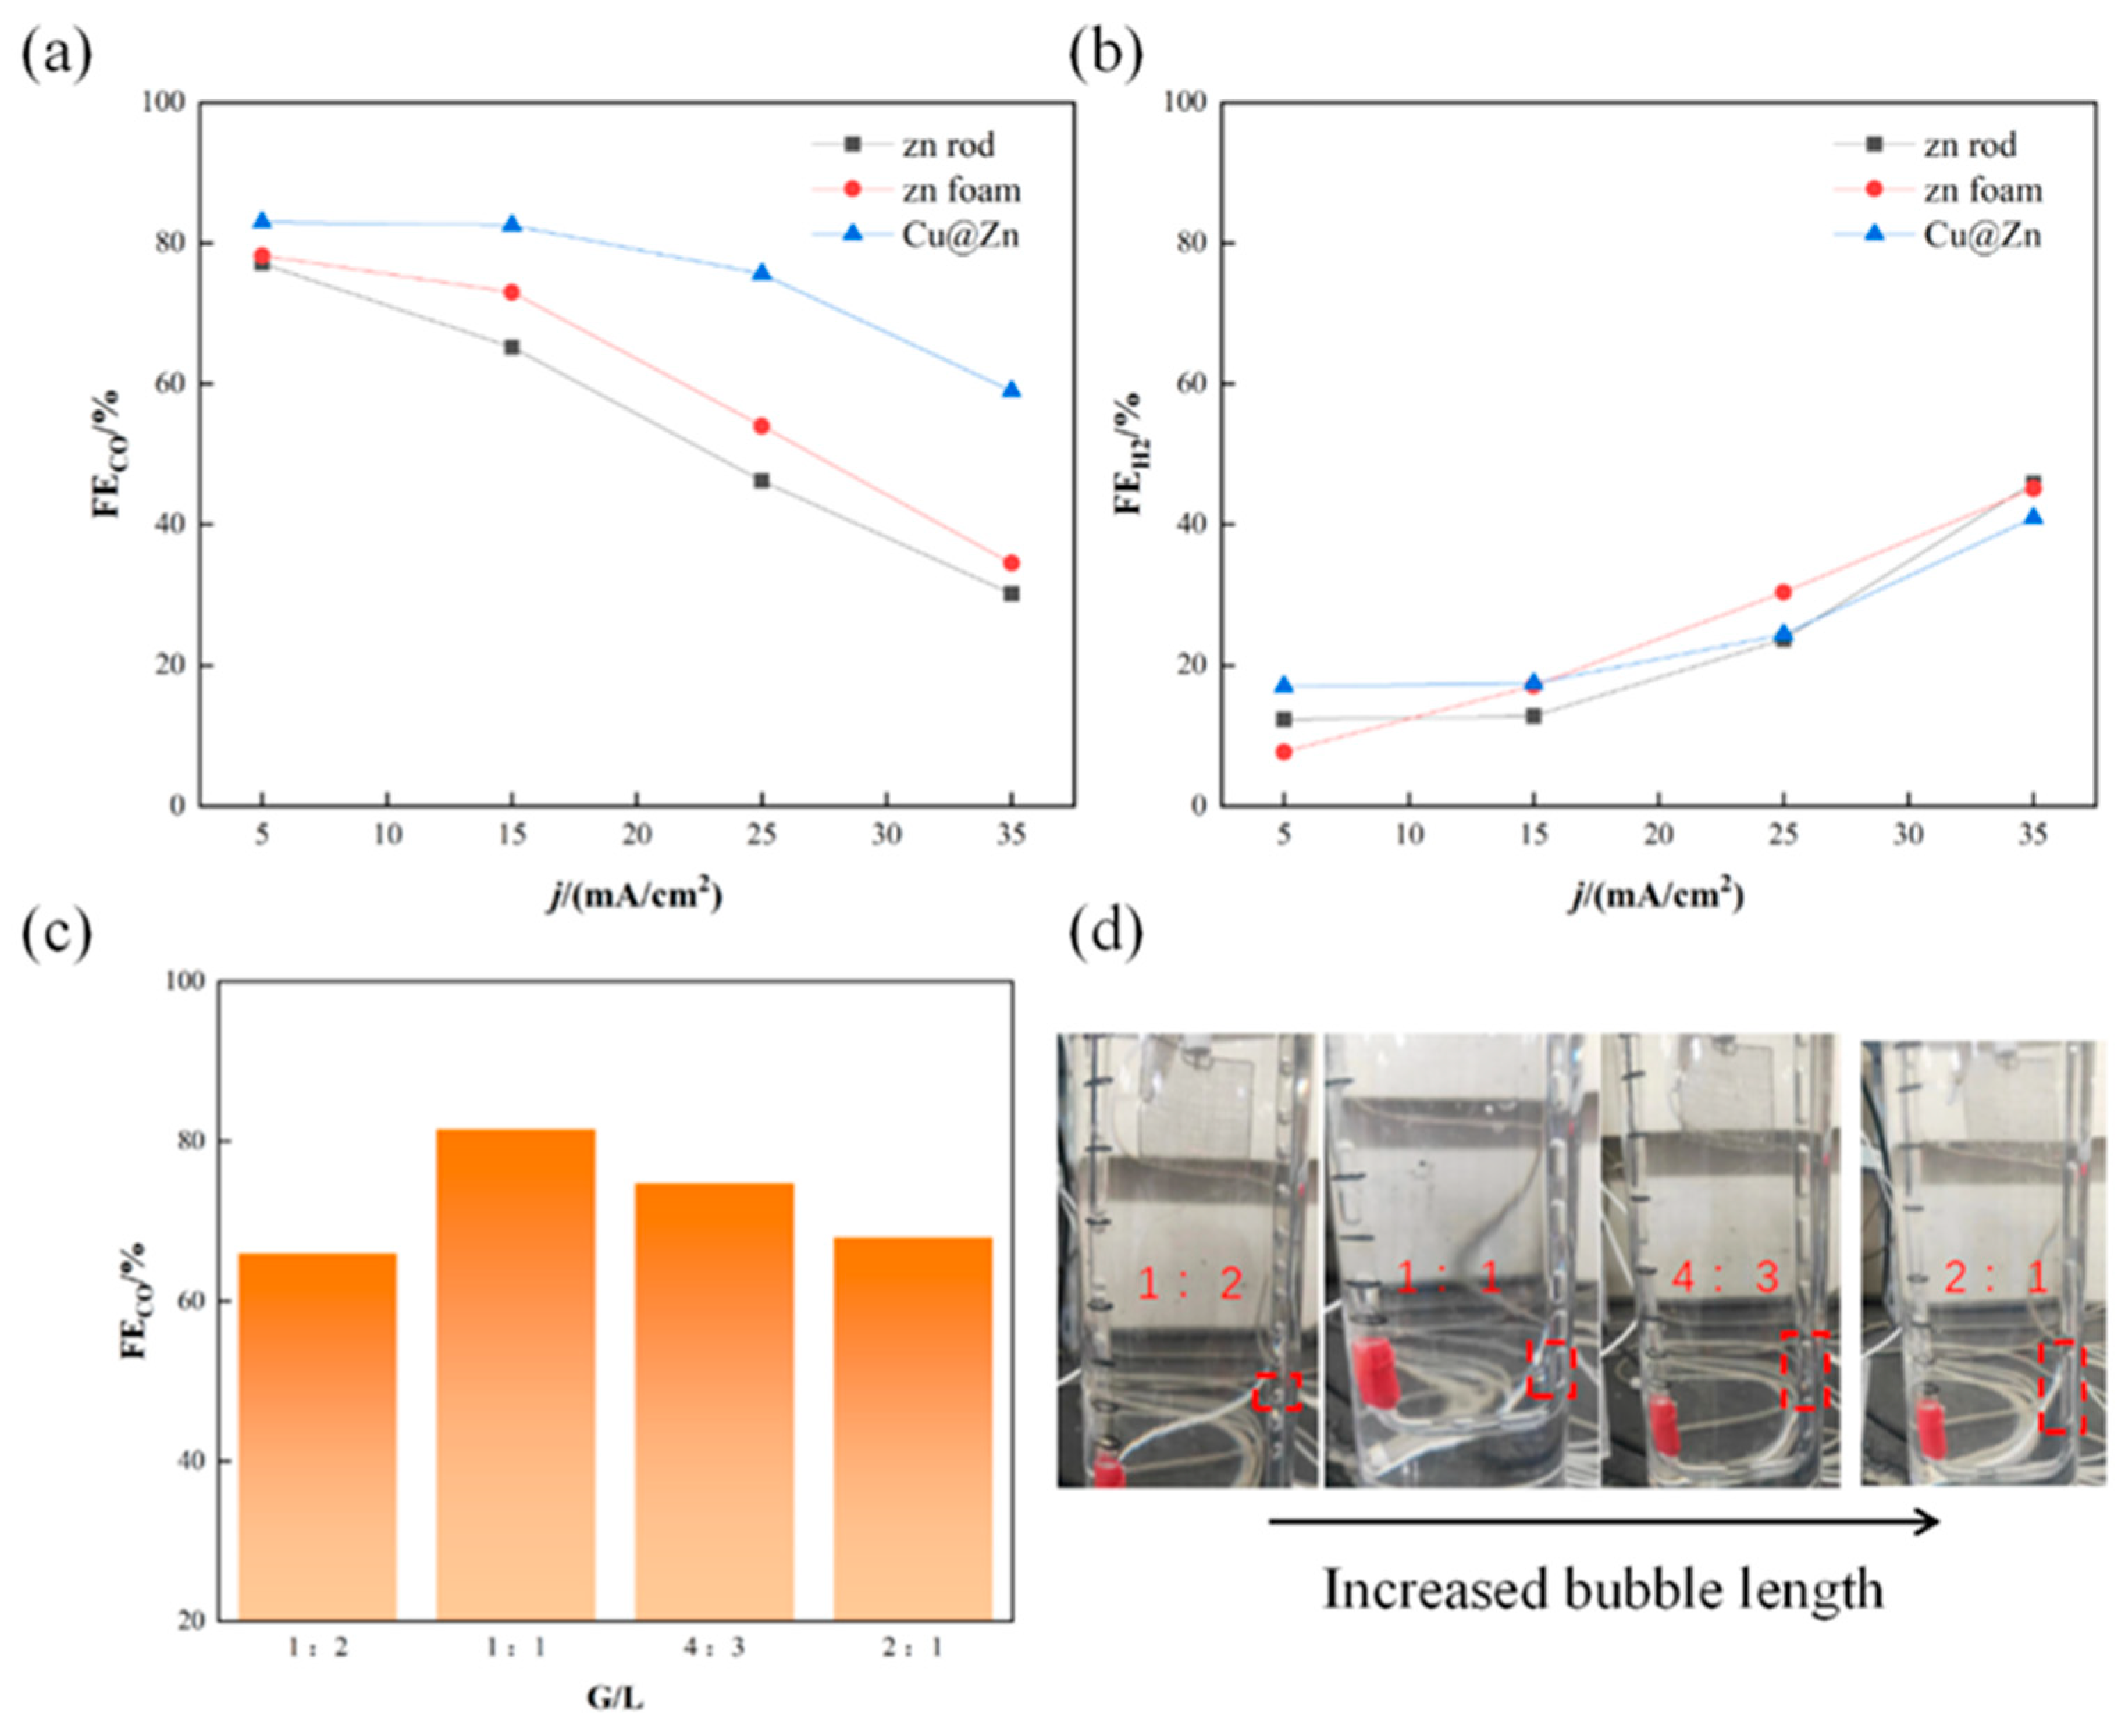
3.2. Cu@Zn Catalyst Performance and Reactor Optimization
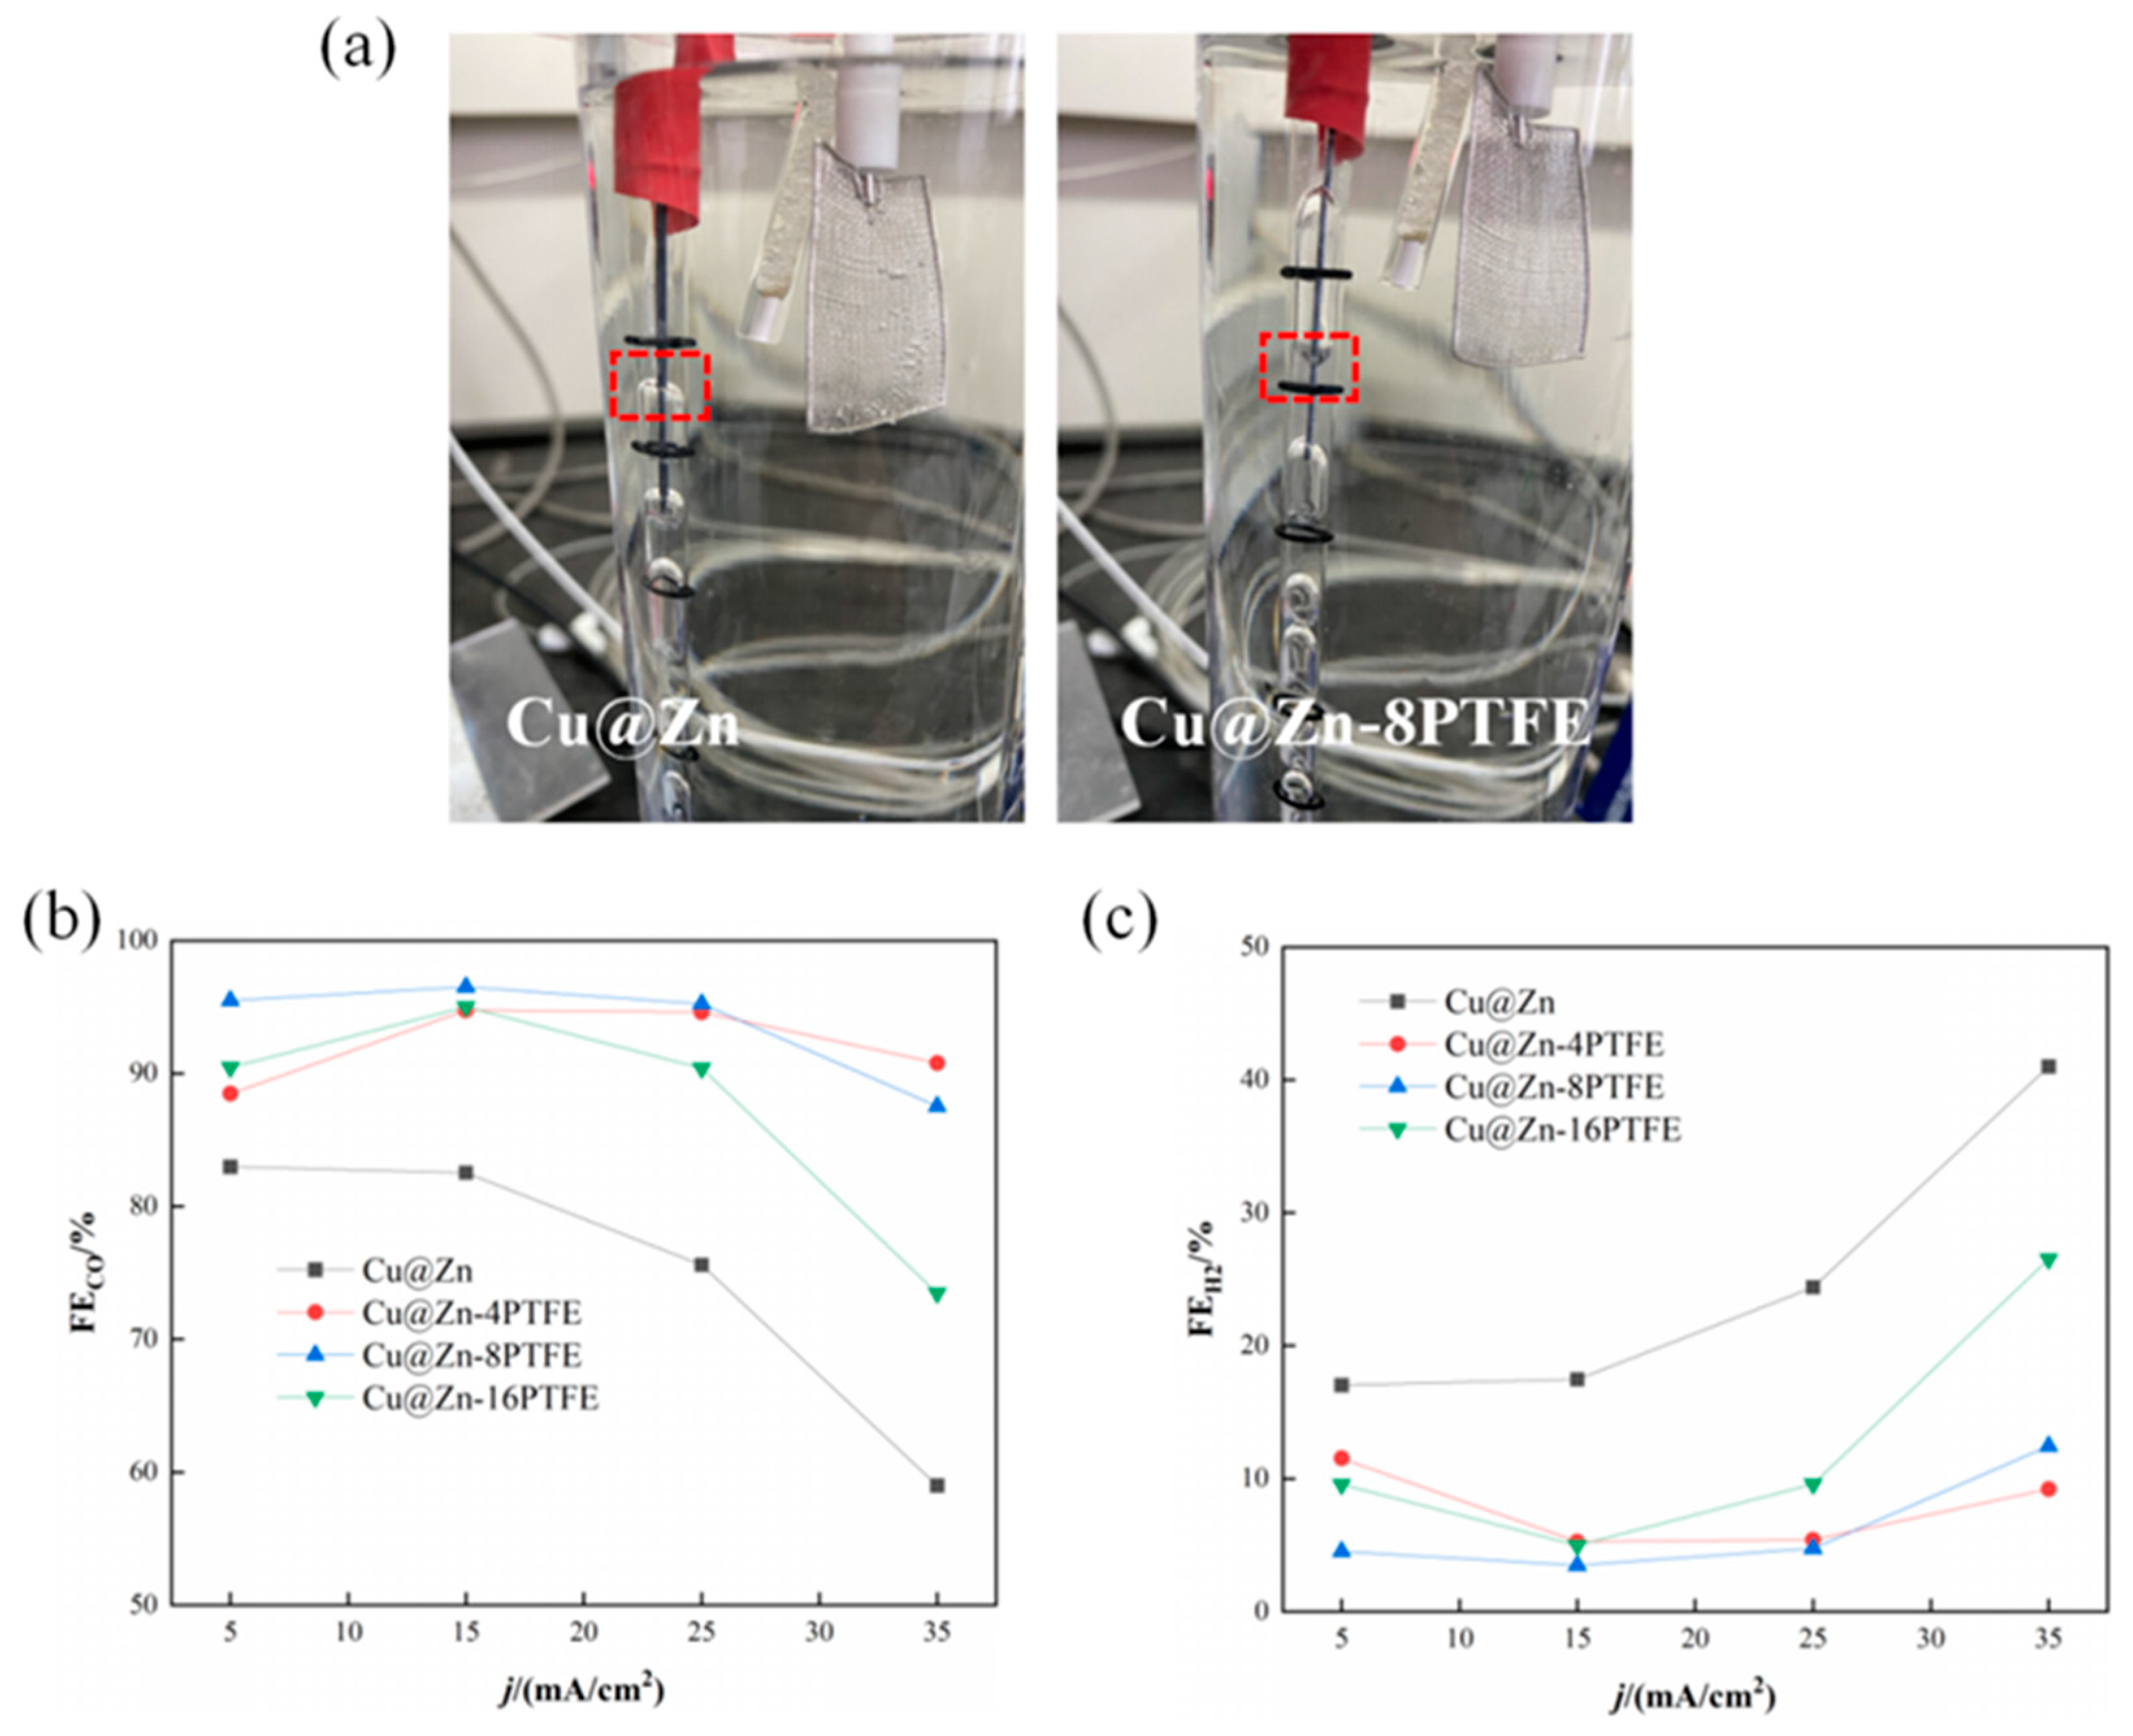
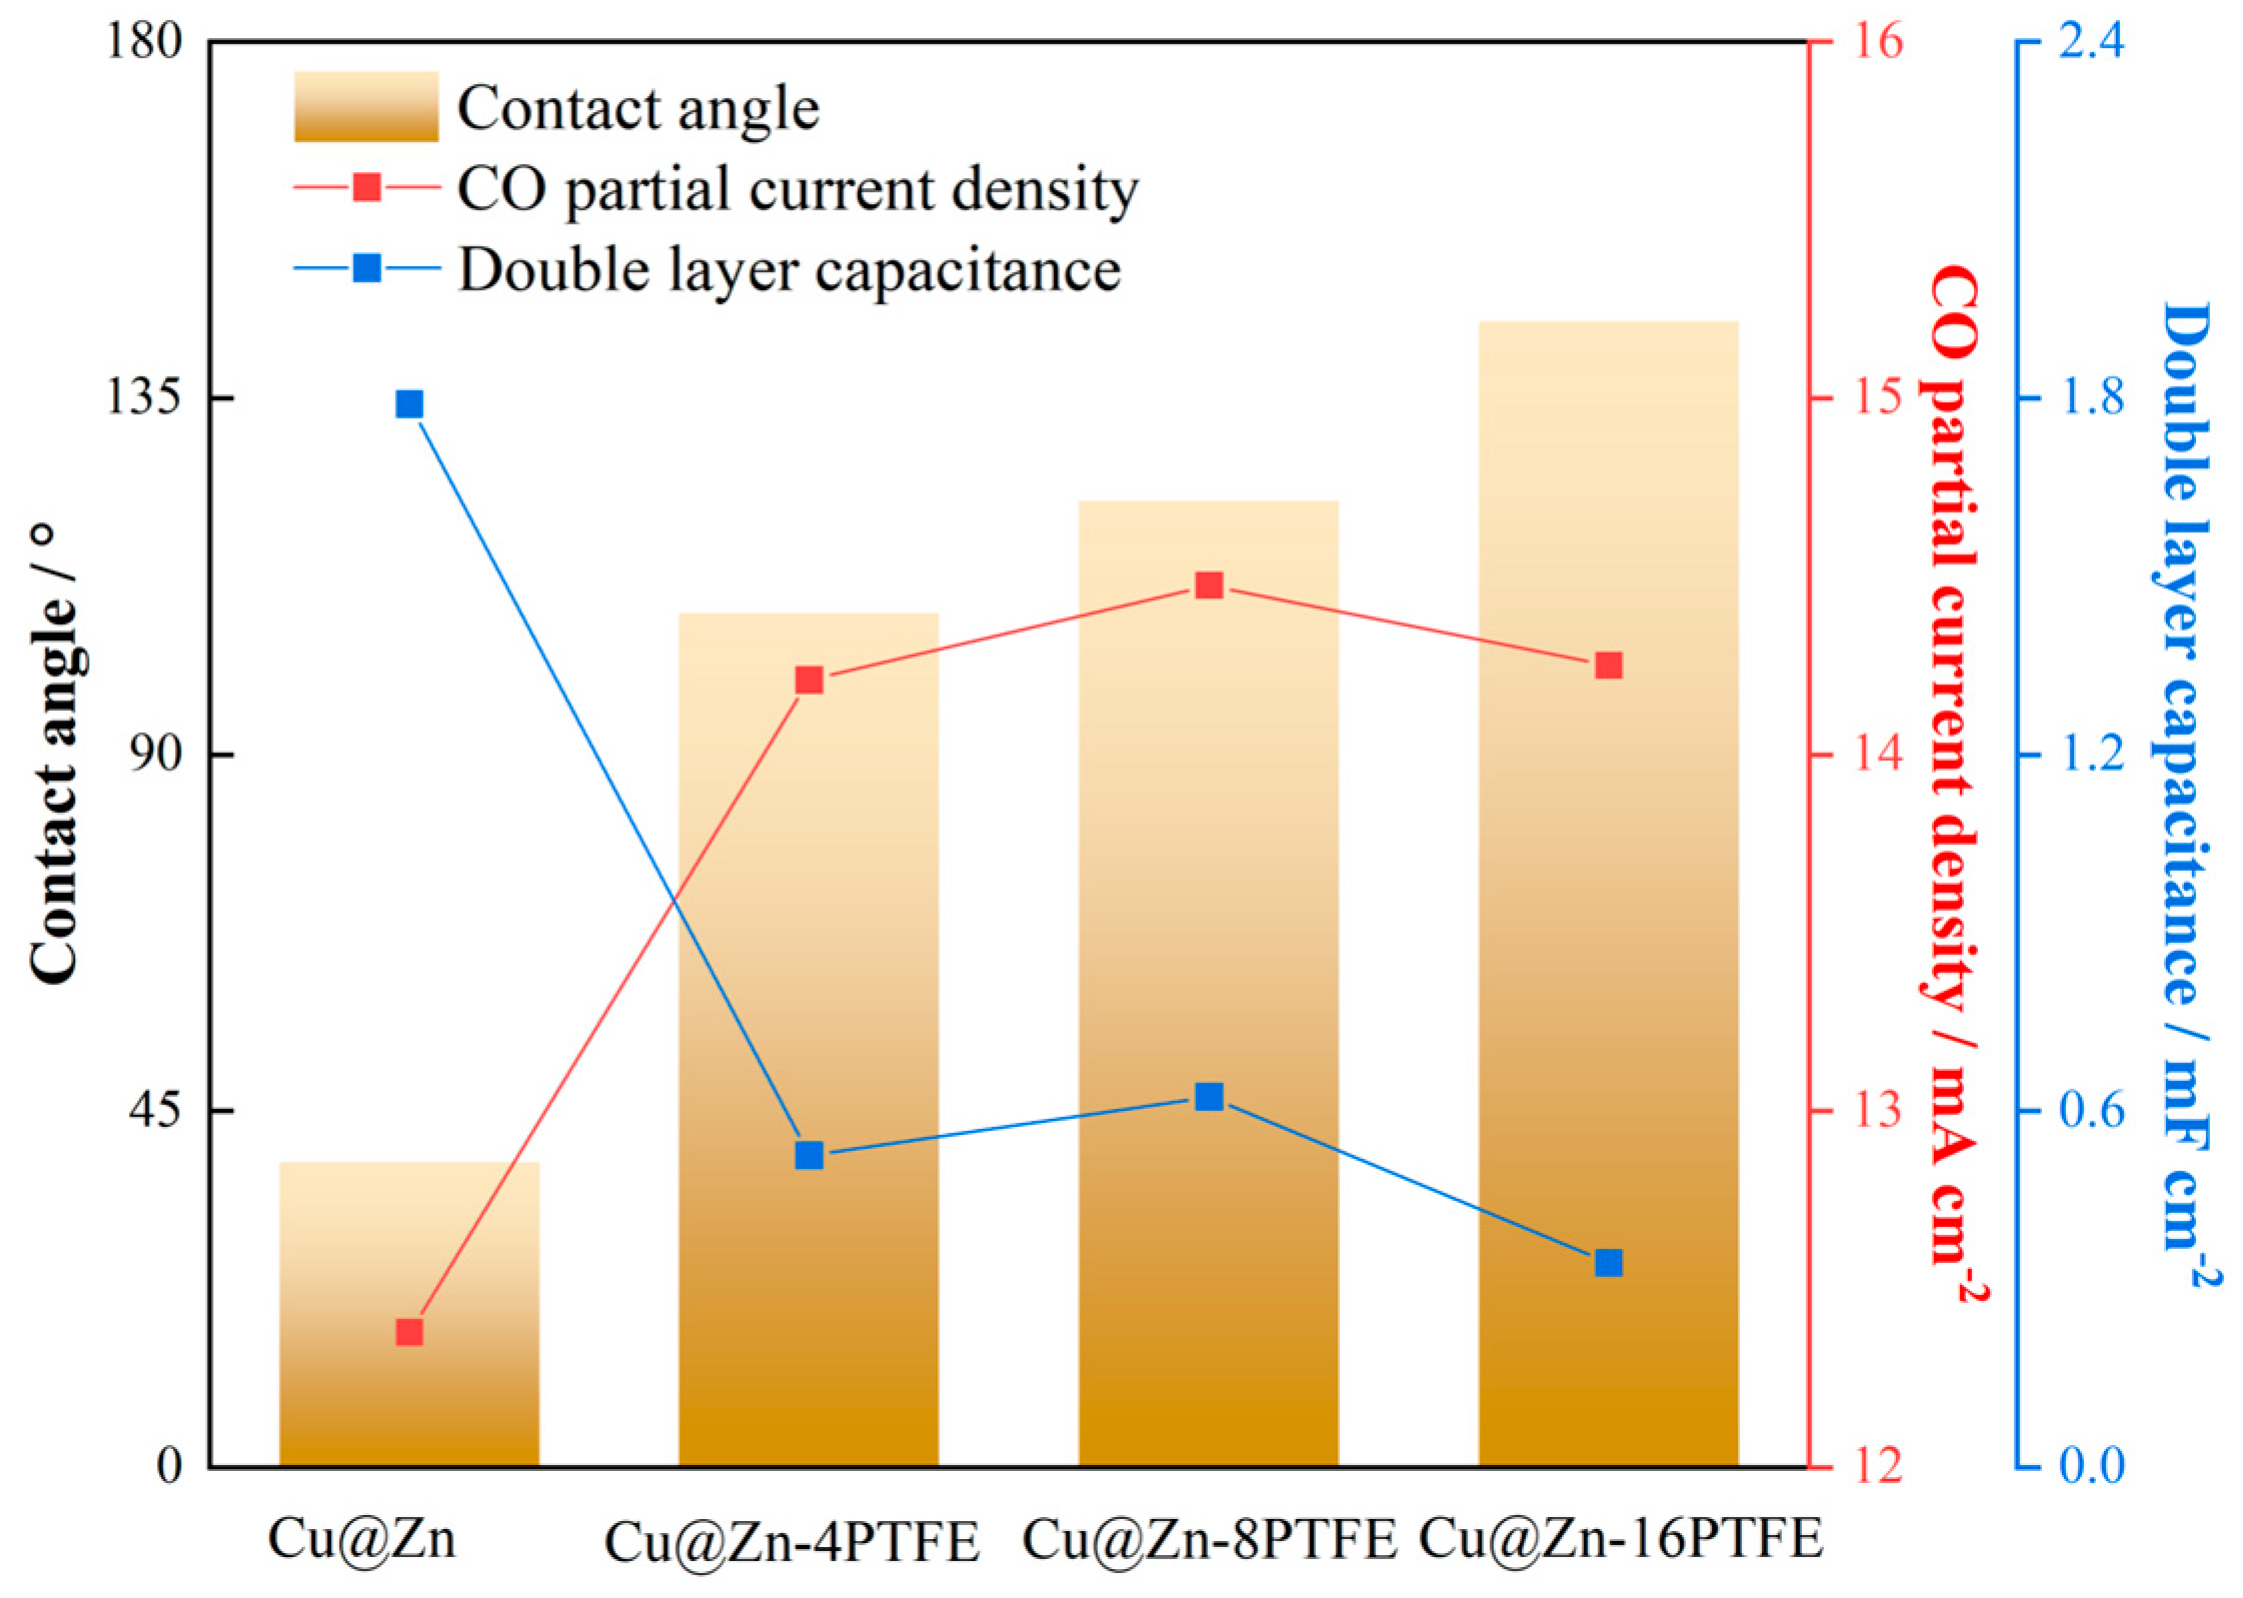
3.3. Hydrophobic Modification of Cu@Zn Catalysts
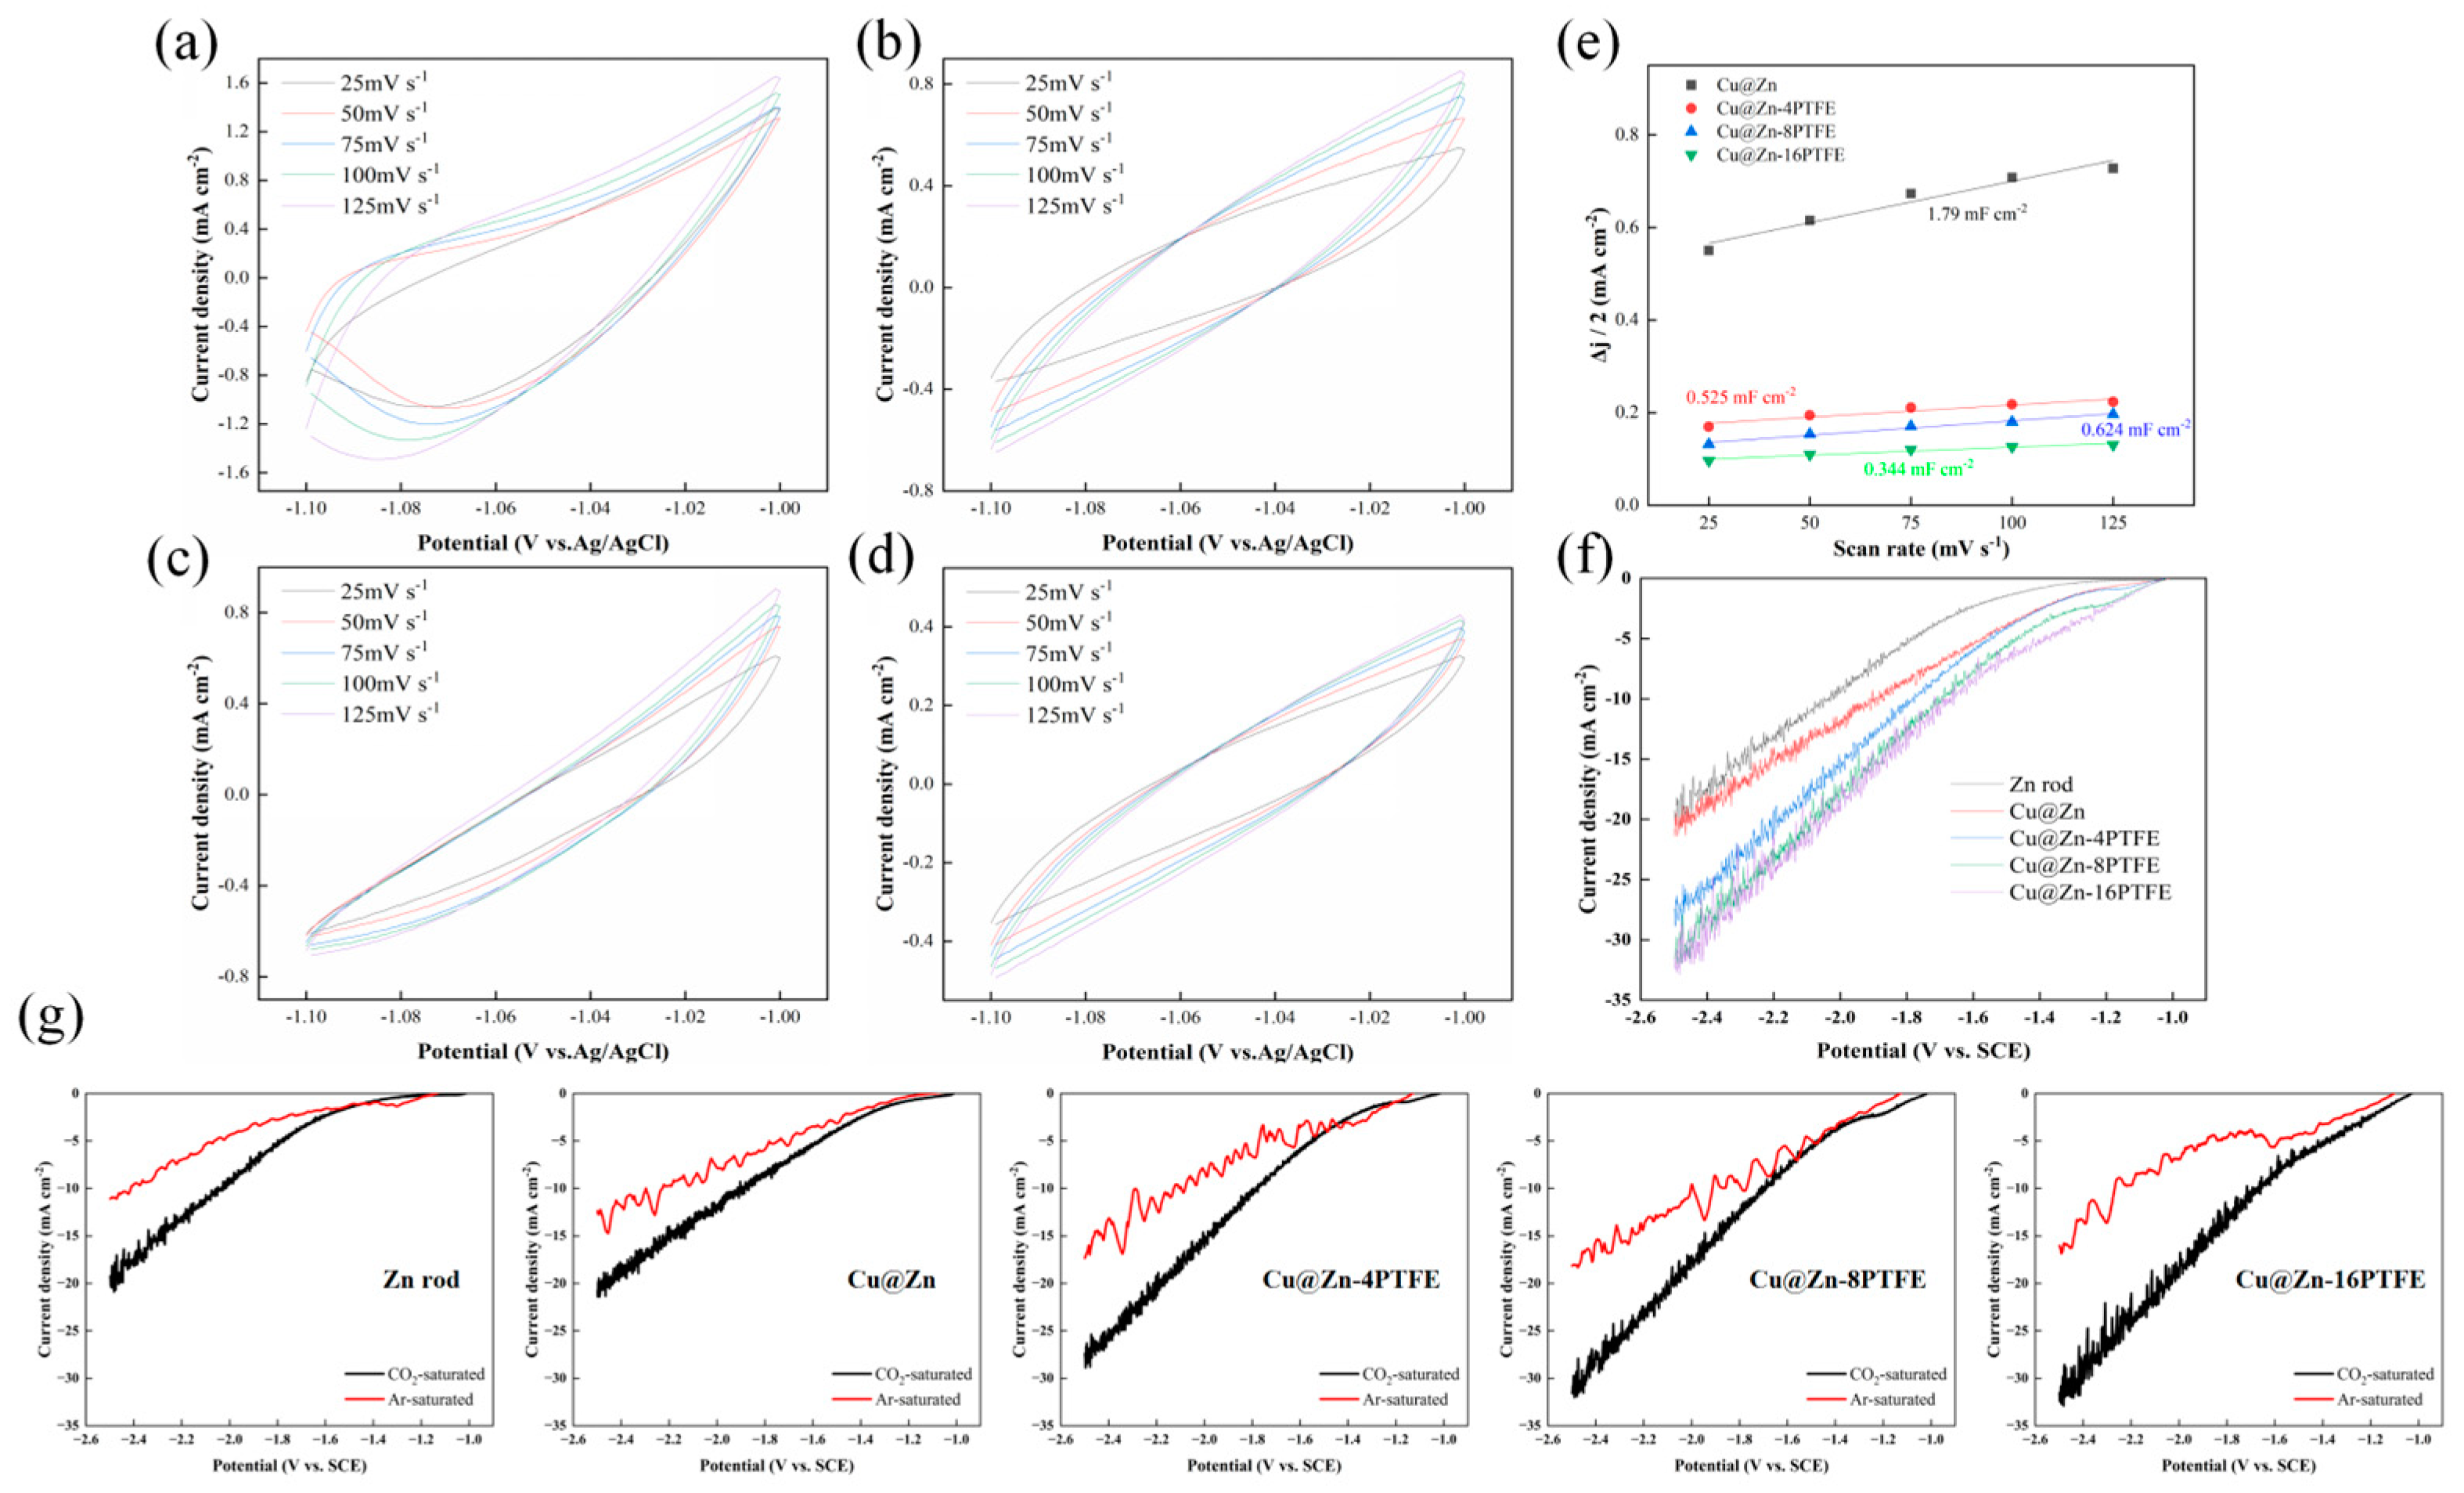
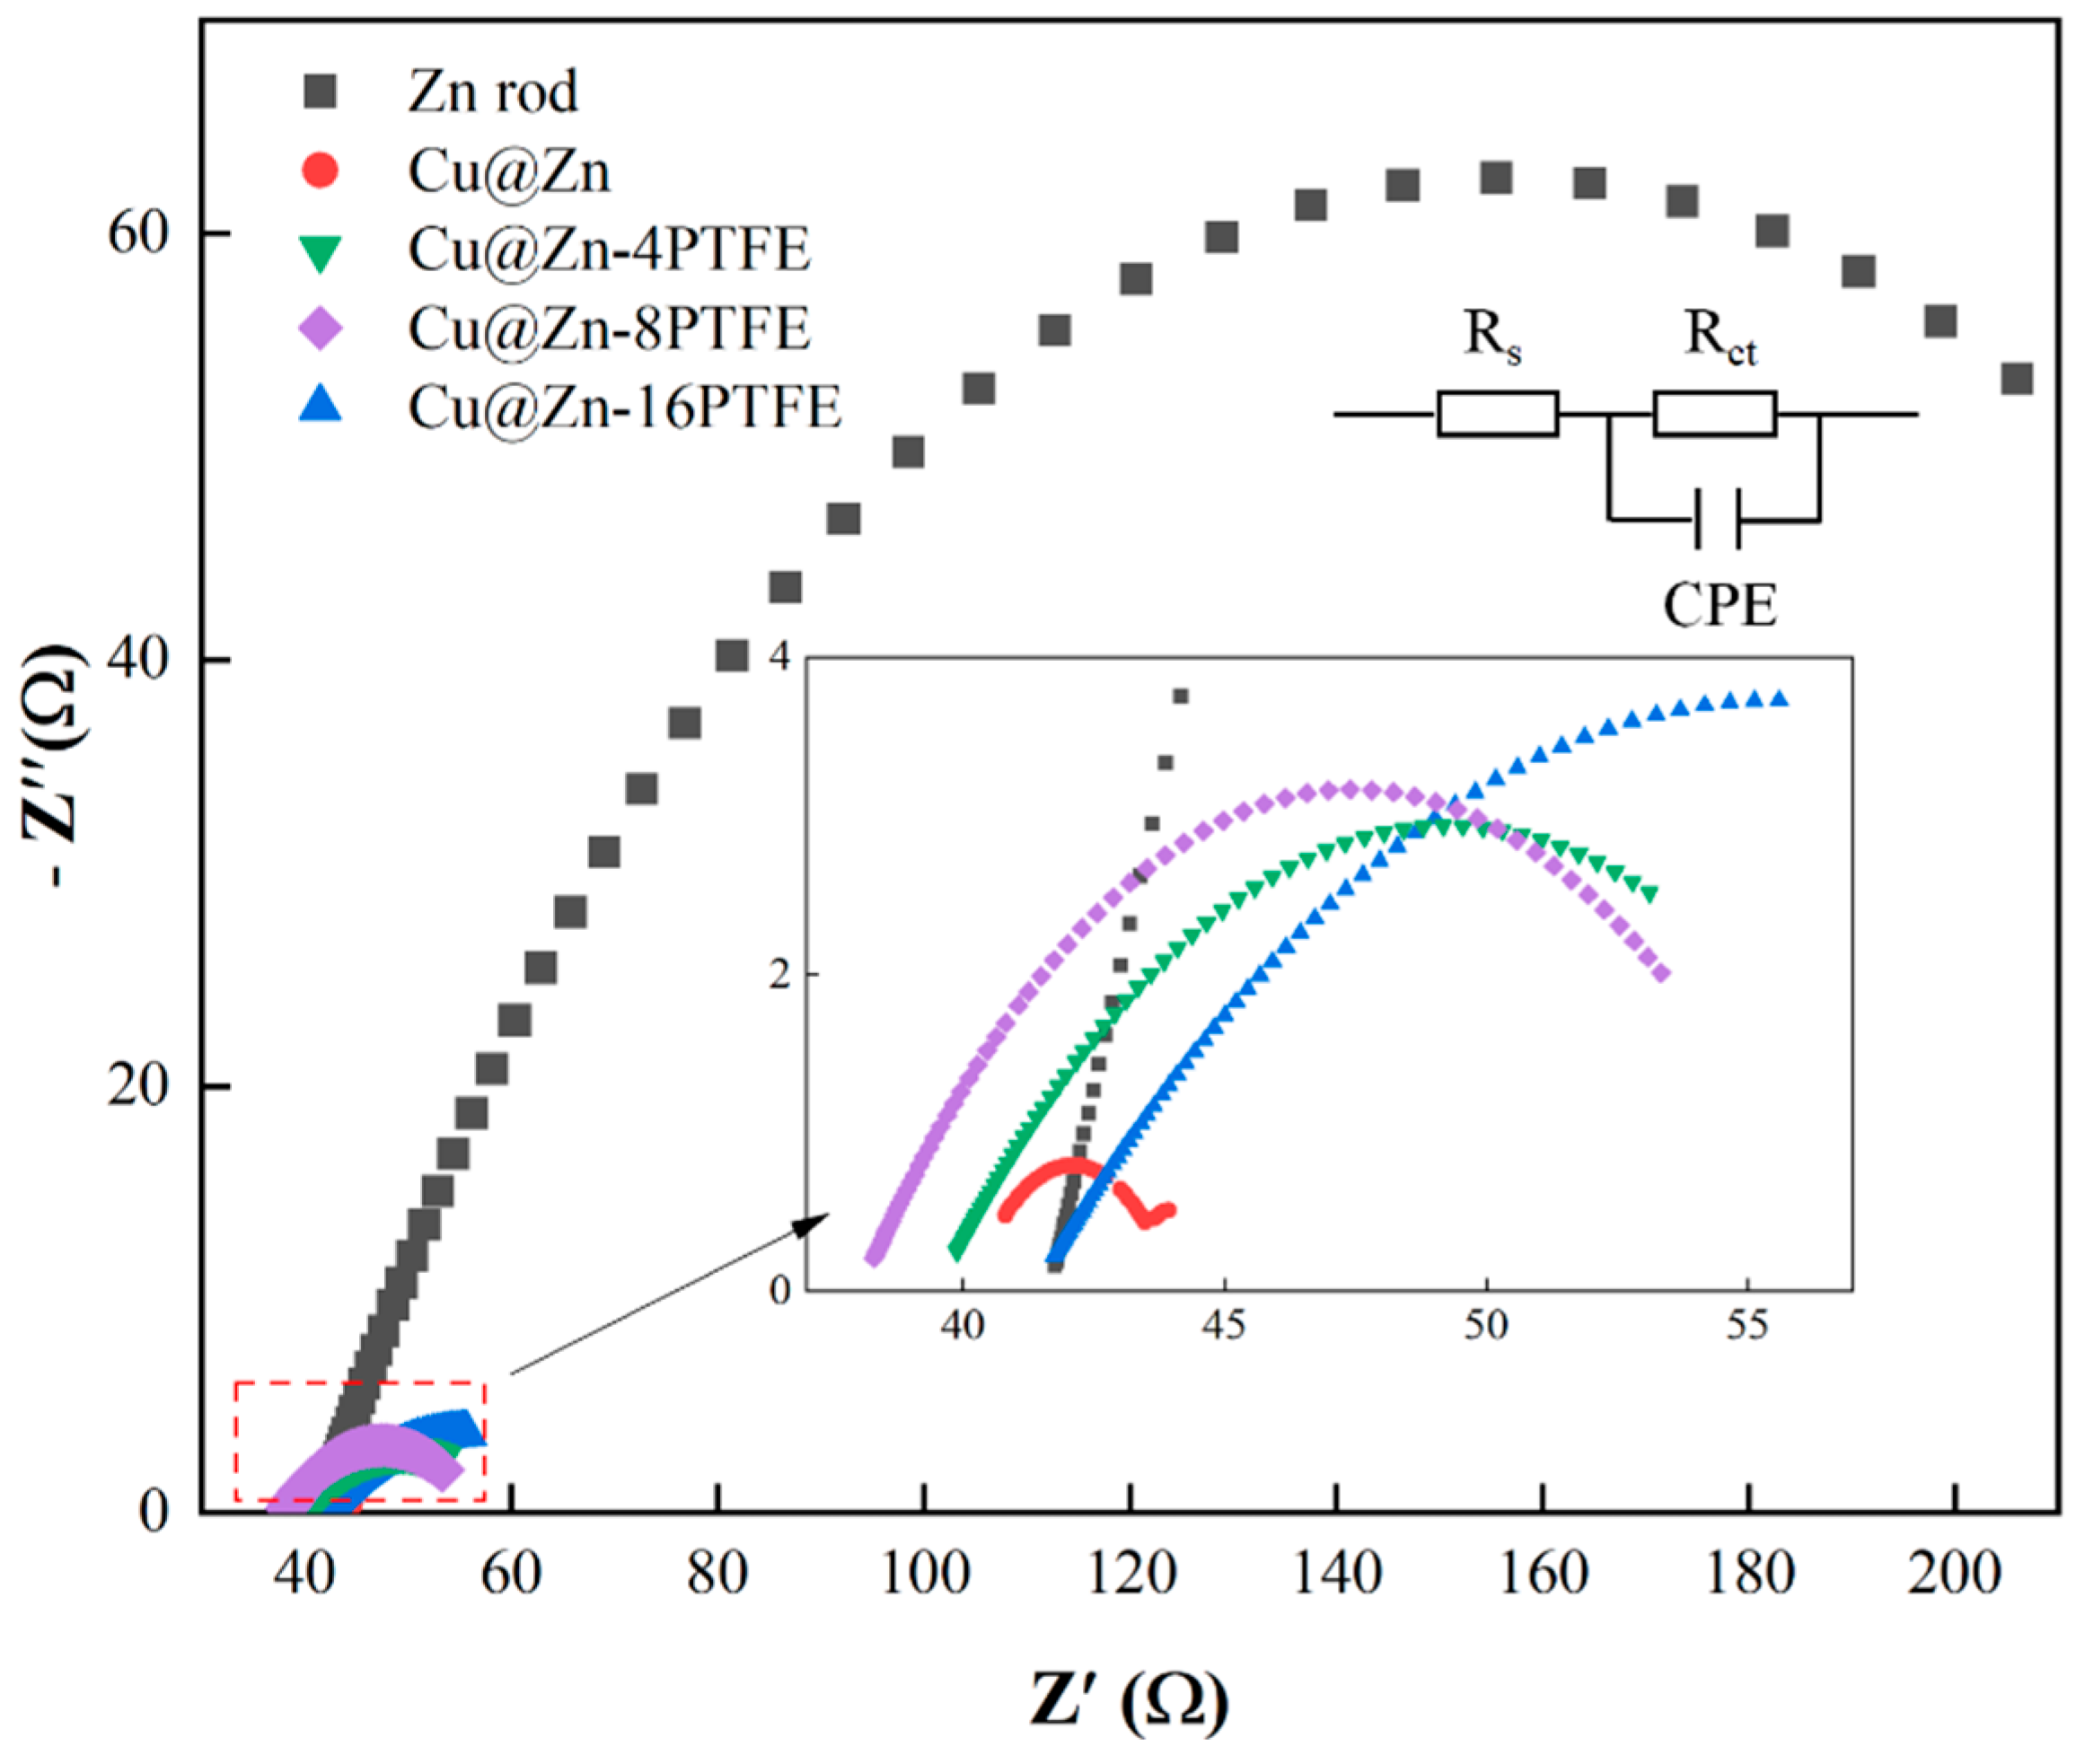
3.4. Mechanistic Insights into the Role of Hydrophobicity
3.5. Long-Term Stability Evaluation
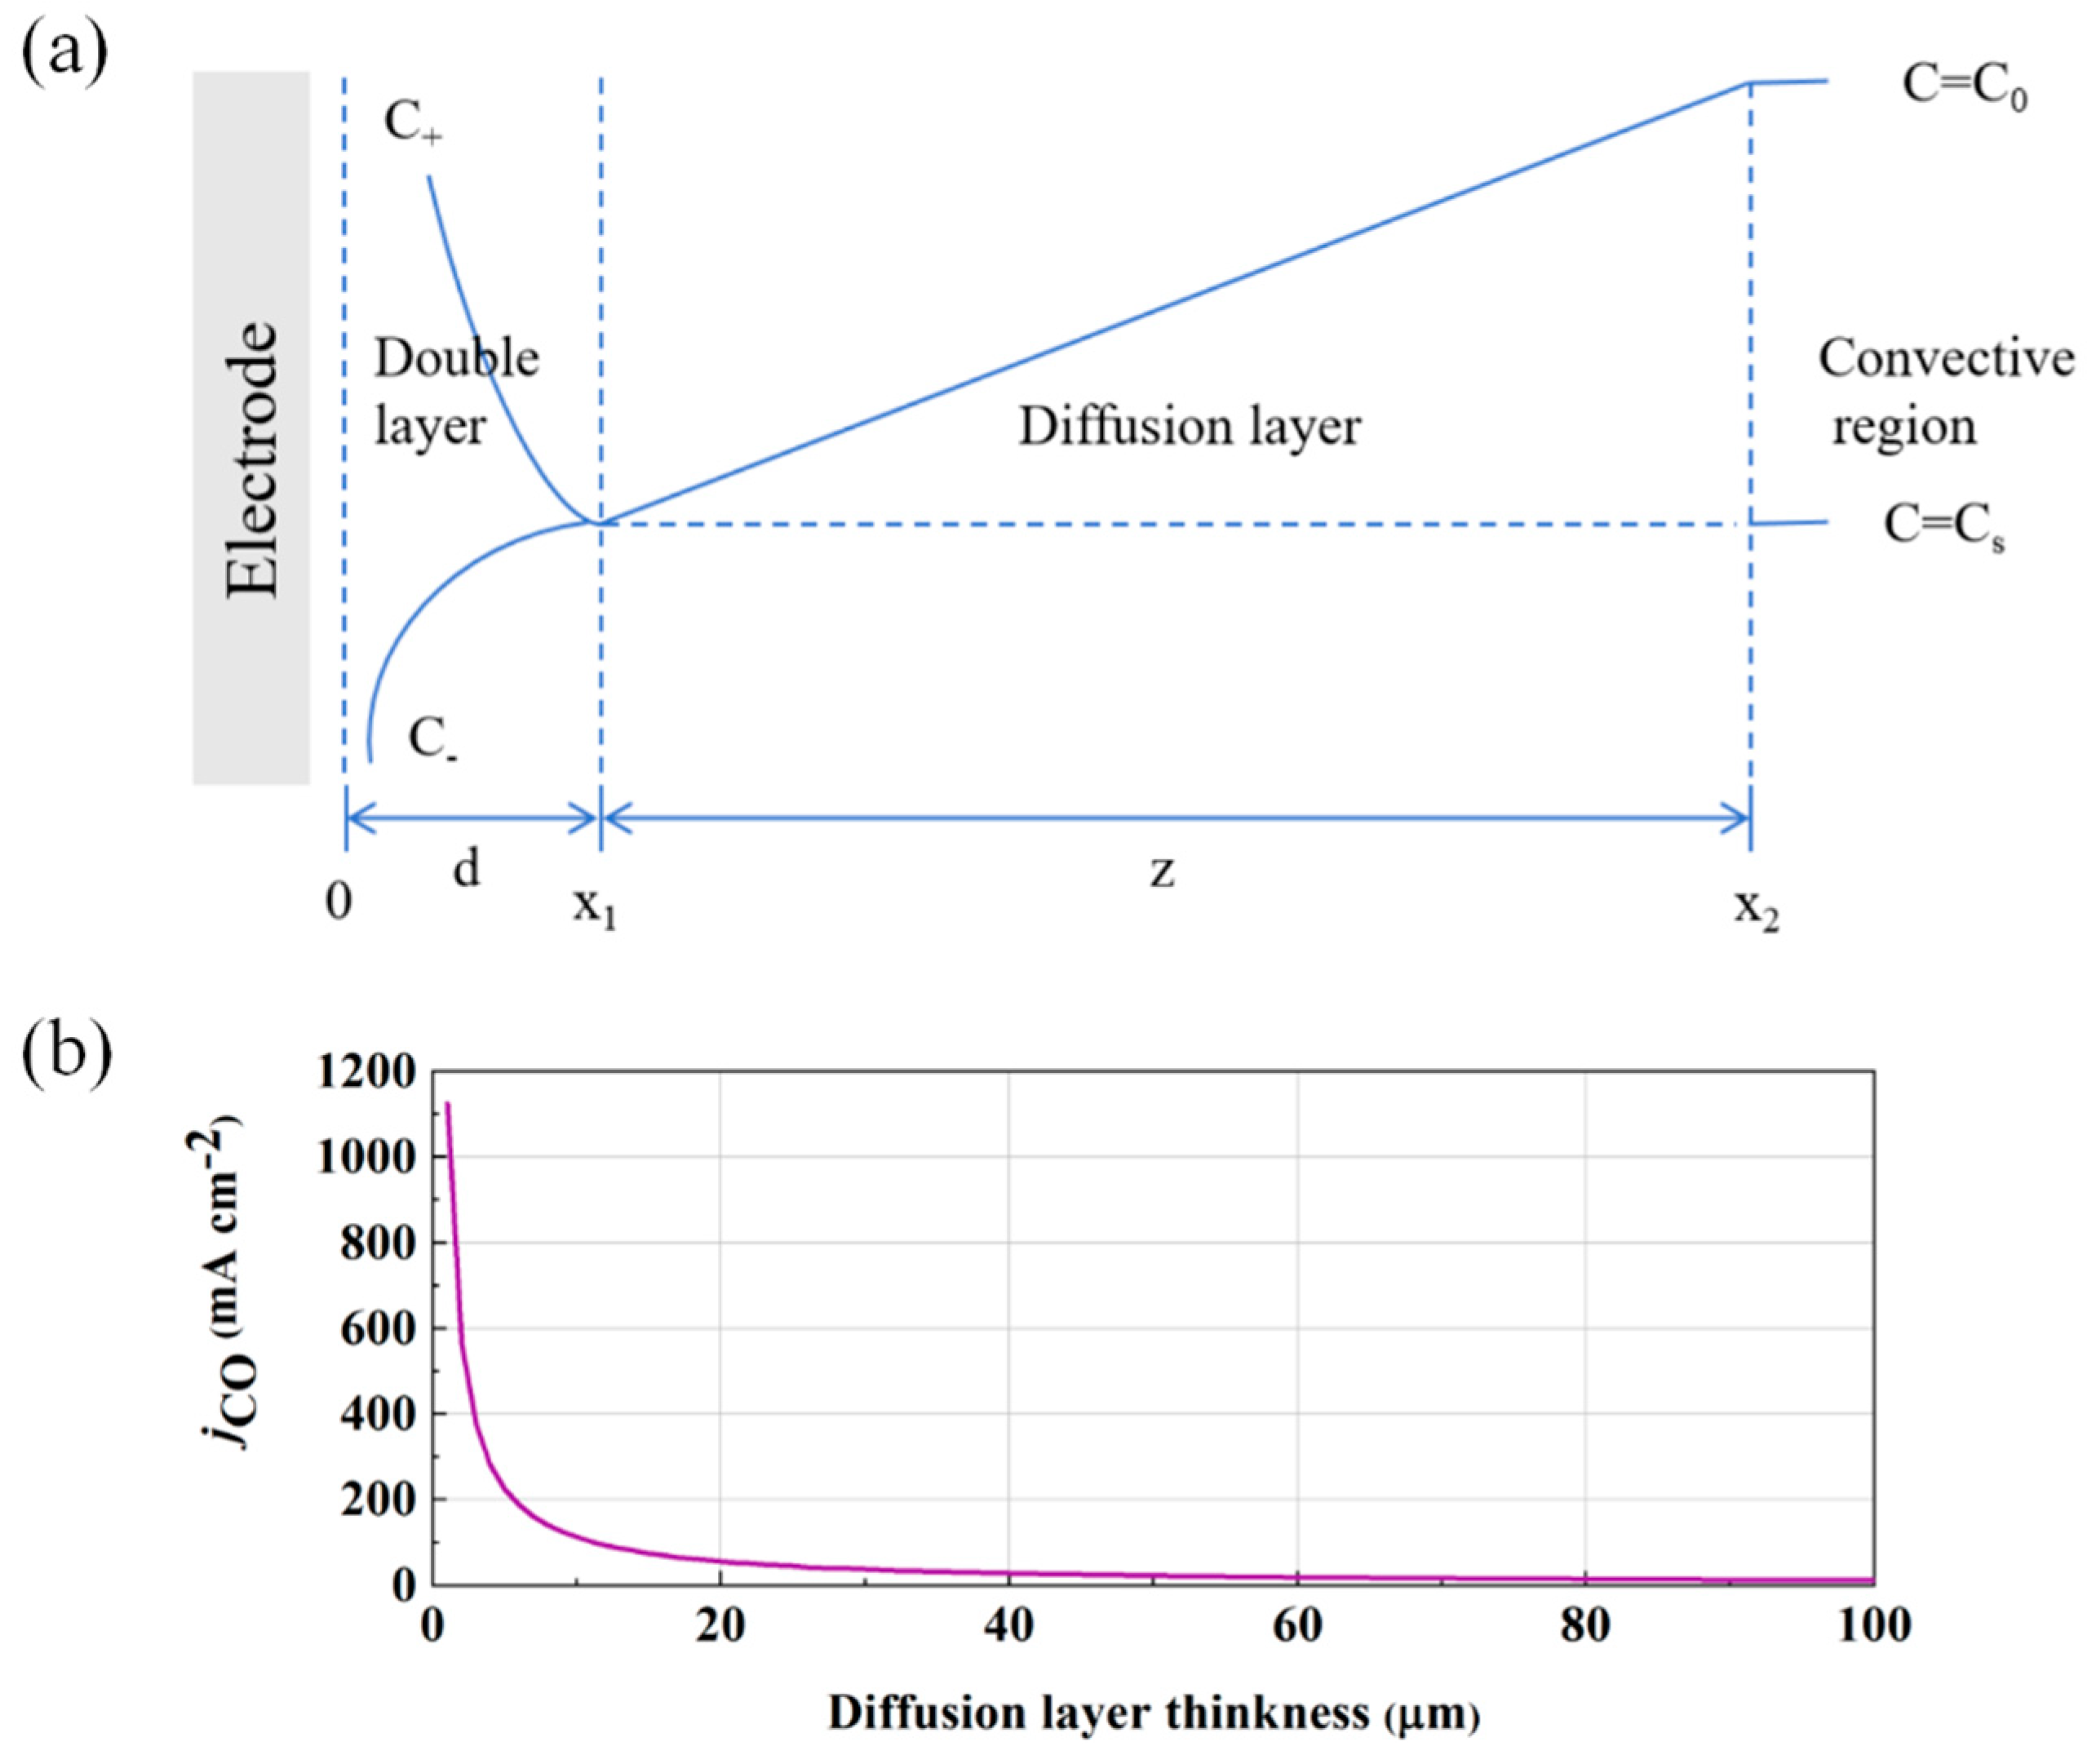
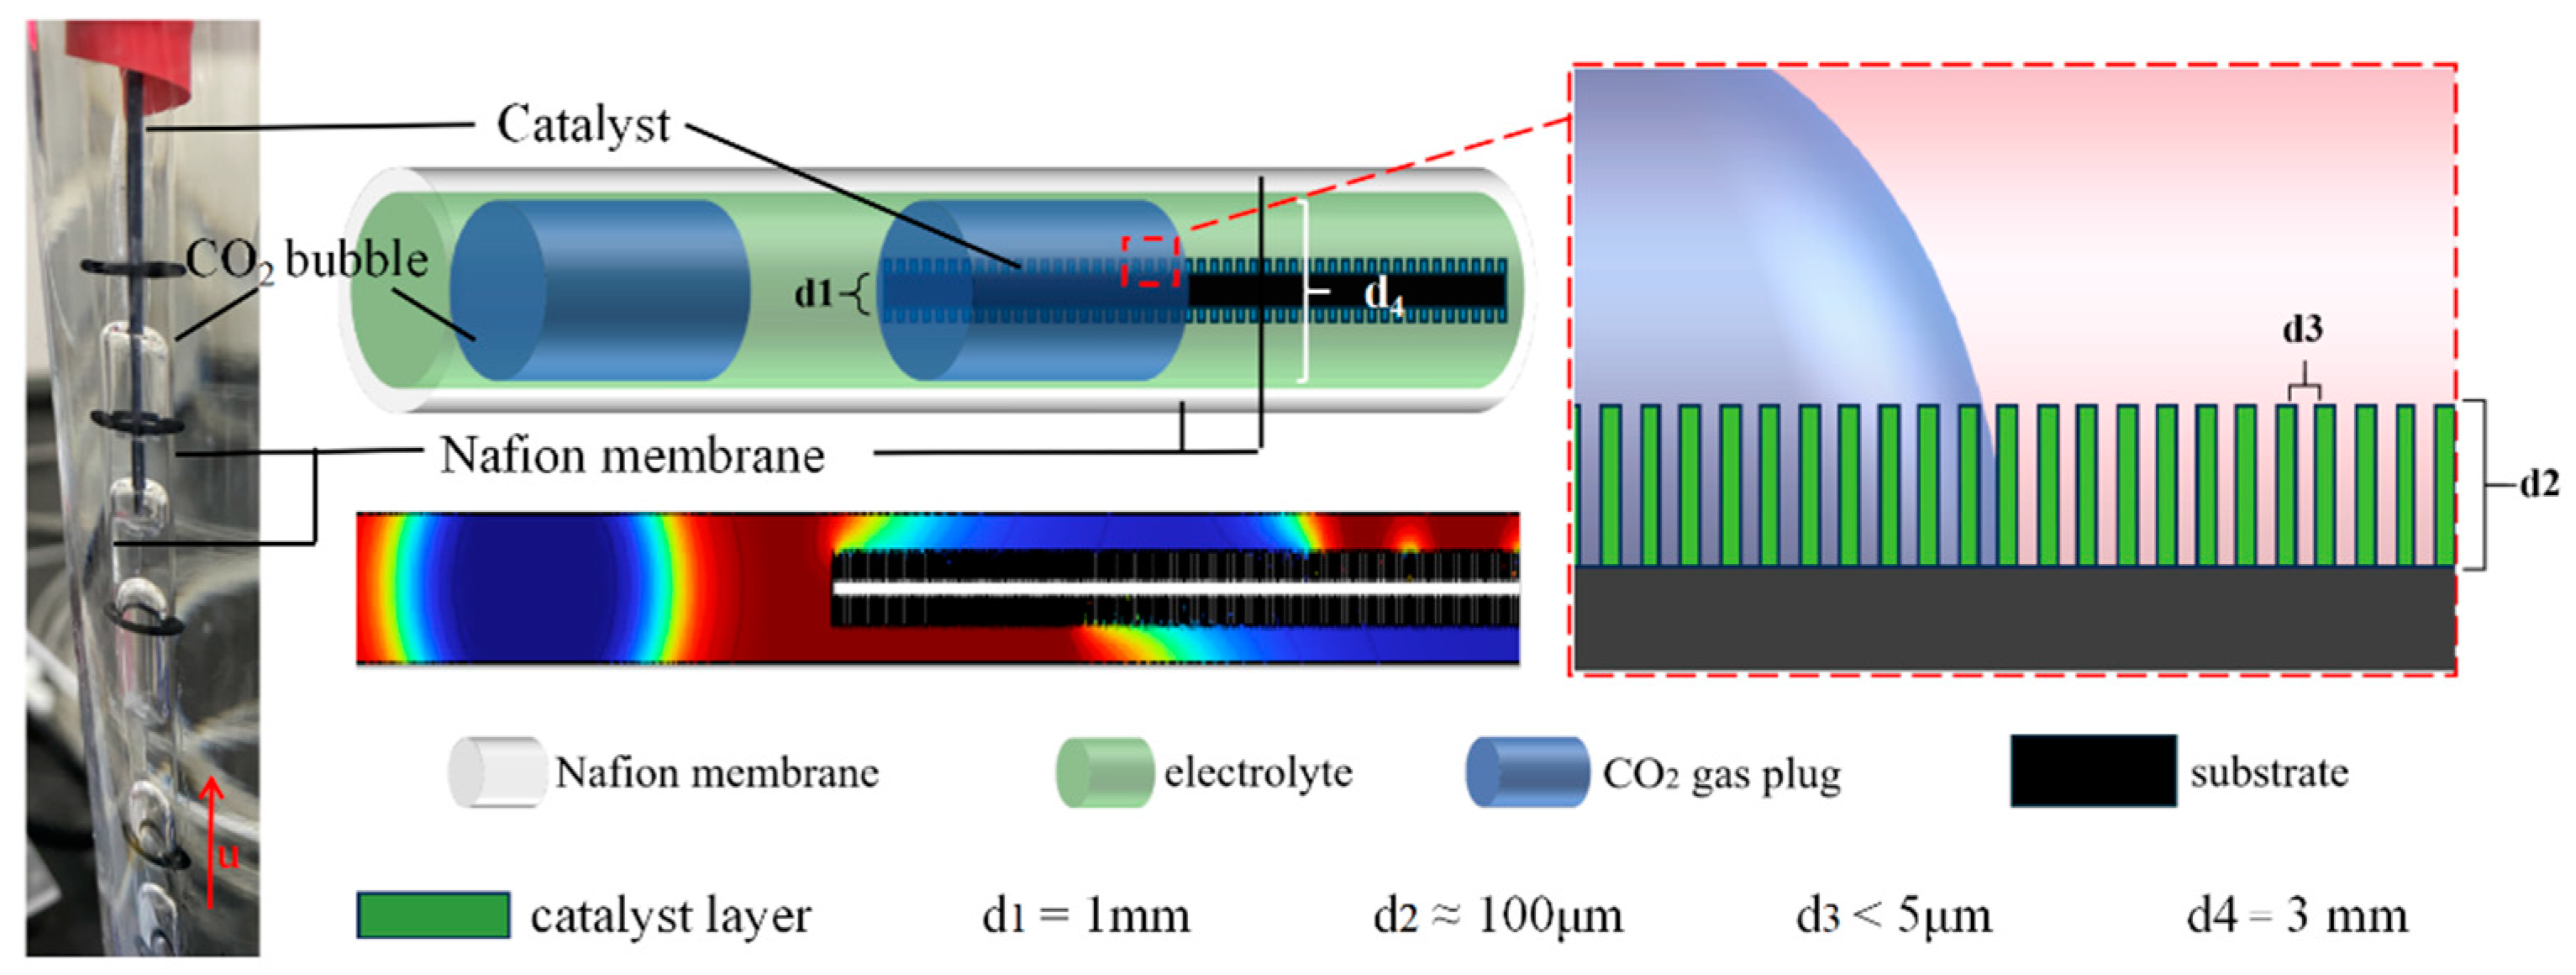
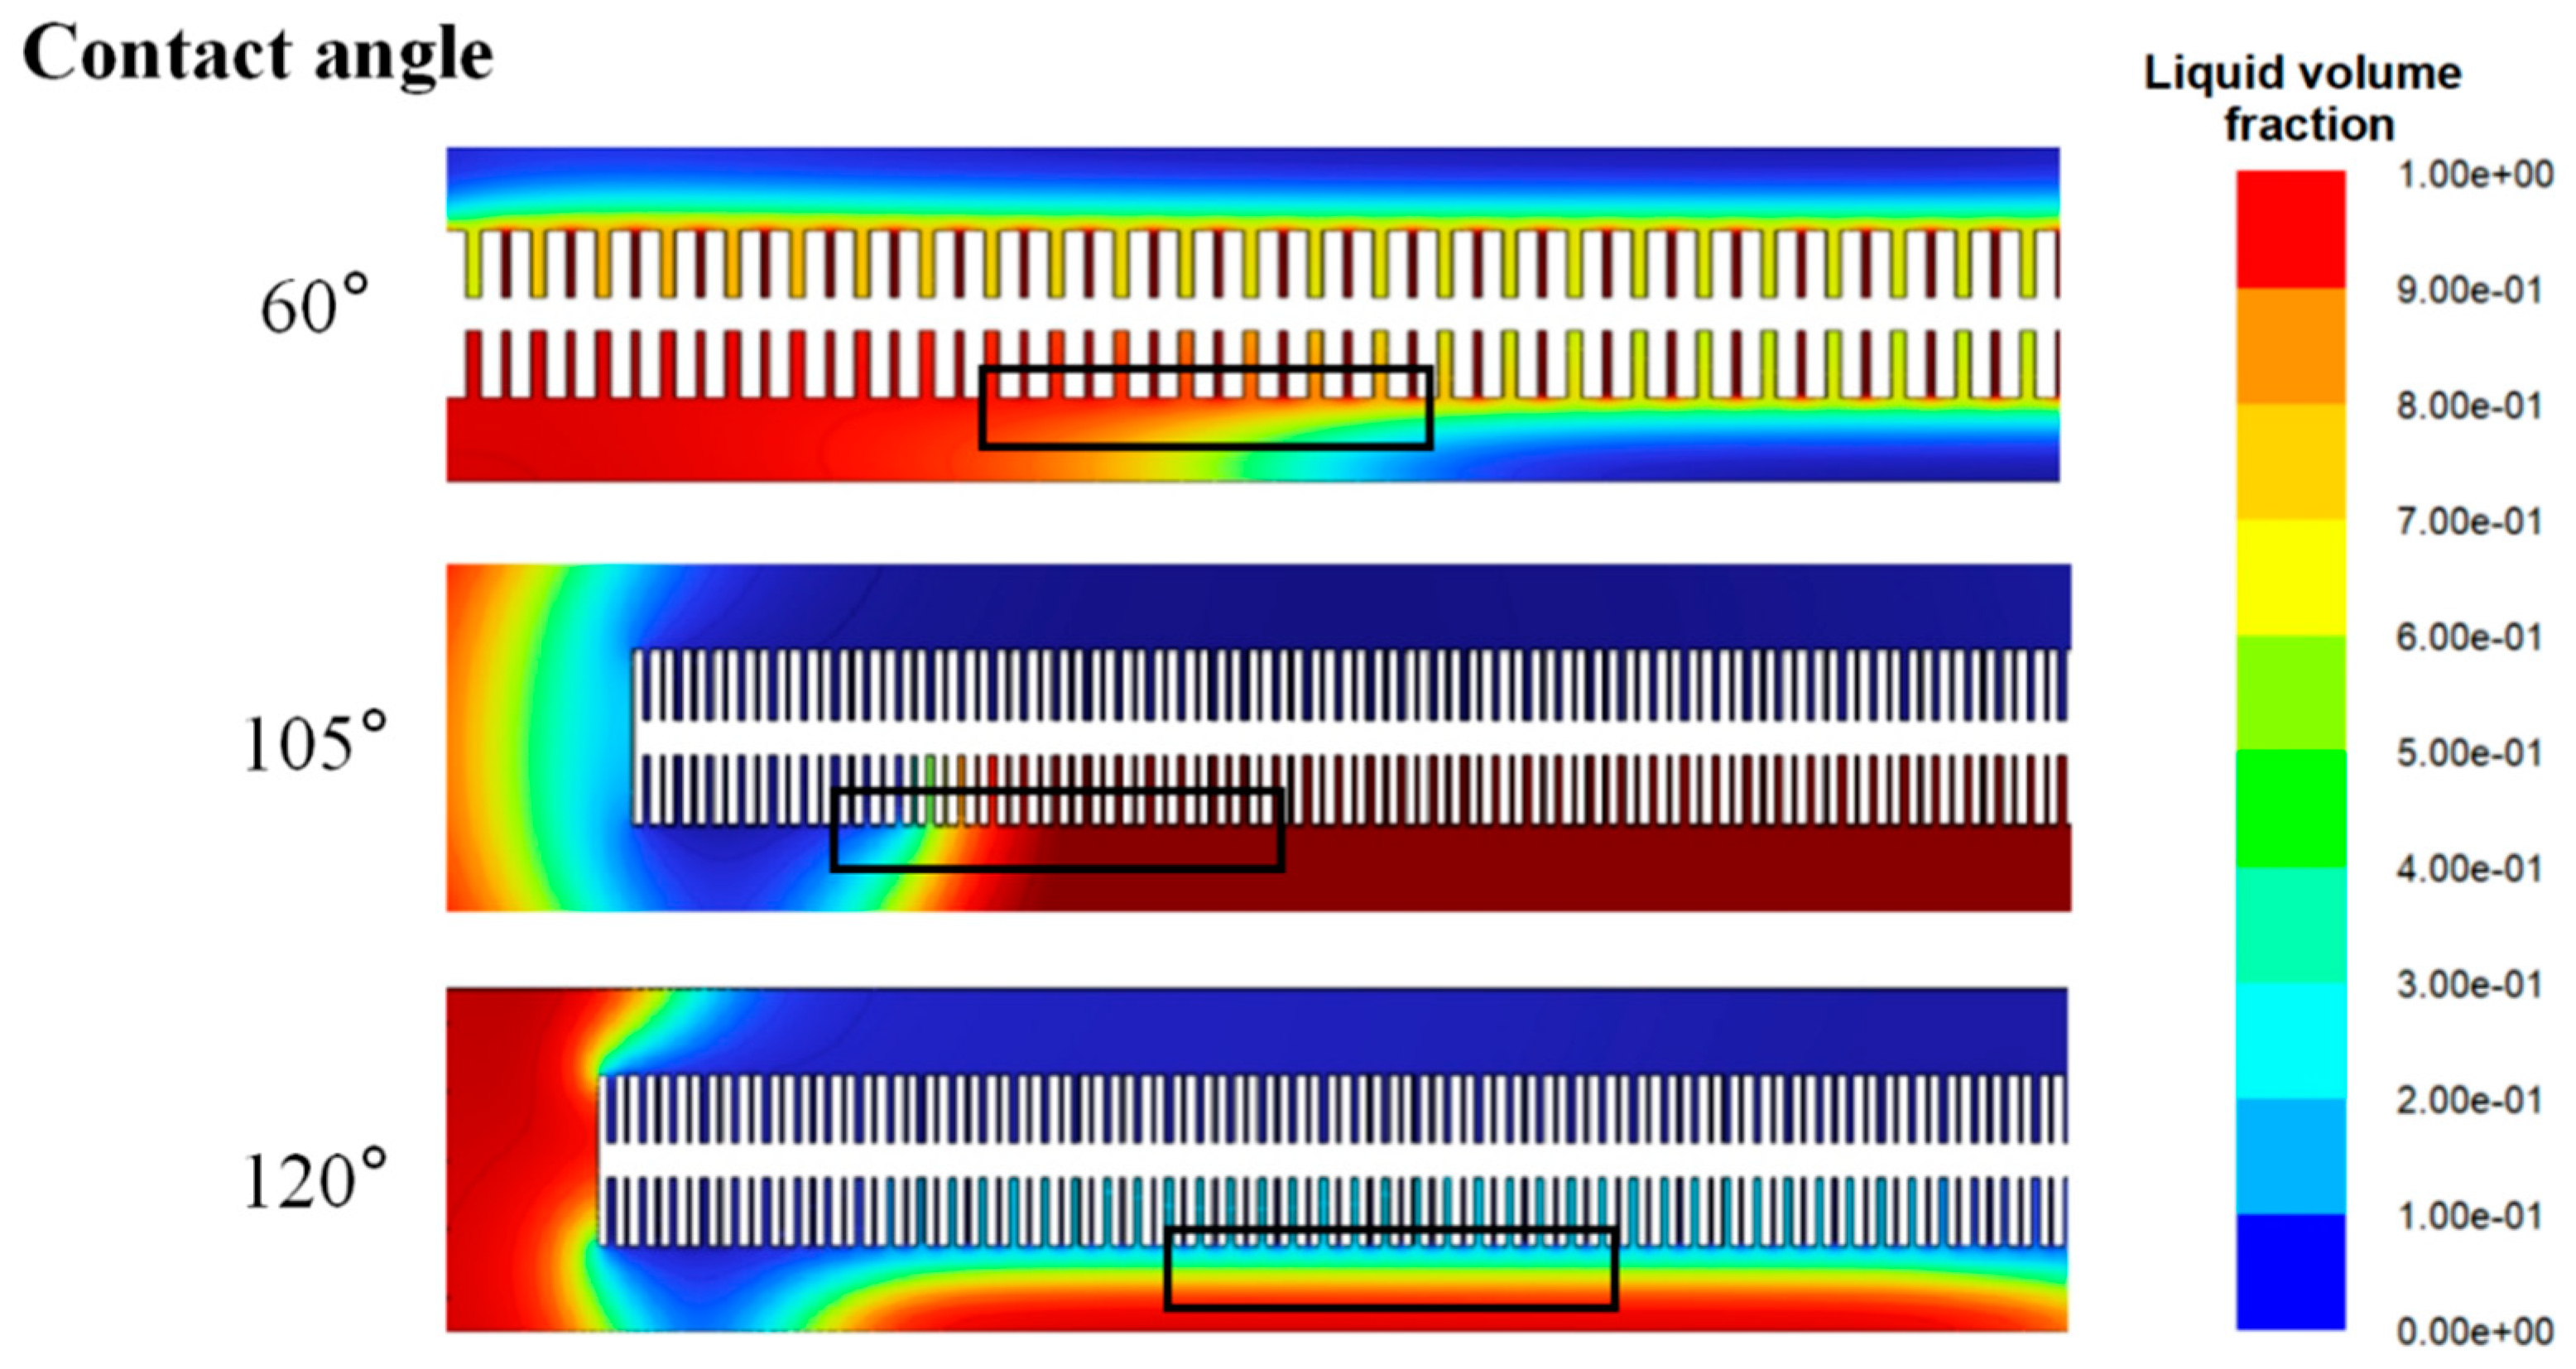
3.6. CFD Modeling of Hydrophobicity Effects on Gas–Liquid Interface
4. Conclusions
Author Contributions
Funding
Data Availability Statement
Conflicts of Interest
References
- Tan, X.Y.; Yu, C.; Ren, Y.W.; Cui, S.; Li, W.B.; Qiu, J.S. Recent advances in innovative strategies for the CO2 electroreduction reaction. Energy Environ. Sci. 2021, 14, 765–780. [Google Scholar] [CrossRef]
- Martín, A.J.; Larrazábal, G.O.; Pérez-Ramírez, J. Towards sustainable fuels and chemicals through the electrochemical reduction of CO2: Lessons from water electrolysis. Green Chem. 2015, 17, 5114–5130. [Google Scholar] [CrossRef]
- Burdyny, T.; Smith, W.A. CO2 reduction on gas-diffusion electrodes and why catalytic performance must be assessed at commercially-relevant conditions. Energy Environ. Sci. 2019, 12, 1442–1453. [Google Scholar] [CrossRef]
- Qiu, Y.L.; Zhong, H.X.; Zhang, T.T.; Xu, W.B.; Su, P.P.; Li, X.F.; Zhang, H.M. Selective electrochemical reduction of carbon dioxide using Cu based metal organic framework for CO2 capture. Acs Appl. Mater. Interfaces 2018, 10, 2480–2489. [Google Scholar] [CrossRef] [PubMed]
- Zhang, Y.; Zhang, R.; Chen, F.F.; Zhang, F.F.; Liu, Y.D.; Hao, X.Y.; Jin, H.K.; Zhang, X.H.; Lu, Z.M.; Dong, H.; et al. Mass-transfer-enhanced hydrophobic Bi microsheets for highly efficient electroreduction of CO2 to pure formate in a wide potential window. Appl. Catal. B-Environ. Energy 2023, 322, 122127. [Google Scholar] [CrossRef]
- Lin, J.; Yan, S.L.; Zhang, C.X.; Hu, Q.; Cheng, Z.M. Electroreduction of CO2 toward high current density. Processes 2022, 10, 826. [Google Scholar] [CrossRef]
- Zhang, F.H.; Jin, Z.C.; Chen, C.Z.; Tang, Y.L.; Mahyoub, S.; Yan, S.L.; Cheng, Z.M. Electrochemical conversion of CO2 to CO into a microchannel reactor system in the case of aqueous electrolyte. Ind. Eng. Chem. Res. 2020, 59, 5664–5674. [Google Scholar] [CrossRef]
- Luo, Q.; Duan, H.Y.; McLaughlin, M.C.; Wei, K.C.; Tapia, J.; Adewuyi, J.A.; Shuster, S.; Liaqat, M.; Suib, S.L.; Ung, G.; et al. Why surface hydrophobicity promotes CO2 electroreduction: A case study of hydrophobic polymer N-heterocyclic carbenes. Chem. Sci. 2023, 14, 9664–9677. [Google Scholar] [CrossRef]
- Wang, M.; Wan, L.L.; Luo, J.S. Promoting CO2 electroreduction on CuO nanowires with a hydrophobic Nafion overlayer. Nanoscale 2021, 13, 3588–3593. [Google Scholar] [CrossRef]
- Xing, Z.; Hu, L.; Ripatti, D.S.; Hu, X.; Feng, X.F. Enhancing carbon dioxide gas-diffusion electrolysis by creating a hydrophobic catalyst microenvironment. Nat. Commun. 2021, 12, 136. [Google Scholar] [CrossRef]
- Zhang, C.X.; Yan, S.L.; Lin, J.; Hu, Q.; Zhong, J.H.; Zhang, B.; Cheng, Z.M. Electrochemical reduction of CO2 to CO on hydrophobic Zn foam rod in a microchannel electrochemical reactor. Processes 2021, 9, 1592. [Google Scholar] [CrossRef]
- Lin, J.; Yan, S.L.; Zhang, C.X.; Hu, Q.; Cheng, Z.M. Hydrophobic electrode design for CO2 electroreduction in a microchannel reactor. Acs Appl. Mater. Interfaces 2022, 14, 8623–8632. [Google Scholar] [CrossRef]
- Wang, P.W.; Hayashi, T.; Meng, Q.A.; Wang, Q.B.; Liu, H.; Hashimoto, K.; Jiang, L. Highly Boosted Oxygen Reduction Reaction Activity by Tuning the Underwater Wetting State of the Superhydrophobic Electrode. Small 2017, 13, 1601250. [Google Scholar] [CrossRef]
- Hu, H.J.; Tang, Y.; Hu, Q.; Wan, P.Y.; Dai, L.M.; Yang, X.J. In-situ grown nanoporous Zn-Cu catalysts on brass foils for enhanced electrochemical reduction of carbon dioxide. Appl. Surf. Sci. 2018, 445, 281–286. [Google Scholar] [CrossRef]
- Zeng, J.Q.; Rino, T.; Bejtka, K.; Castellino, M.; Sacco, A.; Farkhondehfal, M.A.; Chiodoni, A.; Drago, F.; Pirri, C.F. Coupled copper-zinc catalysts for electrochemical reduction of carbon dioxide. Chemsuschem 2020, 13, 4128–4139. [Google Scholar] [CrossRef]
- Jeon, H.S.; Timoshenko, J.; Scholten, F.; Sinev, I.; Herzog, A.; Haase, F.T.; Roldan Cuenya, B. Operando insight into the correlation between the structure and composition of CuZn nanoparticles and their selectivity for theelectrochemical CO2 reduction. J. Am. Chem. Soc. 2019, 141, 19879–19887. [Google Scholar] [CrossRef] [PubMed]
- Kim, J.; Kim, H.; Han, G.H.; Ahn, S.H. Solution-phase-reconstructed Zn-based nanowire electrocatalysts for electrochemical reduction of carbon dioxide to carbon monoxide. Int. J. Energy Res. 2021, 45, 7987–7997. [Google Scholar] [CrossRef]
- Yu, Y.L.; Huang, W.X.; Liu, Z.M.; Hu, Z.F.; Wang, L.G. First-principles study of surface segregation in bimetallic Cu3M(1 1 1) (M = Au, Ag, and Zn) alloys in presence of adsorbed CO. Comput. Mater. Sci. 2022, 212, 111550. [Google Scholar] [CrossRef]
- Xue, L.; Zhang, C.J.; Shi, T.; Liu, S.P.; Zhang, H.; Sun, M.; Liu, F.R.; Liu, Y.; Wang, Y.; Gu, X.J.; et al. Unraveling the improved CO2 adsorption and COOH* formation over Cu-decorated ZnO nanosheets for CO2 reduction toward CO. Chem. Eng. J. 2023, 452, 139701. [Google Scholar] [CrossRef]
- Wan, L.L.; Zhang, X.L.; Cheng, J.S.; Chen, R.; Wu, L.X.; Shi, J.W.; Luo, J.S. Bimetallic Cu-Zn catalysts for electrochemical CO2 reduction: Phase-separated versus core-shell distribution. Acs Catal. 2022, 12, 2741–2748. [Google Scholar] [CrossRef]
- Ozden, A.; Shahgaldi, S.; Li, X.G.; Hamdullahpur, F. A review of gas diffusion layers for proton exchange membrane fuel cells-With a focus on characteristics, characterization techniques, materials and designs. Prog. Energy Combust. Sci. 2019, 74, 50–102. [Google Scholar] [CrossRef]
- Wang, X.L.; Zhang, H.M.; Zhang, J.L.; Xu, H.F.; Zhu, X.B.; Chen, J.; Yi, B.L. A bi-functional micro-porous layer with composite carbon black for PEM fuel cells. J. Power Sources 2006, 162, 474–479. [Google Scholar] [CrossRef]
- Feng, Y.; Cheng, C.Q.; Zou, C.Q.; Zheng, X.L.; Mao, J.; Liu, H.; Li, Z.; Dong, C.K.; Du, X.W. Electroreduction of Carbon Dioxide in Metallic Nanopores through a Pincer Mechanism. Angew. Chem. Int. Ed. 2020, 59, 19297–19303. [Google Scholar] [CrossRef] [PubMed]
- Lamaison, S.; Wakerley, D.; Montero, D.; Rousse, G.; Taverna, D.; Giaume, D.; Mercier, D.; Blanchard, J.; Tran, H.N.; Fontecave, M.; et al. Zn-Cu alloy nanofoams as efficient catalysts for the reduction of CO2 to syngas mixtures with a potential-independent H2/CO ratio. Chemsuschem 2019, 12, 511–517. [Google Scholar] [CrossRef]
- Chao, L.J.; Lin, J.; Hu, Q.; Yan, S.L.; Mahyoub, S.A.; Wei, Z.H.; Wu, Y.R.; Cheng, Z.M. Reaction environment optimization with Janus electrode in CO2 electrochemical reduction to CO. Sep. Purif. Technol. 2025, 362, 131799. [Google Scholar] [CrossRef]
- Sato, K.; Tominaga, Y.; Imai, Y.; Yoshiyama, T.; Aburatani, Y. Deformation capability of poly(tetrafluoroethylene) materials: Estimation with X-ray diffraction measurements. Polym. Test. 2022, 113, 107690. [Google Scholar] [CrossRef]
- Moreno-García, P.; Schlegel, N.; Zanetti, A.; Cedeño López, A.; Gálvez-Vázquez, M.d.J.; Dutta, A.; Rahaman, M.; Broekmann, P. Selective Electrochemical Reduction of CO2 to CO on Zn-Based Foams Produced by Cu2+ and Template-Assisted Electrodeposition. ACS Appl. Mater. Interfaces 2018, 10, 31355–31365. [Google Scholar] [CrossRef]
- Rao, C.N.R.; Vijayakrishnan, V.; Kulkarni, G.U.; Rajumon, M.K. A comparative study of the interaction of oxygen with clusters and single-crystal surfaces of nickel. Appl. Surf. Sci. 1995, 84, 285–289. [Google Scholar] [CrossRef]
- Dupin, J.C.; Gonbeau, D.; Vinatier, P.; Levasseur, A. Systematic XPS studies of metal oxides, hydroxides and peroxides. Phys. Chem. Chem. Phys. 2000, 2, 1319–1324. [Google Scholar] [CrossRef]
- Lupan, O.; Chow, L.; Chai, G.Y.; Roldan Cuenya, B.; Naitabdi, A.; Schulte, A.; Heinrich, H. Nanofabrication and characterization of ZnO nanorod arrays and branched microrods by aqueous solution route and rapid thermal processing. Mater. Sci. Eng. B-Solid State Mater. Adv. Technol. 2007, 145, 57–66. [Google Scholar] [CrossRef]
- Lin, L.; Li, H.B.; Wang, Y.; Li, H.F.; Wei, P.F.; Nan, B.; Si, R.; Wang, G.X.; Bao, X.H. Temperature-dependent CO2 electroreduction over Fe-N-C and Ni-N-C single-atom catalysts. Angew. Chem.-Int. Ed. 2021, 60, 26582–26586. [Google Scholar] [CrossRef] [PubMed]
- Zong, S.; Chen, A.; ś niewski, M.W.; Macheli, L.; Jewell, L.L.; Hildebrandt, D.; Liu, X. Effect of temperature and pressure on electrochemical CO2 reduction: A mini review. Carbon Capture Sci. Technol. 2023, 8, 100133. [Google Scholar] [CrossRef]
- Zhang, Z.; Li, S.; Rao, Y.; Yang, L.; Yan, W.; Xu, H. Three-dimension porous Zn-Cu alloy: An inexpensive electrocatalyst for highly selective CO2 reduction to CO in non-aqueous electrolyte. Chem. Eng. J. 2024, 479, 147376. [Google Scholar] [CrossRef]
- Huang, Q.-S.; Chu, C.; Li, Q.; Liu, Q.; Liu, X.; Sun, J.; Ni, B.-J.; Mao, S. Three-Phase Interface Construction on Hydrophobic Carbonaceous Catalysts for Highly Active and Selective Photocatalytic CO2 Conversion. ACS Catal. 2023, 13, 11232–11243. [Google Scholar] [CrossRef]
- Yan, S.L.; Zhang, X.Y.; Mahyoub, S.A.; Zhang, B.; Wan, X.B.; Cui, Y.R.; Xie, P.F.; Wang, Q.; Cheng, Z.M.; Li, Z.L. In situ growth of hydrophobic 3D porous Zn@Ag electrode in achieving excellent performance for eCO2RR. Chem. Eng. J. 2024, 499, 156159. [Google Scholar] [CrossRef]
- Preethichandra, D.M.G.; Sonar, P. Electrochemical impedance spectroscopy and its applications in sensor development and measuring battery performance. IEEE Sens. J. 2022, 22, 10152–10162. [Google Scholar] [CrossRef]
- Yang, C.; Wang, C.; Zhao, X.; Shen, Z.; Wen, M.; Zhao, C.; Sheng, L.; Wang, Y.; Xu, D.; Zheng, Y.; et al. Superhydrophobic surface on MAO-processed AZ31B alloy with zinc phosphate nanoflower arrays for excellent corrosion resistance in salt and acidic environments. Mater. Des. 2024, 239, 112769. [Google Scholar] [CrossRef]
- Sun, B.; Hu, H.; Guan, J.Y.; Jiang, Z.H.; Wang, Y.Z.; Ma, S.Y.; Song, K.X.; Shi, C.R.; Cheng, H.Y. Porous-carbon confined Cu-O-Zn heterointerface for efficient electroreduction of CO2 to syngas with controllable CO/H2 ratios. Fuel 2024, 371, 132145. [Google Scholar] [CrossRef]
- Zhang, K.J.; Hua, W.J.; Ruan, R.H.; Cui, B.C.; Su, M.X.; Wang, X.B.; Tan, H.Z. Rapid fabrication of phase-separated Cu-Zn particles though “droplet-to-particle” method and their performance in CO2 electrocatalysis. Fuel 2025, 388, 134360. [Google Scholar] [CrossRef]
- Van Thiet, D.; Tung, N.T.; Tuan, N.Q.; Tu, D.N. Facile synthesis of Cu-Zn bimetallic metal-organic framework for effective catalyst toward electrochemical reduction of CO2. J. Alloys Compd. 2024, 976, 173053. [Google Scholar] [CrossRef]
- Li, P.S.; Liu, J.Y.; Bi, J.H.; Zhu, Q.G.; Wu, T.N.; Ma, J.; Zhang, F.R.; Jia, J.C.; Han, B.X. Tuning the efficiency and product composition for electrocatalytic CO2 reduction to syngas over zinc films by morphology and wettability. Green Chem. 2022, 24, 1439–1444. [Google Scholar] [CrossRef]
- Wang, W.Y.; Zhang, K.; Xu, T.; Yao, Y.G. Local environment-mediated efficient electrocatalysis of CO2 to CO on Zn nanosheets. Dalton Trans. 2022, 51, 17081–17088. [Google Scholar] [CrossRef] [PubMed]


| Catalyst | Cu@Zn | Cu@Zn-4PTFE | Cu@Zn-8PTFE | Cu@Zn-16PTFE |
|---|---|---|---|---|
| Image | 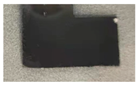 | 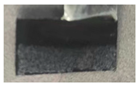 | 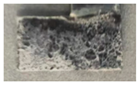 | 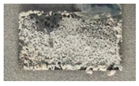 |
| Water contact angle | 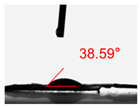 | 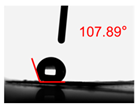 | 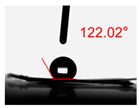 | 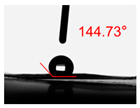 |
| Electrode | Rs/Ω | Rct/Ω | Cdl/mF |
|---|---|---|---|
| Zn rod | 41.66 | 229.3 | 0.70532 |
| Cu@Zn | 40.14 | 3.93 | 0.101171 |
| Cu@Zn-4PTFE | 41.34 | 18.86 | 3.29605 |
| Cu@Zn-8PTFE | 39.5 | 19.55 | 8.558368 |
| Cu@Zn-16PTFE | 38.01 | 28.38 | 27.530152 |
| Weight Content (%) | |||
|---|---|---|---|
| Element | Zn | Cu | F |
| Before stability | 86.32 | 10.6 | 3.08 |
| After stability | 88.36 | 11.12 | 0.52 |
| Catalyst | FEco/% | Electrolyte | Stability/h | Reference |
|---|---|---|---|---|
| Cu@Zn-8PTFE | 93 | 0.1M KHCO3 | 65 | This work |
| Np Zn-Cu | 50 | 0.5M KHCO3 | 18 | [14] |
| Cu-ZnO-2 | 75.6 | 0.1M KHCO3 | 12 | [38] |
| Cu2Zn8 | 73.1 | 0.1M KHCO3 | 24 | [39] |
| Cu0.3Zn9.7 | 90.69 | 0.1M KHCO3 | 8 | [33] |
| CuZn-MOF | 90 | 0.1M KHCO3 | / | [40] |
| Zn-1P | 92.6 | 0.5M KHCO3 | 12 | [41] |
| ZnAg-40-F/0 | 97.4 | 0.1M KHCO3 | 10 | [35] |
| Zn NS-8% PTFE | 90.2 | 0.1M KHCO3 | 12 | [42] |
Disclaimer/Publisher’s Note: The statements, opinions and data contained in all publications are solely those of the individual author(s) and contributor(s) and not of MDPI and/or the editor(s). MDPI and/or the editor(s) disclaim responsibility for any injury to people or property resulting from any ideas, methods, instructions or products referred to in the content. |
© 2025 by the authors. Licensee MDPI, Basel, Switzerland. This article is an open access article distributed under the terms and conditions of the Creative Commons Attribution (CC BY) license (https://creativecommons.org/licenses/by/4.0/).
Share and Cite
Hu, Q.; Wei, Z.; Chao, L.; Liu, Y.; Luo, L.; Zhang, B.; Cheng, Z. Optimizing Hydrophobicity of Cu@Zn Foam Catalysts for Efficient CO2 Electroreduction in a Microchannel Reactor. Processes 2025, 13, 1454. https://doi.org/10.3390/pr13051454
Hu Q, Wei Z, Chao L, Liu Y, Luo L, Zhang B, Cheng Z. Optimizing Hydrophobicity of Cu@Zn Foam Catalysts for Efficient CO2 Electroreduction in a Microchannel Reactor. Processes. 2025; 13(5):1454. https://doi.org/10.3390/pr13051454
Chicago/Turabian StyleHu, Qing, Zhihang Wei, Linjie Chao, Yujing Liu, Lin Luo, Bo Zhang, and Zhenmin Cheng. 2025. "Optimizing Hydrophobicity of Cu@Zn Foam Catalysts for Efficient CO2 Electroreduction in a Microchannel Reactor" Processes 13, no. 5: 1454. https://doi.org/10.3390/pr13051454
APA StyleHu, Q., Wei, Z., Chao, L., Liu, Y., Luo, L., Zhang, B., & Cheng, Z. (2025). Optimizing Hydrophobicity of Cu@Zn Foam Catalysts for Efficient CO2 Electroreduction in a Microchannel Reactor. Processes, 13(5), 1454. https://doi.org/10.3390/pr13051454