Article

Effect of Process Parameters on Metallurgical Behavior of Liquid Steel in a Thickened Compact Strip Production Mold with Electromagnetic Braking

1
State Key Laboratory of Advanced Refractories, Wuhan University of Science and Technology, Wuhan 430081, China
2
Hubei Provincial Key Laboratory for New Processes of Ironmaking and Steelmaking, Wuhan University of Science and Technology, Wuhan 430081, China
3
Baosteel Central Research Institute (Wuhan), Wuhan 430080, China
*
Author to whom correspondence should be addressed.
Processes 2025, 13(5), 1427; https://doi.org/10.3390/pr13051427
Submission received: 15 April 2025 / Revised: 27 April 2025 / Accepted: 5 May 2025 / Published: 7 May 2025
(This article belongs to the Special Issue Advanced Ladle Metallurgy and Secondary Refining)

Abstract

:
Herein, a three-dimensional mathematical model was established to investigate the metallurgical behavior of liquid steel in a funnel-shaped mold equipped with single-ruler electromagnetic braking (EMBr). The effects of mold thicknesses, electromagnetic intensity, and casting speed in flow behavior were investigated. The results indicate that with EMBr, multiple pairs of induced current loops are present in the horizontal section of the magnetic pole center, distributed in pairs between the jets and broad faces. The Lorentz force acting on the main jet, which impacts the downward and upward flow at adjacent broad faces, is opposite in direction. Increasing mold thickness results in a larger jet penetration depth, leading to a higher meniscus temperature near the narrow faces accompanied by elevated velocity and turbulent kinetic energy. EMBr can lead to a decrease in shell thickness and an improvement in its uniformity at mold exit. For the thickened mold, as the magnetic flux density increases and the casting speed decreases, the penetration depth of jets and velocity near the narrow faces and meniscus decreases. The shell thickness decreases as the casting speed increases, with the lowest non-uniformity coefficient of 6.78% observed at a casting speed of 5.0 m/min.

1. Introduction

Thin slab continuous casting and rolling technology, as one of representatives of the near-net-shape technology, is characterized by its short process, high efficiency, and the ability to directly roll steel products [1,2]. The mold is the key area in the thin slab production process, where liquid steel undergoes the transformation from the liquid to solid phase. The thinner thickness of the casting mold results in a narrow space between the submerged entry nozzle (SEN) and molten pool, making it difficult for the mold slag around the nozzle to melt and for inclusions to float up [3,4]. The development of the funnel-shaped mold with variable cross-section has significantly improved casting conditions. However, the extremely thin thickness of the casting slab still makes the quality control rather difficult. With the advancement of related technologies such as liquid core reduction, it has become possible to enlarge the inner cavity volume of the mold to improve product quality. Meanwhile, driven by the need to enhance the capacity of the production line, there is a tendency to increase the thickness of continuous casting mold.
The high casting speed and unique geometric structure result in a stronger turbulence within the thin slab mold compared to the traditional one [5]. This affects the stability of the meniscus and uniformity of heat transfer and increases the probability of surface defects. Zong et al. [6] pointed out that longitudinal surface cracks were frequently observed in regions near the centerline of the slab wide surface, which is related to the large stress in the solidified shell at the transition region between the funnel and parallel sections of the mold [7]. As an effective method for controlling the flow behavior in a mold [8], the Electromagnetic Braking (EMBr) process has been widely applied in the thin slab continuous casting process and a series of technologies have been developed, including Local EMBr [9], Ruler EMBr [10], and FC-Mold EMBr [11]. The principle is that when the conductive liquid steel passes through a steady static magnetic field, an electromagnetic force opposite to the velocity direction can be generated to slow the liquid steel flow, thereby inhibiting the meniscus fluctuation and slag entrapment [12,13,14]. However, excessively suppression on the meniscus flow may increase the risk of meniscus freezing [15]. Obviously, the applied static electromagnetic field increases the complexity of the high temperature flow field. Understanding the metallurgical behavior of the liquid steel in a thickened mold with EMBr is essential for responding to the changes in process parameters and maintaining the slab quality in continuous casting production.
Due to the invisibility of the metallurgical high-temperature process, numerical simulation has become an important method for studying the flow behavior of high-temperature magnetohydrodynamic fluid. The explorations conducted by metallurgists are mainly focused on the flow, heat transfer, and solidification behavior of liquid steel in thin slab molds equipped with EMBr [16,17,18]. Chaudhary et al. [19] pointed out that the magnetic field located above the bottom of the SEN may lead to a more concentrated and stronger jet entering the mold, causing detrimental variations in meniscus velocity; lowering the magnetic field below the SEN can cause the jet to deflect upwards, resulting in larger meniscus velocity. While, it is found in Zhang’s research [20] that an optimal braking effect can be obtained when the distance between the SEN bottom and upper surface of the EMBr device is 100 mm. The discrepancies in conclusions are attributed to differences in the molds studied and the process parameters employed. Meanwhile, their numerical simulations do not take into account the solidification process, which has significant influence on the flow field. Wang et al. [21] analyzed the intensity of EMBr on the flow pattern and meniscus fluctuation by large eddy simulation, and found that flow patterns in the mold change significantly with increasing magnetic induction intensity. Also, there is a lack of research on the solidified shell thickness under different process parameters. It is evident that the flow behavior in thin slab continuous casting molds with EMBr is more complex; comprehensive electromagnetic flow control in a thickened mold requires integrating specific on-site operating conditions with systematic parameter optimization [22,23,24].
In this paper, a funnel-shaped mold used in Compact Strip Production (CSP) thin slab continuous casting was taken as the research object. The magnetic field distribution generated by Ruler-EMBr in the mold and its typical impact mechanisms on the metallurgical behavior of liquid steel were numerically solved. The distribution changes in meniscus velocity and temperature caused by the increasing mold thickness were investigated. Furthermore, the effects of electromagnetic intensity and casting speed in the thickened mold are discussed in detail. The research results can provide a theoretical basis for stabilizing the production of CSP continuous casting and improving the quality of thin slab.

2. Mathematical Model and Computational Conditions

2.1. Basic Assumptions

(1)
Regarding the liquid steel as an incompressible Newtonian fluid with constant physical properties [20].
(2)
Disregarding the influence of oscillation and negative taper of the mold [14].
(3)
Neglecting the effects of solidification shrinkage and liquid core reduction on flow and heat transfer [25].
(4)
Ignoring the effects of mold flux and its surface tension on meniscus flow [26].

2.2. Mathematical Formulation

The continuity equation and momentum equations are as follows:
ρ t + ρ u i x i = 0
ρ u i t + ρ u i u j x j = P x i + x i μ eff u i x j + u j x i + ρ g i + S F + S m
where ρ is the fluid density, kg/m3. t is the calculating time, s. ui and uj are the velocity vectors in directions i and j, respectively, m/s. i, j = x, y, or z. xi and xj represent the i and j components of the direction, respectively, m. P is the pressure, Pa. g is the gravity acceleration, m/s2. SF is the source term of the Lorentz force. Sm represents the source term of the mushy zone acting on momentum in the solidification model. μeff is the effective viscosity, Pa·s, which can be deduced as follows:
μ eff = μ + μ t = μ + ρ C μ k 2 ε
where μ and μt are the dynamic viscosity and turbulent viscosity, respectively, Pa·s; Cμ = 0.09 is the empirical constant; k is the turbulent kinetic energy, m2·s−2; and ε is the dissipation rate of turbulence energy, m2·s−3.
The standard k-ε two-equation model, stemming from the Reynolds-averaged Navier–Stokes turbulence models, was selected to solve the turbulent flow of liquid steel in a funnel-shaped mold. The equations for turbulent kinetic energy and the turbulent dissipation rate are as follows:
ρ k t + ρ k u i x i = x j μ + μ t σ k k x j + G k + G b - ρ ε + S φ
ρ ε t + ρ ε u i x i = x j μ + μ t σ ε ε x j + C 1 ε k G k + C 3 G b C 2 ρ ε 2 k + S φ
where Gk and Gb are the turbulent kinetic energy generated by the average velocity gradient and thermal buoyancy gradient, m2·s−2. σk and σε are the turbulent Prandtl number of k and ε, respectively. C1, C2, and C3 are the empirical constants. Sk and Sε are the source terms of the mushy zone acting on the turbulence in the solidification model.
The Solidification/Melting model was employed to model solidification phase transition in a mold during the flow and heat transfer process. Based on the enthalpy-porosity technique, the liquid–solid mushy zone is treated as a porous zone, with porosity equal to the liquid fraction. Moreover, the energy equation can be solved according to the enthalpy values at each node in the fluid domain.
t ρ H + ρ u H = λ T + S h
where λ is the thermal conductivity of liquid steel, W/(m K). Sh is the source term, J/(m3 s). H is the enthalpy of liquid steel, kJ/kg, which is the sum of sensible enthalpy and latent heat.
H = h ref + T ref T c p d T + β L
where href is the reference enthalpy, J/(kmol). cp is the specific heat, J/(kg·K). Tref is the reference temperature, K. L is the latent heat of liquid steel, J/(kg·K). β is the liquid fraction, which is defined as follows:
β = 0 T < T solidus T T solidus T liquidus T solidus T solidus < T < T liquidus 1 T liquidus < T
where Tliquidus and Tsolidus are the liquidus temperature and solidus temperature of liquid steel, K, respectively.
To account for the pressure drop caused by the presence of solid steel, appropriate momentum sink terms are added to the momentum and turbulence equations. The momentum sink and turbulence sink due to the reduced porosity in the mushy zone take the following form:
S m = 1 β 2 β 3 + ε A mush u u p
S φ = 1 β 2 β 3 + ε A mush φ
where ε = 0.001 is a small number to prevent division by zero. Amush is the mushy zone constant, and its value is 1 × 10⁸ in the current work. up is the casting speed, m/s. φ represents the turbulence quantity being solved (k, ε).
The magnetohydrodynamics (MHD) model was used for the coupling between the flow field and magnetic field. The magnetic induction method was employed to calculate the induced current, which can be deduced from Ampere’s relation:
J = 1 μ × B
where J is the induced current density, A/m2. μ is the magnetic permeability of fluid, H/m. B is the magnetic flux density, T, which consists of the applied direct current magnetic field B0 and the secondary field b induced by the liquid steel flow, that is, B = B0 + b. From Ohm’s law and Maxwell’s equation, the induction equation can be derived as follows:
b t + u b = 1 μ σ 2 b + B 0 + b u u B 0 B 0 t
Thus, the source term of the Lorentz force SF added into the momentum equation can be given by
S F = F L = J × B

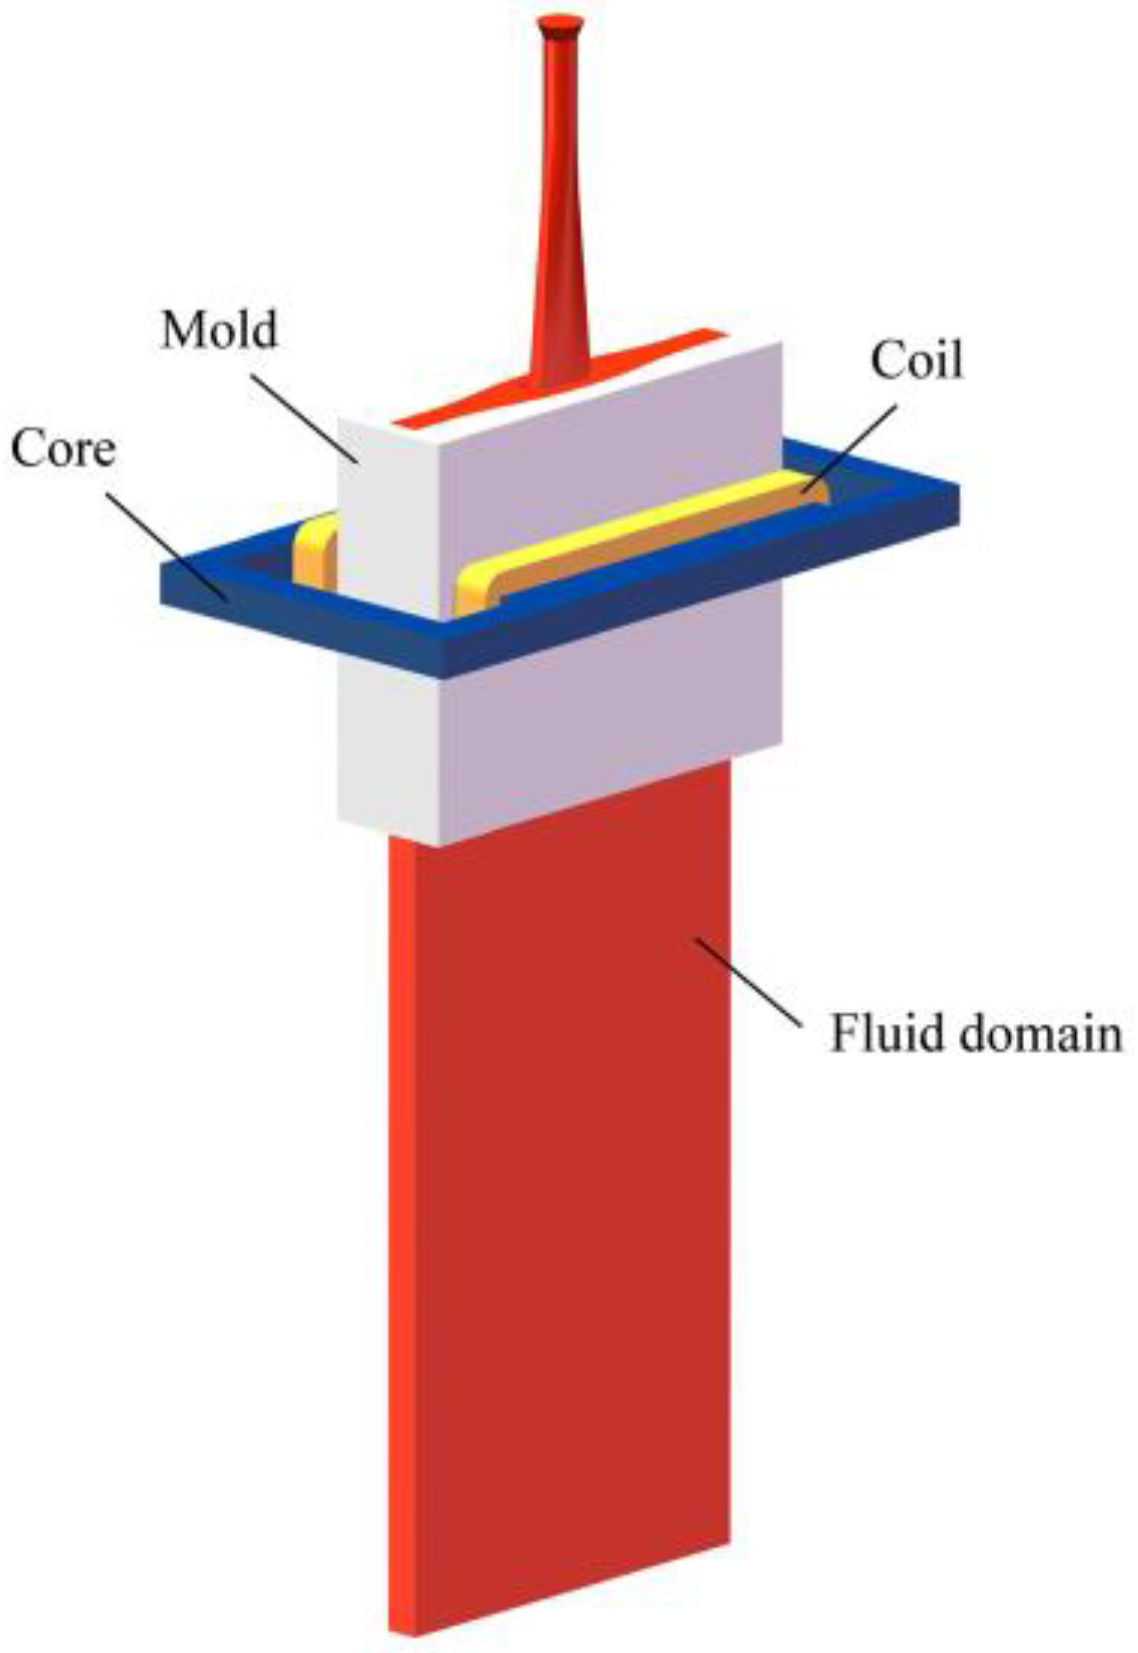
2.3. Geometric Model and Mesh Division

The external dimension of the CSP mold is 1200 mm × 330 mm, and the width of the inner broad face is 1100 mm. The thickness of the mold Th is increased from 74 mm to 87 mm. The width of the funnel zone inside the mold is 900 mm, with a depression depth of 50 mm and a vertical height of 1000 mm. The numerical simulation is conducted in two parts. First, a mold model with an EMBr device is established to calculate the electromagnetic field of the computational domain, as shown in Figure 1, which includes the iron core, induction coil, mold, and fluid domain of liquid steel. The main body of the EMBr device consists of an iron core and two induction coils, and the magnetic field center of the EMBr is positioned at 410 mm below the upper surface of the mold. Table 1 lists the main parameters used in the calculation of the electromagnetic field.
Subsequently, the obtained electromagnetic data are loaded into ANSYS Fluent 16.0 (Pittsburgh, PA, USA) by the MHD model for the further calculation of the flow, heat transfer, and solidification behavior of liquid steel; the geometry structure and mesh of the fluid model used in Fluent are shown in Figure 2. To ensure the full development of the flow field and avoid the disturbance of backflow on the calculations, the total length of the mold is extended to 3000 mm. The computational domain is discretized using hexahedral structured meshes. For regions like the nozzle and meniscus, the mesh is refined. While, for the extended region of the mold where the velocity changes are weak, the mesh is adjusted to be coarse to reduce computational load. The total number of grids, verified for grid independence, reaches 1.5 million. Table 2 lists the main process parameters and physical properties of the liquid steel as used in the calculation of the fluid.

2.4. Boundary Conditions

(1) The inlet of the fluid domain adopts a velocity inlet boundary condition; the velocity value is determined by the casting speed and mold section size [27]. (2) The mold outlet is set with an outflow condition, where the normal components of all variables are taken as zero. (3) The top surface of the mold is defined as an adiabatic boundary condition, and the shear stress is set to zero in all directions [28]. (4) The standard wall function is adopted to all side walls of the mold and nozzle with a non-slip boundary condition. For the heat transfer calculation process, the broad and narrow faces are set with a heat flux boundary condition [29], which is compiled in the computational domain by a User Defined Function (UDF). Furthermore, the convective heat transfer coefficients of the broad and narrow side walls in the secondary cooling zone are 1500 and 1300 W/(m2·k) [30].

2.5. Model Validation

Due to the difficulty in industrial measurements of the magnetic field distribution inside the on-site mold, a model with similar process parameters to the current study, as specified in reference [20], was selected to re-model and calculate the magnetic field for validation. The mold size is 1100 mm × 70 mm, and the EMBr device is located 400 mm below the meniscus. When the MMF is 10,000 a·n, the obtained distribution of magnetic flux density along the vertical direction of the mold is used to compare with the data in reference [20], as shown in Figure 3. It can be observed that the calculated result in the current study is similar to that in the reference, which indicates that the numerical simulation for the electromagnetic field is relatively accurate. In addition, the solidified shell thickness at the mold exit calculated in this paper is in the range of 11~15 mm, which is similar to the measured range of 12~15 mm in actual industrial production. It can be concluded that the solidification model and heat transfer boundary condition of the mathematical model in this article are relatively reliable.
To verify the flow field, a physical experiment test system with a model-to-scale ratio of 1:3 was established. Mercury, a low-melting-point liquid metal, was used to simulate the liquid steel, and an Ultrasonic Doppler Velocimeter (DOP-2000, Signal Processing S.A. Co., Switzerland) was employed to measure the velocity of the liquid metal in the mold. Based on the similarity principle, the similarity ratios of the magnetic field intensity and the liquid flow rate were obtained [31]. Figure 4a shows the actual device in the physical experiment, and Figure 4b presents a comparison between the flow fields in the mold in the physical experiment and numerical simulation under the conditions of a casting speed of 4.5 m/min, a magnetic field intensity of 0.2 T, and a mold thickness of 87 mm. It can be seen that under this condition, an effective upward return flow can be formed in the mold. The velocity distribution obtained from the numerical simulation is basically consistent with that from the physical experiment, and the existing differences are related to the consideration of the solidification in the numerical simulation. It can be concluded that the model is relatively reliable in the calculation of the flow field.

3. Results and Discussion

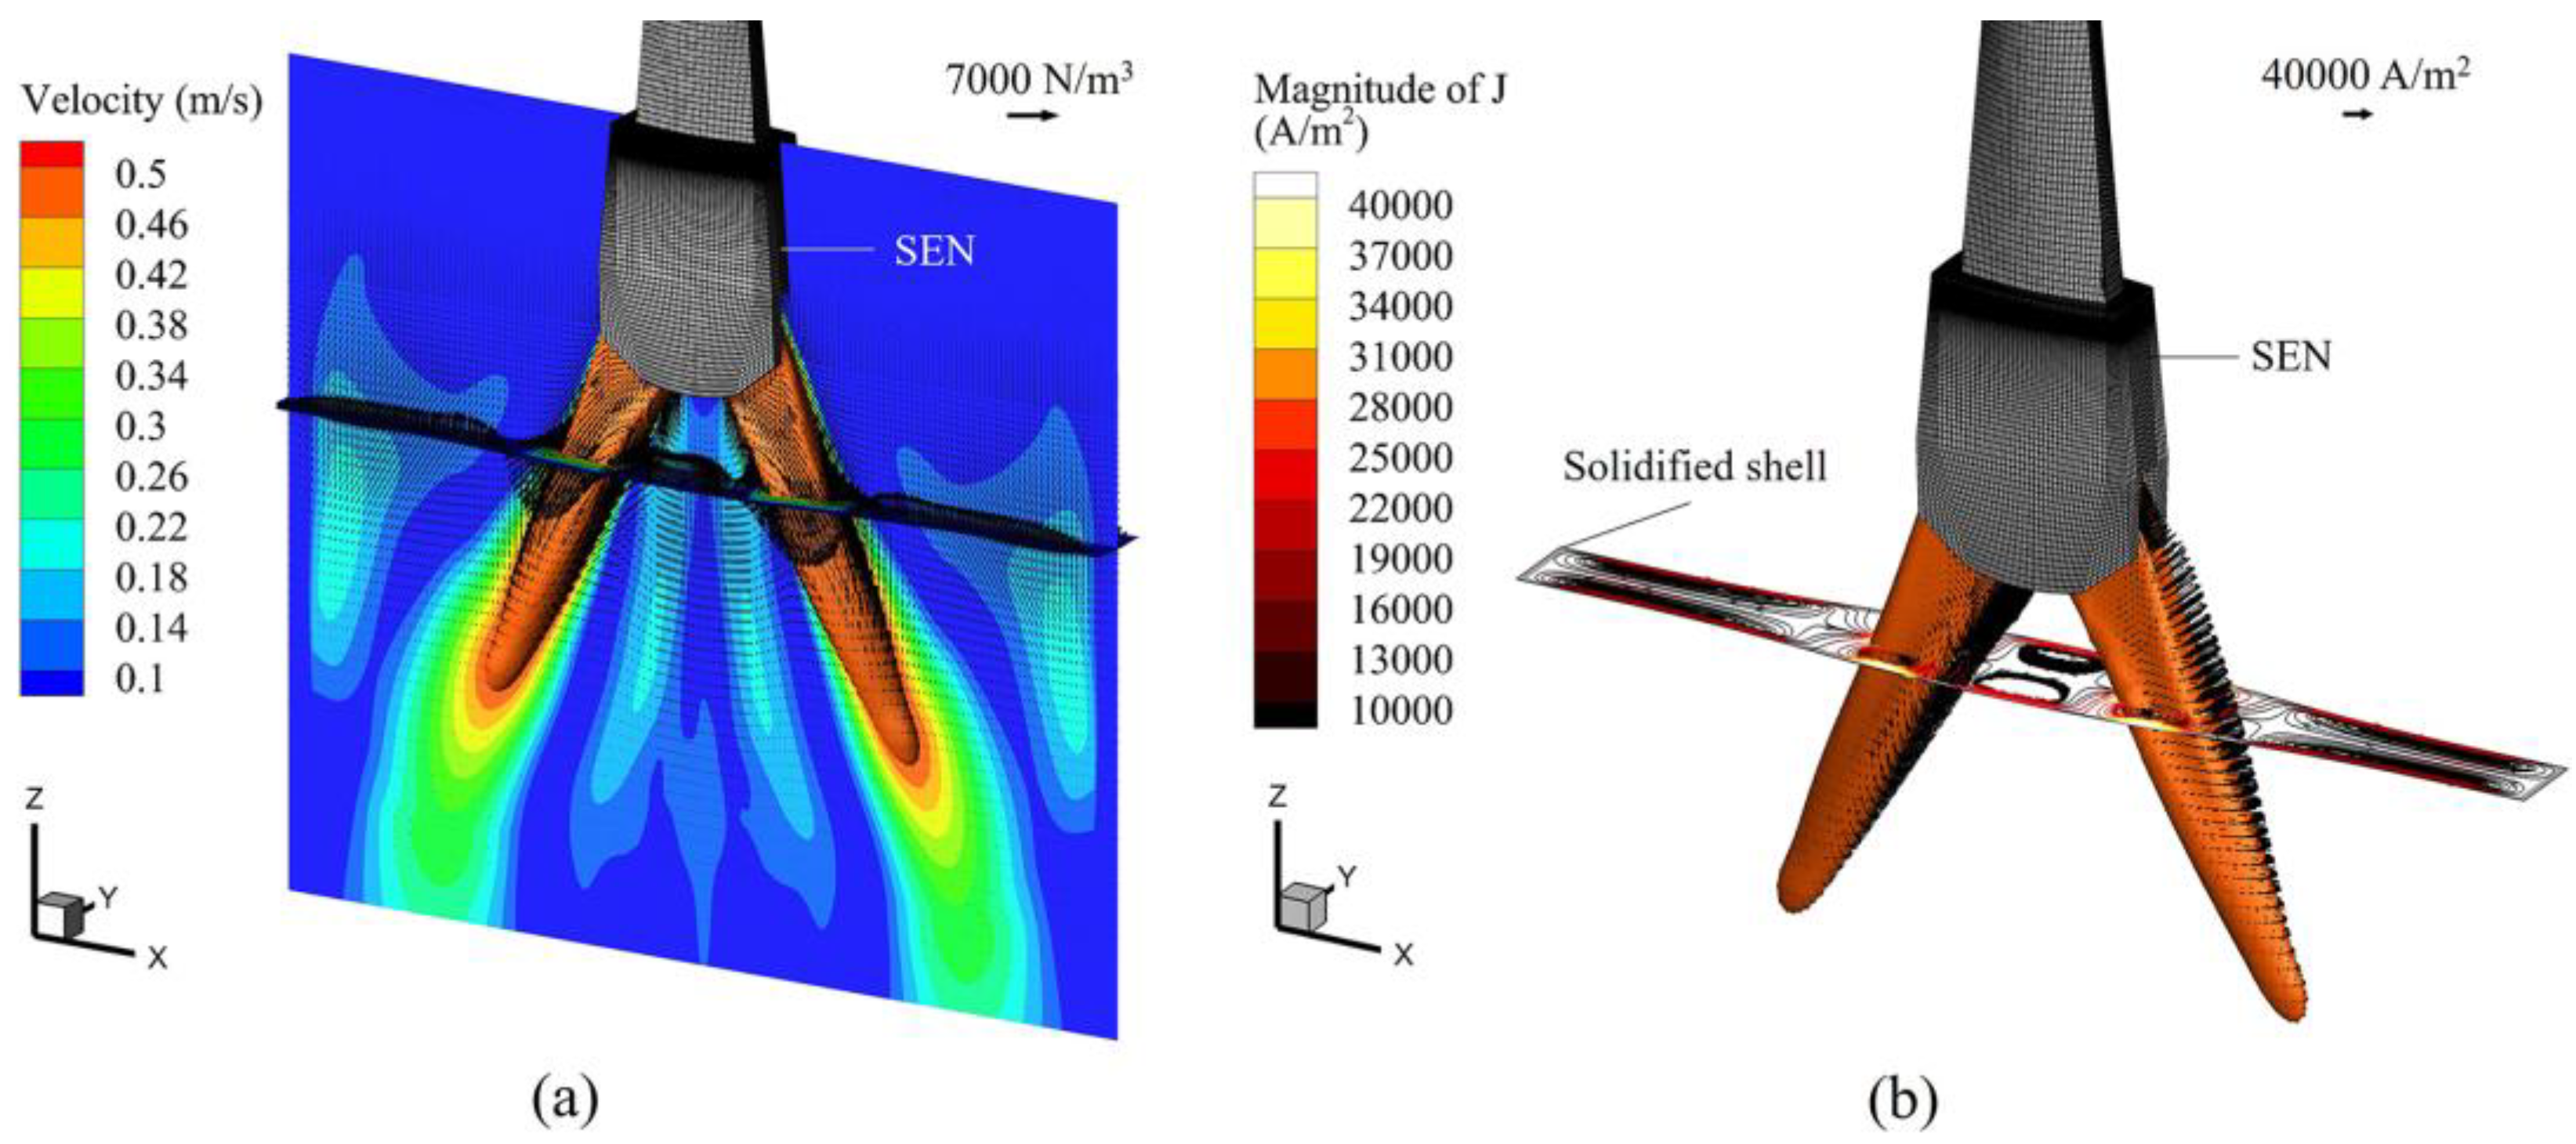
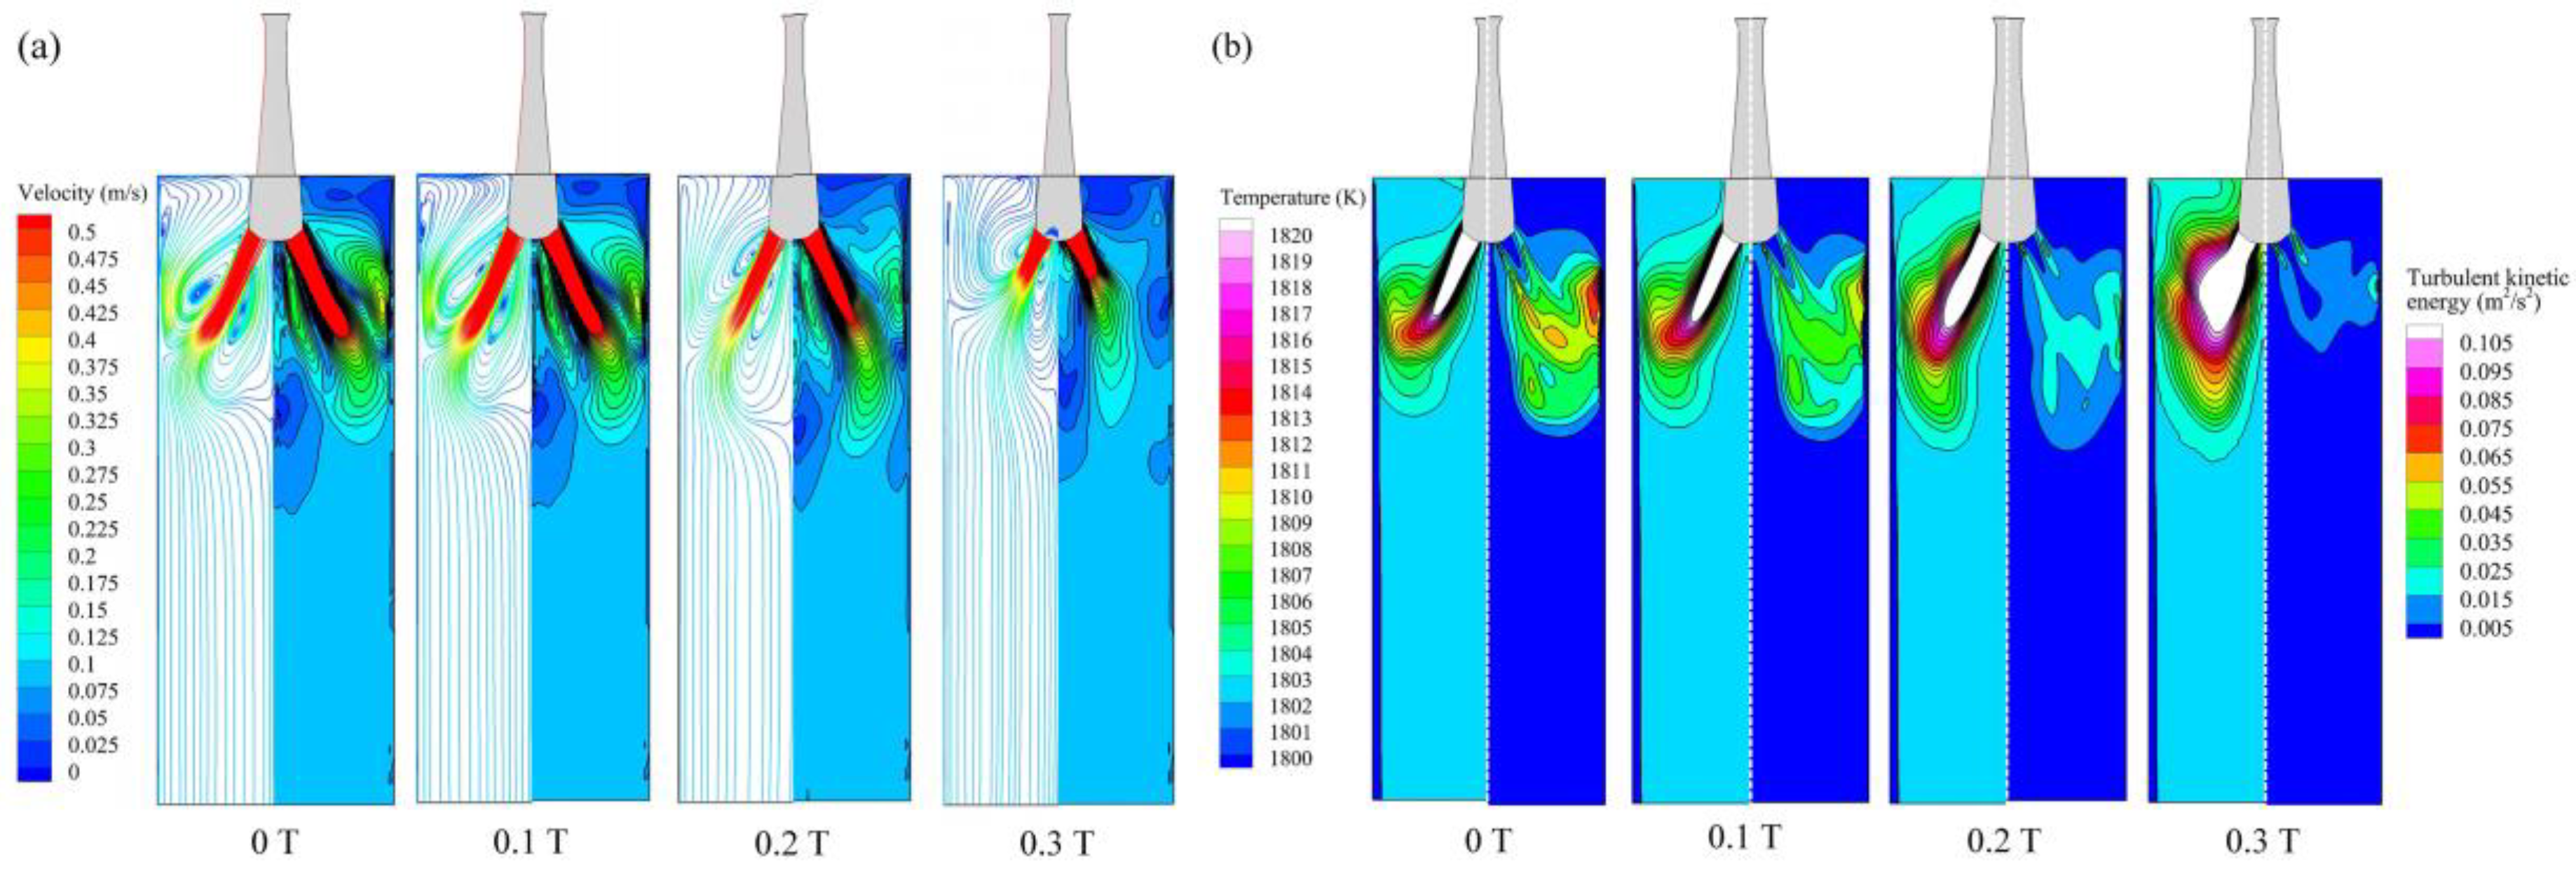
3.1. Electromagnetic Field in CSP Mold with EMBr

When MMF is 36,000 a·n, the typical distribution of magnetic flux density in the vertical plane at the mold half-thickness is shown in Figure 5. The distribution of magnetic flux density in the plane along the height direction and horizontal direction across the magnetic pole center of the mold under different MMF values is shown in Figure 6. Therein, the shades of gray in Figure 6a represents the installation position of the magnetic poles.
Figure 5 shows that the magnitude of the magnetic flux density is largest at the center of the magnetic poles and gradually decreases along both sides along the vertical direction of the mold. The contour lines of magnetic flux density along the width direction of the mold are presented in a track shape, with a uniform value in the central area and a smaller value near the narrow faces. Figure 6a indicates that when the MMF is the same, the magnetic flux density shows a Gaussian distribution from the center to both sides in the vertical direction, while the variation along the horizontal direction is not significant, as shown in Figure 6b. As the MMF increases, the magnetic flux density gradually increases, and the maximum magnitude of magnetic flux density Bmax is about 0.1, 0.2, and 0.3 T when the MMF is 24,000, 36,000 and 54,000 a·n, respectively. In the following section, Bmax is used to represent the electromagnetic intensity under different MMF.

3.2. Typical Metallurgical Characteristics of Liquid Steel in CSP Mold with EMBr

The conditions were a casting speed of 4.5 m/min and a Bmax of 0.2 T; the induced current J and Lorentz force FL produced by the jets are shown in Figure 7. Therein, the cross-section shown in Figure 7a is located at the horizontal center of the magnetic poles, with the induced current streamline displayed inside. The gray area near the side wall represents the solidified shell, and the 0.5 m/s iso-surface of velocity is extracted to exhibit the jets rushing out from the nozzle ports. The vector length on the velocity iso-surface represents the magnitude of induced current. The vertical and horizontal cross-sections in Figure 7b are at the mold half-thickness and the EMBr device half-height, respectively. The colors of the contour and vector in the cross-section represent the velocity and Lorentz force, respectively.
Figure 7a indicates that under the action of a static magnetic field along the positive y-axis, the main direction of the induced current generated by the jets is towards the positive x-axis. Multiple pairs of induced current loops are formed in the horizontal section, two pairs of which are in the mid-region between the jets and broad faces. These induced current loops have a maximum value of 40,000 A/m2 in the solidified shell. This phenomenon was also validated in Wang’s research [21].
Figure 7b shows that the Lorentz force acting on the jets is opposite to the velocity direction. Moreover, the upward flow towards the meniscus, split from the jets impacting the narrow faces, is slowed by a downward Lorentz force, which is expected to inhibit the meniscus fluctuation. It should be noted that in the horizontal section, a relatively large Lorentz force opposite to the main jet direction is observed near the solidified shell, while the reverse Lorentz force in the circumferential direction near the side walls is relatively small. The uneven Lorentz forces in opposite directions distributed in the mushy zone and solidified shell will cause a shear force. The difference of the Lorentz forces in the opposite directions at the solidified shell reaches 6000 N/m3, corresponding to the solidified shell thickness of 6.4 mm at this point; thus, the produced stress magnitude is 38.4 Pa. According to Suzuki’s research [32], the fracture strength of the solidified shell near the solidus line temperature is in the range of 1 to 3.5 MPa. It can be seen that the stress caused by the non-uniformity of the Lorentz forces is much smaller than the fracture strength of the shell. Whether it will exacerbate the surface defects of the thin slab together with the thermal stress and concentrated strain existing in the mold funnel area deserves further study.

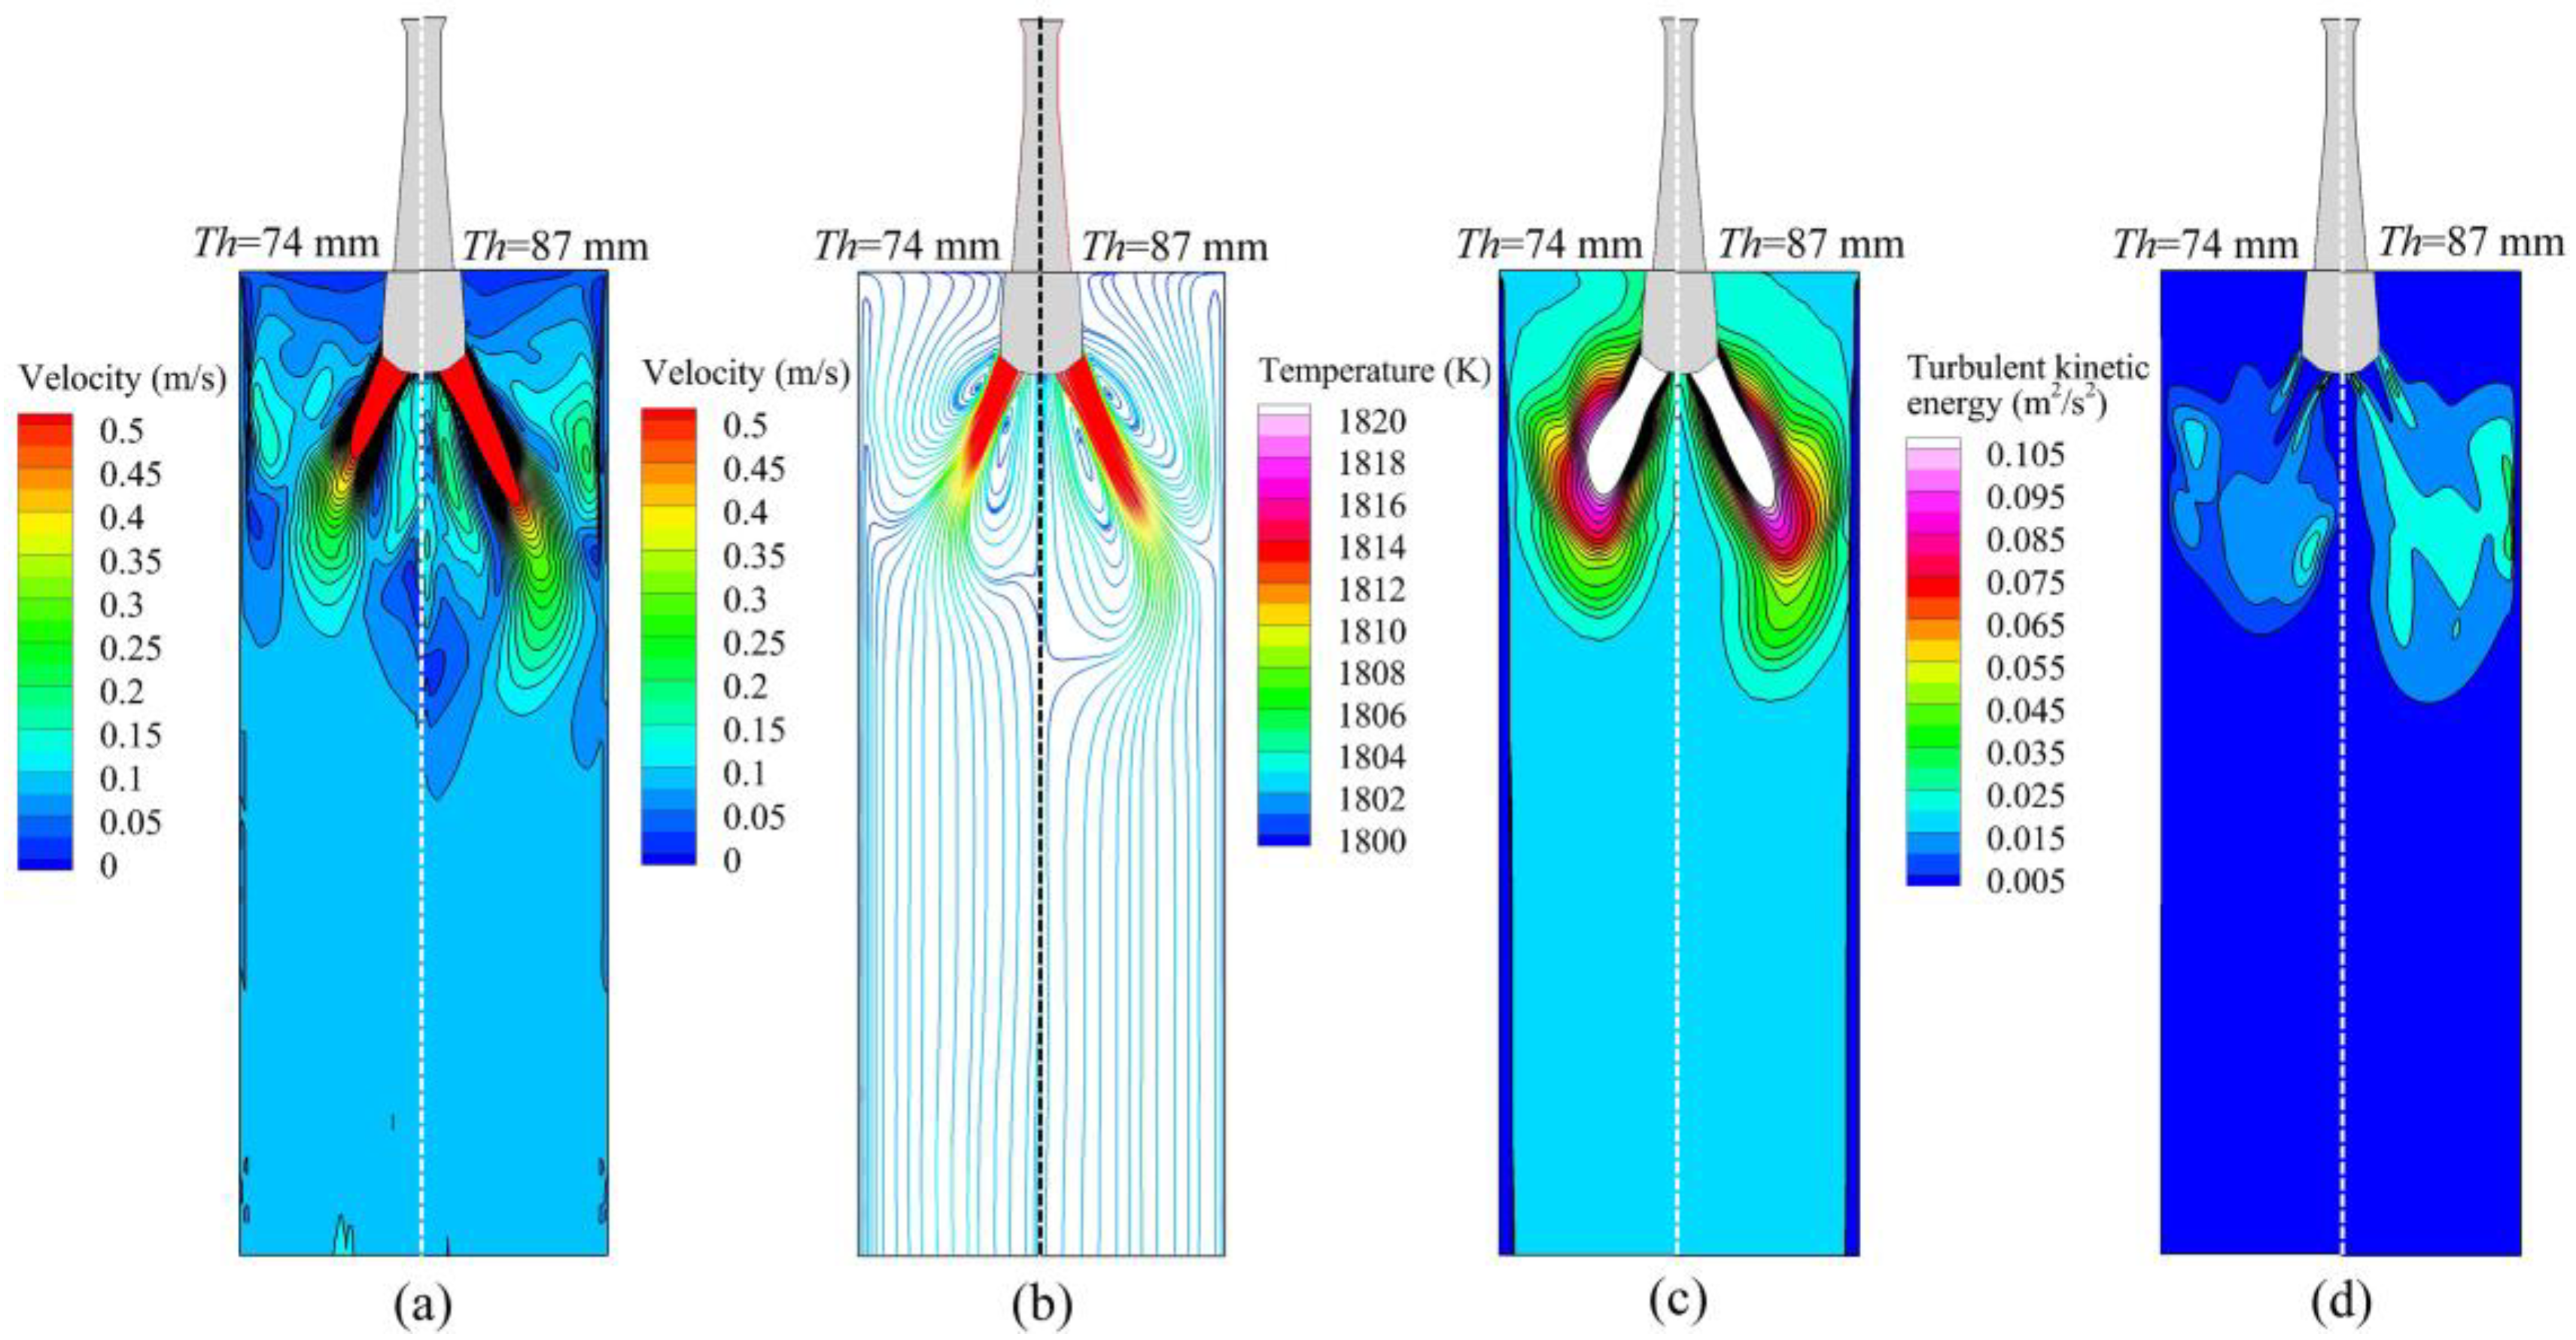
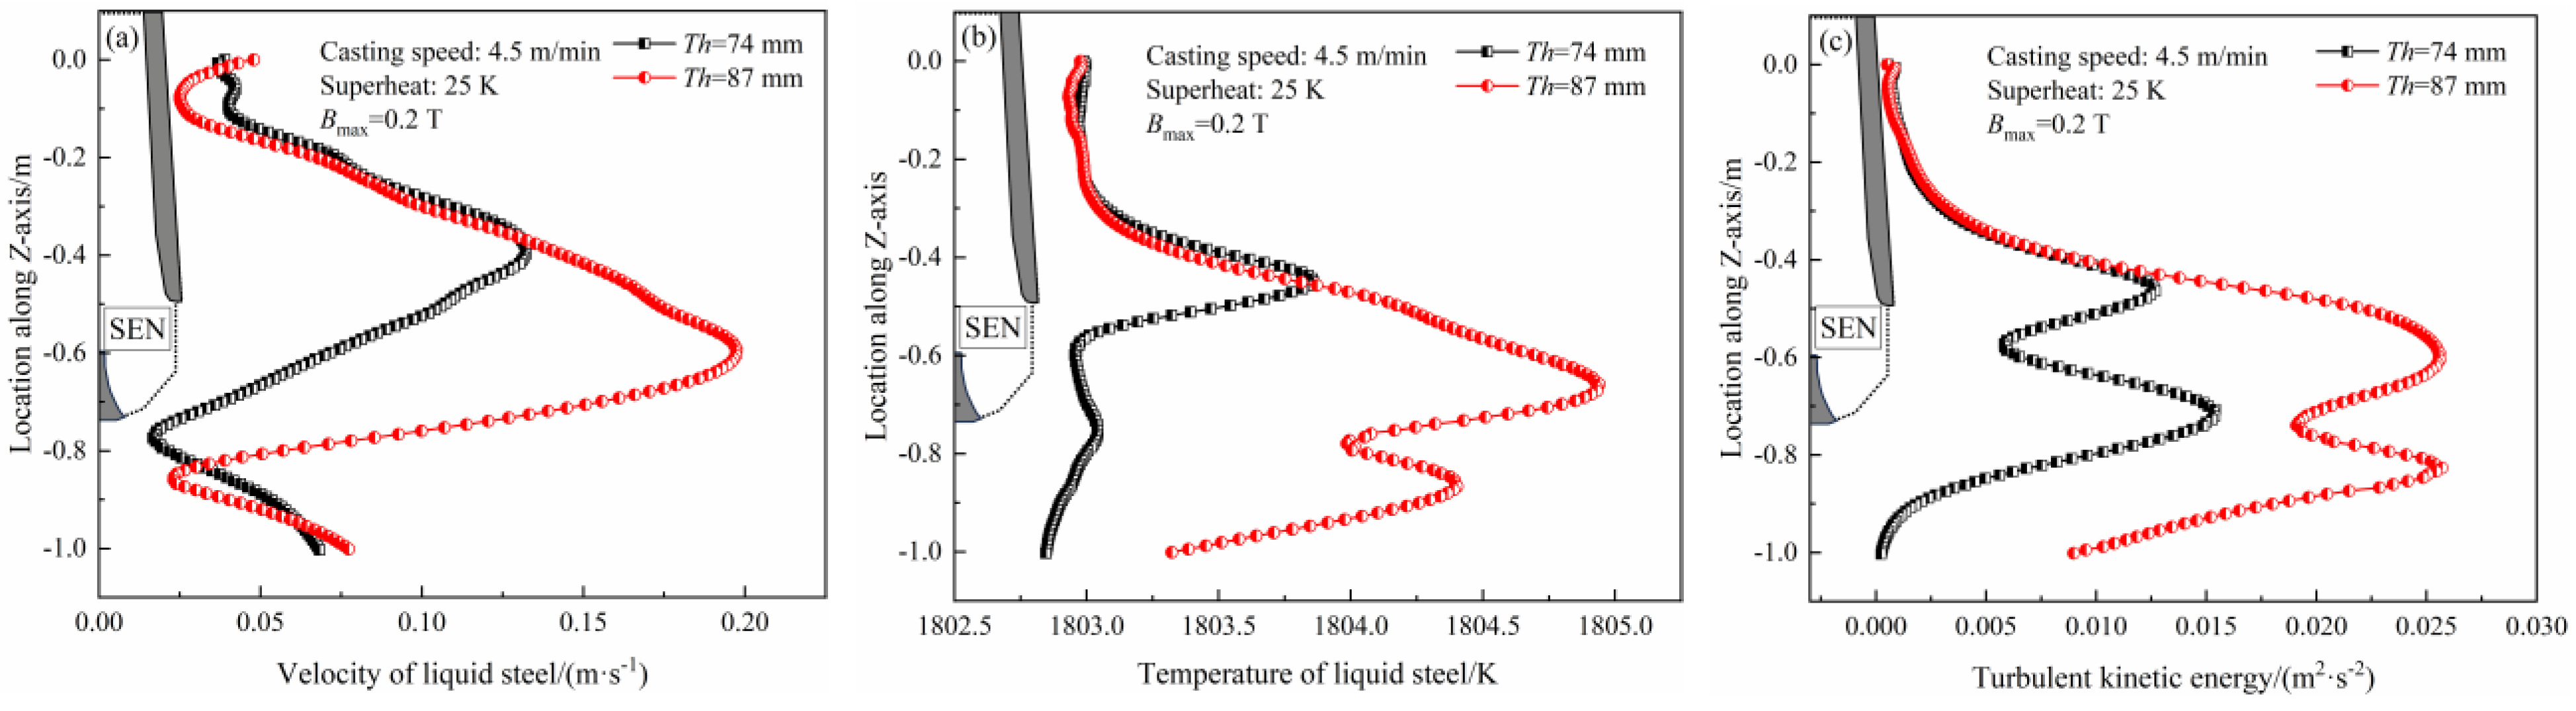
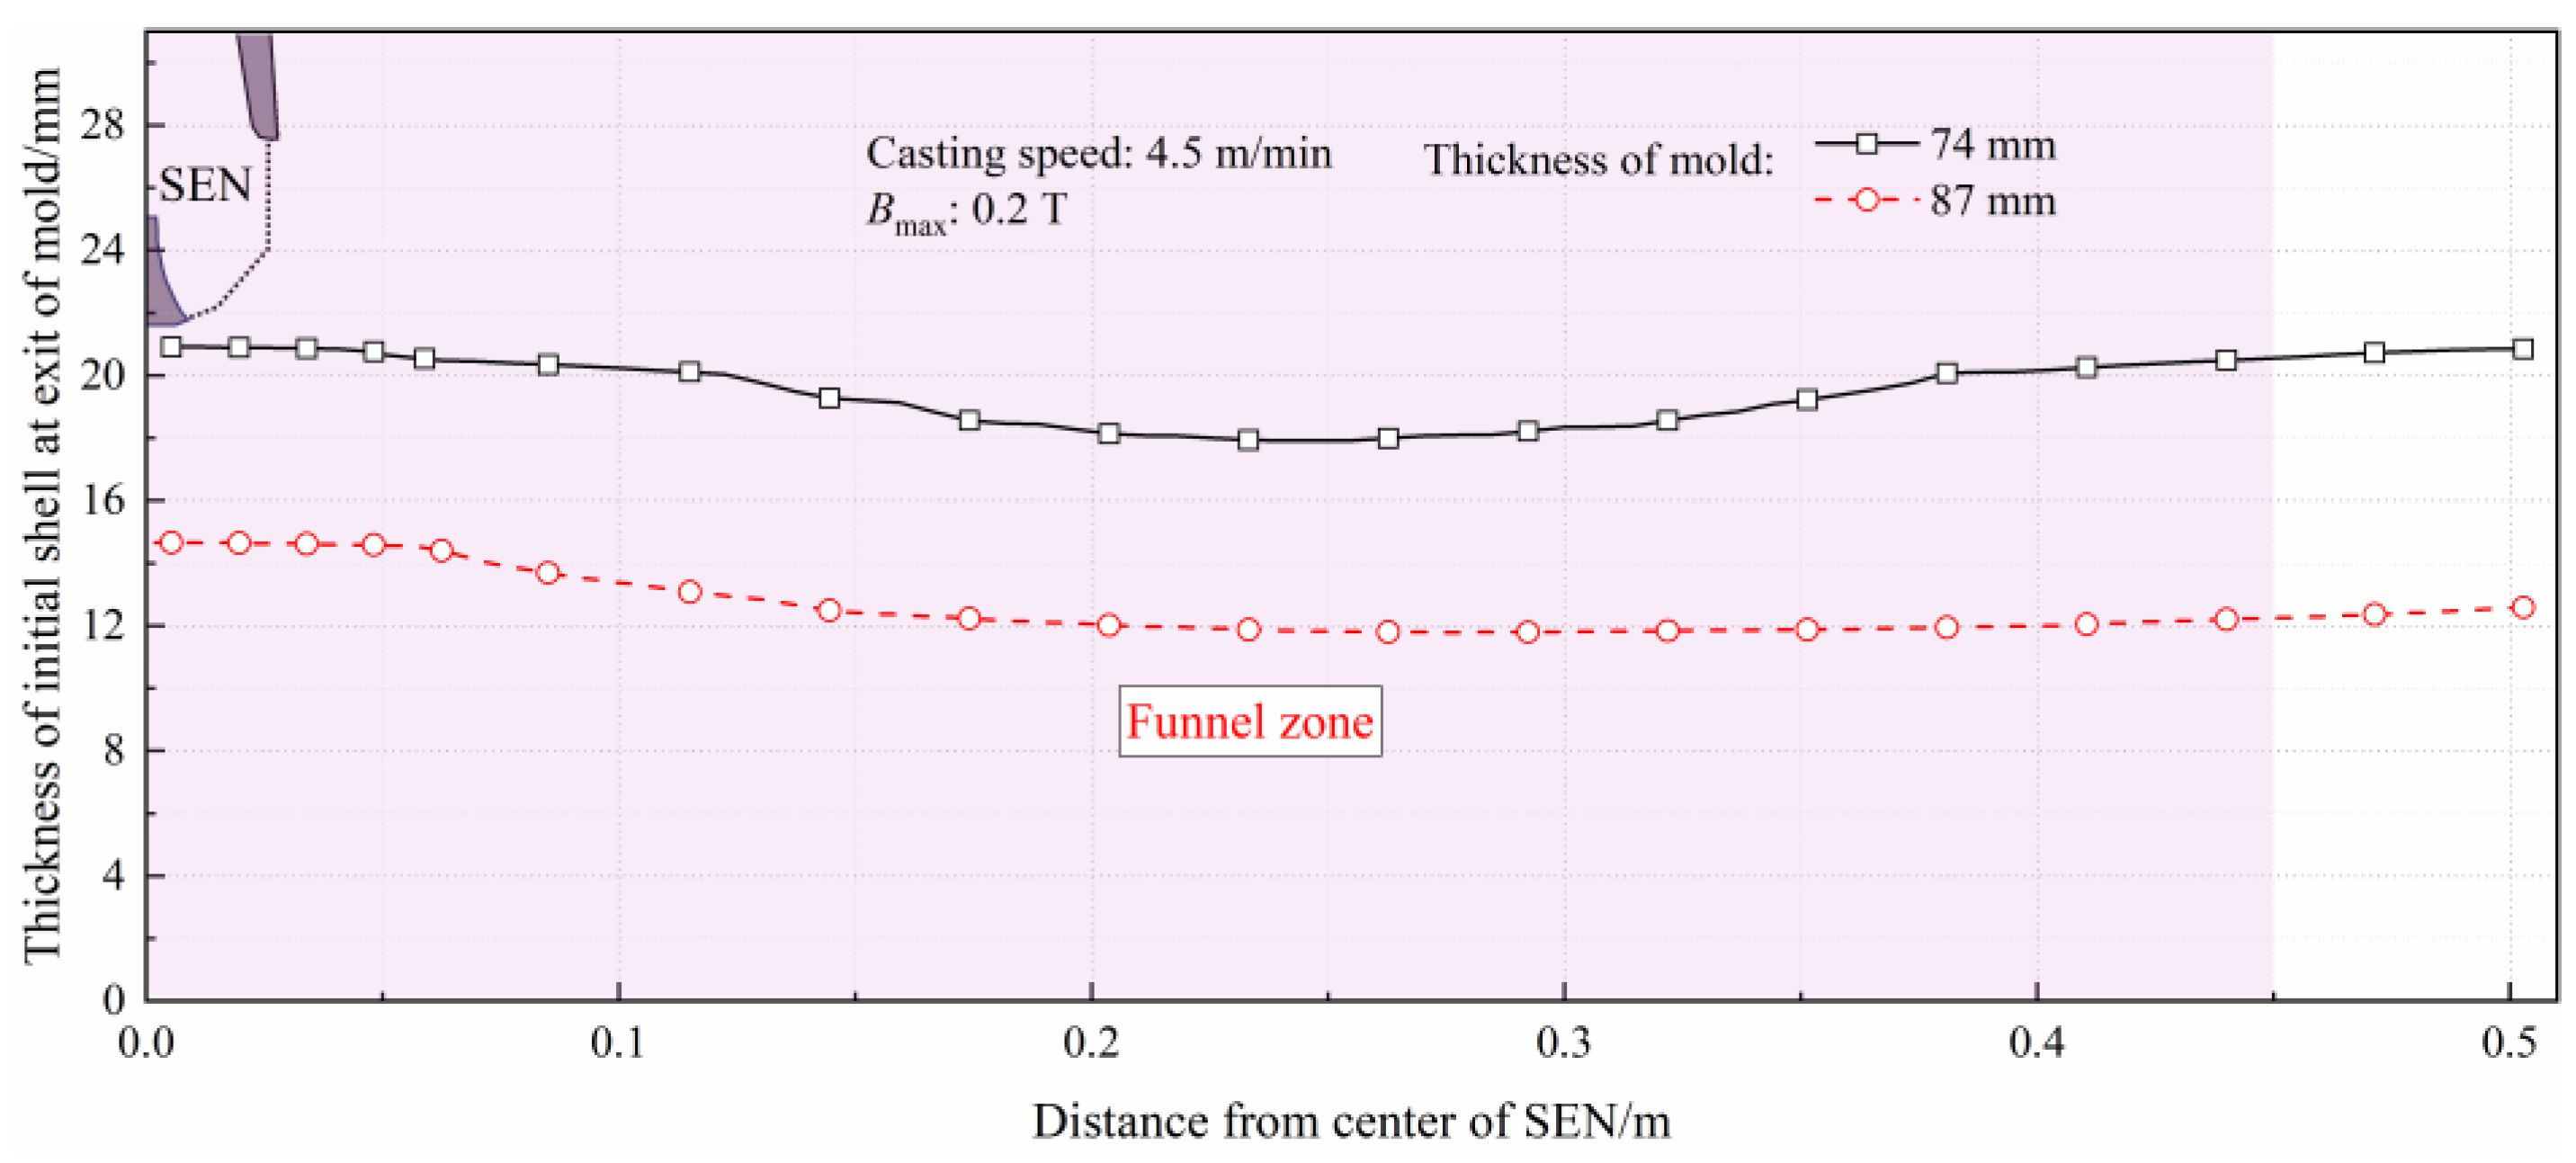
3.3. Comparison of Metallurgical Behavior of Liquid Steel in Thin Slab Molds with Different Thicknesses

Figure 8a–d shows the velocity contour, streamline, temperature contour, and turbulence kinetic energy contour of the liquid steel in the mold when the casting speed is 4.5 m/min, Bmax is 0.2 T, and the thickness of the mold (Th) is 74 and 87 mm.
Figure 8 shows that when the mold thickness increases from 74 mm to 87 mm, the liquid steel is still in a double roll flow pattern. A larger thickness means a larger steel throughput in the mold, resulting in a larger jet velocity, and the penetration depth of the jet increases from 1.12 m to 1.35 m below the meniscus, as shown in Figure 8a, which hinders the flotation of non-metallic inclusions. It can be demonstrated that even under the braking effect of the EMBr, the impact of increasing mold thickness on the metallurgical behavior of liquid steel is considerable. Specifically, the upward flow has a higher velocity, and the center of the recirculation flow moves downwards, as shown in Figure 8b. In addition, the temperature in the mold upper region decreases with the increase of mold thickness, especially in the area near the SEN. Overall, the high-temperature penetration zone also moves downwards, as shown in Figure 8c, which will increase the superheat at the solidification front and the proportion of columnar crystals. Furthermore, turbulent kinetic energy in the thicker mold becomes larger and concentrated in the lower part of the mold, as shown in Figure 8d.
Figure 9 shows the distribution of velocity and temperature near the narrow faces and meniscus in the molds with different thicknesses. It can be seen that as the mold thickness increases from 74 mm to 87 mm, the maximum velocity near the narrow face increases from 0.13 m/s to 0.20 m/s, and peak value position of velocity decreases from −387 mm to −591 mm below the meniscus, indicating that the range and strength of upper recirculation flow are enlarged. The temperature and turbulence energy in the lower part of the mold increase, which will exacerbate the unevenness of the initial solidified shell. Figure 10 shows that the meniscus velocity and turbulent kinetic energy have peak values near the narrow face, showing a trend of decreasing first and then increasing towards the SEN direction, and the meniscus temperature near the SEN is relatively higher. Increasing the mold thickness from 74 mm to 87 mm, the maximum meniscus velocity and turbulence kinetic energy increase slightly; the temperature near the SEN decreases, and the overall distribution of meniscus temperature becomes more uniform.
Figure 11 presents the distribution profiles of the initial solidified shell thickness along the broad face direction at the mold exit under different thicknesses of the mold. The impact of different process parameters on the uniformity of the solidified shell is characterized by defining the non-uniformity coefficient λ, as illustrated in Equation (14):
λ = D max D min D ave
where Dmax, Dmin are the maximum and minimum thickness of the solidified shell, respectively, mm. Dave is the average thickness of the solidified shell, mm.
Figure 11 shows that the solidification shell is thickest near the nozzle center, where the flow is weaker and the steel renewal rate is slower, while it is thinner in the jet penetration region 0.2~0.3 m away from the nozzle. An obvious change in shell thickness is observed within the range of 0.05~0.15 m from the nozzle, indicating that this area is prone to significant stress concentration due to the non-uniformity of the shell thickness, making it a susceptible location for longitudinal cracks. Spatially, the uneven velocity distribution leads to significant variations in heat distribution in the mold. In the 74 mm-thickened mold, the smaller steel flow rate results in a thicker solidified shell. The maximum and minimum shell thicknesses along the broad face direction at the mold exit are 17.92 mm and 20.82 mm, respectively. The average shell thickness is 19.73 mm, with a non-uniformity coefficient λ of 15.23% and a standard deviation value of 1.09. However, when the mold thickness increases to 87 mm, the shell thickness thins, and the average thickness drops to 12.83 mm, with the non-uniformity coefficient λ increasing to 22.34% and the standard deviation value increasing to 1.10.

3.4. Effect of Process Parameters on Metallurgical Behavior of Liquid Steel in Thin Slab Mold with EMBr

By leveraging electromagnetic effects, the EMBr technique applies Lorentz forces on the moving liquid steel to regulate its flow behavior in a mold. The alteration in flow patterns subsequently influences the heat transfer and solidification of the liquid steel, as well as the melting and infiltration of mold flux. The magnetic flux density represents the intensity of the external electromagnetic field, while the casting speed is correlated with the liquid steel velocity in the mold. Both factors are directly associated with the braking force. Therefore, based on the mathematical model established in this study, a comprehensive analysis was conducted to investigate the relationships between the electromagnetic intensity, the casting speed, and the metallurgical behavior of liquid steel in an 87 mm-thick mold.

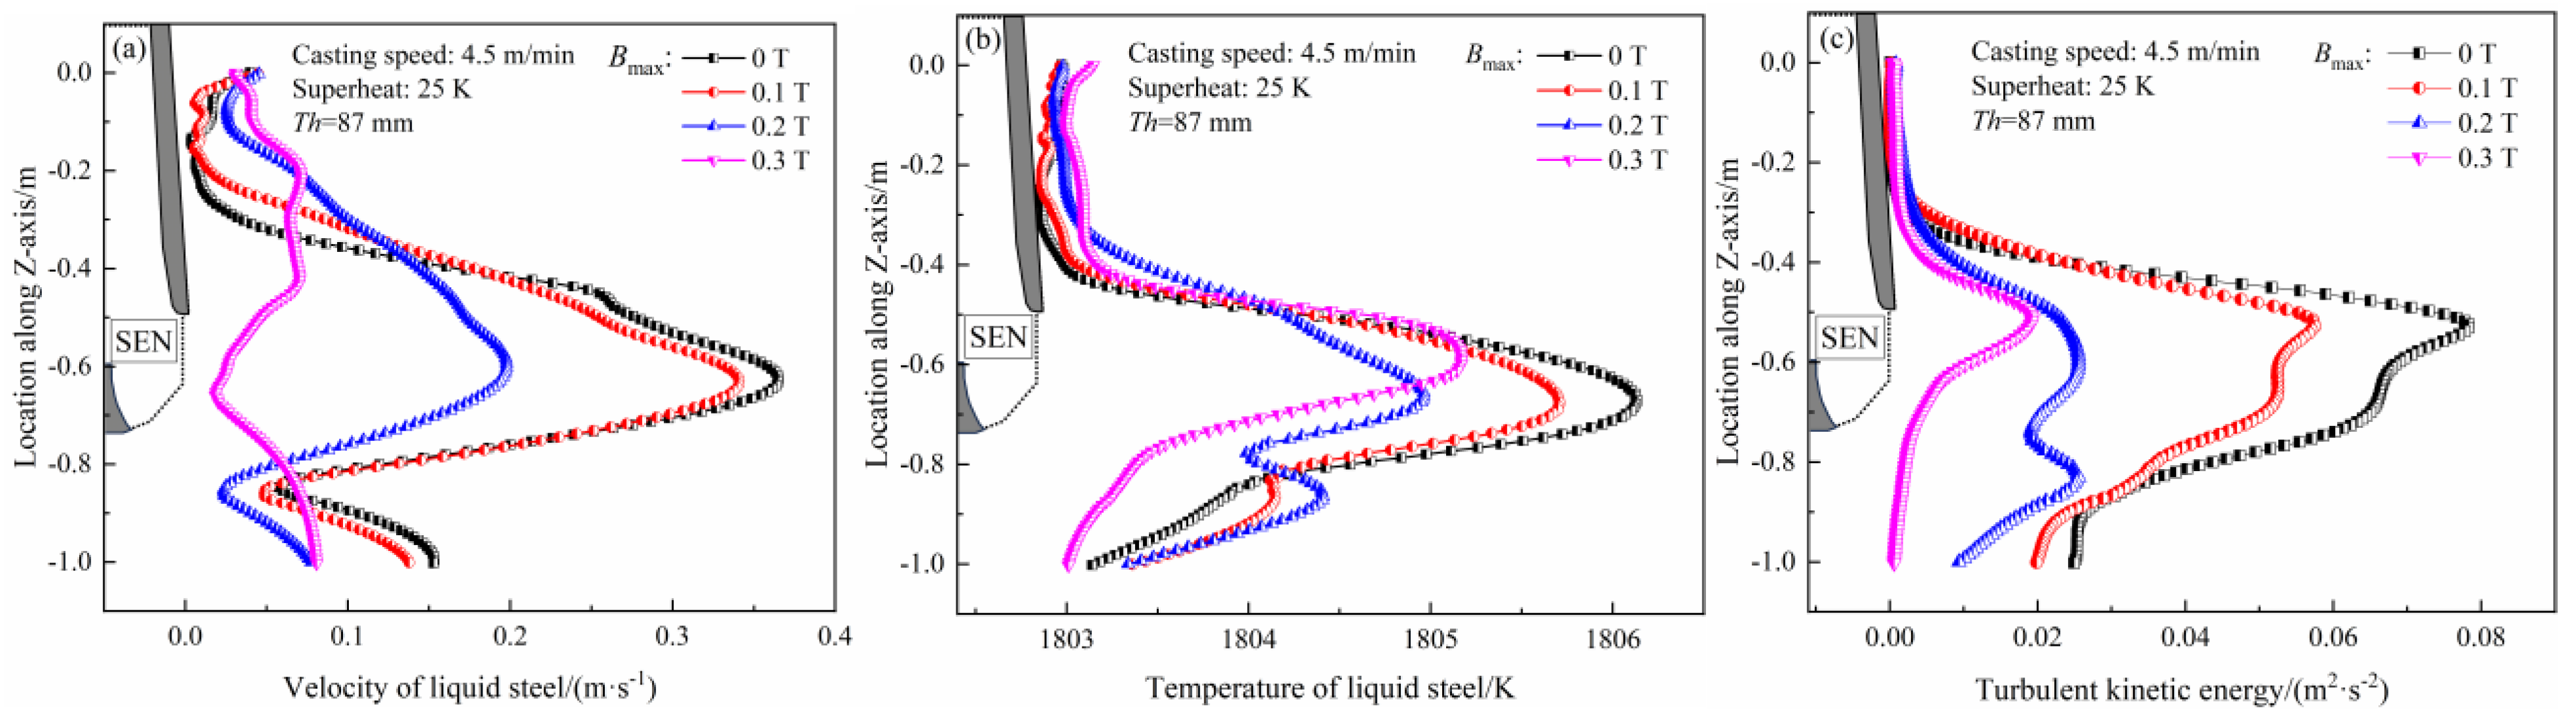
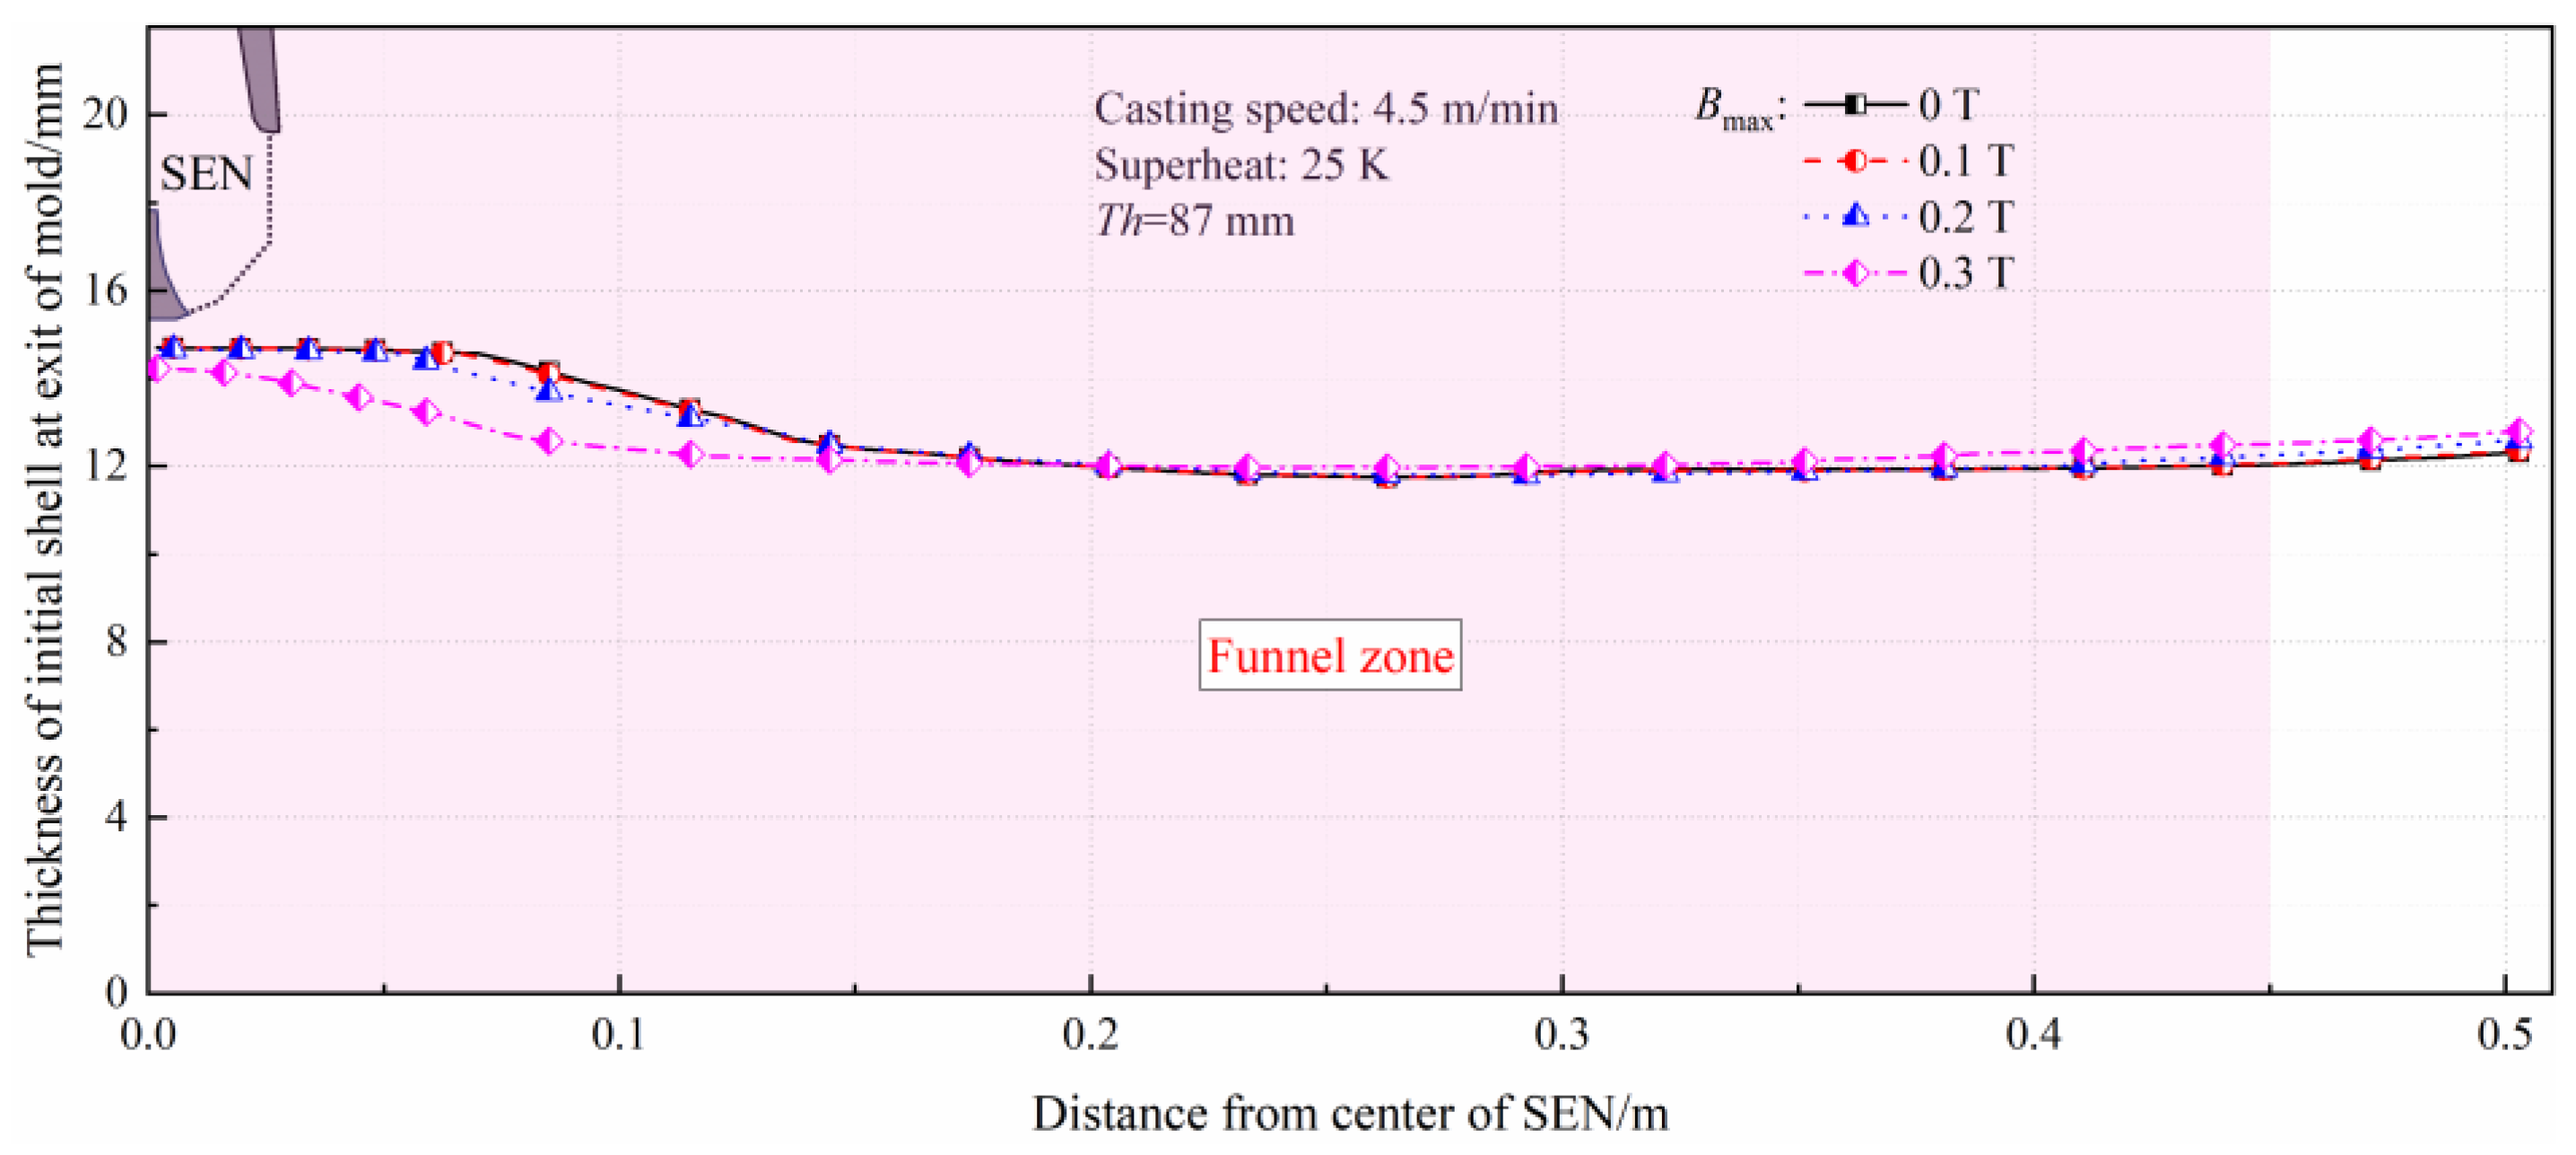
3.4.1. Effect of Electromagnetic Intensity

When the casting speed is 4.5 m/min, Bmax is 0, 0.1, 0.2, and 0.3 T; the velocity contour and streamline are shown in Figure 12a, and the temperature and turbulence kinetic energy are shown in Figure 12b. The distributions of velocity, temperature, and turbulence kinetic energy near the narrow faces and meniscus in the molds with different electromagnetic intensity are shown in Figure 13 and Figure 14, respectively.
Figure 12 indicates that when Bmax is 0, the liquid steel ejected from the SEN migrates to the narrow faces at the lower part of the mold, subsequently splitting into two sub-flow streams. One portion of upward flow towards the SEN forms a large recirculation flow above the main jet, and the other portion towards the meniscus generates a smaller eddy near the narrow face, which can influence the slag infiltration behavior. The superheat is gradually dissipated and reduced along the main impinging jet direction, with the turbulent kinetic energy reaching its maximum in the narrow face adjacent to the upper recirculation flow. With the employment of EMBr, the jet is deflected towards the SEN by the constraint of the Lorentz force, resulting in an upward shift of the recirculation flow center and a reduction in turbulent kinetic energy. Particularly, when the Bmax increases from 0.1 T to 0.2 T, the control effect of EMBr on the jets becomes pronounced. Specifically, the jet penetration depth increasing from 1.30 m to 1.35 m leads to an expansion of the high-temperature region and a notable decrease in turbulent kinetic energy. When Bmax further increases to 0.3 T, the penetration depth decreases to 1.20 m, the high-temperature area expands, and the turbulent kinetic energy decreases sharply.
Figure 13 and Figure 14 illustrate that when Bmax increases from 0 to 0.1 T, the velocity and temperature near the narrow face and meniscus exhibit minimal changes, while the turbulent kinetic energy decreases by approximately 25%. This indicates that the braking effect on the liquid steel is relatively weak when the magnetic flux density is lower. When the Bmax increases to 0.2 T, the maximum velocity, temperature, and turbulent kinetic energy near the narrow face decrease to 0.20 m/s, 1805 K, and 0.02 m2/s2, respectively. Meanwhile, the locations of the maximum velocity and turbulent kinetic energy at the meniscus shift towards the narrow face, and the temperature near SEN increases slightly. This is related to the alteration in the flow pattern. When Bmax further increases to 0.3 T, a strong braking force makes the velocity and turbulent kinetic energy decrease markedly, which may adversely affect the melting and infiltration of the mold flux and increase the risk of surface cracks in the thin slab.
For further analysis of the influence of electromagnetic intensity on the solidification of liquid steel, Figure 15 presents the distribution profiles of the initial solidified shell thickness along the broad face direction at the mold exit under different electromagnetic intensity. Table 3 presents the characteristic parameters of the solidified shell at the mold exit under different electromagnetic intensity, by further processing the data depicted in Figure 15.
It can be observed that when Bmax is 0 T, the solidified shell thickness ranges from 11.76 to 14.69 mm, and the average thickness is 12.86 mm, with a non-uniformity coefficient of 22.85% and a standard deviation value of 1.17. When the EMBr is applied, the shell thickness decreases near the nozzle and increases at the broad face center and near the narrow face. The maximum thickness decreases, and the minimum thickness increases. As the Bmax increases to 0.1 T, 0.2 T, and 0.3 T, the average thickness of the solidified shell decreases to 12.84 mm, 12.83 mm, and 12.62 mm, and the non-uniformity coefficient decreases to 22.84%, 22.34%, and 17.94%, respectively. The lowest standard deviation value is 0.71 when the Bmax is 0.3 T. It is evident that EMBr improves the thickness uniformity of the solidified shell by altering the metallurgical behavior of liquid steel in the mold.

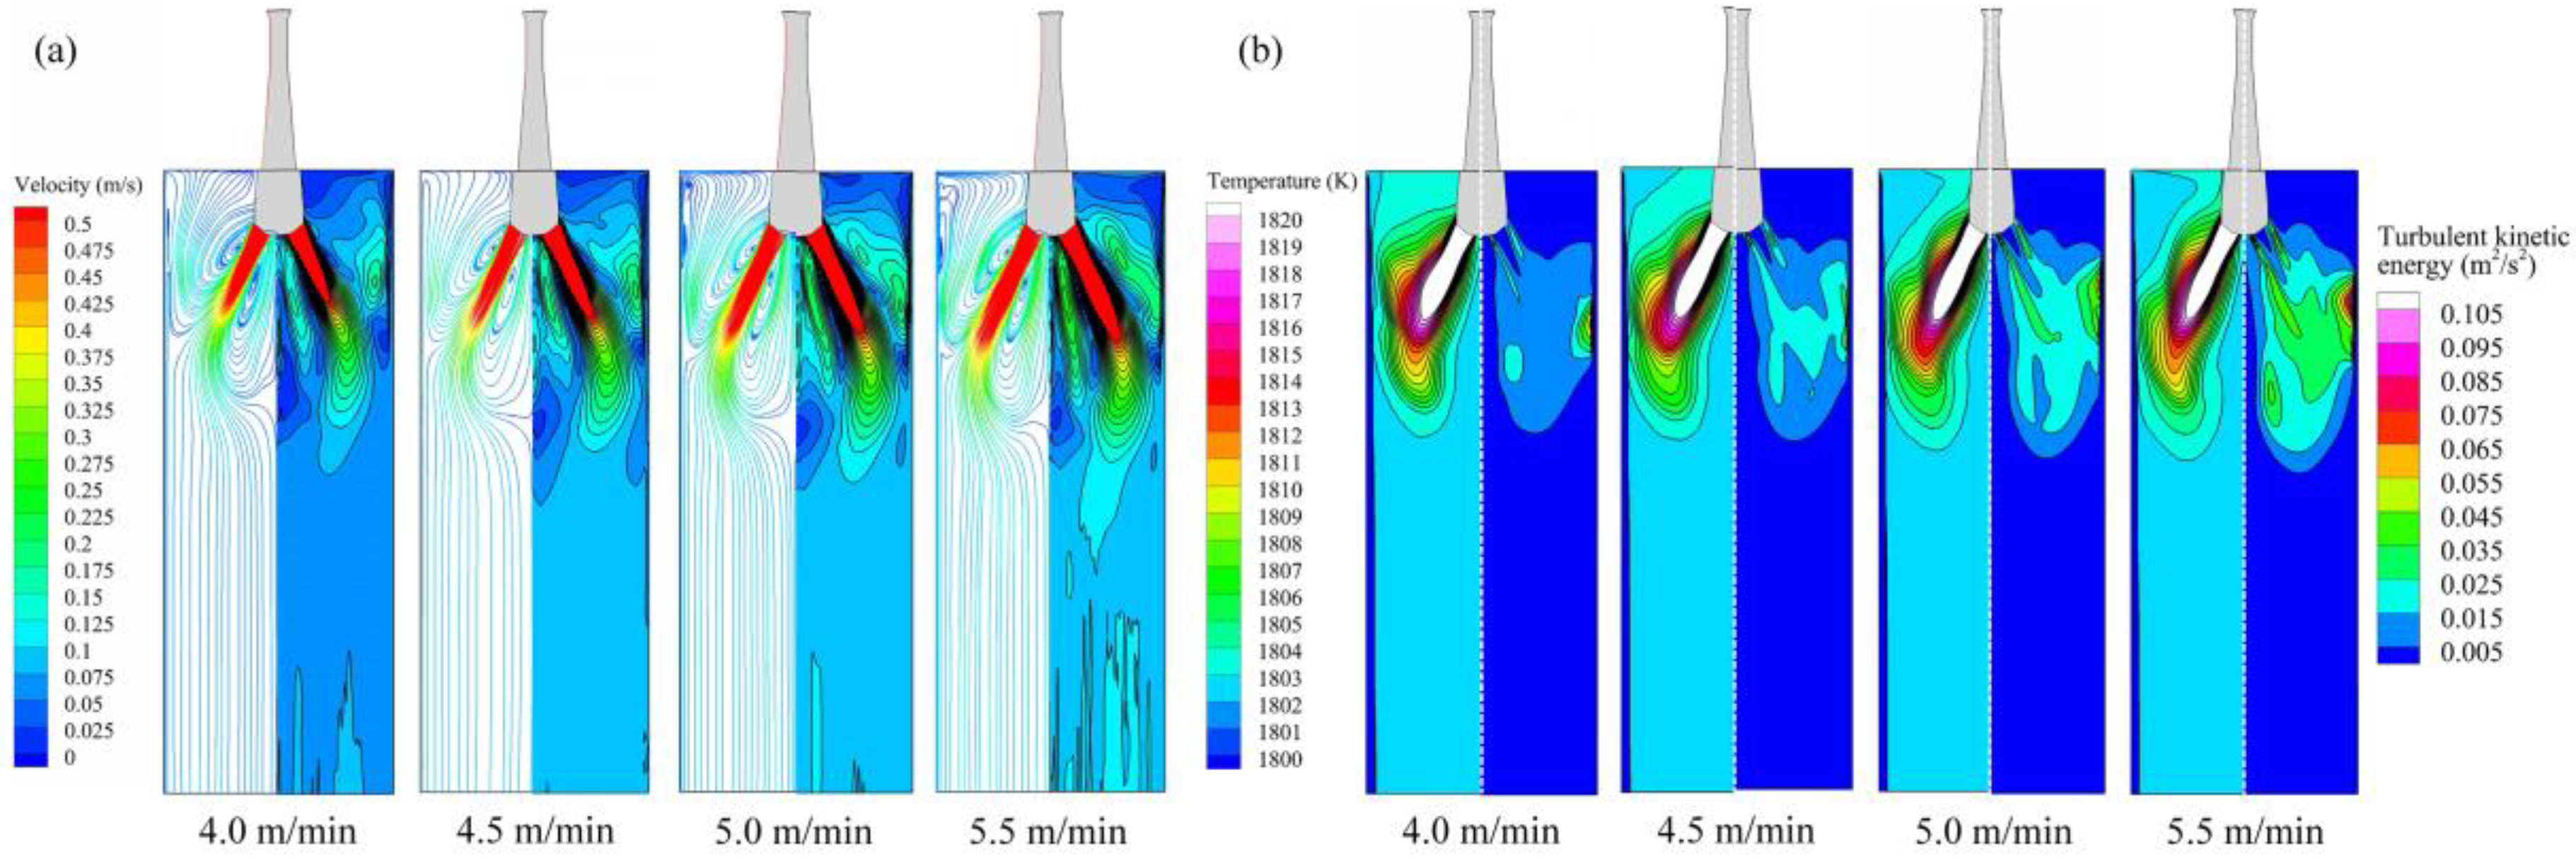
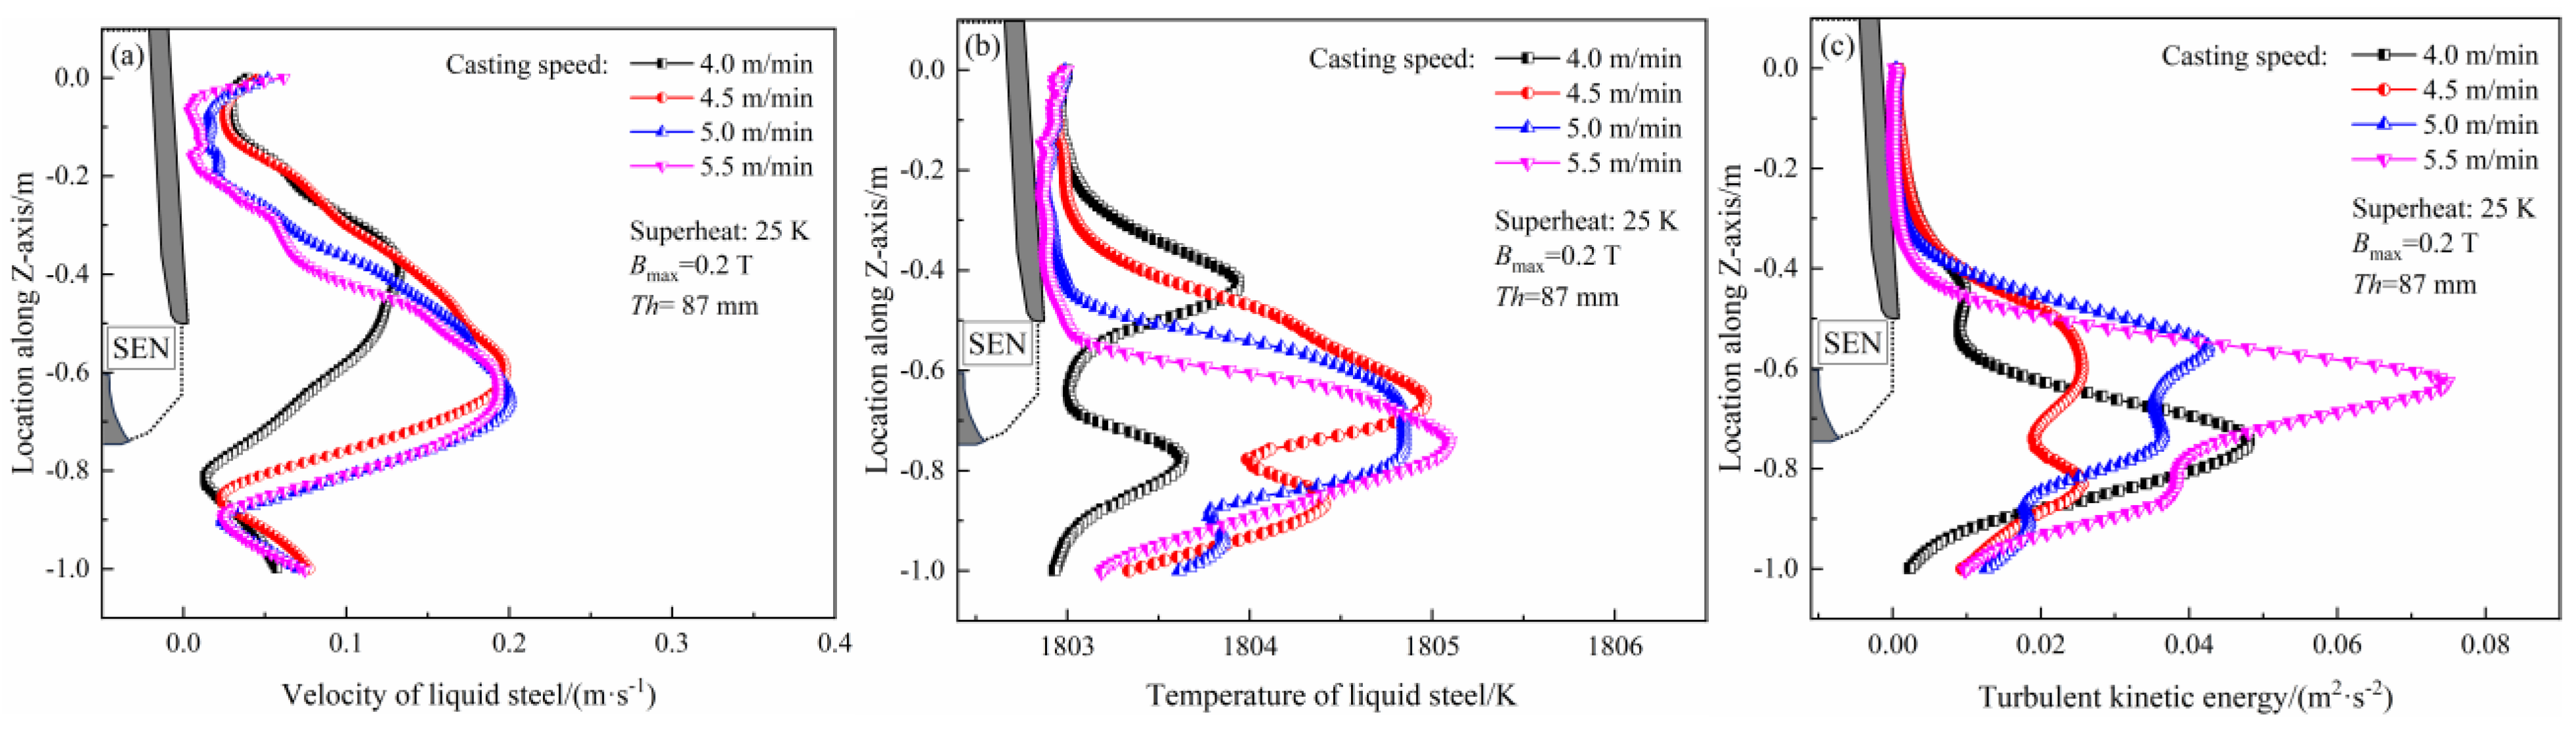
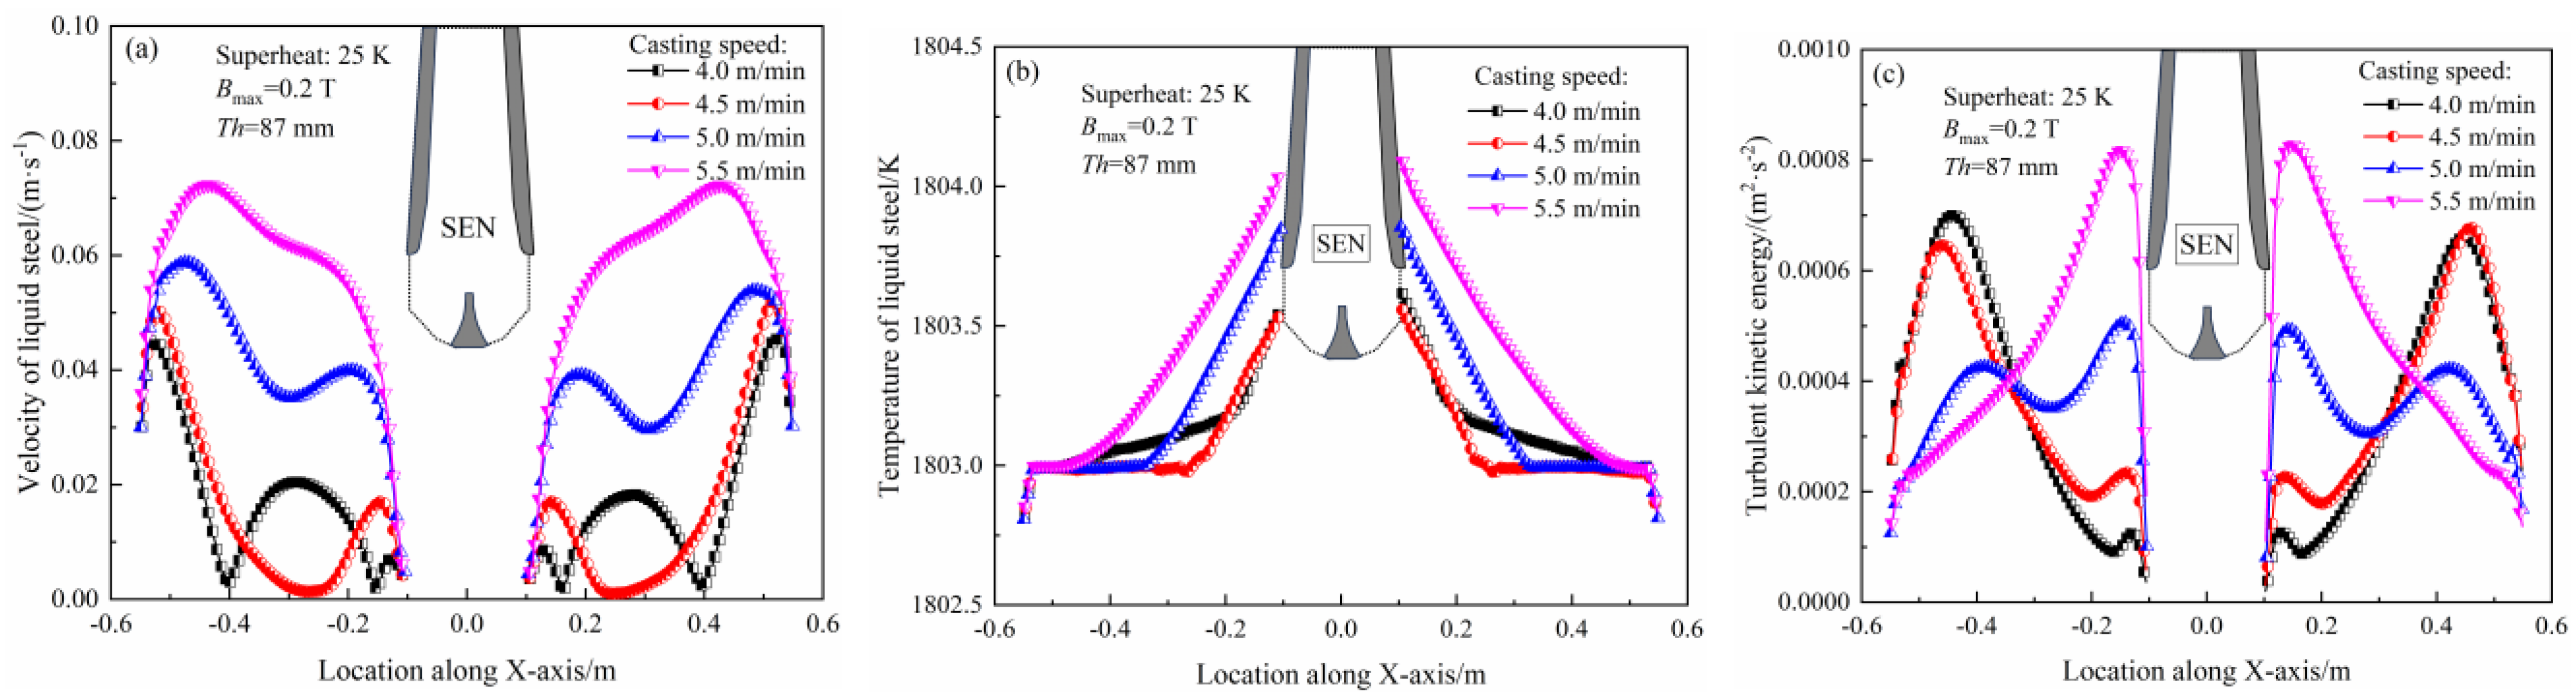
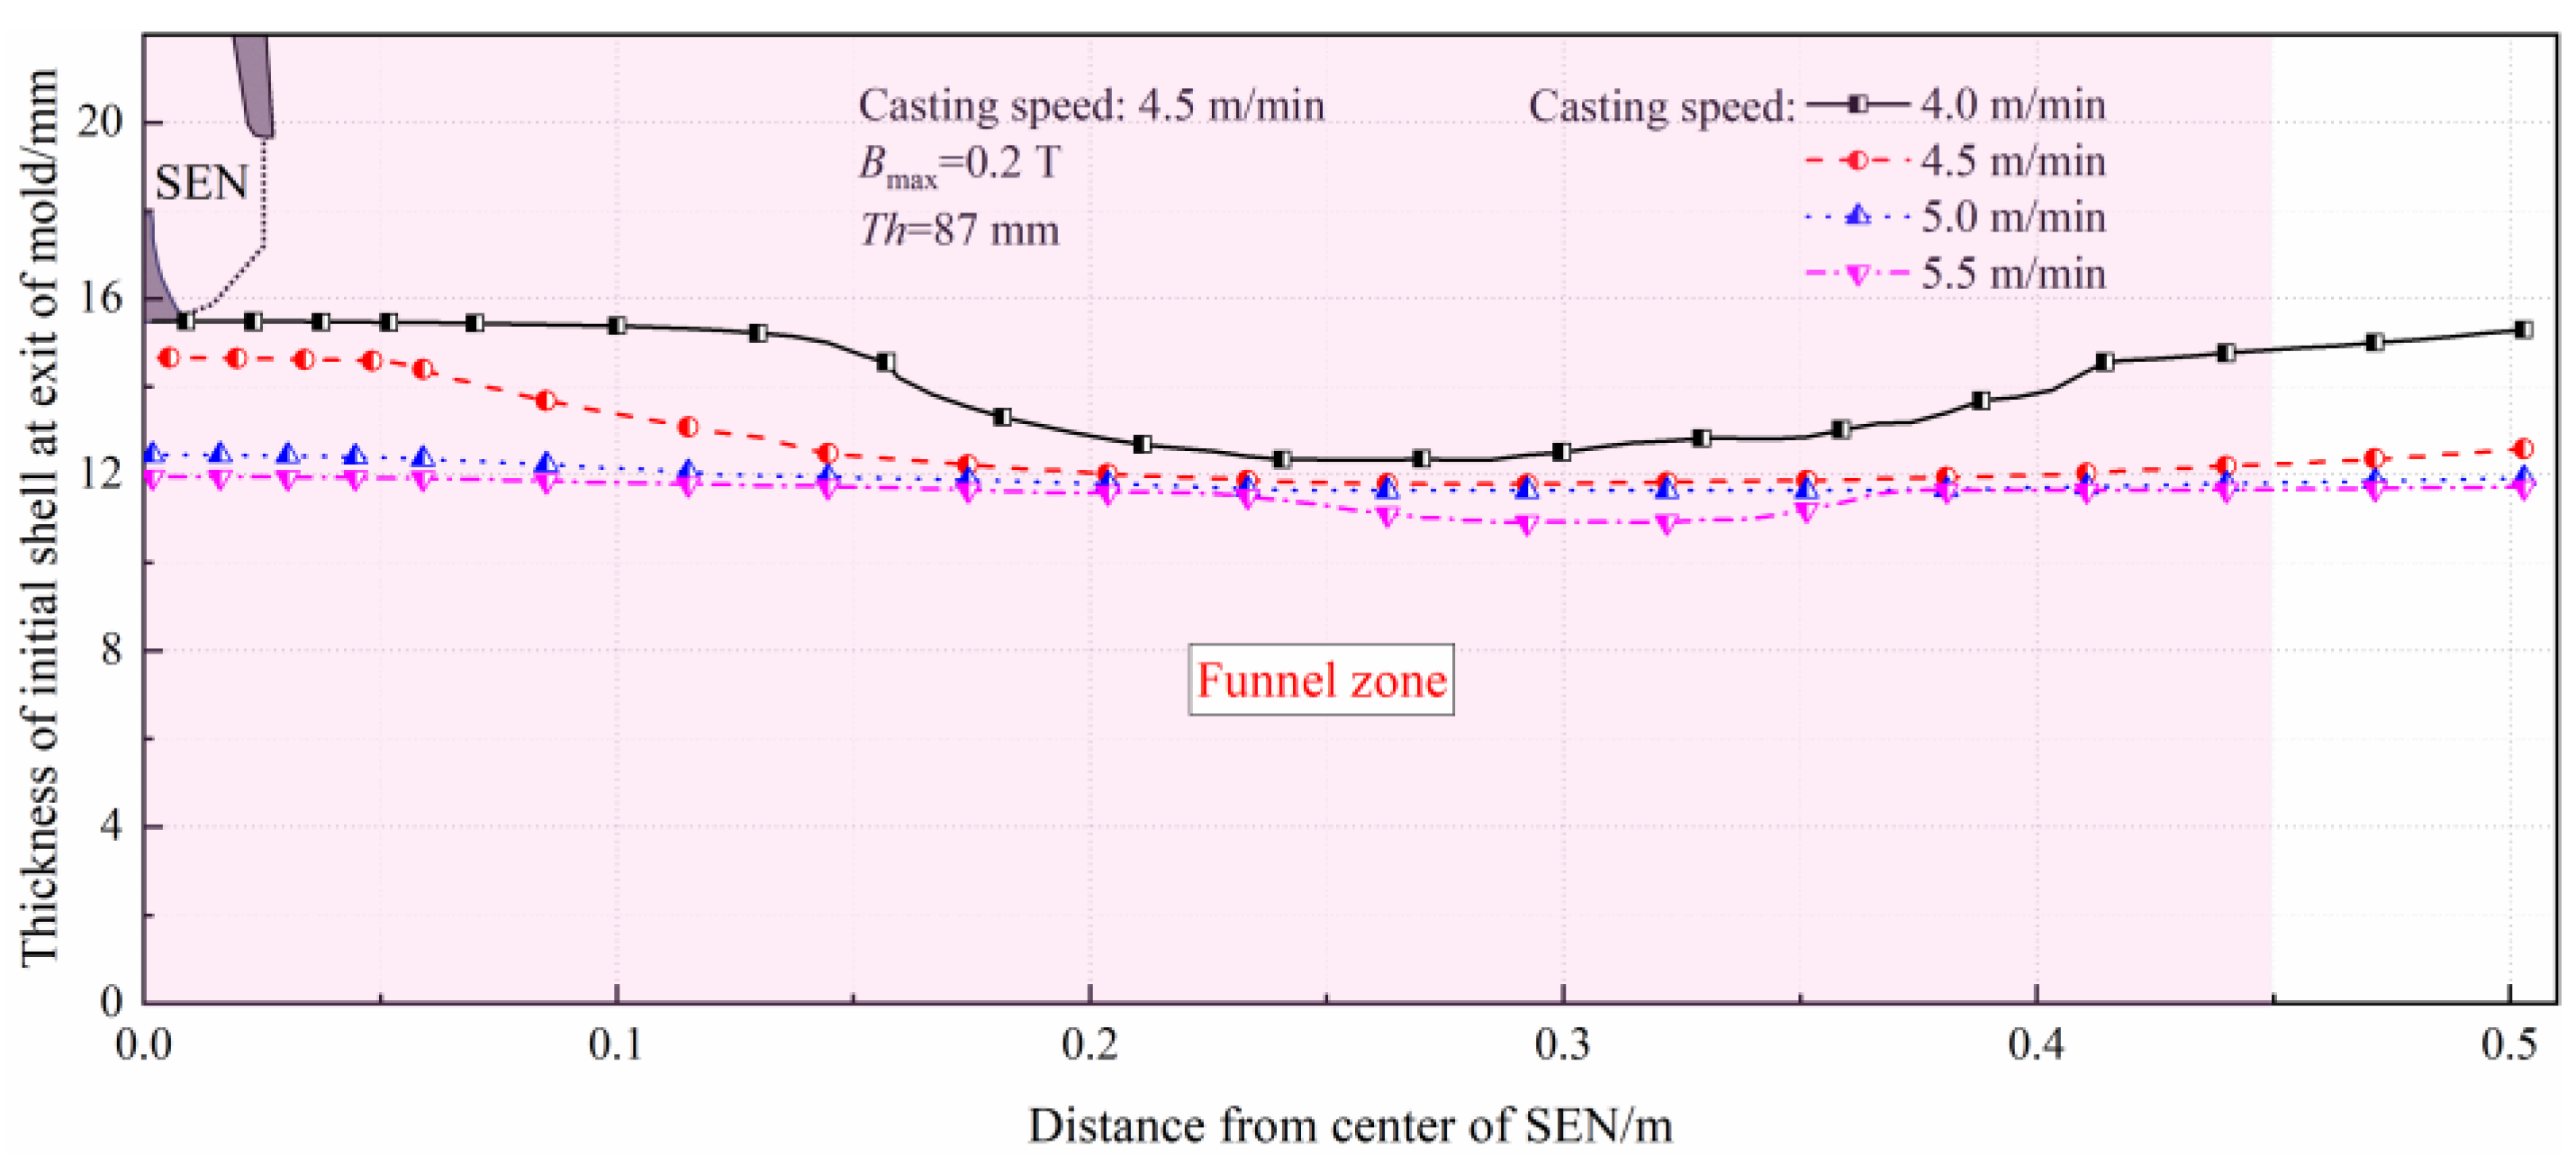
3.4.2. Effect of Casting Speed

For a Bmax of 0.2 T and casting speed of 4.0 m/min, 4.5 m/min, 5.0 m/min, and 5.5 m/min, the velocity contour and streamline are shown in Figure 16a, and the temperature and turbulence kinetic energy are shown in Figure 16b. The distributions of velocity, temperature, and turbulence kinetic energy near the narrow faces and meniscus in the molds with different casting speeds are shown in Figure 17 and Figure 18, respectively.
Figure 16 shows that when the casting speed is 4.0 m/min, the jet penetration depth is 1.23 m under the braking effect of the steady magnetic field. The temperature distribution in the upper part of the mold is uniform, and the turbulent kinetic energy in the lower part of the mold is relatively lower. As the casting speed increases to 4.5 m/min, 5.0 m/min, and 5.5 m/min, the penetration depth increases to 1.35 m, 1.50 m, and 1.78 m, respectively. The recirculation flow center shifts downward, and the area of both the high-temperature and turbulent kinetic energy increases rapidly. This indicates that, when the magnetic flux density remains constant, increasing the casting speed diminishes the braking effectiveness of EMBr, particularly for a high casting speed.
Figure 18 and Figure 19 indicate that when the casting speed is 4.0 m/min, the maximum velocity near the narrow face is 0.13 m/s, located −385 mm below the meniscus. When the casting speed increases to 4.5 m/min, both the velocity and temperature near the narrow face increase, and the range of high turbulent kinetic energy also expands. However, the changes at the meniscus are not significant. As the casting speed increases to 5.0 and 5.5 m/min, the maximum velocity and temperature near the narrow face change less. This is related to the increase in Lorentz force with higher casting speeds. The intensified jet interacts with the magnetic field, causing more liquid steel to migrate towards the upper part of the mold, thereby increasing the meniscus velocity and temperature. Additionally, the maximum turbulent kinetic energy is near the nozzle, which will enhance the slag fluctuations and slag entrapment.
Figure 19 illustrates the distribution profiles of the initial solidified shell thickness along the broad face direction at the mold exit under different casting speeds. Table 4 presents the characteristic parameters of the solidified shell at the mold exit for various casting speeds. It can be observed that as the casting speed increases, the narrow funnel-shaped space within the thin slab mold results in a reduced growth rate of the initial solidified shell owing to the impact of high-throughput liquid steel, leading to a thinner shell. Specifically, with increasing casting speed, the shell thickness near the nozzle and narrow face decreases significantly, while the change is relatively minor in the 1/4 region of the broad face. Both the maximum and minimum thicknesses of the solidified shell decrease, with the average thickness decreasing from 14.24 mm at a casting speed of 4.0 m/min to 11.62 mm at a casting speed of 5.5 m/min. The non-uniformity coefficient and standard deviation of the solidified shell are the smallest when the casting speed is 5.0 m/min, with values of 6.78% and 0.30, respectively, and the shell thickness profile curve is uniform. It can be inferred that the stress concentration caused by the non-uniformity of shell thickness will be improved.

4. Conclusions

(1)
The solidification shell is thickest near the nozzle center and thinner in the jet penetration region 0.2~0.3 m away from the nozzle. An obvious change in shell thickness is observed within the range of 0.05~0.15 m from the nozzle. In addition, a relatively large Lorentz force opposite to the main jet direction is found near the solidified shell in the jet penetration region, corresponding to a stress magnitude of 38.4 Pa at the solidified front.
(2)
When the mold thickness increases from 74 mm to 87 mm, the maximum meniscus velocity and turbulence kinetic energy increase, and the penetration depth increases from 1.12 m to 1.35 m. In addition, the high-temperature penetration zone moves downwards overall, which will increase the superheat at the solidification front and the proportion of columnar crystals. The shell thickness thins, and the average thickness of the solidified shell drops from 19.73 to 12.83 mm, with the non-uniformity coefficient λ increasing from 15.23% to 22.34%.
(3)
For the 87 mm-thickened mold, as the magnetic flux density increases, the velocity near the narrow faces and meniscus decreases, and the average thickness of the solidified shell decreases with a more uniform distribution. Increasing the casting speed results in a deeper penetration depth, a larger meniscus velocity and temperature, and a more uniform shell thickness at the mold exit. The lowest non-uniformity coefficient and standard deviation of the solidified shell is obtained at a casting speed of 5.0 m/min, with values of 6.78% and 0.30, respectively.

Author Contributions

X.Q., J.Z., and C.C. conceived and designed the study; X.Q. and P.W. conducted the experiment; P.W. analyzed the experimental data and wrote the manuscript with the advice of X.Q. and Y.L. All authors have read and agreed to the published version of the manuscript.

Funding

This work was supported by National Natural Science Foundation of China [grant numbers 52204351, 52174324], the China Postdoctoral Science Foundation (2022M722487), and the Open fund project (grant No. FMRUlab23-05) supported by the Key Laboratory for Ferrous Metallurgy and Resources Utilization of the Ministry of Education.

Data Availability Statement

The original contributions presented in the study are included in the article, and further inquiries can be directed at the corresponding author.

Acknowledgments

Numerical calculation is supported by the High-Performance Computing Center of Wuhan University of Science and Technology.

Conflicts of Interest

Author Jianjun Zhang was employed by the company Baosteel Central Research Institute (Wuhan). The remaining authors declare that the research was conducted in the absence of any commercial or financial relationships that could be construed as a potential conflict of interest.

References

  1. Wang, S.; Gao, J.; Wu, G.; Mao, X. Thin slab casting and direct rolling technology: Current status and prospects. Chin. J. Eng. 2022, 44, 534–545. (In Chinese) [Google Scholar]
  2. Lu, X.; Li, H.; Liu, G.; Yang, W. Influence of different entry nozzle on flow patterns in the CSP mold. J. Iron Steel Res. Int. 2008, 15, 105–109. [Google Scholar]
  3. Nie, C.; Zhang, X.; Wang, B.; Sun, Y.; Liu, Q. Characteristics of inclusion motion and accumulation in CSP mold. ISIJ Int. 2015, 55, 1677–1683. [Google Scholar] [CrossRef]
  4. Liu, R.; Blazek, K.; Forman, B.; Fritz, C.; Graham, C. Effect of submerged-entry nozzle (SEN) design on fluid flow and heat transfer in a thin-slab steel caster. Steel Res. Int. 2019, 90, 1800398. [Google Scholar] [CrossRef]
  5. Liu, H.; Zhang, J.; Tao, H.; Zhang, H. Numerical analysis of local heat flux and thin-slab solidification in a CSP funnel-type mold with electromagnetic braking. Metall. Res. Technol. 2020, 117, 602. [Google Scholar] [CrossRef]
  6. Zong, N.; Liu, Y.; Zhang, H. Application of chamfered narrow face mold technology to reduce longitudinal surface crack defects of hyperperitectic steel generated during flexible thin slab casting process. Metall. Res. Technol. 2017, 114, 413. [Google Scholar] [CrossRef]
  7. Ramacciotti, A. Thermo-mechanical behaviour of the solidified shell in a “funnel-shaped” mold for continuous casting of thin slabs. Steel Res. 1988, 59, 438–448. [Google Scholar] [CrossRef]
  8. Garcia-Hernandez, S.; Gonzalez-Guzman, C.H.; Morales, D.R.; Barreto, J.J.; Gutierrez, E.; Calderon-Ramos, I. Modeling study of EMBr effects on the detrimental dynamic distortion phenomenon in a funnel thin slab mold. Crystals 2020, 10, 958. [Google Scholar] [CrossRef]
  9. Tian, X.; Zou, F.; Li, B.; He, J. Numerical analysis of coupled fluid flow, heat transfer and macroscopic solidification in the thin slab funnel shape mold with a new type EMBr. Metal. Mater. Trans. B. 2010, 41, 112–120. [Google Scholar] [CrossRef]
  10. Yamamura, H.; Toh, T.; Harada, H.; Takeuchi, E.; Ishii, T. Optimum magnetic flux density in quality control of casts with level DC magnetic field in continuous casting mold. ISIJ Int. 2001, 41, 1229–1235. [Google Scholar] [CrossRef]
  11. Idogawa, A.; Sugizawa, M.; Takeuchi, S.; Sorimachi, K.; Fujii, T. Control of molten steel flow in continuous casting mold by two static magnetic fields imposed on whole width. Mat. Sci. 1993, 173, 293–297. [Google Scholar] [CrossRef]
  12. Jayakrishna, P.; Chakraborty, S.; Ganguly, S.; Talukdar, P. Numerical investigation on role of vertical electromagnetic brake system in reducing remelting effect and improving thermal characteristics in thin slab continuous casting. Int. J. Therm. 2023, 192, 108434. [Google Scholar] [CrossRef]
  13. Li, Z.; Zhang, L.; Bao, Y.; Ma, D.; Wang, E. Numerical simulation of the effects of horizontal and vertical EMBr on jet flow and mold level fluctuation in continuous casting. Metal. Mater. Trans. B 2022, 53, 938–953. [Google Scholar] [CrossRef]
  14. Xu, L.; Karcher, C.; Wang, E. Numerical simulation of melt flow, heat transfer and solidification in CSP continuous casting mold with vertical-combined electromagnetic braking. Metall. Res. Technol. 2023, 54, 1646–1664. [Google Scholar] [CrossRef]
  15. Singh, R.; Thomas, B.G.; Vanka, S.P. Large eddy simulations of double-ruler electromagnetic field effect on transient flow during continuous casting. Metal. Mater. Trans. B 2014, 45, 1098–1115. [Google Scholar] [CrossRef]
  16. Xu, L.; Tang, M.; Lyu, Z.; Li, N.; Liu, C.; Pei, Q. Influence of operating parameters on metal flow and thermal characteristics in an EMBr-single-ruler controlled CSP funnel-shaped mould. Metal. Mater. Trans. B 2024, 121, 316. [Google Scholar] [CrossRef]
  17. Cui, H.; Sun, J.; Zhang, J.; Ji, C.; Wang, G.; Liu, Q. Large eddy simulation of novel EMBr effect on flow pattern in thin slab casting mold with multi-port SEN and ultra-high casting speed. J. Manuf. Process. 2025, 133, 448–465. [Google Scholar] [CrossRef]
  18. Liu, H.; Yang, C.; Zhang, H.; Zhai, Q.; Gan, Y. Numerical simulation of fluid flow and thermal characteristics of thin slab in the funnel-type molds of two casters. ISIJ Int. 2011, 51, 392–401. [Google Scholar] [CrossRef]
  19. Chaudhary, R.; Thomas, B.G.; Vanka, S.P. Effect of electromagnetic ruler braking (EMBr) on transient turbulent flow in continuous slab casting using large eddy simulations. Metal. Mater. Trans. B 2012, 43, 532–553. [Google Scholar] [CrossRef]
  20. Zhang, L.; Zhang, X.; Wang, B.; Liu, Q.; Hu, Z. Numerical analysis of the influences of operational parameters on the braking effect of EMBr in a CSP funnel-type mold. Metal. Mater. Trans. B 2014, 45, 295–306. [Google Scholar] [CrossRef]
  21. Wang, C.; Liu, Z.; Li, B. Effect of the intensity of single-ruler electromagnetic braking on the flow pattern in a thin-slab funnel mold. Metal. Mater. Trans. B 2023, 54, 3438–3450. [Google Scholar] [CrossRef]
  22. Greis, B.; Bahrmann, R.; Rueckert, A.; Pfeifer, H. Investigations of flow pattern in the SEN regarding different stopper rod geometries. Steel Res. Int. 2015, 86, 1469–1479. [Google Scholar] [CrossRef]
  23. Fu, Y.; Yuan, G.; Wang, G.; Mao, Q. Study on the inverse problem of thin slab continuous casting mold based on fluid-solid coupled heat transfer. Case Stud. Therm. Eng. 2024, 63, 105277. [Google Scholar] [CrossRef]
  24. Sun, Y.; Ni, Y.; Xu, Z.; Cai, K.; Chang, C.; Ma, M.; Du, X.; Jia, X. Longitudinal surface cracks of medium carbon steel on CSP thin slab. J. Iron Steel Res. Int. 2008, 15, 154–164. [Google Scholar]
  25. Dong, Q.; Zhang, J.; Yin, Y.; Nagaumi, H. Numerical simulation of macrosegregation in billet continuous casting influenced by electromagnetic stirring. J. Iron Steel Res. Int. 2021, 29, 612–627. [Google Scholar] [CrossRef]
  26. Lu, H.; Xie, X.; Zhong, Y.; Cheng, C.; Ren, W.; Lei, Z. Analysis of Transient Flow and Inclusion Transport in Vertical-Bending Slab Continuous Caster with Mold Electromagnetic Stirring. Metal. Mater. Trans. B 2024, 55, 5052–5067. [Google Scholar] [CrossRef]
  27. Song, X.; Cheng, S.; Cheng, Z. Numerical computation for metallurgical behavior of primary inclusion in compact strip production mold. ISIJ Int. 2012, 52, 1824–1831. [Google Scholar] [CrossRef]
  28. Li, X.; Zhang, Z.; Lv, M.; Fang, M.; Liu, K. Numerical simulation of the fluid flow, heat transfer, and solidification in ultrahigh speed continuous casting billet mold. Steel Res. Int. 2022, 93, 2100673. [Google Scholar] [CrossRef]
  29. Petrus, B.; Zheng, K.; Zhou, X.; Thomas, B.G.; Bentsman, J. Real time, model-based spray-cooling control system for steel continuous casting. Metal. Mater. Trans. B 2011, 42, 87–103. [Google Scholar] [CrossRef]
  30. Xu, L.; Pei, Q.; Han, Z.; Yang, S.; Wang, J.; Yao, Y. Modeling study on melt flow, heat transfer, and inclusion motion in the funnel-shaped molds for two thin-slab casters. Processes 2022, 10, 2738. [Google Scholar] [CrossRef]
  31. Lu, H.; Zhong, Y.; Ren, W.; Ren, Z.; Lei, Z. Effect of Electromagnetic brake on transient asymmetric flow, solidification, and inclusion transport in a slab continuous casting. Steel Res. Int. 2022, 93, 2200518. [Google Scholar] [CrossRef]
  32. Suzuki, M.; Suzuki, M.; Yu, C.; EMI, T. ln-situ measurement of fracture strength of solidifying to predict upper limit of casting speed in continuous oscillating mold. ISIJ Int. 1997, 37, 375–382. [Google Scholar] [CrossRef]
Figure 1. Geometry model of mold with EMBr device.
Processes 13 01427 g001
Figure 2. (a) Geometry structure of fluid model; (b) mesh of fluid model.
Processes 13 01427 g002
Figure 3. Comparison of distribution of magnetic flux density along vertical centerline of mold [20].
Processes 13 01427 g003
Figure 4. (a) Actual device in physical experiment; (b) comparison between flow fields in mold in physical experiment and numerical simulation.
Processes 13 01427 g004
Figure 5. Typical distribution of magnetic flux density in thin slab mold with an MMF of 36,000 a·n.
Processes 13 01427 g005
Figure 6. Distribution of magnetic flux density at different MMF values: (a) along height direction; (b) along horizontal direction.
Processes 13 01427 g006
Figure 7. (a) Induced current produced by the jets under the effect of EMBr; (b) Lorentz force produced by the jets under the effect of EMBr.
Processes 13 01427 g007
Figure 8. Comparison of metallurgical behavior of liquid steel in molds with thicknesses of 74 mm and 87 mm: (a) velocity contour; (b) velocity streamline; (c) temperature contour; (d) turbulence kinetic energy contour.
Processes 13 01427 g008
Figure 9. Effect of mold thickness on the velocity (a), temperature (b), and turbulence kinetic energy (c) distribution near the mold narrow face.
Processes 13 01427 g009
Figure 10. Effect of mold thickness on the velocity (a), temperature (b), and turbulence kinetic energy (c) distribution near the meniscus.
Processes 13 01427 g010
Figure 11. Thickness distribution of solidified shell along broad face direction at mold exit under different thicknesses of mold.
Processes 13 01427 g011
Figure 12. Effect of electromagnetic intensity on metallurgical behavior of liquid steel in mold: (a) velocity streamline and contour; (b) temperature and turbulence kinetic energy contour.
Processes 13 01427 g012
Figure 13. Metallurgical behavior of liquid steel near narrow faces in molds with different electromagnetic intensity: (a) velocity; (b) temperature; (c) turbulence kinetic energy.
Processes 13 01427 g013
Figure 14. Metallurgical behavior of liquid steel at meniscus in molds with different electromagnetic intensity: (a) velocity; (b) temperature; (c) turbulence kinetic energy.
Processes 13 01427 g014
Figure 15. Thickness distribution of solidified shell along broad face direction at mold exit under different electromagnetic intensity.
Processes 13 01427 g015
Figure 16. Effect of casting speed on metallurgical behavior of liquid steel in mold: (a) velocity streamline and contour; (b) temperature and turbulence kinetic energy contour.
Processes 13 01427 g016
Figure 17. Metallurgical behavior of liquid steel near narrow faces in molds with different casting speed: (a) velocity; (b) temperature; (c) turbulence kinetic energy.
Processes 13 01427 g017
Figure 18. Metallurgical behavior of liquid steel at meniscus in molds with different casting speed: (a) velocity; (b) temperature; (c) turbulence kinetic energy.
Processes 13 01427 g018
Figure 19. Thickness distribution of solidified shell along broad face direction at mold exit under different casting speed.
Processes 13 01427 g019
Table 1. Main parameters for calculation of electromagnetic field.
ParameterValueParameterValue
Height of iron core/mm100Relative permeability of mold 1
Relative permeability of air1Conductivity of mold (s/m)5.81 × 107
Conductivity of air (s/m)0Relative permeability of liquid steel1
Relative permeability of iron core4000Conductivity of liquid steel (s/m)7.14 × 105
Conductivity of iron core (s/m)2 × 106Relative permeability of coil1
Magnetomotive force (a·n)19,000, 36,000, 54,000Conductivity of coil (s/m)5.81 × 107
In this paper, the magnetomotive force (MMF) is adopted to represent the current intensity, which is equal to the product of the number of coil turns and the current intensity.
Table 2. Main process parameters and physical parameters of liquid steel used in the calculation of fluid.
ParameterValueParameterValue
Submerged depth of SEN/mm175Density (kg/m3)7020
Superheat/K25Viscosity (Pa·s)0.0062
Casting speed (m/min)4.0, 4.5, 5.0, 5.5Specific heat (J/kg)720
Liquidus temperature/K1803solidification latent heat (J/(kg·K))275,000
Solidus temperature/K1763Thermal conductivity (W/(m·K))31
Standard state enthalpy (J/kg mol)−2,649,000Conductivity (S/m)7.14 × 105
Inlet temperature (K)1828Magnetic permeability (H/m)1.257 × 10−6
Table 3. Characteristic parameters of solidified shell at mold exit under different electromagnetic intensity.
Bmax/TThickness Range/mmAverage Thickness/mmNon-Uniformity CoefficientStandard Deviation
0 T11.76~14.6912.8422.85%1.17
0.1 T11.76~14.6912.8422.84%1.17
0.2 T11.79~14.6612.8322.34%1.10
0.3 T11.97~14.2412.6117.94%0.71
Table 4. Characteristic parameters of solidified shell at mold exit under different casting speed.
Casting Speed (m·min−1)Thickness Range/mmAverage Thickness/mmNon-Uniformity CoefficientStandard Deviation
4.012.34~15.4914.2422.13%1.21
4.511.79~14.6612.8322.34%1.10
5.011.65~12.4611.966.78%0.30
5.510.92~11.9611.628.89%0.32
Disclaimer/Publisher’s Note: The statements, opinions and data contained in all publications are solely those of the individual author(s) and contributor(s) and not of MDPI and/or the editor(s). MDPI and/or the editor(s) disclaim responsibility for any injury to people or property resulting from any ideas, methods, instructions or products referred to in the content.

