Abstract
Due to the widespread utilization of biodegradable plastics (such as polylactic acid (PLA) and polybutylene adipate terephthalate (PBAT)) as alternatives to traditional plastics such as PE and PP, the disposal of the end-of-use biodegradable plastic products mixed with other waste has increasingly become an issue. This study investigated the co-pyrolysis characteristics, kinetic features, product formation, and synergistic effects of common biodegradable plastics (PLA and PBAT) and kitchen waste (KW) at different mass ratios, using TGA-FTIR-GC/MS. The findings revealed that the addition of KW significantly lowered the pyrolysis temperature. For the PLA and KW with a 2:1 mass ratio, the activation energy decreased by approximately 35 kJ/mol compared to PLA pyrolysis alone. The production of lactide increases significantly, while the formation of aldehydes and CO decreases. Moreover, the co-pyrolysis of KW and PBAT reduces the formation of harmful substances such as tetrahydrofuran and cyclopentanone. This study provides valuable insights into the pyrolysis process of mixed biodegradable plastic waste, offering a better approach for the disposal of similar forms of waste and resource recovery scenarios.
1. Introduction
In recent years, plastic pollution has significantly increased, posing serious risks to the environment, human health, and wildlife [1,2]. The global annual production of plastic waste is expected to rise from 260 million tons in 2016 to 460 million tons by 2030 [3], further exacerbating pollution and health threats [2]. In response, governments and international organizations have implemented measures like plastic bans, taxes, and the promotion of alternatives such as biodegradable plastics (BPs) [4,5]. BP adoption has grown rapidly, particularly in regions like Europe and China [6,7], with global production increasing from 2 million tons in 2018 to 2.62 million tons in 2023 [8]. Polylactic acid (PLA) and polybutylene adipate terephthalate (PBAT) are the main types of bioplastics, together accounting for 81% of China’s biodegradable plastic production in 2020. Due to their favorable degradation and mechanical properties, they are widely used in packaging, textiles, and agriculture, with biodegradable plastic bags and food containers comprising about 77% of these applications [9,10]. However, the growing adoption of biodegradable plastics presents significant waste management challenges. Inadequate infrastructure and misaligned disposal systems lead to leakage into ecosystems, and in China, most discarded BPs are incinerated or landfilled with household waste, causing resource wastage and high greenhouse gas emissions [11,12]. While chemical recycling offers a promising solution to reduce carbon emissions and recover resources, its development and practical applications remain limited, requiring further research.
As economic development progresses, urban household waste generation has increased, with KW accounting for 40% to 60% of urban solid waste. In China, approximately 1.95 million tons of food are wasted annually, most of which is disposed of via composting and anaerobic digestion [13]. The widespread use of biodegradable plastics in food packaging has led to their frequent mixing with KW during post-consumer waste processing. The degradation period of biodegradable plastics is typically longer than the retention time of digestate in composting or fermentation processes [14], which may interfere with normal processing conditions [15]. Additionally, degradation releases harmful substances like microplastics and plasticizers, which may affect functional bacteria and the quality of fermentation products [16]. Therefore, it is essential to screen out discarded biodegradable plastics and other contaminants during pretreatment [13]. However, the flexible nature of biodegradable plastics causes them to adhere to food residues during screening, making separation difficult. This creates a challenge for waste management, as most mixed residues are sent to municipal incineration plants, leading to high chemical use and greenhouse gas emissions [17]. The implementation of stricter waste disposal regulations worldwide underscores the urgent need for research on resource recovery and the treatment of mixed waste, including biodegradable plastics and KW.
Pyrolysis offers a rapid and efficient method for disposing of mixed solid waste while recovering valuable products such as oils, gasses, and carbon [18]. This makes it a promising approach for the resource recovery of biodegradable plastic waste. Existing studies have focused on the individual pyrolysis of PLA, PBAT, and KW. Saeaung et al. found that PLA pyrolysis yields liquid wax and oil rich in lactic acid, lactide, and propionic acid [19]. Dong et al. reported that rapid pyrolysis of PBAT primarily produces acids, esters, and aromatic compounds [20]. Kim et al. reported that pyrolysis of PLA/PBAT composite films under nitrogen primarily generates adipate and phthalate esters, alongside phenyl compounds, acids, cyclic dimers, and polycyclic compounds [21]. KW pyrolysis also releases a broad spectrum of volatiles, including alkanes, alkenes, alcohols, phenols, ketones, esters, amines, and nitriles [22]. However, limited research has explored the co-pyrolysis of biodegradable plastics with biomass waste like KW. The effects of co-pyrolyzing different organic solid wastes on pyrolysis characteristics, re-action kinetics, and product distribution remain largely unknown. Huang et al. observed that co-pyrolyzing of PLA with sugarcane bagasse significantly lowers the mass loss temperature (with a 20% bagasse blend showing an average activation energy of 121 kJ/mol) [23]. Nardella et al. found that adding plastics to lignocellulosic biomass pyrolysis decreased the oxygenated compound content in the resulting pyrolysis oil [24]. Given these gaps, further investigation into the co-pyrolysis behavior of biodegradable plastics and KW is essential to assess the viability of pyrolysis-based waste treatment strategies.
TGA-FTIR-GC/MS is an integrated analytical system that combines thermogravimetric analysis, in situ infrared spectroscopy, gas chromatography, mass spectrometry, and real-time monitoring, offering advanced analytical capabilities. It can explore the complex pyrolysis behaviors, reaction kinetics, thermodynamics, and product evolution during pyrolysis. Sufficient research has been conducted on related pyrolysis processes [25]. Chen et al. studied the impact of the ZSM-5 catalyst on the pyrolysis characteristics of kitchen and tire waste using TG-FTIR and Py-GC/MS. The average mass loss rate of the mixture was significantly higher than that of individual pyrolysis processes. Co-pyrolysis enhanced reaction activity and showed synergistic effects on pyrolysis kinetics and product formation. Moreover, co-pyrolysis increased the production of volatile compounds and improved hydrocarbon selectivity, facilitating the subsequent purification of high-value chemicals [26]. Yousef et al. employed TGA-FTIR-GC/MS to analyze the pyrolysis of end-of-life ultrafiltration polymer nanocomposite membranes. They studied the effects of carbon nanotubes (CNTs) and graphene (GNs) in the nanocomposite on the pyrolysis characteristics of polysulfone (PES) membranes, the produced volatile compounds, and the kinetics. The study found that the pyrolysis volatiles primarily included sulfur dioxide, benzene, phenol, and biphenyl. Kinetic results indicated that the presence of nanocomposites reduced the overall activation energy, and the nanocomposites acted as self-catalysts, making end-of-life polymer membranes a potential new source of renewable energy [27]. Given the current lack of research on the pyrolysis of biodegradable plastics, KW, and their mixtures, the TGA-FTIR-GC/MS system offers an excellent analytical solution for pyrolysis studies.
This study investigated the influence of co-pyrolysis of biodegradable plastics PLA and PBAT and KW on the pyrolysis characteristics, reaction kinetic features, and product formation by employing the TGA-FTIR-GC/MS system. Both separation and online modes were employed to monitor the formation of high-value products during pyrolysis. The research further explores the synergistic effects of material ratios on pyrolysis kinetics and the conversion of high-value products. This work provides valuable guidance for optimizing co-pyrolysis parameters, enhancing pyrolysis efficiency, and improving the conversion of high-value products. Furthermore, it offers critical insights into the pyrolysis and resource recovery of waste biodegradable plastics and other waste materials, contributing to the development of sustainable waste management strategies.
This paper is organized as follows. Section 2 describes the experimental design, sample preparation procedures, and kinetic analysis methods. Section 3 presents and discusses the pyrolysis characteristics, reaction kinetics, and product distributions. Finally, Section 4 summarizes the key conclusions and highlights the implications of these findings for the co-pyrolysis of biodegradable plastics and kitchen waste within a sustainable waste-management framework.
2. Materials and Methods
2.1. Experimental Design and Sample Preparation
This study aimed to investigate the characteristics and product formation from the co-pyrolysis of biodegradable plastics (PLA, PBAT) and KW. Baseline data were obtained by analyzing the pyrolysis of individual material samples (KW, PLA, PBAT) using TGA-FTIR-GC/MS. To maintain a focused experimental matrix and capture the extremes of dilution and synergy, we selected two contrasting kitchen waste-to-plastic ratios (1:2 and 2:1) and also conducted standalone pyrolysis of kitchen waste and each biodegradable plastic. This concise design provided clear insights into their interaction effects. The specific experimental design is detailed in Table 1.

Table 1.
Sample mass ratio and naming rules for experimental co-pyrolysis of KW and bioplastics.
PLA and PBAT were purchased from McKinley Reagents. The PLA feedstock had a nominal particle size of 3 mm and a weight-average molecular weight (Mw) of approximately 80,000 Da. The PBAT was supplied with a number-average molecular weight (Mn) of approximately 120,000 Da. Prior to the experiment, the biodegradable plastics were immersed in liquid nitrogen for at least 40 min to induce brittleness, then ground using a Retsch MM400 ball mill at 30 Hz for 10 min. The crushed plastics were sieved through a 50-mesh screen, and the collected material was stored in a sealed bag. To minimize interference and ensure consistent KW composition, relevant literature [28] and practical observations were reviewed. The KW model compound was determined to consist of 30% starch, 30% protein, and 10% lipid. The starch (CAS No. 9005-25-8; product No. S818265) and protein (CAS No. 9010-10-0; product No. S832685) reagents were obtained from McKinley Reagents. The lipid model compound, stearic acid (CAS No. 112-80-1; product No. BD239605), was sourced from Bidder Pharmaceuticals. Following mass ratio measurements, the KW model compound was uniformly ground in an agate mortar, transferred to a sealed bag, and stored at room temperature in a dry environment for subsequent use.
2.2. Analytical Methods
The pyrolysis experiments were performed on a TGA-FTIR/GC–MS system (TGA 8000 thermogravimetric analyzer coupled to a Spotlight 200i FTIR microscope and a Clarus 690 GC with SQ8T mass spectrometer: PerkinElmer, Waltham, MA, USA). TG/DTG analysis was performed on both individual and mixed samples using the TGA8000 analyzer. A schematic diagram of the analyzer is provided in the Supplementary Information (Figure S1). Pyrolysis was conducted at atmospheric pressure, with a temperature range of 40 °C to 800 °C. Heating rates of 10 °C/min, 20 °C/min, 30 °C/min, and 40 °C/min were studied. To prevent air interference during pyrolysis, pure nitrogen was used as the carrier gas at a flow rate of 20 mL/min. Mass loss and temperature were recorded during pyrolysis. After the experiment, the samples were carefully removed once the instrument temperature cooled to room temperature. The pyrolysis weight loss data were used to analyze the thermal degradation characteristics and apparent activation energy.
The FTIR spectrometer and GCMS were connected to the TGA system. Approximately 8–12 mg of the sample was weighed, placed in an alumina crucible, and heated to 800 °C at 30 °C/min under a nitrogen atmosphere. FTIR spectrum scanning was conducted within the wavelength range of 4000–450 cm−1. The transfer line temperature between the FTIR spectrometer and GCMS was set to 260 °C to prevent the condensation of volatiles, enabling analysis of pyrolysis product composition. In online mode, the mass spectrometer (MS) began collecting data one minute after TG was triggered, with the m/z scan range set from 10 to 350. In separation mode, the TGA-compatible software method was used to isolate and detect volatiles within 10 °C of the maximum thermal mass loss temperature. This temperature range corresponds to the highest volume and variety of volatiles produced during pyrolysis. Pyrolysis volatiles were separated using an Elite-5MS chromatographic column (30 m × 0.25 mm × 0.25 μm). The column oven was held at 50 °C for 1 min, then heated at 15 °C/min to 280 °C, where it was held for 5 min to separate pyrolysis volatiles before entering mass spectrometric analysis. Product identification was performed using Turbo Mass software’s built-in purity analysis (purity > 60%) and matching with the NIST spectrum library (R. Match factor > 700).
2.3. Kinetic Analytical Methods
Kinetic analysis was performed to further investigate the pyrolysis characteristics and reaction kinetics of individual biodegradable plastic samples and their mixtures in different proportions. To achieve a robust and comprehensive evaluation—and to cross-validate activation energies while mitigating model-specific biases—we employed three complementary kinetic models (DAEM, Starink, and FWO). This analysis involves three key elements: activation energy (E), pre-exponential factor (A), and the reaction model function () [29]. The equations for these elements are as follows.
The following equations represent the reaction kinetics based on the Arrhenius equation.
Here, () represents the reaction model function, k is the decomposition rate constant, and is the conversion rate, with its calculation formula given as follows:
W0 is the initial sample mass (g), W is the remaining mass after pyrolysis (g), and W is the sample mass (g). k is defined as
where A is the pre-exponential factor (1/s), R is the gas constant (8.314 J·K−1·mol−1), and E is the activation energy (kJ·mol−1). Since the heating rate is constant, the temperature–time relationship is as follows:
In this expression, (°C/min) denotes the heating rate, defined as the rate of temperature change over time, where ‘T’ is temperature and ‘t’ is time.
Therefore, Equation (1) can be rewritten as
P(x) represents the temperature integral:
E and A vary with temperature. Typically, the pyrolysis of plastics, biomass, and other materials is considered a primary reaction [30].
2.3.1. Distributed Activation Energy Model (DAEM)
DAEM is a commonly used kinetic analysis method for the pyrolysis of fossil fuels and biomass. The conversion rate of volatiles during pyrolysis is given by the following equation:
Here, (E) is the distribution of activation energy:
Estimating the activation energy and pre-exponential factor simultaneously is challenging. In 1998, Miura and Maki proposed a method to predict kinetic parameters using experimental data obtained at three different heating rates [31]. Therefore, Equation (9) can be simplified as
where Es is consistent with E at a given temperature of . Hence, Equation (11) can be converted as follows:
2.3.2. Flynn–Wall–Ozawa (FWO) Method
The FWO method is a quantitative transformation technique for non-isothermal experimental analysis. By integrating Equations (5) and (6) and taking the natural logarithm, the following equation is obtained:
Here, G(α) is the constant within the range 2ln(E/RT) for a given conversion rate. Since P(x) has no exact solution in this method, it can be estimated as follows:
Based on Equations (13) and (14), the following equation can also be estimated:
Since G(α) is constant for a given α, lnβ exhibits a linear relationship with 1/T, allowing the activation energy to be calculated from the slope.
2.3.3. Starink Method
The Starink method is commonly used to calculate the temperature integral precisely, using the KAS and FWO methods [32] to determine the activation energy.
Equation (13) can be simplified as follows:
where Cs, B, and Cs are constants.
When the temperature integral results are accurate and consistent, the equation is as follows:
At a constant conversion rate, plot a straight line with as the vertical axis and as the horizontal axis to determine the activation energy from the slope.
3. Results and Discussion
3.1. Thermogravimetric Analysis of Biodegradable Plastics and KW
Figure 1 and Figure 2 show the thermogravimetric (TG) and derivative thermogravimetric (DTG) analysis results for two types of biodegradable plastics and the KW model compound, both individually and mixed in varying mass ratios, at heating rates of 10 °C/min, 20 °C/min, 30 °C/min, and 40 °C/min. Figure 1a and Figure 2a display the TG and DTG curves for KW. KW displays three distinct pyrolysis temperature zones. Below 150 °C, weight loss is mainly due to moisture evaporation and the degradation of volatile components [33]. The primary pyrolysis temperature range is between 150 °C and 530 °C, with the peak weight loss rate around 0.90%/°C. After pyrolysis, the weight loss is approximately 85.6%. Studies have shown that the pyrolysis temperature range of KW and biodegradable plastic mixtures at different ratios also falls within this range. During this interval, decomposition of major volatile components such as starch and proteins likely occurs [22]. Figure 1b,c display the TG curves of PLA and PBAT. The primary pyrolysis range for PLA is between 290 °C and 440 °C, with nearly zero residual mass. For PBAT, the primary pyrolysis range spans 230 °C to 600 °C, with an ash residue of approximately 4.78% after pyrolysis. As the heating rate increases from 10 °C/min to 40 °C/min, the TG and DTG curves shift to higher temperatures, and the maximum weight loss rates for BP and KW decrease. This phenomenon is likely caused by “thermal lag” [34]. As the heating rate increases, the temperature gradient between the sample’s interior and exterior enlarges, causing internal reactions to lag behind external ones, resulting in decreased reaction efficiency [35].
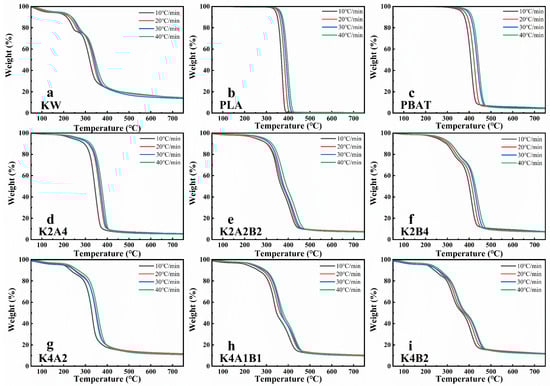
Figure 1.
TGA analysis of single and mixed samples of KW and biodegradable plastics (PLA, PBAT) at different heating rates (10 °C/min, 20 °C/min, 30 °C/min, and 40 °C/min): (a) KW, (b) PLA, (c) PBAT, (d) K2A4, (e) K2A2B2, (f) K2B4, (g) K4A2, (h) K4A1B1, (i) K4B2.
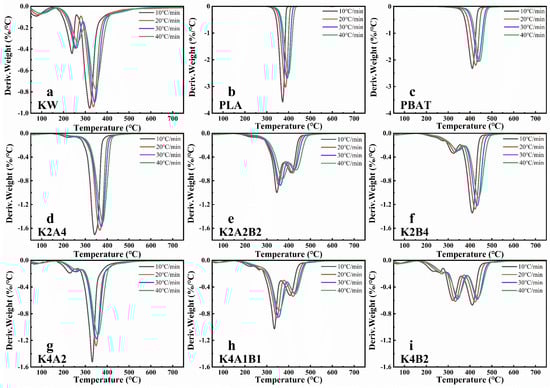
Figure 2.
DTG analysis of single and mixed samples of KW and biodegradable plastics (PLA, PBAT) at different heating rates (10 °C/min, 20 °C/min, 30 °C/min, and 40 °C/min): (a) KW, (b) PLA, (c) PBAT, (d) K2A4, (e) K2A2B2, (f) K2B4, (g) K4A2, (h) K4A1B1, (i) K4B2.
In the pyrolysis study of BP and KW mixtures at different mass ratios, the pyrolysis characteristics vary with the component proportions. Overall, as the proportion of KW increases, the pyrolysis temperature range broadens, the temperature at the maximum weight loss rate decreases, and the residual mass increases (Figure 1d–i and Figure 2d–i). For comparison, the relevant values are presented at a heating rate of 30 °C/min. In the co-pyrolysis of PLA and KW, as the KW proportion increases from 1/3 (Figure 1d) to 2/3 (Figure 1g), the temperature at the maximum weight loss peak decreases from 368.02 °C to 350.76 °C, and the maximum weight loss rate decreases from 1.31%/°C to 1.18%/°C. Increasing the proportion of kitchen waste (KW) in the co-pyrolysis blend introduces thermally labile components—lipids, carbohydrates, and proteins—that decompose at relatively low temperatures [36]. This leads to a broadening of the TG/DTG profiles and a shift toward lower temperature regions. The superposition of these component-specific degradation stages also increases the number of identifiable thermal decomposition intervals. As the KW/PBAT ratio rises from 1:2 (Figure 1f) to 2:1 (Figure 1i), both the onset and peak decomposition temperatures decrease, while the maximum weight-loss rate drops from 1.22% °C−1 to 0.58% °C−1 (Table S1). This trend is primarily attributed to two factors: (i) the reduced PBAT content diminishes its relative contribution to overall mass loss during pyrolysis [37] and (ii) the softened plastic forms a surface film upon heating, which acts as a physical barrier to volatile release, further suppressing the rate of mass loss [38]. Figure 1e and Figure 2e show that the TG and DTG curves for PLA and PBAT blend with KW at different ratios. As the KW ratio increases, the weight loss peak below 200 °C becomes more distinct, and the pyrolysis weight loss stage around 300 °C becomes more pronounced (Figure 2h).
During the pyrolysis of individual samples of KW, PLA, and PBAT, the pyrolysis temperature range for biodegradable plastics is narrower than that of KW, and their pyrolysis reaction rate is faster. As the heating rate increases, the TG and DTG curves shift to higher temperatures, and the maximum pyrolysis rate decreases. Co-pyrolysis exhibits a distinct “thermal lag” phenomenon. During co-pyrolysis, an increased proportion of KW resulted in a greater number of pyrolysis temperature ranges, lower TG and DTG peaks, and a marked reduction in pyrolysis temperature, thereby enhancing the energy efficiency of the process.
3.2. Kinetic Analysis of Pyrolysis of Biodegradable Plastics and KW
Figures S2–S4 show the fitting curves for different samples using three models—DAEM, Starink, and FWO—at various pyrolysis rates. The corresponding pyrolysis kinetic parameters are provided in Tables S2–S4. For most samples, the fitting curves yield an R² value greater than 0.95. The activation energy values for the three models at the same conversion rate are comparable, indicating that the results are relatively reliable.
Figure 3a shows the variation in apparent activation energy for KW at different conversion rates. In the initial stage of pyrolysis, the apparent activation energy is approximately 100 kJ/mol, mainly due to moisture evaporation. When the conversion rate (α) reaches 0.3, the apparent activation energy rises sharply to 200 kJ/mol (Figure 3a). This phenomenon may result from the formation of a lipid liquid phase on the surface of proteins and starch during co-pyrolysis, which hinders the deep pyrolysis of organic matter [39]. As more refractory components are consumed, the remaining substances may decompose more easily, leading to a decrease in activation energy. The mass residue after the pyrolysis of KW is about 15%, which significantly impacts the activation energy calculation at a conversion rate of 0.9. Therefore, only the activation energy variation for conversion rates from 0.1 to 0.8 is shown in Figure 3a. The activation energy for PLA pyrolysis decreases steadily as the conversion rate increases (Figure 3b). The activation energy decreases from approximately 180 kJ/mol to about 150 kJ/mol, with an average value of 167.14 kJ/mol. The activation energy for PBAT pyrolysis increases gradually as the conversion rate rises (Figure 3c). The activation energy increases from about 130 kJ/mol to around 150 kJ/mol, with an average of approximately 140.26 kJ/mol. The activation energy changes for PLA and PBAT are minimal.
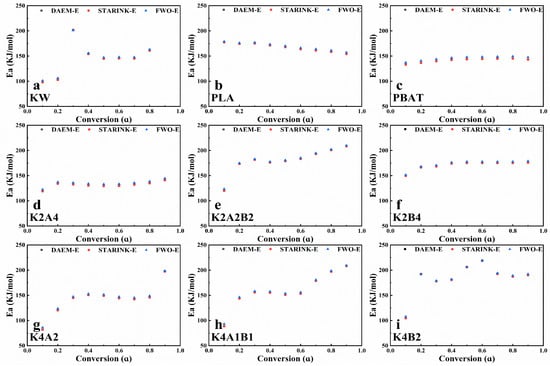
Figure 3.
The activation energy of samples pyrolysis at different conversion rates.: (a) KW, (b) PLA, (c) PBAT, (d) K2A4, (e) K2A2B2, (f) K2B4, (g) K4A2, (h) K4A1B1, (i) K4B2.
In the co-pyrolysis of KW and BP at a 1:2 ratio, the average activation energy for the pyrolysis of KW and PLA (Figure 3d) is 131.52 kJ/mol, lower than the average activation energies for PLA (167.14 kJ/mol) and KW (144.21 kJ/mol), indicating a significant synergistic effect. At this ratio, the average activation energy for the pyrolysis of KW and PBAT (170.72 kJ/mol) is higher than that for PBAT alone (140.26 kJ/mol). For mixed samples of KW with PLA and PBAT in equal mass proportions (Figure 3e), the pyrolysis activation energy increases with the conversion rate. The increase is initially rapid, then levels off. The average activation energy is 179.68 kJ/mol. Compared to the pyrolysis of KW and BP mixtures at the same ratio, a greater number of components in the mixture results in more unstable activation energy changes and a higher average activation energy.
In the co-pyrolysis of KW and BP at a 2:1 ratio, the activation energy change is more unstable (Figure 3g–i). At this ratio, during pyrolysis with PLA (Figure 3g), the activation energy is relatively low in the initial stage. As the conversion rate increases, the activation energy stabilizes, then rises rapidly to 197.62 kJ/mol at a conversion rate of 0.9. This activation energy change is similar to the phenomenon observed by Huang et al. in their study of high-ratio sugarcane bagasse and PLA co-pyrolysis. A higher proportion of biomass waste influences PLA pyrolysis, making the initial pyrolysis stage easier and the final stage more difficult [23]. During pyrolysis with PBAT (Figure 3i), the activation energy increases significantly at low conversion rates, then gradually decreases and stabilizes. The activation energy fluctuates widely, challenging the stability of equipment operation. In the co-pyrolysis of KW, PLA, and PBAT at this ratio (Figure 3h), a similar trend is observed, with activation energy fluctuating significantly between 88.61 kJ/mol and 208.45 kJ/mol.
Overall, during the co-pyrolysis of KW and biodegradable plastics, a higher proportion of biodegradable plastics results in a smaller change in activation energy. As the proportion of KW increases, the pyrolysis activation energy change shows an easier initial stage and a more difficult final stage, with larger fluctuations in activation energy. Among the samples analyzed, the K2A4 group exhibits a lower average activation energy compared to PLA and KW pyrolyzed individually, suggesting a pronounced synergistic interaction. This is important for reducing energy consumption in practical pyrolysis systems and ensuring stable operation.
3.3. TG-FTIR Analysis of Pyrolysis of Biodegradable Plastics and KW
TG-FTIR was employed to characterize and analyze the volatile gasses produced during the pyrolysis of biodegradable plastics and KW. Information on the bands of the major functional groups in the IR spectra is given in Table S5. Figure 4 presents the 3D FTIR spectrum of pyrolytic volatile products from nine sample groups in this study (Figure S5a–i). In Figure 4a, multiple absorption peaks are observed in the 3D FTIR spectrum of KW across various temperature ranges. As the proportion of biodegradable plastic in the blend increases, the absorption peaks become more concentrated within specific temperature ranges (Figure 4b–i). First, we analyze the 3D FTIR spectrum of KW (Figure S5), followed by plotting the maximum cross-sectional data of the 3D FTIR spectrum for the other samples in Figure 5 for further analysis. During pyrolysis, we also focused on common volatile gasses produced from plastics and biomass, such as CO (2176 cm−1), CH4 (3015 cm−1), CO2 (2360 cm−1), and H2O (3735 cm−1) [40]. The concentration trends of these gasses during pyrolysis were examined using a characteristic FTIR spectrum in accordance with Beer’s Law, as shown in Figure 6.
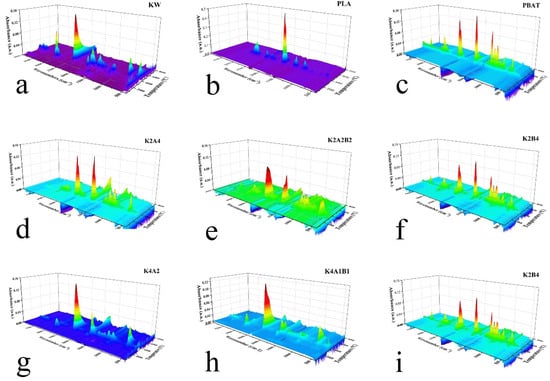
Figure 4.
Three-dimensional FTIR spectrum of samples during pyrolysis at 30 °C/min heating rate. The x-axis represents wavenumber (cm−1), the y-axis represents temperature (°C), and the z-axis represents absorbance (a.u.): (a) KW, (b) PLA, (c) PBAT, (d) K2A4, (e) K2A2B2, (f) K2B4, (g) K4A2, (h) K4A1B1, (i) K4B2.
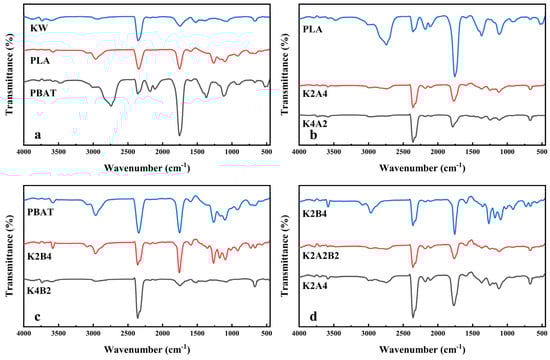
Figure 5.
FTIR spectra of samples at peak weight loss rate during pyrolysis at 30 °C/min heating rate. (a). Pyrolysis of KW, PLA, and PBAT individually; (b). Pyrolysis of PLA alone and co-pyrolysis with KW at two different ratios; (c). Pyrolysis of PBAT alone and co-pyrolysis with KW at two different ratios; (d). Co-pyrolysis of KW and biodegradable plastics at a 1:2 ratio.
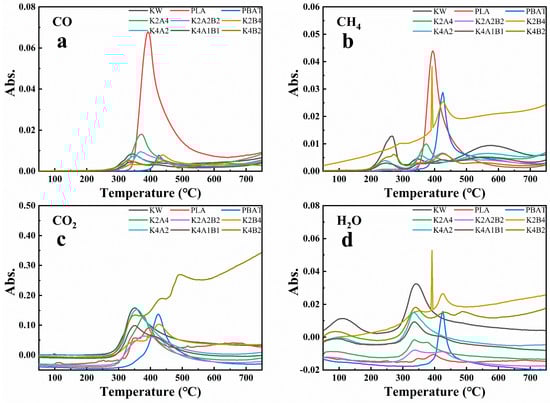
Figure 6.
Volatile gas generation during pyrolysis of samples at 30 °C/min heating rate. (a) CO, (b) CH4, (c) CO2, (d) H2O.
The pyrolysis of KW (Figure 4a) exhibits multiple absorption peaks in the 3D FTIR spectrum across various temperature ranges (Figure S5a). Below 200 °C, broad peaks are observed around 3500 cm−1~4000 cm−1 and 1500 cm−1, likely resulting from the volatilization and decomposition of oleic acid or starch, producing small molecules such as alcohols and hydrocarbons. Triglycerides undergo decarboxylation during pyrolysis, generating esters, alcohols, and hydrocarbons [41].As the temperature rises, a prominent methyl C-H stretching vibration peak appears around 2900 cm−1, accompanied by a weaker C-H bending peak near 1380 cm−1. Additionally, C=O stretching vibration peaks of acid anhydrides appear between 1750 cm−1 and 1800 cm−1, while C-O stretching vibration peaks are observed around 1100 cm−1 [42]. According to TG curve analysis, this temperature range likely corresponds to the pyrolysis of starch, where glycosidic bonds break to form monosaccharides, which further decompose or rearrange into acidic compounds [41]. In the temperature range corresponding to the maximum absorption peaks in the 3D FTIR spectrum, three absorption peaks appear between 4000 cm−1 and 3500 cm−1, with one absorption peak observed between 1600 cm−1 and 1500 cm−1. These peaks are likely attributed to the N-H stretching and bending vibrations of amine compounds generated during the pyrolysis of soy protein [42]. The asymmetric stretching vibrations at 2320 cm−1 and 2380 cm−1 are linked to CO2 [43]. Between 2300 cm−1 and 2100 cm−1, two absorption peaks are observed; one is likely HNCO (2251 cm−1), generated during the pyrolysis of soy protein isolate [44], and the other is CO (2176 cm−1), produced during the pyrolysis of starch. A small unsaturated C-H stretching vibration is observed near 3000 cm−1, and a C=C stretching vibration peak of the benzene ring appears between 1600 cm−1 and 1500 cm−1. In the fingerprint region, between 900 cm−1 and 700 cm−1, an absorption peak appears, likely corresponding to aromatic compounds generated during the pyrolysis of starch [45]. A moderate C=O stretching vibration absorption peak appears near 1740 cm−1, and multiple absorption peaks are observed between 1300 cm−1 and 1000 cm−1. These peaks may correspond to ester compounds formed during the pyrolysis of starch [46]. During the pyrolysis of KW, esters, alcohols, acids, amines, aromatic hydrocarbons, and gasses such as HNCO, CO, and CO2 are produced. The product composition closely aligns with related studies [22].
Figure 5a presents the FTIR spectrum of gasses corresponding to the maximum mass loss rate during the pyrolysis of PLA, PBAT, and KW. Biodegradable plastics exhibit prominent C=O and C-H stretching vibration absorption peaks around 1750 cm−1 and 3000 cm−1~2800 cm−1. Additionally, two absorption peaks in the range of 1300 cm−1~1000 cm−1 are attributed to C-O bonds, possibly related to the formation of aldehydes, ketones, carboxylic acids, and esters. A distinct asymmetric stretching vibration absorption peak of CO2 appears around 2350 cm−1. During the pyrolysis of PLA, a significant CO absorption peak appears at 2176 cm−1. The generation of CO is likely associated with the further decomposition of lactide, acrylic acid, and aldehydes formed during PLA pyrolysis [47]. In addition to the similar peak regions observed for PLA, the gasses produced during PBAT pyrolysis exhibit characteristic absorption peaks for aromatic compounds around 1600 cm−1 and 720 cm−1. This indicates that aromatic compounds are also produced during PBAT pyrolysis [48].
Figure 5b presents the FTIR spectrum corresponding to the maximum mass loss rate during the co-pyrolysis of PLA and KW at various proportions. As the proportion of KW increases, the C-H stretching vibration associated with aldehydes near 2740 cm−1 disappears [49], and the intensities of the CO absorption peak and C=O stretching vibration decrease significantly. As the proportion of KW increases, the C=O stretching vibration peak shifts from 1755 cm−1 to 1791 cm−1, with the latter corresponding to a characteristic carbonyl band for lactic acid or cyclic oligomers [50]. Two overlapping peaks are observed between 2400 cm−1 and 2250 cm−1. This is likely due to the increased proportion of starch and protein components in KW, which enhances the overlap of absorption peaks for CO2 (2359 cm−1) and HNCO (2251 cm−1) produced during pyrolysis [44]. Although the intensity of the C-O stretching vibration between 1300 cm−1 and 1000 cm−1 decreases, the absorption peaks become more complex in shape. This indicates that the introduction of KW leads to the formation of more oxygen-containing compounds in the pyrolysis products.
Figure 5c presents the FTIR spectrum corresponding to the maximum mass loss rate during the co-pyrolysis of PBAT and KW at various proportions. As the proportion of KW increases, the intensity of the C=O stretching vibration decreases, and the formation of ester compounds is reduced. The intensity of the CO absorption peak between 2500 cm−1 and 2020 cm−1 increases, while the intensities of absorption peaks for unsaturated C-H bonds above 3000 cm−1, around 1600 cm−1, and in the fingerprint region near 720 cm−1 decrease. This indicates a reduced contribution from PBAT decomposition and a decrease in aromatic compound formation. Figure 5d presents the FTIR spectrum of the co-pyrolysis of the KW model compounds and biodegradable plastics in a 1:2 mixture. Since the temperature corresponding to the maximum mass loss rate of KW is closer to that of PLA, the FTIR spectrum of K2A2B2 resembles that of K2B4 (Figure 5b). The spectra of the other samples have been analyzed in previous figures (Figure 5b,c).
FTIR analysis reveals that the primary components in the pyrolysis products of KW are esters, alcohols, acids, amines, aromatic hydrocarbons, and gasses such as HNCO, CO, and CO2. The pyrolysis products of PLA and PBAT are similar, mainly consisting of aldehydes, ketones, acids, and esters. Aromatic compounds are also present in the pyrolysis products of PBAT. As the proportion of KW increases, the intensities of the absorption peaks for CO2 and HNCO increase. During the co-pyrolysis of PLA and KW, the C-H stretching peak for aldehydes disappears, and the intensities of the C=O and CO absorption peaks decrease. The C=O peak shifts to 1791 cm−1, and the C-O bond absorption peaks become more complex in shape. During the co-pyrolysis of PBAT and KW, the formation of aromatic compounds decreases, and the contribution from PBAT pyrolysis diminishes.
Figure 6a shows that PLA pyrolysis produces substantial CO, likely from ester exchange reactions forming aldehydes. Further CO generation arises from the endothermic break-down of lactide, acrylic acid, and aldehydes. As illustrated in Figure 6b, PLA and PBAT pyrolysis produce relatively large amounts of CH4 gas. The production of methane during PLA pyrolysis may be associated with alkyl bond cleavage [51] and further aldehyde decomposition [52], while methane production during PBAT pyrolysis is likely related to the cleavage of C-C and C-H bonds [20]. As the proportion of KW increases in the blend, the CO content produced during pyrolysis decreases significantly. The absence of the C–H stretching vibration peak associated with aldehydes in Figure 5b suggests that co-pyrolysis of KW and PLA suppresses the ester exchange reaction, which typically leads to the formation of aldehydes and CO. The co-pyrolysis of KW and BP does not promote CH4 production (Figure 6b). CO2 production is primarily associated with the removal of carbonyl groups and the decarboxylation of carboxyl groups [53]. As shown in Figure 6c, pyrolysis of blends with a higher proportion of KW produces CO2 at a lower temperature. Since starch molecules in KW model compounds contain a large number of hydroxyl groups, they provide more precursors for dehydration reactions [51]. Figure 6d indicates that blends containing a higher fraction of KW generate greater amounts of H2O. Overall, the co-pyrolysis of KW and PLA significantly inhibits CO production, while the co-pyrolysis of KW with biodegradable plastics increases CO2 and H2O production, optimizing the pyrolysis process and reducing harmful gas emissions.
3.4. GC-MS Analysis of Biodegradable Plastics and KW Co-Pyrolysis
Infrared spectroscopy primarily reflects functional groups rather than entire compounds, making it challenging for qualitative product analysis. Therefore, coupled GC-MS is necessary for further analysis of the pyrolysis products. In this study, pyrolysis products near the maximum mass loss rate were initially analyzed using a separation mode, with product identification based on reliable NIST spectral library data (purity > 60%, R. Match factor > 700), as shown in Figure 7, Figure 8 and Figure 9. Additionally, spectra obtained in online mode were analyzed, and detailed information about high-value products was plotted using characteristic m/z values, as shown in Figure 9.
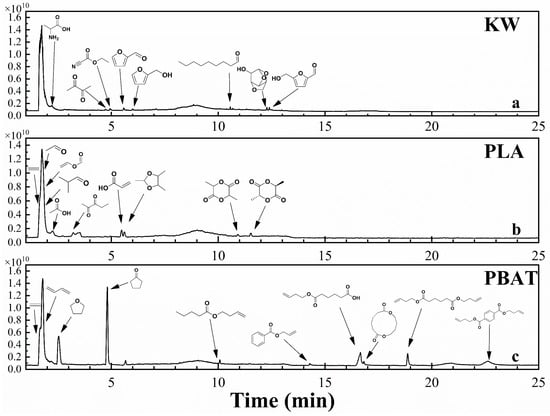
Figure 7.
TIC of gas chromatography–mass spectrometry at peak pyrolysis weight loss of KW model compounds and bioplastics (PLA and PBAT).
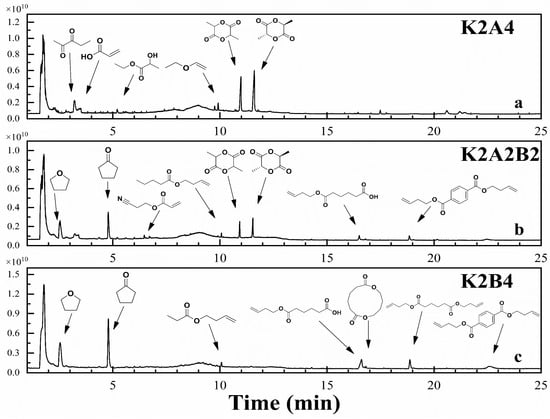
Figure 8.
TIC of gas chromatography–mass spectrometry at peak pyrolysis weight loss at a 1:2 ratio of KW/bioplastics.
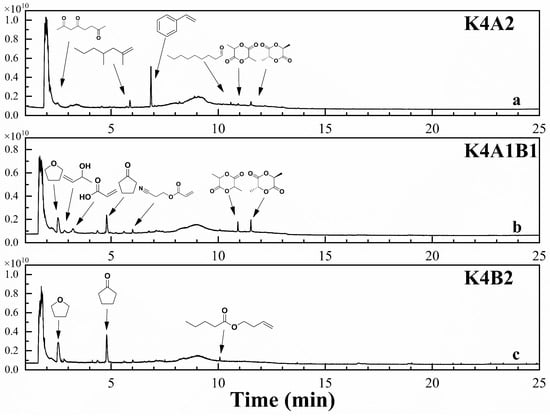
Figure 9.
TIC of gas chromatography–mass spectrometry at peak pyrolysis weight loss at a 2:1 ratio of KW/bioplastics.
Figure 7 presents the pyrolytic volatile TIC of KW, PLA, and PBAT near the maximum mass loss rate, along with reliable product identification results, consistent with FTIR analysis. As illustrated in Figure 7a, the pyrolysis products of KW include numerous carbonyl compounds (aldehydes, acids) and oxygen-containing cyclic compounds (such as furan and dehydration sugar derivatives), as well as alcohols and acids. The primary components at the maximum mass loss point of KW pyrolysis are starch and protein. Starch pyrolysis primarily involves glycosidic bond cleavage, dehydration, ring opening, and rearrangement [41]. Due to the high nitrogen content in proteins, several nitrogen-containing compounds co-elute in the first chromatographic peak. These compounds are not labeled because of their low matching factors. During PLA pyrolysis, ester exchange, free radical, and cis-elimination reactions primarily occur [52]. In the ester exchange reaction, C-O bond cleavage generates D, L-lactide and possible oligomers (Figure 7b), accompanied by cis-elimination reactions. The C-O bond at the end of the PLA molecular chain breaks, forming acrylic acid, which absorbs heat and decomposes into acetaldehyde and CO. Acetaldehyde may absorb more energy, causing C-C bond cleavage and generating CO and methane [47]. The pyrolysis products of PBAT primarily include acids, esters, ketones, and aromatic compounds (Figure 6c). The pyrolysis process involves the decomposition of individual homopolymers, PBT and PBA, resulting in the formation of butene-1,6-dicarboxylate and butene-terephthalate. Through α-chain cleavage of the ester bond and hydrogen transfer reactions, further cleavage produces isoprene acetate, pentanoic acid, 3-butene ester, but-3-en-1-ylbenzoate, and smaller compounds such as ethylene [20]. The generated fragments undergo further cyclization, yielding tetrahydrofuran, cyclopentanone, and 1,6-dioxaspiro[4.5]decane-7,12-dione, among others (Figure 7c).
As the proportion of KW increases, the TIC plot shows more small chromatographic peaks, a wider variety of pyrolysis products, and significant background ion interference, which affects the purity analysis of peaks and the NIST spectral library search. Figure 8 presents the TIC of the pyrolysis products from KW and biodegradable plastics blended in a 1:2 mass ratio, along with reliable product identification results. The search results show that at this ratio, co-pyrolysis of KW and PLA significantly increases lactide production (Figure 8a), particularly meso-lactide. Meso-lactide is a specific product of free radical reactions during PLA pyrolysis [54]. Combining kinetic and FTIR analyses, we observe that co-pyrolysis at this ratio lowers the activation energy and reduces the formation of acetaldehyde and CO. It is hypothesized that adding KW promotes free radical reactions, reducing activation energy, decreasing the decomposition of lactide into acetaldehyde and CO, and leading to the production of more valuable chemicals, such as lactide [52]. Figure 9 presents the TIC of the pyrolysis products from KW and biodegradable plastics blended in a 2:1 mass ratio, along with reliable product identification results. The chromatographic peak area of lactide nearly disappears, but a relatively large styrene peak appears at 6.9 min (Figure 9a). This is likely due to the nitrogen-containing groups in the soy protein components of KW breaking down during pyrolysis, forming styrene. Styrene is a carcinogenic substance harmful to human health. Its formation is inhibited in the pyrolysis of high-ratio PLA mixtures. In the co-pyrolysis products of KW and PBAT, the chromatographic peak areas of tetrahydrofuran and cyclopentanone decrease (Figure 7c, Figure 8c and Figure 9c). These two chemicals are highly toxic, and their formation can be effectively reduced through co-pyrolysis, thereby lowering potential environmental risks during the pyrolysis process.
The chromatographic peak search identified acetaldehyde, acrylic acid, styrene, lactide, tetrahydrofuran, cyclopentanone, bis (Butenyl) adipate, and terephthalic acid di(but-3-enyl) ester as the main pyrolysis products with relatively high content [55,56,57]. Acrylic acid, lactide, bis (Butenyl) adipate, and terephthalic acid di(but-3-enyl) ester are important raw materials or intermediates in various chemical and manufacturing processes across industries. However, styrene and cyclopentanone are highly toxic, making the investigation of their formation during co-pyrolysis valuable for research [19]. The separation mode can only capture chromatographic peaks within a short time range, limiting its ability to explore chemical formation during the reaction. Therefore, combining it with the online mode enables more comprehensive monitoring of dynamic changes in the pyrolysis products, providing insights for evaluating resource recovery potential. A NIST spectral library search for the separation mode and analysis of online mode spectra yielded mass spectrometry data, identifying the six studied products and their characteristic m/z values: acrylic acid (m/z 72), styrene (m/z 104), lactide (m/z 144), cyclopentanone (m/z 84), bis (Butenyl) adipate (m/z 183), and terephthalic acid di(but-3-enyl) ester (m/z 203). The corresponding m/z data from the online mode were then retrieved to create Figure 10.
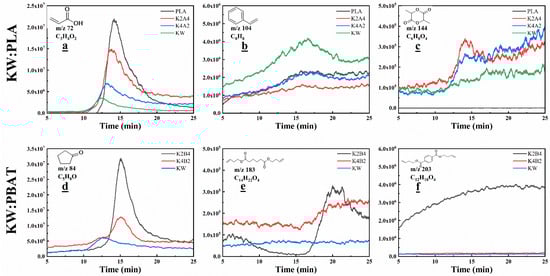
Figure 10.
Mass spectrometry of high-value chemicals generated during co-pyrolysis of KW and bioplastics at different ratios: (a) acrylic acid, (b) styrene, (c) lactide, (d) cyclopentanone, (e) bis (Butenyl) adipate, (f) terephthalic acid di(but-3-enyl) ester.
Figure 10a–c show the formation of three products—acrylic acid, styrene, and lactide—during the co-pyrolysis of KW and PLA at different ratios. The formation of acrylic acid is associated with the C-O bond cleavage in PLA chain segments. Figure 10a demonstrates that a greater proportion of PLA in the blend results in an increased yield of acrylic acid during pyrolysis. The generation of styrene may be due to the cleavage of nitrogen-containing groups in the soy protein components. By combining Figure 9a and Figure 10b, we observe that a higher proportion of PLA in the blend with KW reduces styrene formation. Figure 10c, along with separation mode results in Figure 8a, indicate that the co-pyrolysis of PLA with a small fraction of KW (K2A4) enhanced lactide generation, despite the possibility of similar m/z molecular fragments originating from KW. Figure 10d–f show the formation of three products—cyclopentanone, bis (Butenyl) adipate, and terephthalic acid di (but-3-enyl) ester—during the co-pyrolysis of KW and PBAT at different ratios. Due to the high volatility during PBAT pyrolysis and intermittent vacuum pump suction under negative pressure, the TIC plot exhibits a regular wave-like pattern, interfering with the monitoring of product formation. Therefore, the PBAT pyrolysis products are not shown in Figure 10d–f. Cyclopentanone, bis (Butenyl) adipate, and terephthalic acid di(but-3-enyl) ester are characteristic products of PBAT pyrolysis. The increased formation of these products with higher PBAT contents highlights the importance of robust separation and purification steps to support environmentally sustainable and resource-efficient waste treatment.
4. Conclusions
This study explored the co-pyrolysis of biodegradable plastics (PLA, PBAT) and KW, utilizing TGA-FTIR-GC/MS at various mass ratios. The findings indicated that co-pyrolysis reduces the temperature required for the primary reactions, highlighting the beneficial synergistic effect. This effect, facilitated by the promotion of PLA free radical reactions, resulted in a significant reduction in average activation energy (131.52 kJ/mol) for the co-pyrolysis of PLA and KW at a 2:1 mass ratio, compared to individual pyrolysis. Moreover, the reduced variation in activation energy contributed to lower energy consumption and enhanced equipment stability.
As the proportion of PLA increases in the co-pyrolysis mixture, harmful by-products like aldehydes, carbon monoxide, and styrene are significantly reduced, and the yield of valuable chemicals such as lactide is promoted. Additionally, the co-pyrolysis of PBAT with KW mitigated the formation of toxic compounds such as tetrahydrofuran and cyclopentanone. Overall, the co-pyrolysis of biodegradable plastics in high proportions with KW demonstrated a favorable synergistic effect, leading to reduced energy consumption, stable operational conditions, and enhanced resource recovery. Therefore, in the actual waste control process, KW and biodegradable plastic blends can be resourced through pyrolysis, thus reducing problems such as pollutant leakage and carbon dioxide emissions during the process of environmentally sound disposal.
This study provides valuable insights into the thermal degradation behavior of a blend of kitchen waste and biodegradable plastics, informing more effective disposal practices and resource recovery strategies for similar waste. However, because this study was limited to milligram-scale TGA-FTIR-GC/MS analyses of simplified model mixtures, the results offer only preliminary insights and provide limited guidance for practical, large-scale applications. Future work should employ real heterogeneous kitchen waste and scale up to pilot- or industrial-scale reactors—such as tubular furnaces and fixed-bed systems—while also considering downstream process factors (e.g., residence time, heat recovery, and reactor design) to fully evaluate co-pyrolysis performance and resource-recovery potential.
Supplementary Materials
The following supporting information can be downloaded at: https://www.mdpi.com/article/10.3390/pr13051405/s1, Table S1. Typical pyrolysis data for different stages of samples at 4 heating rates. Figure S1. Plots of DAEM curves. Figure S2. Plots of Starink model curves. Figure S3. Plots of FWO model curves. Table S2. The estimated apparent activation energy at each conversion rate of kitchen waste, PLA and PBAT. Table S3. The estimated apparent activation energies at various conversion rates for pyrolysis of biodegradable plastic to kitchen waste blends with a mass ratio of 2:1. Table S4. The estimated apparent activation energy at various conversion rates for pyrolysis of biodegradable plastic to kitchen waste blends with a mass ratio of 1:2. Table S5. Main functional groups represented in the infrared spectrum. Table S6. Separation mode of kitchen waste, PLA and PBAT pyrolysis products search results. Figure S4a. Three-dimensional FTIR spectra of kitchen waste during pyrolysis at 30 °C/min. Figure S4b. Three-dimensional FTIR spectra of PLA during pyrolysis at 30 °C/min. Figure S4c. Three-dimensional FTIR spectra of PBAT during pyrolysis at 30 °C/min. Figure S4d. Three-dimensional FTIR spectra of samples (KW/PLA = 1:2) during pyrolysis at 30 °C/min. Figure S4e. Three-dimensional FTIR spectra of samples (KW/PLA/PBAT = 1:1:1) during pyrolysis at 30 °C/min. Figure S4f. Three-dimensional FTIR spectra of samples (KW/PBAT = 1:2) during pyrolysis at 30 °C/min. Figure S4g. Three-dimensional FTIR spectra of samples (KW/PLA = 2:1) during pyrolysis at 30 °C/min. Figure S4h. Three-dimensional FTIR spectra of samples (KW/PLA/PBAT = 4:1:1) during pyrolysis at 30 °C/min. Figure S4i. Three-dimensional FTIR spectra of samples (KW/PBAT = 2:1) during pyrolysis at 30 °C/min. Figure S5. The schematic diagram of TGA8000.
Author Contributions
Conceptualization, Y.Z. and L.T.; data curation, Y.Z. and Q.L.; formal analysis, Y.Z., Q.L., and Y.L.; funding acquisition, L.T. and R.X.; investigation, Y.Z., Q.L., and Y.X.; methodology, Y.L. and Y.X.; project administration, L.T.; resources, W.Z.; software, Y.Z.; supervision, B.d.C., L.T., and M.D.; validation, Y.Z. and Y.L.; visualization, Y.Z.; writing—original draft, Y.Z. and Q.L.; writing—review and editing, Y.Z., T.W., R.X., and P.D.F. All authors have read and agreed to the published version of the manuscript.
Funding
This research was funded by the National Energy R&D Center of Petroleum Refining Technology (RIPP, SINOPEC) (Project Number: 36800000-24-ZC0699-0065); the Natural Science Foundation of Hainan Province (No. 424RC467); the National Science Foundation of China (No. 52460017); and the Hainan key R&D program (ZDYF2025SHFZ062).
Data Availability Statement
The data presented in this study are available on request from the corresponding author.
Conflicts of Interest
The authors declare that they have no known competing financial interests or personal relationships that could have appeared to influence the work reported in this paper.
References
- Borrelle, S.B.; Ringma, J.; Law, K.L.; Monnahan, C.C.; Lebreton, L.; McGivern, A.; Murphy, E.; Jambeck, J.; Leonard, G.H.; Hilleary, M.A.; et al. Predicted Growth in Plastic Waste Exceeds Efforts to Mitigate Plastic Pollution. Science 2020, 369, 1515–1518. [Google Scholar] [CrossRef] [PubMed]
- MacLeod, M.; Arp, H.P.H.; Tekman, M.B.; Jahnke, A. The Global Threat from Plastic Pollution. Science 2021, 373, 61–65. [Google Scholar] [CrossRef] [PubMed]
- Chen, S.; Hu, Y.H. Advancements and Future Directions in Waste Plastics Recycling: From Mechanical Methods to Innovative Chemical Processes. Chem. Eng. J. 2024, 493, 152727. [Google Scholar] [CrossRef]
- Buitrago, N.R.; Gracia C, A. Colombia Acts to Combat Plastic Pollution. Science 2024, 386, 389. [Google Scholar] [CrossRef]
- Simon, N.; Raubenheimer, K.; Urho, N.; Unger, S.; Azoulay, D.; Farrelly, T.; Sousa, J.; Van Asselt, H.; Carlini, G.; Sekomo, C.; et al. A Binding Global Agreement to Address the Life Cycle of Plastics. Science 2021, 373, 43–47. [Google Scholar] [CrossRef]
- Manfra, L. Biodegradable Polymers: A Real Opportunity to Solve Marine Plastic Pollution? J. Hazard. Mater. 2021, 416, 125763. [Google Scholar] [CrossRef]
- Schneiderman, D.K.; Hillmyer, M.A. 50th Anniversary Perspective: There Is a Great Future in Sustainable Polymers. Macromolecules 2017, 50, 3733–3749. [Google Scholar] [CrossRef]
- Awasthi, S.K.; Kumar, M.; Kumar, V.; Sarsaiya, S.; Anerao, P.; Ghosh, P.; Singh, L.; Liu, H.; Zhang, Z.; Awasthi, M.K. A Comprehensive Review on Recent Advancements in Biodegradation and Sustainable Management of Biopolymers. Environ. Pollut. 2022, 307, 119600. [Google Scholar] [CrossRef]
- Shao, H.; Yu, M.; Zhao, L.; Wang, P.; Meng, X.; Ren, L. Impact of Hydrothermal Pretreatment on Enhancing Anaerobic Co-Digestion of Food Waste and Biodegradable Plastics. J. Environ. Chem. Eng. 2025, 13, 115205. [Google Scholar] [CrossRef]
- Wen, Z.; Hu, Y.; Li, H. Environmental Impact Assessment of Degradable Plastics Amd Policy Support Research Project Report; Tsinghua University: Beijing, China, 2022. [Google Scholar]
- Thompson, R.C.; Courtene-Jones, W.; Boucher, J.; Pahl, S.; Raubenheimer, K.; Koelmans, A.A. Twenty Years of Microplastic Pollution Research—What Have We Learned? Science 2024, 386, eadl2746. [Google Scholar] [CrossRef]
- Huang, Y.; Han, M.; Bi, Z.; Gu, N.; Gu, D.; Hu, T.; Li, G.; Lu, J. Differentiating Low-Carbon Waste Management Strategies for Bio-Based and Biodegradable Plastics under Various Energy Decarbonization Scenarios. Waste Manag. 2025, 193, 328–338. [Google Scholar] [CrossRef]
- Wang, Z.; Wang, S.; Li, H.; Lu, Y.; Zhang, B.; Zhang, H.; Zhang, S. Synergistic Effects of Economic Benefits, Resource Conservation and Carbon Mitigation of Kitchen Waste Recycling from the Perspective of Carbon Neutrality. Resour. Conserv. Recycl. 2023, 199, 107262. [Google Scholar] [CrossRef]
- Narancic, T.; Verstichel, S.; Reddy Chaganti, S.; Morales-Gamez, L.; Kenny, S.T.; De Wilde, B.; Babu Padamati, R.; O’Connor, K.E. Biodegradable Plastic Blends Create New Possibilities for End-of-Life Management of Plastics but They Are Not a Panacea for Plastic Pollution. Environ. Sci. Technol. 2018, 52, 10441–10452. [Google Scholar] [CrossRef] [PubMed]
- Kakadellis, S.; Woods, J.; Harris, Z.M. Friend or Foe: Stakeholder Attitudes towards Biodegradable Plastic Packaging in Food Waste Anaerobic Digestion. Resour. Conserv. Recycl. 2021, 169, 105529. [Google Scholar] [CrossRef]
- Chen, Y.; Zhang, Y.; Zhang, Z. Occurrence, Effects, and Biodegradation of Plastic Additives in Sludge Anaerobic Digestion: A Review. Environ. Pollut. 2021, 287, 117568. [Google Scholar] [CrossRef]
- Chen, G.; Li, J.; Sun, Y.; Wang, Z.; Leeke, G.A.; Moretti, C.; Cheng, Z.; Wang, Y.; Li, N.; Mu, L.; et al. Replacing Traditional Plastics with Biodegradable Plastics: Impact on Carbon Emissions. Engineering 2024, 32, 152–162. [Google Scholar] [CrossRef]
- Rubi, R.V.; Patricia, A.D.; Michelle, H.; Shalimar, S.; Kirstie, I.C.; Jerry, G.O.; Erison, C.R.; Edgar, C.L.; Eric, H. Slow Pyrolysis of Buri Palm: Investigation of Pyrolysis Temperature and Residence Time Effects. Mater. Today Proc. 2023. [Google Scholar] [CrossRef]
- Saeaung, K.; Phusunti, N.; Phetwarotai, W.; Assabumrungrat, S.; Cheirsilp, B. Catalytic Pyrolysis of Petroleum-Based and Biodegradable Plastic Waste to Obtain High-Value Chemicals. Waste Manag. 2021, 127, 101–111. [Google Scholar] [CrossRef]
- Dong, Z.; Zhou, Y.; Chen, Q.; Zhang, C.; Wang, N.; Xu, Q. Product Distribution and Conversion Mechanism of Fossil-Based Biodegradable Plastics during Rapid Pyrolysis. Chem. Eng. J. 2024, 491, 152099. [Google Scholar] [CrossRef]
- Kim, S.; Yang, W.; Lee, H.S.; Tsang, Y.F.; Lee, J. Effectiveness of CO2-Mediated Pyrolysis for the Treatment of Biodegradable Plastics: A Case Study of Polybutylene Adipate Terephthalate/Polylactic Acid Mulch Film. J. Clean. Prod. 2022, 372, 133763. [Google Scholar] [CrossRef]
- Zhao, J.; Wang, Z.; Li, J.; Yan, B.; Chen, G. Pyrolysis of Food Waste and Food Waste Solid Digestate: A Comparative Investigation. Bioresour. Technol. 2022, 354, 127191. [Google Scholar] [CrossRef] [PubMed]
- Huang, Z.; Li, Y.; Zhao, C.; Liu, Y. Co-Pyrolysis of Poly (Lactic Acid) and Sugar Cane Bagasse: Kinetic and Thermodynamic Studies. Fuel 2024, 372, 132228. [Google Scholar] [CrossRef]
- Nardella, F.; Bellavia, S.; Mattonai, M.; Ribechini, E. Co-Pyrolysis of Biomass and Plastic: Synergistic Effects and Estimation of Elemental Composition of Pyrolysis Oil by Analytical Pyrolysis–Gas Chromatography/Mass Spectrometry. Bioresour. Technol. 2022, 354, 127170. [Google Scholar] [CrossRef] [PubMed]
- Liu, X.; Tian, K.; Chen, Z.; Wei, W.; Xu, B.; Ni, B.-J. Online TG-FTIR-MS Analysis of the Catalytic Pyrolysis of Polyethylene and Polyvinyl Chloride Microplastics. J. Hazard. Mater. 2023, 441, 129881. [Google Scholar] [CrossRef]
- Chen, J.; Ma, X.; Yu, Z.; Deng, T.; Chen, X.; Chen, L.; Dai, M. A Study on Catalytic Co-Pyrolysis of Kitchen Waste with Tire Waste over ZSM-5 Using TG-FTIR and Py-GC/MS. Bioresour. Technol. 2019, 289, 121585. [Google Scholar] [CrossRef]
- Yousef, S.; Eimontas, J.; Striūgas, N.; Mohamed, A.; Ali Abdelnaby, M. Pyrolysis Kinetic Behavior and TG-FTIR-GC–MS Analysis of End-Life Ultrafiltration Polymer Nanocomposite Membranes. Chem. Eng. J. 2022, 428, 131181. [Google Scholar] [CrossRef]
- Yan, M.; Liu, J.; Yoshikawa, K.; Jiang, J.; Zhang, Y.; Zhu, G.; Liu, Y.; Hantoko, D. Cascading Disposal for Food Waste by Integration of Hydrothermal Carbonization and Supercritical Water Gasification. Renew. Energy 2022, 186, 914–926. [Google Scholar] [CrossRef]
- Bach, Q.-V.; Chen, W.-H. Pyrolysis Characteristics and Kinetics of Microalgae via Thermogravimetric Analysis (TGA): A State-of-the-Art Review. Bioresour. Technol. 2017, 246, 88–100. [Google Scholar] [CrossRef]
- Zhou, L.; Wang, Y.; Huang, Q.; Cai, J. Thermogravimetric Characteristics and Kinetic of Plastic and Biomass Blends Co-Pyrolysis. Fuel Process. Technol. 2006, 87, 963–969. [Google Scholar] [CrossRef]
- Miura, K.; Maki, T. A Simple Method for Estimating f (E) and k0 (E) in the Distributed Activation Energy Model. Energy Fuels 1998, 12, 864–869. [Google Scholar] [CrossRef]
- Hu, S.; Ma, X.; Lin, Y.; Yu, Z.; Fang, S. Thermogravimetric Analysis of the Co-Combustion of Paper Mill Sludge and Municipal Solid Waste. Energy Convers. Manag. 2015, 99, 112–118. [Google Scholar] [CrossRef]
- Liu, L.; Chen, H.; Shiko, E.; Fan, X.; Zhou, Y.; Zhang, G.; Luo, X.; Hu, X. (Eric) Low-Cost DETA Impregnation of Acid-Activated Sepiolite for CO2 Capture. Chem. Eng. J. 2018, 353, 940–948. [Google Scholar] [CrossRef]
- Zhang, W.; Jia, J.; Ding, Y.; Jiang, G.; Sun, L.; Lu, K. Effects of Heating Rate on Thermal Degradation Behavior and Kinetics of Representative Thermoplastic Wastes. J. Environ. Manag. 2022, 314, 115071. [Google Scholar] [CrossRef]
- Somerville, M.; Deev, A. The Effect of Heating Rate, Particle Size and Gas Flow on the Yield of Charcoal during the Pyrolysis of Radiata Pine Wood. Renew. Energy 2020, 151, 419–425. [Google Scholar] [CrossRef]
- Kumar, M.; Srivastava, N.; Upadhyay, S.N.; Mishra, P.K. Thermal Degradation of Dry Kitchen Waste: Kinetics and Pyrolysis Products. Biomass Conv. Bioref. 2023, 13, 2779–2796. [Google Scholar] [CrossRef]
- Han, B.; Chen, Y.; Wu, Y.; Hua, D.; Chen, Z.; Feng, W.; Yang, M.; Xie, Q. Co-Pyrolysis Behaviors and Kinetics of Plastics–Biomass Blends through Thermogravimetric Analysis. J. Therm. Anal. Calorim. 2014, 115, 227–235. [Google Scholar] [CrossRef]
- Sharypov, V.; Beregovtsova, N.; Kuznetsov, B.; Membrado, L.; Cebolla, V.; Marin, N.; Weber, J. Co-Pyrolysis of Wood Biomass and Synthetic Polymers Mixtures. Part III: Characterisation of Heavy Products. J. Anal. Appl. Pyrolysis 2003, 67, 325–340. [Google Scholar] [CrossRef]
- Yao, L.; Wu, B.; Fan, H.; Gu, J.; Yuan, H.; Xie, J. An Investigation on Synergistic Effects and Kinetic Characteristics of Pyrolysis of Kitchen Waste Components: Starch, Protein and Lipid. J. Environ. Chem. Eng. 2024, 12, 114619. [Google Scholar] [CrossRef]
- Ong, H.C.; Chen, W.-H.; Singh, Y.; Gan, Y.Y.; Chen, C.-Y.; Show, P.L. A State-of-the-Art Review on Thermochemical Conversion of Biomass for Biofuel Production: A TG-FTIR Approach. Energy Convers. Manag. 2020, 209, 112634. [Google Scholar] [CrossRef]
- Wang, X.; Sheng, L.; Yang, X. Pyrolysis Characteristics and Pathways of Protein, Lipid and Carbohydrate Isolated from Microalgae Nannochloropsis Sp. Bioresour. Technol. 2017, 229, 119–125. [Google Scholar] [CrossRef]
- Zhang, Z.; Zhu, M.; Zhang, D. A Thermogravimetric Study of the Characteristics of Pyrolysis of Cellulose Isolated from Selected Biomass. Appl. Energy 2018, 220, 87–93. [Google Scholar] [CrossRef]
- Huang, X.; Yin, H.; Zhang, H.; Mei, N.; Mu, L. Pyrolysis Characteristics, Gas Products, Volatiles, and Thermo–Kinetics of Industrial Lignin via TG/DTG–FTIR/MS and in–Situ Py–PI–TOF/MS. Energy 2022, 259, 125062. [Google Scholar] [CrossRef]
- Feng, Y.; Wan, L.; Wang, S.; Yu, T.; Chen, D. The Emission of Gaseous Nitrogen Compounds during Pyrolysis of Meat and Bone Meal. J. Anal. Appl. Pyrolysis 2018, 130, 314–319. [Google Scholar] [CrossRef]
- Chen, H.; Xie, Y.; Chen, W.; Xia, M.; Li, K.; Chen, Z.; Chen, Y.; Yang, H. Investigation on Co-Pyrolysis of Lignocellulosic Biomass and Amino Acids Using TG-FTIR and Py-GC/MS. Energy Convers. Manag. 2019, 196, 320–329. [Google Scholar] [CrossRef]
- Niu, S.; Zhou, Y.; Yu, H.; Lu, C.; Han, K. Investigation on Thermal Degradation Properties of Oleic Acid and Its Methyl and Ethyl Esters through TG-FTIR. Energy Convers. Manag. 2017, 149, 495–504. [Google Scholar] [CrossRef]
- Zhang, F.; Sun, Y.; Li, J.; Su, H.; Zhu, Z.; Yan, B.; Cheng, Z.; Chen, G. Pyrolysis of 3D Printed Polylactic Acid Waste: A Kinetic Study via TG-FTIR/GC-MS Analysis. J. Anal. Appl. Pyrolysis 2022, 166, 105631. [Google Scholar] [CrossRef]
- Dong, N.; Hui, H.; Li, S.; Du, L. Study on Preparation of Aromatic-Rich Oil by Thermal Dechlorination and Fast Pyrolysis of PVC. J. Anal. Appl. Pyrolysis 2023, 169, 105817. [Google Scholar] [CrossRef]
- Worzakowska, M.; Sztanke, M.; Sztanke, K. Decomposition Course of Anticancer Active Imidazolidine-Based Hybrids with Diethyl Butanedioate Studied by TG/FTIR/QMS-Coupled Method. J. Anal. Appl. Pyrolysis 2019, 143, 104686. [Google Scholar] [CrossRef]
- Amin, M.K.; Boateng, J. Surface Functionalization of PLGA Nanoparticles for Potential Oral Vaccine Delivery Targeting Intestinal Immune Cells. Colloids Surf. B Biointerfaces 2023, 222, 113121. [Google Scholar] [CrossRef]
- Zong, P.; Jiang, Y.; Tian, Y.; Li, J.; Yuan, M.; Ji, Y.; Chen, M.; Li, D.; Qiao, Y. Pyrolysis Behavior and Product Distributions of Biomass Six Group Components: Starch, Cellulose, Hemicellulose, Lignin, Protein and Oil. Energy Convers. Manag. 2020, 216, 112777. [Google Scholar] [CrossRef]
- Sun, C.; Li, C.; Tan, H.; Zhang, Y. Synergistic Effects of Wood Fiber and Polylactic Acid during Co-Pyrolysis Using TG-FTIR-MS and Py-GC/MS. Energy Convers. Manag. 2019, 202, 112212. [Google Scholar] [CrossRef]
- Özsin, G.; Pütün, A.E. Insights into Pyrolysis and Co-Pyrolysis of Biomass and Polystyrene: Thermochemical Behaviors, Kinetics and Evolved Gas Analysis. Energy Convers. Manag. 2017, 149, 675–685. [Google Scholar] [CrossRef]
- Sun, C.; Chen, X.; Zheng, D.; Yao, W.; Tan, H.; Zhang, Y.; Liu, S. Exploring the Synergetic Effects of the Major Components of Biomass Additives in the Pyrolysis of Polylactic Acid. Green Chem. 2021, 23, 9014–9023. [Google Scholar] [CrossRef]
- Sánchez-Gómez, J.A.; Cabrera-Ruiz, J.; Hernández, S. Design and Optimization of an Intensified Process to Produce Acrylic Acid as Added Product Value from Glycerol Generated in the Biodiesel Production. Chem. Eng. Res. Des. 2022, 184, 543–553. [Google Scholar] [CrossRef]
- Ghadamyari, M.; Chaemchuen, S.; Zhou, K.; Dusselier, M.; Sels, B.F.; Mousavi, B.; Verpoort, F. One-Step Synthesis of Stereo-Pure l,l Lactide from l-Lactic Acid. Catal. Commun. 2018, 114, 33–36. [Google Scholar] [CrossRef]
- Shirai, M.A.; Müller, C.M.O.; Grossmann, M.V.E.; Yamashita, F. Adipate and Citrate Esters as Plasticizers for Poly(Lactic Acid)/Thermoplastic Starch Sheets. J. Polym. Environ. 2015, 23, 54–61. [Google Scholar] [CrossRef]
Disclaimer/Publisher’s Note: The statements, opinions and data contained in all publications are solely those of the individual author(s) and contributor(s) and not of MDPI and/or the editor(s). MDPI and/or the editor(s) disclaim responsibility for any injury to people or property resulting from any ideas, methods, instructions or products referred to in the content. |
© 2025 by the authors. Licensee MDPI, Basel, Switzerland. This article is an open access article distributed under the terms and conditions of the Creative Commons Attribution (CC BY) license (https://creativecommons.org/licenses/by/4.0/).