Article

Study of the Macro-Mesoscopic Shear Anisotropic Mechanical Behavior of Reservoir Shale

1
State Key Laboratory of Lithospheric and Environmental Coevolution, Institute of Geology and Geophysics, Chinese Academy of Sciences, Beijing 100029, China
2
College of Earth and Planetary Sciences, University of Chinese Academy of Sciences, Beijing 100049, China
3
School of Earth Science and Engineering, Hebei University of Engineering, Handan 056038, China
4
Collaborative Innovation Center of Resource Exploration and Exploitation, Hebei University of Engineering, Handan 056038, China
*
Author to whom correspondence should be addressed.
Processes 2025, 13(5), 1404; https://doi.org/10.3390/pr13051404
Submission received: 17 March 2025 / Revised: 20 April 2025 / Accepted: 28 April 2025 / Published: 4 May 2025

Abstract

:
Shear failure is pivotal in fracture evolution and stimulated reservoir volume (SRV) during hydraulic fracturing, particularly in bedded shale formations. However, the limited availability of coupled macro- and mesoscale experimental data on the shear behavior of reservoir shale constrains a comprehensive understanding of its anisotropic shear mechanical properties across scales. This study systematically investigates shear anisotropy at both macro- and mesoscales in shale with varying bedding orientations under different normal stress conditions. The key findings are summarized as follows: (1) At lower normal stresses, the anisotropy of peak shear strength was more pronounced, whereas the anisotropy of residual shear strength was relatively weak. As the normal stress increased, the anisotropic effects of bedding on peak and residual shear strengths exhibited opposite trends. The former exhibited a fluctuating decline, whereas the latter showed a progressive increase. (2) The internal friction angle of shale bedding planes was higher than that of the matrix, whereas cohesion exhibited the opposite trend. The internal friction angle corresponding to the peak shear strength reached its maximum at a bedding angle of 45°, while cohesion peaked at a bedding angle of 60°. (3) At lower normal stresses, the cumulative acoustic emission (AE) ringing count curves for shale shear failure followed an “S”-shaped pattern for bedded and matrix shear, differing from the piecewise linear pattern observed in bedded-matrix coupled shear. As the normal stress increased, the bedding-induced effects on macro- and mesoscale shear behavior evolved from non-uniformity to uniformity, reflecting a transition of anisotropy from uncoordinated to coordinated characteristics.

1. Introduction

Shale gas is an unconventional clean energy resource with substantial reserves and widespread distribution, contributing an increasingly significant share to global recoverable oil and gas resources [1,2,3]. Its burial depth varies considerably, with shallow reserves accounting for approximately two-thirds of total resources, while medium to deep reservoirs have been extensively explored and evaluated [4]. Consequently, a systematic assessment of the resource potential, exploration prospects, and development feasibility of shallow shale gas is imperative [4,5]. In the Sichuan Basin and surrounding areas, approximately 50 shallow shale gas wells have been drilled, with most exhibiting favorable gas-bearing properties, underscoring considerable exploration potential and promising development prospects. However, large-scale commercial development in China remains in its early stages, necessitating further research and technological advancements [6]. Moreover, shale constitutes over 60% of the effective sealing capacity in hydrocarbon-bearing formations and is regarded as one of the most promising and economically viable geological caprocks [7]. Functioning as both a reservoir and a caprock [8], shale plays a pivotal role in hydrogen and CO2 geological sequestration [9,10,11]. Therefore, beyond its significance in energy exploration and production, shallow shale represents a critical research focus in geological sequestration engineering, warranting further in-depth investigation.
Hydraulic fracturing and horizontal well drilling, as key engineering techniques for efficient shale gas extraction, are critically affected by the mechanical properties of shale [12,13]. Hydraulic fracturing induces the formation of a complex fracture network within the shale, thereby enhancing its permeability and providing primary pathways for hydrocarbon transport [14]. Nevertheless, this process also introduces a significant risk of gas leakage [7]. Thus, understanding the formation mechanisms of fracture networks is crucial for enhancing reservoir stimulation volume efficiency and ensuring sequestration safety. The unique microstructural characteristics of shale, including mineral composition, preferential structural orientation, and the development of micropores and microfractures, contribute to its inherently complex anisotropic stratification behavior [15,16,17,18]. On a macroscopic scale, shale exhibits distinct bedding structures due to sedimentary history and environmental differentiation [19,20]. During the formation of complex fracture networks, the accumulation of mesoscopic structural damage controls macroscopic deformation and failure, exhibiting anisotropic mechanical behavior [21]. These characteristics significantly impact shale gas extraction efficiency [2] and increase operational risks in geological sequestration systems [7]. The development of bedding planes and natural fractures is a key factor in determining the formation of hydraulic fracture networks [7,18,22,23,24,25,26,27,28]. The formation of fracture networks is often accompanied by complex mechanical behaviors such as tensile failure, shear failure, slip, and faulting. Shear failure plays a crucial role in connecting hydraulic fractures with bedding planes or natural fractures [22,25,29]. Acoustic emission (AE) localization and fracture mechanism analyses indicate that shear events are predominant [30], making shear failure a key fracturing mechanism. Therefore, understanding the role of shear failure in complex fracture network formation is of paramount importance.
To investigate the shear failure mechanisms of shale, including its failure process under shear stress as well as the associated physical, mechanical, and mesoscopic evolution characteristics, various experimental approaches have been employed. These include triaxial compression tests [18,31,32,33,34,35] and direct shear tests [18,22,23,25,26,27,28,36,37]. Among these, direct shear testing is widely regarded as one of the most intuitive and effective methods for elucidating shear failure mechanisms [23,36,37]. In the study of macroscopic shear anisotropy, existing research has examined the effects of different bedding angles [18,22,28,36] and normal stresses [22,23,36,37] on shale shear strength and deformation failure characteristics, revealing significant differences in shear strength between the bedding plane and the shale matrix. Heng et al. [22,36] conducted direct shear tests on 50 mm diameter cylindrical shale samples, finding that the peak shear internal friction angle and cohesion of the matrix were higher than those of the bedding plane. MashhadialiIt and Molaei [18] performed direct shear tests on 50 mm diameter cylindrical shale specimens with a height-to-diameter ratio of 1 under normal stresses of 1, 6, 9, and 12 MPa, showing that shear strength peaked within the 30 ° to 60 ° bedding angle range. Fan et al. [27] expanded their study of the direct shear failure of bedded shale by incorporating the divider orientation in addition to vertical and parallel bedding orientations using 50 × 50 × 100 mm rectangular shale specimens under normal stresses of 10, 30, and 50 MPa. The results indicated that the divider orientation exhibited the highest shear strength and cohesion, while the short-transverse orientation showed the lowest values. The internal friction angle was maximized in the divider orientation and minimized in the arrester orientation, demonstrating a three-dimensional anisotropic shear strength behavior. Similarly, Fan et al. [37] conducted direct shear tests on shale samples of the same bedding orientation and dimensions under normal stresses of 25, 50, 75, 100, and 125 MPa, revealing that higher normal stresses suppressed fracture propagation and enhanced shear resistance without reducing the anisotropy ratio. Lu et al. [23] performed direct shear tests on 50 mm cubic shale samples under normal stresses of 20, 30, 45, and 60 MPa, showing that peak shear strength initially increased and then decreased with bedding angle, reaching a maximum at a bedding angle of 60 ° . Additionally, most samples with bedding angles of 30 ° and 60 ° exhibited stress fluctuations near the peak shear stress, leading to the proposal of a new anisotropic shear failure criterion. Ye et al. [28] used 50 mm cubic shale samples to study the mesoscopic mechanism of asymmetric progressive failure under direct shear at 30 MPa normal stress, revealing significant asymmetry in fracture initiation type and scale. Zhang et al. [38] conducted direct shear tests on cubic shale specimens with seven bedding angles ( 0 ° , 15 ° , 30 ° , 45 ° , 60 ° , 75 ° , and 90 ° ). The results indicated that under normal stresses of 10, 25, 40, and 50 MPa, the peak shear strength was lowest at the 0 ° bedding angle and reached its maximum at either the 45 ° or 60 ° bedding angle. The internal friction angle peaked at a bedding angle of 45 ° . Despite extensive studies on shale shear failure behavior, direct shear test data for Longmaxi shale with different bedding orientations under low normal stress conditions remain scarce, and the shear failure mechanism of shallow shale is still not well understood.
In the study of mesoscopic shear anisotropy, acoustic emission (AE) technology has been widely used for the real-time monitoring of microfracture evolution in shale [39,40], providing critical insights into the distribution, propagation, and energy release of microfractures during shear failure [27,41,42]. For cubic shale specimens, Ye et al. [28] investigated the asymmetric failure mechanism of shale under direct shear through AE monitoring at a single normal stress of 30 MPa. Their results showed that the fracture initiation threshold, damage threshold, and cumulative AE ring count exhibited an “M-shaped” variation with increasing bedding angle. Fan et al. [27] conducted direct shear tests on shale specimens under a relatively high normal stress of 30 MPa and integrated mesoscopic AE parameters such as ring count and energy with surface strain analysis to examine the progressive shear failure of shale with different bedding angles. They classified the failure process into five stages: initial stage, elastic deformation stage, stable fracture propagation stage, fracture coalescence stage, and post-peak stage. Li [26] studied the AE characteristics of cylindrical shale samples; however, due to limitations in sensor placement, the monitoring accuracy of the microfracture evolution was relatively low. Additionally, the AE monitoring in the above studies did not sufficiently capture the AE signal variations during the residual friction phase after the peak shear strength. Therefore, experimental research on the direct shear failure process and mesoscopic shear mechanical properties of shale based on AE under different bedding angles and low normal stress conditions remains limited. Previous studies have examined the macroscopic shear strength and fracture surface roughness in shale shear failure [23]. However, the effects of low normal stress conditions on fracture surface roughness have yet to be fully explored.
This study first investigated the relationships among the mineral composition, microstructure, and bedding characteristics of shale. Direct shear tests and acoustic emission (AE) monitoring were then integrated to examine the macro- and mesoscopic shear failure mechanisms of shallow shale under different bedding angles and low normal stress conditions. A three-dimensional scanner was employed for the quantitative analysis of post-failure fracture morphology, providing a comprehensive assessment of the shear failure process across macro- to mesoscopic scales. The findings offer experimental data and scientific insights to optimize drilling and hydraulic fracturing techniques for shallow shale reservoirs, enhancing drilling efficiency, reducing development costs, and ensuring the safety of geological sequestration.

2. Materials and Methods

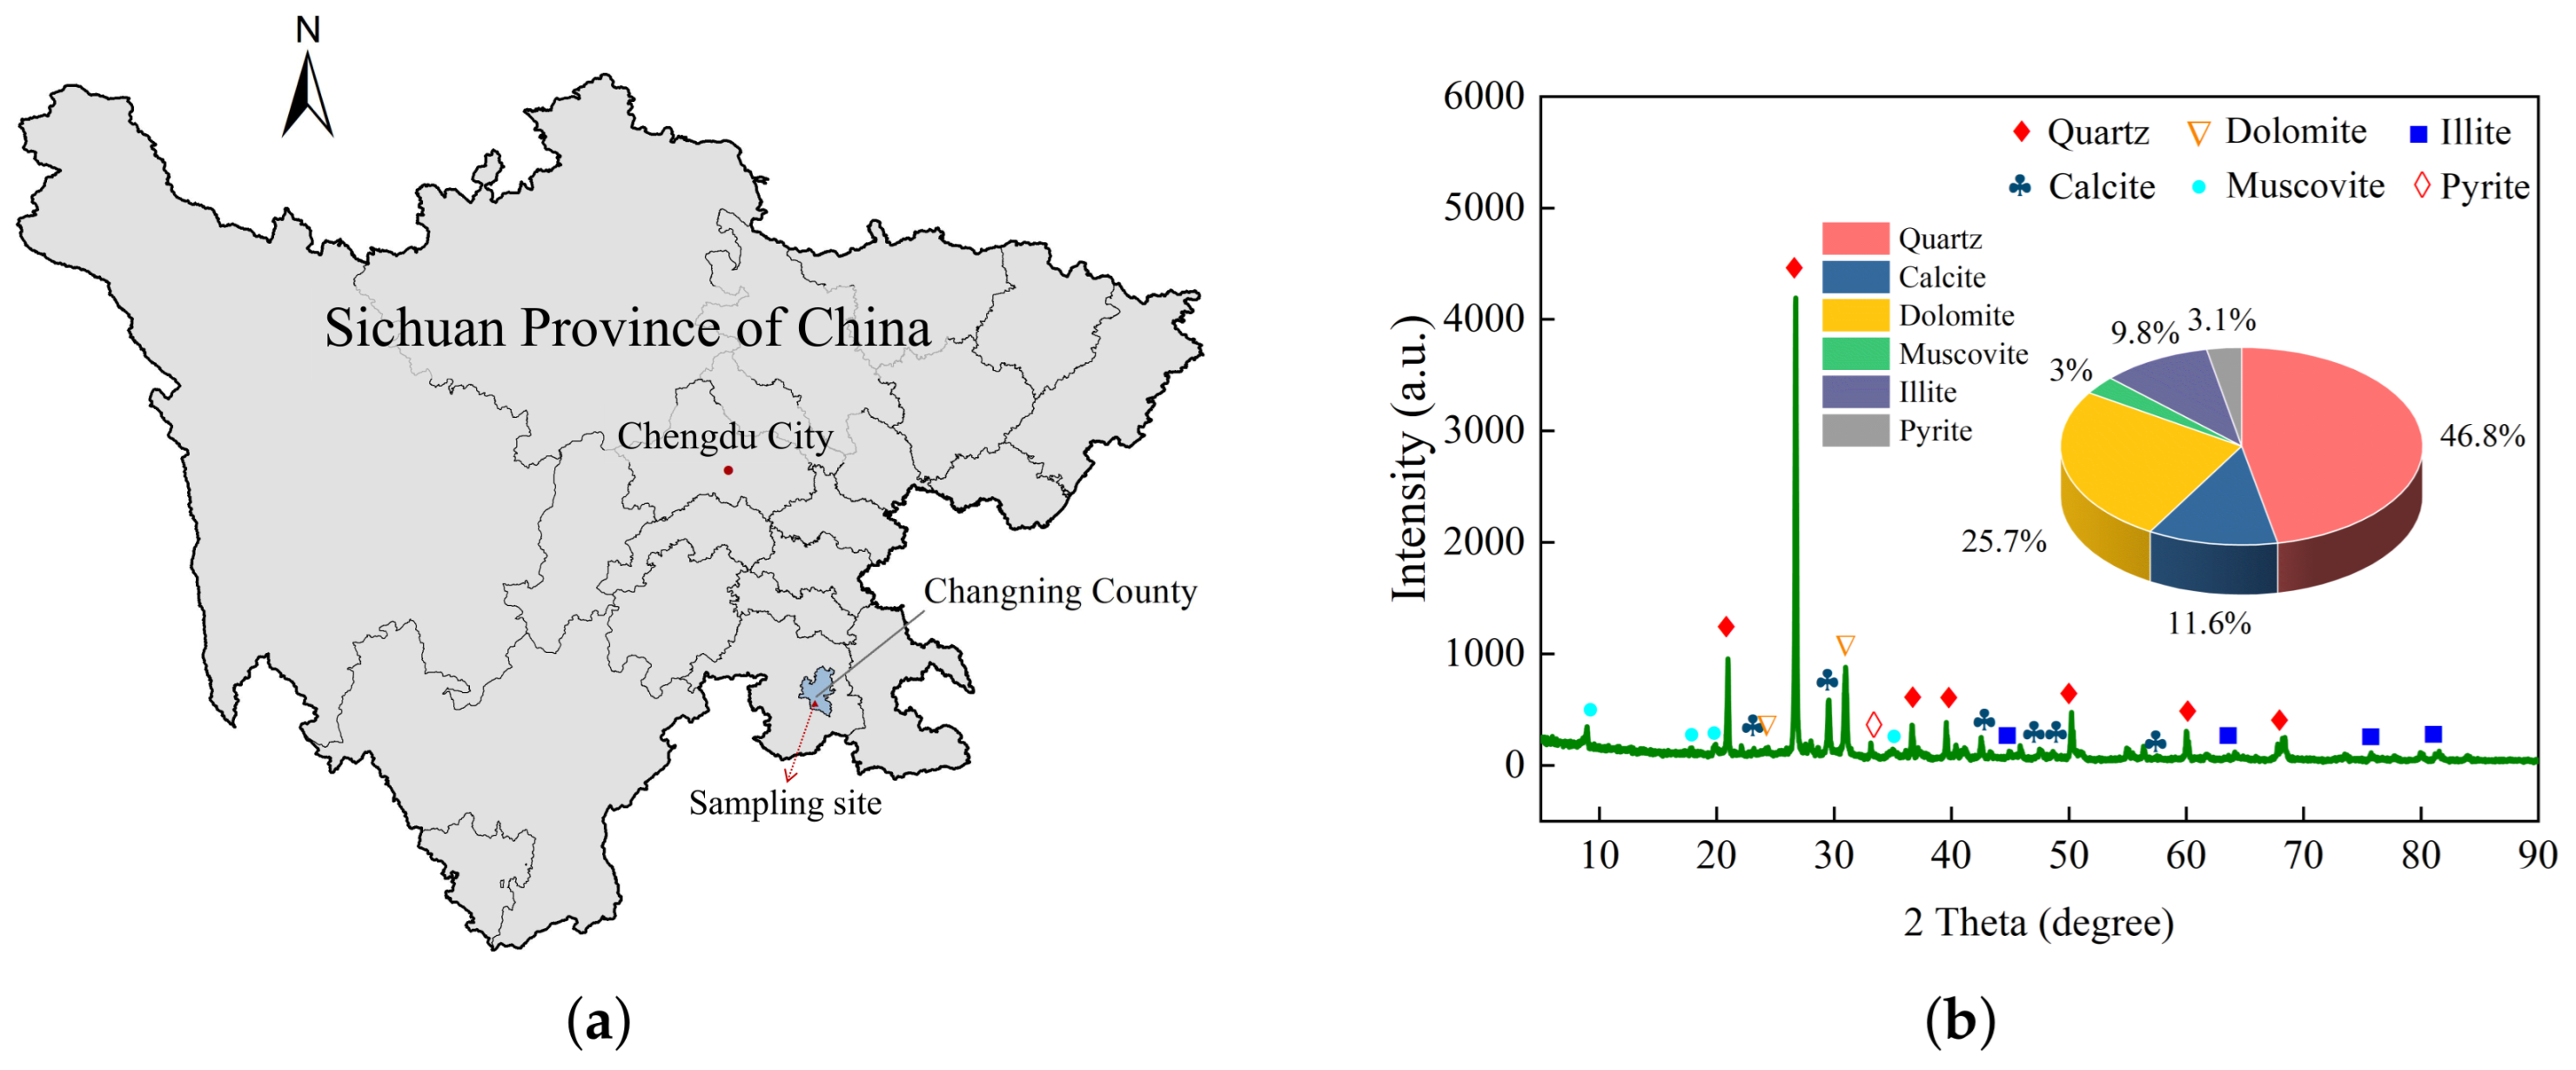
2.1. Microscopic Experimental Methods

The shale samples used in this study were collected from the Longmaxi Formation outcrop in Changning County, Sichuan Province, China, with an average density of 2.6 g/cm3. X-ray diffraction (XRD) analysis identified quartz, calcite, dolomite, illite, and pyrite as the primary minerals, with quartz and dolomite accounting for 72.5% of the total mineral content (Figure 1). A Hitachi TM4000Plus scanning electron microscope (SEM) equipped with a Bruker Quantax75 energy-dispersive spectroscopy (EDS) system was used for the microscopic examination of the shale bedding at 30° and 45° orientations. Additionally, a Phenom XL desktop SEM equipped with a Phenom XL EDS system was employed for the high-resolution analysis of microstructures and mineral morphology.

2.2. Macroscopic and Mesoscopic Experimental Methods

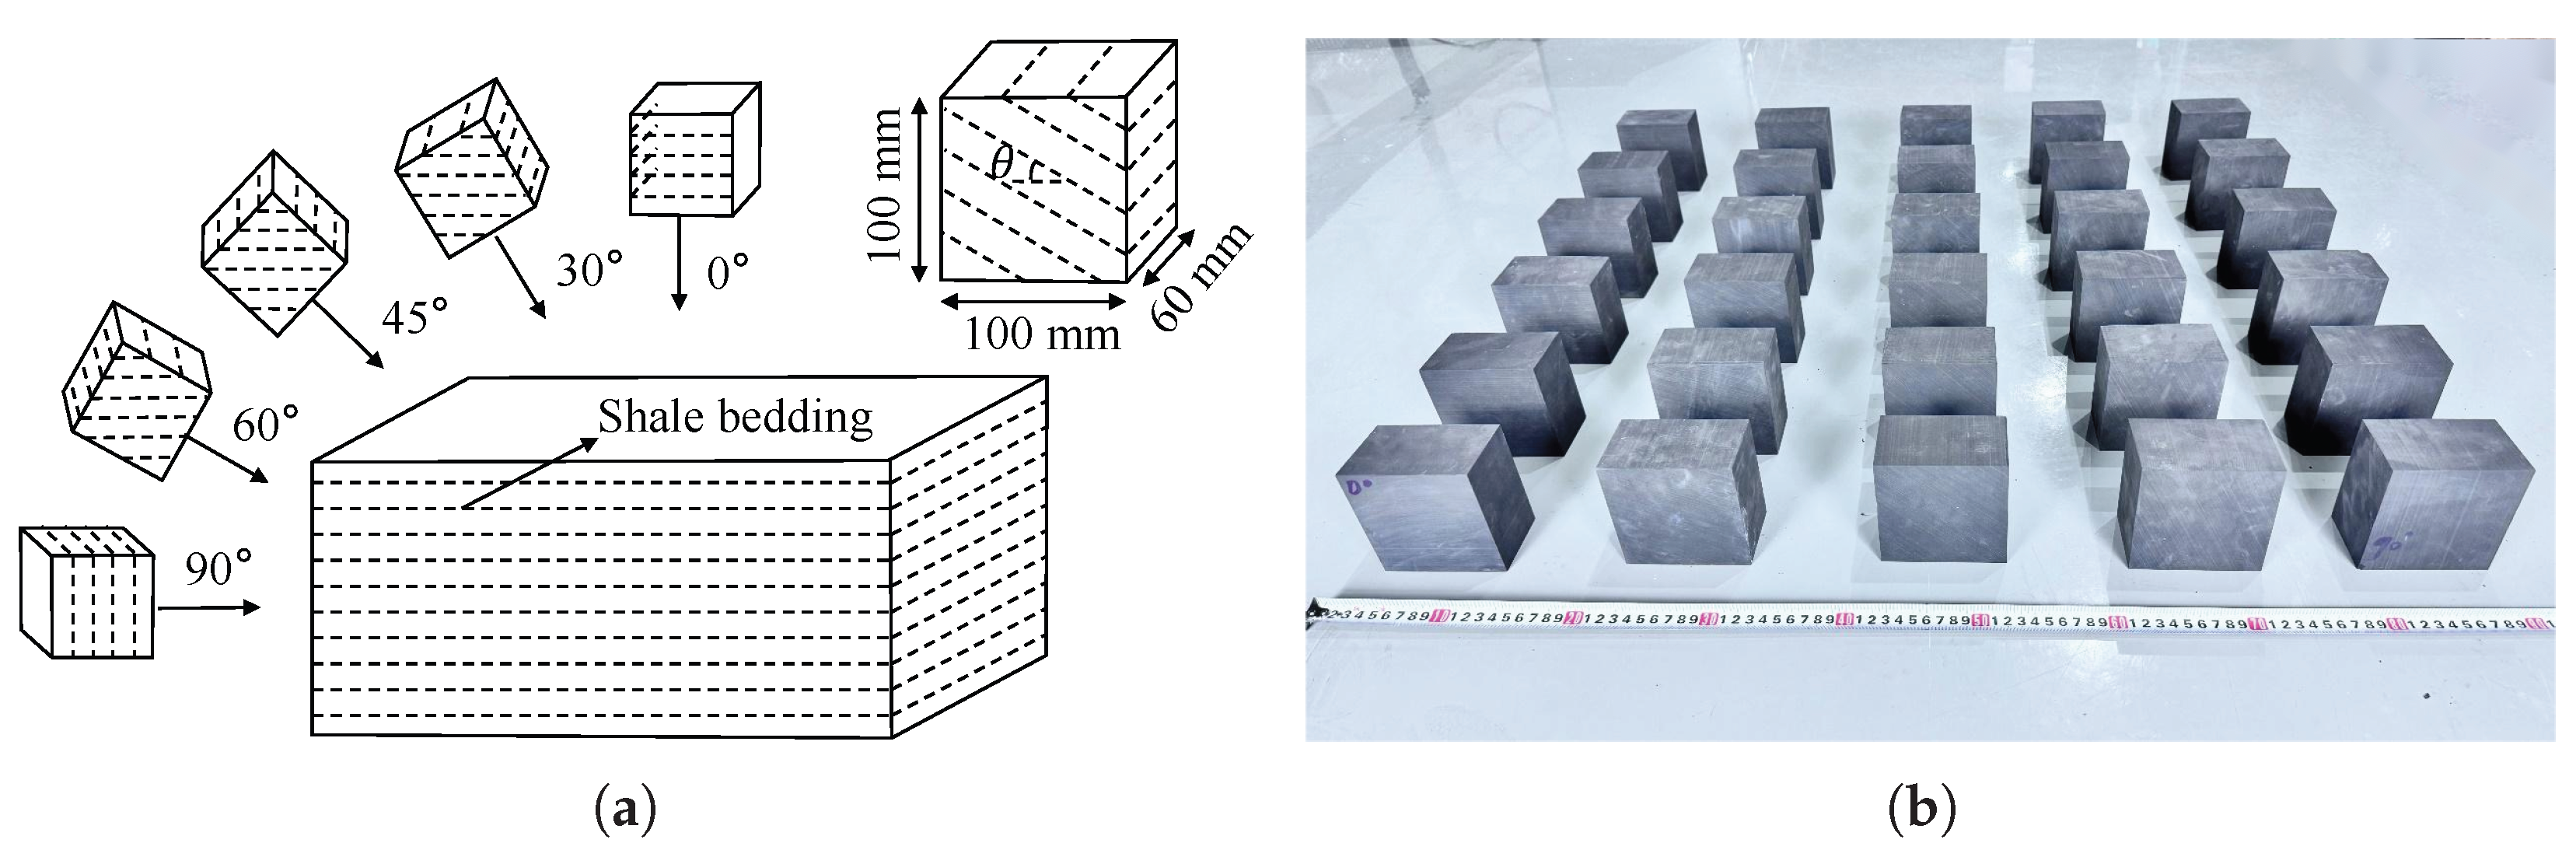
2.2.1. Macroscale Direct Shear Test Method

Cuboid shale specimens ( 100 mm × 60 mm × 100 mm ) were prepared for high-precision direct shear tests (Figure 2). The end-face parallelism error was controlled within 0.02 mm and the verticality deviation was within 0.25°. To avoid moisture influence, the specimens were cut and polished under dry conditions [27,28,36]. Ultrasonic velocity tests were conducted on specimens with different bedding angles, and those with similar longitudinal velocities were selected for further testing. The experimental design included five bedding angles, defined as the angle θ between the bedding plane and the shear direction ( θ = 0 , 30 , 45 , 60 , 90 ) and four normal stress levels (10 MPa, 15 MPa, 20 MPa, 25 MPa). Three specimens were tested for each condition, resulting in a total of 60 test groups.
The shear tests on Longmaxi Formation shale were conducted at the Institute of Geology and Geophysics, Chinese Academy of Sciences (CAS), using a dynamic direct shear testing apparatus (Figure 3), as detailed in Qi et al. [43]. All experiments were performed at room temperature. After applying and maintaining the normal load, the shear load was applied under displacement-controlled mode. The macroscopic mechanical parameters of the direct shear tests were calculated using the following equations:
σ n = N S
τ = F S
G = τ γ
τ = c + σ n tan ( φ )
where σ n is the normal stress, τ is the shear stress, the shear modulus (G) is defined as the ratio of peak shear stress to peak shear strain, N is the normal load, F is the shear load, S is the nominal shear area, γ is the shear strain, c is the cohesion, and φ is the internal friction angle. The normal forces applied were 60 kN, 90 kN, 120 kN, and 150 kN, with a loading rate of 100 N/s. Shear force was applied at 0.01 mm/s until rupture, with shear strain limited to 7%. Real-time data on normal and shear loads and displacements were recorded to analyze shear failure behavior.

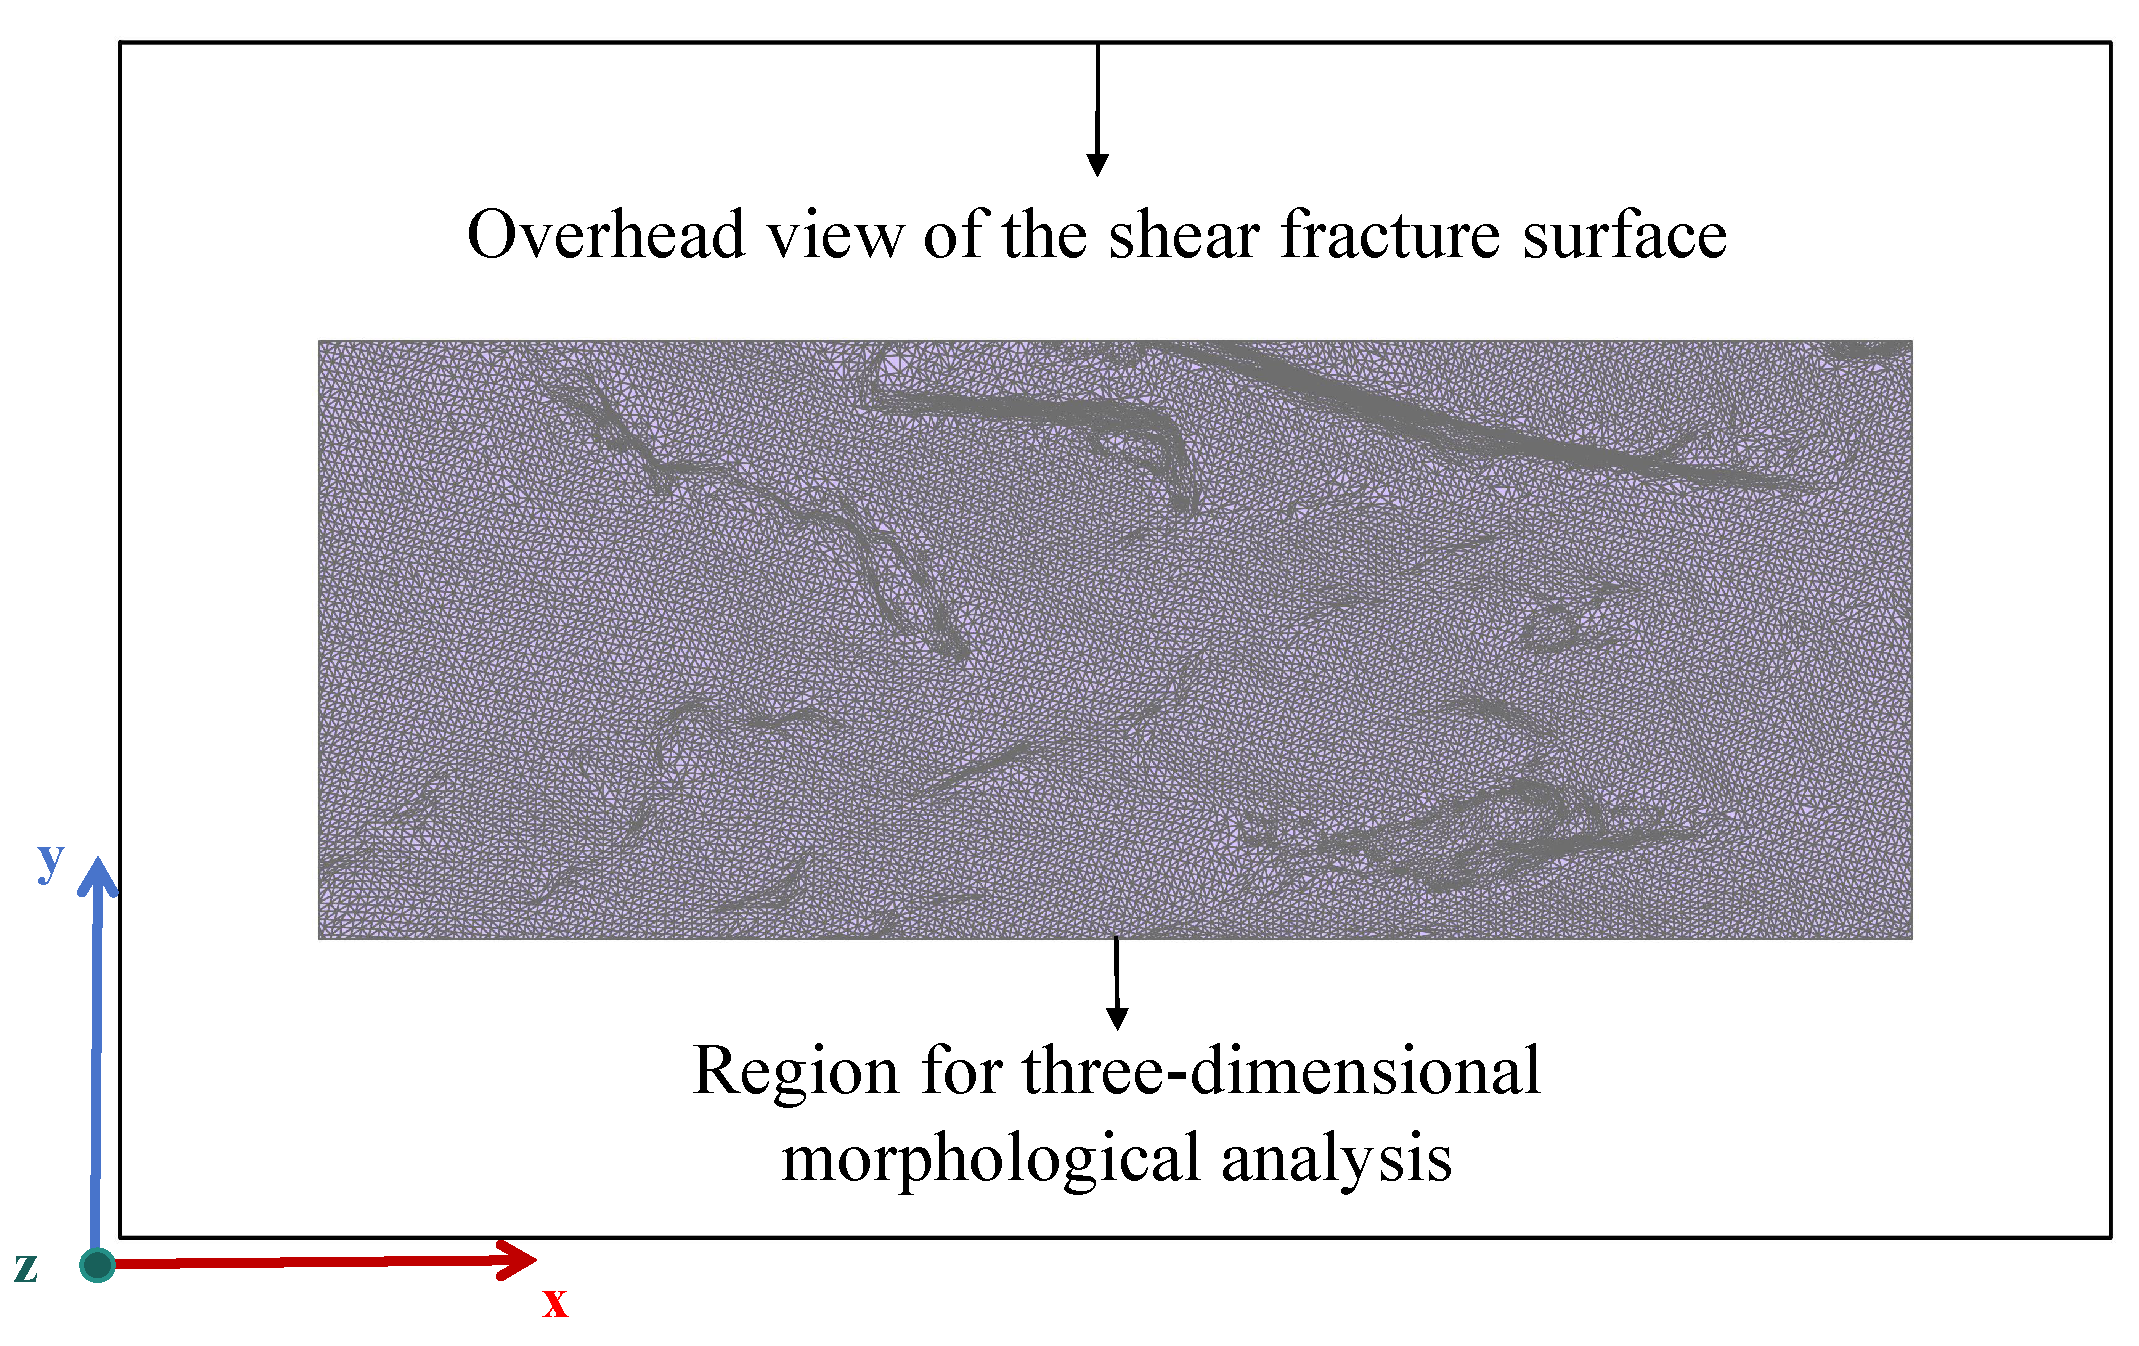
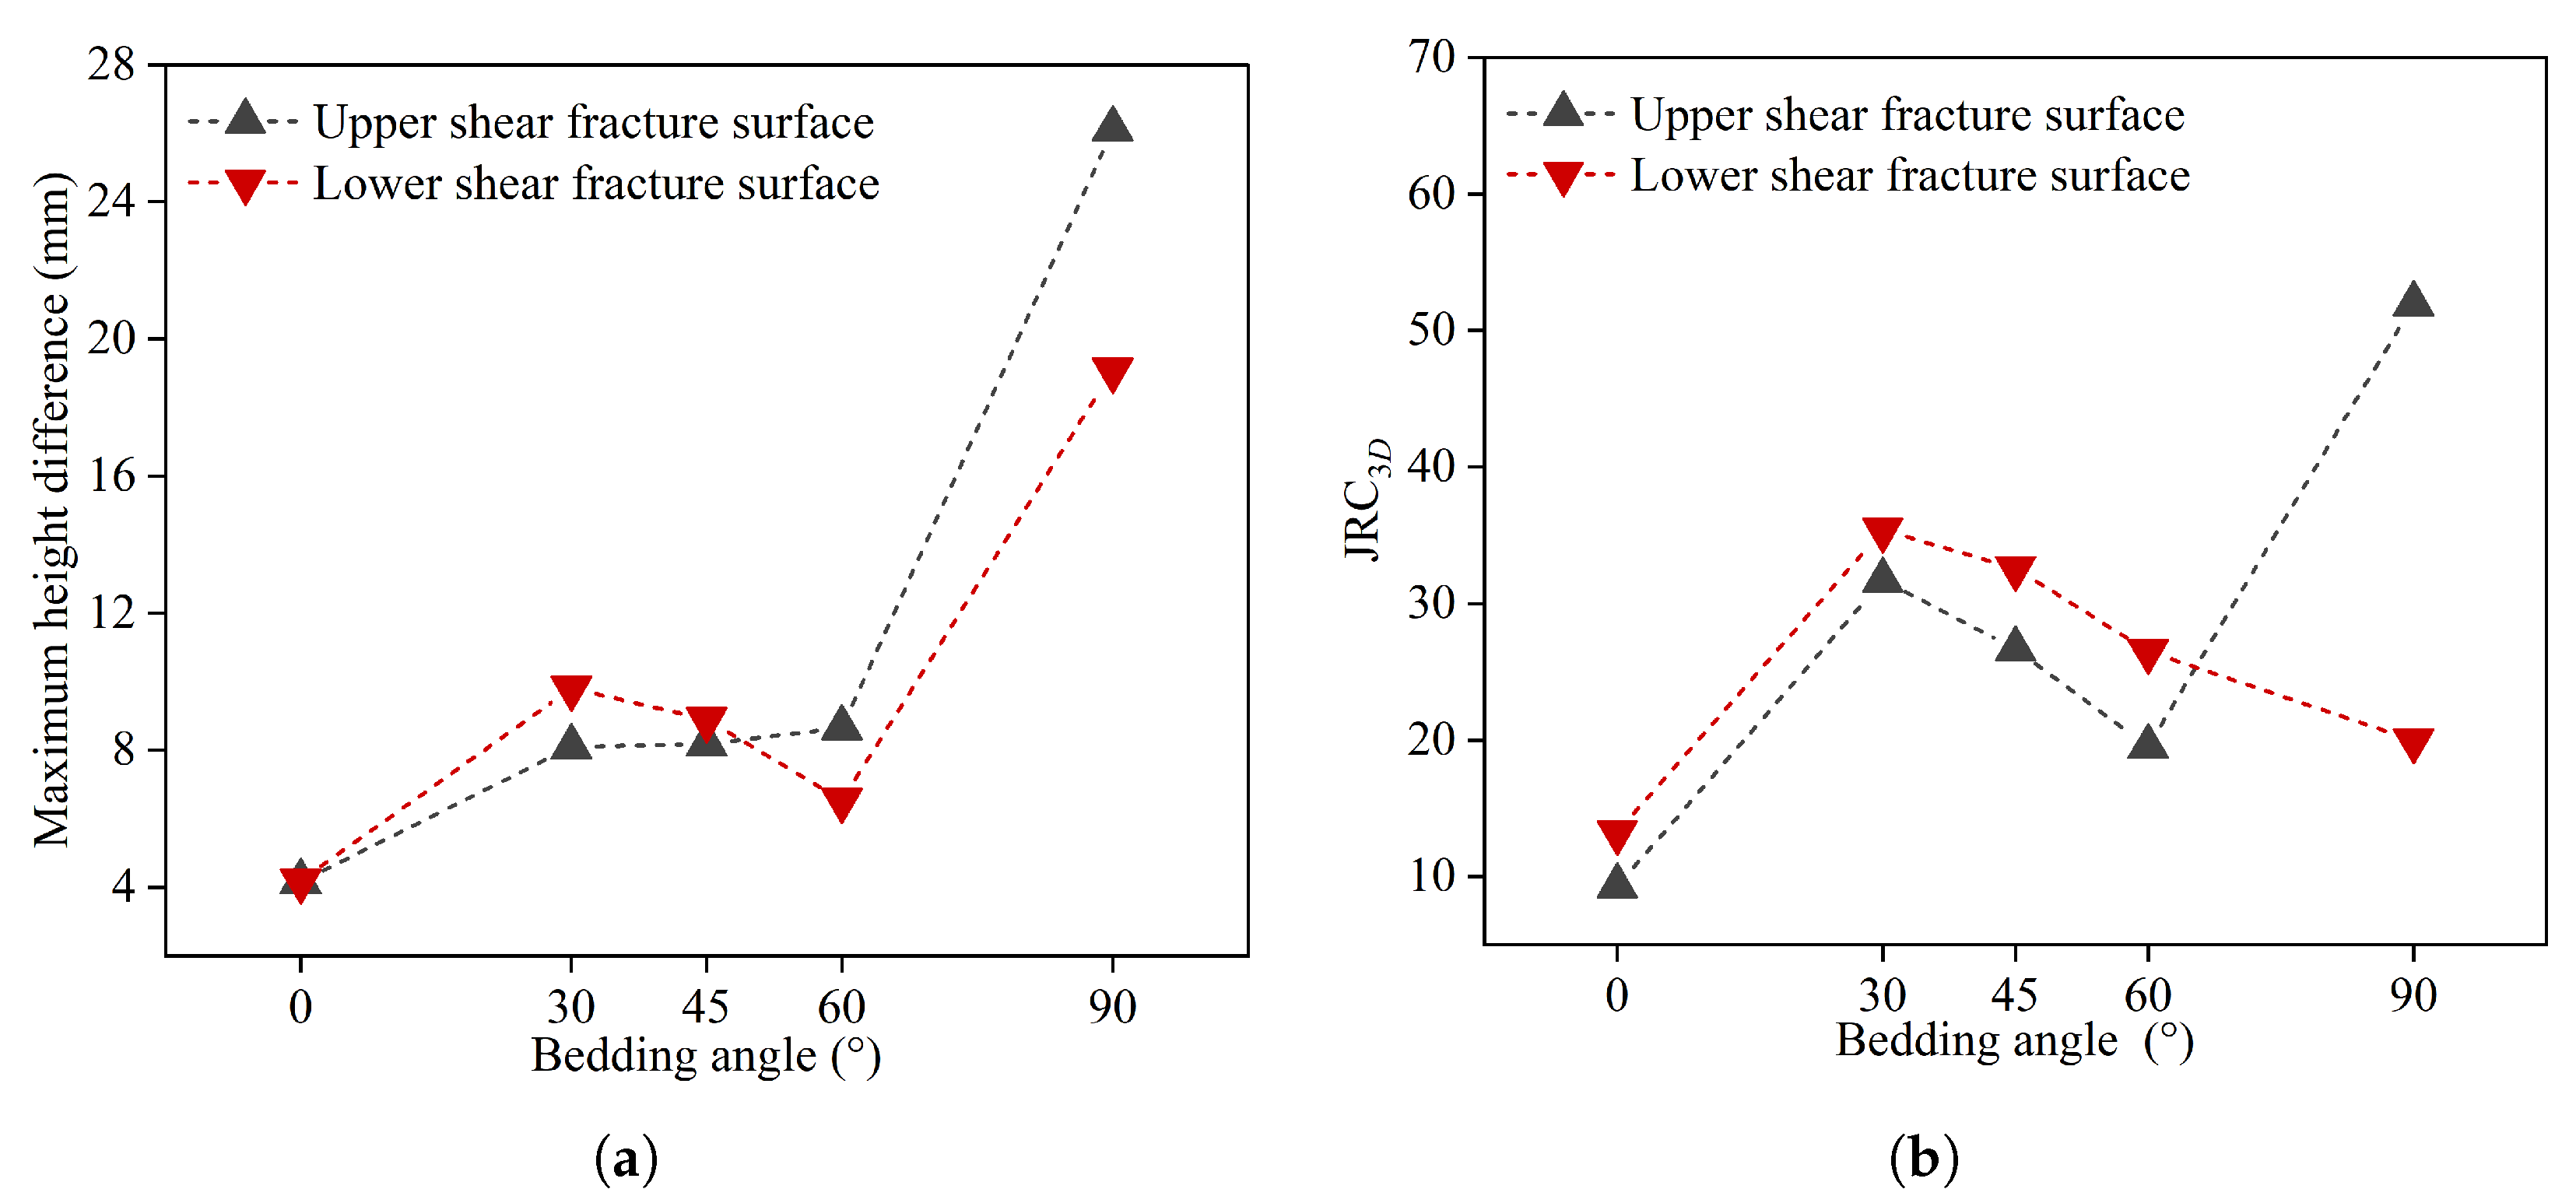
2.2.2. Quantitative Characterization Method of Shear Fracture Surface Morphology

The shear fracture surface was scanned using a handheld three-dimensional laser scanner (Creaform Handyscan 3D VIUscan, Lévis, QC, Canada). at the Institute of Geology and Geophysics, CAS. The irregular surface was analyzed and the scanned data were imported into meshing software to establish a coordinate system. To reduce edge fragmentation effects, a top-center view was selected within a unified, 3D coordinate system. A specific mesh region ( 80 mm × 30 mm , marked in purple) was extracted for analysis (Figure 4), and 3D data were processed using ArcGIS.
To quantitatively describe the three-dimensional roughness, this study employed the three-dimensional Joint Roughness Coefficient ( JRC 3 D ) method by Zheng et al. [44]. The JRC 3 D was given by the following formula:
JRC 3 D = 2.9206 ( θ 0 * ) ave 0.7592 3.1 L n / h n L 0 / h 0 0.02 2.9206 ( θ 0 * ) ave 0.7592 3.1
where L n and h n are the discontinuity length and the maximal undulating amplitude, L 0 is the length (100 mm) of the Barton profile, and h 0 is its maximal undulating amplitude (6.148 mm) among all Barton profiles. θ 0 * represents the apparent dip angles of the discontinuity surfaces [45]).

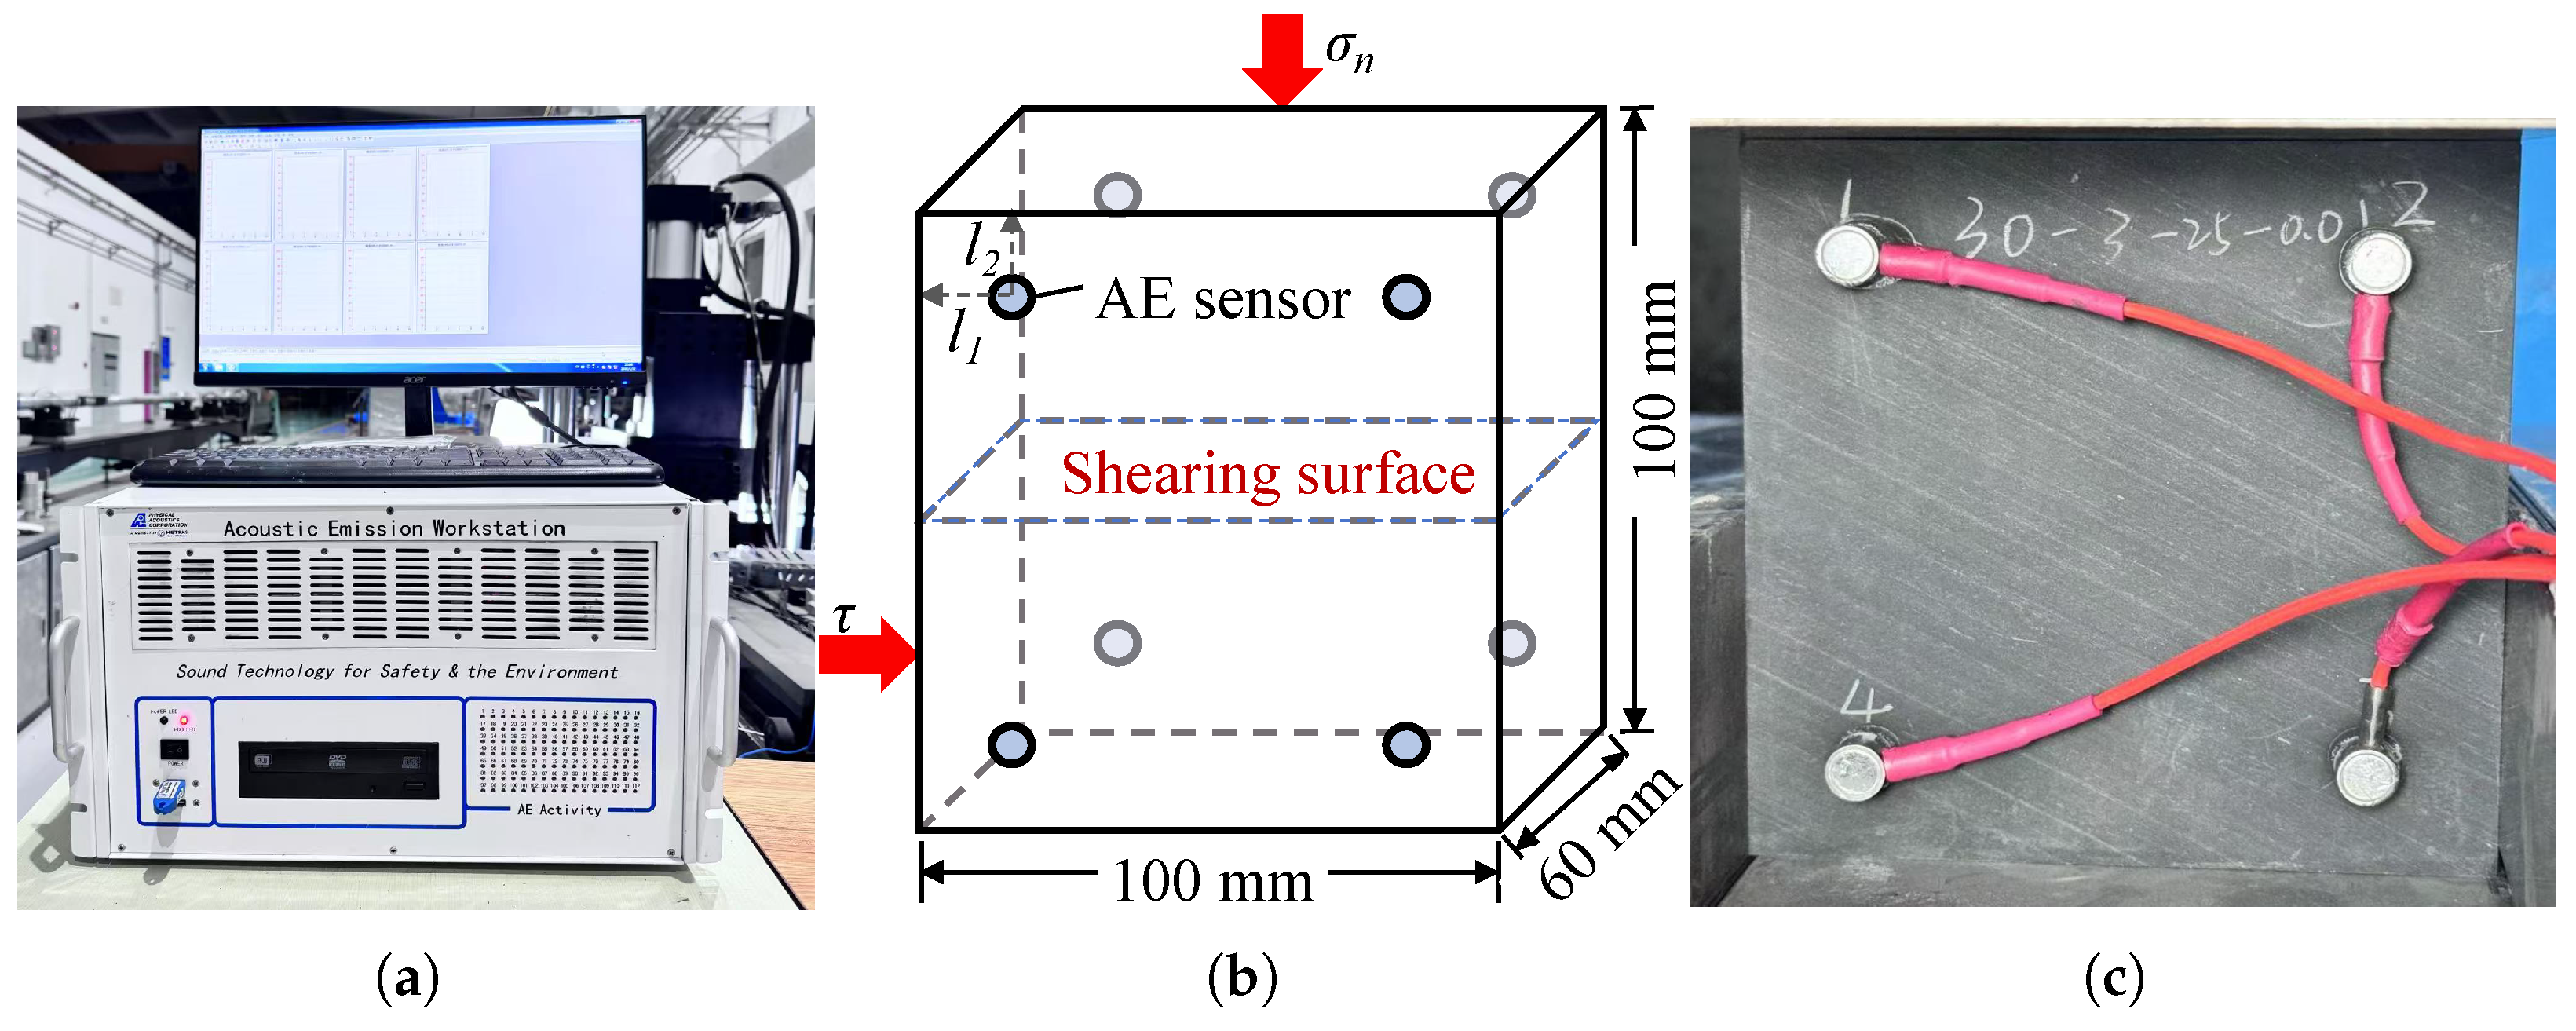
2.2.3. Mesoscale Acoustic Emission Monitoring Method

The damage evolution during shear testing was monitored in real time using the PCI-II AE system (Physical Acoustics Corporation, Princeton, New Jersey, USA) at the Institute of Geology and Geophysics, CAS. Eight AE sensors were placed 15 mm from the sample’s upper and lower surfaces (Figure 5). The hit-based streaming method synchronized AE monitoring with shear testing. Data were sampled at 2 MHz with a 35 dB threshold to reduce noise.

3. Results

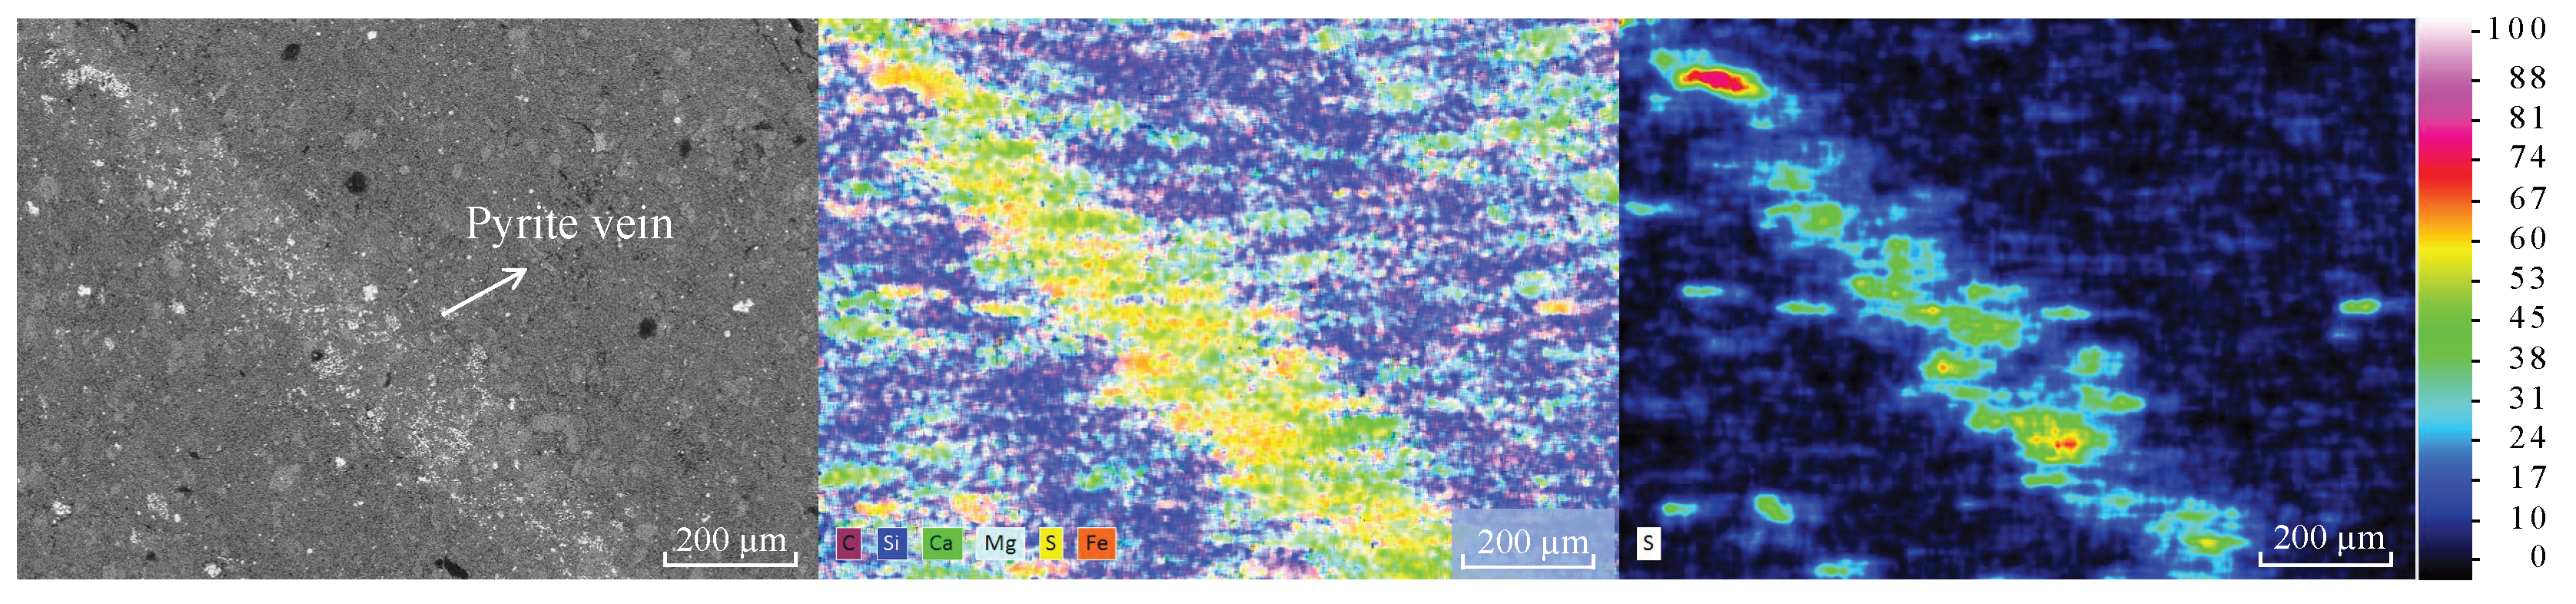
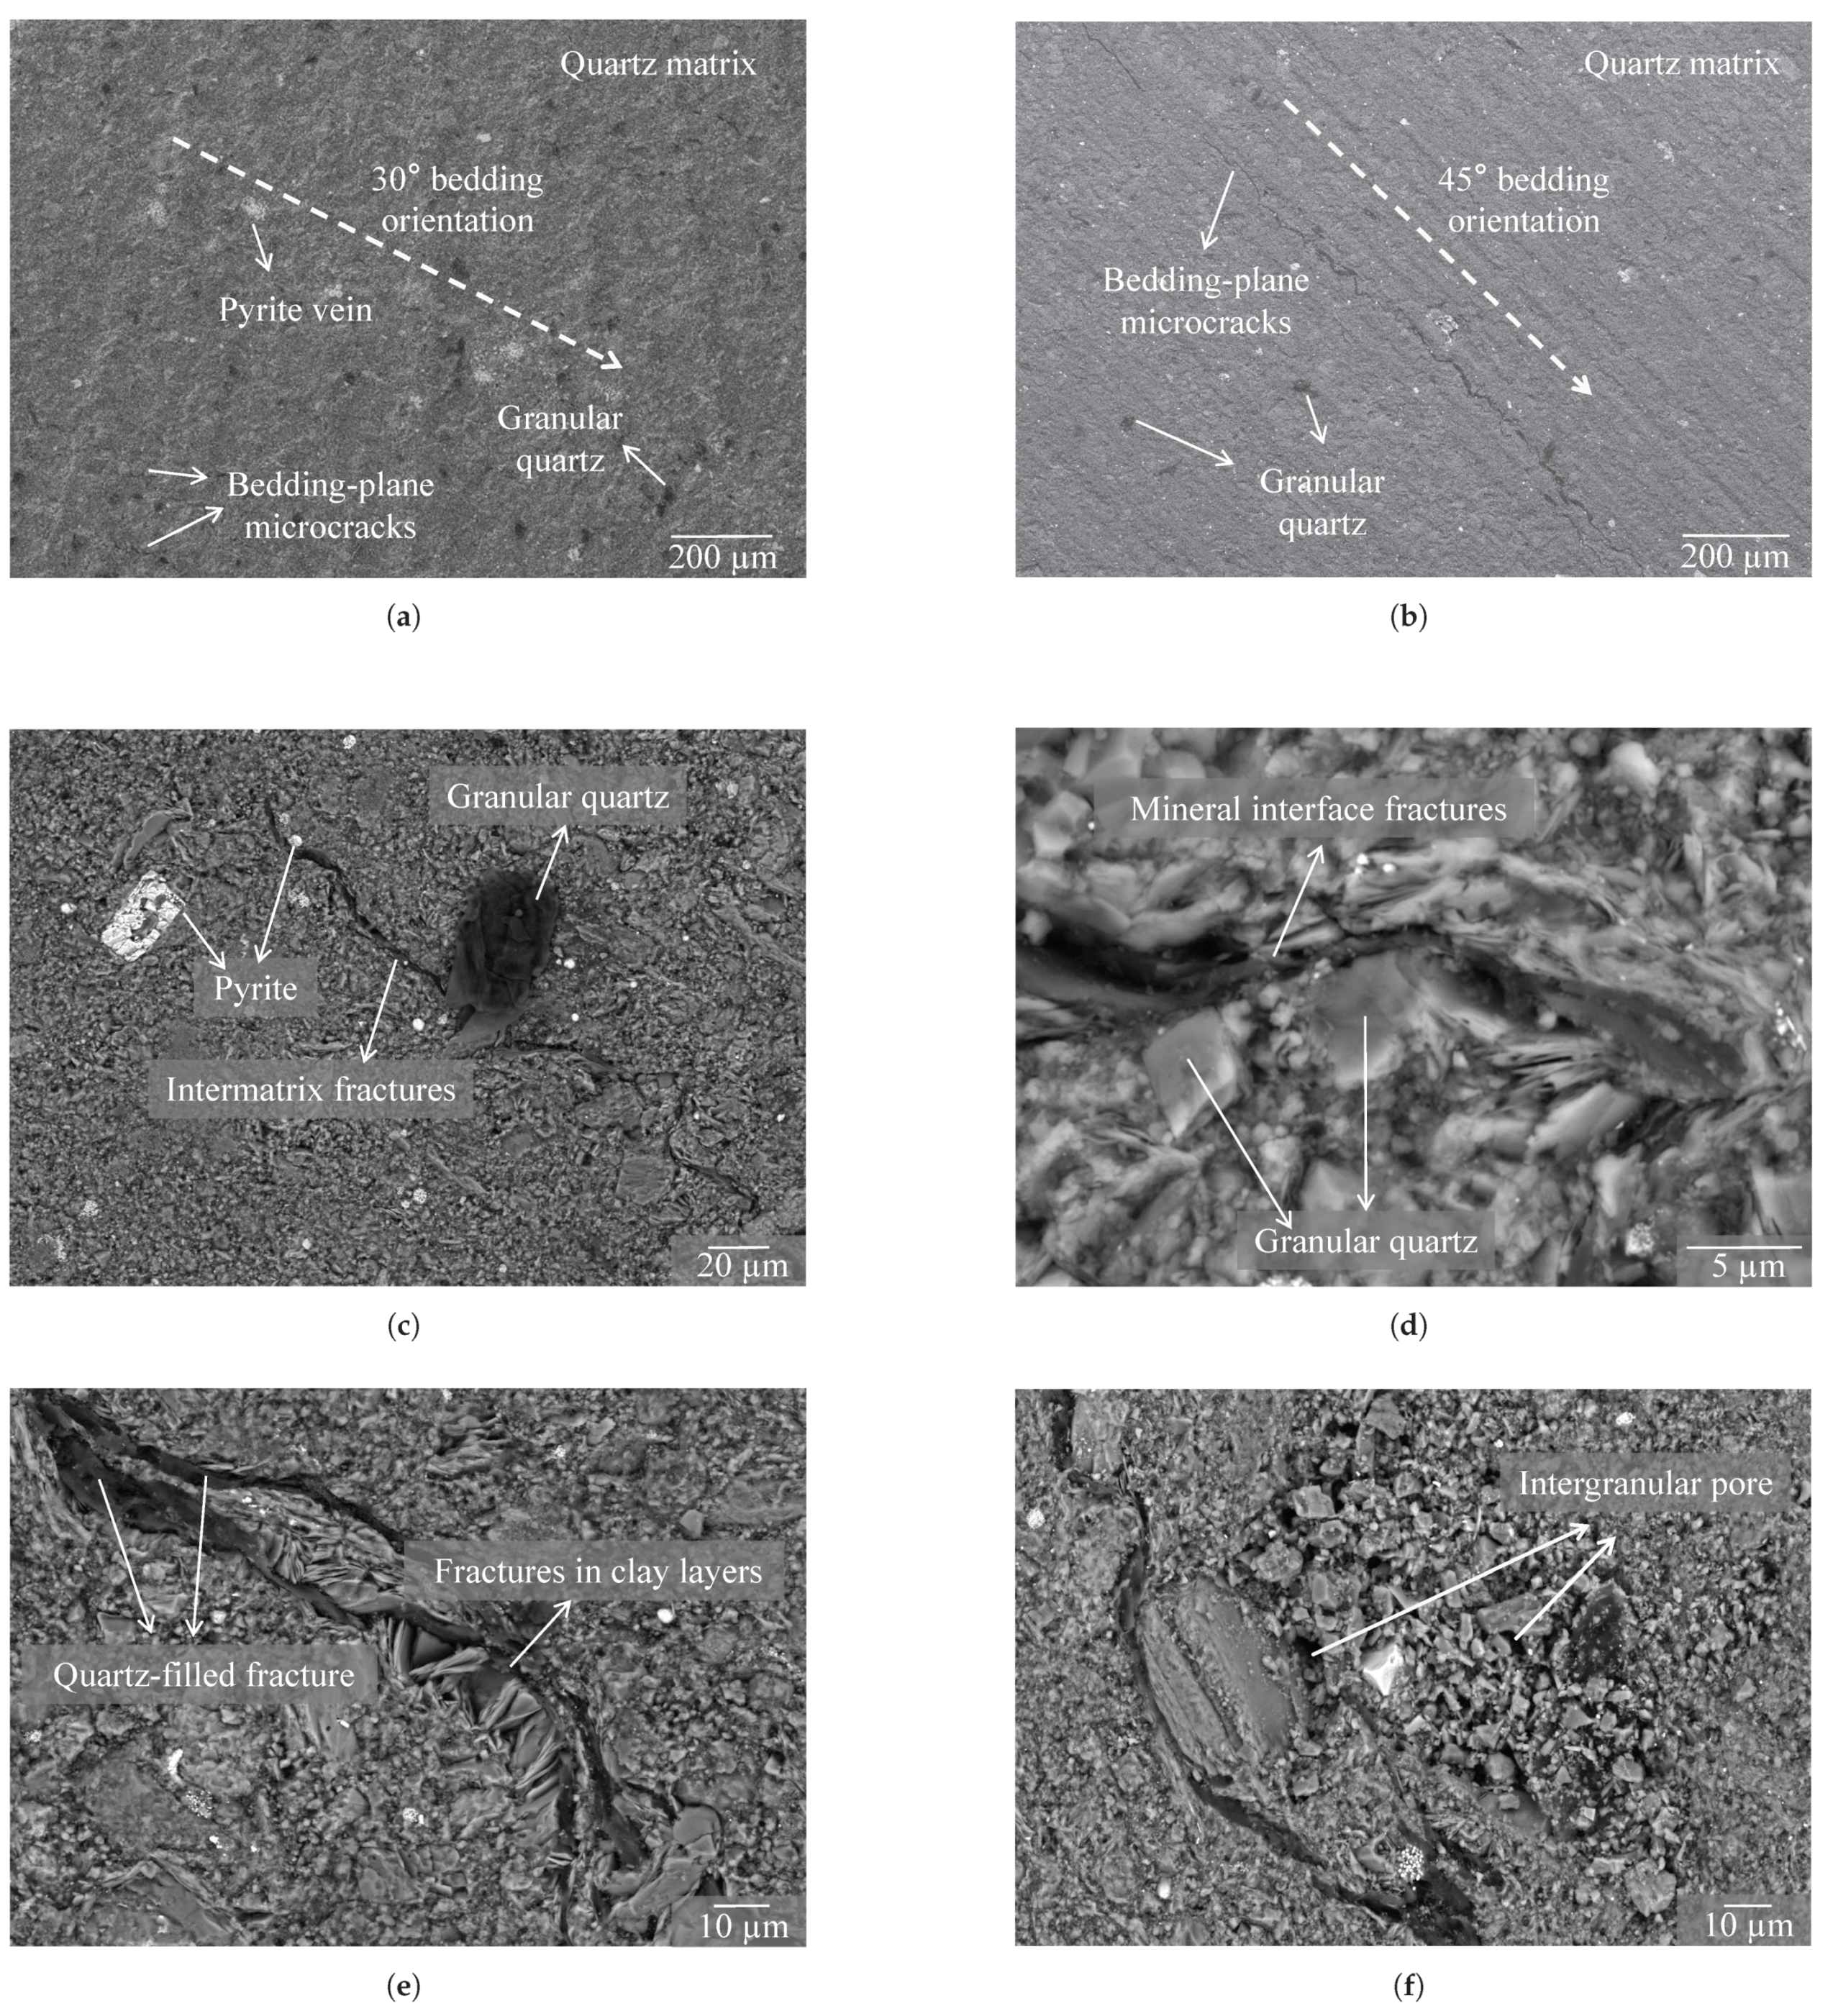
3.1. Microscopic Structure Analysis of Shale

Figure 6 shows that the shale exhibited a uniformly distributed bedding structure, as observed using a scanning electron microscope (SEM). Minerals such as pyrite, quartz, muscovite, and calcite were preferentially aligned along the bedding direction. Energy-dispersive spectroscopy (EDS) was used to map the elemental distribution of carbon (C), silicon (Si), calcium (Ca), magnesium (Mg), sulfur (S), and iron (Fe), with silicon and carbon being the most abundant elements. The EDS images revealed two distinct phases: a matrix composed of fine- and coarse-grained minerals and a bright white mineral phase. The matrix primarily consisted of fine-grained minerals rich in Si and C, while the larger particles were Fe-rich. These observations were consistent with the X-ray diffraction (XRD) results, indicating that the matrix was composed of 72.5% quartz and layered silicates. Pyrite was present in regions where Fe (orange) and S (yellow) signals overlapped.
Figure 7 shows that microfractures and pores were primarily distributed along the boundaries of layered minerals in the bedding direction, commonly found at the interfaces of rigid minerals (e.g., quartz and feldspar) or within mineral grains. The main fracture types included bedding plane fractures (Figure 7c) and mineral interface fractures (Figure 7d), ranging in size from 1 to 100 μm. Some fractures were filled with quartz, calcite, pyrite, and clay minerals (Figure 7d,e). Microfractures often exhibited fine-banded or zigzag bending patterns, with their development and extension closely related to the bedding angle. The quartz matrix provided a supporting framework for intergranular pores (Figure 7f).

3.2. Macroscopic Shear Anisotropic Mechanical Properties

3.2.1. Shear Stress–Shear Strain Curve

Figure 8 shows the typical shear stress–shear strain curves, illustrating the stress variations during the shear failure process of shale. The characteristic feature of shale shear failure was the appearance of a distinct peak in shear stress, followed by a residual phase, with all curves exhibiting a similar trend. However, under a normal stress of 10 MPa, the peak on the shear stress curve for shale with a 45 ° bedding angle was not prominent, while the curve for the 60 ° bedding angle exhibited a double-peak characteristic. At normal stresses of 15 MPa and 20 MPa, the shear stress curve for shale with a 90 ° bedding angle showed a more subdued peak. Moreover, under a normal stress of 20 MPa, the curve displayed significant fluctuations with increasing shear strain after reaching the peak.

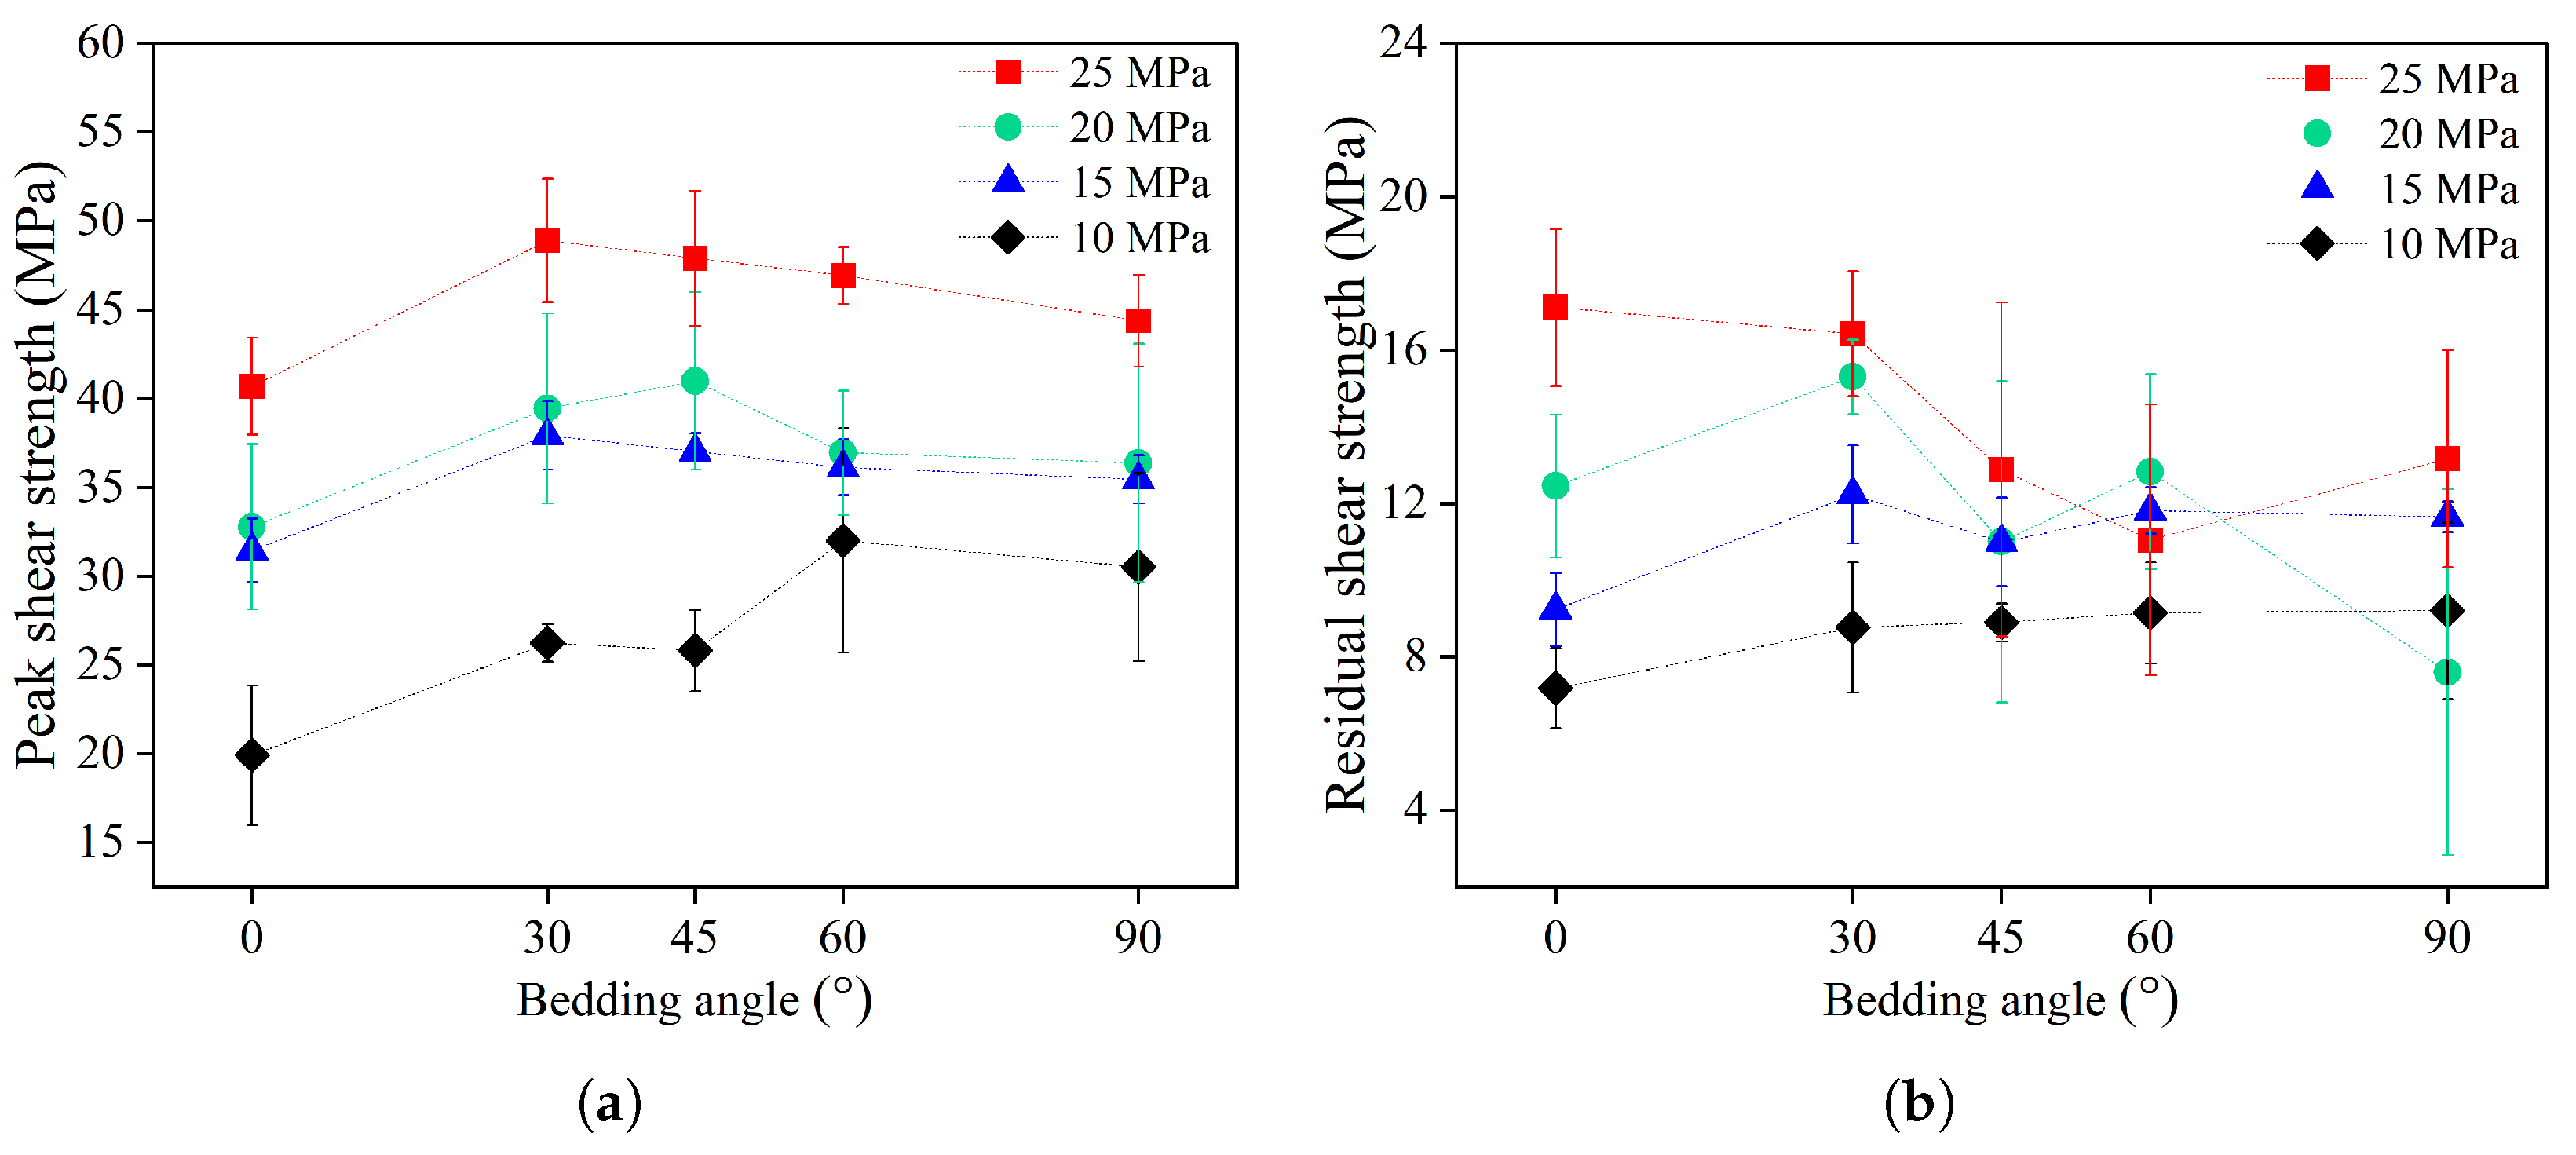
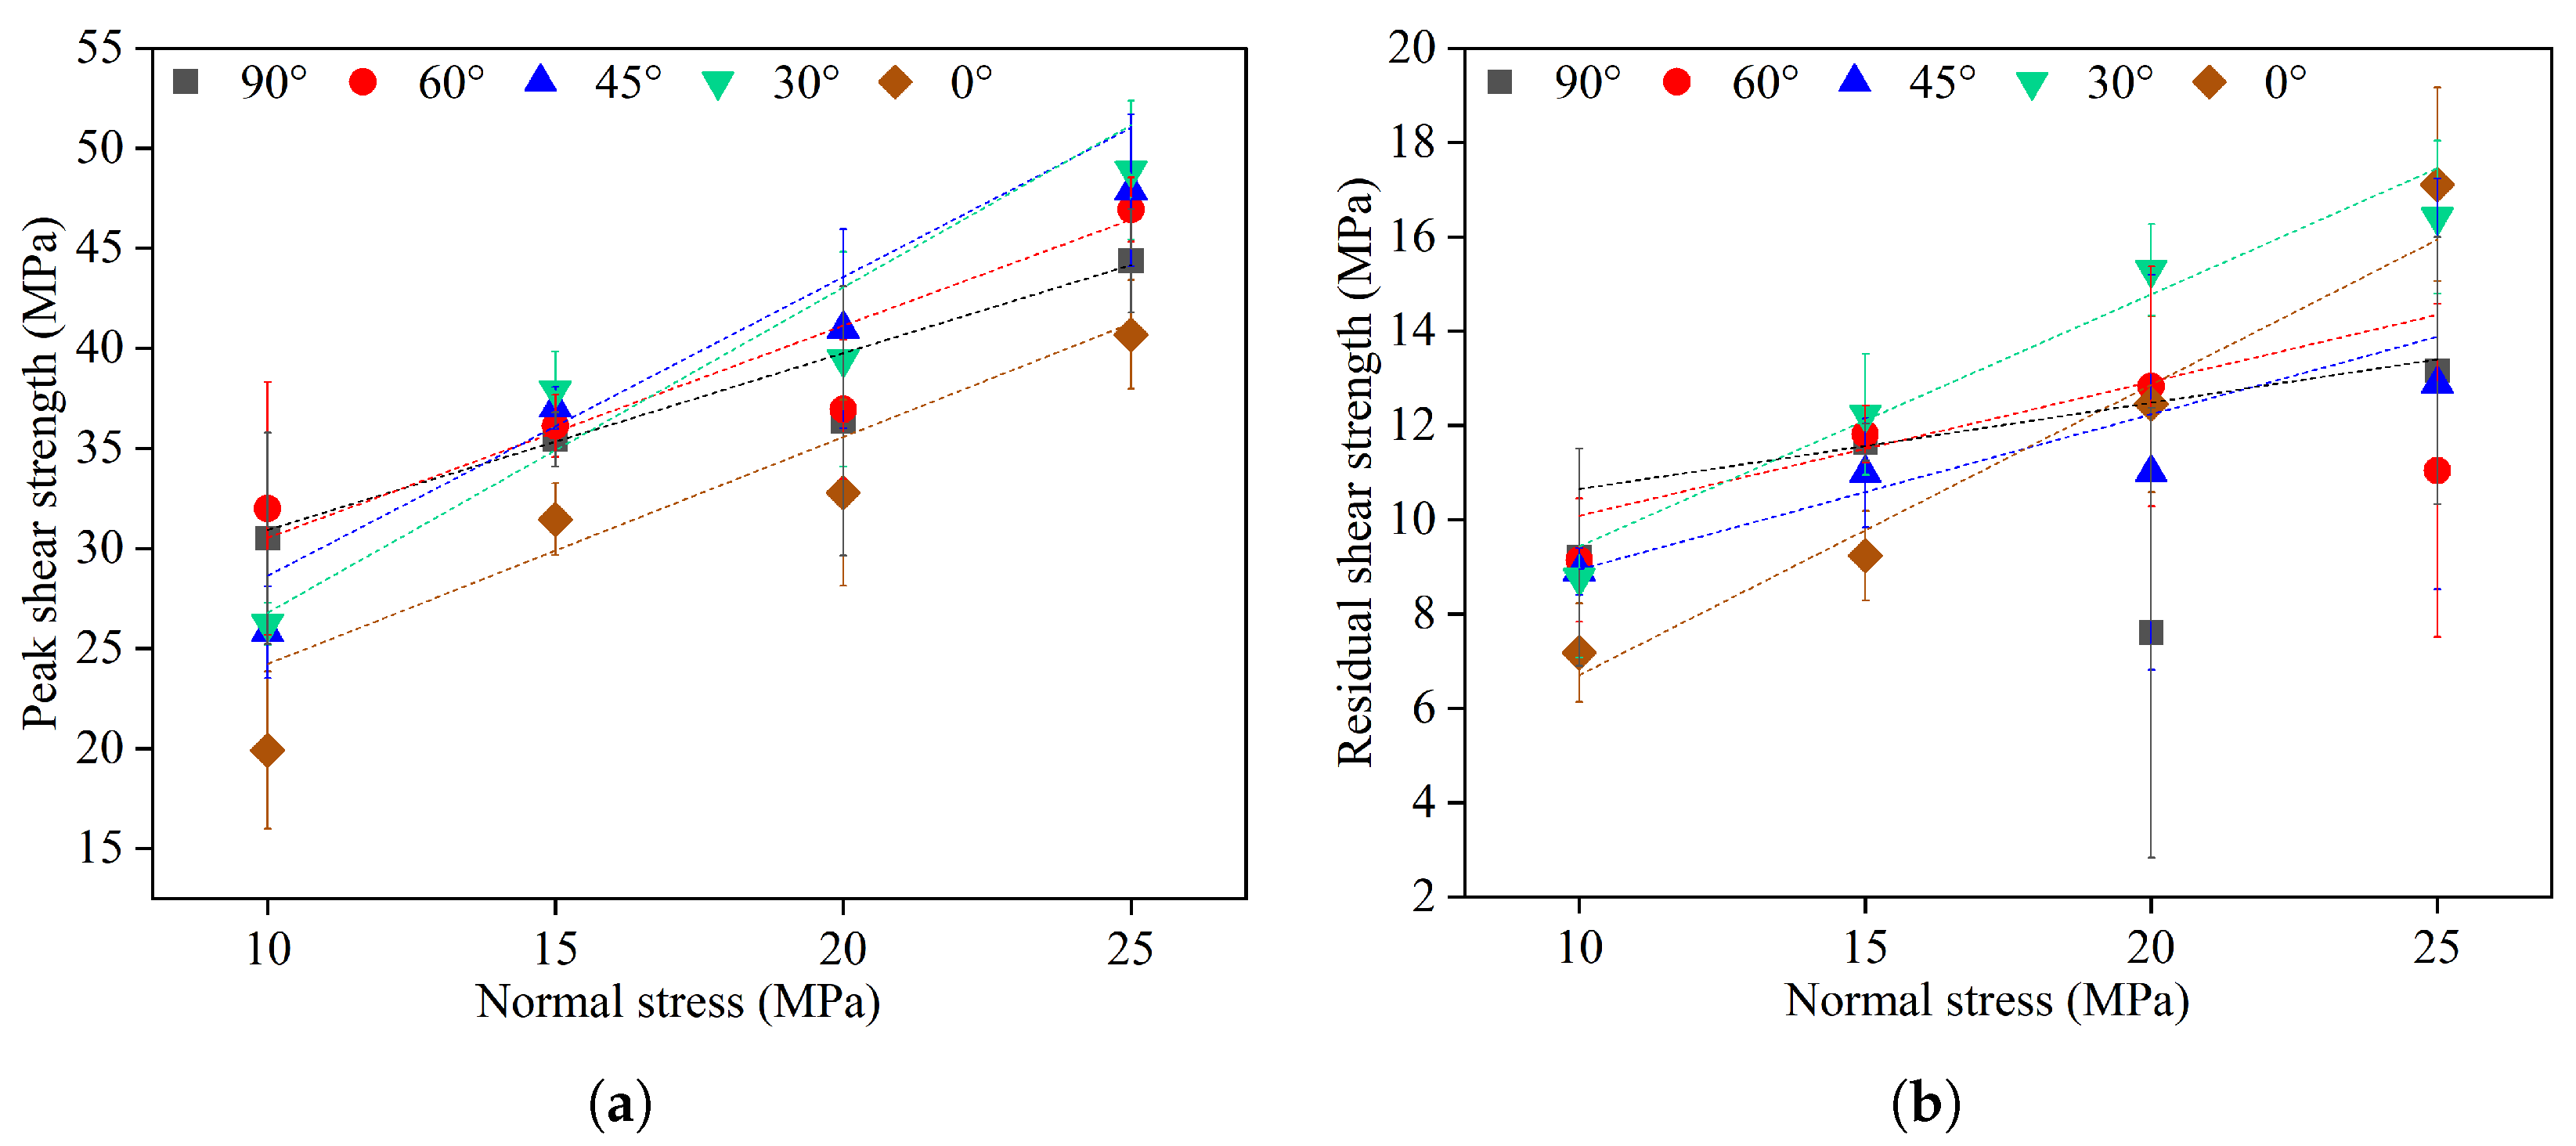
3.2.2. Macroscopic Shear Strength Parameters

The parameters for the 90° bedding orientation represented the shale matrix, while those for the 0° bedding orientation corresponded to the bedding plane [36]. The macroscopic shale peak shear strength parameters are shown in Table 1. The shale residual shear strength parameters are shown in Table 2.
Figure 9a shows that as the bedding angle increased, the influence of normal stress on the peak shear strength of shale weakened. Under different normal stresses, the peak shear strength of shale initially increased and then decreased with increasing bedding angle. When the normal stress was 10 MPa, the peak shear strength of shale fluctuated and increased with the bedding angle, with the 0° bedding orientation exhibiting the lowest strength. When the normal stress exceeded 10 MPa, the peak shear strength followed a trend of increasing first and then decreasing with the bedding angle. Under normal stresses of 15 MPa and 20 MPa, the strengths of shale samples with different bedding orientations were generally similar, except for the sample with a 45° bedding orientation. At all normal stress levels, higher peak shear strengths were primarily concentrated within the bedding angle range of 30° to 60°. Figure 9b illustrates that as the bedding angle increased, the residual shear strength of shale exhibited a nonlinear increasing trend under lower normal stresses, whereas, under higher normal stresses, it showed a fluctuating decreasing trend.
Figure 10 illustrates that as the normal stress increased, the peak and residual shear strengths of shale samples with different bedding angles exhibited a fluctuating increasing trend. As shown in Figure 10a, the magnitude of the increase in peak shear strength of shale specimens initially rose and subsequently declined with increasing normal stress. The magnitude of this increase reached its maximum for shale samples with a 45° bedding angle, whereas it was minimal for those with a 90° bedding angle. The peak shear strength was lowest under a normal stress of 10 MPa and reached its maximum under a normal stress of 25 MPa. At a normal stress of 10 MPa, the influence of bedding angle on the dispersion of peak shear strength was the strongest, while, at a normal stress of 15 MPa, this influence was the weakest. Figure 10b shows that the magnitude of increase in residual shear strength was greatest for shale specimens with a bedding orientation of 0°. Moreover, as the normal stress increased, the anisotropic effect of bedding orientation on the dispersion of residual shear strength in shale specimens became more pronounced.
Figure 11a illustrates that the peak and residual internal friction angles of the shale bedding planes were higher than those of the matrix, whereas the peak and residual cohesion values of the bedding planes were lower than those of the matrix. As the bedding angle increased, the internal friction angle corresponding to the peak shear strength of shale initially increased slightly and then decreased significantly, reaching its maximum at a bedding angle of 45° and its minimum at a bedding angle of 90°. The cohesion associated with both the peak and residual shear strength of shale exhibited a fluctuating upward trend, with the lowest value at a bedding angle of 0° and the highest at a bedding angle of 60°. When the bedding angle transitioned from 0° to 30° and from 90 ° to 60 ° , both the internal friction angle and cohesion of peak shear strength exhibited an increasing trend, with a larger increment observed in the former transition ( 0 ° to 30 ° ). At bedding angles of 30 ° and 45 ° , both parameters were relatively close, whereas, from 45 ° to 60 ° , the internal friction angle decreased sharply, and cohesion increased significantly, indicating the strongest anisotropic effect of bedding on peak shear strength. The internal friction angle of residual shear strength decreased with the increasing of the bedding angle, with the most significant reduction occurring at bedding angles from 30 ° to 45 ° , and a slight increase from 60 ° to 90 ° . Cohesion increased with an increase in the bedding angle, with the greatest increase observed at bedding angles between 30 ° and 45 ° , followed by a slight decrease from 60 ° to 90 ° . With increasing bedding angle, the anisotropic effect on the internal friction angle generally exhibited two plateau phases and one transition phase, whereas the anisotropic effect on cohesion presented two plateau phases and two transition phases. The impact of anisotropy on the internal friction angle was opposite to that of its impact on cohesion, with the latter having a stronger effect. The variation trends of internal friction angle and cohesion for peak and residual shear strength were generally similar with increasing bedding angle, except at a bedding angle of 45 ° , where the trends of peak and residual shear strength parameters diverged significantly.
Figure 12a shows that the anisotropic characteristics of the shale shear modulus varied under different normal stresses. When the normal stress was 10 MPa, the shear modulus of shale exhibited a fluctuating increasing trend with the bedding angle. However, when the normal stress exceeded 10 MPa, the shear modulus exhibited fluctuating variations within the shale bedding angle range of a 0 ° bedding angle to a 45 ° bedding angle and decreased nonlinearly within the range of a 45 ° bedding angle to a 90 ° bedding angle. The dispersion of peak shear modulus was highest for the 0 ° bedding angle, indicating the most significant anisotropy, whereas it was lowest for the 60 ° bedding angle, implying the weakest anisotropy. Figure 12b illustrates that as the normal stress increased, the shear modulus of shale generally exhibited a fluctuating, increasing trend. At normal stress of 10 MPa, the bedding orientation exhibited the greatest dispersion in shear modulus, indicating the strongest anisotropic effect. Conversely, at a normal stress of 15 MPa, the dispersion in shear modulus caused by bedding orientation was minimal, reflecting the weakest anisotropic effect.

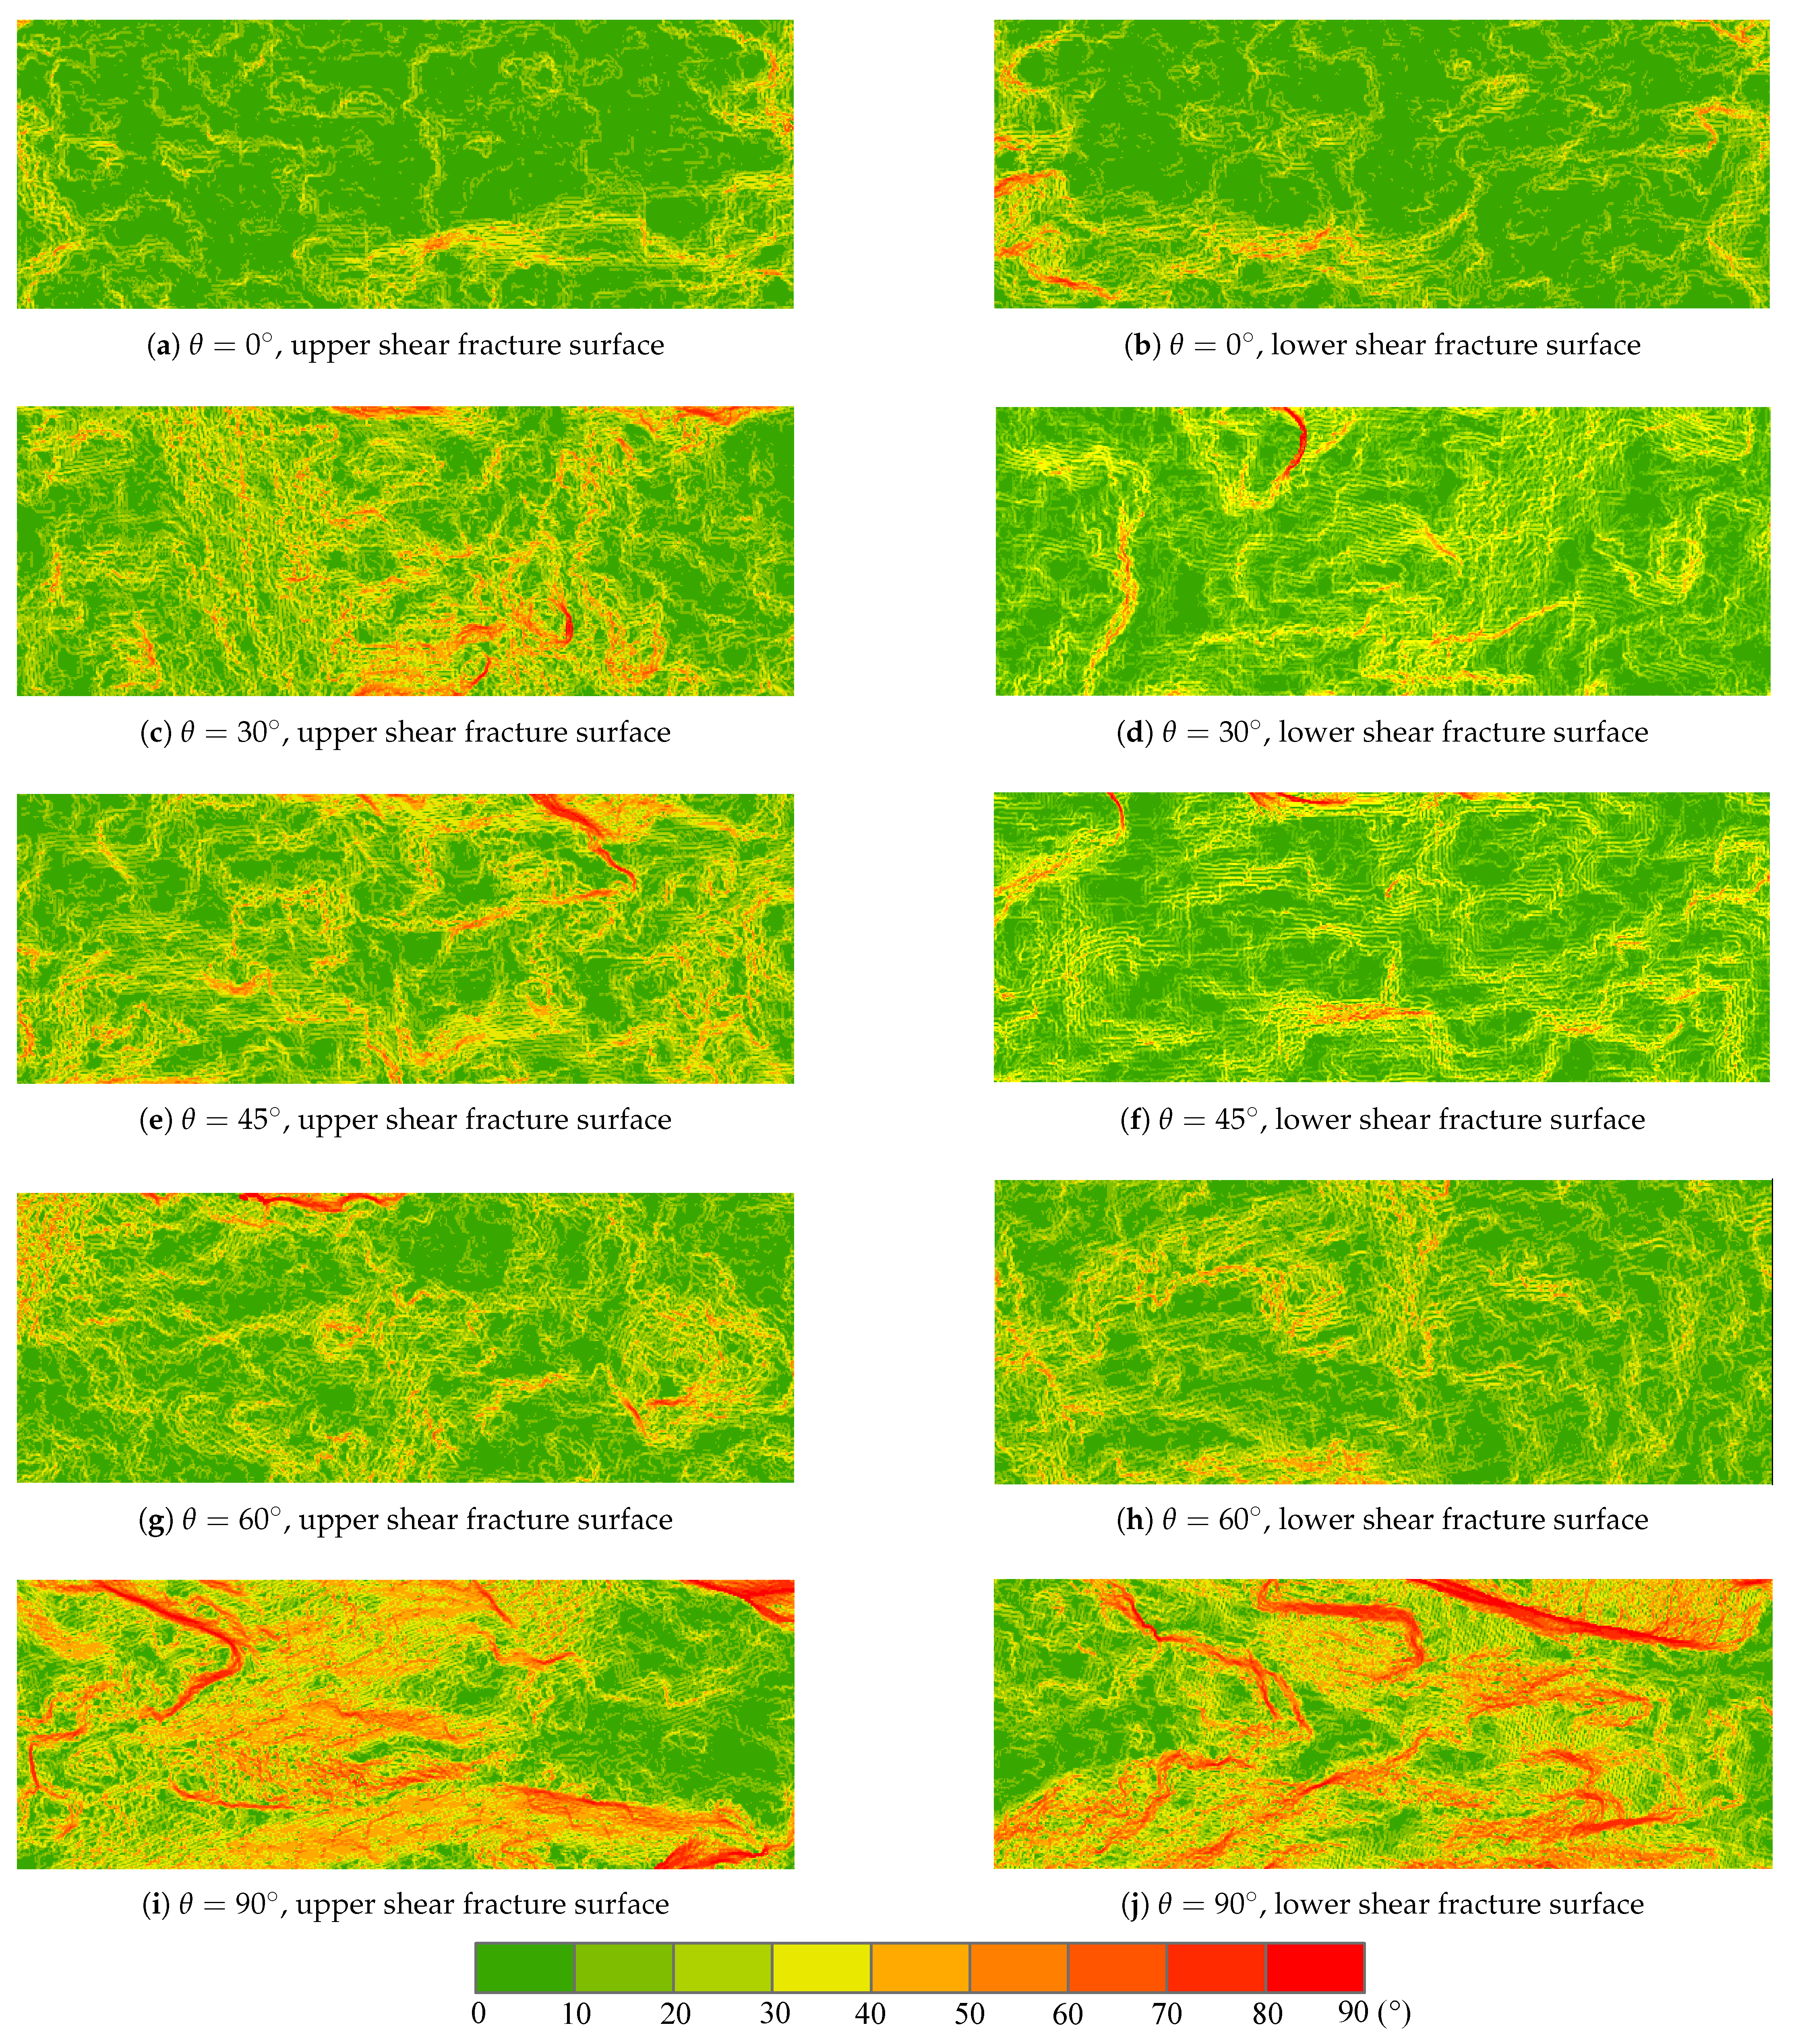
3.3. Shear Failure Patterns and Shear Fracture Surface Morphology

From the above analysis, it is evident that under a normal stress of 15 MPa, the influence of the bedding angle on the anisotropy of the peak shear strength and shear modulus was minimal. However, Figure 13 shows that the bedding angle still significantly affected the shear fracture morphology and fracture surface characteristics of shale. For the 0 ° bedding, shear fractures developed almost parallel to the bedding planes, resulting in a narrow fracture zone with a smooth surface. Unlike other orientations, fractures propagated along internal discontinuities associated with heterogeneous white pyrite layers (as shown by the whitish bedding planes in Figure 13a). In specimens with a bedding angle of 30 ° , 45 ° , and 60 ° , shear fractures initially formed parallel to bedding planes and then evolved into inclined cracks intersecting the bedding structure, resulting in broader fracture zones with rough, stepped surfaces. For the 90 ° bedding angle, shear failure predominantly occurred within the matrix, interacting intensively with the bedding structure, thus generating the widest fracture zone with the greatest surface roughness.
To facilitate the quantitative statistical analysis of the morphological parameters of the upper and lower shear fracture surfaces, the shear directions of both surfaces were aligned consistently. As shown in Figure 14, under normal stress of 15 MPa, all upper and lower shear fracture surfaces exhibited deepened edge color variations, indicating significant height changes and the detachment of small fragments after shearing. For the shale specimen with a 0 ° bedding angle, the height of the fracture surface was uniformly distributed. As the bedding angle increased, the height distribution became more irregular. The inclination of all structural surfaces varied significantly with the bedding angle (Figure 15). For shale specimens with a 0 ° bedding angle, the inclination distribution of the upper and lower shear fracture surfaces remained relatively uniform. However, with the increasing of the bedding angle, the inclination patterns gradually aggregated into distinct bands. The main inclination of the upper shear fracture surface shifted from the southwest and southeast directions to the northwest and northeast (The shear direction is the eastward inclination.), while that of the lower shear fracture surface shifts from the northwest and northeast to the southwest and southeast. For shale with a 0 ° bedding angle, the slope distribution was uniform. (Figure 16). As the bedding angle increased, the fracture surface gradually developed a stepped and banded morphology. The sample with a 0 ° bedding angle exhibited high-slope features concentrated at the edges with a relatively smooth center, whereas the sample with a 90 ° bedding angle showed high-slope features concentrated in the center.
Previous research has shown that morphological differences between the along-shear and opposite-shear surfaces of structural planes influence the anisotropic mechanical behavior of rock masses under dynamic cyclic shear conditions [45]. The 3D morphology parameters quantitatively characterize the roughness evolution and anisotropy of shear fracture surfaces [46]. As illustrated in Figure 17, under normal stress of 15 MPa, the bedding angle significantly affected the parameters of the leading surfaces on both the upper and lower shear fracture surfaces. As the bedding angle increased, an observation of the upper shear fracture surface revealed that the maximum height difference parameter of the along-shear surface increased with the bedding angle. The JRC 3 D parameter increased within the bedding angle range of 0° to 30°, then decreased from 30° to 60°, and subsequently increased again at 90°, reaching its peak value. For the lower shear fracture surface, the maximum height difference of the along-shear surface first increased, then decreased, and subsequently increased again with increasing bedding angle. When the bedding angle reached 90 ° , the maximum height difference of the along-shear surface attained its highest value. The JRC 3 D parameter initially increased with the bedding angle, then decreased, reaching its maximum at a bedding angle of 30 ° . A comparison of the differences in the maximum height difference of the along-shear surface and the JRC 3 D parameter between the upper and lower shear fracture surfaces indicated that these differences reached their maximum at a bedding angle of 90 ° and their minimum at 0 ° . This suggests that the bedding angle had a significant influence on the anisotropy of the morphological characteristics of the upper and lower shear fracture surfaces in shale. Overall, for the along-shear surface, the anisotropic influence of bedding on fracture surface morphology increased, then decreased, and increased again, reaching its maximum at a bedding angle of 90 ° . Furthermore, the roughness difference between the upper and lower shear fracture surfaces increased with the bedding angle, indicating that the degree of anisotropy in the roughness difference between the two surfaces intensified as the bedding angle increased.

3.4. Mesoscopic Shear Anisotropic Mechanical Properties

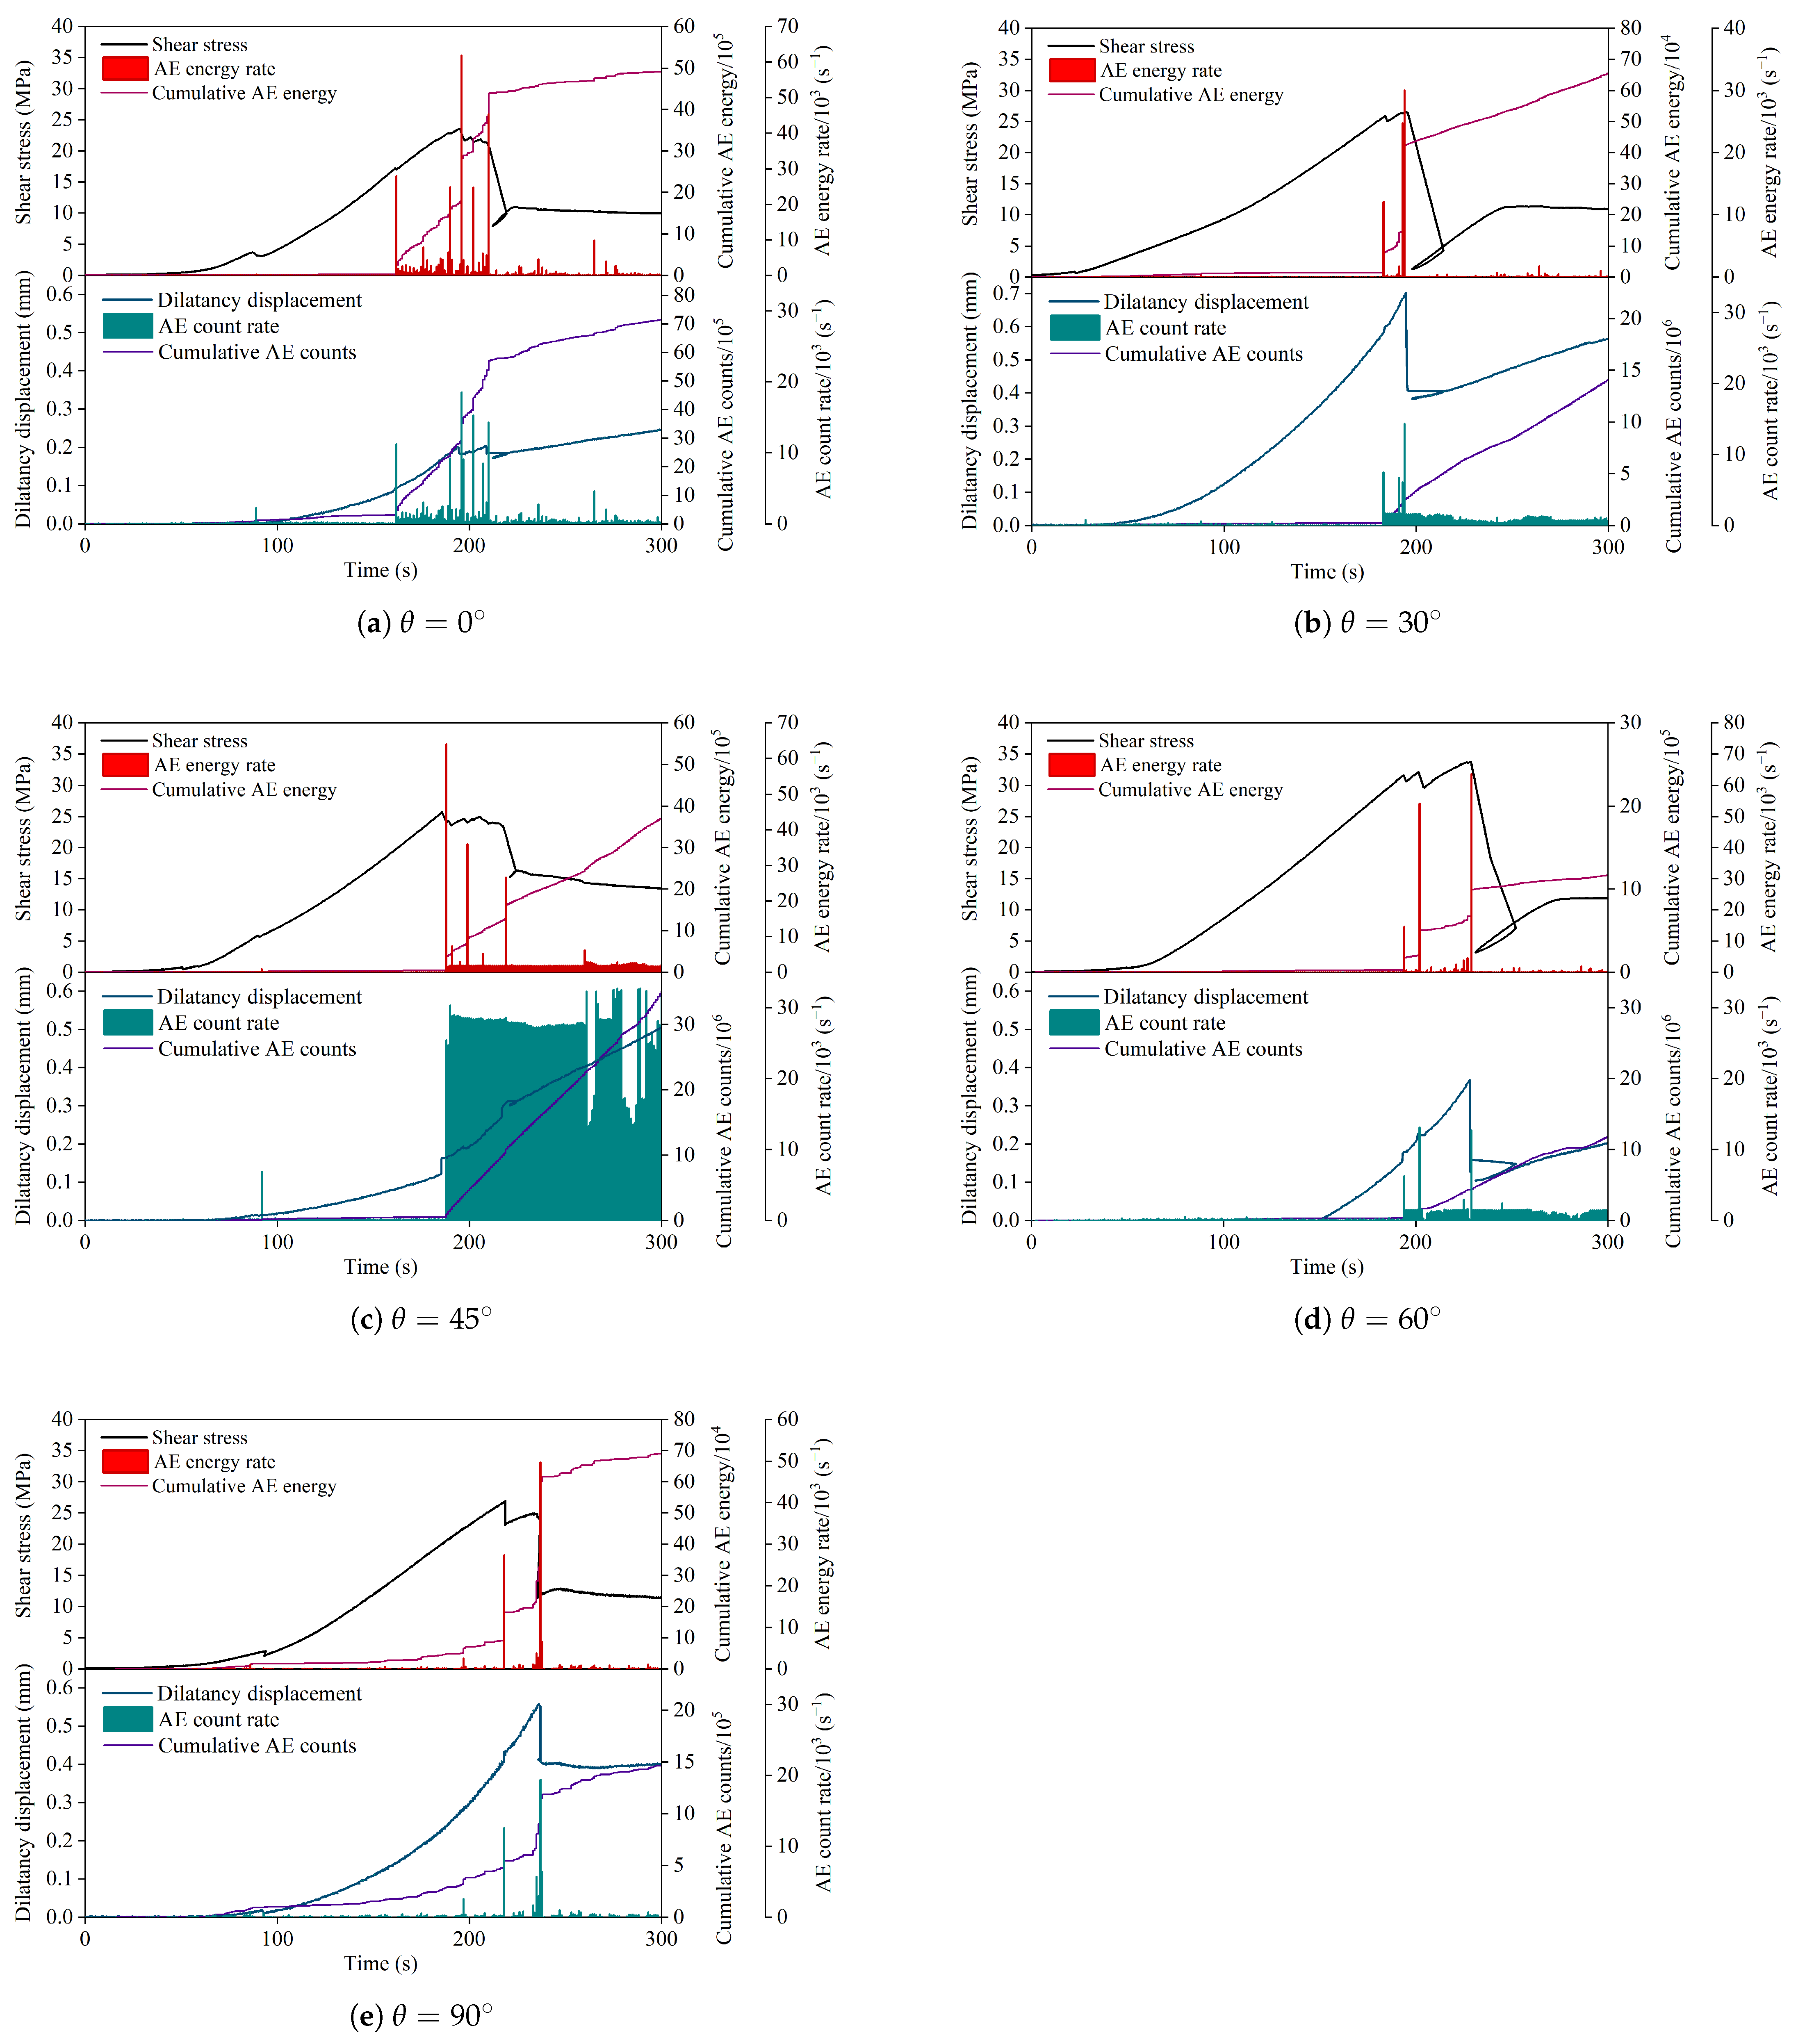
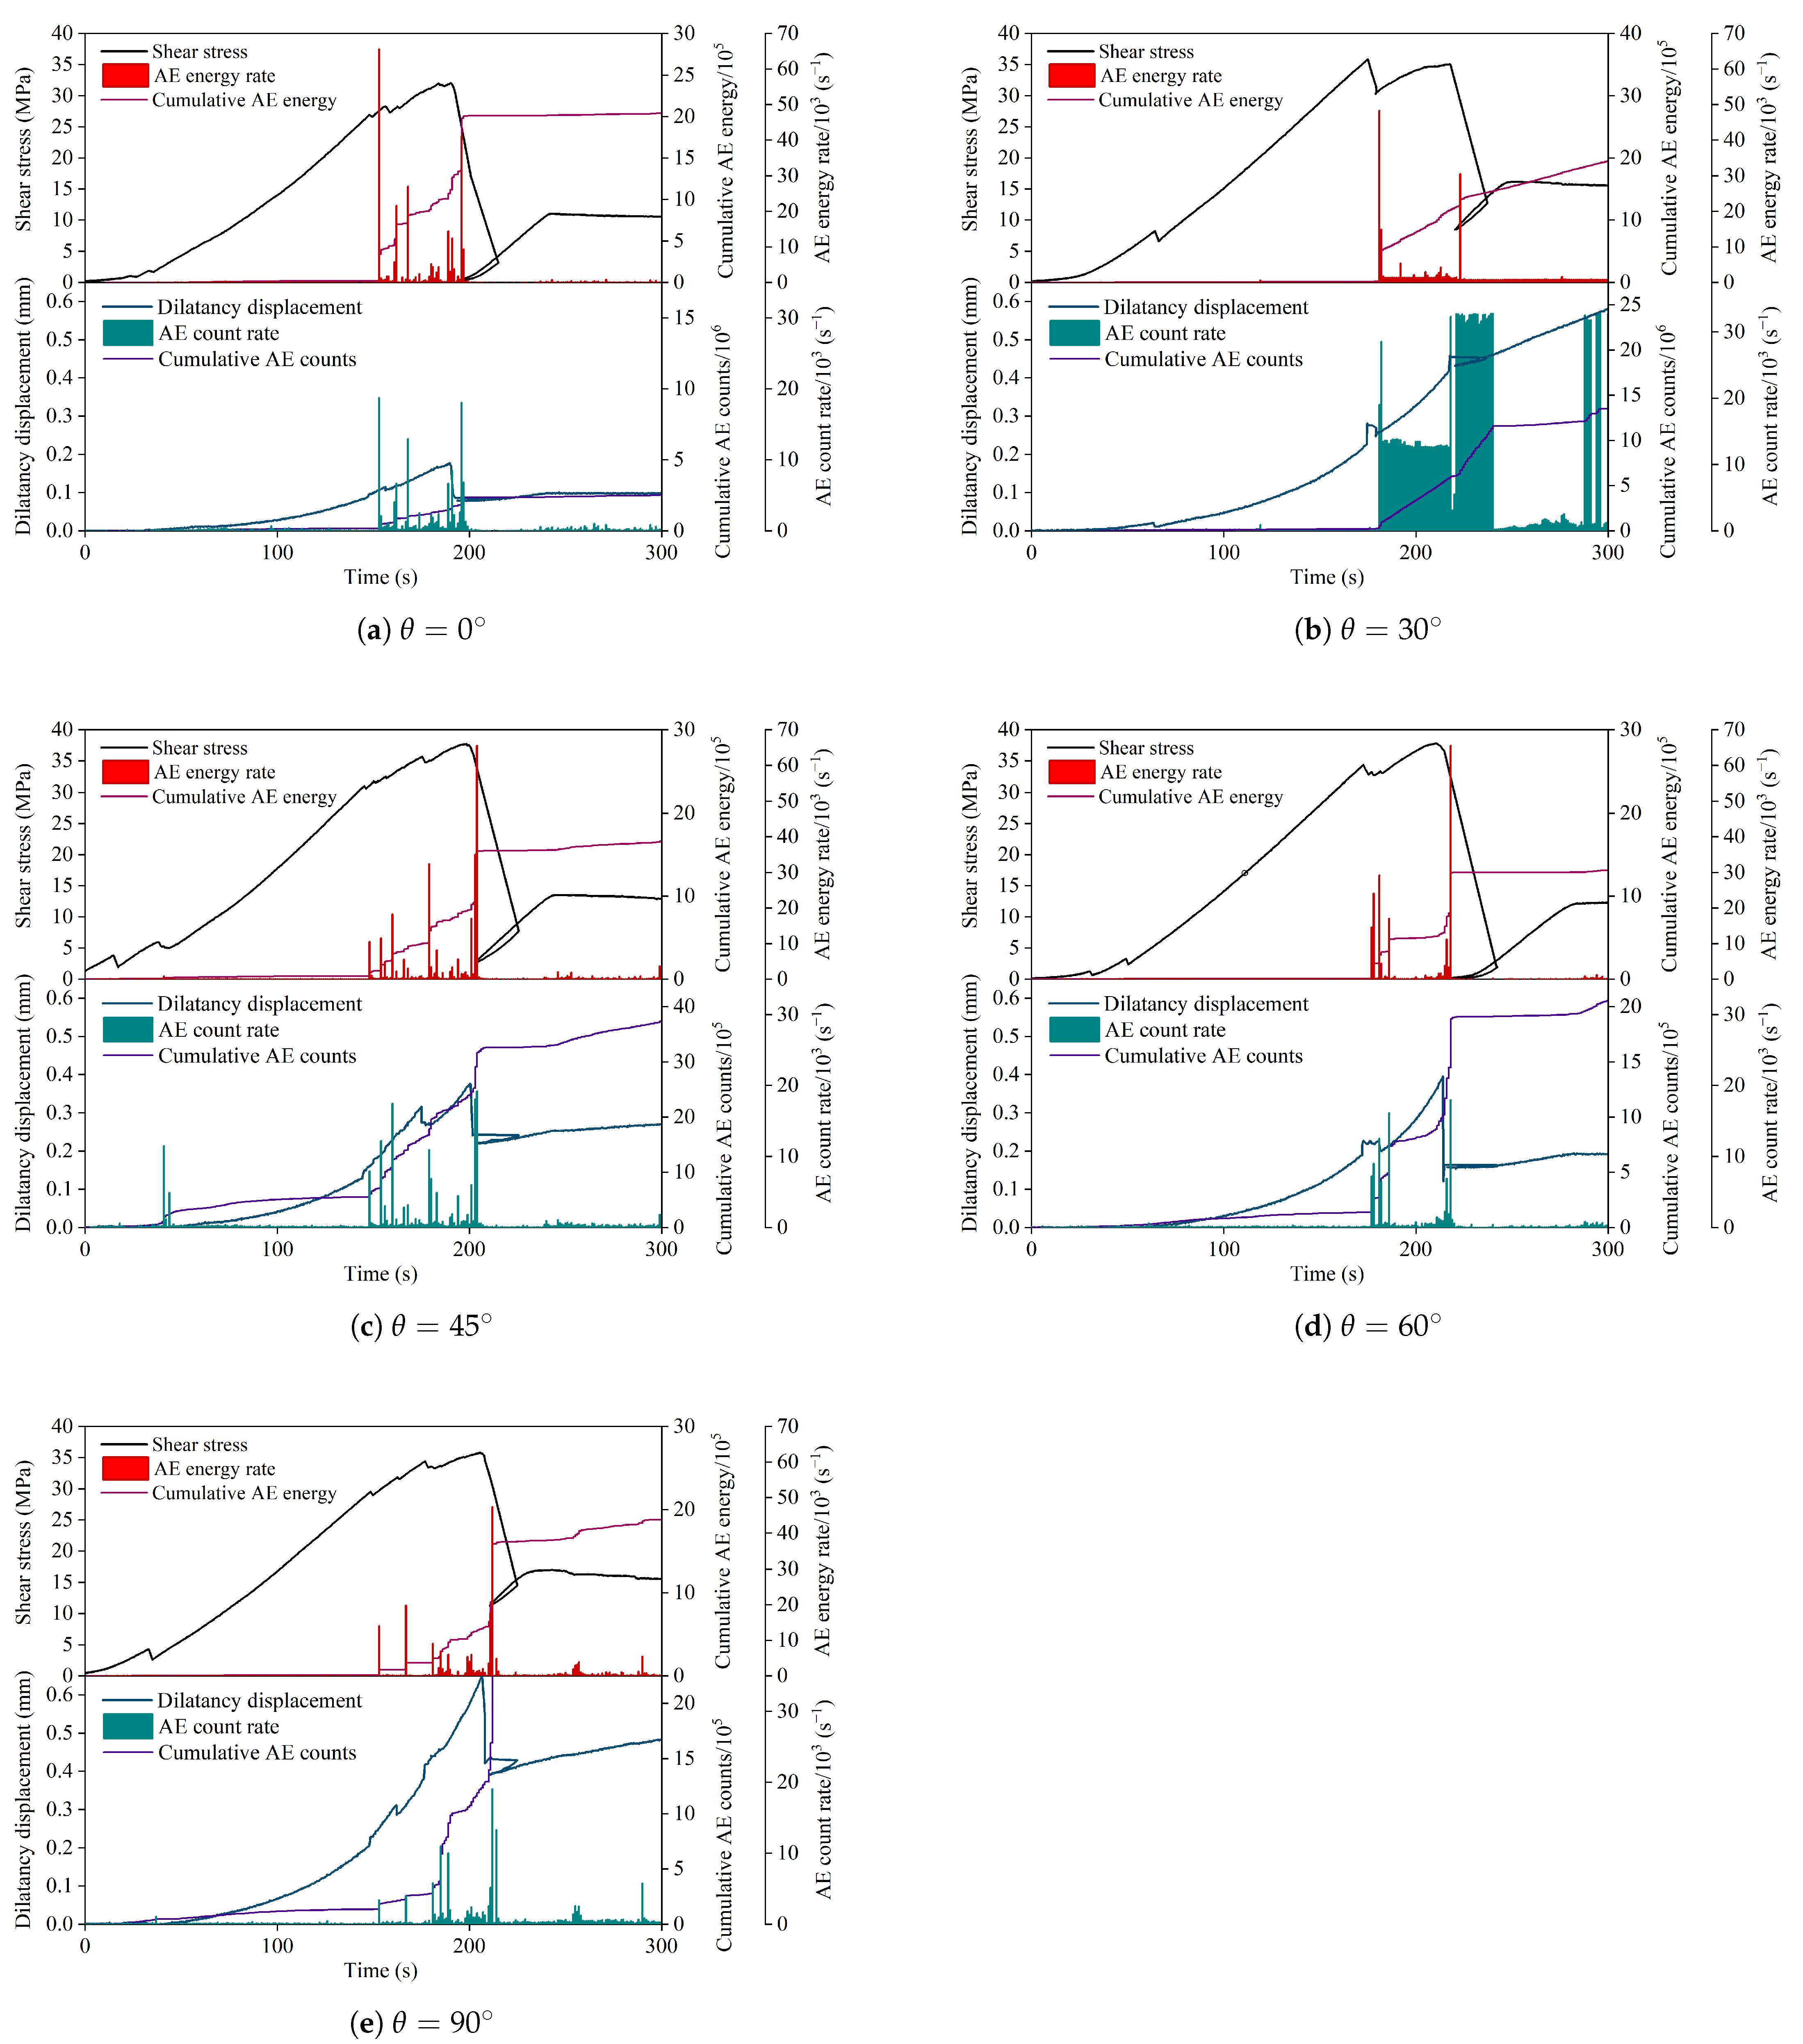
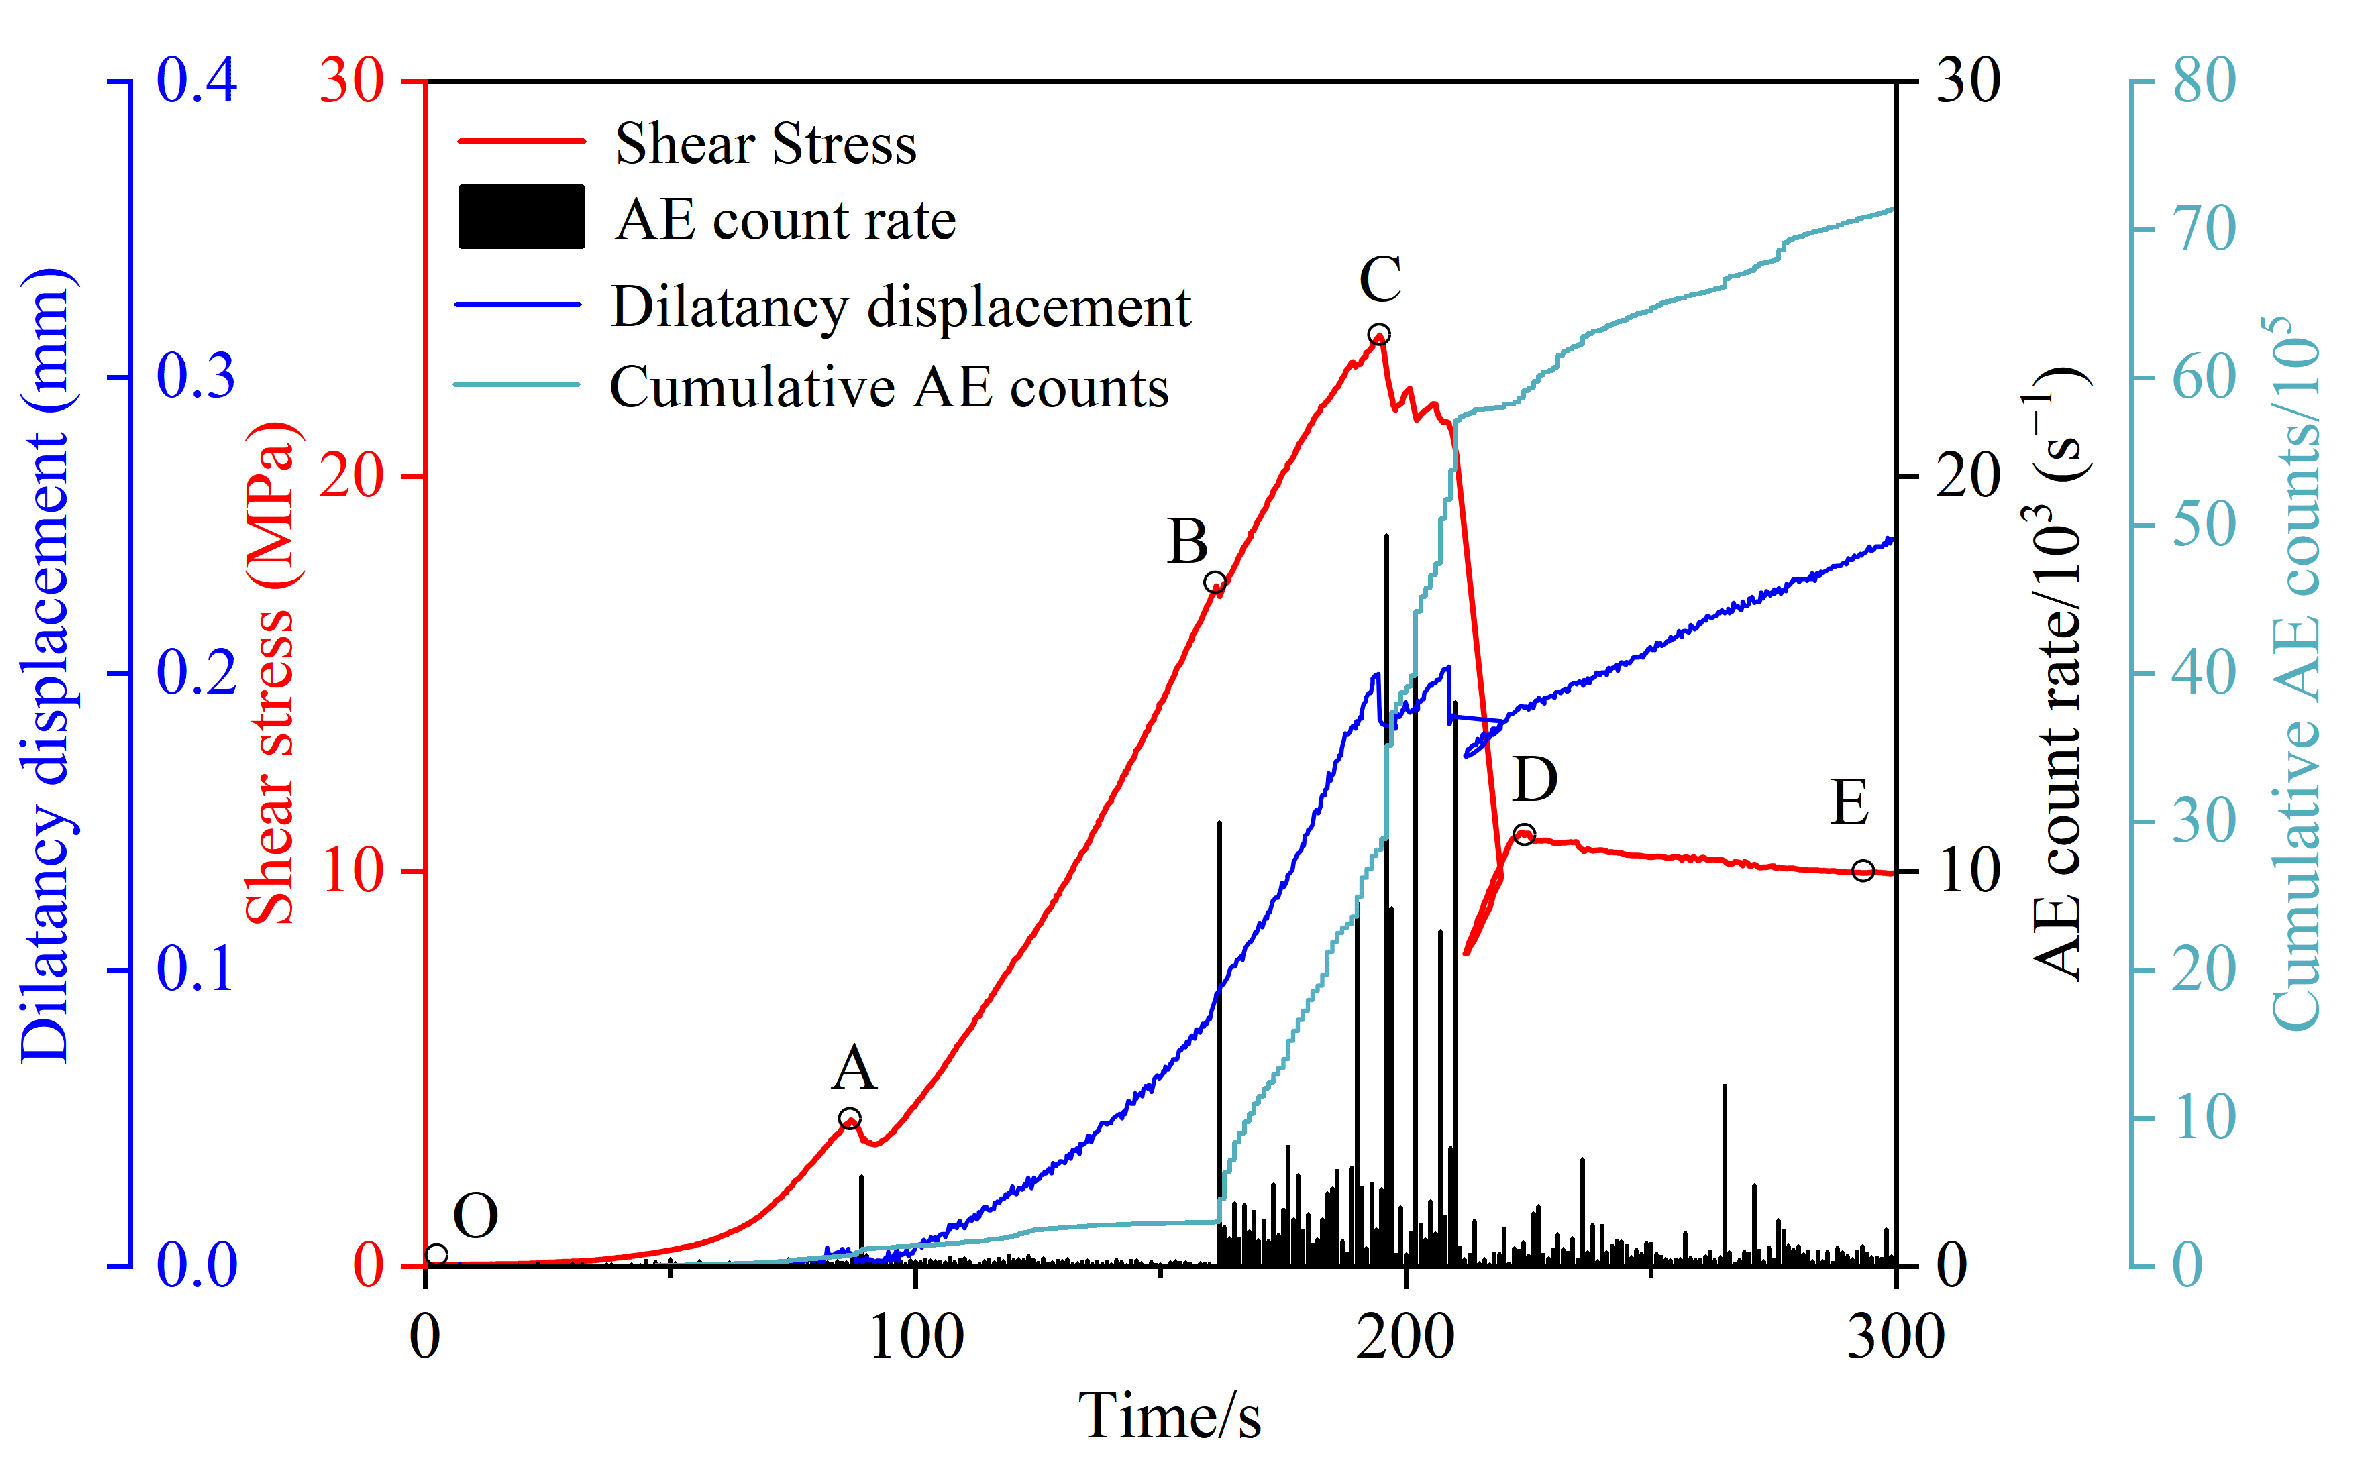
3.4.1. Mesoscopic Characterization of the Progressive Shear Failure Process

Previous studies have demonstrated that the acoustic emission (AE) ring count serves as a state parameter for characterizing internal damage in rock specimens, while its cumulative value quantifies the extent of accumulated damage. Acoustic emission (AE) energy reflects the elastic energy released during fracture nucleation and propagation in shale shear failure [27,28,47,48]. When applied stress surpasses a critical threshold, shear dilation becomes closely linked to the initiation and evolution of microcracks [49]. In direct shear tests, upward normal displacement is defined as shear dilation deformation [50]. As shown in Figure 10, when the normal stress is 10 MPa and 15 MPa, the influence of bedding angle on the peak shear strength parameters of shale is at its strongest and weakest, respectively. Therefore, direct shear tests on shale with different bedding angles under normal stresses of 10 MPa and 15 MPa were selected for analysis of shear stress, shear dilation deformation, and AE activity parameters, as illustrated in Figure 18 and Figure 19. This study investigated the damage evolution mechanisms of shale shear failure from a mesoscopic perspective.
Based on the variations in shear stress, shear dilation deformation, and acoustic emission (AE) parameters over time, the progressive failure process of shale under shear loading can be divided into five stages: crack compaction (OA), crack initiation (AB), crack propagation (BC), crack coalescence (CD), and residual friction stage (DE), as shown in Figure 20.
OA Stage: In the initial loading phase, the shale is primarily subjected to normal stress, leading to the compaction of pores and microcracks. At this stage, shear dilation deformation is almost negligible, and the frequency and count of AE ring signals remain low.
AB Stage: As shear stress increases, the shale experiences the combined effects of normal and shear stress. With the onset of shear dilation deformation, the AE ring count initially surges and then rapidly decreases. The frequency of the AE ring count increases, but the AE ring count remains low. The cumulative AE ring count curve exhibits a slow upward trend with a gradually decreasing slope, while the rate of shear dilation deformation increases. Since the frequency and count of AE rings remain stable, the microcracks inside the shale enter the initiation stage.
BC Stage: With a further increase in shear stress, shear dilation deformation grows almost linearly and rapidly. The frequency of the AE ring count rises significantly, and the AE ring count is noticeably higher than in the previous stage. The cumulative AE ring count curve steepens compared to the previous stage and, due to multiple peaks in AE ring counts, local jumps appear in the curve. As AE ring counts fluctuate significantly over time with strong randomness and discreteness, the microcracks inside the shale transition into the propagation stage. When the normal stress reaches point C, shear stress reaches its peak, and, for most samples, shear dilation deformation also attains its maximum.
CD Stage: Shear stress rapidly decreases, entering the post-peak drop stage. For most samples, shear dilation deformation decreases suddenly and then continues to increase at a smaller slope than in the previous stage. AE ring counts rapidly increase within a short period, reaching their maximum, and the cumulative AE ring count curve exhibits a jump. At this moment, microcracks inside the shale coalesce, forming a macroscopic shear fracture surface. Subsequently, the frequency of AE ringing occurrences and the AE ringing count decrease rapidly, while the cumulative AE ringing count curve markedly flattens and rises with a smaller slope compared to the previous stage.
DE Stage: Shear stress stabilizes, marking the transition into the residual shear stage, where shear dilation deformation continues to increase at a slower rate. As shear slip occurs along the fracture surface, new microcracks form in the shale sample, causing a slight increase in AE ring count frequency and AE ring count. Due to local peaks in AE ring counts, the cumulative AE ring count curve still exhibits occasional jumps but rises at a smaller slope than in the previous stage.

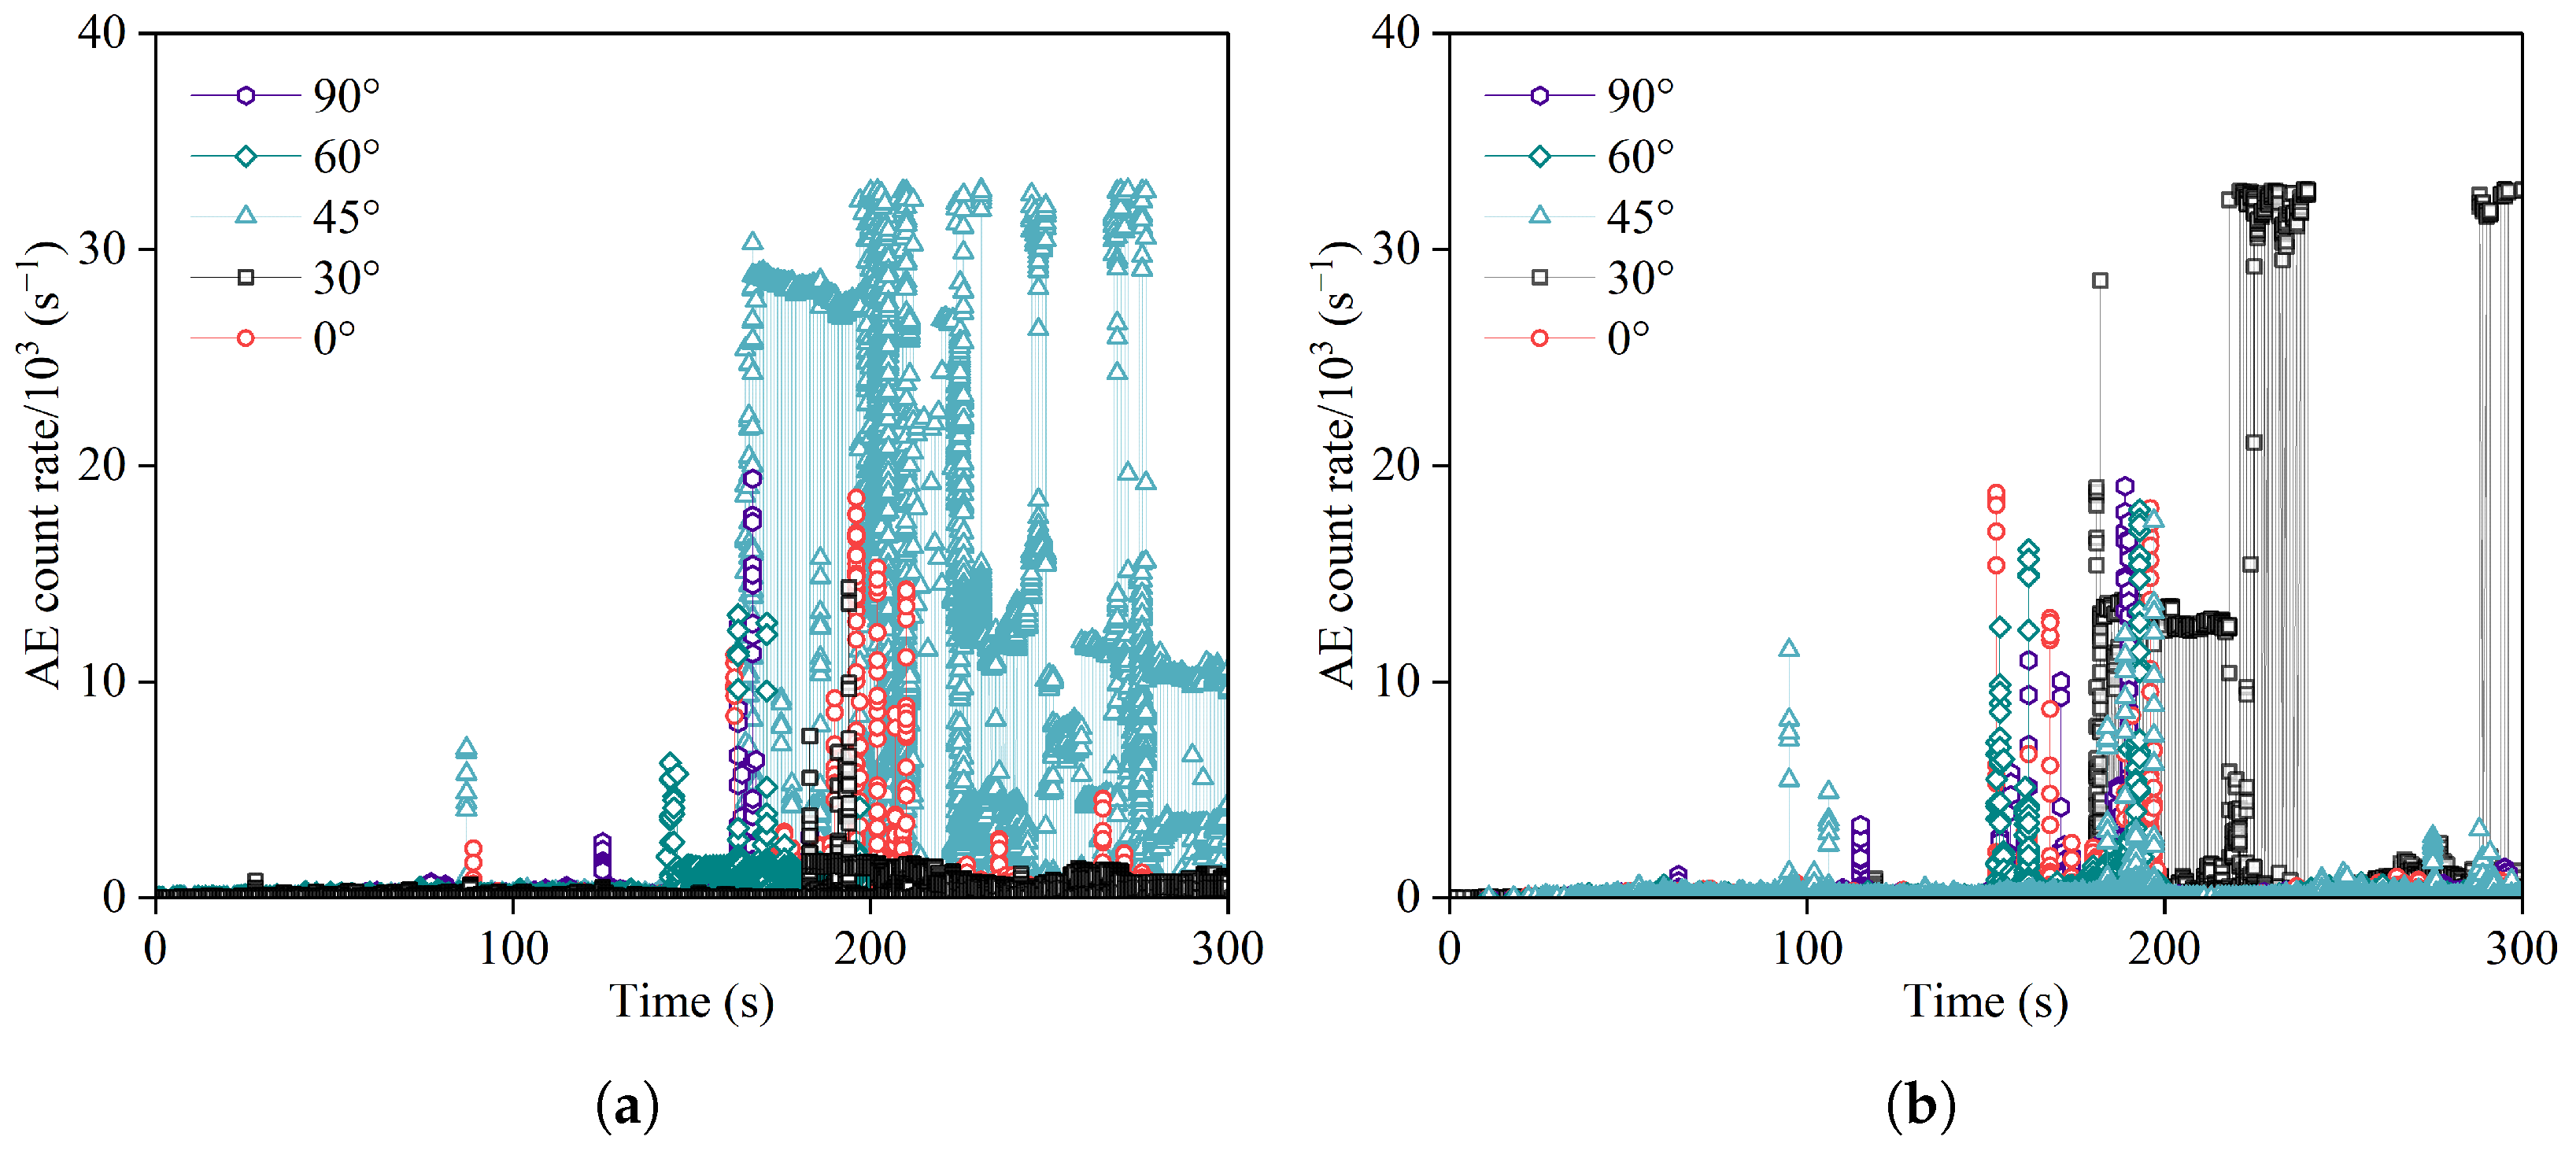
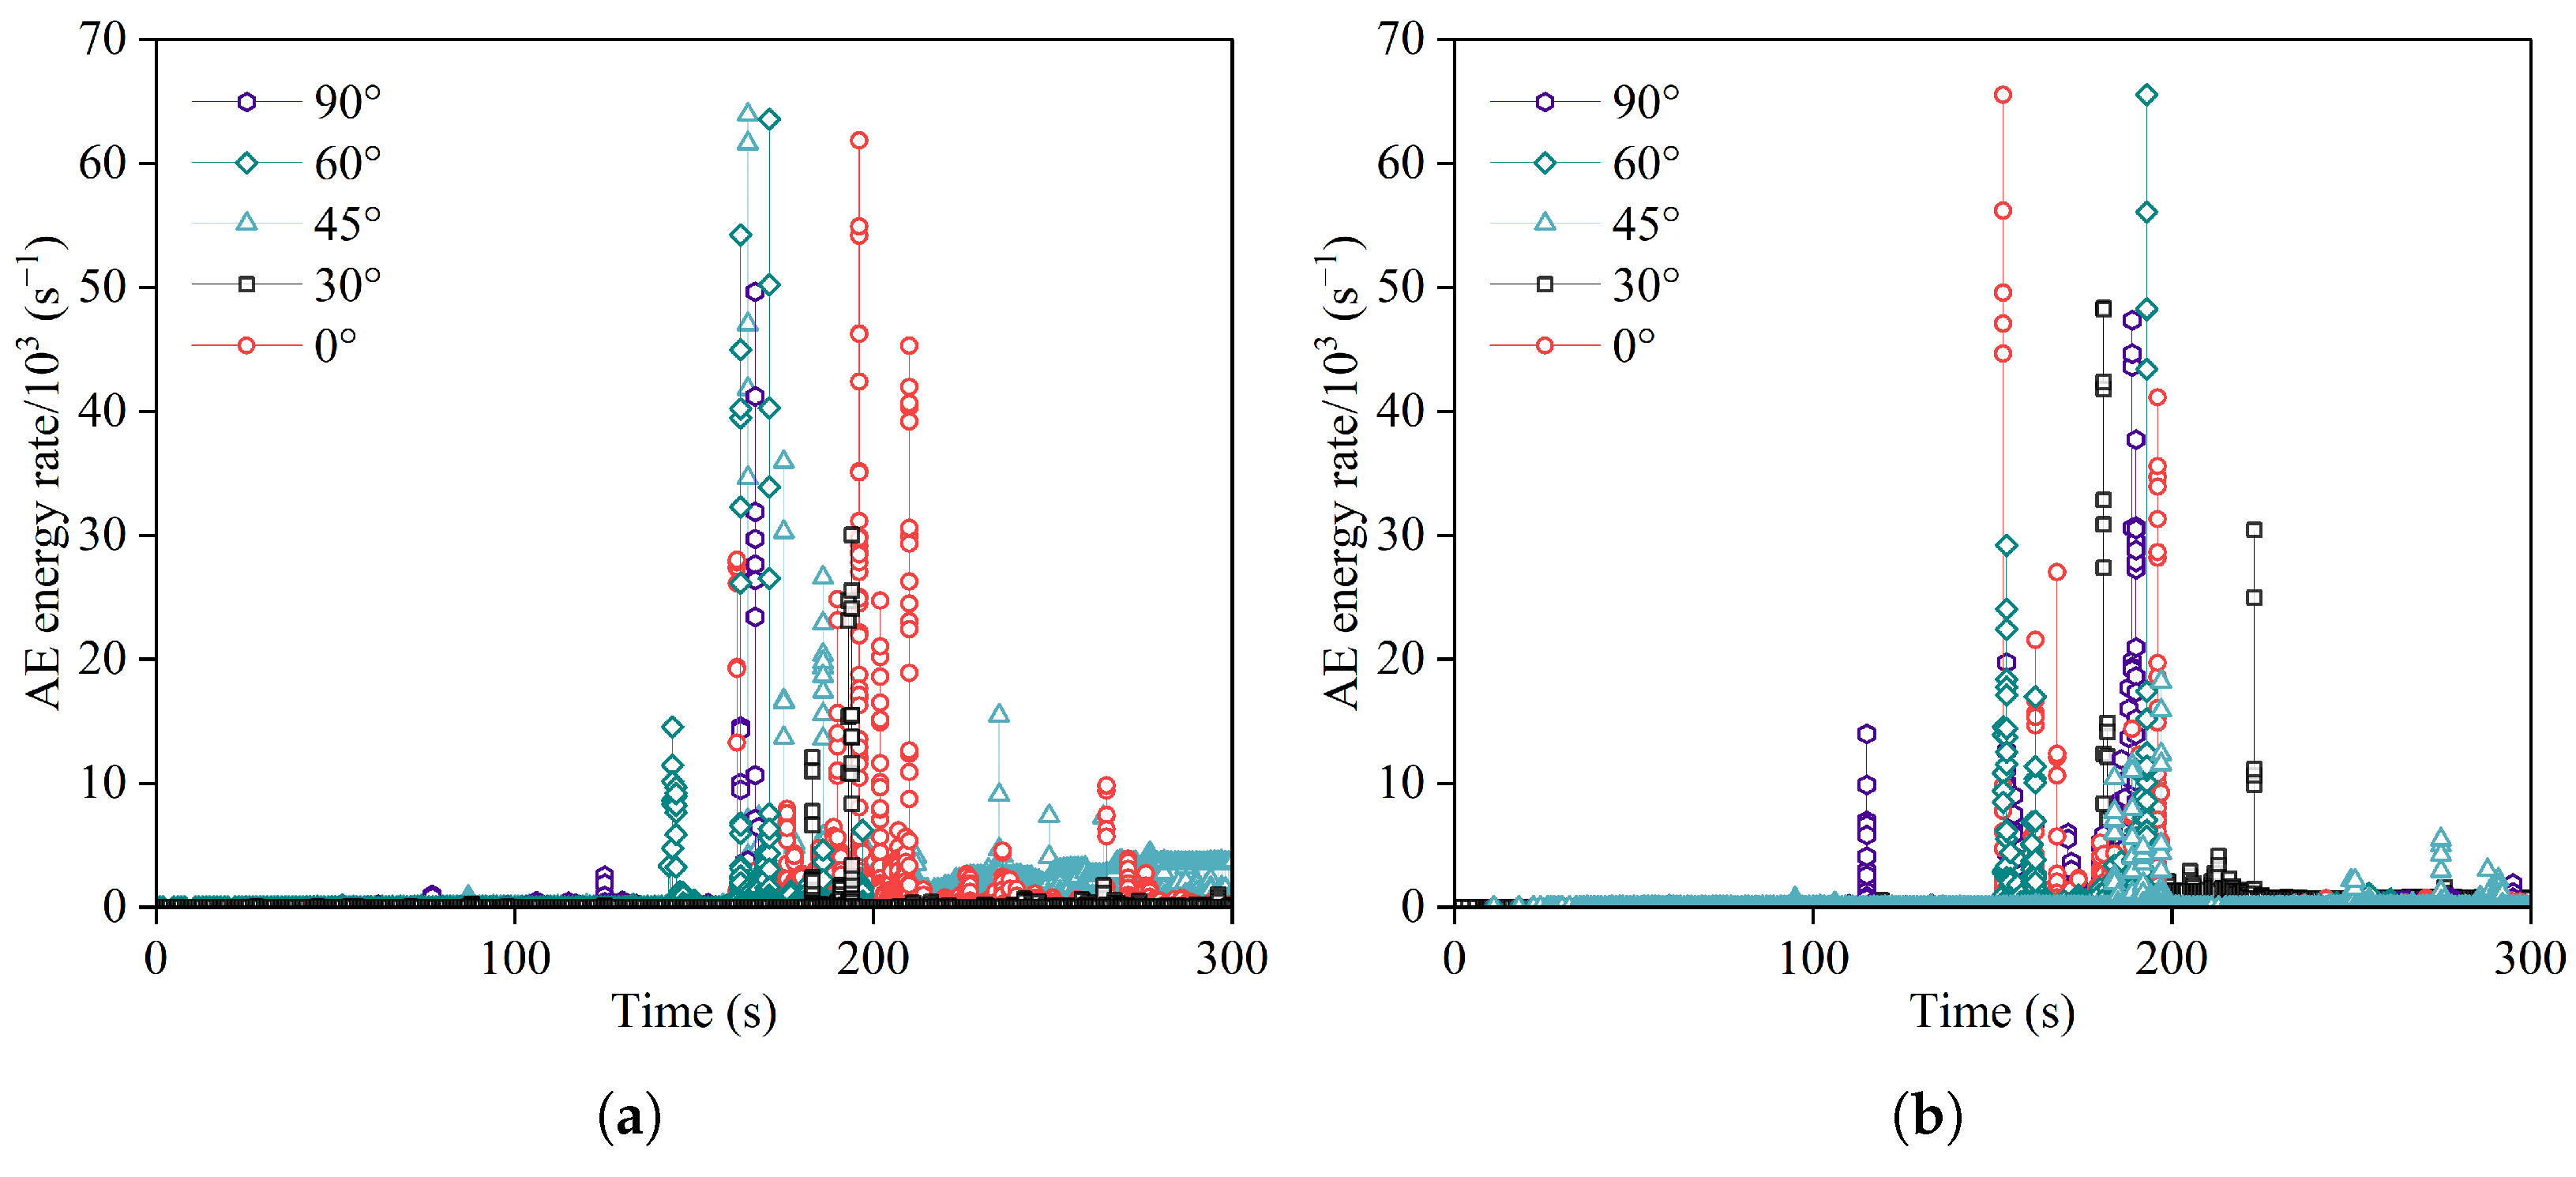
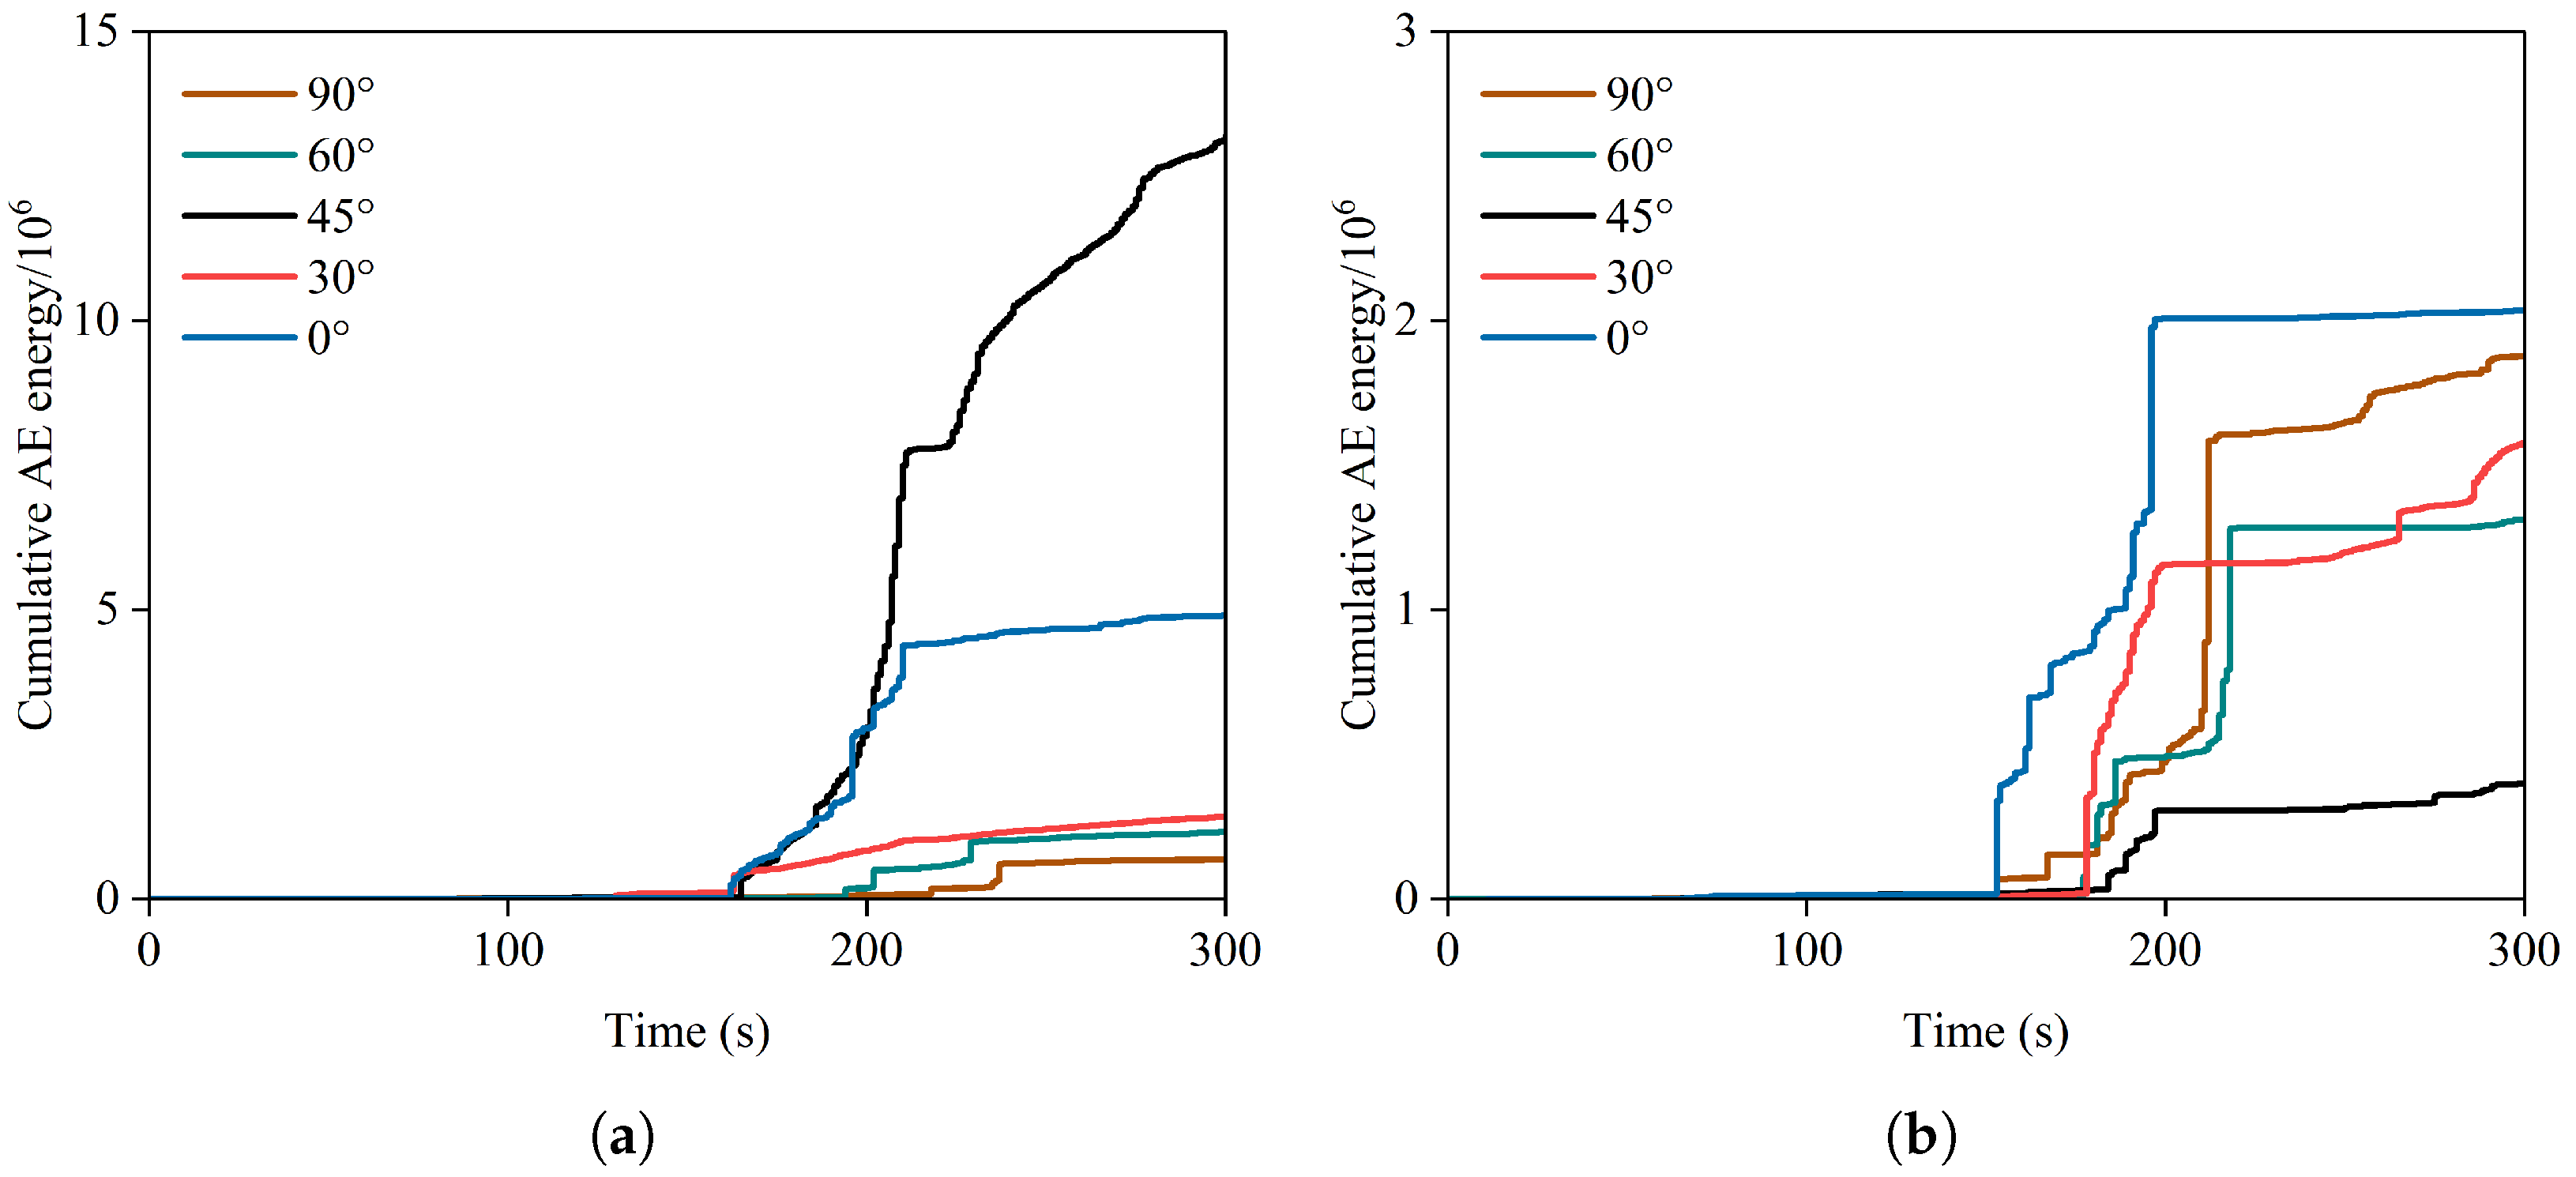
3.4.2. Stress and Bedding Effects on Acoustic Emission Parameters During Progressive Shear Failure

Figure 21 shows that under normal stresses of 10 MPa and 15 MPa, the AE ring count of the 45° bedding sample increased the earliest, suggesting that microcracks formed first at this bedding angle, followed by an increase in the AE ring count in the 90 ° bedding specimens. Under normal stress of 10 MPa, shale samples with different bedding angles exhibited two AE ring count peaks, with the first being smaller and the second reaching the maximum. Under 15 MPa normal stress, the shale samples also displayed two AE ring count peaks, but the difference in magnitude was smaller. At a normal stress of 10 MPa, the difference in maximum AE ring counts among different bedding angles was greater than that at 15 MPa, indicating that the anisotropic effect of bedding on the AE count was more pronounced under lower normal stress. For shale samples with a bedding angle of 45 ° under a normal stress of 10 MPa and a bedding angle of 30 ° under 15 MPa, the AE ring count frequency was the highest and the count was the largest, with a significant increase after the peak shear stress. This suggested a sharp rise in the rate and quantity of microcrack initiation. During the residual stage, the complex interactions between the bedding and the matrix persisted, leading to the continuous formation of localized microcracks and macro-fracture bands.
Figure 22 shows that under a normal stress of 10 MPa, the shale sample with a bedding angle of 90 ° first exhibited a brief release of AE energy, followed by energy release in the sample with a bedding angle of 60 ° . Subsequently, the shale sample with a bedding angle of 45 ° showed the highest AE energy release, followed by the sample with a bedding angle of 60 ° . In contrast, the shale sample with a bedding angle of 30 ° exhibited relatively insignificant AE energy release. Under a normal stress of 15 MPa, the shale sample with a bedding angle of 90 ° was the first to exhibit a high level of AE energy release, while the shale sample with a bedding angle of 0 ° showed the highest overall AE energy release. The shale sample with a bedding angle of 30 ° exhibited a more significant AE energy release after the peak. Under a normal stress of 10 MPa, the frequency of AE energy release among shale samples with different bedding angles was higher than that under 15 MPa.
Figure 23 shows that at the normal stress of 10 MPa, the cumulative AE ring count curves of shale samples with different bedding angles exhibited significant differences. When the bedding angle was 45 ° , the cumulative AE ring count reached its maximum, while at a bedding angle of 90 ° , it was at its lowest. As the bedding angle increased, the initial significant increase in the cumulative AE ring count curve became progressively delayed. The shale sample with a bedding angle of 0 ° exhibited the earliest onset of AE activity, whereas the sample with a bedding angle of 90 ° showed the latest. When the bedding angles were 30 ° , 45 ° , and 60 ° , the cumulative AE ring count increased nearly linearly. When the normal stress was 15 MPa, the cumulative AE ring count curves for different bedding angles tended to be similar. Unlike the case under a normal stress of 10 MPa, the sample with a bedding angle of 45 ° had the smallest cumulative AE ring count but exhibited a relatively large initial increase, which appeared the earliest. The sample with a bedding angle of 30 ° had the largest cumulative AE ring count, with the fastest and greatest increase. For shale samples with bedding angles of 0 ° , 45 ° , and 60 ° , the maximum cumulative AE ring count decreased with increasing normal stress and the number of microcracks was reduced. In contrast, for samples with bedding angles of 30 ° and 90 ° , the maximum cumulative AE ring count increased sharply, with the largest increase and the highest number of microcracks. As the bedding angle increased, the overall influence on the cumulative AE ring count followed a trend of first strengthening and then weakening, indicating that the anisotropic effect of the cumulative AE ring count first increased and then decreased. With increasing normal stress, the influence of bedding on the cumulative AE count pattern (curve shape) during the progressive shear failure process weakened, leading to a reduction in the anisotropy degree of the cumulative AE counts.
Figure 24 shows that under normal stress of 10 MPa, the cumulative energy curves of shale samples with different bedding angles exhibited significant differences in amplitude. When the bedding angle was 45 ° , the cumulative energy was the highest, and when the bedding angle was 90 ° , the cumulative energy was the lowest. As the bedding angle increased, the sample with a bedding angle of 30 ° was the first to show a significant initial increase, while the sample with a bedding angle of 90 ° was the last to show a significant initial increase. The cumulative energy curves of the samples with bedding angles of 90 ° and 60 ° tended to exhibit similar shapes. Under normal stress of 15 MPa, the cumulative energy count curves for different bedding angles became more similar in amplitude and shape. When the bedding angle was 45 ° , the cumulative energy was the lowest. The sample with a bedding angle of 0 ° exhibited a relatively large initial increase in cumulative energy and showed the earliest onset of a significant increase. For shale samples with bedding angles of 0 ° , 30 ° , and 45 ° , as the normal stress increased, the maximum cumulative energy decreased, indicating a reduction in microcrack severity and failure intensity. As the bedding angle increased, the influence of normal stress on the overall distribution pattern of cumulative energy (curve amplitude and shape) during the progressive shear failure process first strengthened and then weakened, meaning that the anisotropy of cumulative energy first increased and then decreased. With increasing normal stress, the influence of bedding on the overall distribution pattern of cumulative energy during progressive shear failure weakened, reducing the anisotropy degree of cumulative energy.

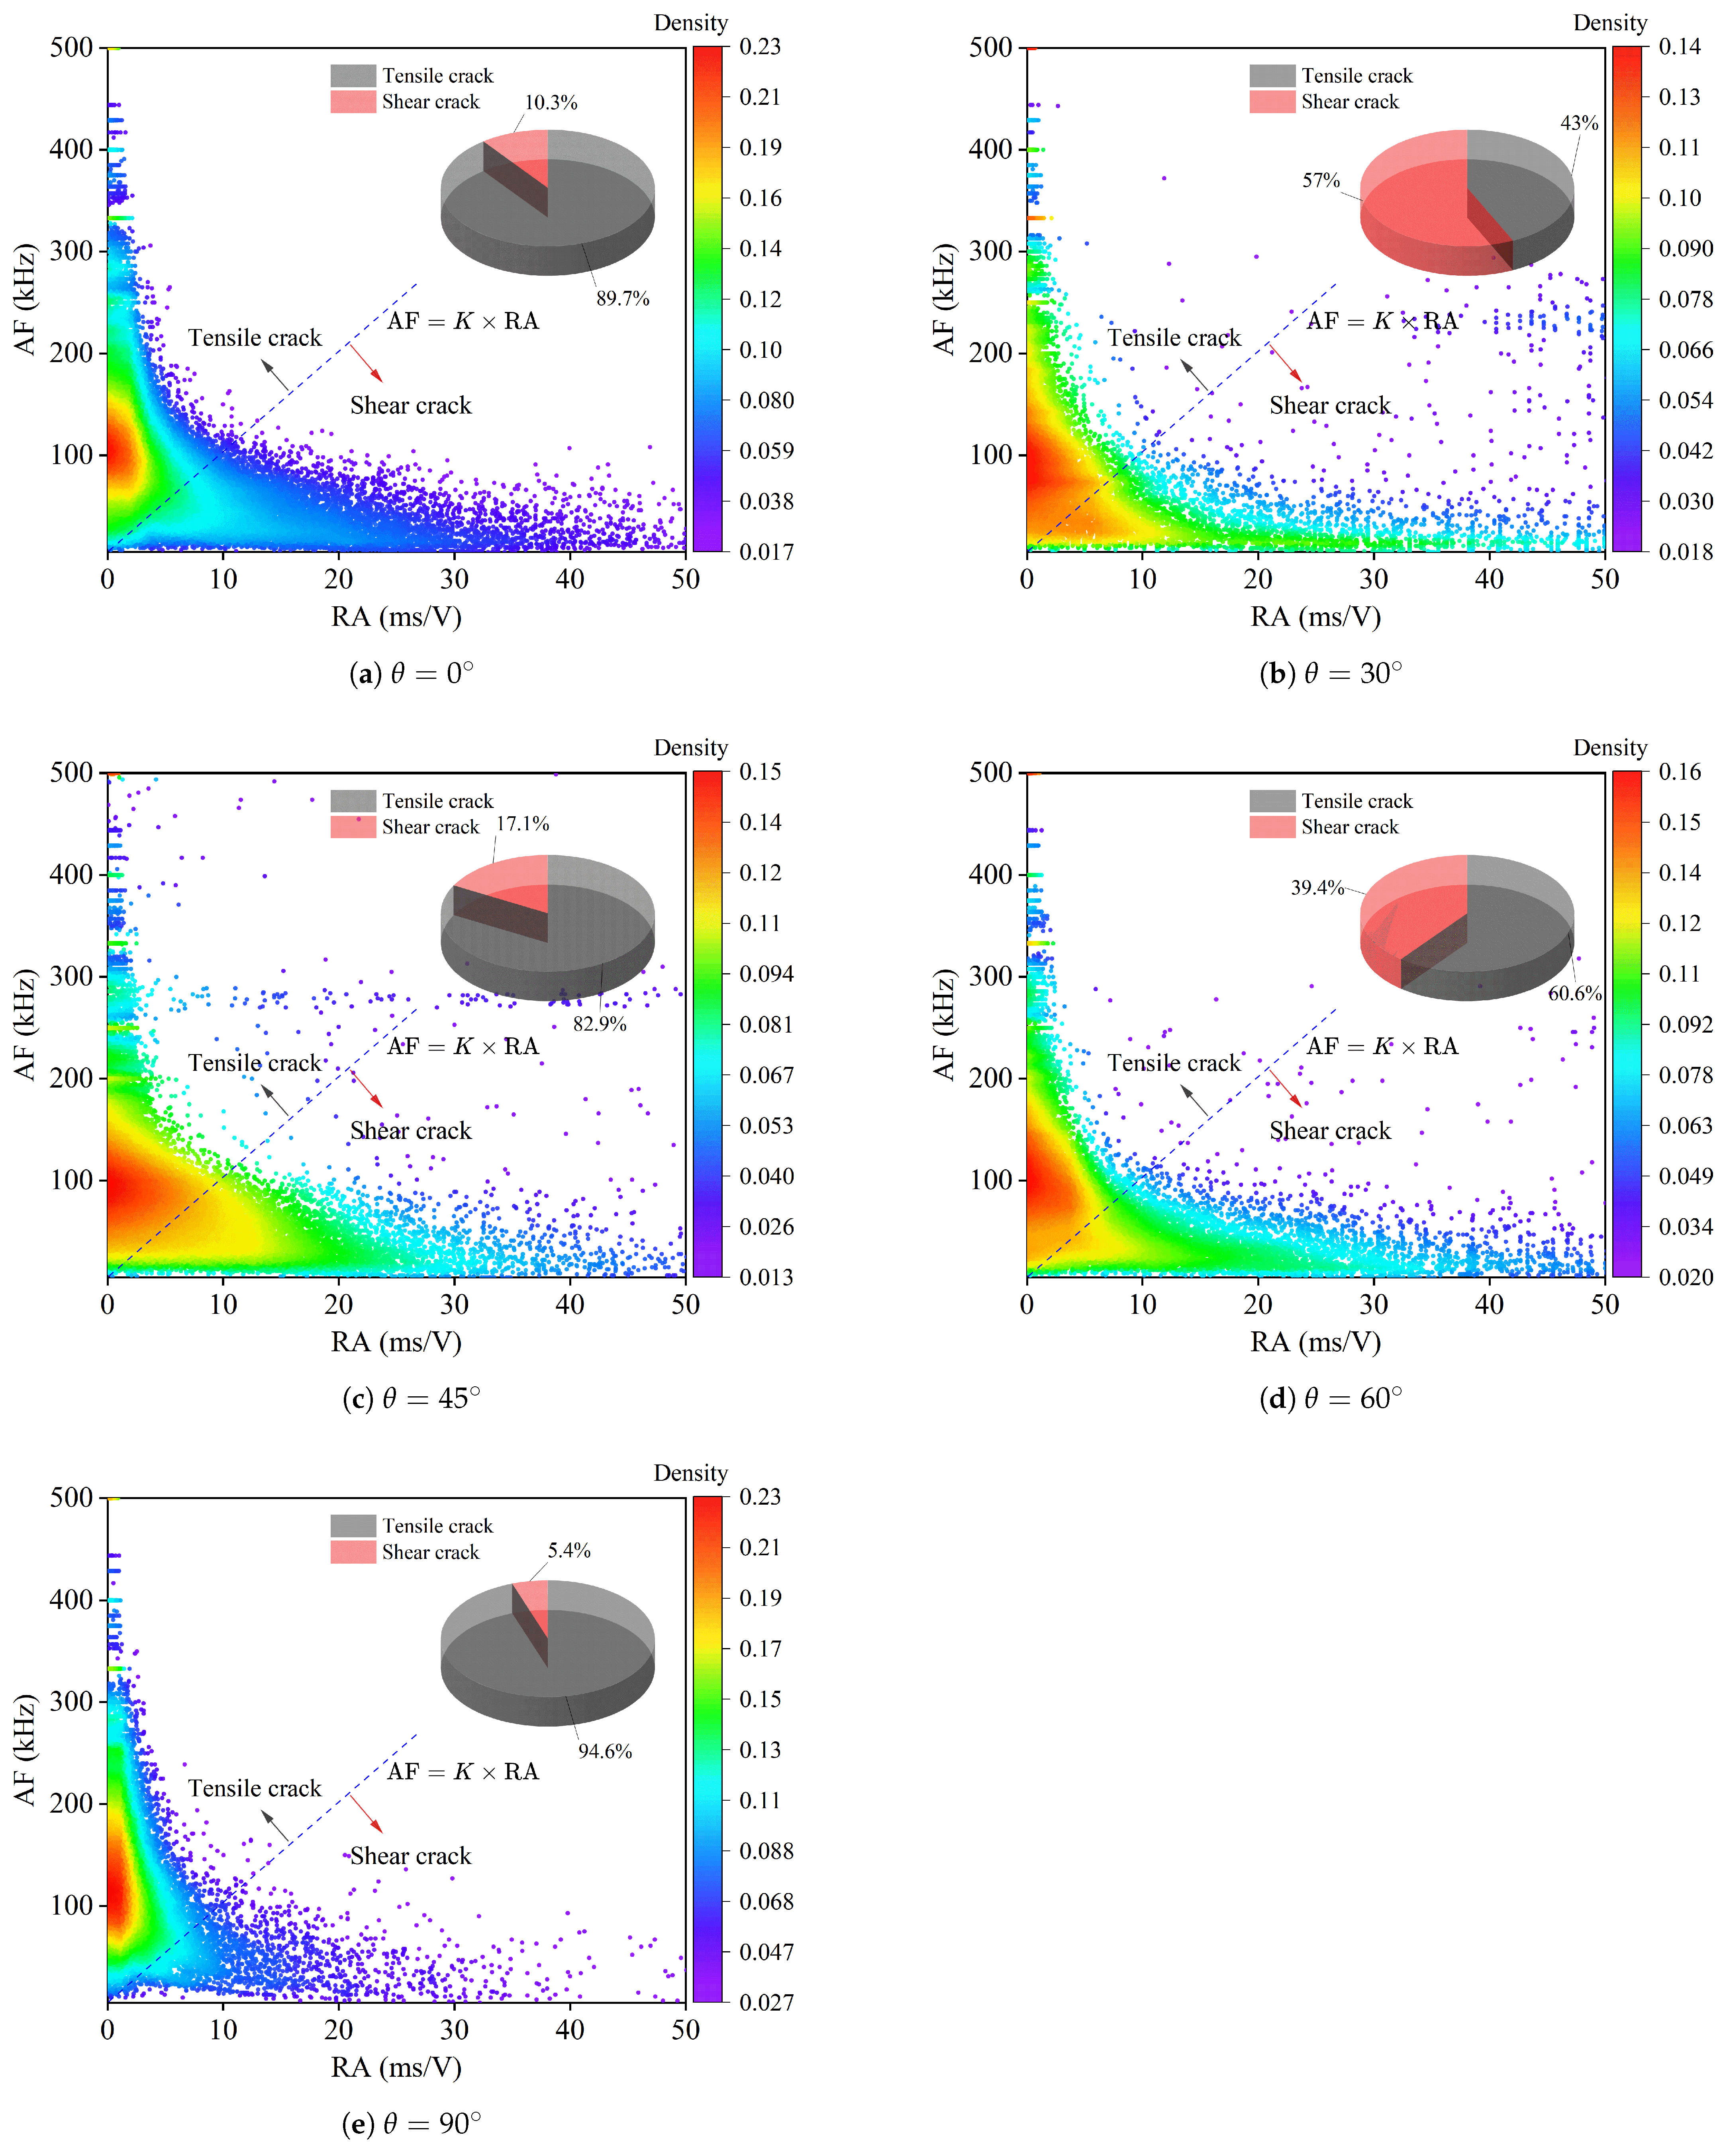
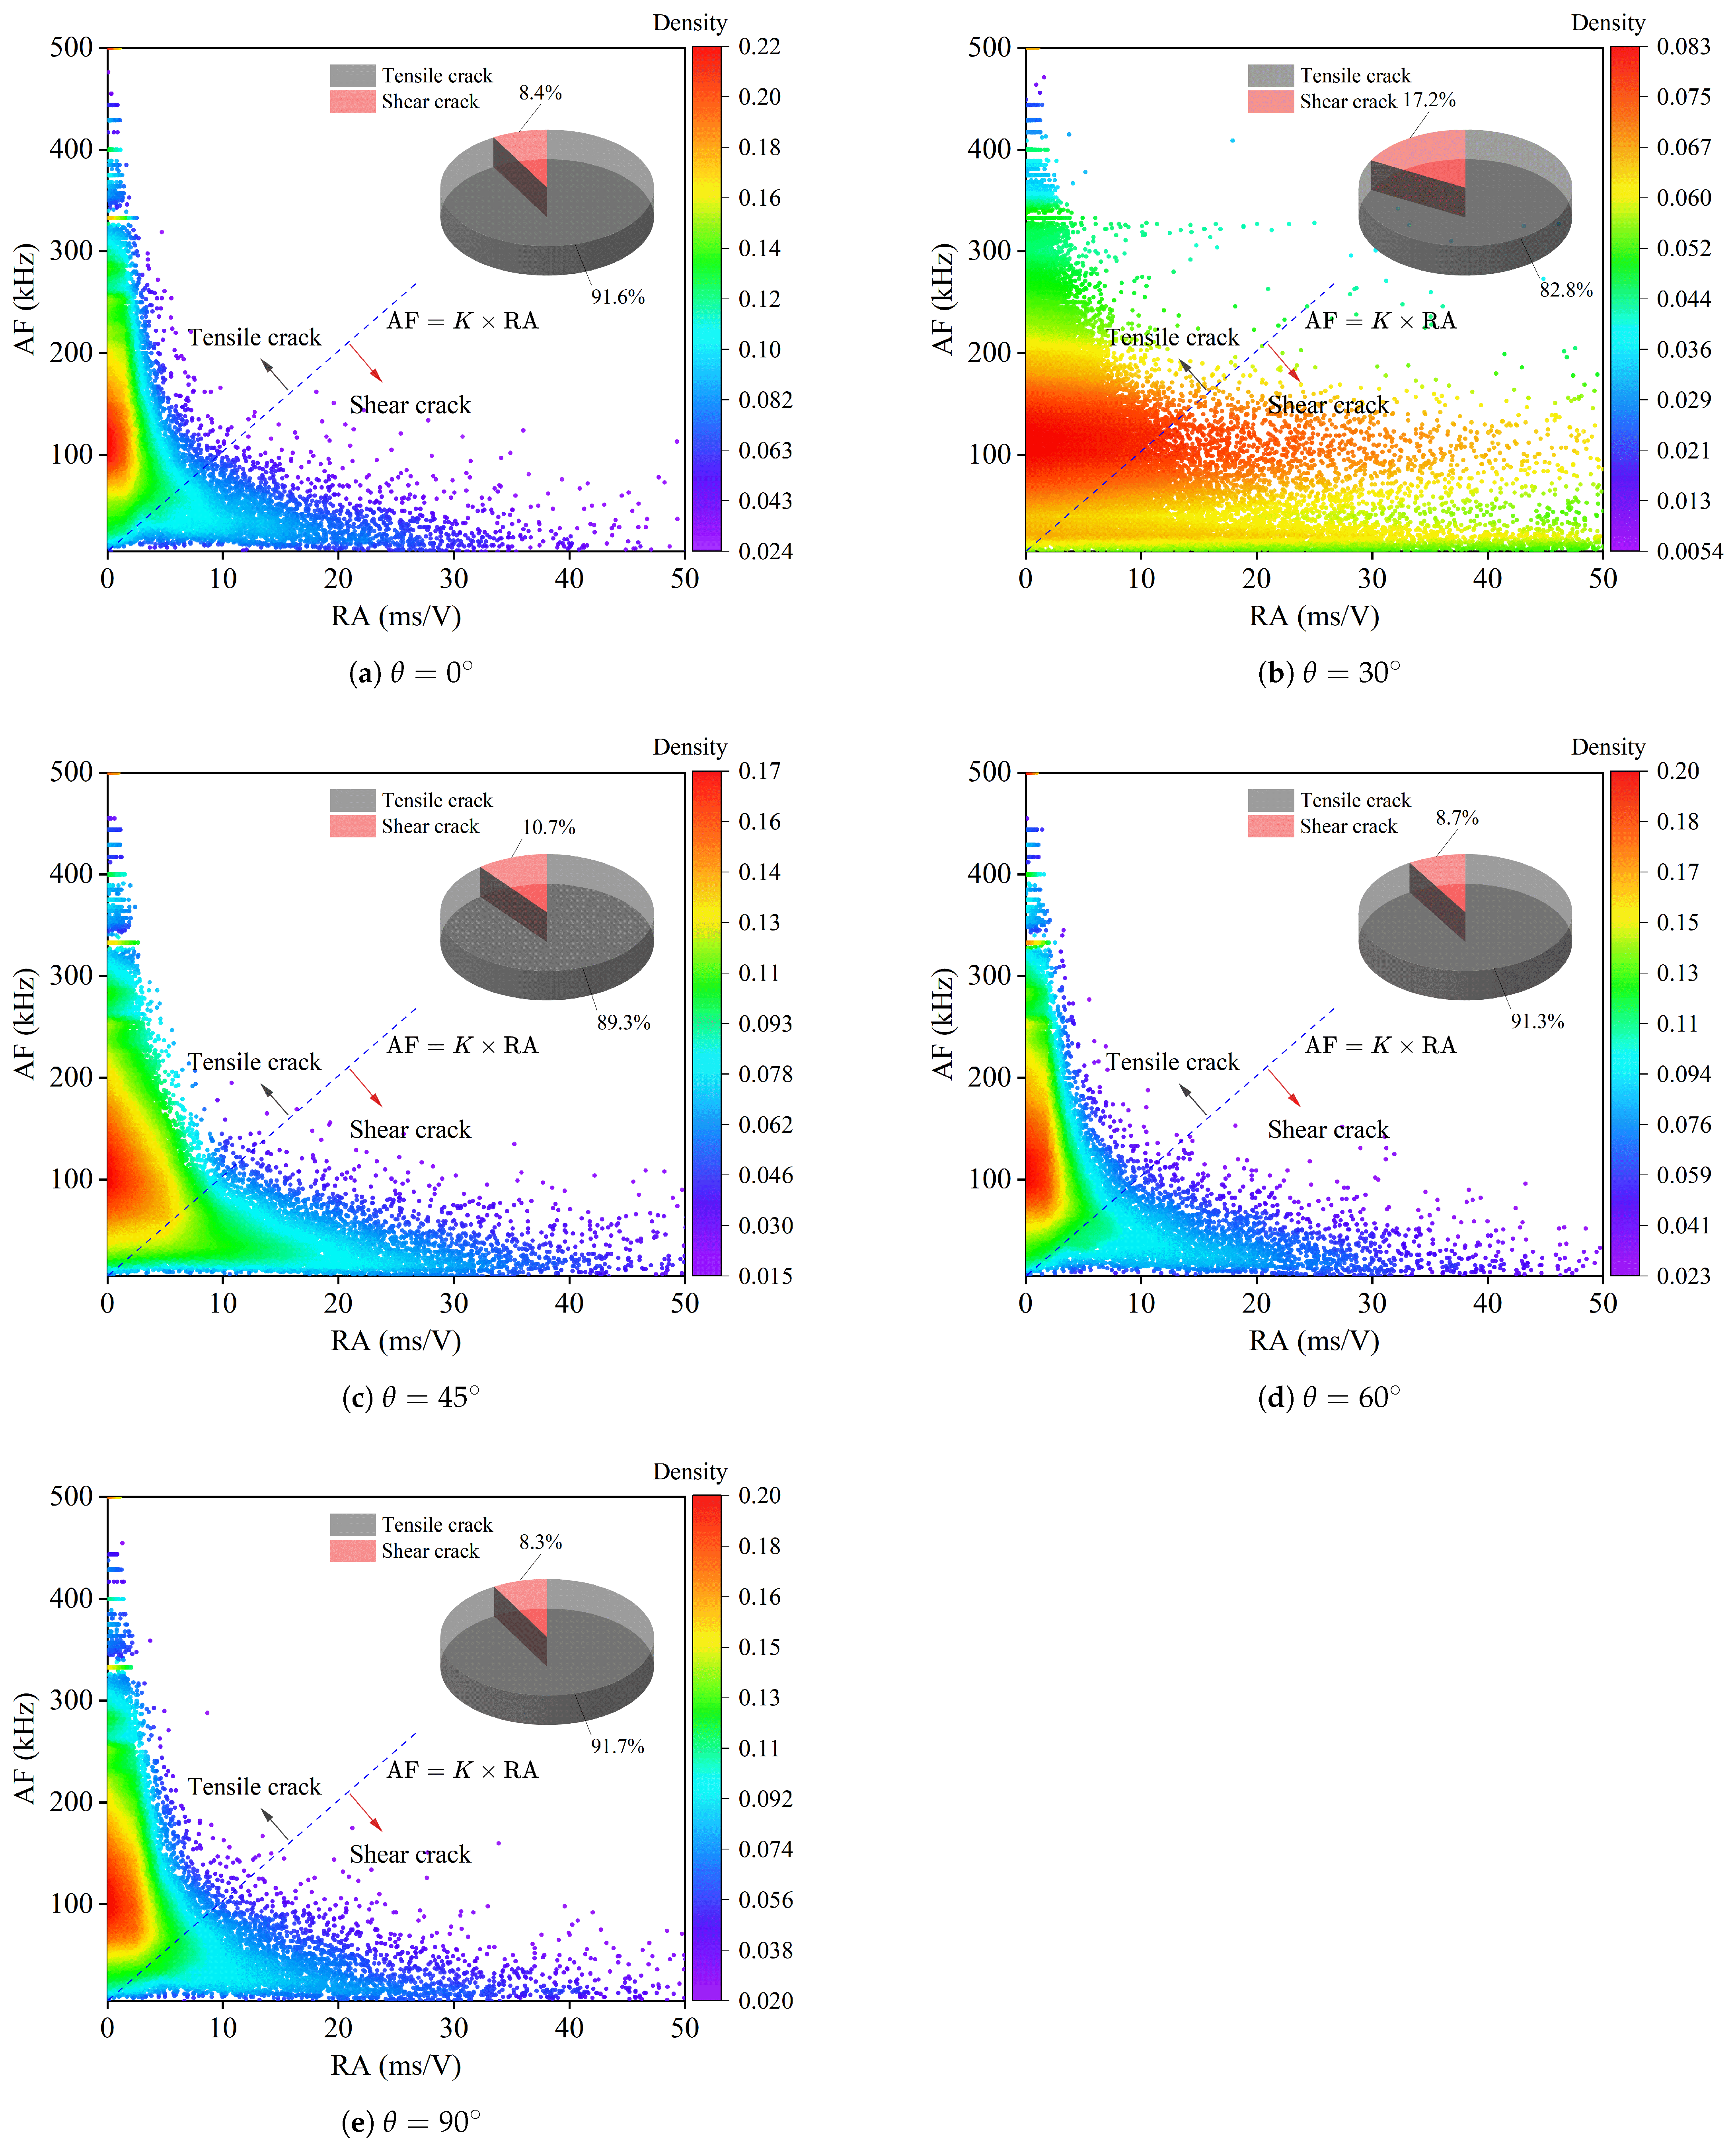
3.4.3. Stress and Bedding Effects on the Evolution of Tensile and Shear Fractures

Rise time over Amplitude (RA = rise time/amplitude) and Average Frequency (AF = ring count/duration) are two key parameters in acoustic emission (AE) analysis, widely used to identify crack types and analyze rock failure mechanisms [42,51]. Previous studies have demonstrated a strong correlation between AE parameters and crack types: tensile cracks generally propagate faster and exhibit smaller scales, with AE signals characterized by shorter durations, higher frequencies, lower RA values, and higher AF values, often accompanied by lower ring counts and energy release. In contrast, shear cracks involve longer frictional sliding processes, leading to longer rise times and lower frequencies in AE signals, thus resulting in higher RA values, lower AF values, and, typically, higher ring counts and energy release [42]. Therefore, analyzing the distribution characteristics of RA–AF parameters is effective for identifying crack types and their evolutionary mechanisms. Previous studies have proposed an empirical threshold (K value) in the RA–AF domain to distinguish between tensile and shear cracks, although this threshold is influenced by lithology, loading conditions, and AE acquisition systems [27]. Based on clustering analyses of AE events in previous studies [27,42,51], tensile events are typically concentrated in the upper-left region of the RA–AF plot, while shear events appear in the lower-right region (as shown in Figure 25 and Figure 26). In this study, K = 10 was adopted as the classification threshold between tensile and shear cracks and RA–AF data density maps were constructed for shale specimens with different bedding angles under 10 MPa and 15 MPa normal stress. Based on the unified threshold, the ratio of tensile to shear events was statistically analyzed to further investigate the influence of normal stress and bedding orientation on AE parameter distributions and failure mechanisms. As shown in Figure 25 and Figure 26, under both 10 MPa and 15 MPa normal stresses, the high-density regions of AF–RA data gradually shifted from the tensile crack domain toward the shear crack domain and eventually returned to the tensile domain with increasing bedding angle. The size of the high-density regions first increased and then decreased, while the overall data density decreased and subsequently increased with the bedding angle. Figure 25 indicates that under 10 MPa normal stress, specimens with 0 ° and 90 ° bedding angles had high-density regions predominantly within the tensile crack domain, whereas specimens with 30 ° to 60 ° bedding angles exhibited high-density regions around the tensile–shear transition zone, with larger overall densities. Figure 26 shows that under a normal stress of 15 MPa, the high-density concentration region of the 30 ° bedding angle sample was distributed on both sides of the tensile–shear transition line and the area of high-density concentration was the largest. For other bedding angles, the high-density concentration regions were mainly located in the tensile crack domain. Under 10 MPa and 15 MPa normal stress conditions, the ratio of tensile to shear cracks showed significant differences across different bedding angles. Under both stress conditions, the 90 ° bedding angle sample exhibited the highest proportion of tensile cracks, indicating that its failure was dominated by tensile cracking. At 10 MPa normal stress, as the bedding angle increased, the ratio of tensile to shear cracks fluctuated. Under 15 MPa normal stress, with increasing bedding angle, the proportion of tensile cracks slightly decreased and then increased, while the proportion of shear cracks first increased and then decreased, although the overall variations remained limited. Compared with the 15 MPa condition, under 10 MPa normal stress, the influence of bedding angle on the AF–RA data distribution was more pronounced, with greater fluctuation in the overall variation. The influence of bedding angle on AF–RA data distribution exhibited stronger anisotropic characteristics.

4. Discussion

4.1. Anisotropy of Macroscopic Shear Parameters

The coefficient of variation of shear strength at different bedding angles under the same normal stress condition represented the anisotropy of shale shear strength, as shown in Figure 27. When the normal stress was 15 MPa, the influence of the bedding angle on the peak shear strength parameters of shale specimens was minimal, indicating the lowest degree of anisotropy in peak shear strength. Conversely, at a normal stress of 10 MPa, the influence of the bedding angle was at its most pronounced, corresponding to the highest degree of anisotropy in peak shear strength. When the normal stress was 10 MPa, the influence of bedding angle on the peak shear strength parameters of shale samples was the strongest, indicating the highest degree of anisotropy in peak shear strength. Compared with the case under a normal stress of 15 MPa, the degree of anisotropy increased by 1.51 times. For normal stresses greater than or equal to 15 MPa, the influence of the bedding angle on the peak shear strength parameters remained relatively consistent. At a normal stress of 10 MPa, the influence of bedding angle on the residual shear strength parameters was the weakest, representing the lowest degree of anisotropy in residual shear strength. In contrast, at a normal stress of 20 MPa, the influence of the bedding angle reached its peak, corresponding to the highest degree of anisotropy in residual shear strength. Compared to the case under a normal stress of 10 MPa, the degree of anisotropy at 20 MPa increased by a factor of 1.48. Compared to peak shear strength, the relationship between residual shear strength and bedding inclination exhibited a different trend as normal stress increased. The influence of bedding angle on peak shear strength followed a fluctuating attenuation trend, indicating a progressive decrease in anisotropy. Conversely, the influence of bedding angle on residual shear strength followed a fluctuating intensification trend, leading to an overall increase in anisotropy. As normal stress increased, the degree of anisotropy in residual shear strength exceeded that in peak shear strength. When the normal stress increased from 10 MPa to 25 MPa, representing a 1.5-fold increase, the maximum reduction in the degree of anisotropy in peak shear strength and the maximum increase in the degree of anisotropy in residual shear strength both approximated a factor of 1.5.
Numerous studies have demonstrated a strong correlation between joint roughness coefficient (JRC) and shear strength [46,52,53,54,55]. Barton [52] indicated that the shear strength of rock joints is directly proportional to the morphology of joint surfaces and the strength of the joint wall. As illustrated in Figure 9, Figure 13, Figure 14, Figure 15 and Figure 16 in the context of shale shear fracture surfaces, bedding significantly influences fracture formation as a relatively weaker plane. Under lower normal stresses, shale shear fracture surfaces become rougher along bedding planes with increasing bedding angles, leading to an increase in residual shear strength. Conversely, under higher normal stresses, despite the rougher fracture surfaces, significant fragmentation of shale blocks above and below the shear surfaces substantially reduces the rock mass strength. The weakening effect caused by rock fragmentation thus outweighs the strengthening effect of surface roughness, resulting in a decrease in residual shear strength as the bedding angle increases. Additionally, consistent with Zheng et al. [56], under low normal stresses, fracture zones broaden with increasing bedding angles, indicating amplified morphological differences between the upper and lower shear fracture surfaces. This further underscores the role of bedding in enhancing local fracture variations and increasing the complexity of shear fracture surface morphology in shale.
Figure 28 illustrates that under a normal stress of 15 MPa, the average three-dimensional roughness parameter ( JRC 3 D ) of the upper and lower fracture surfaces increases with both peak and residual shear strengths. This suggests a positive correlation between three-dimensional surface roughness and shear resistance, wherein increased surface roughness corresponds to an enhancement in shear strength. As the bedding angle increases, fracture processes such as crack branching, fragmentation, and transgranular propagation become more prominent [22,36,38], resulting in elevated energy dissipation. Greater energy consumption is generally associated with rougher fracture morphologies and contributes to higher peak shear strength [46]. Thus, fracture surface roughness can serve as a proxy for evaluating peak shear strength. With increasing normal stress, the influence of bedding angle on residual shear strength transitions from being primarily governed by surface roughness to a coupled mechanism involving both roughness and the post-fracture strength degradation of wall rock. Consequently, the controlling factors of residual shear strength become more complex, and its anisotropy becomes more pronounced under higher normal stresses (as illustrated in Figure 27).
As shown in Table 3, this study employed cuboid shale specimens, consistent with the findings of Zhang et al. [38], Fan et al. [27], and Lu et al. [23], who used cubic shale specimens. These studies found that the internal friction angle of the shale matrix is lower than that of the shale bedding planes, while the cohesion of the matrix is greater than that of the bedding planes. In contrast, studies using cylindrical shale specimens [12,22,36] reported higher internal friction angles and cohesion in the matrix compared to the bedding planes. These results suggest that specimen geometry has a certain influence on shear strength parameters [22]. The configuration and experimental boundary conditions differ between rectangular (or cubic) and cylindrical specimens [27]. Cuboid or cubic specimens allow full planar contact with the loading apparatus during shear, facilitating the uniform transfer of surface forces. In contrast, cylindrical specimens, due to their curved surfaces, experience a different loading mode, and the curved geometry may cause non-uniform force transmission [27]. Future studies are recommended to combine experimental and numerical simulations to systematically investigate different specimen geometries and further elucidate the mechanisms by which geometry affects mechanical parameters.

4.2. Anisotropy of Mesoscopic Shear Parameters

As shown in Figure 23, for normal stress of 15 MPa, the cumulative AE ring count curves of shale with different bedding angles exhibited an “irregular stepwise” pattern. Under normal stress of 10 MPa, when the bedding angles were 0 ° and 90 ° , the cumulative AE ring count curves of shale bedding and matrix shearing both followed an approximately “S-shaped” pattern. When the bedding angle ranged from 30 ° to 60 ° , the cumulative AE ring count curves of the shale bedding–matrix coupled medium shearing exhibited a “segmented line” pattern, indicating that the damage process of shale bedding ( 0 ° ) and matrix ( 90 ° ) shearing, i.e., the microcrack initiation and propagation processes, differed from those in the bedding–matrix coupled medium ( 30 ° to 60 ° ) shearing and were more complex.
For the same bedding angle, the microcrack initiation and propagation process in shale shearing under higher normal stress (“irregular stepwise” pattern) was more complex than the damage process under lower normal stress (“S-shaped” and “segmented line” patterns). Compared to 15 MPa normal stress, the cumulative AE ring count curves of shale shearing at 10 MPa normal stress exhibited two distinct evolutionary patterns with bedding angle variation, suggesting that at lower normal stress, the anisotropic bedding effect on the cumulative damage process was more pronounced.
As shown in Figure 29, under higher normal stress (15 MPa), the variation of macroscopic shear dilation deformation and mesoscopic cumulative damage of shale with bedding angle exhibited consistency, further indicating the synergy of the anisotropic bedding effect on macro–meso shear behavior. In contrast, under lower normal stress (10 MPa), the variation of macroscopic shear dilation deformation and mesoscopic cumulative damage with bedding angle was inconsistent, further demonstrating the non-synergistic effect of anisotropic bedding on macro–meso shear behavior.
The influence of bedding angle on the macro- to mesoscale shear failure of shale, namely, the progressive transition from microcracking to macroscopic rupture, remains insufficiently understood [38]. Zhang et al. [38] found a significant correlation between macroscopic shear failure and the evolution of microcracks in shale. During the shear process, the synchronous changes in the scale and orderliness of microcrack events monitored by acoustic emission (AE) are closely related to macroscopic shear damage. As illustrated in Figure 20, throughout progressive shear deformation, the evolution of AE ring count and cumulative ring count, which reflected the number and activity of mesoscale microcracks, exhibited a strong correlation with the stress–strain behavior of shale. A sharp increase in both ring count and cumulative count signified the initiation and propagation of microcracks. When the ring count frequency intensified and reached a peak, followed by a slower growth in cumulative count, this signaled the onset of macroscopic shear failure. This stage corresponded to the peak and subsequent drop in the stress–strain curve, during which, the macroscopic shear fracture zone gradually formed. These observations indicate that AE-derived mesoscale parameters can serve as reliable indicators for predicting macroscopic shear instability. In the residual shear stage, the moderate reappearance of ring count and the continued, albeit slower, growth in cumulative count suggested the sustained extension of macro- and micro-fractures. Regarding the mesoscale anisotropy induced by bedding, SEM observations (Figure 7) showed a greater prevalence of microcracks and weak mineral interfaces aligned along bedding planes. During mechanical loading, microcracks deflect and branch along mineral grain boundaries. In clay-rich zones, fractures typically initiate along disordered layer boundaries before penetrating the laminated structure [57]. Tensile failure predominantly generates intergranular microcracks, whereas shear failure involves a combination of intergranular and transgranular cracking [42]. At a bedding angle of 0 ° , shear slip failure along bedding planes was primarily governed by intergranular microcracking. At bedding angles of 30 ° to 60 ° , shear failure was mainly controlled by transgranular microcracks that traversed the matrix and propagated along bedding surfaces, accompanied by tensile splitting. At a bedding angle of 90 ° , the entire matrix underwent shear failure along with pronounced tensile splitting parallel to bedding, jointly influenced by both intergranular and transgranular microcracks [38]. These results suggest that microcracks and weak interfaces developed along bedding planes play a critical role in controlling the preferential orientation of shear failure.

4.3. Engineering Implications and Prospects

In shale gas extraction through hydraulic fracturing, fractures intersecting layered shale reservoirs at appropriate angles can facilitate the formation of more effective fracture networks and reduce the risk of wellbore shear-slip instability [38]. As noted above, shale with 0 ° bedding orientation exhibited relatively low shear strength, and fractures tended to propagate along bedding planes, which may close under compressive stress, thereby reducing fracture conductivity, limiting production, and increasing the risk of wellbore instability. In contrast, shale with bedding angles of 30 ° to 60 ° showed a significantly higher proportion of shear fractures. This orientation range is thus considered favorable for promoting the development of hydraulic shear fractures, contributing to the formation of complex fracture networks. Moreover, it tends to produce rougher fracture surfaces that help maintain self-propping, thereby offering more effective flow channels for shale gas migration and enhancing reservoir productivity. This angle range is recommended as an optimal intersection angle for shallow-layered shale formations. This study systematically provides key macroscopic mechanical parameters of shale shear strength at various bedding angles, including cohesion (c) and internal friction angle ( ϕ ), offering valuable data for evaluating the long-term stability of both reservoir and caprock shales. The experimental parameters proposed herein serve as a foundation for subsequent numerical simulations and machine learning models, supporting the prediction of shear failure and caprock slip behavior during fluid (e.g., CO2) injection processes around the wellbore. These findings offer theoretical guidance for engineering design and risk mitigation in layered rock formations. Nevertheless, the shale samples used in this study were tested under dry conditions, focusing primarily on shallow formations under low-stress scenarios. Future work is recommended to conduct macro–mesoscopic coupled experiments under varied moisture contents and multi-level stress conditions, aiming to extend the applicability and engineering relevance of the current findings to both shallow and deep shale reservoirs.

5. Conclusions

This study conducted macroscopic direct shear tests and mesoscopic acoustic emission (AE) monitoring on reservoir shale with different bedding angles ( 0 ° , 30 ° , 45 ° , 60 ° , 90 ° ) under varying normal stresses (10 MPa, 15 MPa, 20 MPa, 25 MPa). Additionally, three-dimensional laser scanning was employed to characterize the post-shear fracture morphology. This comprehensive approach facilitated the investigation of the anisotropic shear mechanical behavior of shale across both macro- and meso-scales. The main conclusions are as follows:
(1)
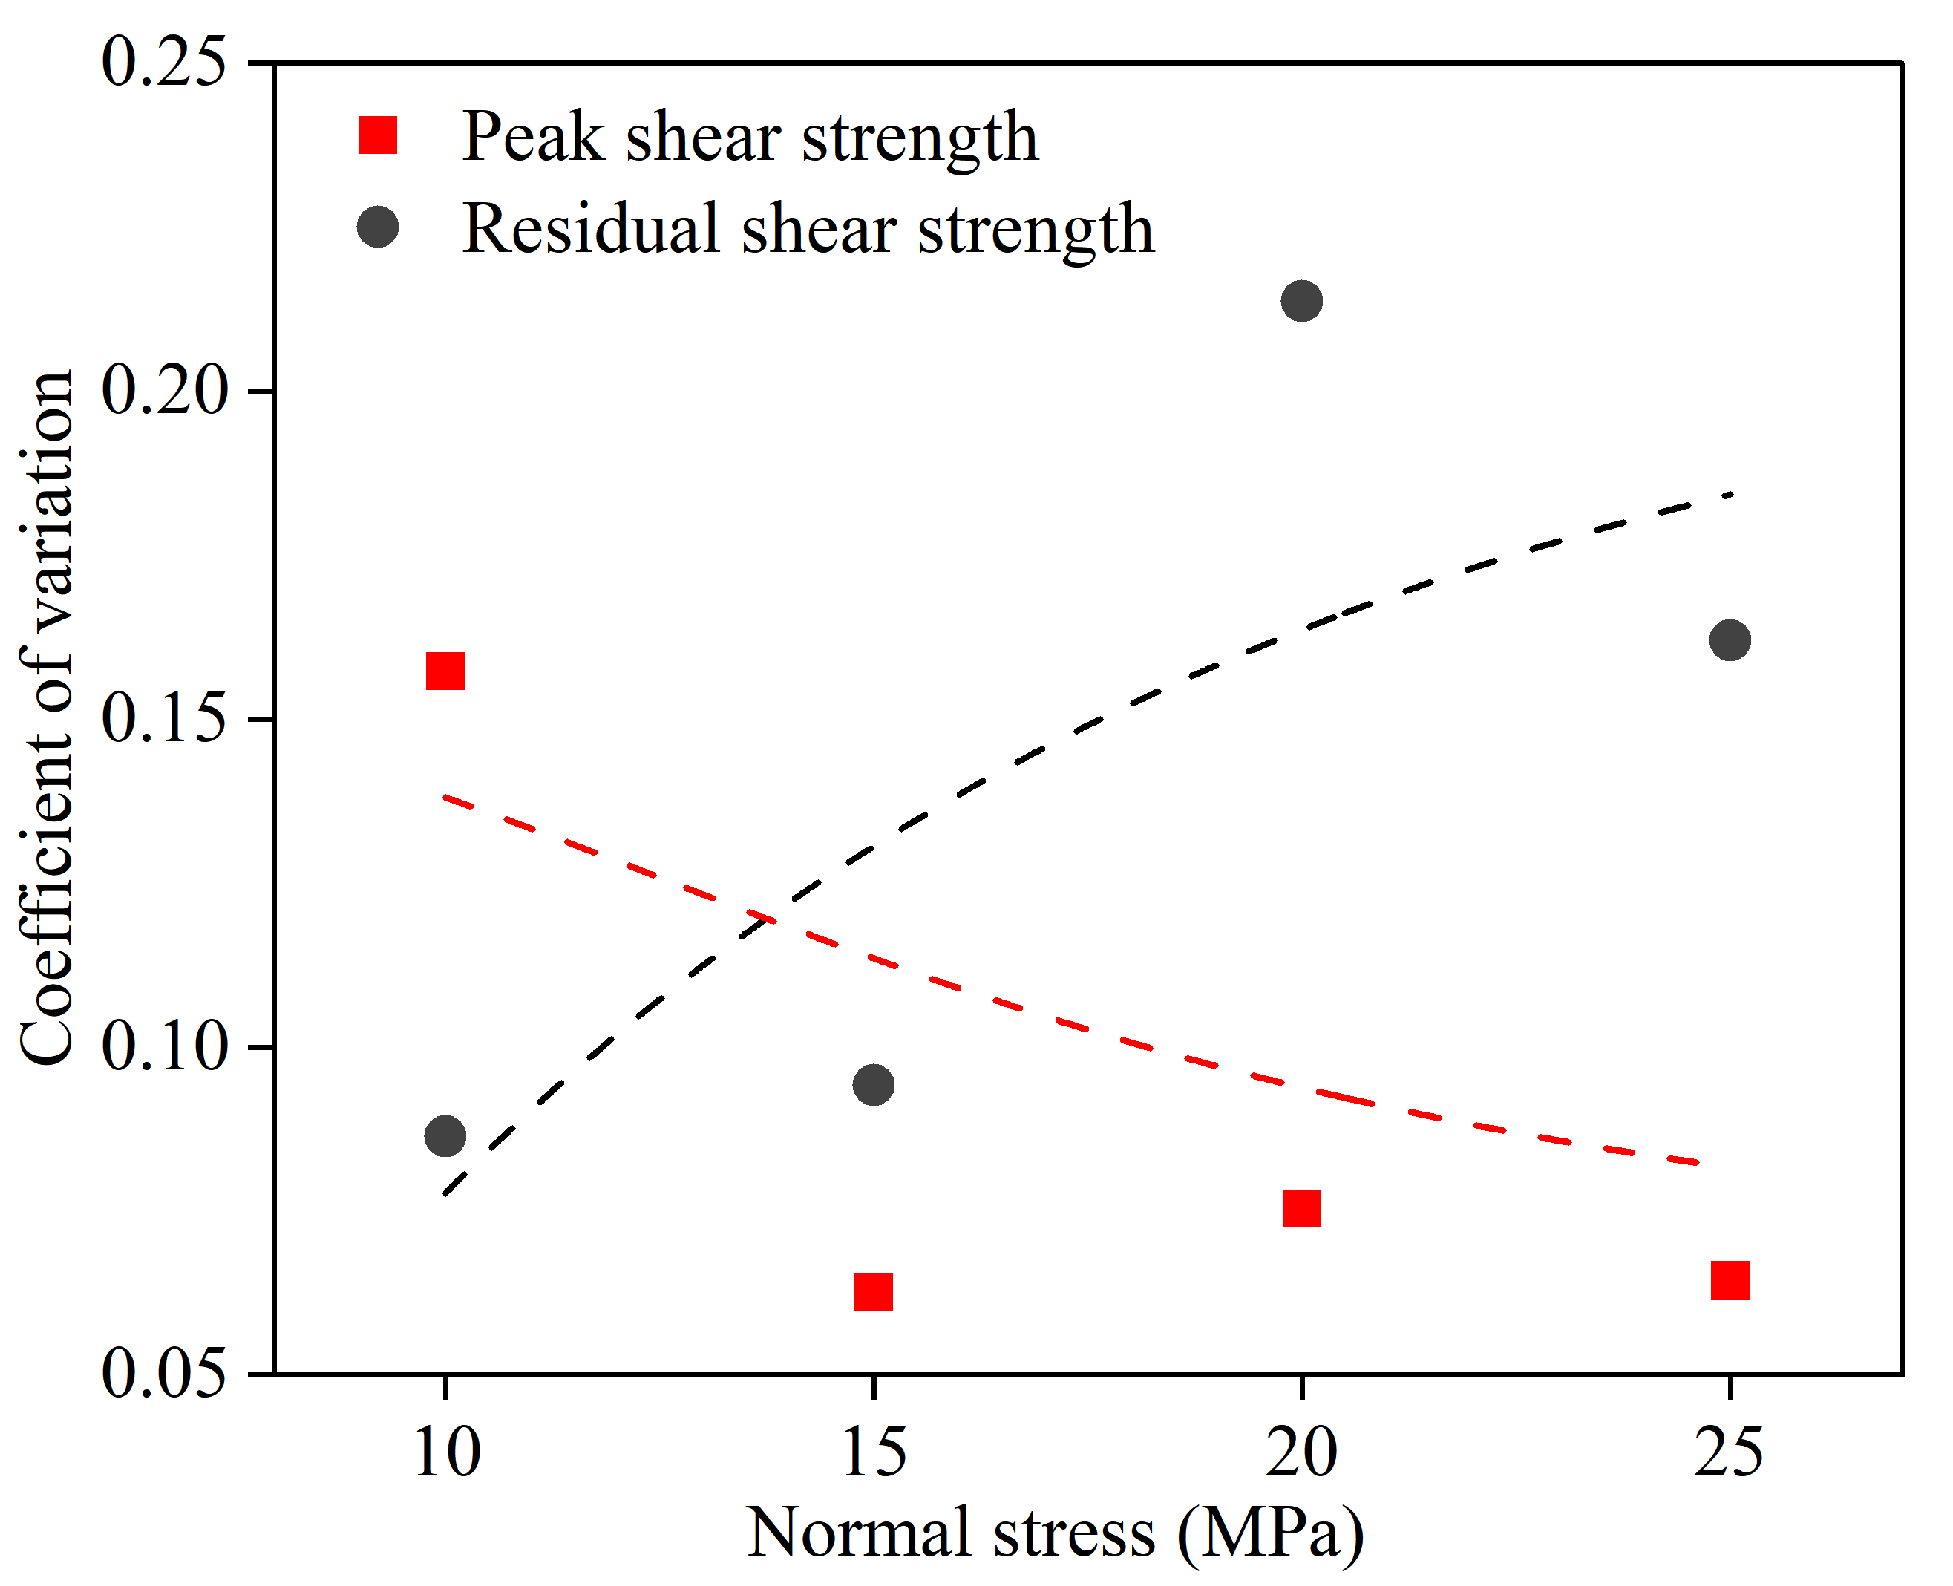
The peak and residual shear strengths of shale at various bedding angles exhibit a fluctuating increasing trend with increasing normal stress. Under all normal stress conditions, shale with bedding angles of 30 to 60 generally shows higher peak shear strength. When the normal stress is low, the anisotropy of peak shear strength is more pronounced than that of residual shear strength. As the normal stress increases, the bedding-induced anisotropy of peak and residual shear strengths exhibits opposite trends. The anisotropy of peak shear strength tends to decrease in a fluctuating manner, while that of residual shear strength increases with fluctuations.
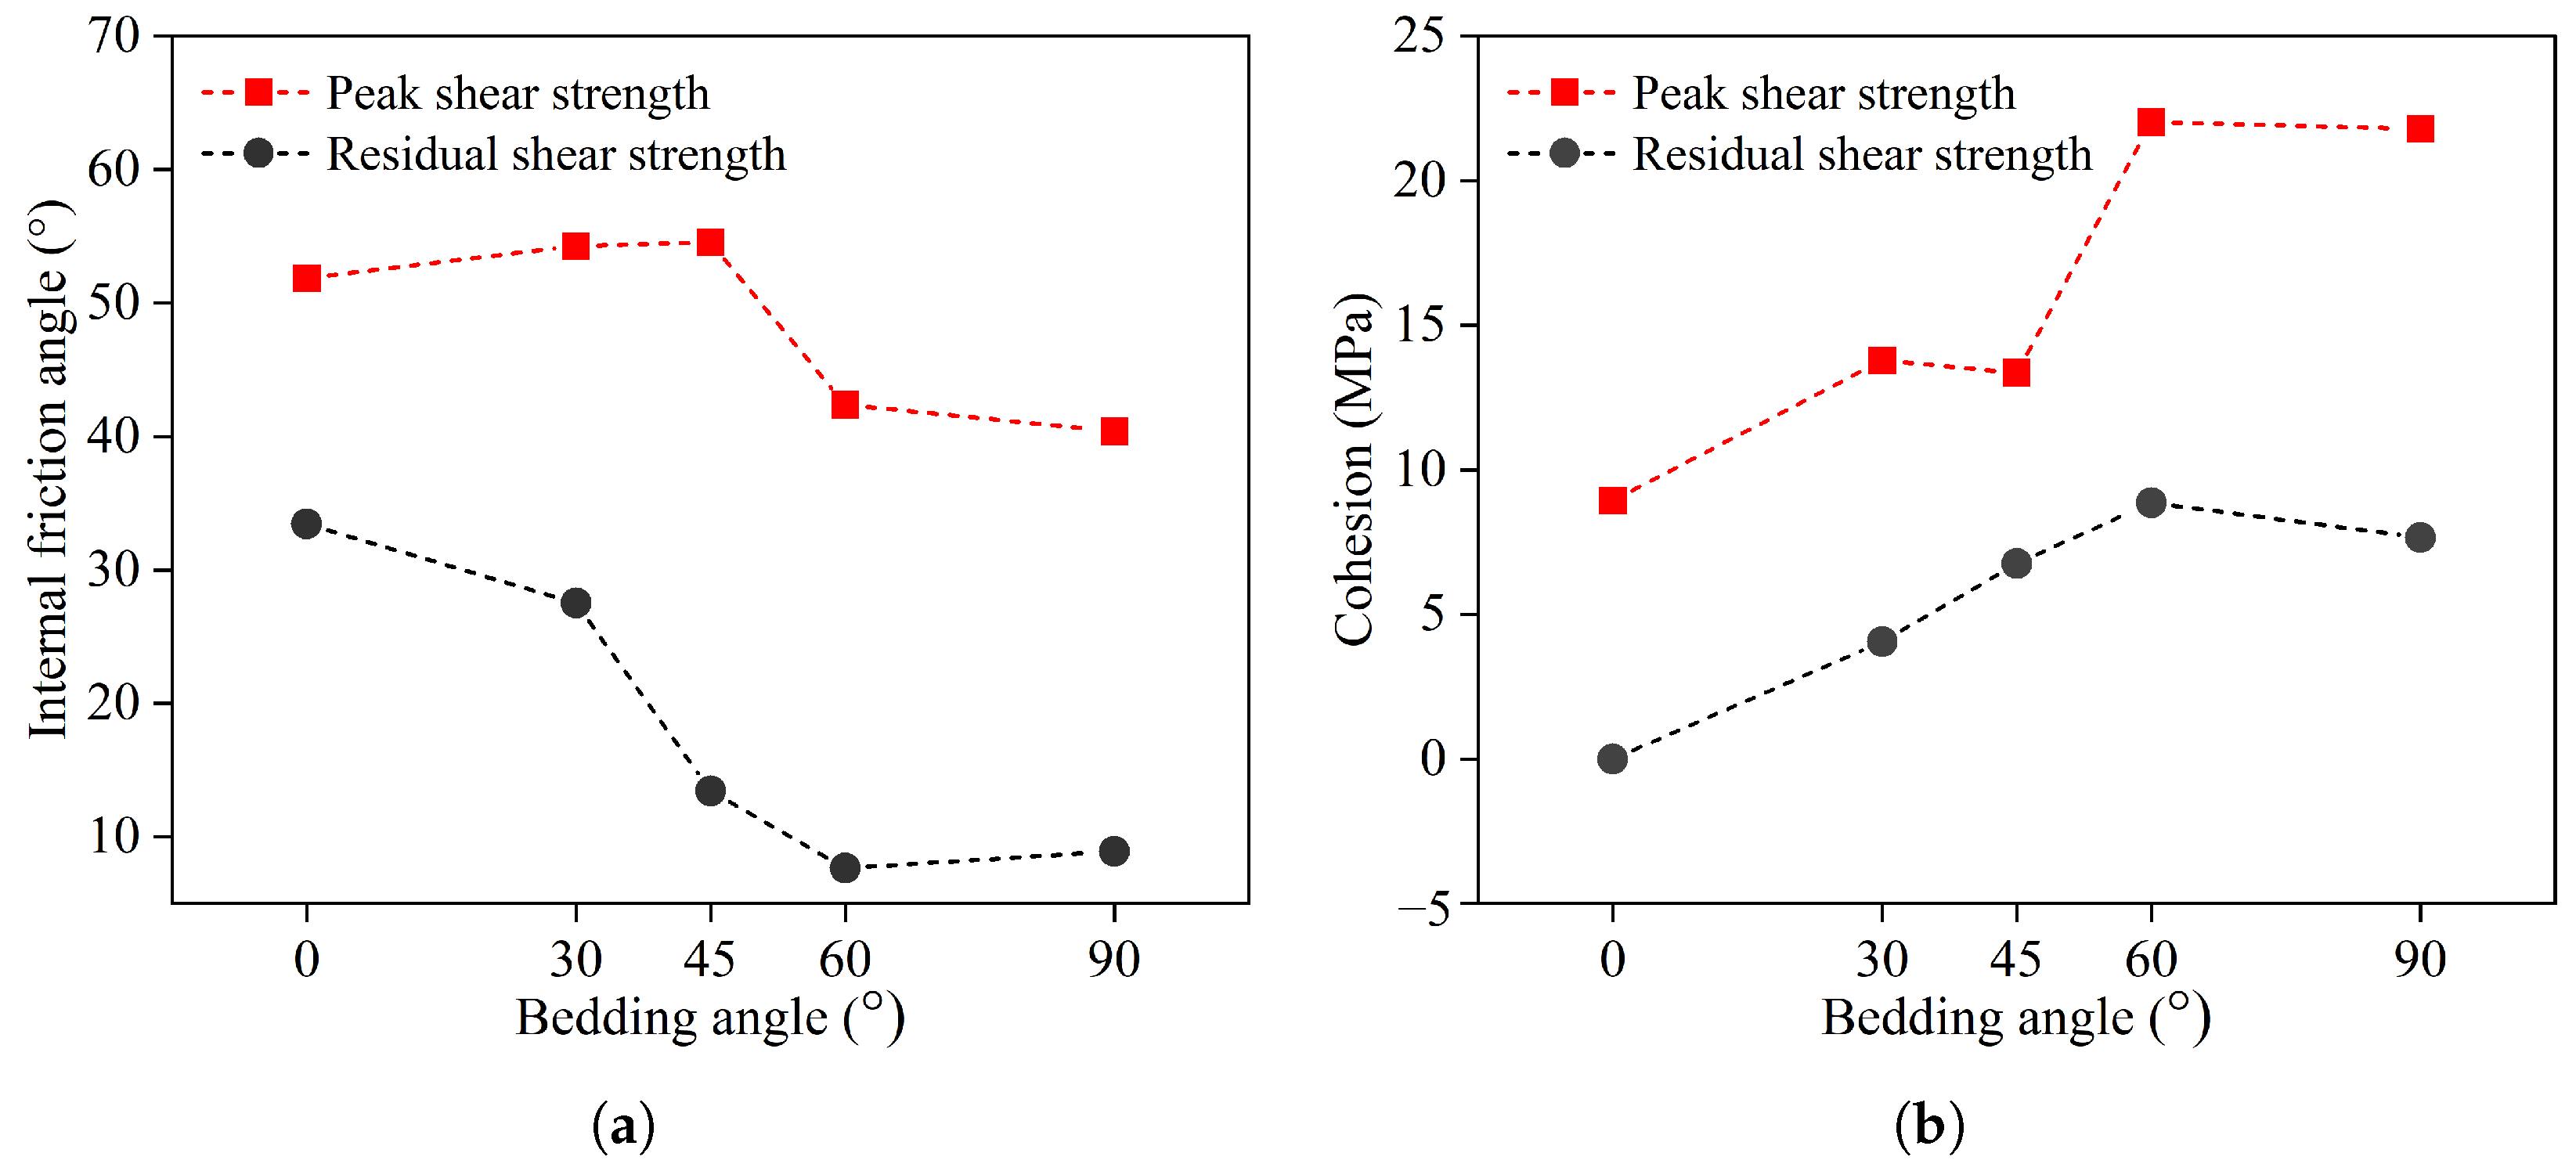
(2)
Both the peak and residual internal friction angles of shale bedding planes are greater than those of the shale matrix, whereas the cohesion values of the bedding planes are lower than those of the matrix. The peak internal friction angle reaches its maximum at a bedding angle of 45 , while the peak cohesion attains its maximum at a bedding angle of 60 . As the bedding angle increases from 0 to 90 , the bedding effect on the anisotropy of peak shear strength parameters (internal friction angle and cohesion) shows a staged evolution characterized by “plateau and step-like” transitions. Moreover, the bedding-induced anisotropy of the internal friction angle and cohesion for peak and residual shear strength exhibits opposite trends.
(3)
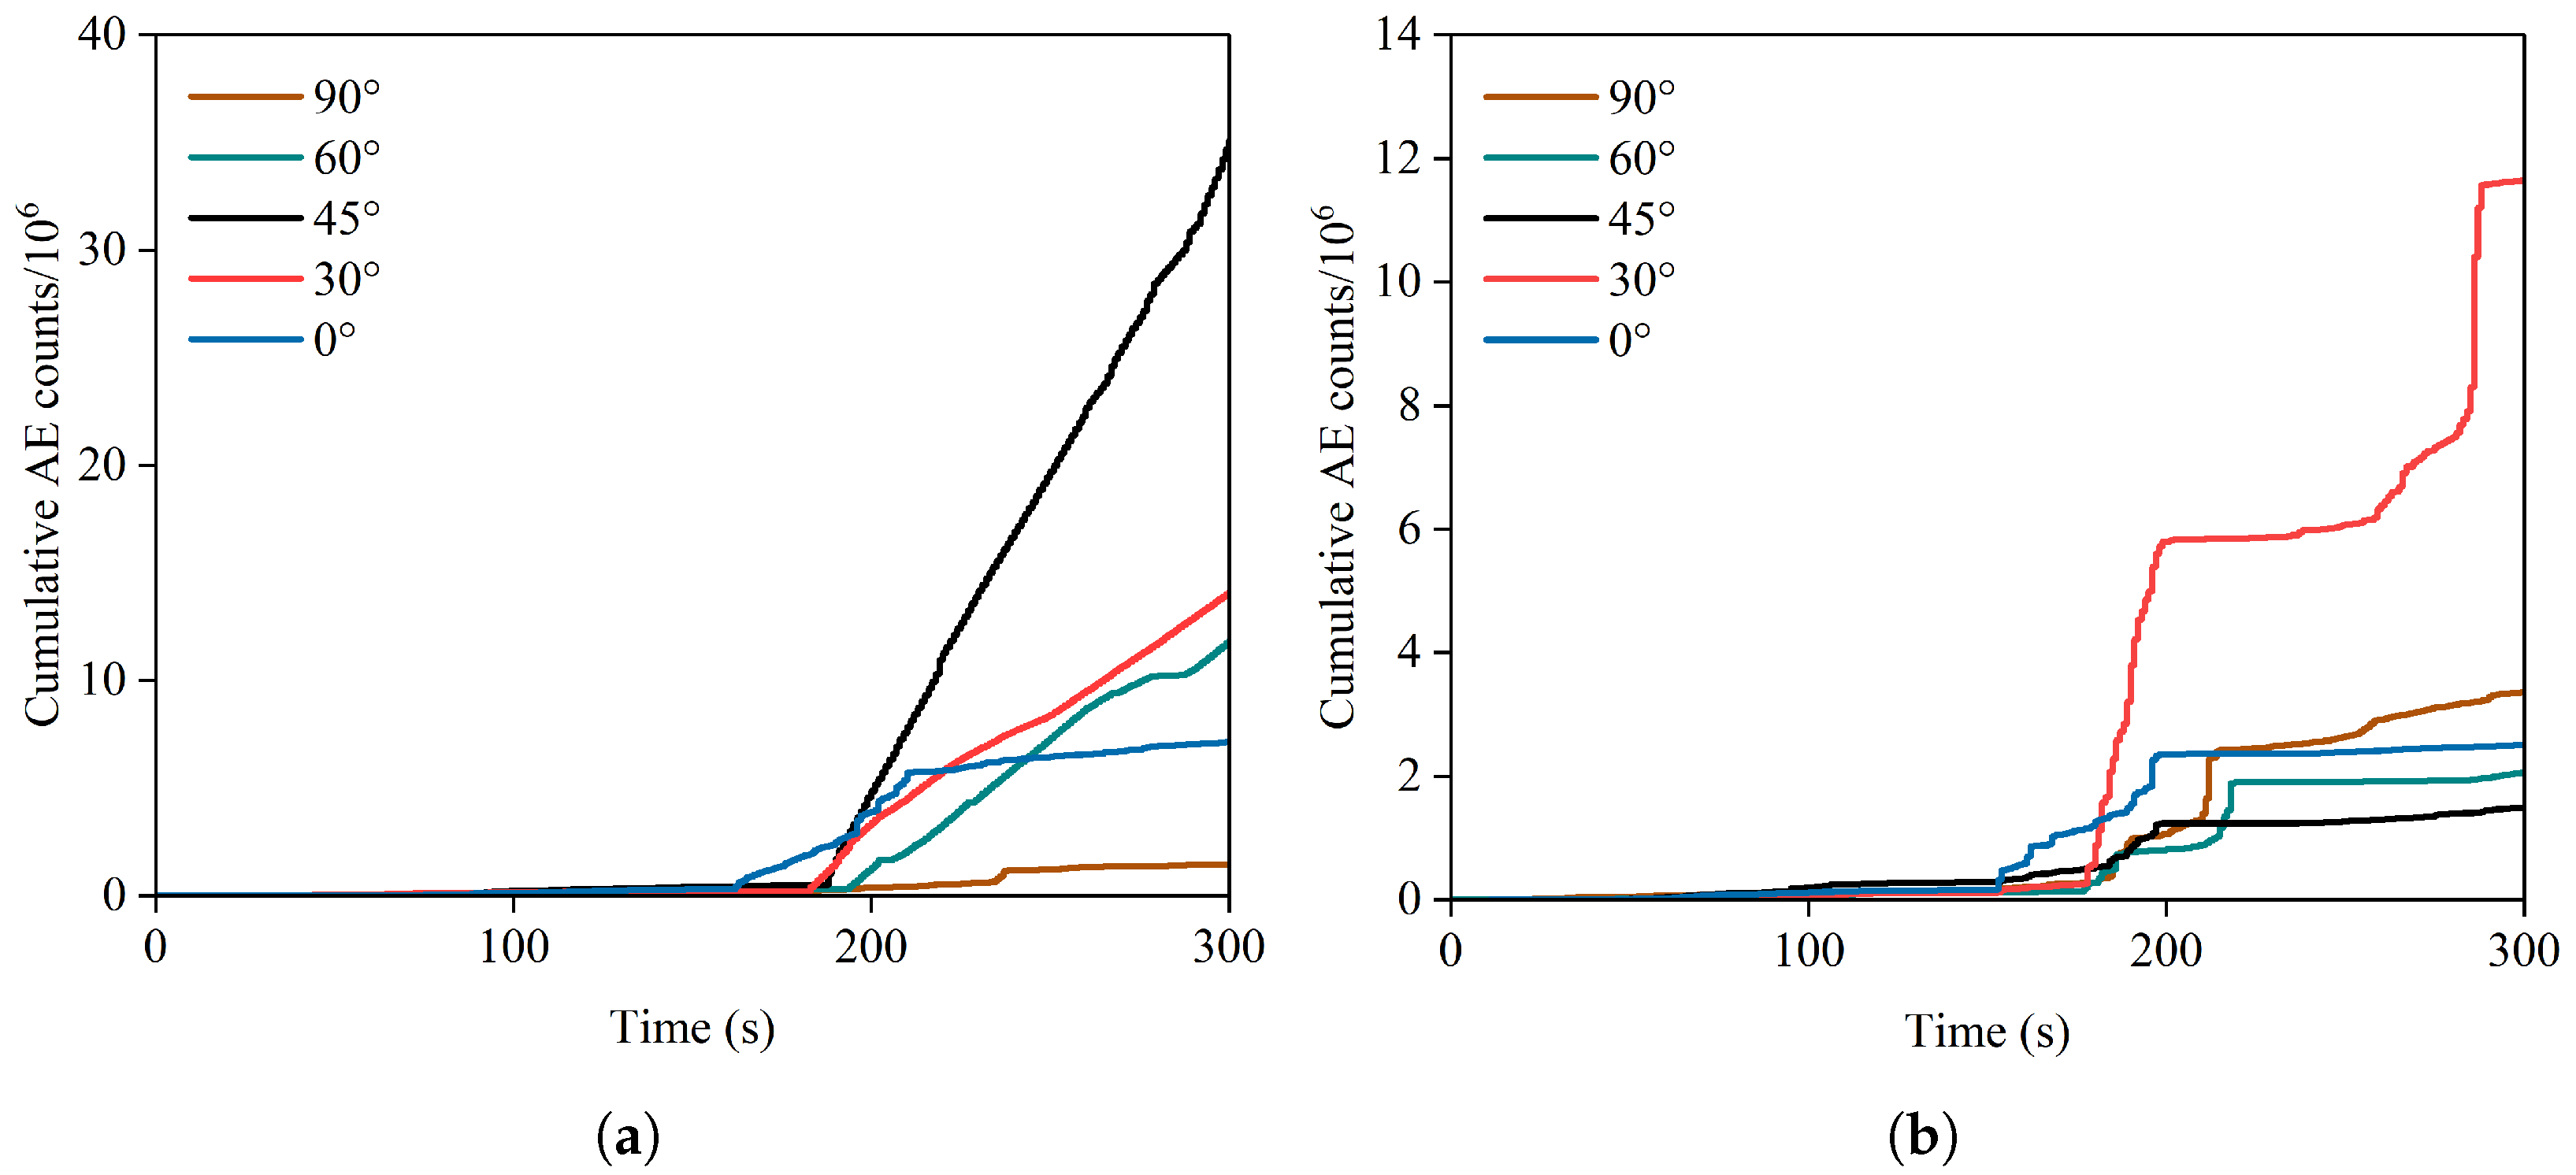
At lower normal stresses, the cumulative AE ringing count curves for shale shear failure follow an “S”-shaped pattern for bedded and matrix shear, differing from the piecewise linear pattern observed in bedded-matrix coupled shear. Under such conditions, macro- and mesoscale damage evolution is inconsistent but becomes increasingly aligned as normal stress increases, indicating a transition of the shear failure mechanism from non-coordinated to coordinated. Combined with acoustic emission (AE) monitoring, the microcrack evolution during shear can be evaluated in real-time, providing technical support for fracture mechanism analysis and fracture-type regulation, thereby enhancing the safety and controllability of shale gas extraction and geological sequestration projects.

Author Contributions

Conceptualization, B.Z. and S.Q.; methodology, S.Q. and S.G.; software, G.L., Z.Z., and T.W.; validation, B.Z.; formal analysis, Z.Z.; investigation, Z.Z., G.L., T.W., and J.J.; data curation, Z.Z.; writing—original draft preparation, Z.Z.; writing—review and editing, B.Z. and S.G.; funding acquisition, B.Z., S.Q., and S.G. All authors have read and agreed to the published version of the manuscript.

Funding

This work was funded by the National Natural Science Foundation of China under grant nos. 42141009, 42422706, and 41902289; the Key Research Program of the Institute of Geology and Geophysics, CAS, under grant no. IGGCAS-202201; and the Youth Innovation Promotion Association Foundation of the Chinese Academy of Sciences under grant no. 2023073.

Data Availability Statement

Data are contained within this article.

Conflicts of Interest

The authors declare no conflicts of interest.

References

  1. Sun, C.; Nie, H.; Dang, W.; Chen, Q.; Zhang, G.; Li, W.; Lu, Z. Shale Gas Exploration and Development in China: Current Status, Geological Challenges, and Future Directions. Energy Fuels 2021, 35, 6359–6379. [Google Scholar] [CrossRef]
  2. Josh, M.; Esteban, L.; Delle Piane, C.; Sarout, J.; Dewhurst, D.; Clennell, M. Laboratory characterisation of shale properties. J. Pet. Sci. Eng. 2012, 88–89, 107–124. [Google Scholar] [CrossRef]
  3. Wang, L.; Zhang, Y.; Zou, R.; Zou, R.; Huang, L.; Liu, Y.; Meng, Z.; Wang, Z.; Lei, H. A systematic review of CO2 injection for enhanced oil recovery and carbon storage in shale reservoirs. Int. J. Hydrogen Energy 2023, 48, 37134–37165. [Google Scholar] [CrossRef]
  4. Liang, X.; Zhang, J.; Zhang, H.; Xu, Z.; Zhang, D.; Zhu, D. Major discovery and high-efficiency development strategy of shallow shale gas: A case study of Taiyang shale gas field. China Pet. Explor. 2021, 26, 21–37. (In Chinese) [Google Scholar]
  5. Liang, X.; Xu, Z.; Zhang, Z.; Wang, W.; Zhang, J.; Lu, H.; Zhang, L.; Zou, C.; Wang, G.; Mei, J.; et al. Breakthrough of shallow shale gas exploration in Taiyang anticline area and its significance for resource development in Zhaotong, Yunnan Province, China. Pet. Explor. Dev. 2020, 47, 12–29. [Google Scholar] [CrossRef]
  6. Lu, Y. Accumulation and exploration enlightenment of shallow normal-pressure shale gas in southeastern Sichuan Basin, SW China. Pet. Explor. Dev. 2023, 50, 1308–1319. [Google Scholar] [CrossRef]
  7. Liu, Y.; Ma, T.; Wu, H.; Chen, P. Investigation on mechanical behaviors of shale cap rock for geological energy storage by linking macroscopic to mesoscopic failures. J. Energy Storage 2020, 29, 101326. [Google Scholar] [CrossRef]
  8. Zhang, Q.; Yue, X. Comparative Analysis of Shale Reservoir Exploitation Conditions in Southeast Sichuan. Multipurp. Util. Miner. Resour. 2022, 43, 109–119. [Google Scholar] [CrossRef]
  9. Ajibona, A.; Pandey, R.; Khanal, A.; Zenali, S.M.; Abdelaziz, S.L. Pycnometric evaluation of shale caprocks during underground hydrogen storage in depleted reservoirs. Int. J. Hydrogen Energy 2025, 101, 1312–1328. [Google Scholar] [CrossRef]
  10. Hou, L.; Elsworth, D.; Wang, J.; Zhou, J.; Zhang, F. Feasibility and prospects of symbiotic storage of CO2 and H2 in shale reservoirs. Renew. Sustain. Energy Rev. 2024, 189, 113878. [Google Scholar] [CrossRef]
  11. Huang, H.; Dong, M. CO2 containment and storage in organic-rich strata—State of the art and future directions. Int. J. Greenh. Gas Control 2024, 132, 104047. [Google Scholar] [CrossRef]
  12. Yan, C.; Deng, J.; Cheng, Y.; Li, M.; Feng, Y.; Li, X. Mechanical properties of gas shale during drilling operations. Rock Mech. Rock Eng. 2017, 50, 1753–1765. [Google Scholar] [CrossRef]
  13. Li, W.; Rezakhani, R.; Jin, C.; Zhou, X.; Cusatis, G. A multiscale framework for the simulation of the anisotropic mechanical behavior of shale. Int. J. Numer. Anal. Methods Geomech. 2017, 41, 1494–1522. [Google Scholar] [CrossRef]
  14. He, J.; Li, X.; Yin, C.; Zhang, Y.; Lin, C. Propagation and Characterization of the Micro Cracks Induced by Hydraulic Fracturing in Shale. Energy 2020, 191, 116449. [Google Scholar] [CrossRef]
  15. Sarout, J.; Guéguen, Y. Anisotropy of elastic wave velocities in deformed shales: Part 1—Experimental results. Geophysics 2008, 73, D75–D89. [Google Scholar] [CrossRef]
  16. Gao, Q.; Tao, J.; Hu, J.; Yu, X.B. Laboratory study on the mechanical behaviors of an anisotropic shale rock. J. Rock Mech. Geotech. Eng. 2015, 7, 213–219. [Google Scholar] [CrossRef]
  17. Ghazvinian, A.; Vaneghi, R.G.; Hadei, M.; Azinfar, M. Shear behavior of inherently anisotropic rocks. Int. J. Rock Mech. Min. Sci. 2013, 61, 96–110. [Google Scholar] [CrossRef]
  18. Mashhadiali, N.; Molaei, F. Theoretical and experimental investigation of a shear failure model for anisotropic rocks using direct shear test. Rock Mech. Min. Sci. 2023, 170, 105561. [Google Scholar] [CrossRef]
  19. Wu, Y.; Li, Y.; Luo, S.; Lu, M.; Zhou, N.; Wang, D.; Zhang, G. Multiscale elastic anisotropy of a shale characterized by cross-scale big data nanoindentation. Int. J. Rock Mech. Min. Sci. 2020, 134, 104458. [Google Scholar] [CrossRef]
  20. Amann, F.; Button, E.A.; Evans, K.F.; Gischig, V.S.; Blümel, M. Experimental study of the brittle behavior of clay shale in rapid unconfined compression. Rock Mech. Rock Eng. 2011, 44, 415–430. [Google Scholar] [CrossRef]
  21. Li, Y.; Zhang, L.; Liu, D.; Zuo, J.; Liu, S.; Dong, H. Application of micro-CT and digital volume correlation for investigating the macro-mesoscopic failure mechanism of shale under uniaxial loading: Insights into fracture behavior relevant to shale gas recovery. Bull. Eng. Geol. Environ. 2025, 84, 82. [Google Scholar] [CrossRef]
  22. Heng, S.; Guo, Y.; Yang, C.; Daemen, J.J.; Li, Z. Experimental and theoretical study of the anisotropic properties of shale. Int. J. Rock Mech. Min. Sci. 2015, 74, 58–68. [Google Scholar] [CrossRef]
  23. Lu, H.; Xie, H.; Luo, Y.; Ren, L.; Zhang, R.; Li, C.; Wang, J.; Yang, M. Failure characterization of Longmaxi shale under direct shear mode loadings. Int. J. Rock Mech. Min. Sci. 2021, 148, 104936. [Google Scholar] [CrossRef]
  24. Lei, B.; Zuo, J.; Coli, M.; Yu, X.; Li, Y.; Liu, H. Investigation on failure behavior and hydraulic fracturing mechanism of Longmaxi shale with different bedding properties. Comput. Geotech. 2024, 167, 106081. [Google Scholar] [CrossRef]
  25. Zhou, P.; Xie, H.; Wang, J.; Zou, B.; Hu, J.; Li, C. Thermal effects on mechanical and failure behaviors of anisotropic shale subjected to direct shear. Rock Mech. Geotech. Eng. 2024, 17, 2307–2327. [Google Scholar] [CrossRef]
  26. Li, T. Study on Anisotropic Mechanical Behavior of Reservoir Shale in Shear Failure. Master’s Thesis, Chongqing University, Chongqing, China, 2021. (In Chinese). [Google Scholar] [CrossRef]
  27. Fan, Z.; Ren, L.; Xie, H.; Zhang, R.; Li, C.; Lu, H.; Zhang, A.; Zhou, Q.; Ling, W. 3D anisotropy in shear failure of a typical shale. Pet. Sci. 2023, 20, 212–229. [Google Scholar] [CrossRef]
  28. Ye, C.; Xie, H.; Wu, F.; Hu, J.; Ren, L.; Li, C. Asymmetric failure mechanisms of anisotropic shale under direct shear. Int. J. Rock Mech. Min. Sci. 2024, 183, 105941. [Google Scholar] [CrossRef]
  29. Hu, J.; Yang, S.; Fu, D.; Rui, R.; Yu, Y.; Chen, Z. Rock mechanics of shear rupture in shale gas reservoirs. J. Nat. Gas Sci. Eng. 2016, 36, 943–949. [Google Scholar] [CrossRef]
  30. Li, N.; Zhang, S.; Zou, Y.; Ma, X.; Zhang, Z.; Li, S.; Chen, M.; Sun, Y. Acoustic Emission Response of Laboratory Hydraulic Fracturing in Layered Shale. Rock Mech. Rock Eng. 2018, 51, 3395–3406. [Google Scholar] [CrossRef]
  31. Niandou, H.; Shao, J.; Henry, J.; Fourmaintraux, D. Laboratory investigation of the mechanical behaviour of Tournemire shale. Int. J. Rock Mech. Min. Sci. 1997, 34, 3–16. [Google Scholar] [CrossRef]
  32. Yang, S.Q.; Yin, P.F.; Li, B.; Yang, D.S. Behavior of transversely isotropic shale observed in triaxial tests and Brazilian disc tests. Int. J. Rock Mech. Min. Sci. 2020, 133, 104435. [Google Scholar] [CrossRef]
  33. Li, C.; Xie, H.; Wang, J. Anisotropic characteristics of crack initiation and crack damage thresholds for shale. Int. J. Rock Mech. Min. Sci. 2020, 126, 104178. [Google Scholar] [CrossRef]
  34. Jia, Y.; Tang, J.; Lu, Y.; Lu, Z. Laboratory geomechanical and petrophysical characterization of Longmaxi shale properties in Lower Silurian Formation, China. Mar. Pet. Geol. 2021, 124, 104800. [Google Scholar] [CrossRef]
  35. Zhao, C.; Liu, J.; Xu, D.; Zhang, L.; Lyu, C.; Ren, Y. Investigation on Mechanical Properties, AE Characteristics, and Failure Modes of Longmaxi Formation Shale in Changning, Sichuan Basin, China. Rock Mech. Rock Eng. 2023, 56, 1239–1272. [Google Scholar] [CrossRef]
  36. Heng, S.; Li, X.; Liu, X.; Chen, Y. Experimental study on the mechanical properties of bedding planes in shale. J. Nat. Gas Sci. Eng. 2020, 76, 103161. [Google Scholar] [CrossRef]
  37. Fan, Z.; Xie, H.; Ren, L.; Zhang, R.; He, R.; Li, C.; Zhang, Z.; Wang, J.; Xie, J. Anisotropy in shear-sliding fracture behavior of layered shale under different normal stress conditions. J. Cent. South Univ. 2022, 29, 3678–3694. [Google Scholar] [CrossRef]
  38. Zhang, A.; Zhang, R.; Lu, H.; Yang, Z.; Zhang, Z.; Ren, L. Anisotropy in shear failure of shale: An insight from microcracking to macrorupture. Measurement 2025, 243, 116391. [Google Scholar] [CrossRef]
  39. Wu, S.; Ge, H.; Li, T.; Wang, X.; Li, N.; Zou, Y.; Gao, K. Characteristics of fractures stimulated by supercritical carbon dioxide fracturing in shale based on acoustic emission monitoring. Int. J. Rock Mech. Min. Sci. 2022, 152, 105065. [Google Scholar] [CrossRef]
  40. Liu, D.; Wang, Z.; Zhang, X.; Wang, Y.; Zhang, X.; Li, D. Experimental investigation on the mechanical and acoustic emission characteristics of shale softened by water absorption. J. Nat. Gas Sci. Eng. 2018, 50, 301–308. [Google Scholar] [CrossRef]
  41. Xie, Y.; Hou, M.Z.; Li, C. Anisotropic characteristics of acoustic emission and the corresponding multifractal spectrum during progressive failure of shale under cyclic loading. Int. J. Rock Mech. 2023, 165, 105364. [Google Scholar] [CrossRef]
  42. Du, K.; Li, X.; Tao, M.; Wang, S. Experimental study on acoustic emission (AE) characteristics and crack classification during rock fracture in several basic lab tests. Int. J. Rock Mech. Min. Sci. 2020, 133, 104411. [Google Scholar] [CrossRef]
  43. Qi, S.; Zheng, B.; Wu, F.; Huang, X.; Guo, S.; Zhan, Z.; Zou, Y.; Barla, G. A new dynamic direct shear testing device on rock joints. Rock Mech. Rock Eng. 2020, 53, 4787–4798. [Google Scholar] [CrossRef]
  44. Zheng, B.; Qi, S.; Huang, X.; Guo, S.; Wang, C.; Zhan, Z.; Luo, G. An Advanced Shear Strength Criterion for Rock Discontinuities Considering Size and Low Shear Rate. Appl. Sci. 2020, 10, 4095. [Google Scholar] [CrossRef]
  45. Zheng, B.; Qi, S.; Luo, G.; Liu, F.; Huang, X.; Guo, S.o. Characterization of discontinuity surface morphology based on 3D fractal dimension by integrating laser scanning with ArcGIS. Bull. Eng. Geol. Environ. 2021, 80, 2261–2281. [Google Scholar] [CrossRef]
  46. Luo, G.; Qi, S.; Zheng, B. Rate Effect on the Direct Shear Behavior of Granite Rock Bridges at Low to Subseismic Shear Rates. J. Geophys. Res. Solid Earth 2022, 127, e2022JB024348. [Google Scholar] [CrossRef]
  47. Liu, J.; Yang, D.; Hu, J.; Yu, B.; Nie, Z. Experimental Study on the Mechanical Properties and ionion Characteristics of Different Bedding High-Rank Coals. ACS Omega 2023, 8, 22168–22177. [Google Scholar] [CrossRef] [PubMed]
  48. Luo, G.; Qi, S.; Zheng, B. A comparative study of progressive failure of granite and marble rock bridges under direct shearing. Sci. Rep. 2024, 14, 10865. [Google Scholar] [CrossRef]
  49. Zhao, X.; Cai, M. A mobilized dilation angle model for rocks. Int. J. Rock Mech. Min. Sci. 2010, 47, 368–384. [Google Scholar] [CrossRef]
  50. Zheng, L.; Wang, L.; Zhu, L.; Fan, B.; Dong, M.; Sun, Z.; An, C. Analytical model of the shear behaviors of bolted rough joints based on the dilation effect and surface abrasion. Eng. Geol. 2021, 294, 106399. [Google Scholar] [CrossRef]
  51. Zhang, X.; Hu, B.; Li, J.; Huang, L.; Zhang, Z.; Li, B.; Zhong, Z.; Wan, C. Acid corrosion deterioration of carbonaceous shale: Mechanism revealed from shear properties and macro-micro structure. Constr. Build. Mater. 2025, 474, 141062. [Google Scholar] [CrossRef]
  52. Barton, N. Review of a new shear-strength criterion for rock joints. Eng. Geol. 1973, 7, 287–332. [Google Scholar] [CrossRef]
  53. Grasselli, G. Shear Strength of Rock Joints Based on Quantified Surface Description. Ph.D. Thesis, EPFL, Lausanne, Switzerland, 2001. [Google Scholar] [CrossRef]
  54. Grasselli, G.; Egger, P. Constitutive law for the shear strength of rock joints based on three-dimensional surface parameters. Int. J. Rock Mech. Min. Sci. 2003, 40, 25–40. [Google Scholar] [CrossRef]
  55. Huan, J.; He, M.; Zhang, Z.; Kong, X.; Shang, W. Reverse calculation and quantitative estimation of JRC3D for rough rock fracture surfaces in various shear directions. Phys. Chem. Earth 2024, 134, 103587. [Google Scholar] [CrossRef]
  56. Zheng, B.; Qi, S.; Guo, S.; Liang, N.; Luo, G.; Zhang, X.; Lu, W.; Jin, C.; Li, Y.; Yu, X.; et al. Experimental Study of Direct Shear Properties of Anisotropic Reservoir Shale. Energies 2024, 17, 1977. [Google Scholar] [CrossRef]
  57. Zhao, J.; Zhang, D. Dynamic microscale crack propagation in shale. Eng. Fract. Mech. 2020, 228, 106906. [Google Scholar] [CrossRef]
Figure 1. Sampling location and mineral composition of Longmaxi Formation shale samples used in the experiment. (a) Sampling location map of the Longmaxi Formation shale in Changning County, Sichuan Province, China, showing the sampling site in the Shuanghe section. (b) Mineral composition and proportion of shale samples obtained from XRD analysis.
Processes 13 01404 g001
Figure 2. Preparation method for shale specimens at different bedding angles. (a) Schematic diagram of bedding angles and sample dimensions. (b) Partial shale specimens.
Processes 13 01404 g002
Figure 3. Direct shear testing device and loading method. (a) Dynamic direct shear testing apparatus (modified after Qi et al. [43]). (b) Location of applied stress. Shear direction was defined based on footwall movement (right-lateral shearing).
Processes 13 01404 g003
Figure 4. Study area for three-dimensional morphology.
Processes 13 01404 g004
Figure 5. Acoustic emission device and sensor arrangement. (a) PAC acoustic emission device. (b) Sketch of the rock sample with the AE sensors ( l 1 = 15 mm, l 2 = 15 mm). (c) Shale sample with AE sensors (front view).
Processes 13 01404 g005
Figure 6. Stratigraphic mineral distribution and element distribution spectrum analysis of shale.
Processes 13 01404 g006
Figure 7. Microstructure of shale. (a) Stratigraphic morphology of shale with a bedding angle of 30 ° . (b) Stratigraphic morphology of shale with a bedding angle of 45 ° . (c) Intermatrix fractures. (d) Mineral interface fractures. (e) Quartz band and clay band fractures. (f) Intergranular pores.
Processes 13 01404 g007
Figure 8. Shear stress–strain curves for shale specimens with different bedding angles. Triplicate measurements under consistent conditions were conducted within the limits of acceptable experimental deviation.
Processes 13 01404 g008
Figure 9. Shear strength of shale under different bedding angles. (a) Peak shear strength. (b) Residual shear strength.
Processes 13 01404 g009
Figure 10. Shear strength of shale under different normal stresses. (a) Peak shear strength. (b) Residual shear strength.
Processes 13 01404 g010
Figure 11. Variation of internal friction angle and cohesion corresponding to the peak and residual shear strength of shale with bedding angle. (a) Internal friction angle. (b) Cohesion.
Processes 13 01404 g011
Figure 12. Shear modulus. (a) Influence of the bedding angle. (b) Influence of the normal stress.
Processes 13 01404 g012
Figure 13. Shear failure patterns and shear fracture surface morphology of shale specimens with different bedding angles under the 15 MPa normal stress. In the top view, the left side represents the upper shear fracture surface, while the right side represents the lower shear fracture surface.
Processes 13 01404 g013
Figure 14. Height difference of shear fracture surfaces (unit: mm) for shale specimens with different bedding angles.
Processes 13 01404 g014aProcesses 13 01404 g014b
Figure 15. Inclination of shear fracture surfaces in shale specimens with different bedding angles.
Processes 13 01404 g015
Figure 16. Slope of shear fracture surfaces in shale specimens with different bedding angles.
Processes 13 01404 g016
Figure 17. Three-dimensional surface morphological parameters. (a) Maximum height difference along the shear fracture surface. (b) JRC 3 D along the shear fracture surface.
Processes 13 01404 g017
Figure 18. Under a normal stress of 10 MPa, the progressive shear failure process of shale specimens with different bedding angles involves the evolution of shear stress, dilatancy displacement, AE energy, AE ringing count rate, cumulative AE energy, and cumulative AE ringing count.
Processes 13 01404 g018
Figure 19. Under a normal stress of 15 MPa, the progressive shear failure process of shale specimens with different bedding angles involves the evolution of shear stress, dilatancy displacement, AE energy, AE ringing count rate, cumulative AE energy, and cumulative AE ringing count.
Processes 13 01404 g019
Figure 20. Characterization of the five stages in the shear failure process.
Processes 13 01404 g020
Figure 21. Acoustic emission counts under different bedding conditions. (a) Shale specimens under 10 MPa normal stress. (b) Shale specimens under 15 MPa normal stress.
Processes 13 01404 g021
Figure 22. Acoustic emission energy rate under different bedding conditions. (a) Shale specimens under 10 MPa normal stress. (b) Shale specimens under 15 MPa normal stress.
Processes 13 01404 g022
Figure 23. Cumulative acoustic emission counts under different bedding conditions. (a) Shale specimens under 10 MPa normal stress. (b) Shale specimens under 15 MPa normal stress.
Processes 13 01404 g023
Figure 24. Cumulative acoustic emission energy under different bedding conditions. (a) Shale specimens under 10 MPa normal stress. (b) Shale specimens under 15 MPa normal stress.
Processes 13 01404 g024
Figure 25. RA–AF data density maps of shale samples with different bedding angles under 10 MPa normal stress. The red regions indicate higher data density, while the purple regions represent lower data density.
Processes 13 01404 g025
Figure 26. RA–AF data density maps of shale samples with different bedding angles under 15 MPa normal stress. The red regions indicate higher data density, while the purple regions represent lower data density.
Processes 13 01404 g026
Figure 27. Coefficient of variation.
Processes 13 01404 g027
Figure 28. Relationship between the average JRC 3 D of upper and lower shear fracture surfaces and shear strength of shales with different bedding orientations. (a) Relationship between the average peak shear strength and JRC 3 D for shales with different bedding orientations. (b) Relationship between the average residual shear strength and JRC 3 D for shales with different bedding orientations.
Processes 13 01404 g028
Figure 29. Peak cumulative acoustic emission counts, cumulative energy, and dilatancy displacement of shale with different bedding conditions. (a) Shale specimens under 10 MPa normal stress. (b) Shale specimens under 15 MPa normal stress.
Processes 13 01404 g029
Table 1. Shale peak shear strength parameters.
Bedding Angle (°)Normal Stress (MPa)Average Peak Strength (MPa)Fitting FormulaInternal Friction Angle (°)Cohesion (MPa)
1019.91 τ = 1.2729 σ n + 8.9324
R 2 = 0.921
51.858.93
1531.45
2032.78
2540.68
30°1026.23 τ = 1.3906 σ n + 13.786
R 2 = 0.9617
54.2813.79
1537.91
2039.45
2548.90
45°1025.81 τ = 1.404 σ n + 13.353
R 2 = 0.9324
54.5413.35
1537.02
2040.97
2547.89
60°1031.99 τ = 0.9126 σ n + 22.024
R 2 = 0.8645
42.3822.02
1536.11
2036.94
2546.92
90°1030.51 τ = 0.8504 σ n + 21.79
R 2 = 0.9139
40.3821.79
1535.45
2036.37
2544.37
Table 2. Shale residual shear strength parameters.
Bedding Angle (°)Normal Stress (MPa)Average Residual Strength (MPa)Fitting FormulaInternal Friction Angle (°)Cohesion (MPa)
107.18 τ = 0.6603 σ n 0.0588
R 2 = 0.9697
33.440
159.24
2012.45
2517.11
30°108.76 τ = 0.5209 σ n + 4.0642
R 2 = 0.9576
27.524.06
1512.23
2015.30
2516.42
45°108.90 τ = 0.2391 σ n + 6.7587
R 2 = 0.9008
13.456.76
1510.99
2011.00
2512.88
60°109.14 τ = 0.1344 σ n + 8.8566
R 2 = 0.31
7.658.86
1511.81
2012.83
2511.05
90°109.20 τ = 0.1569 σ n + 7.6582
R 2 = 0.1668
8.927.66
1511.65
207.60
2513.17
Table 3. Comparison of shear strength parameters of shale specimens with different geometries.
ResourceBedding Angle (°)c (MPa) φ (°)
This work (cuboid sample)90°21.7940.38
8.9351.85
[38] (cubic sample)90°25.8939.08
17.4443.88
[27] (cubic sample)90°29.8344.89
23.8546.50
[23] (cubic sample)90°31.1527.11
19.4932.94
[36] (cylindrical sample)90°36.2216.18
31.228.93
[12] (cylindrical sample)90°25.2232.24
4.9125.90
[22] (cylindrical sample)90°16.0435.34
8.9232.31
Disclaimer/Publisher’s Note: The statements, opinions and data contained in all publications are solely those of the individual author(s) and contributor(s) and not of MDPI and/or the editor(s). MDPI and/or the editor(s) disclaim responsibility for any injury to people or property resulting from any ideas, methods, instructions or products referred to in the content.

