Abstract
With the development of intelligent grid systems, smart circuit breakers are widely used. The control circuit is the core component of the smart circuit breaker, making its performance degradation characteristics highly significant. This paper focuses on the control circuit’s accelerated degradation test and performance degradation characteristics. First, an accelerated degradation test is designed, and a test platform is established. By analyzing the degradation mechanism of the intelligent circuit breaker control loop, the key weak links in the control loop are determined, and then the monitoring quantity is determined. Then, degradation data are preprocessed to extract features from the time, frequency, and wavelet domains. The multidimensional evaluation index model is applied to select the optimal features, fit the degradation trend, and use the fixed segmentation algorithm to divide the degradation stages and analyze the performance degradation characteristics of the control circuit. The experimental results show that the turning points of the two-stage degradation process at 85 °C, 95 °C, and 105 °C are 78.8%, 77.6%, and 77.0%, respectively. The position of the turning point is relatively fixed. The key circuit’s PSpice simulation model is built to verify the two-stage nonlinear characteristics observed in the experimental results. Finally, the results are verified by the Pearson correlation coefficient. The results show that the Pearson correlation coefficient between the simulation and accelerated life test results is above 0.9158, and the consistency between the two is high.
1. Introduction
With the continuous development and change of electronic technology, electronic products in the field of low-voltage electrical appliances have shown the characteristics of long life and high reliability. The performance degradation process of electronic products is very slow. Accelerated degradation testing is an important means to quickly obtain the life data of electronic products, and data must be obtained during the degradation process to conduct a reliability assessment and expose the defects of electronic products in a timely manner [1]. The research field of electronic product performance degradation and reliability is mainly divided into two categories: device level and module level [2]. The authors of [3] used an electronic design automation circuit simulation platform to conduct orthogonal simulation experiments, built a database to characterize power supply degradation, and derived the functional relationship between different stress factors and power supply output, which can be used to evaluate the health status under any stress combination. The authors of [4,5,6] designed accelerated degradation tests, monitored system output voltage and current parameters, established accelerated life models, and analyzed model parameter estimation methods.
Most of the above performance degradation modeling methods only consider that electronic products follow a single-stage degradation process, that is, they assume that the performance degradation rate of electronic products remains unchanged [7]. However, in engineering practice, due to the complexity of the internal failure mechanism of electronic products and the dynamic nature of external environmental factors, the macroscopic degradation process of electronic products often presents a two-stage or even multi-stage degradation characteristic [8]. Each degradation stage has statistical characteristics that vary greatly, and there are “change points” in the degradation process, which means that the performance degradation rate of electronic products will change [9]. The authors of [10] used the output voltage and current of the LED driver as the key indicator parameters to evaluate the life of the power supply, designed a constant temperature stress accelerated degradation test platform, and established a Wiener degradation process model with parameter drift. The authors of [11] studied the storage degradation process of torpedoes, fully considered the degradation information in the full degradation stage, established a torpedo component performance degradation model based on a two-stage degradation process with Bayesian theory to estimate the real-time parameters and reliability of the model, and provided a method for estimating the degradation change point.
Zhou J et al. [12] used the shrinkage trend obtained by the two-stage shrinkage model to construct a hybrid framework of input and output of machine learning algorithms for shrinkage prediction. This significantly improved the estimation efficiency of product reliability and expected shrinkage. Yajing Li proposed a residual life prediction method that considers the complementarity of positively and negatively correlated features. An adaptive clustering method was used to group features into two sets: one positively correlated and the other negatively correlated with residual life. The method leverages the complementary effect of these feature groups to improve the prediction accuracy of residual life [13]. Zheng X et al. [14] proposed a two-stage ageing framework based on Gaussian process recovery. In constructing the ageing change model, the appropriate detection method is determined according to the position of the point to realize the change in the real-time resting mode. The results show that the two-stage degradation model is effective and has greater room for development than previous performance degradation modeling methods.
The main work of this paper includes the following three parts:
The first part mainly analyzes the performance degradation mechanism of the intelligent circuit breaker control circuit, determines the key components and key modules that affect the degradation rate, and then determines the monitoring quantity.
The second part mainly involves accelerated degradation test design and characteristic analysis. The test platform is built for data acquisition, and the multi-dimensional evaluation index method is used to determine the optimal characteristic quantity as the peak-to-peak value of the motor terminal voltage. By fitting the optimal characteristic quantity, the degradation characteristics of the intelligent circuit breaker control circuit, which are two-level nonlinear characteristics, are obtained, and the degradation stage is divided by the important point fixed segmentation algorithm.
In the third part, the PSpice simulation model of the key circuit is built, and the evolution trend of the simulation degradation characteristic parameters is consistent with the two-stage nonlinear characteristics proposed in the second part. Finally, the simulation results are compared with the accelerated life test results obtained using the Pearson correlation coefficient. The results show that the Pearson correlation coefficient is above 0.9158, and the consistency between the two is high.
2. A Study on the Mechanism of Control Circuit Performance Degradation
2.1. Control Circuit Working Principle
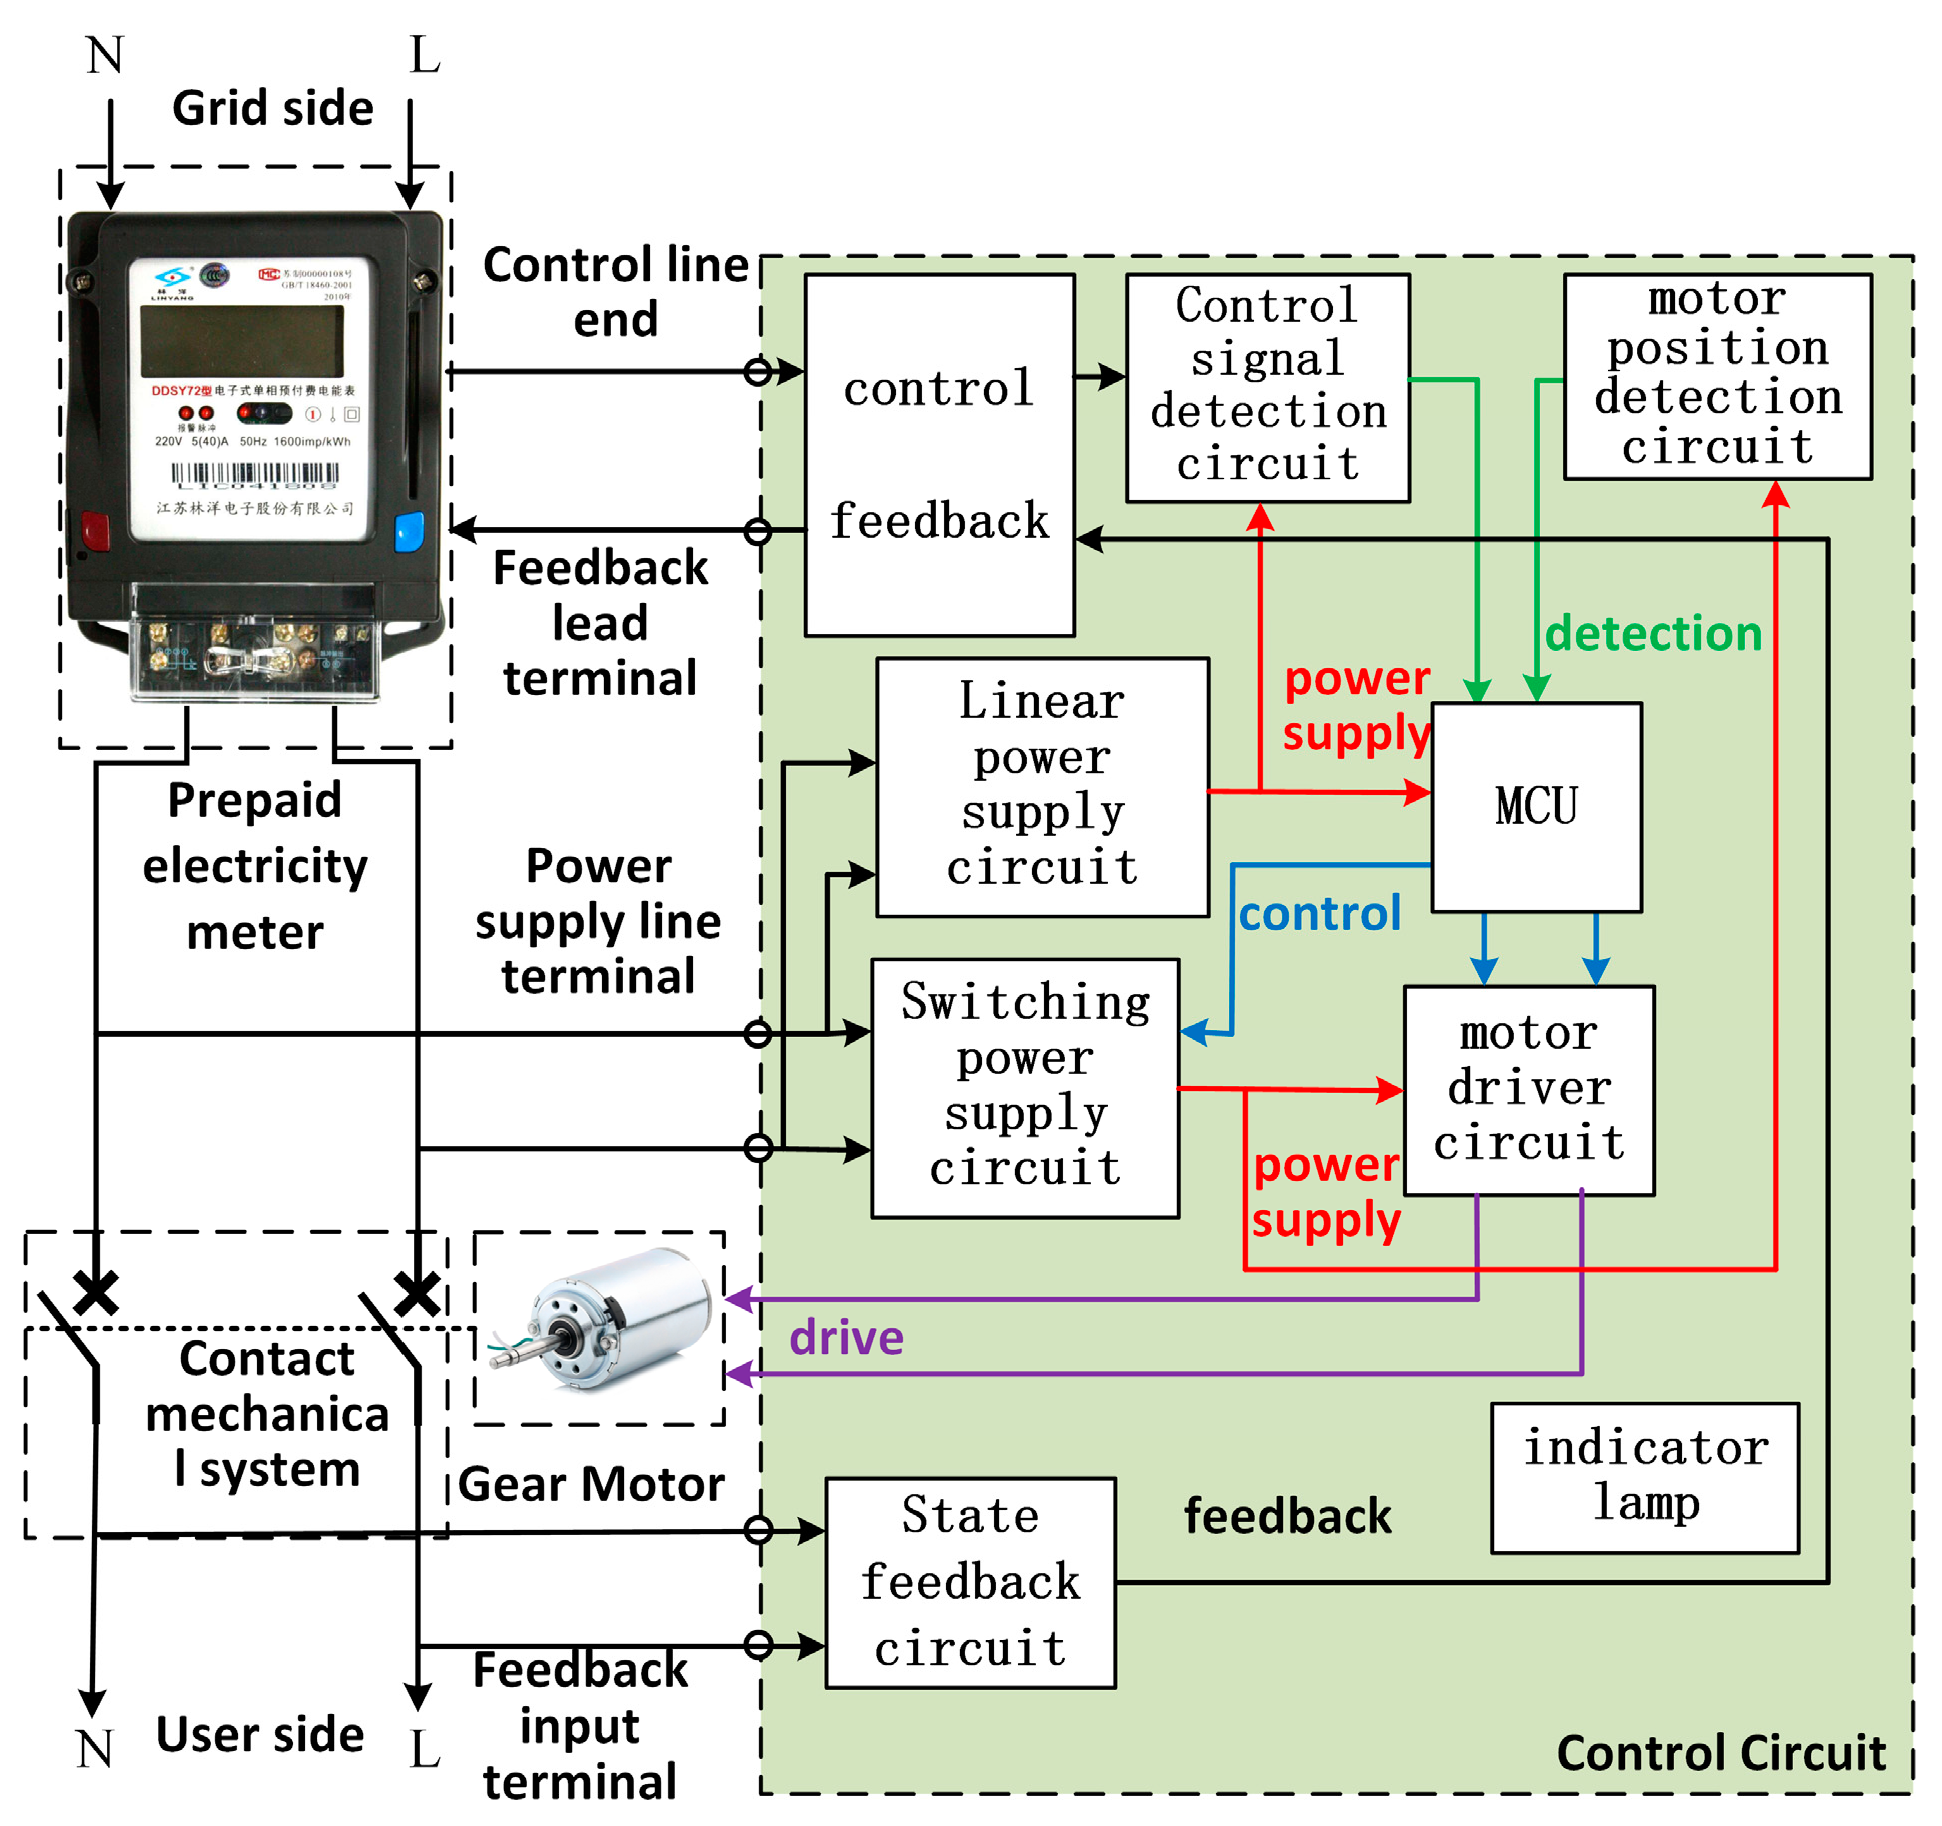
The intelligent circuit breaker consists of two parts: an intelligent electronic system and a contact mechanical system. As shown in Figure 1, the intelligent electronic system includes a control circuit and a gear motor.
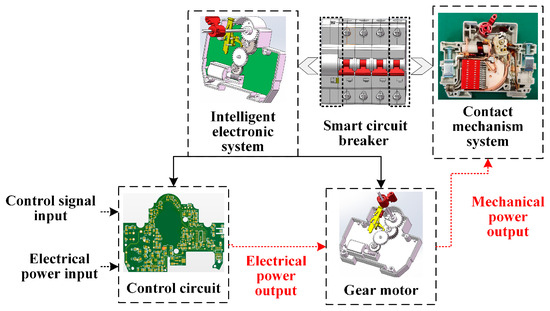
Figure 1.
Diagram of intelligent circuit breaker system structure.
According to Figure 1, the control circuit receives and determines the opening/closing control signal input from the outside. The function of the gear motor is to convert the electrical power input from the control circuit into mechanical power output. The main function of the contact mechanical system is to utilize the mechanical power transmitted by the gear motor, as shown in Figure 2.
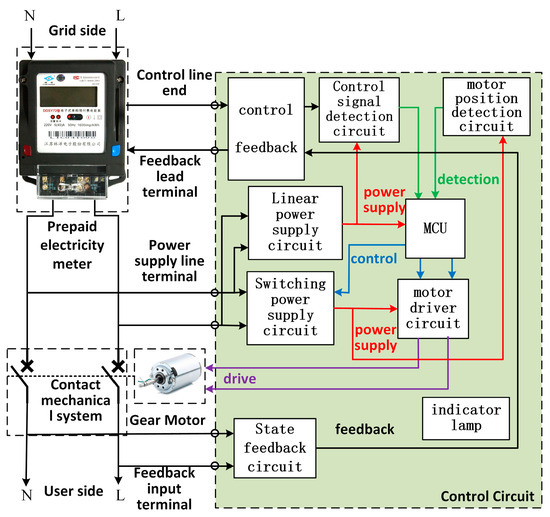
Figure 2.
Intelligent circuit breaker control circuit block diagram.
According to Figure 2, the control circuit can be divided into the following functional modules: power supply, microcontroller, position detection, motor drive, control signal detection, and ON/OFF state feedback. These functional modules are interconnected and cannot operate independently. The power supply consists of two parts: a linear power supply and a switching power supply. The linear power supply provides power to the microcontroller and the control signal detection circuit. The switching power supply circuit adopts low-power consumption technology. The microcontroller controls the circuit system to activate the switching power supply when it receives an external control command. Once the control command has been executed, the switching power supply is turned off to avoid unnecessary power consumption by the user. The control signal detection circuit converts the state information of the meter (voltage signal: AC 220 V–0 V), indicating whether there are arrears, into a DC signal (DC 4 V–0 V), which is then processed and judged by the microcontroller. The ON/OFF state feedback circuit transmits the status information of the connected or disconnected power supply circuit to the energy meter via the feedback terminal. The motor position detection circuit is used to detect the motor’s position and to limit the maximum rotation angle of the motor.
The hardware circuit board of the control circuit is shown in Figure 3.
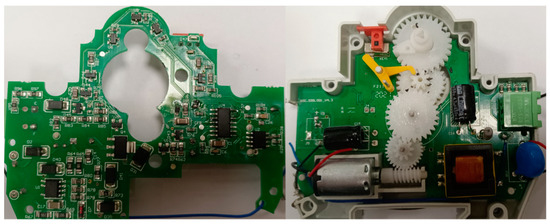
Figure 3.
Control circuit board of intelligent circuit breaker.
It can be seen from Figure 3 that the left image is the main control circuit board. This part of the key components includes an integrated circuit chip responsible for signal processing and control logic. Passive devices such as resistors and capacitors are used for filtering, current limiting, and other functions. Transistors or driver elements are used to control output or switching operations. The image on the right side is the gear drive and execution module, which is the view of the integrated circuit board and the mechanical structure, showing the core of the entire actuator. The DC motor performs physical action through the connected gear drive system. Multi-stage gear sets are used for deceleration and force augmentation to achieve more precise mechanical control. The limit switch is used to detect the current position of the gear or component to prevent overshoot. A relay or power device controls the start–stop process or switching of the motor.
2.2. Determination of Key Modules and Impact Analysis
According to engineering experience statistics, although the failure mechanisms of different components are different, the change in the failure rate over time can be roughly divided into three stages: the early failure period, the accidental failure period, and the wear-out failure period [15]. Through the reliability analysis of the intelligent circuit breaker control circuit, the following mathematical model is obtained:
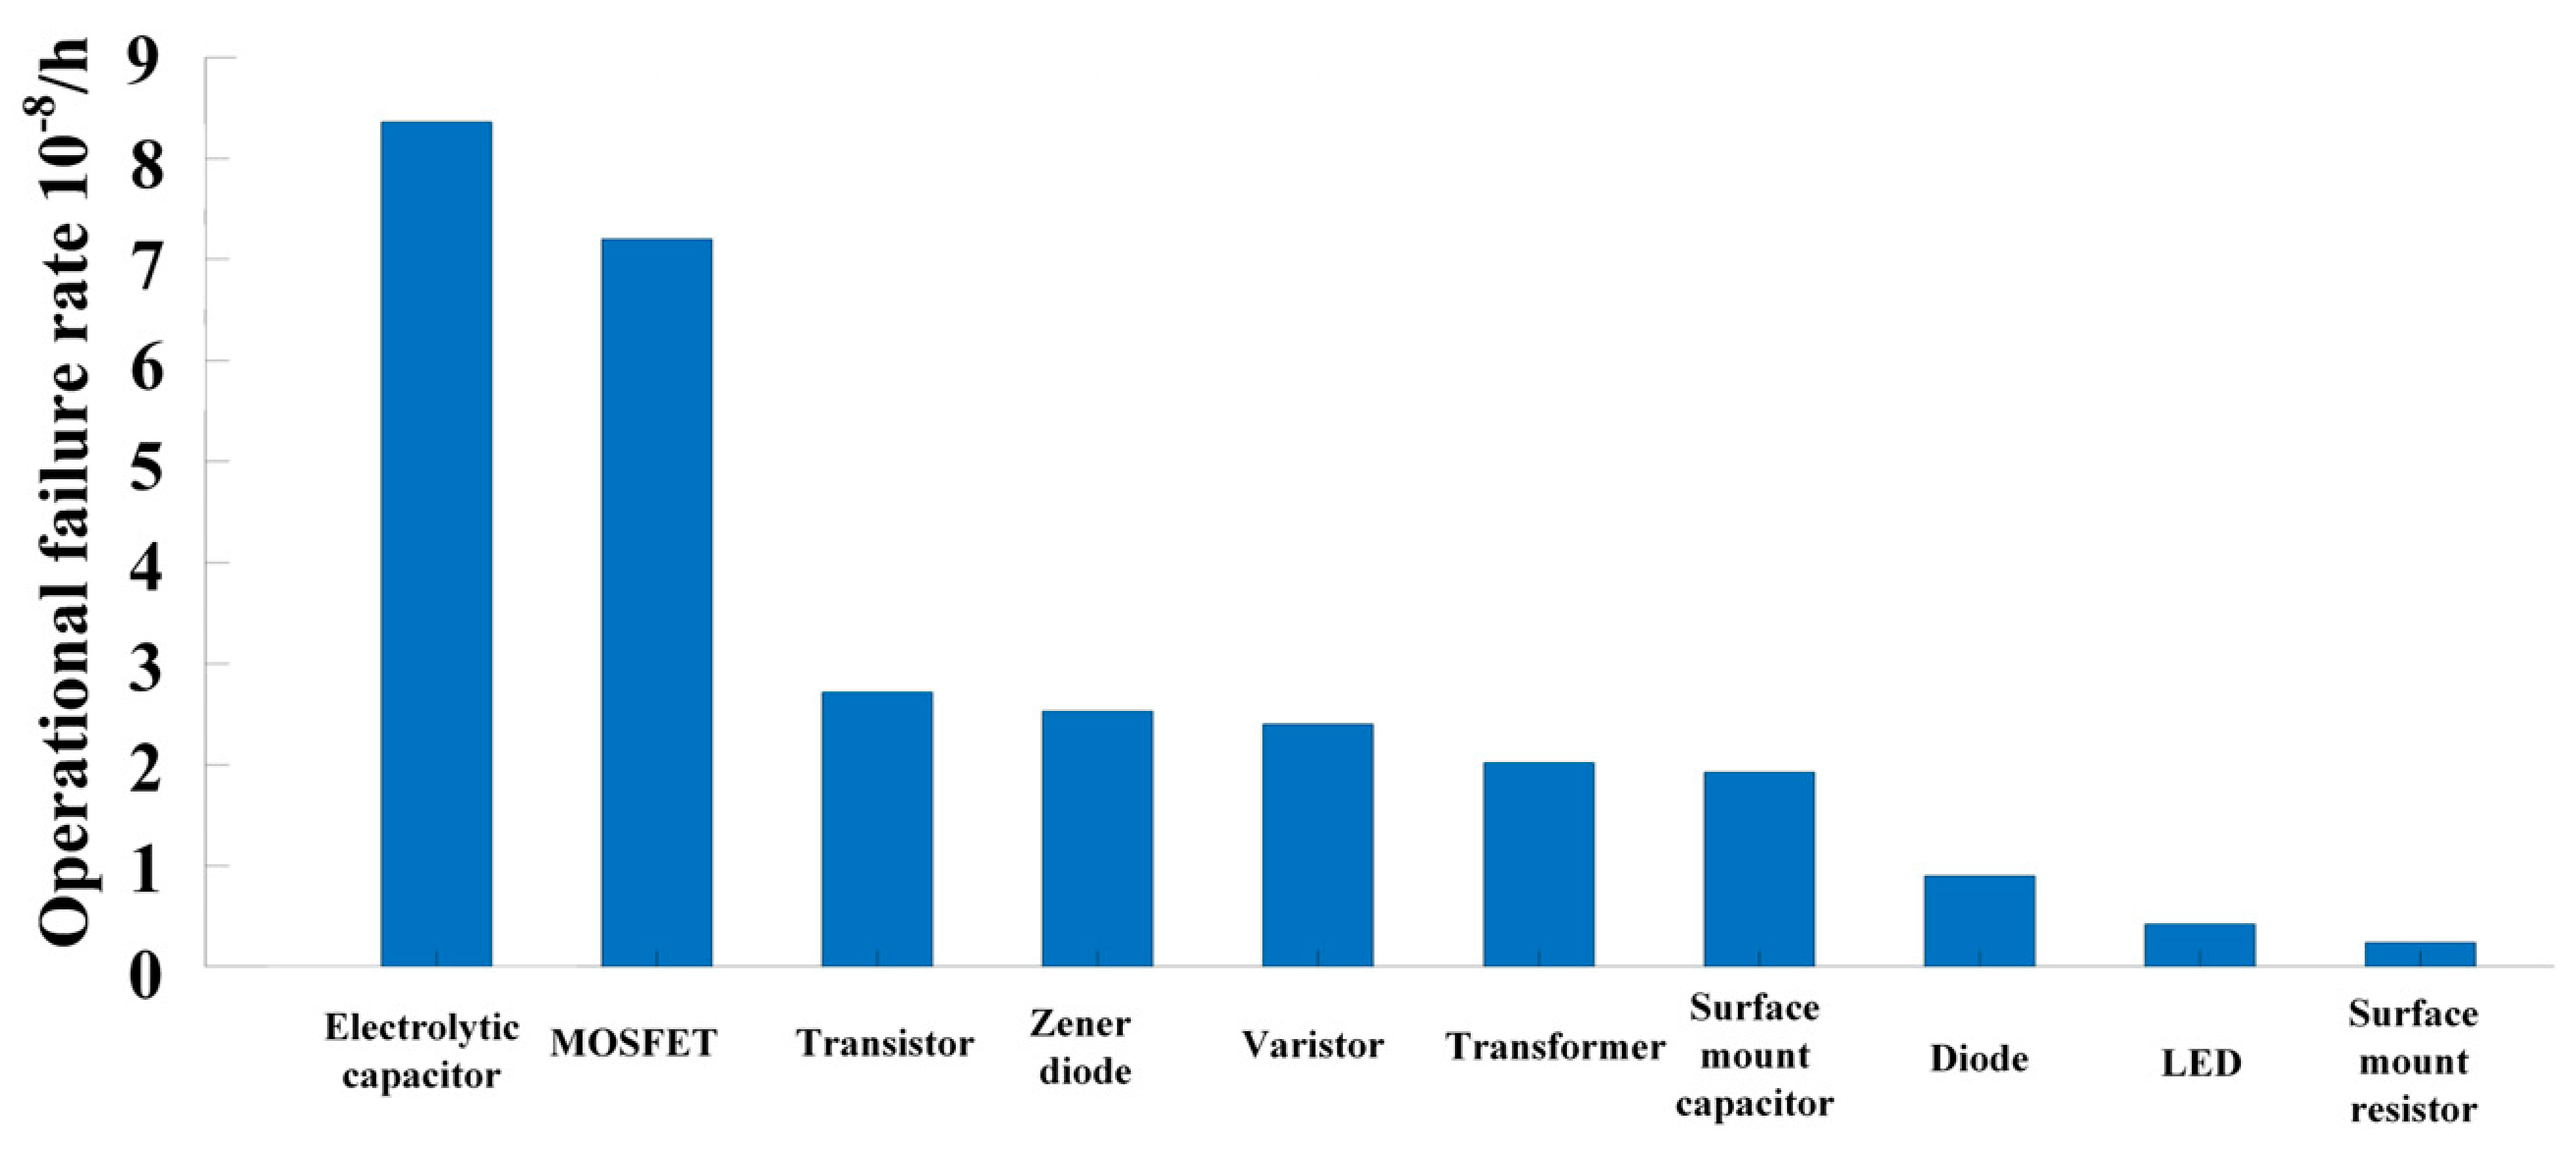
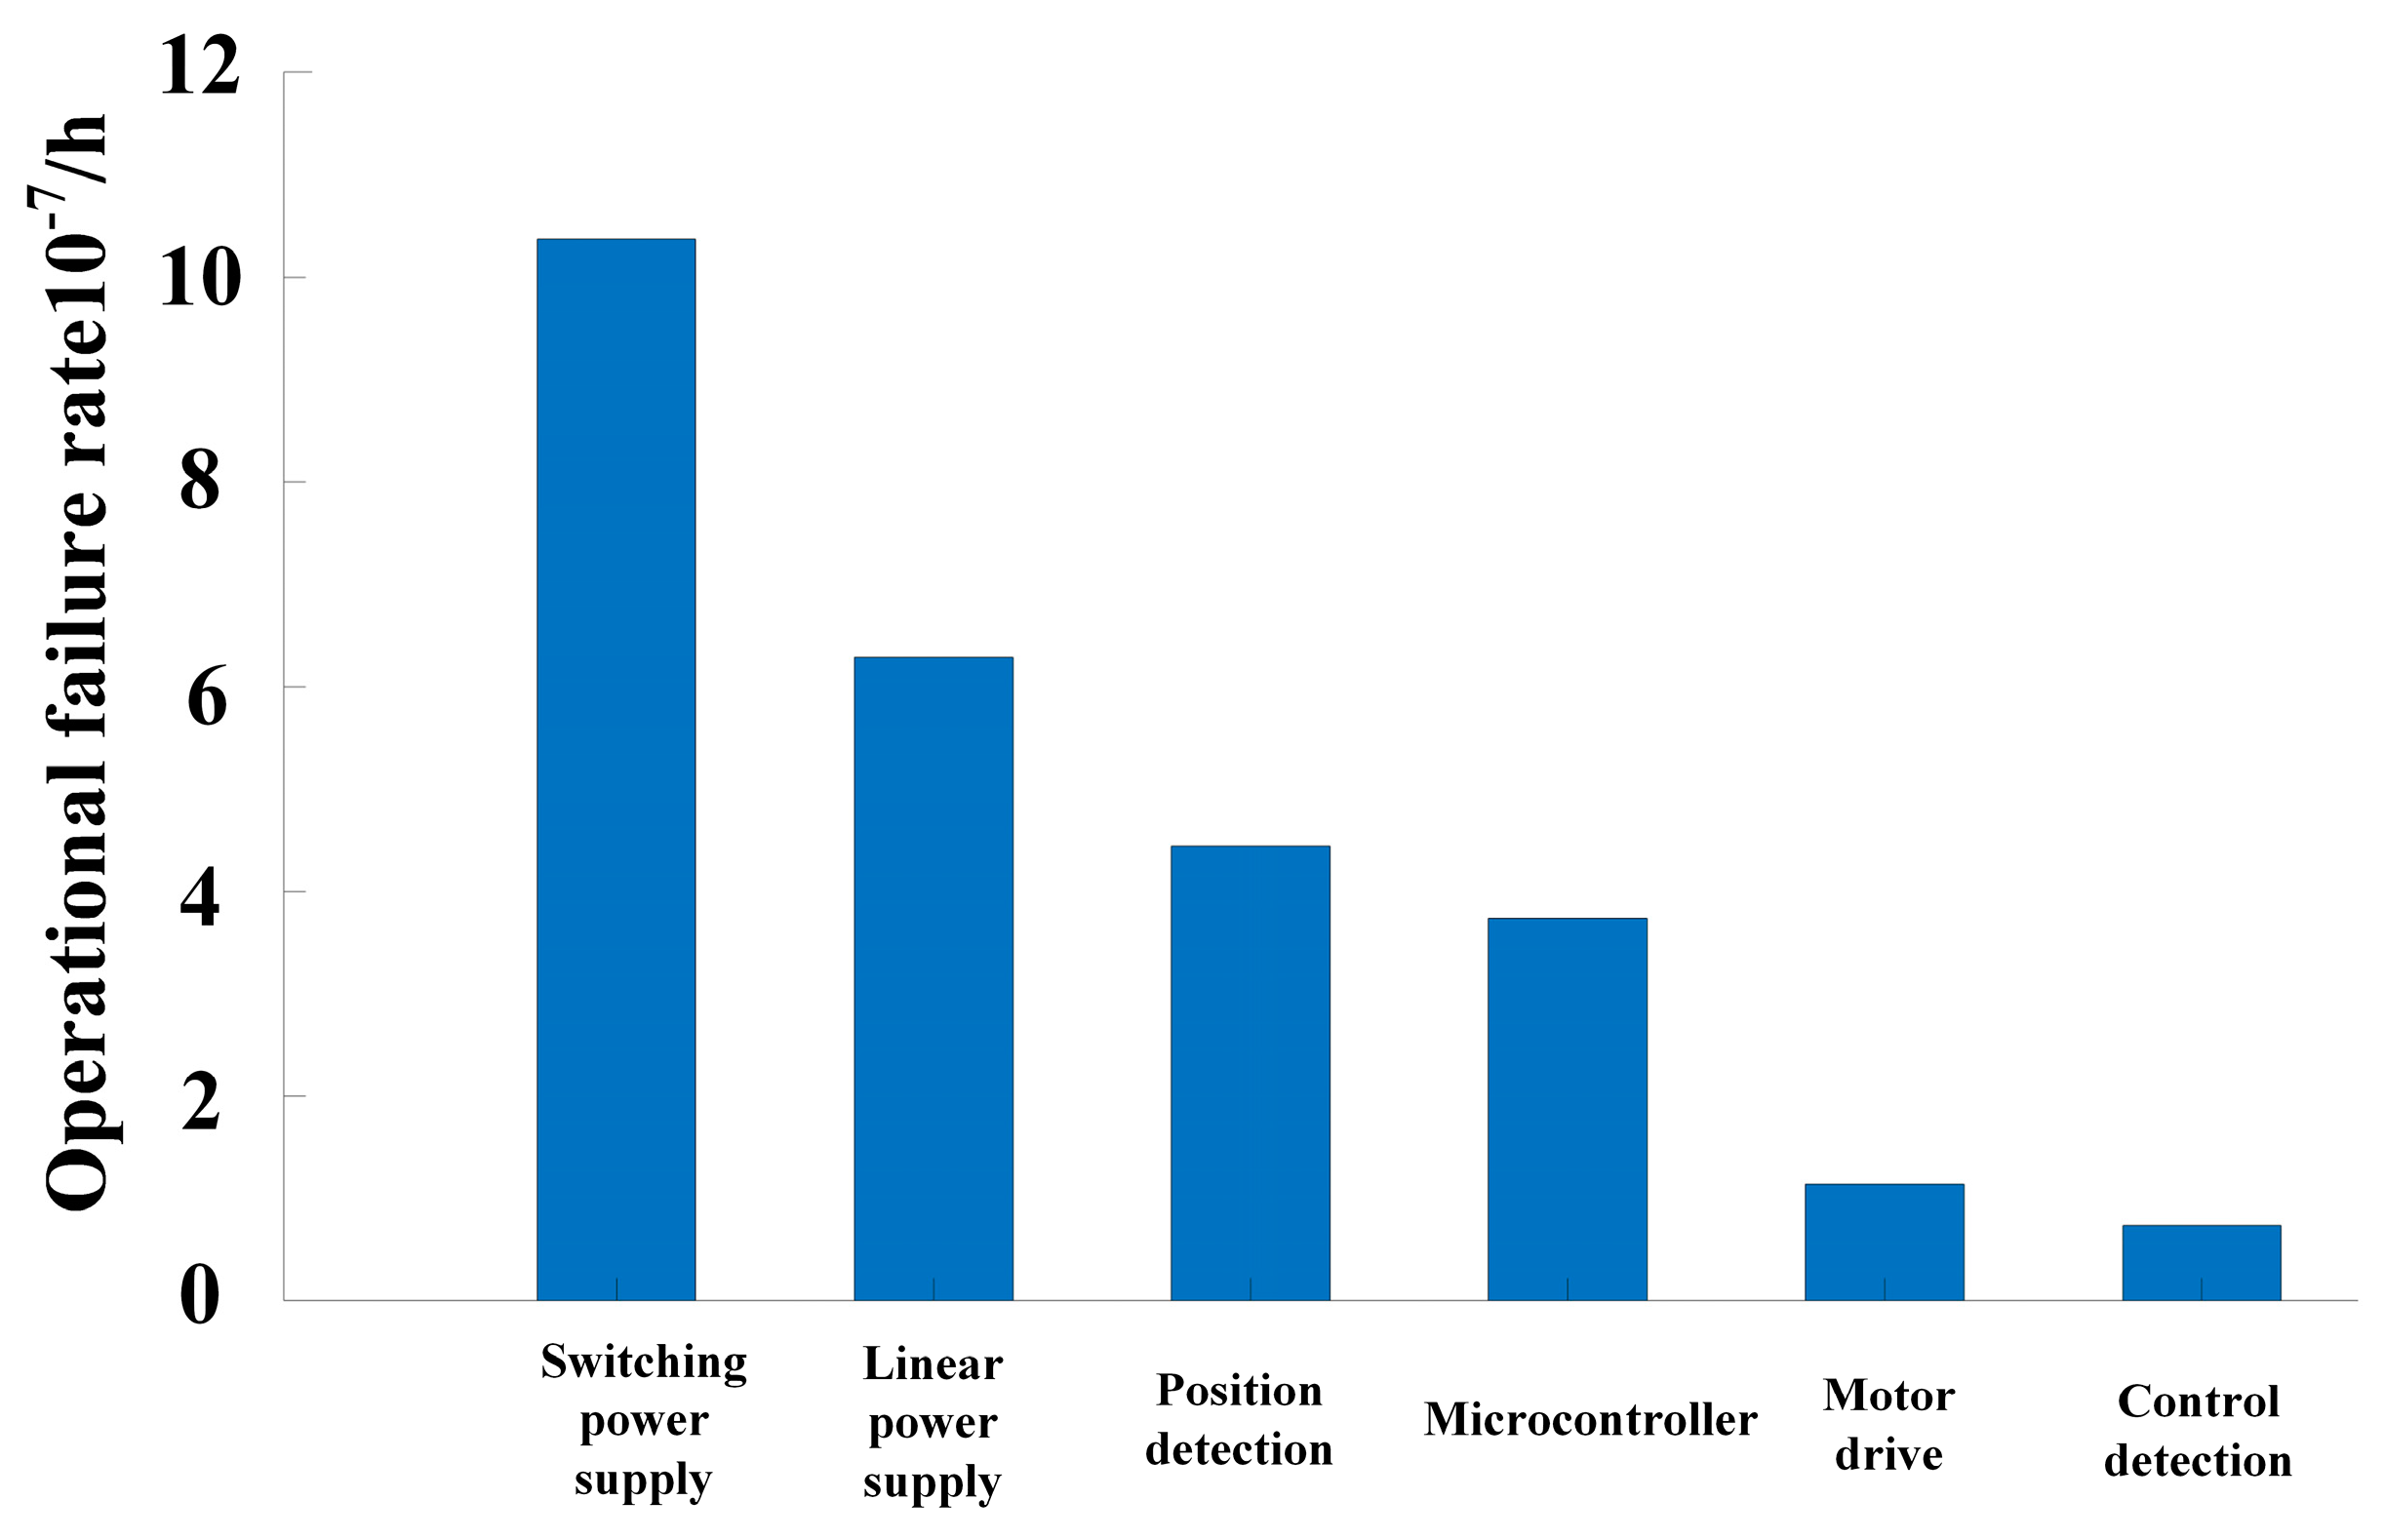
In the formula, λs is the failure rate of the control circuit; λi is the failure rate of the i-th component in the circuit; and TBF is the mean time between failures of the control circuit. The failure rates of each component and functional module are calculated, and a bar chart is drawn with the failure rates of each component and functional module sorted from high to low, as shown in Figure 4 and Figure 5.

Figure 4.
Component failure rate.

Figure 5.
Functional module failure rate.
According to the analysis of Figure 3, the key components that affect the reliability level of the circuit system are electrolytic capacitors and power MOSFETs, and the key functional modules are the main drive circuit composed of the switching power supply module and the motor drive module.
3. Accelerated Degradation Test Design
3.1. Accelerated Degradation Test Assumptions and Stress Loading Type Selection
The data analysis and model establishment of the accelerated degradation test need to meet the following assumptions:
- (1)
- The degradation failure mechanism of all samples at each stress level cannot change and must remain consistent.
- (2)
- The degradation model of each sample under rated stress and accelerated stress is consistent, and different stress levels will only change the distribution parameter value of the model.
- (3)
- The degradation model established for each sample based on the accelerated degradation data has a certain regularity and can meet a specific form of distribution.
- (4)
- The degradation rate of each sample is only related to the current applied stress level and has nothing to do with the degradation process [5].
Accelerated degradation tests are usually divided into three types of tests according to the stress loading method: constant stress, step stress, and sequential stress. Under the premise of comprehensively considering the test cost and feasibility, in order to further shorten the test time, reduce the test sample size, and consider the reliability of test data modeling, this paper chooses the loading method of constant stress accelerated test.
3.2. Accelerated Degradation Test Protocol
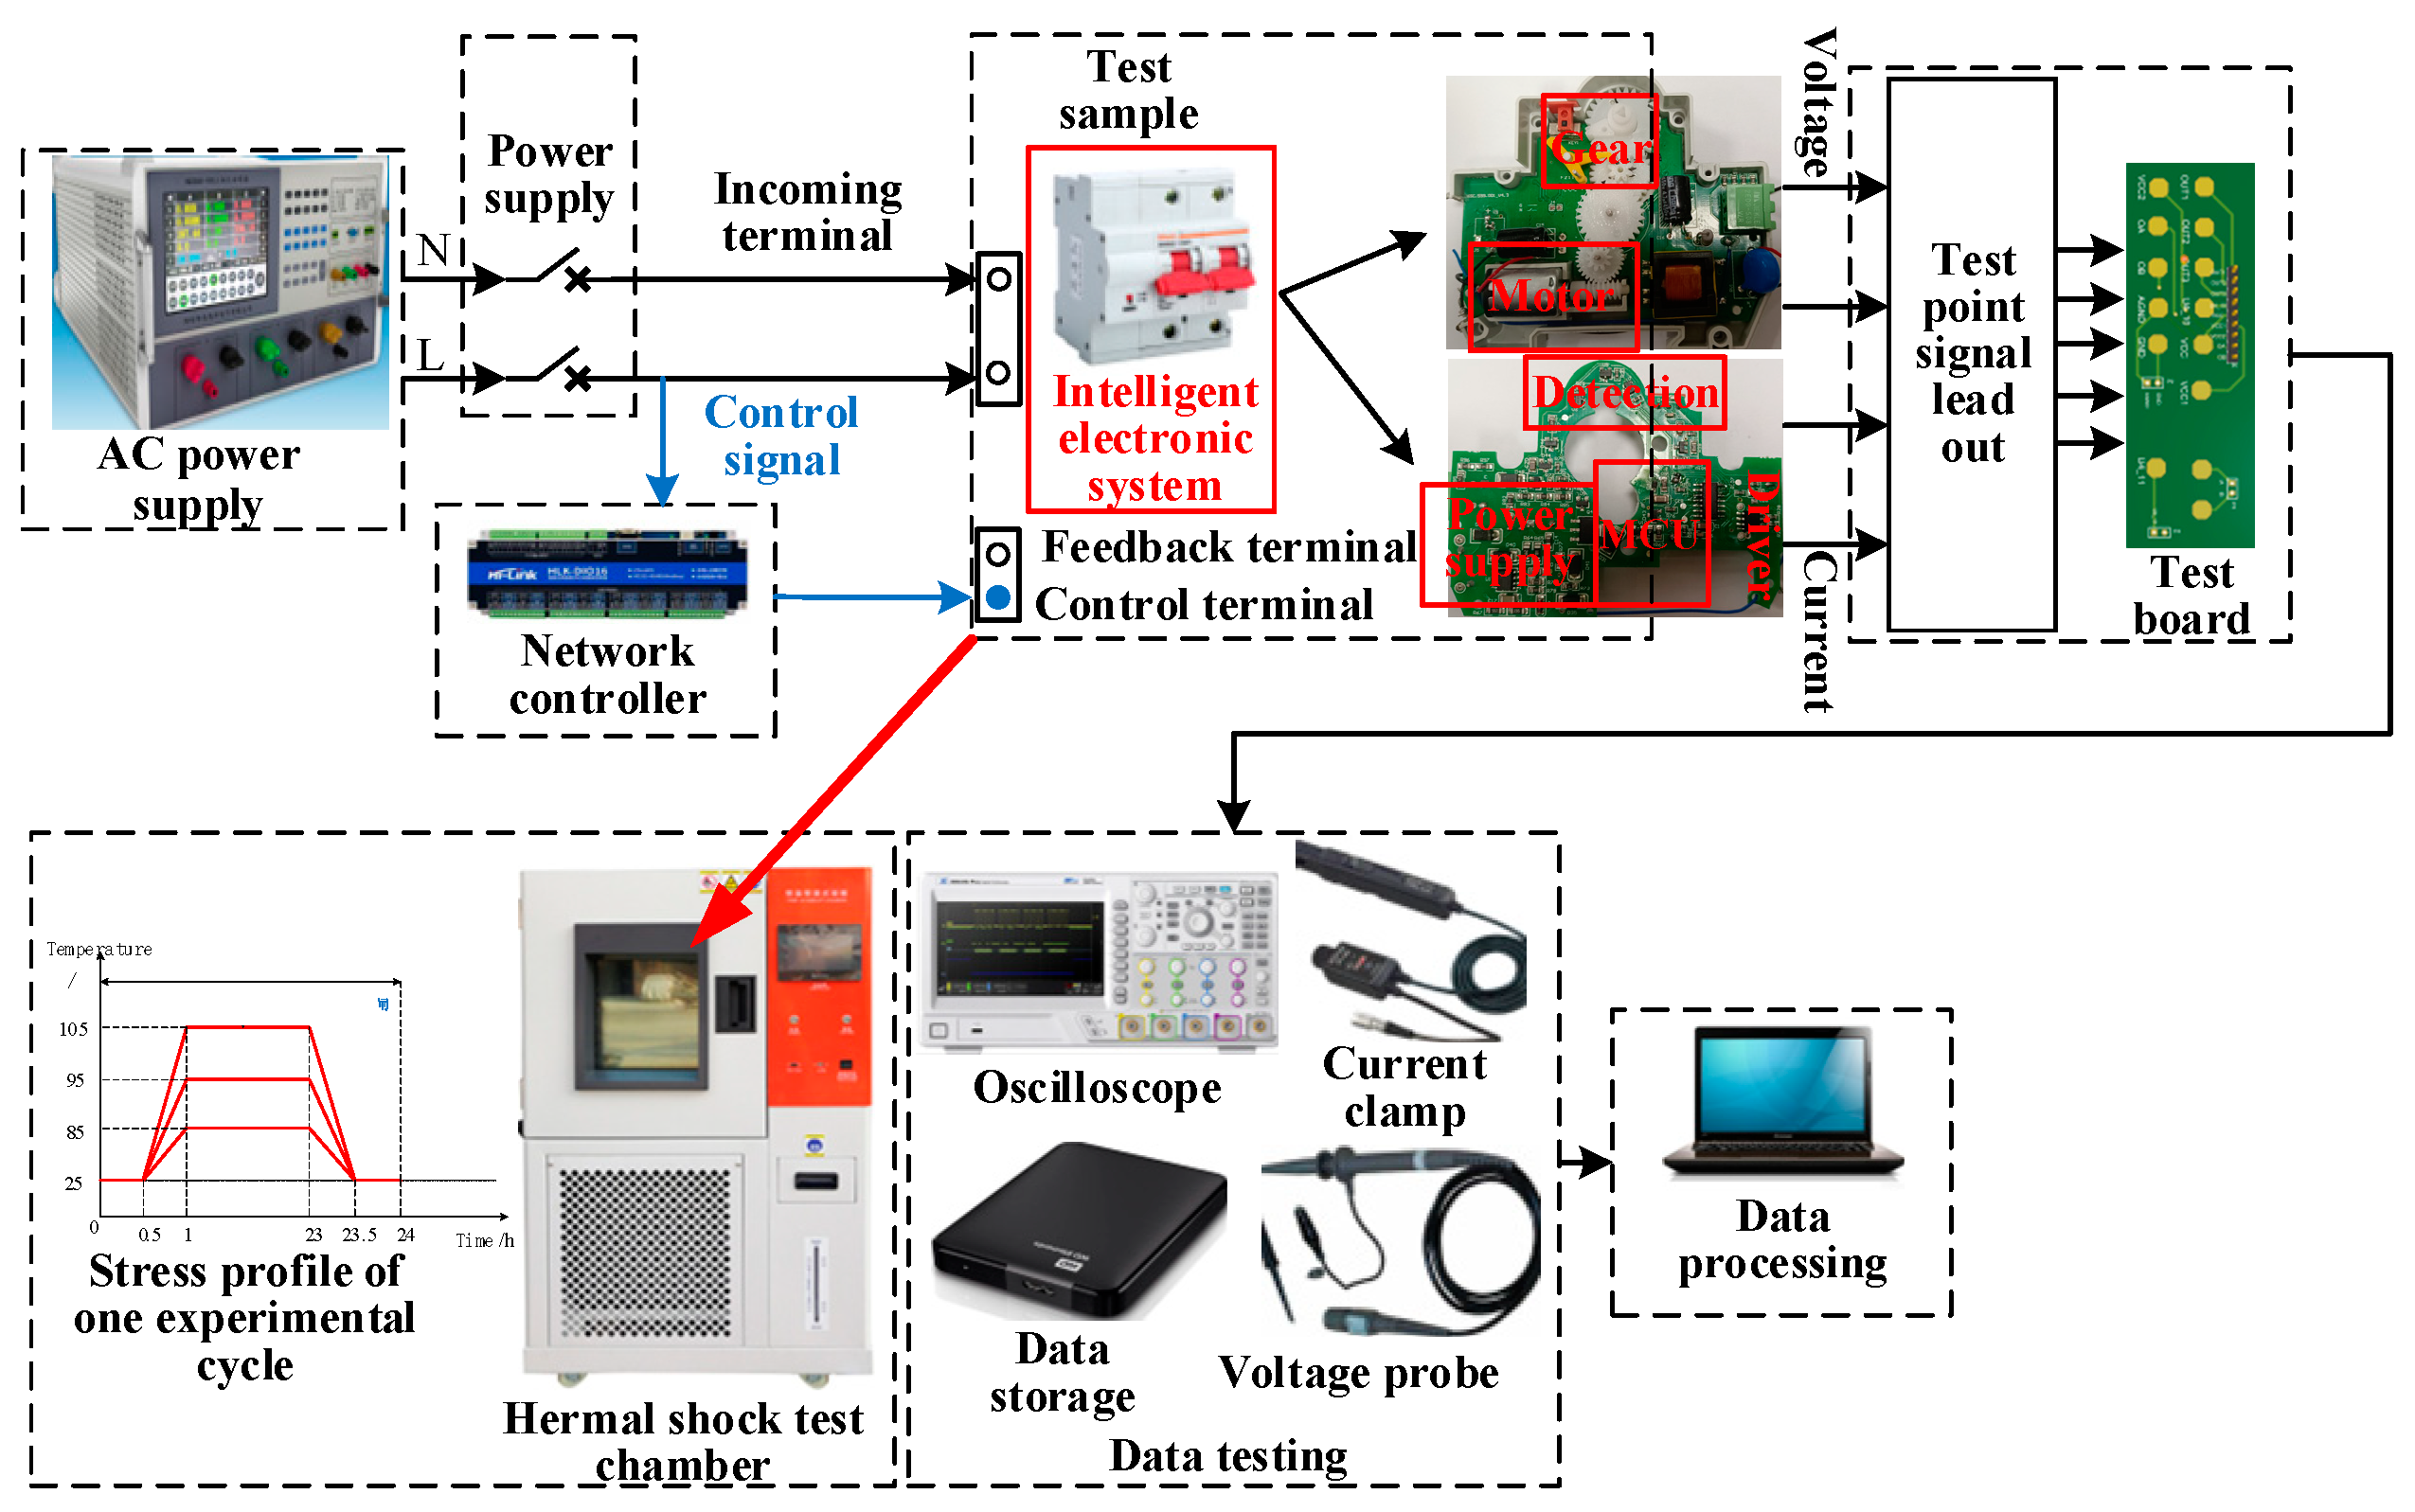
The test system diagram is shown in Figure 6.

Figure 6.
Accelerated degradation test system diagram.
According to the test platform shown in Figure 6, since the plastic shell of the intelligent circuit breaker sample is sealed, the sample must be slotted to facilitate testing. The electrical parameter test points are connected to the test board via leads. At the end of each test cycle, the voltage and current parameters are collected using an oscilloscope, and the data are summarized and stored. The entire sample is placed inside a high- and low-temperature test chamber, and AC power is supplied to the input terminal of the sample. A network controller—used as a functional module—controls the ON/OFF state of its internal relay through communication with the host computer. It is connected to the control circuit of the sample to switch the control signal ON and OFF, simulating the opening and closing control signals of an external electric meter to implement time-division control of the sample. The closing operation simulates the actual working condition of the sample under high-temperature stress.
The design of the accelerated degradation test plan requires comprehensive consideration of the following aspects:
- (1)
- The selection of stress type and the value of the accelerated test: Select temperature as a single accelerated stress. The single temperature stress model usually requires data at three stress levels to estimate the model parameters. The adjacent temperature gradient is not less than 10 °C to ensure that the degradation trend obtained by the test data fitting is obvious.
- (2)
- The determination of the number of accelerated test samples: According to relevant research, under single temperature stress, the number of samples in each group is generally 5, and the influence of individual differences in samples on data processing and model estimation is avoided as much as possible.
- (3)
- The accelerated test cycle and number of tests: The determination of the test cycle comprehensively considers the requirements of performance parameter changes, test workload, test cost, and data volume and preliminarily determines the test interval. According to the test, the law of performance parameter changes is explored, and the test interval is adjusted in time.
According to the harsh grade expressed by temperature and test duration given in IEC 60068-2-2 [16] Environmental Testing Part 2-2: Tests-Test B: Dry Heat, combined with product technical specification CQC1121-2016 and the component manual, the test temperature level was investigated. The maximum temperature value should be selected while comprehensively considering the limited temperature range of components and constituent materials, and the minimum value of each maximum temperature value, 105 °C, should be taken to avoid exceeding the temperature tolerance limit and changing the failure mechanism. The selection of the minimum temperature value should consider the test time cost and acceleration effect, and the selection is 85 °C. According to the principle of equal distribution, the intermediate temperature stress is calculated to be 95 °C.
The experiment has three temperature stress conditions: 85 °C, 95 °C, and 105 °C. Five experimental samples are used under each condition for a total of 15. The experimental results show that the degradation trend of the five samples under different temperature stress conditions is consistent.
The specific steps of the accelerated test are as follows:
- (1)
- Record the initial data of the state monitoring signal switch power supply voltage, motor terminal voltage, and motor current of each sample at a room temperature of 25 °C as the initial benchmark reference for sample performance degradation.
- (2)
- Carry out periodic accelerated degradation tests under temperature stress at 105 °C, 95 °C, and 85 °C in sequence.
- (3)
- Each test cycle is 24 h. First, let the sample stand at 25 °C for 0.5 h. Set the temperature box to increase the temperature to the corresponding temperature stress level value within 0.5 h. Control the sample to open and close once every 1 h and keep it at this value for 22 h. Then, set the temperature box to reduce the temperature to 25 °C within 0.5 h. After maintaining this value for 0.5 h, take out the sample, measure the state monitoring parameters in sequence, and then carry out the next cycle of testing.
- (4)
- The test continues until all 5 samples under each stress fail.
4. Analysis of Control Circuit Performance Degradation Characteristics
4.1. Degraded Data Preprocessing
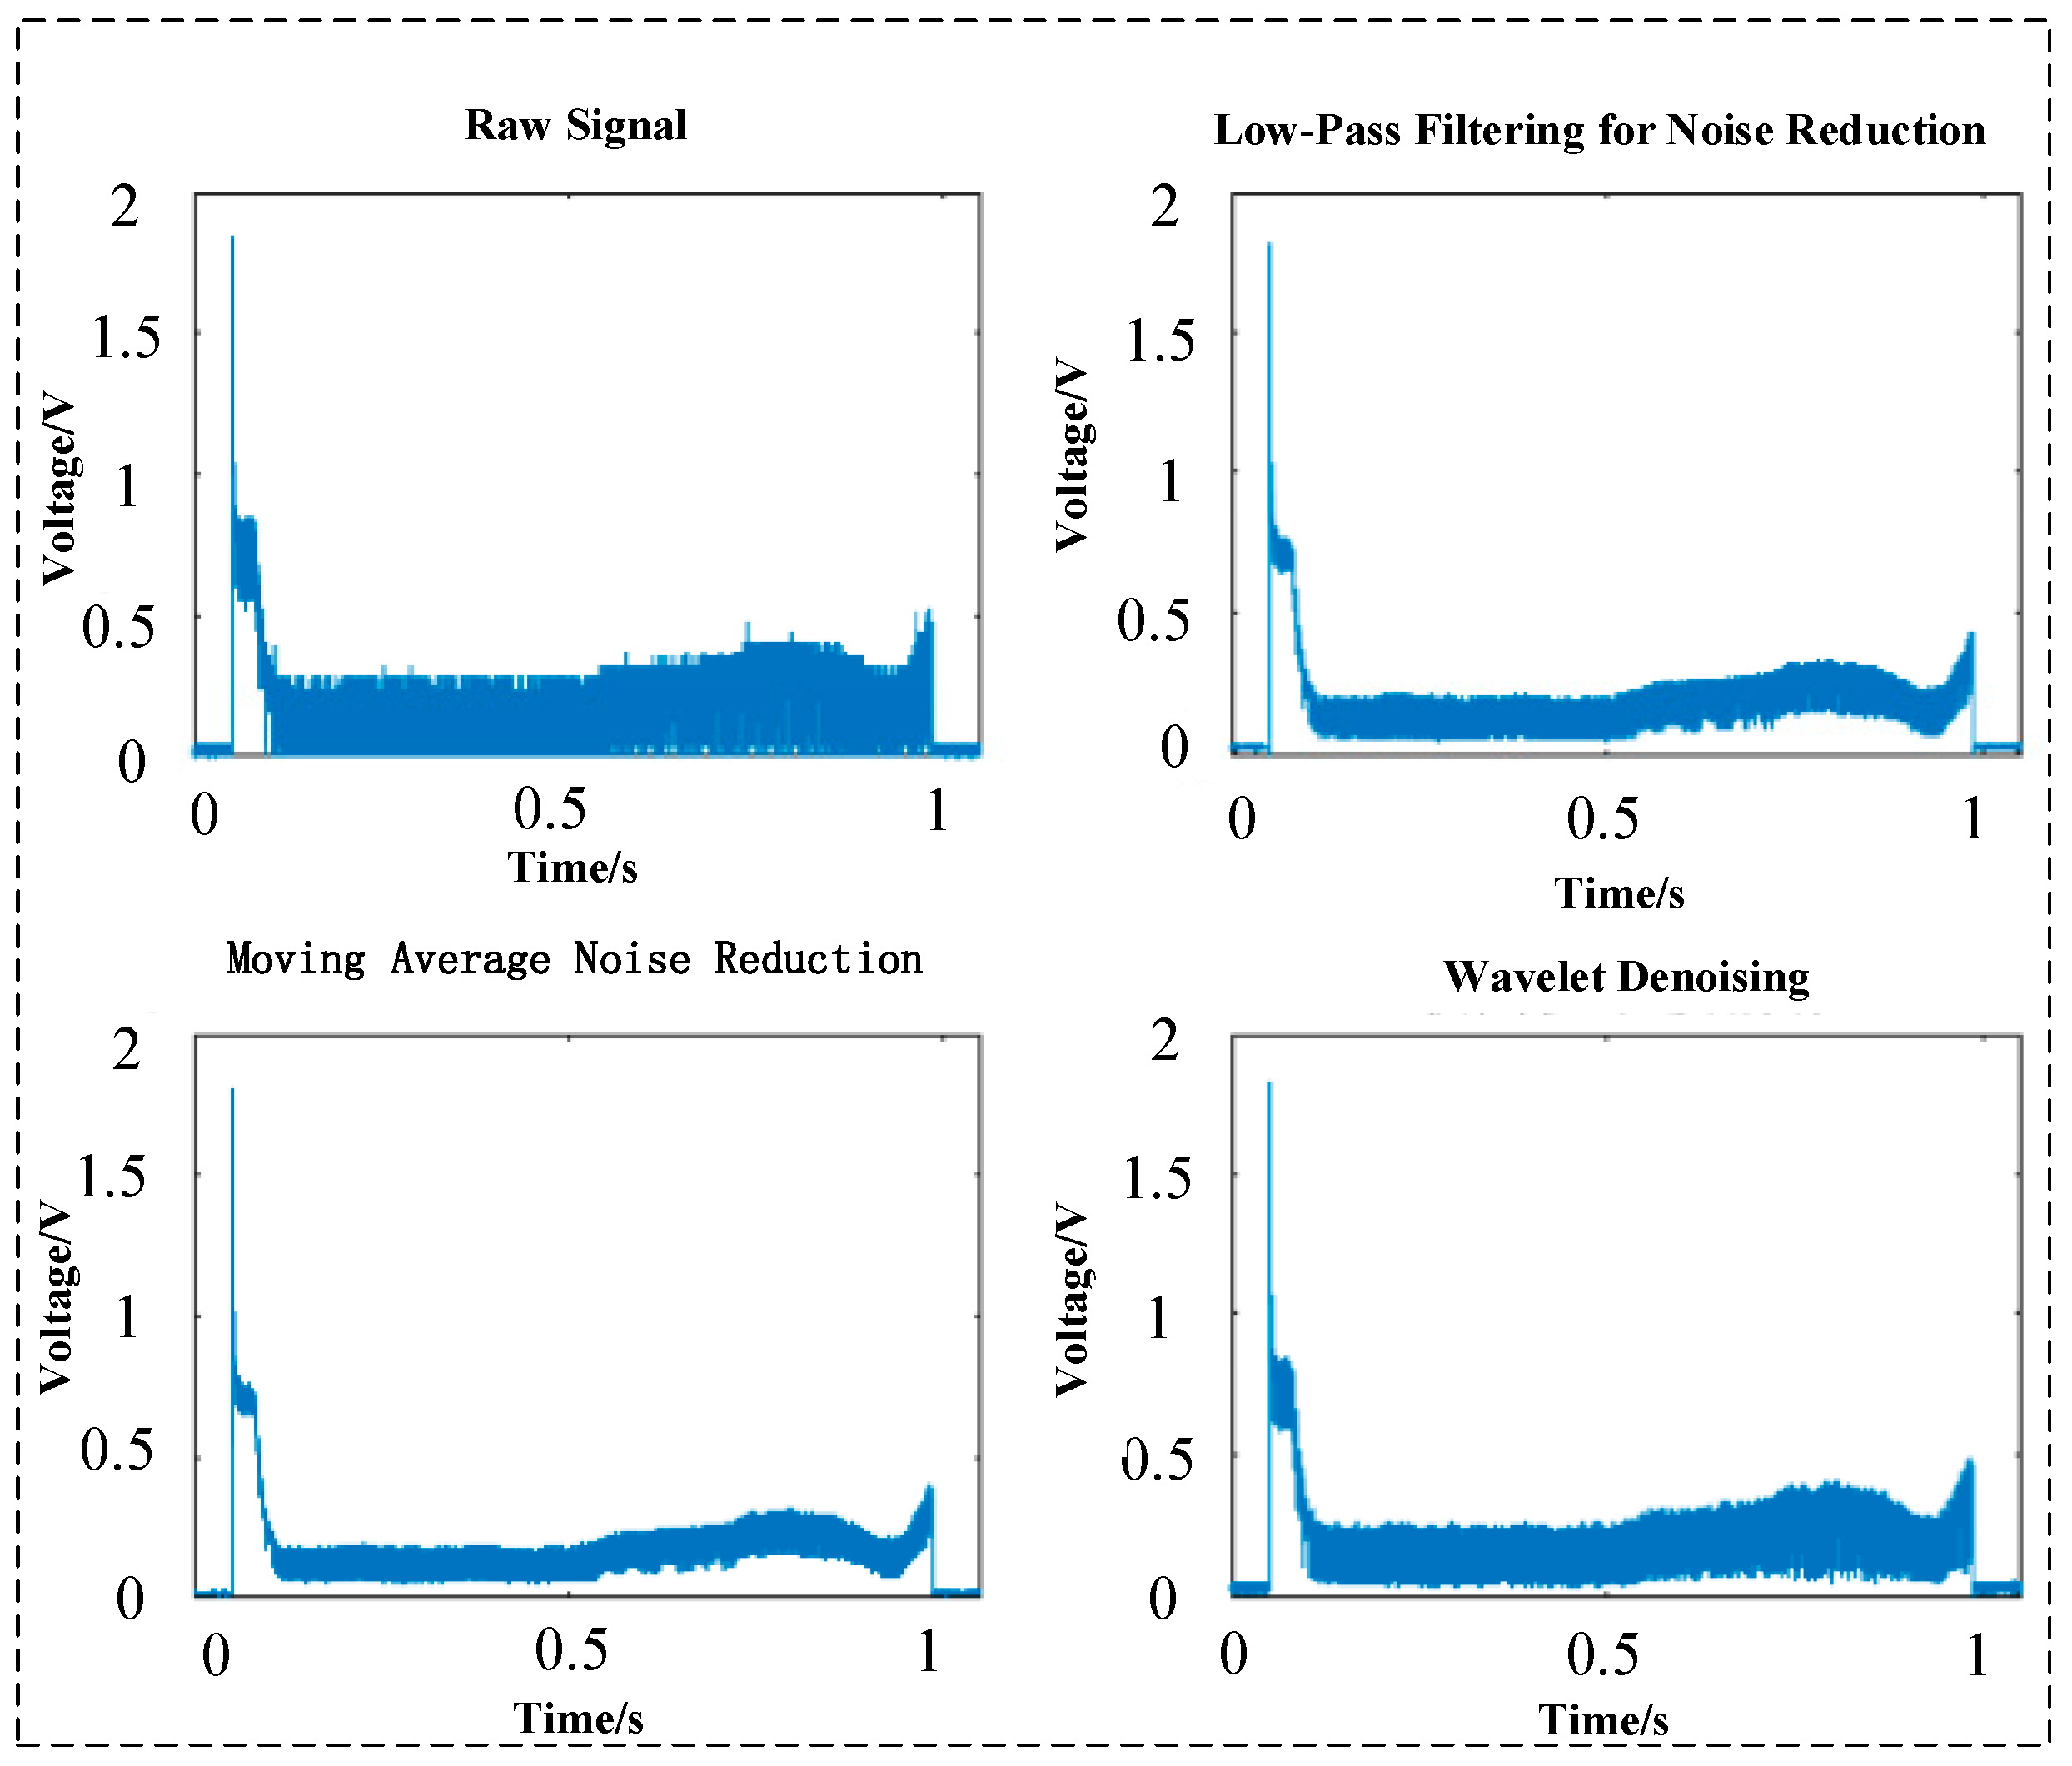
Common wavelet denoising, moving average denoising, and low-pass filtering denoising are used to denoise the test data, and the comparison results of motor current denoising are shown in Figure 7.
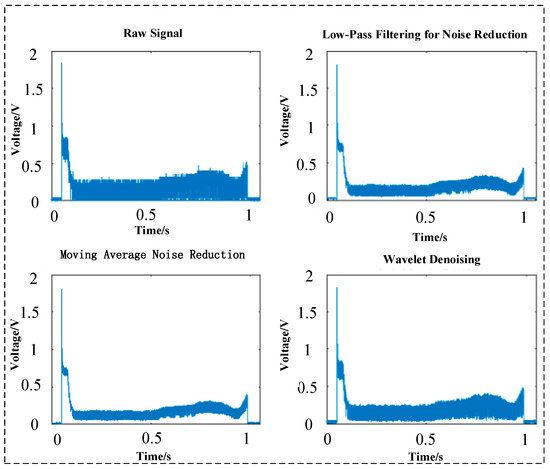
Figure 7.
Comparison of motor current noise reduction.
The signal-to noise ratio (SNR) is a commonly used evaluation index for the signal denoising effect [17]. The SNR values of the three monitoring signals under the above three denoising methods are calculated below, as shown in Table 1.

Table 1.
SNR comparison of monitoring signal after noise removal.
As shown in the table above, the wavelet denoising method has a better denoising effect on the three test signals than the moving average and low-pass filtering denoising methods. Therefore, the wavelet denoising method can be used to pre-process each test signal.
4.2. Performance Degradation Feature Extraction and Selection
The following feature parameters are extracted for the test data:
- (1)
- Time domain: mean, peak-to-peak value, peak value, and kurtosis;
- (2)
- Frequency domain: centroid frequency, frequency, and standard deviation;
- (3)
- Wavelet domain: energy entropy and singular entropy.
A total of 18-dimensional candidate libraries of degradation feature parameters can be obtained. Assuming the collected test signal is Xi and its spectrum is Pi, the calculation formulas of the feature parameters in each domain are shown in Table 2.
Table 2.
Feature parameter candidate list.
A multidimensional evaluation index model is used to score and evaluate each candidate feature parameter in the degradation feature parameter candidate library. The calculation formula of the multidimensional evaluation comprehensive index feature optimization model is as follows:
In the formula, Z is the comprehensive evaluation index, and ki is the weight coefficient, which represents the contribution of each evaluation index to the comprehensive index. According to engineering experience, k1, k2, and k3 are selected as 0.5, 0.4, and 0.1, respectively. Tre(.), Mon(.), and Rob(.) are trend indicators, monotonicity indicators, and robustness indicators, respectively. The specific formula is as follows:
- (1)
- Trend:
- (2)
- Monotonicity:
- (3)
- Robustness:
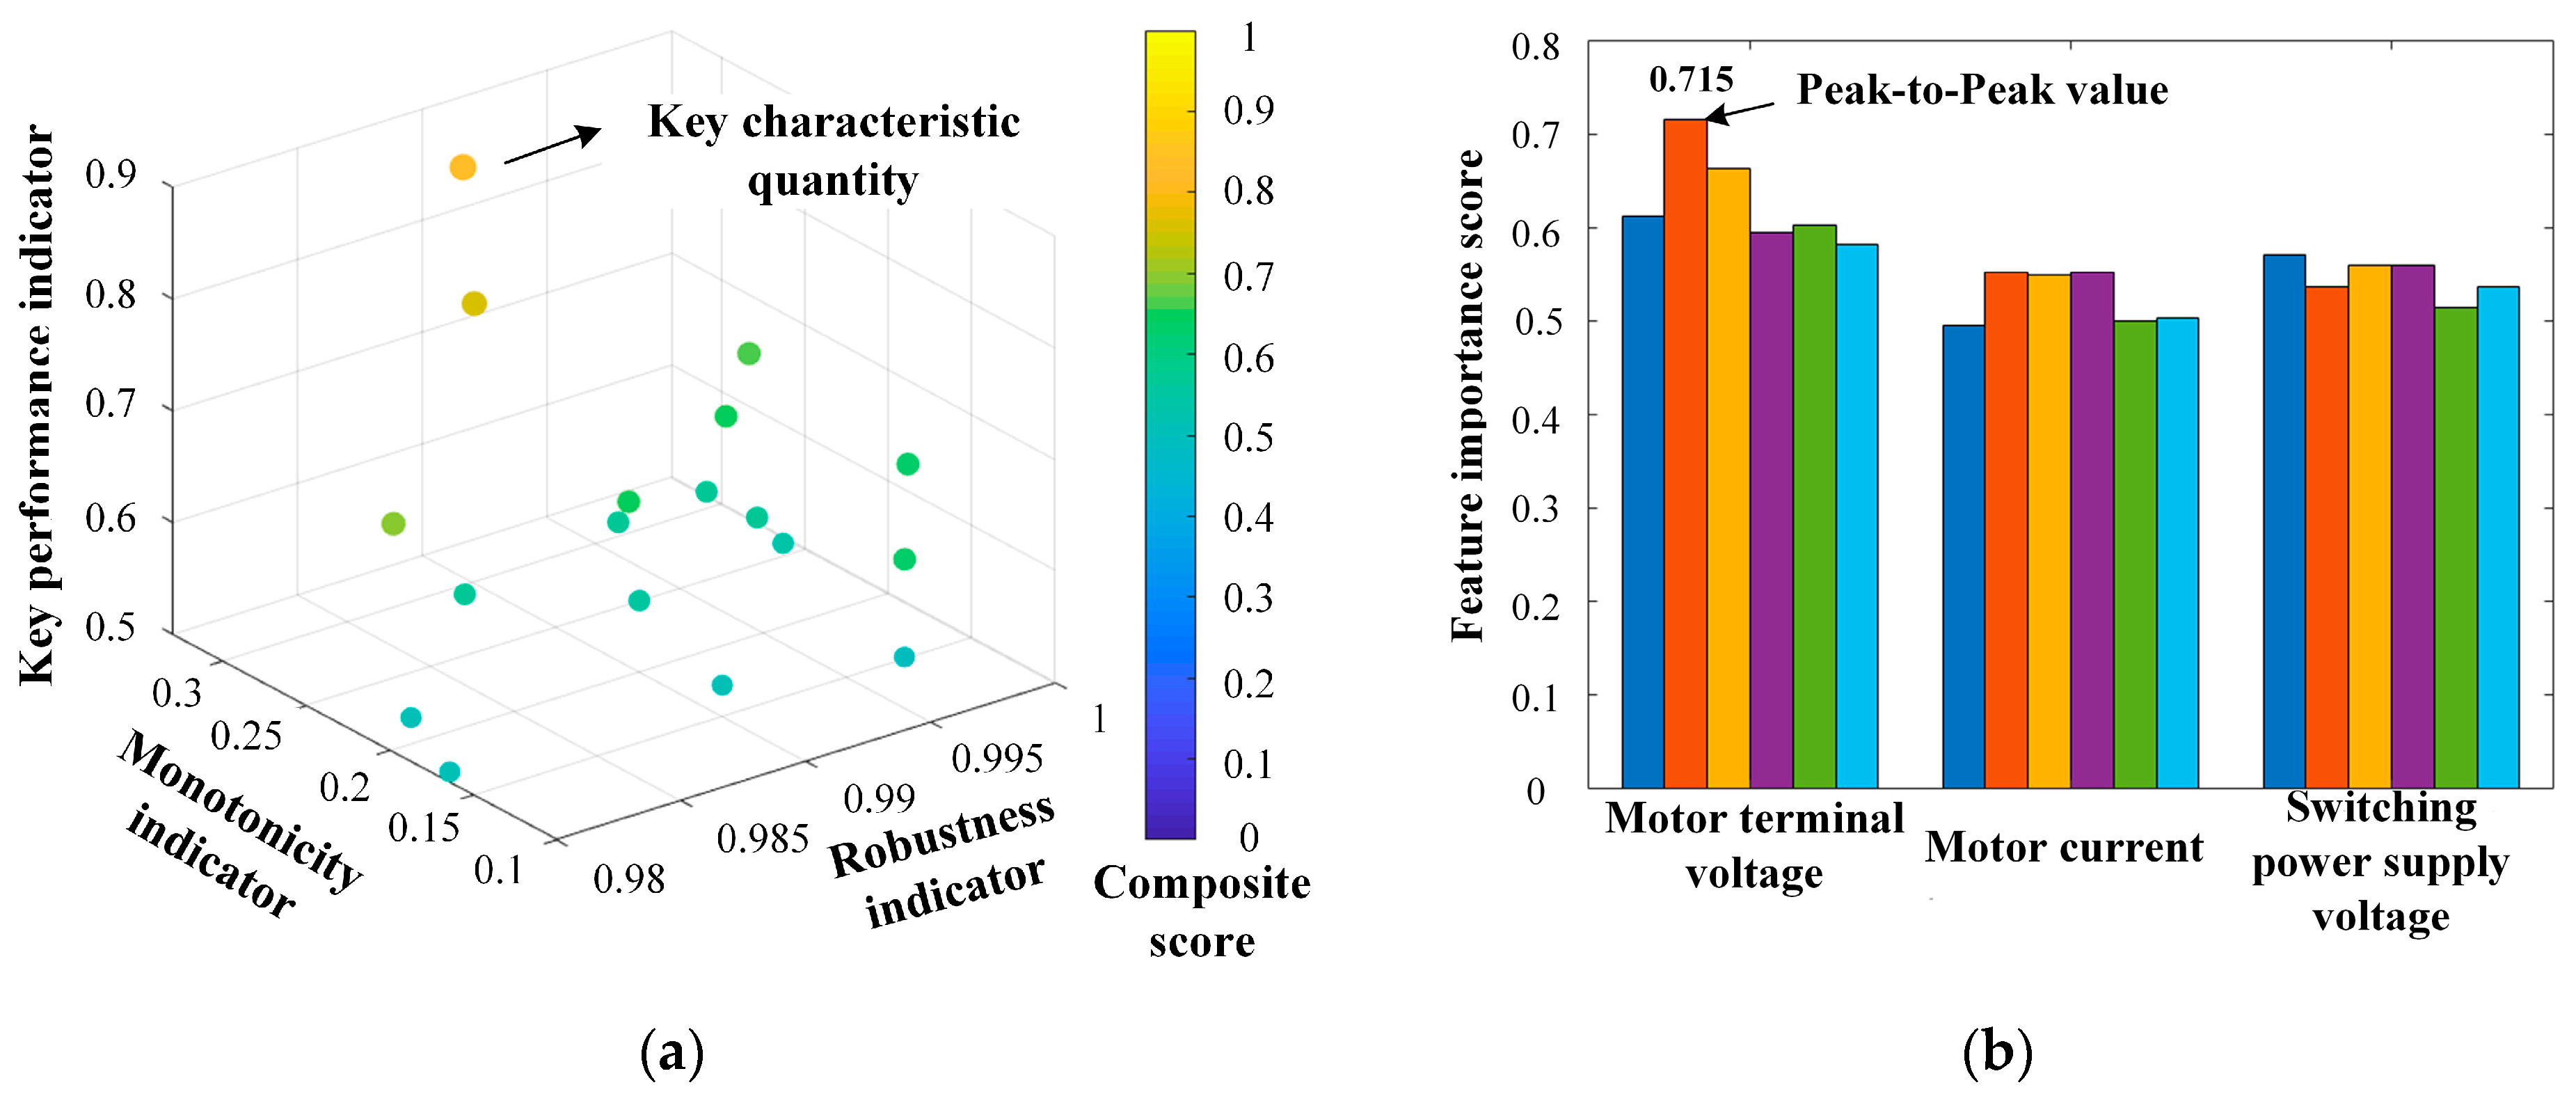
The above-mentioned feature evaluation model is used to score the candidate features to select the best feature parameters that can characterize the performance degradation of the control circuit. The scoring effect diagram is shown in Figure 8.

Figure 8.
(a) Three-dimensional graph of comprehensive score of characteristic parameters. (b) Histogram of comprehensive score of feature parameters.
The higher the score of the characteristic parameter, the more the characteristic parameter can characterize the degradation process of the control circuit. According to Figure 8, the characteristic with the highest score among the candidate characteristic parameters is the peak-to-peak value of the motor terminal voltage, and its score table is shown in Table 3. According to the experimental tests and statistical analysis, it can be concluded that the failure threshold, H, of the characteristic parameter is 3 V.
Table 3.
Score table for best degradation characteristic parameters.
4.3. Characteristic Parameter Degradation Trend and Characteristic Analysis
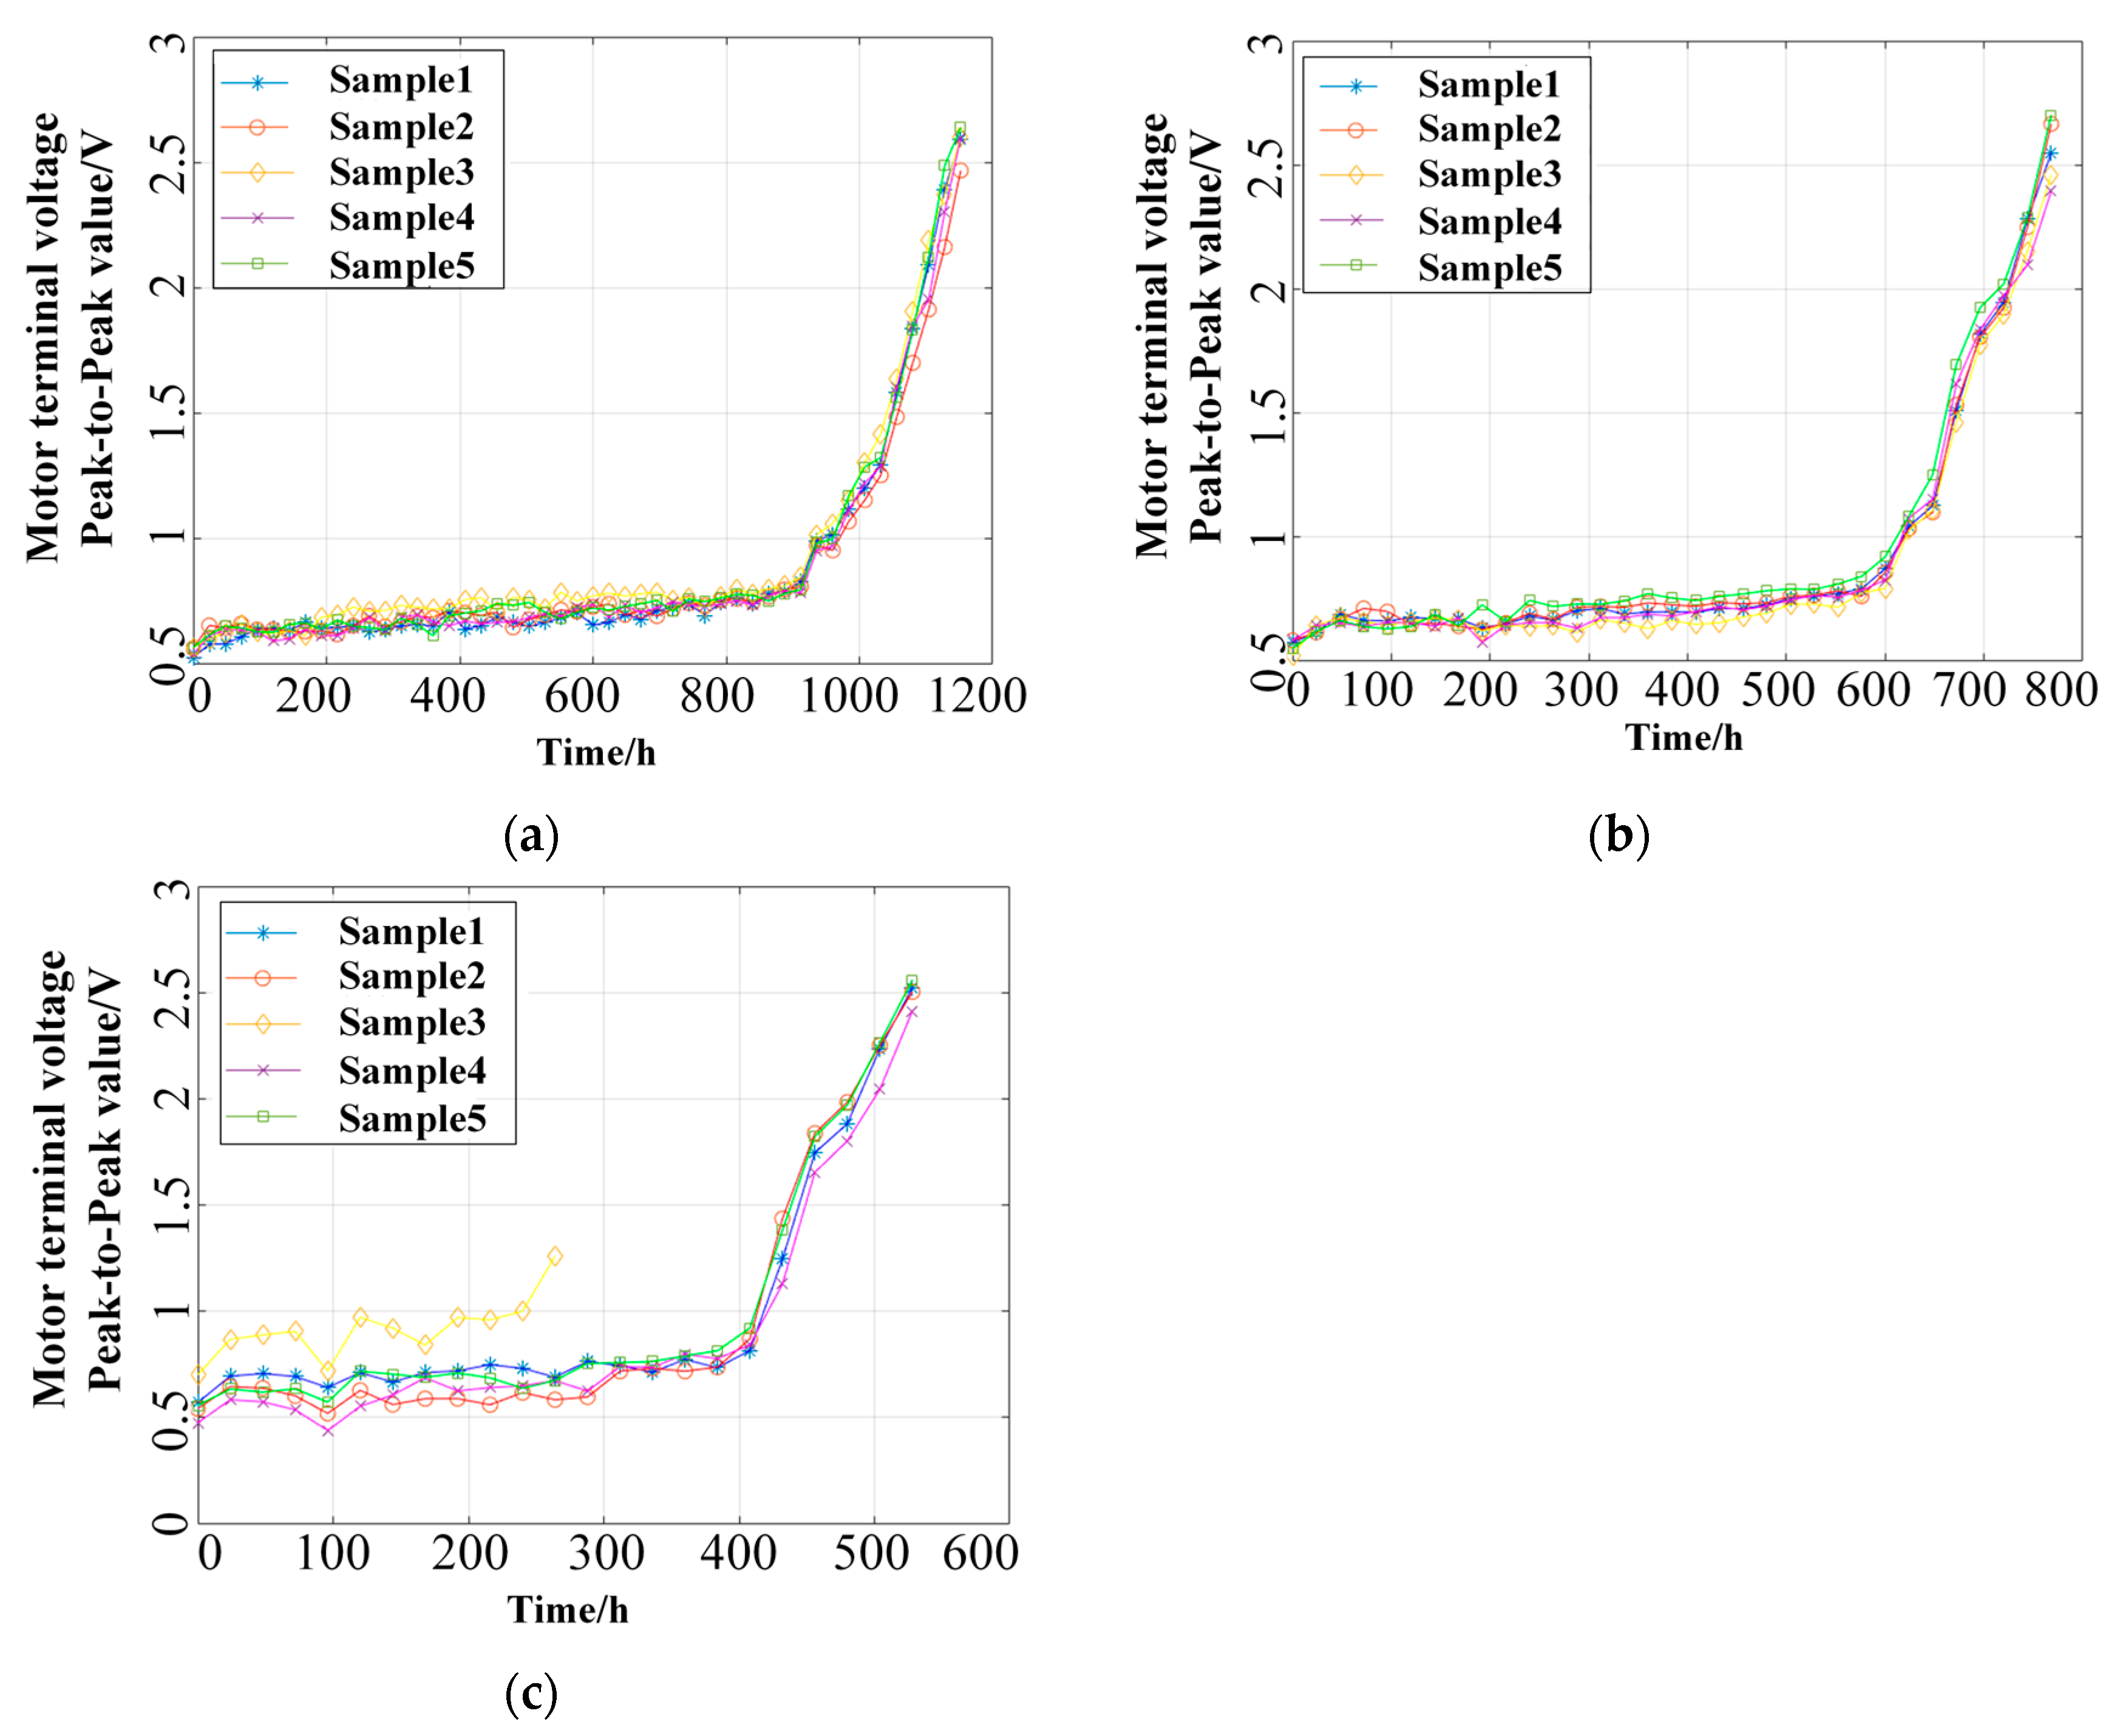
The degradation data of the samples under various temperature stresses are sorted out below, and the degradation evolution trend of the degradation characteristic parameters (the peak-to-peak value of the motor terminal voltage) fitted using the least squares method is shown in Figure 9.
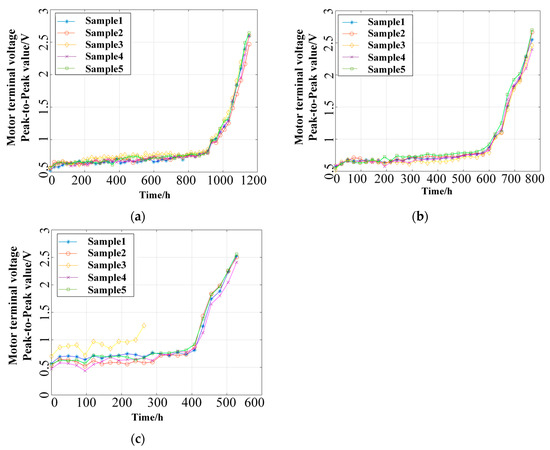
Figure 9.
(a) Degradation trend fitting at 85 °C. (b) Degradation trend fitting at 95 °C. (c) Degradation trend fitting at 105 °C.
The fixed segmentation algorithm of important points of characteristic sequence based on the trend turning distance is introduced to divide the performance degradation process of the control circuit into stages. The trend turning distance of each point is calculated using Formula (6), and the calculation results are shown in Table 4.
Table 4.
The results of the transition distance between the degraded measurement point and the endpoint at a stress level of 105 °C.
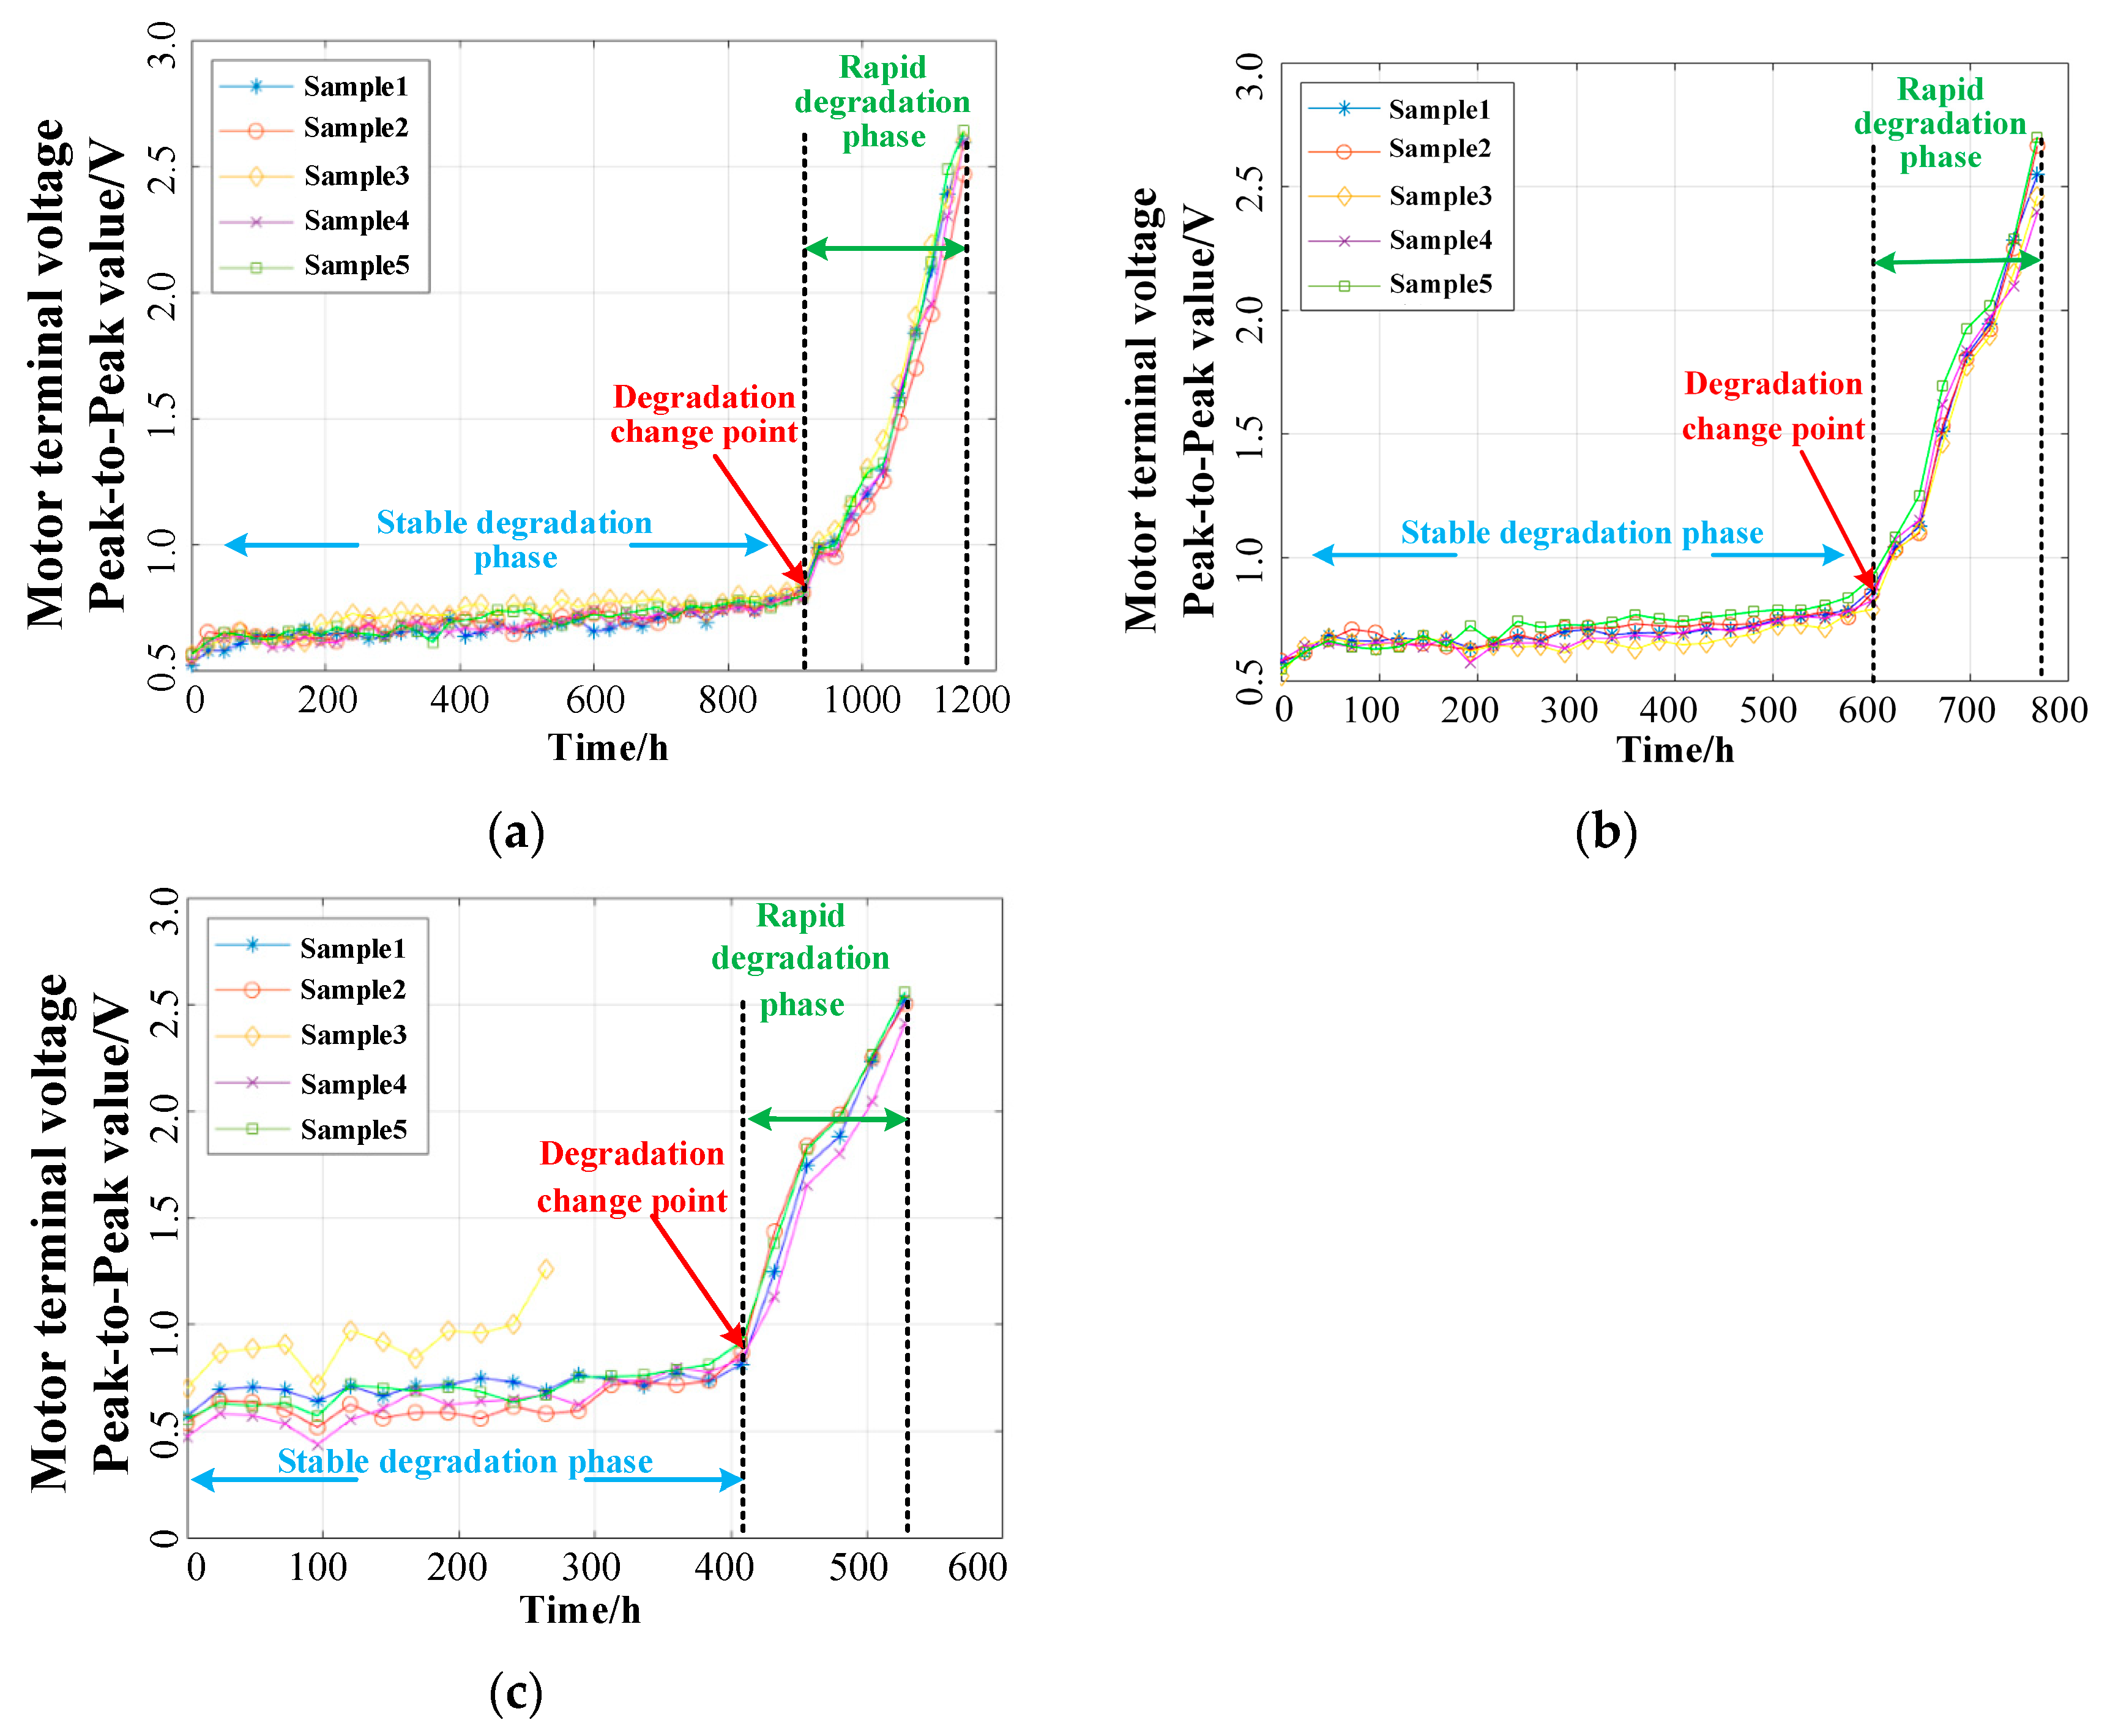
According to Table 4, the degradation time series under different stress levels are divided into two stages, a stable degradation stage and a rapid degradation stage, as shown in Figure 10.
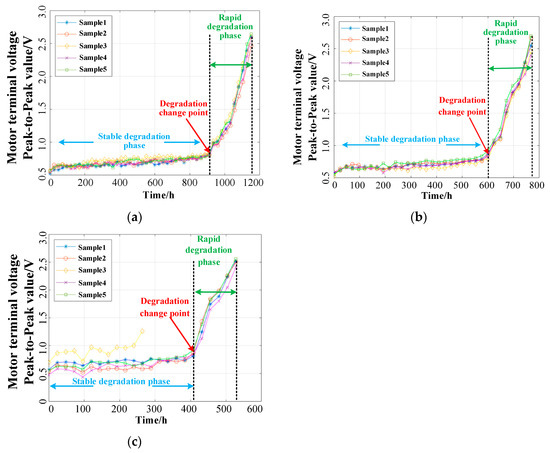
Figure 10.
(a) Degradation stage division at 85 °C. (b) Degradation stage division at 95 °C. (c) Degradation stage division at 105 °C.
It can be seen from Figure 10 that the degradation “change point” appears at around 912 h, 600 h, and 408 h, respectively, corresponding to 78.8%, 77.6%, and 77.0% of the whole degradation process, respectively. It can be seen that the higher the test temperature stress level value, the earlier the degradation “change point” appears, and the earlier the intelligent circuit breaker control circuit enters the rapid degradation stage from the stable degradation stage, reflecting that the intelligent circuit breaker control circuit presents a two-stage nonlinear performance degradation characteristic during actual use. Additionally, the more severe the temperature cycle stress loaded on the control circuit, the easier it is for the control circuit to fail due to degradation, and the faster the life decays.
5. Simulation Analysis of Performance Degradation Characteristics
Since the performance degradation of components is very slow under normal use, the performance degradation of components starts from parameter drift until they reach the failure threshold, which directly affects the output characteristics of the control circuit. Therefore, this paper builds a simulation model of the key modules of the control circuit based on the PSpice simulation tool.
5.1. Analysis of Control Circuit Sensitivity
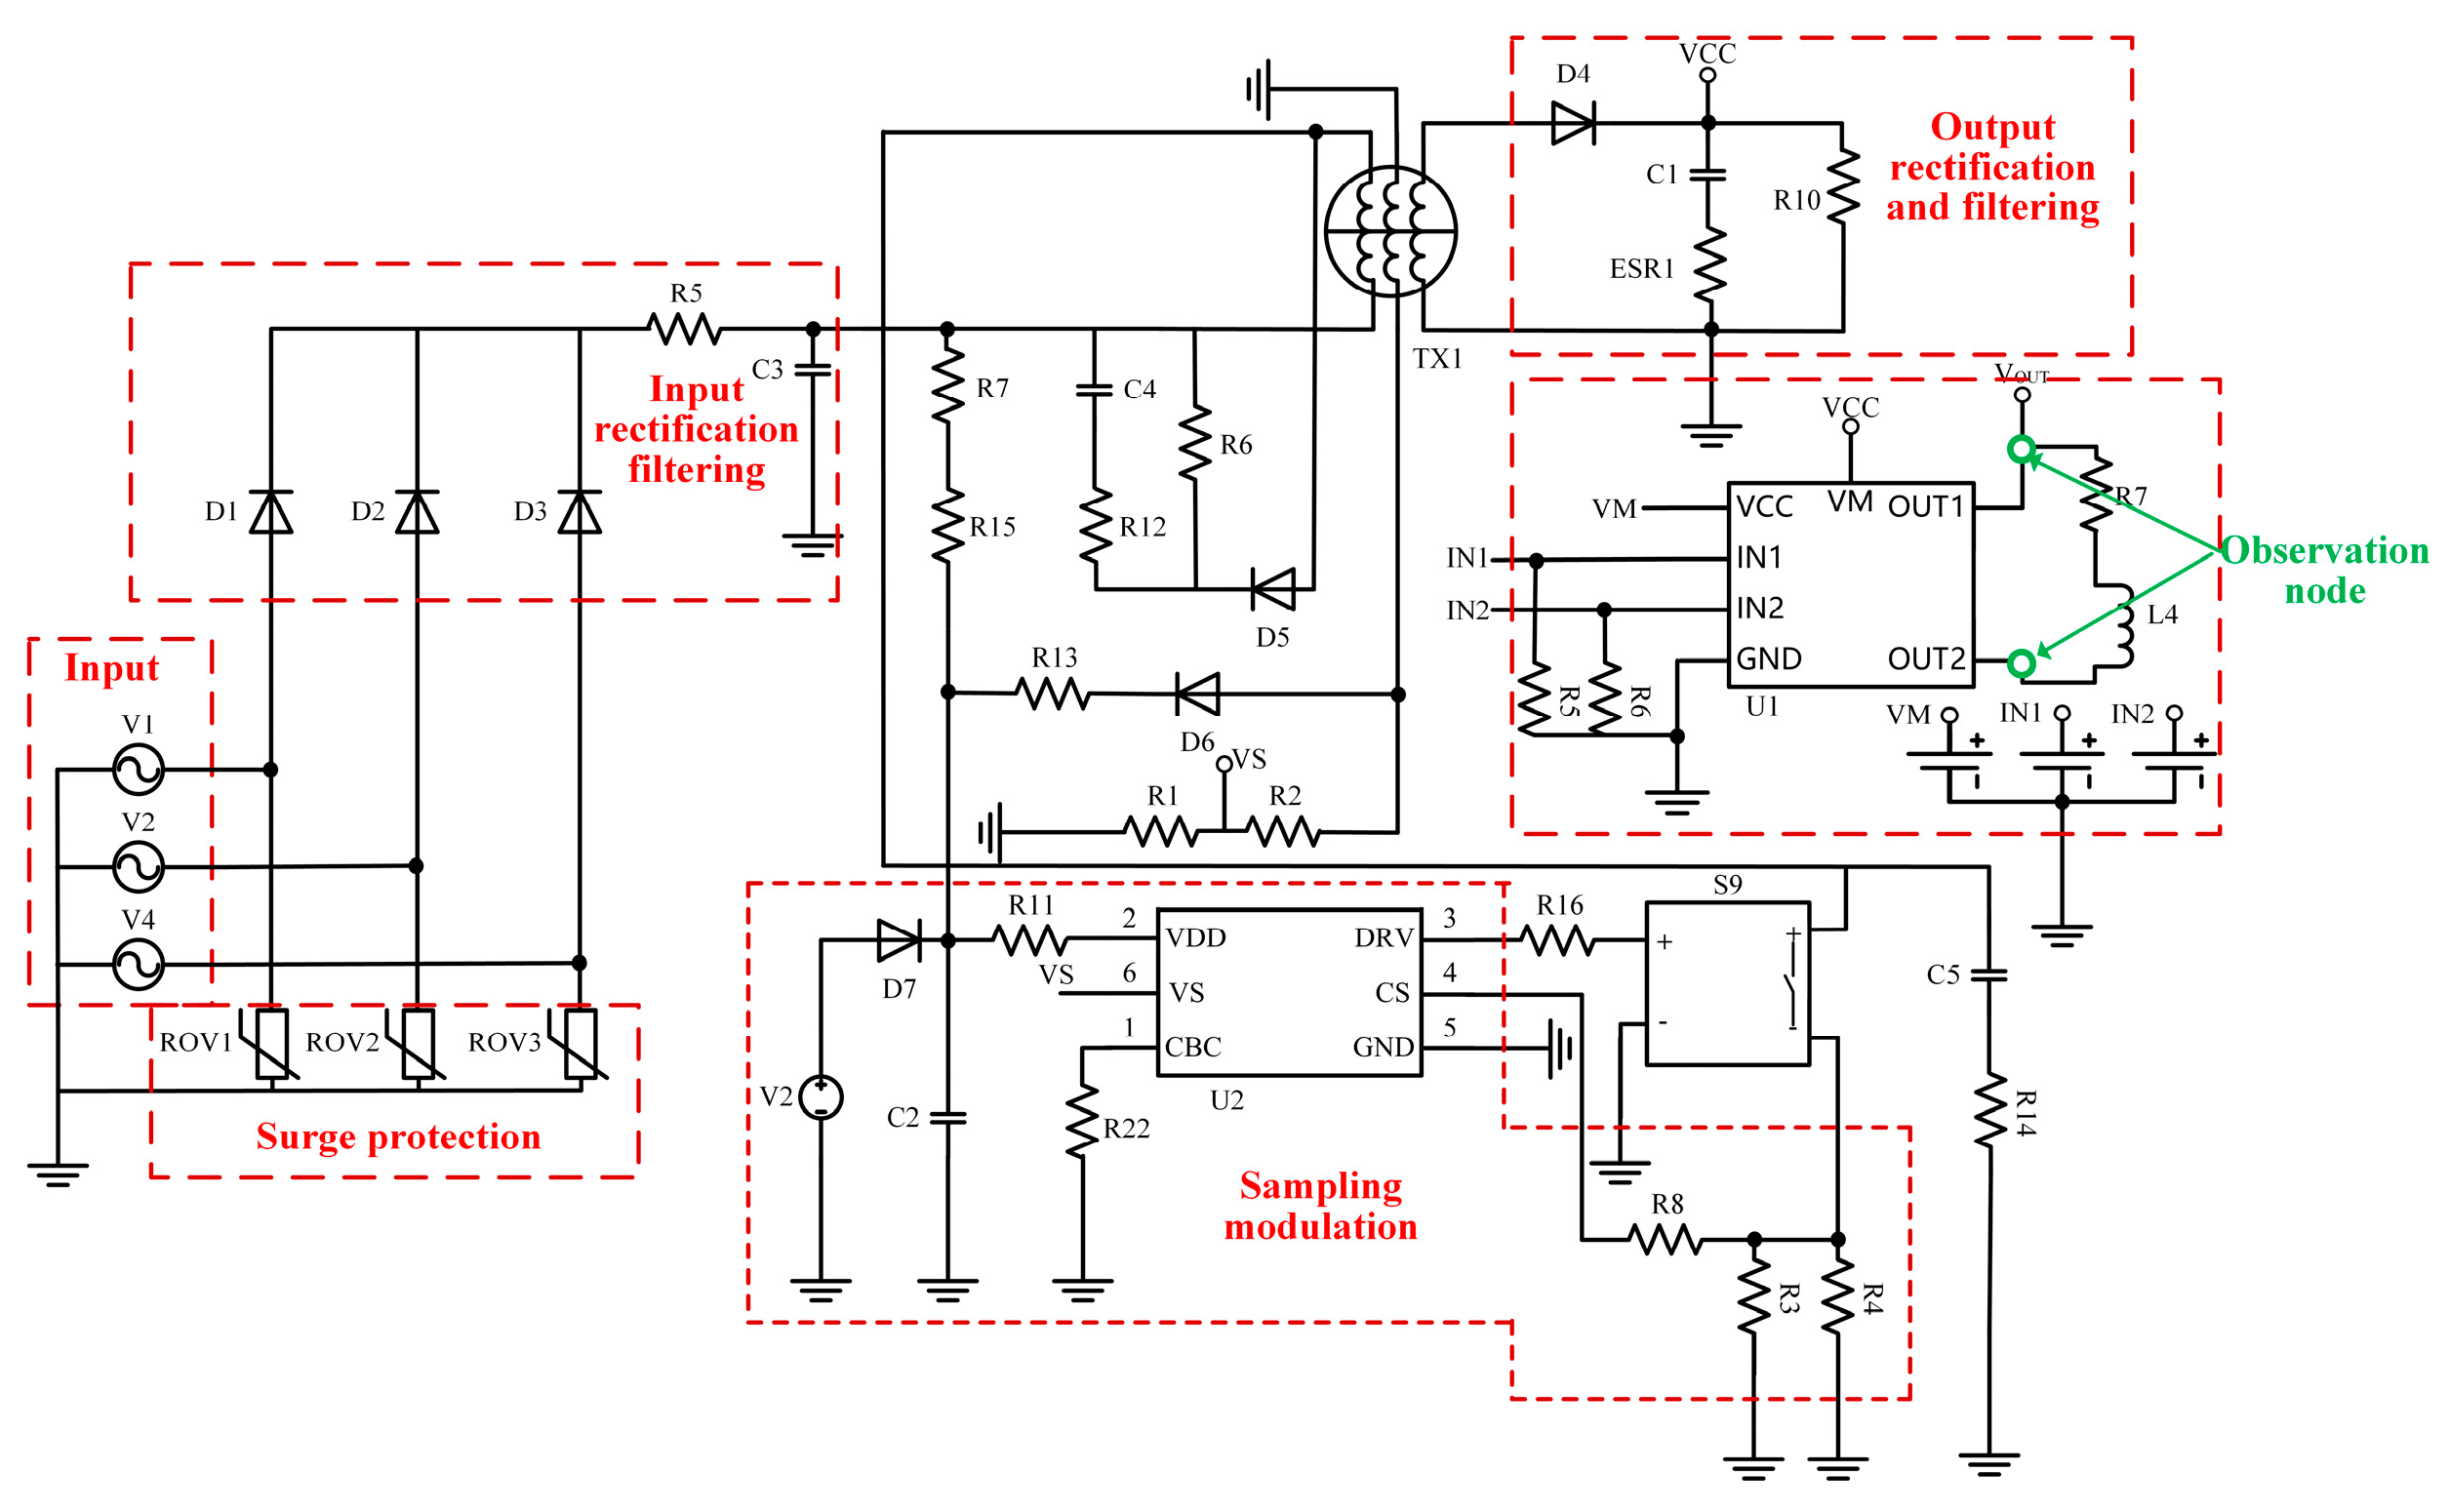
The sensitivity simulation model in the PSpice simulation environment is shown in Figure 11.
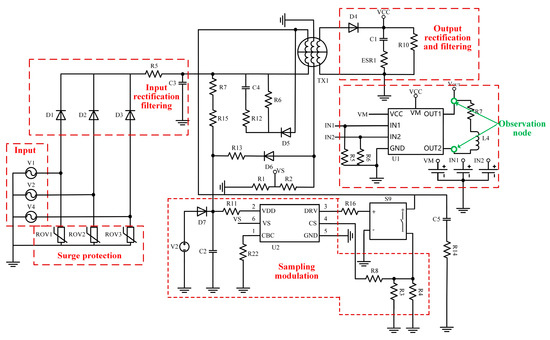
Figure 11.
Sensitivity simulation model.
The performance degradation of components causes a gradual drift from their initial parameters until a failure threshold is eventually reached. This directly affects the output characteristics of the control circuit. Therefore, it is necessary to study the impact of key component degradation on the circuit’s output performance [18]. In this paper, a simulation model of the key modules of the control circuit is constructed using the OrCAD/PSpice simulation tool. This tool serves as a multifunctional platform for circuit system simulation and testing. It offers advantages such as good convergence, high practicality, and strong integration. It also allows convenient modification of component parameters and supports various simulation analyses, including transient analysis. Voltage and current waveforms can be observed by placing probes at specific nodes. Due to the confidentiality of component parameters within the circuit, and the lack of a corresponding PSpice simulation model for the domestically produced primary-side feedback quasi-resonant switching power supply control chip (PN8366), the UCC28700 chip and transformer simulation model from Texas Instruments—with the same working principle—are used as substitutes. The main difference between the two chips is whether the power switch transistor is integrated into the chip.
Based on this simulation model, the sensitivity and parameter drift of key modules of the control circuit can be simulated. By modifying the performance parameters of key components, it is convenient to observe the output changes of each simulation observation node of the control circuit and to analyze the performance degradation characteristics of the key weak links of the control circuit.
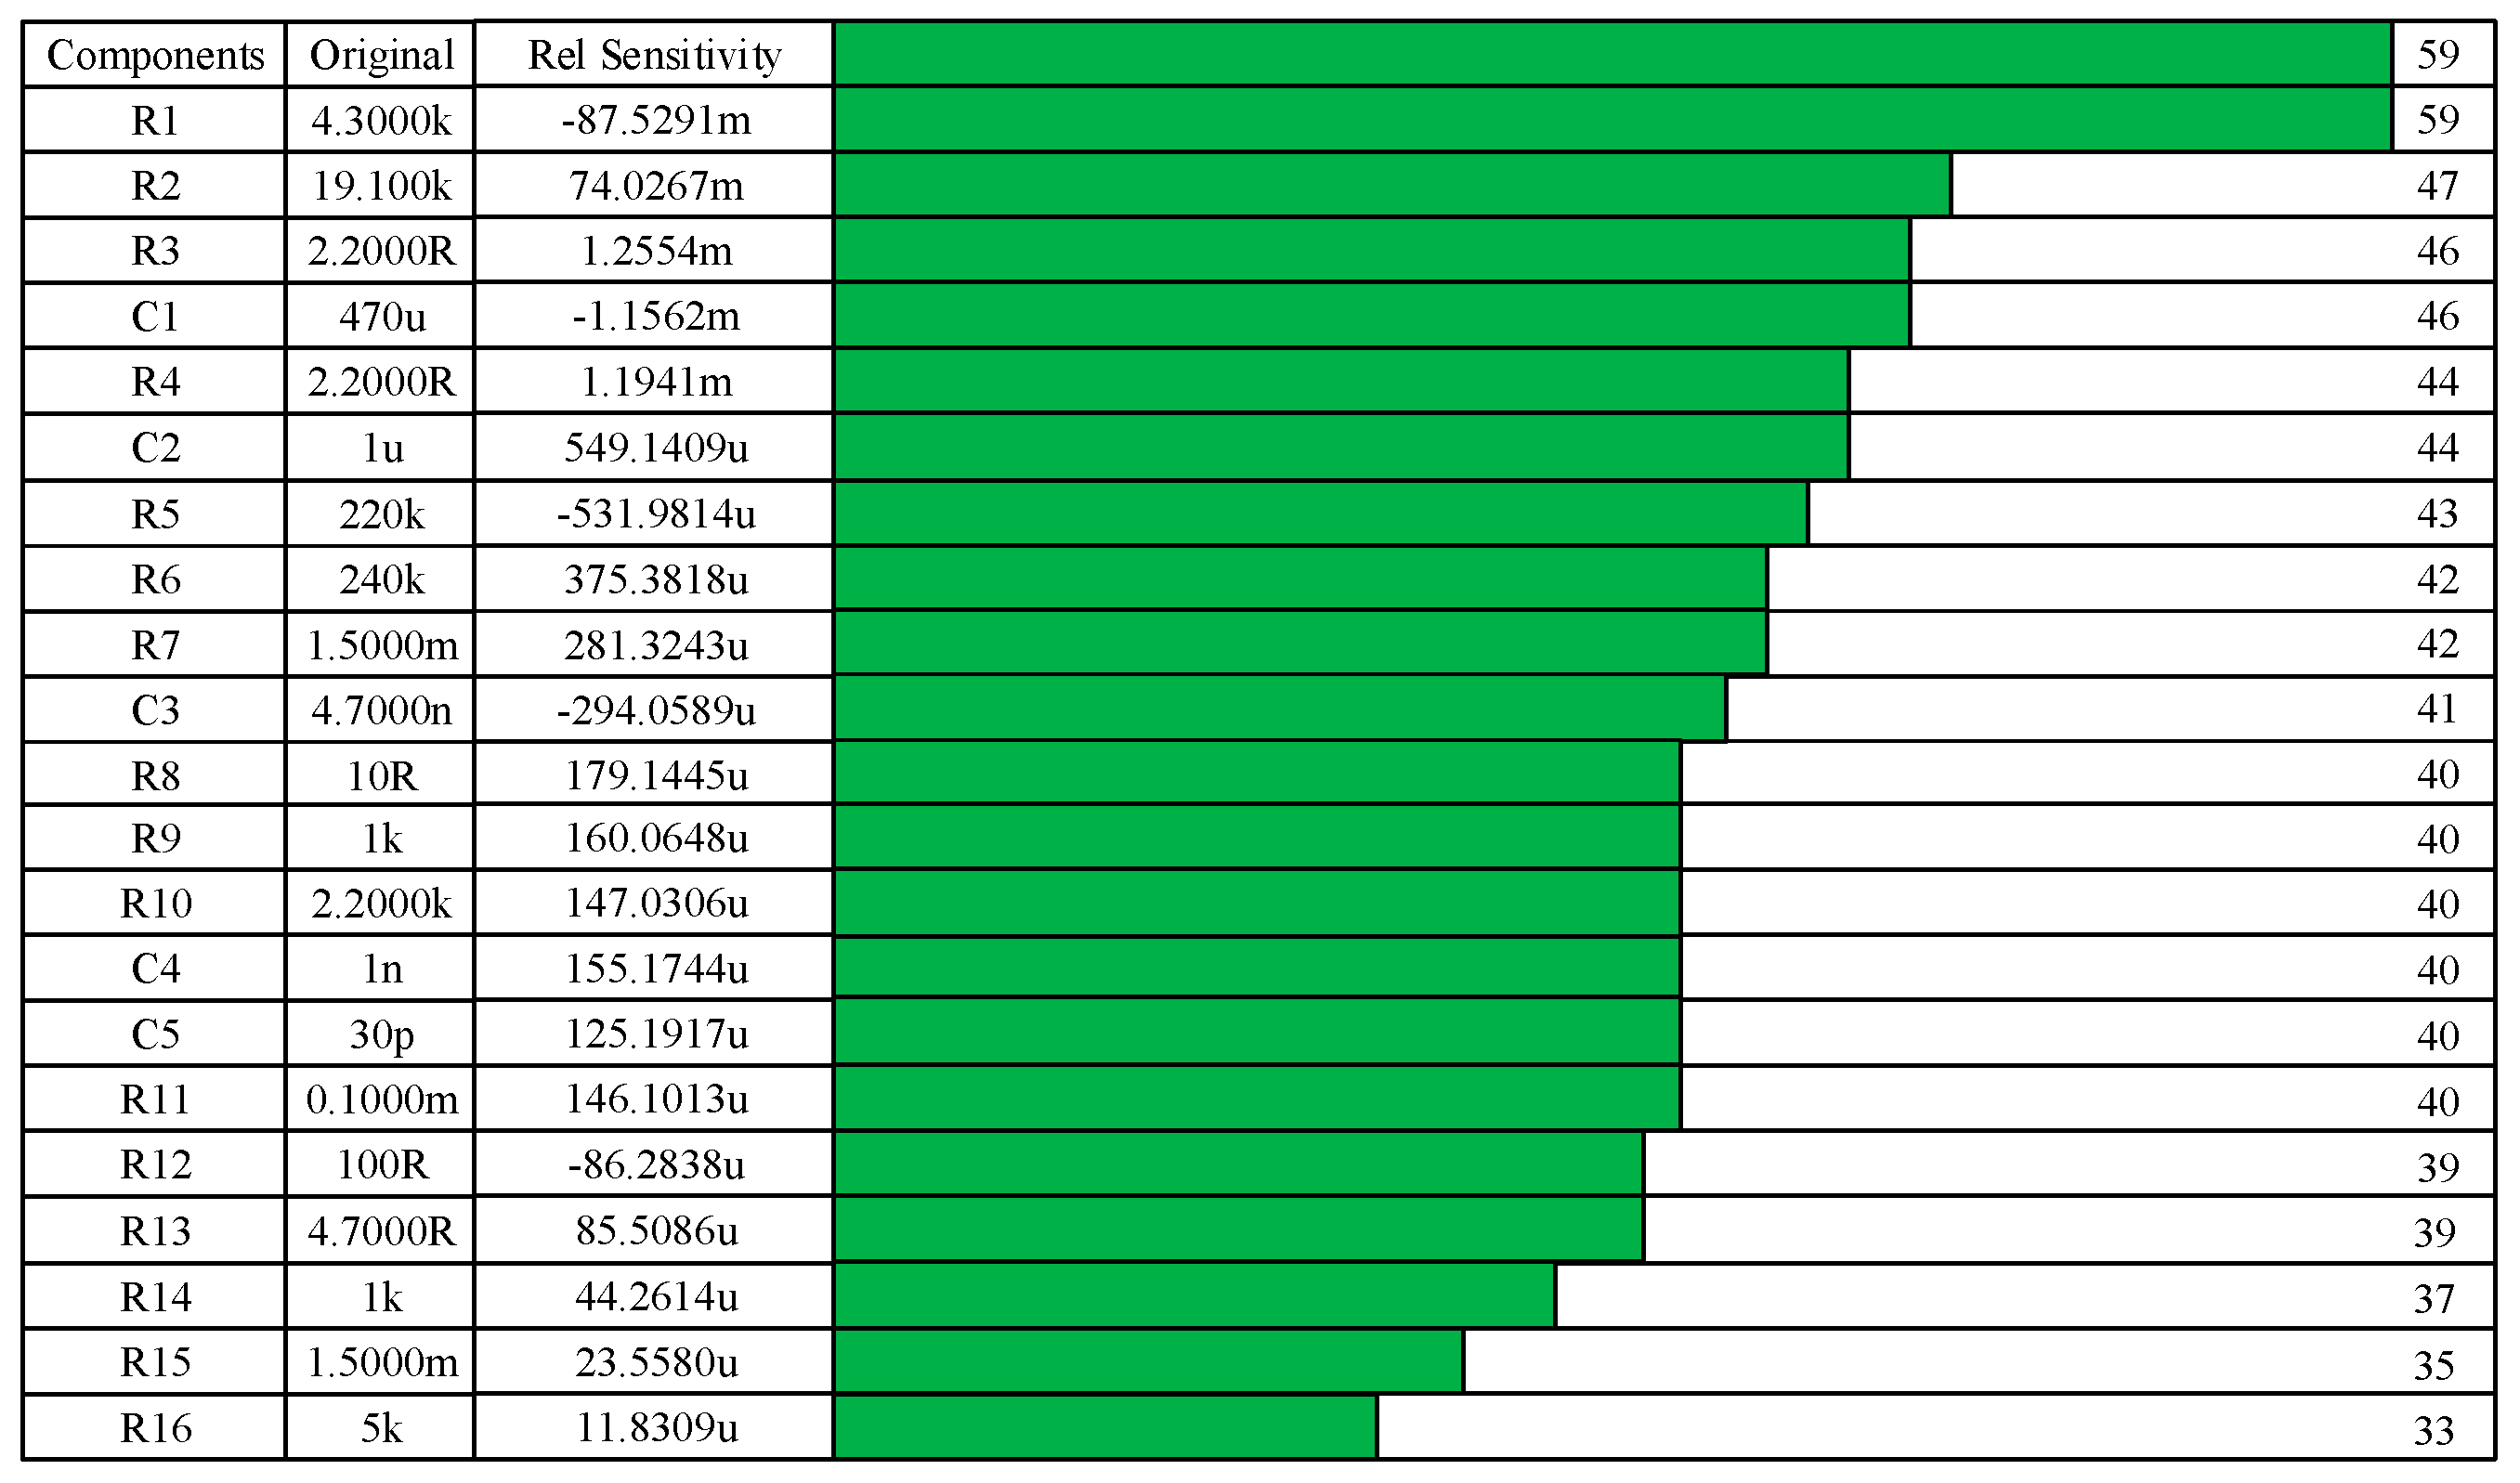
Based on the above circuit simulation model, the variable table is created in the PSpice 9.2 software, and the tolerance parameters of the resistors and capacitors are uniformly set to ±5%. A voltage probe is placed at the output node Vout, and a PSpice AD transient simulation analysis is performed. The measurement function, Max(Vout), is added to the output voltage, and the sensitivity analysis in the advanced simulation tool PSpice AA is carried out. The measurement function is imported for simulation analysis. The simulation results are shown in Figure 12.
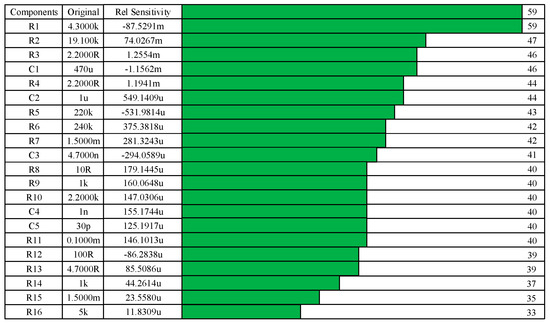
Figure 12.
Relative sensitivity simulation results.
As can be seen from Figure 12, the key components include voltage sampling resistors R1 and R2, current sampling resistors R3 and R4, output filter capacitor C1, and input filter components R5 and C3.
5.2. Evolution Trend Analysis of Simulation Degradation Characteristic Parameters
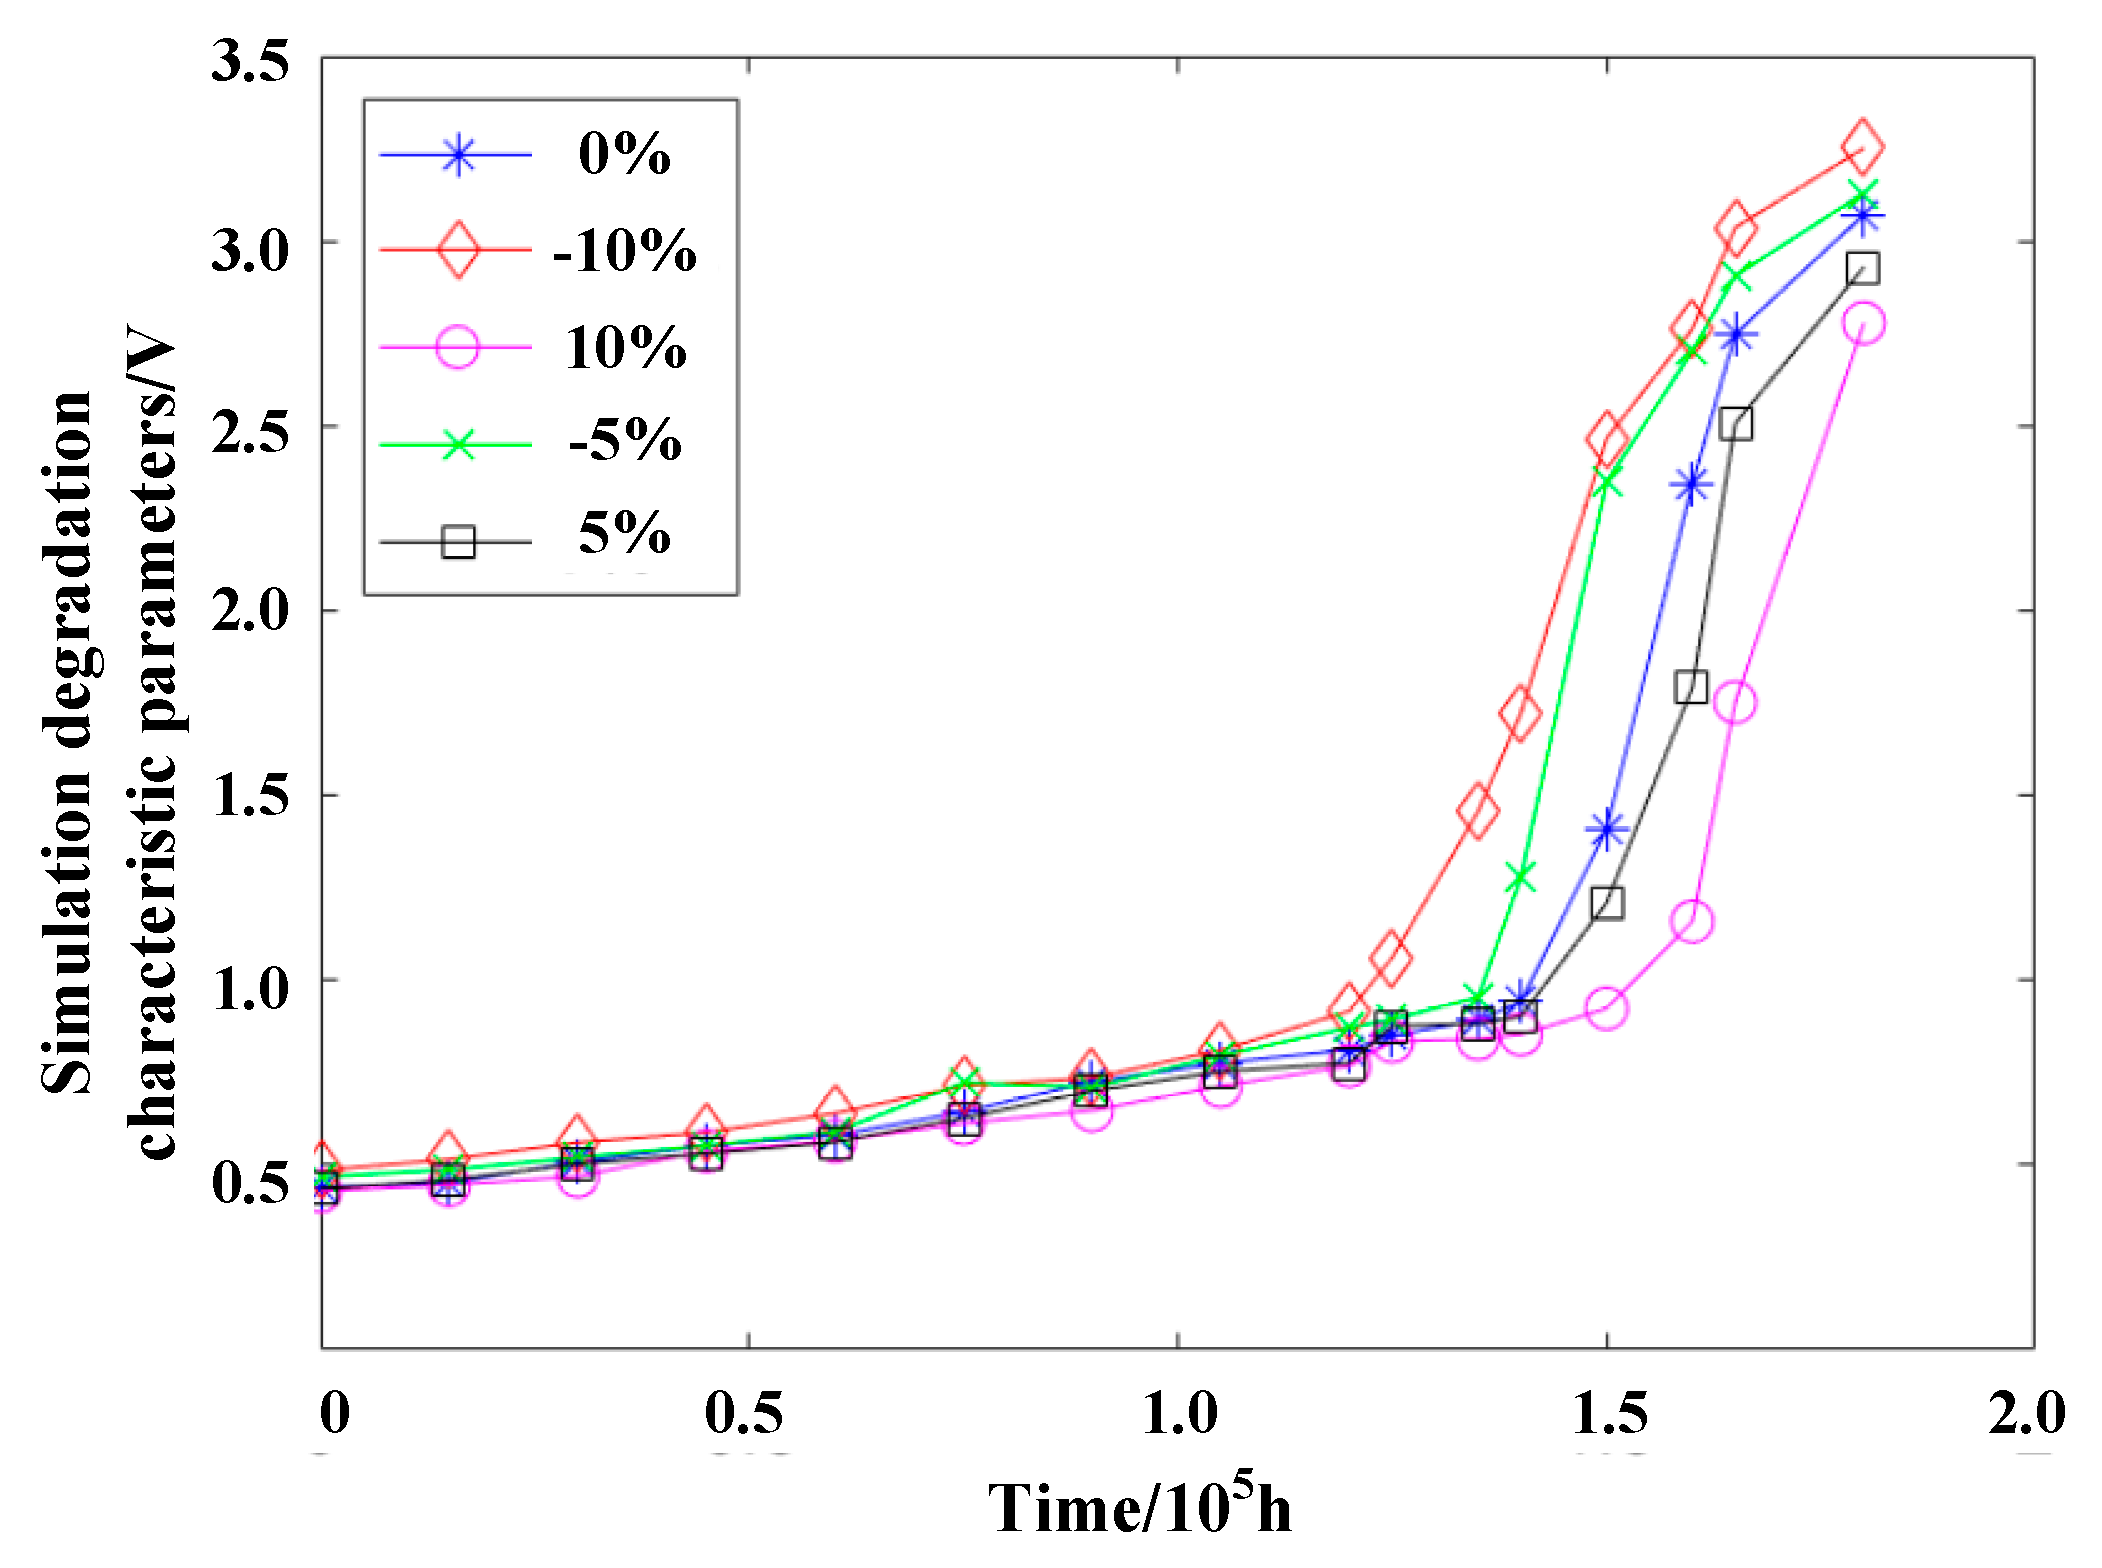
According to the failure analysis of the above samples, the electrolytic capacitor C22 at the output end of the switching power supply is the most vulnerable and weakest device. Due to the preparation process, there is a tolerance problem [19]; different samples have different initial parameter values: the initial capacitance value, C, and the initial equivalent series resistance (ESR) value. This section mainly considers the initial tolerance factor of electrolytic capacitors. The initial tolerance of the electrolytic capacitor is set to 0% (470 μF, 0.25 Ω), −10% (423 μF, 0.27 Ω), 10% (517 μF, 0.23 Ω), −5% (446.50 μF, 0.26 Ω), and 5% (493.50 μF, 0.24 Ω). The degradation characteristic parameters at different test times under different initial tolerance conditions are extracted in turn, and the least squares method is used for fitting. The results are shown in Figure 13.
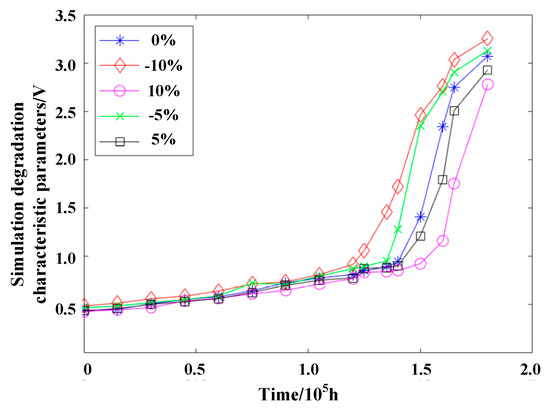
Figure 13.
Evolution trend of simulation degradation characteristic parameters.
According to Figure 13, the overall evolution trend of the simulated degradation characteristic parameters shows a relatively obvious two-stage nonlinear degradation characteristic, that is, it first undergoes a relatively stable degradation process, and then the degradation process intensifies after the degradation “change point” until failure. This further verifies that the intelligent circuit breaker control circuit meets the working characteristics of the two-stage nonlinear degradation process during normal use.
The simulation results are compared with the results obtained from the accelerated life test. The Pearson correlation coefficient is used to characterize the consistency of the degradation trends of the two. The closer the Pearson correlation coefficient is to 1, the greater the similarity between the simulation and experimental results. The mean square error measures the difference between the data. The smaller the mean square error, the smaller the deviation between the simulation and experimental results. The calculation results are shown in Table 5. Under the three temperature stress conditions, the Pearson correlation coefficient, the mean square error of the simulation results, and the accelerated life test results are 0.9158 (85 °C), 0.9766 (95 °C), and 0.9484 (105 °C) and 0.2166 (85 °C), 0.1380 (95 °C), and 0.1527 (105 °C), respectively. Data consistency is the highest at 95 °C. The Pearson correlation coefficient can reach 0.9766, and the mean square error is 0.1380. Even at 85 °C, the similarity is still above 0.91. It can be seen from the analysis that the consistency of the simulation and experimental results is high, and the validity of the simulation model is proven.
Table 5.
Comparison of simulation results with accelerated life test results.
6. Conclusions
In this paper, the performance degradation characteristics of the intelligent circuit breaker control circuit are studied in depth, and the following conclusions are drawn:
- (1)
- An accelerated degradation test platform of the control circuit was successfully designed and built. Through an analysis of the degradation mechanism of the intelligent circuit breaker control circuit, the key weak links in the control circuit were determined, and the monitoring quantity was determined.
- (2)
- By extracting multi-dimensional features, such as the time domain, frequency domain, and wavelet domain, combined with a multi-dimensional evaluation index model, the optimal features were selected for a performance degradation trend analysis. The results show that the performance degradation of intelligent circuit breaker control circuits presents stage nonlinearity.
- (3)
- The important point is that a fixed segmentation algorithm was applied to realize the accurate division of the performance degradation stage. The results show that under 85 °C, 95 °C, and 105 °C, the performance degradation inflection points of the control circuit are 78.8%, 77.6%, and 77.0%, respectively, and the inflection point position is relatively fixed.
- (4)
- By building the PSpice simulation model of the key circuit, the obtained two-stage nonlinear degradation characteristics were verified, and the Pearson correlation coefficient was used to verify the consistency of the experimental and simulation results. The correlation coefficients are all above 0.9158, which further proves the reliability and consistency of the experiment and simulation.
Author Contributions
Conceptualization, Z.X. and Y.W.; methodology, L.H.; software, Y.C.; validation, P.H., L.H., and Y.W.; formal analysis, L.H.; investigation, P.H.; resources, Z.X.; data curation, P.H.; writing—original draft preparation, Z.X.; writing—review and editing, Z.X.; visualization, L.H.; supervision, P.H.; project administration, Y.C.; funding acquisition, Z.X. All authors have read and agreed to the published version of the manuscript.
Funding
This research was funded by the National Natural Science Foundation of China under Grant No. 51937004 and the Zhejiang Natural Science Foundation under Grant No. LTGG23E070001.
Data Availability Statement
Data is contained within the article.
Conflicts of Interest
Authors Zhenhua Xie, Linming Hou, Puquan He and Yizhou Cai were employed by the company Zhejiang Testing & Inspection Institute for Mechanical and Electrical Products Quality Co., Ltd. The remaining author declare that the research was conducted in the absence of any commercial or financial relationships that could be construed as a potential conflict of interest.
Nomenclature
List of Abbreviations
| SNR | Signal-to noise ratio |
| AC | Alternating current |
| DC | Direct current |
| Vout | Output node voltage |
| Xi | Collected test signal |
| Pi | Collected test signal’s spectrum |
| XM | Mean |
| XP | Peak value |
| XP-P | Peak-to-peak value |
| K | Kurtosis |
| FFC | Center of gravity frequency |
| C | Center of gravity frequency |
| E | Energy entropy |
| ESR | Equivalent series resistance |
| λs | Failure rate of control circuit |
| λi | Failure rate of i-th component in circuit |
| TBF | Mean time between failures of control circuit |
| R | Resistance |
| C | Capacitance |
References
- Ding, Z.; Hu, F.; Yu, C.; Wen, W. High-voltage thyristor life prediction method based on Wiener process. J. Wuhan Univ. (Eng. Ed.) 2022, 55, 1044–1049. [Google Scholar]
- Wei, X. Non-Intrusive Health Status Monitoring and Fault Warning of Key Components of Buck Converter; Beijing Jiaotong University: Beijing, China, 2021. [Google Scholar]
- Tuo, Y. Research on Component Staged Remaining Life Prediction Method Based on Wiener Process; North University of China: Taiyuan, China, 2023. [Google Scholar]
- Zheng, R.; Zhou, Y.; Gu, L.; Zhang, Z. Joint optimization of lot sizing and condition-based maintenance for a production system using the proportional hazards model. Comput. Ind. Eng. 2021, 154, 107157. [Google Scholar] [CrossRef]
- Gong, C.; Xu, H.; Yuan, Z.; Liang, J. The accelerated life test investigation and lifetime prediction method for LED driver. In Proceedings of the 2022 5th International Conference on Power and Energy Applications (ICPEA), Guangzhou, China, 18–20 November 2022; pp. 355–359. [Google Scholar]
- Padmasali, A.N.; Kini, S.G. Accelerated degradation test investigation for life-time performance analysis of LED luminaires. IEEE Trans. Compon. Packag. Manuf. Technol. 2020, 10, 551–558. [Google Scholar] [CrossRef]
- Wang, J.; Ma, X.; Zhao, Y.; Yang, L. A condition-based maintenance policy for two-stage continuous degradation considering inspection errors. In Proceedings of the 2023 5th International Conference on System Reliability and Safety Engineering (SRSE), Beijing, China, 20–23 October 2023; pp. 339–346. [Google Scholar]
- Liao, G. Research on Equipment Remaining Life Prediction Method Based on Multi-Stage Wiener Process; Chongqing University: Chongqing, China, 2022. [Google Scholar]
- Hu, J.; Sun, M.; Jing, B.; Liu, J.; Cao, X. Two-phase degradation modeling and residual life prediction based on nonlinear wiener process. In Proceedings of the 2021 Global Reliability and Prognostics and Health Management (PHM-Nanjing), Nanjing, China, 15–17 October 2021; pp. 1–8. [Google Scholar]
- Li, X. . Research on Performance Degradation Parameter Monitoring and Life Prediction Method of LED Driver Power Supply; Harbin Institute of Technology: Harbin, China, 2012. [Google Scholar]
- Liu, J. Performance Degradation Research and Reliability Analysis of MEMS Acceleration Sensor; University of Electronic Science and Technology of China: Chengdu, China, 2022. [Google Scholar]
- Zhou, J.; Coit, D.W.; Nassif, H.; Li, Z. Two-stage degradation modeling combined with machine learning for steel rebar degradation prediction. In Proceedings of the 2022 Annual Reliability and Maintainability Symposium (RAMS), Tucson, AZ, USA, 24–27 January 2022; pp. 1–7. [Google Scholar]
- Li, Y. Research on the Remaining Life Prediction Method of Rolling Bearings Based on Multi-Dimensional Degradation Characteristics. Master’s Thesis, Central North University, Minneapolis, MN, USA, 2024. [Google Scholar]
- Zheng, X.; Fan, W.; Chen, C.; Peng, Z. Adaptive two-stage model for bearing remaining useful life prediction using gaussian process regression with matched kernels. IEEE Trans. Reliab. 2024, 73, 1958–1966. [Google Scholar] [CrossRef]
- Zhou, H. Degradation Reliability Evaluation Method and Experimental Research of Ball Screw Pair; Nanjing University of Science and Technology: Nanjing, China, 2022. [Google Scholar]
- IEC 60068-2-2:2007; Environmental Testing—Part 2-2: Tests—Test B: Dry Heat. International Electrotechnical Commission. IEC: Geneva, Switzerland, 2007.
- Luo, Z. Research on Reliability Modeling and Evaluation Method of Long-Term Storage Equipment Based on Degradation Data; University of Electronic Science and Technology of China: Chengdu, China, 2020. [Google Scholar]
- Guan, Q.; Fu, Z. Analysis and application of exponential degradation trajectory model under random failure threshold. J. East China Norm. Univ. (Nat. Sci. Ed.) 2020, 2020, 7–15. [Google Scholar]
- Pan, Z. Reliability Prediction Method and Software Implementation of Typical Airborne Electronic Equipment Based on Failure Physics and Fault Tree Analysis; Xidian University: Xi’an, China, 2020. [Google Scholar]


Disclaimer/Publisher’s Note: The statements, opinions and data contained in all publications are solely those of the individual author(s) and contributor(s) and not of MDPI and/or the editor(s). MDPI and/or the editor(s) disclaim responsibility for any injury to people or property resulting from any ideas, methods, instructions or products referred to in the content. |
© 2025 by the authors. Licensee MDPI, Basel, Switzerland. This article is an open access article distributed under the terms and conditions of the Creative Commons Attribution (CC BY) license (https://creativecommons.org/licenses/by/4.0/).