
Thermally Driven Layered Phase Transition and Decomposition Kinetics of γ-AlH3: A Multiscale Study Integrating Core-Shell Dynamics and Fluorescence-Guided Analysis


Abstract
1. Introduction
2. Materials and Methods
2.1. Materials
2.2. Characterization of α and γ Phases
2.2.1. DSC Analysis
2.2.2. X-ray Powder Diffraction Analysis
2.2.3. SEM Analysis
2.3. In Situ X-Ray Powder Diffraction Analysis
2.4. In Situ Thermal Transformation Analysis
2.4.1. Non-Isothermal Hot Stage Analysis
2.4.2. Isothermal Hot Stage Analysis
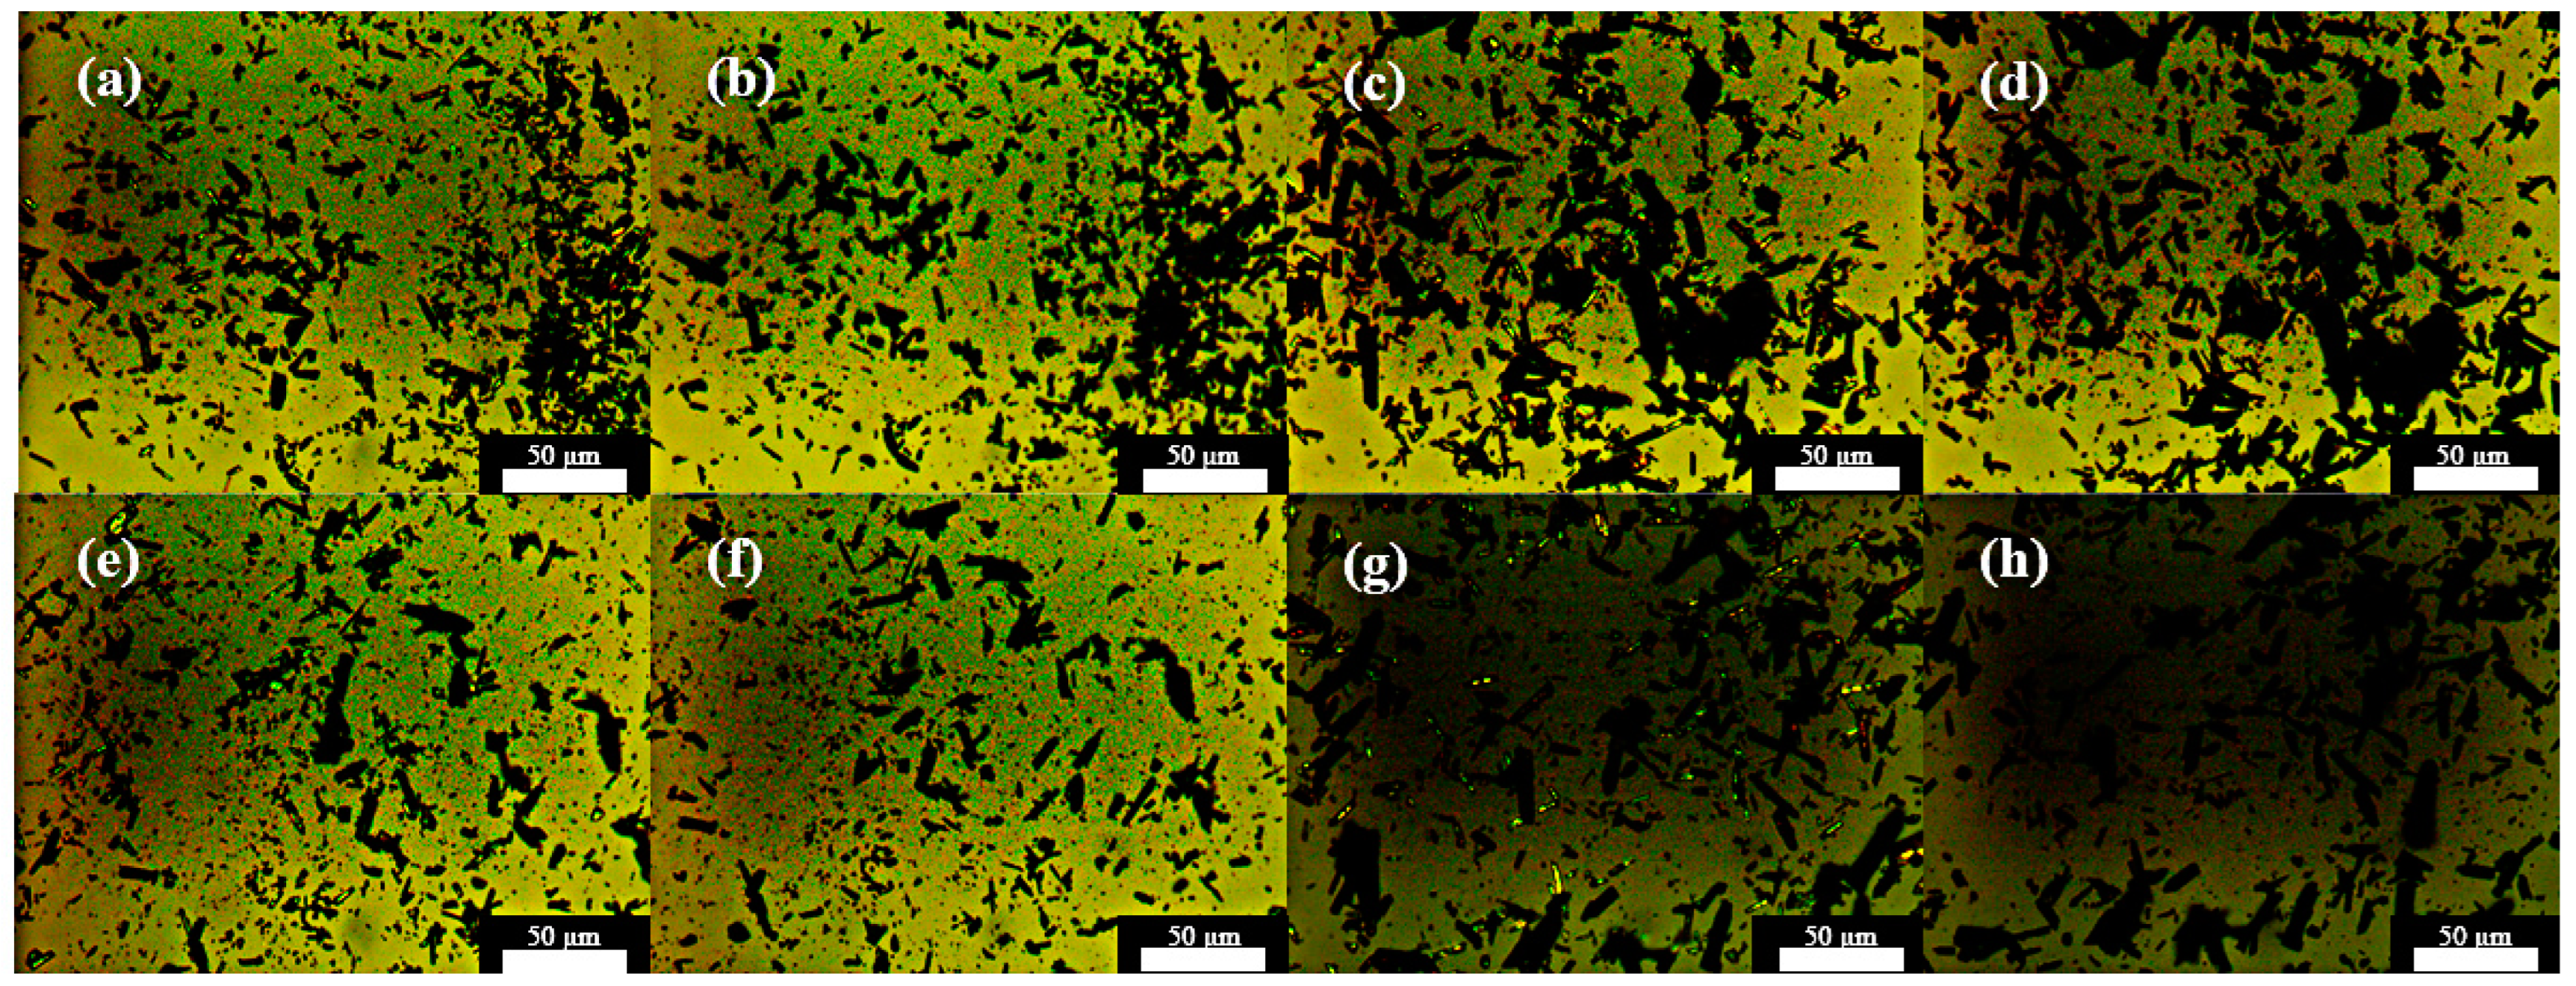
2.5. Fluorescence Image Processing Analysis
3. Results
3.1. Characterization of α and γ Phases
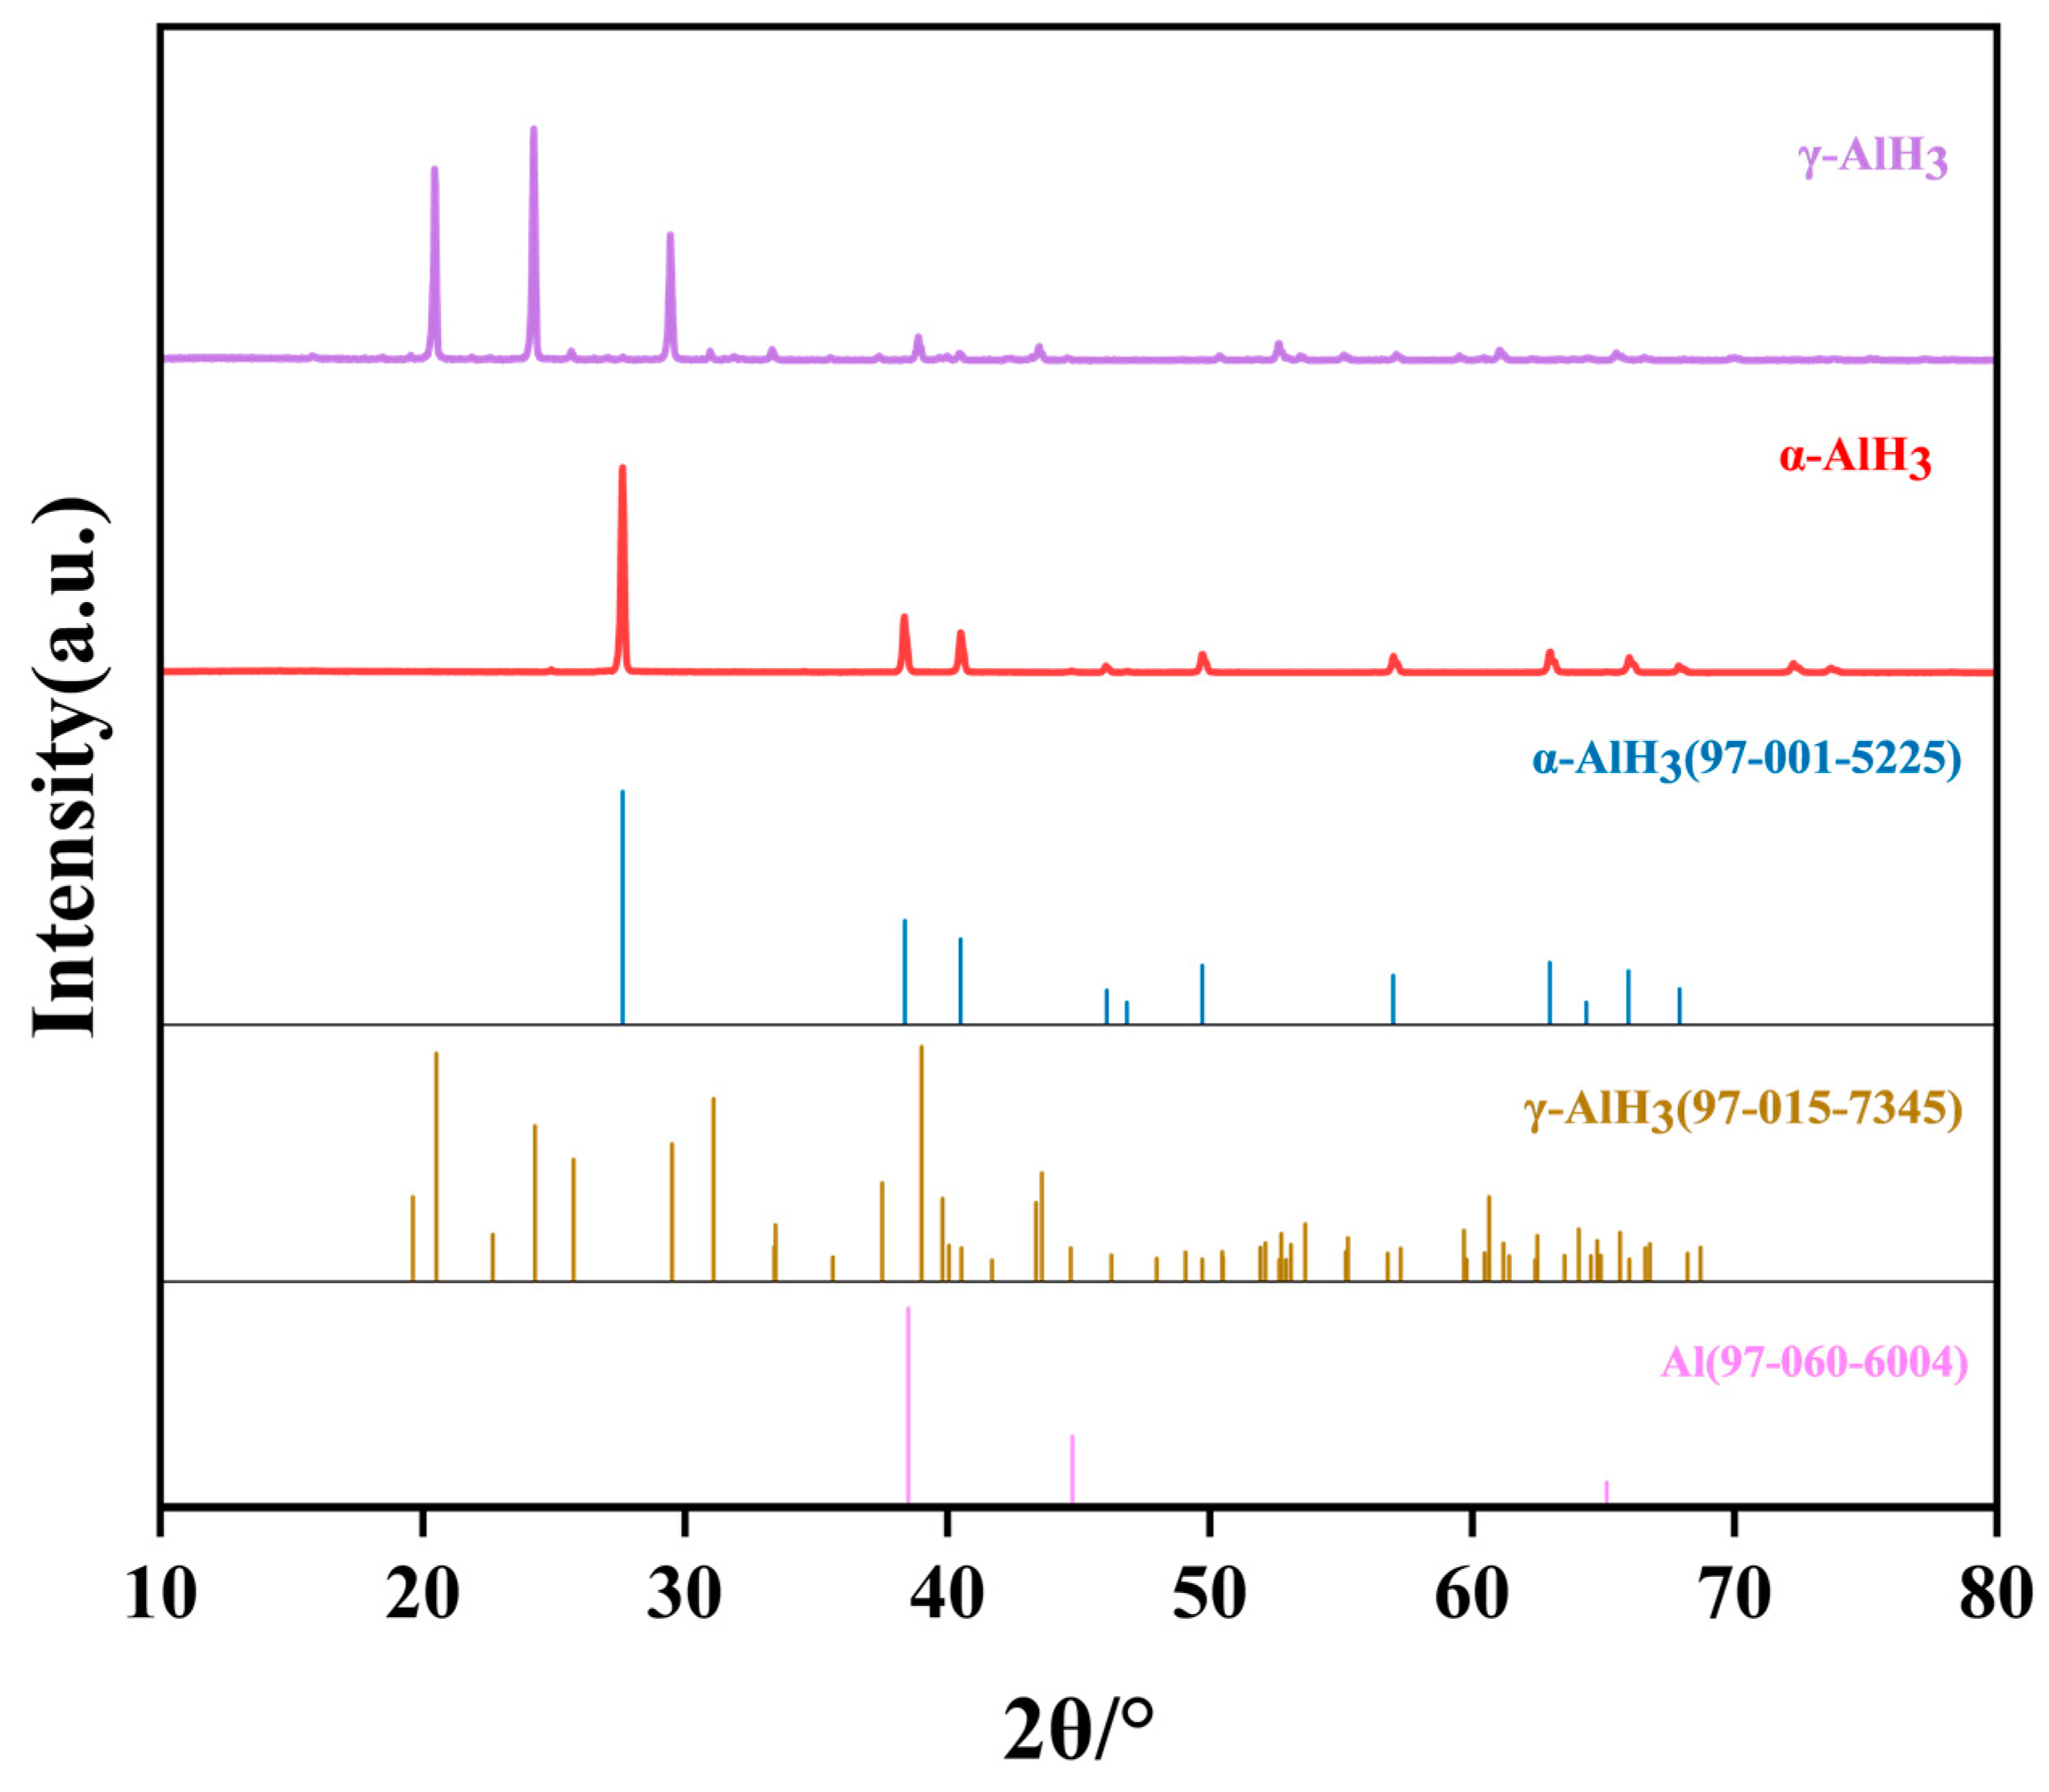
3.1.1. XRD Analysis
3.1.2. SEM Analysis
3.2. In Situ PXRD
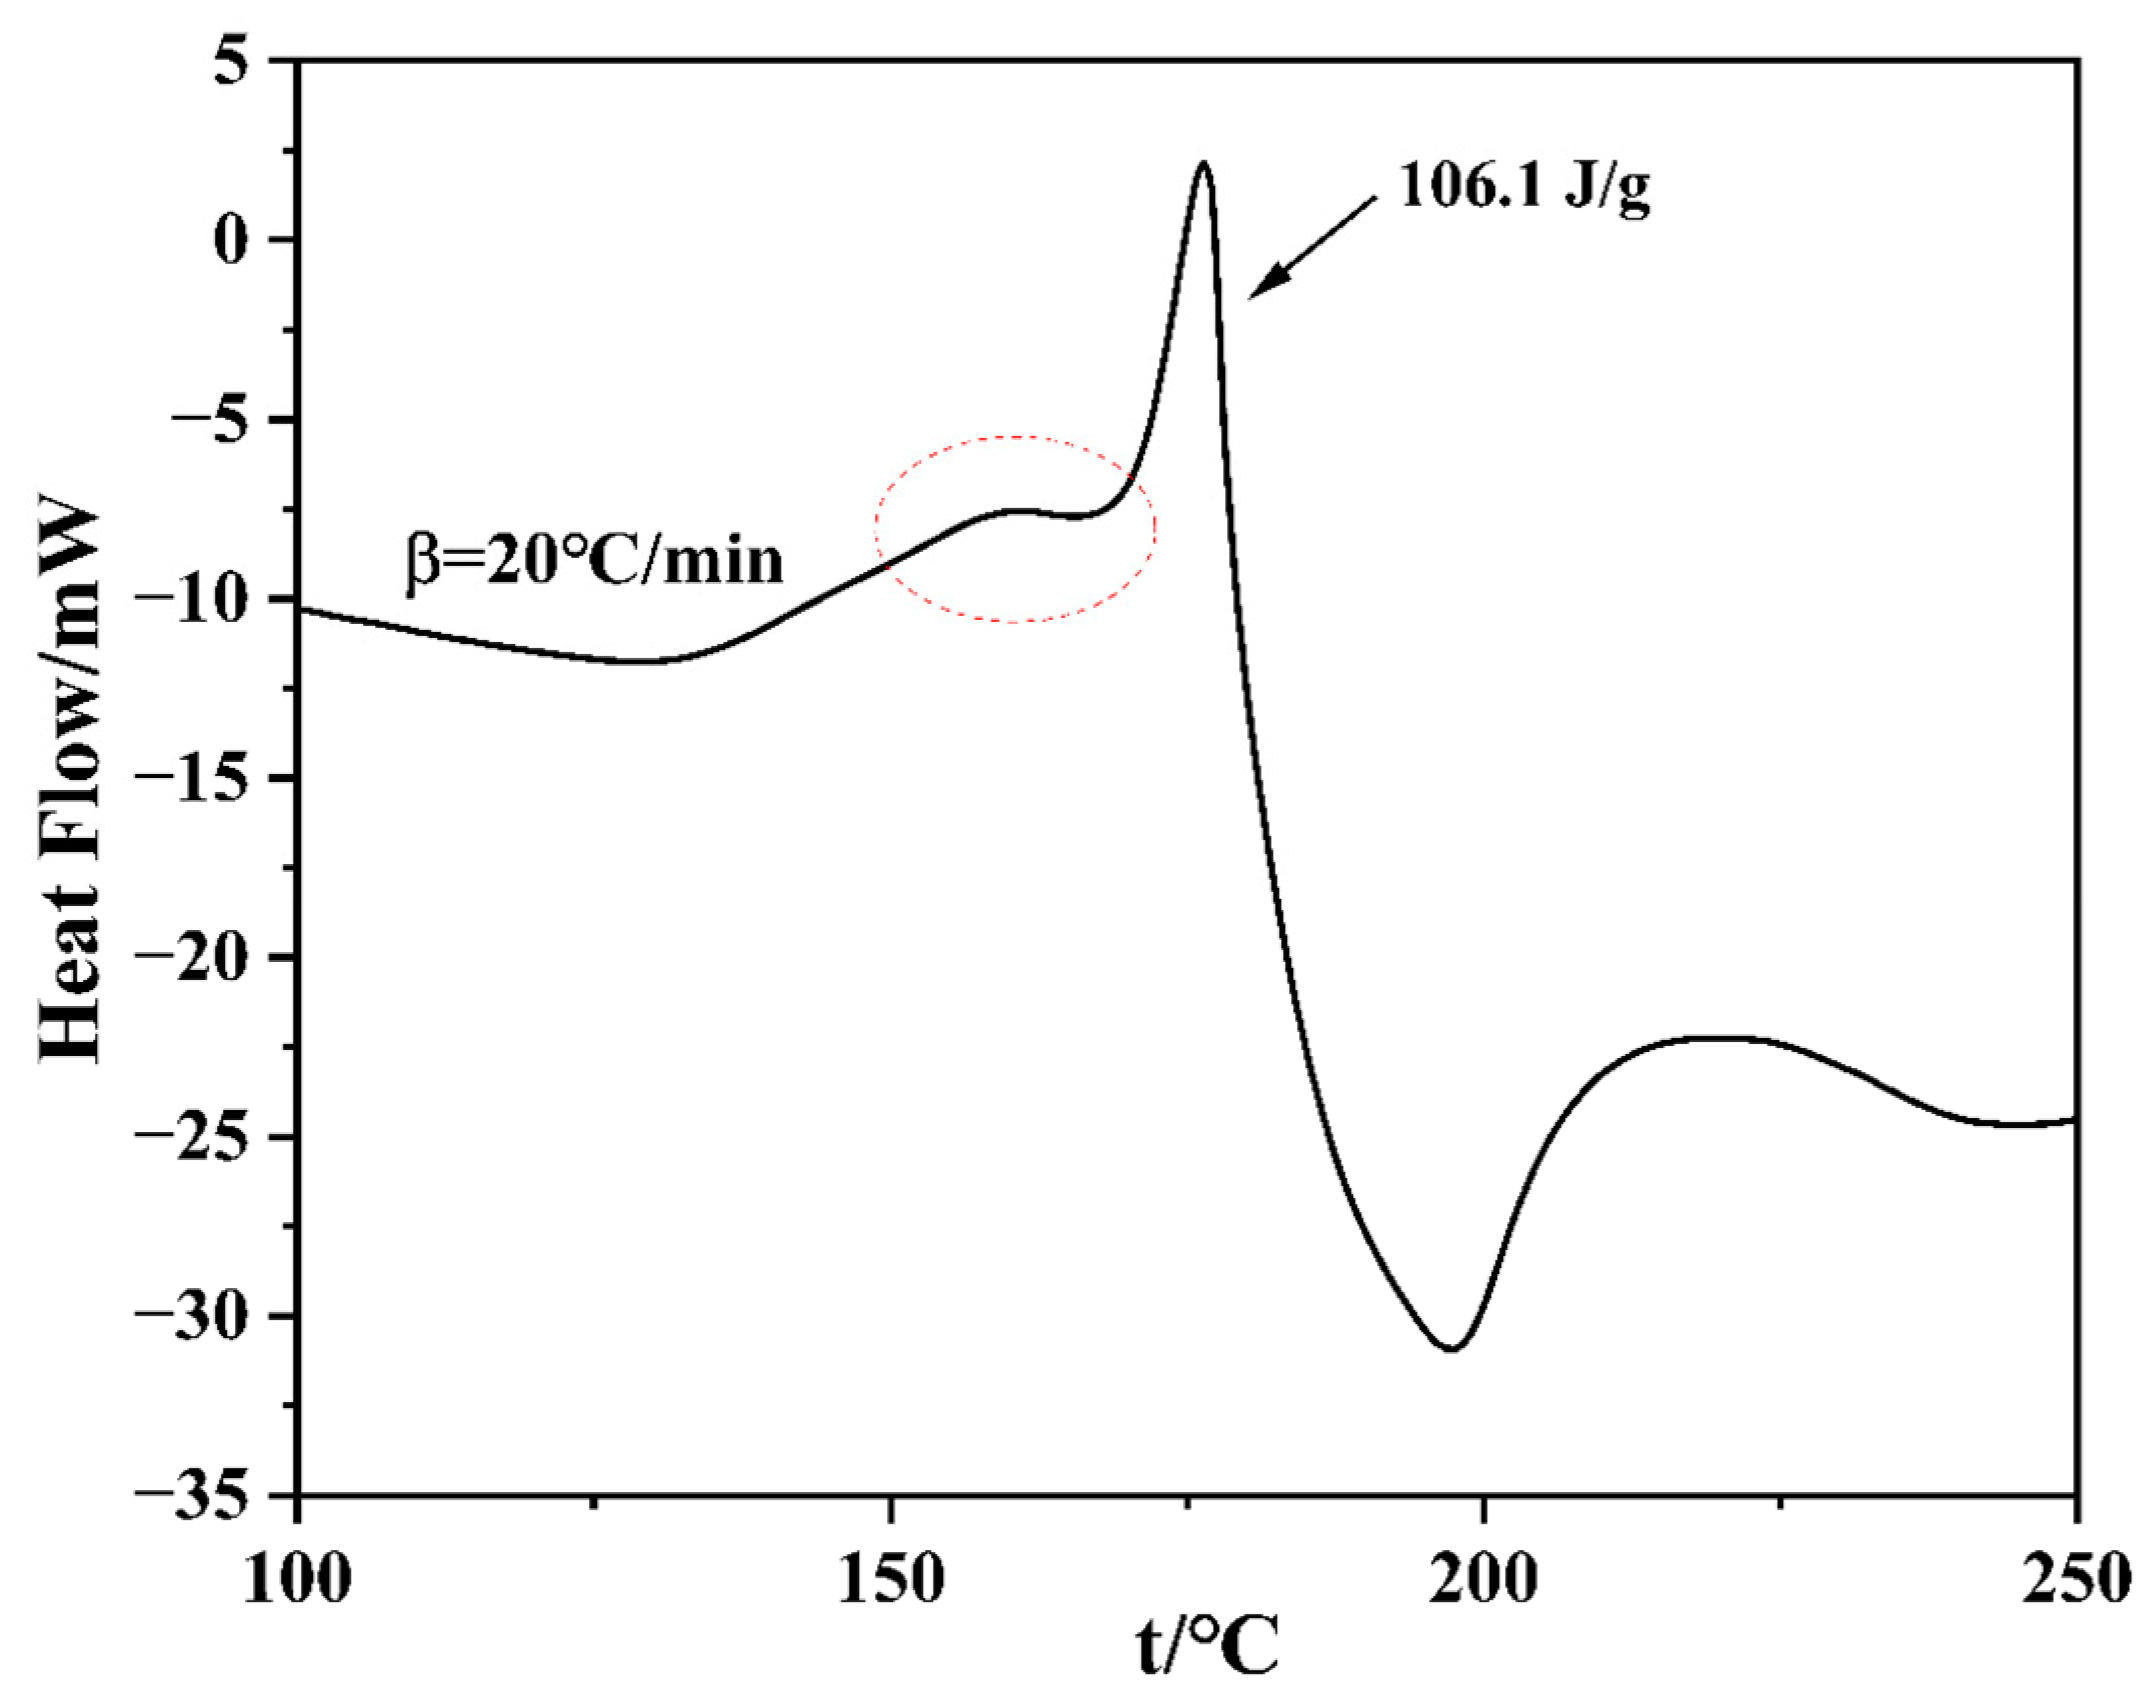
3.3. DSC Analysis
3.4. On-Line Analysis of Non-Adiabatic Phase Transitions
3.4.1. Non-Isothermal Hot Stage Analysis
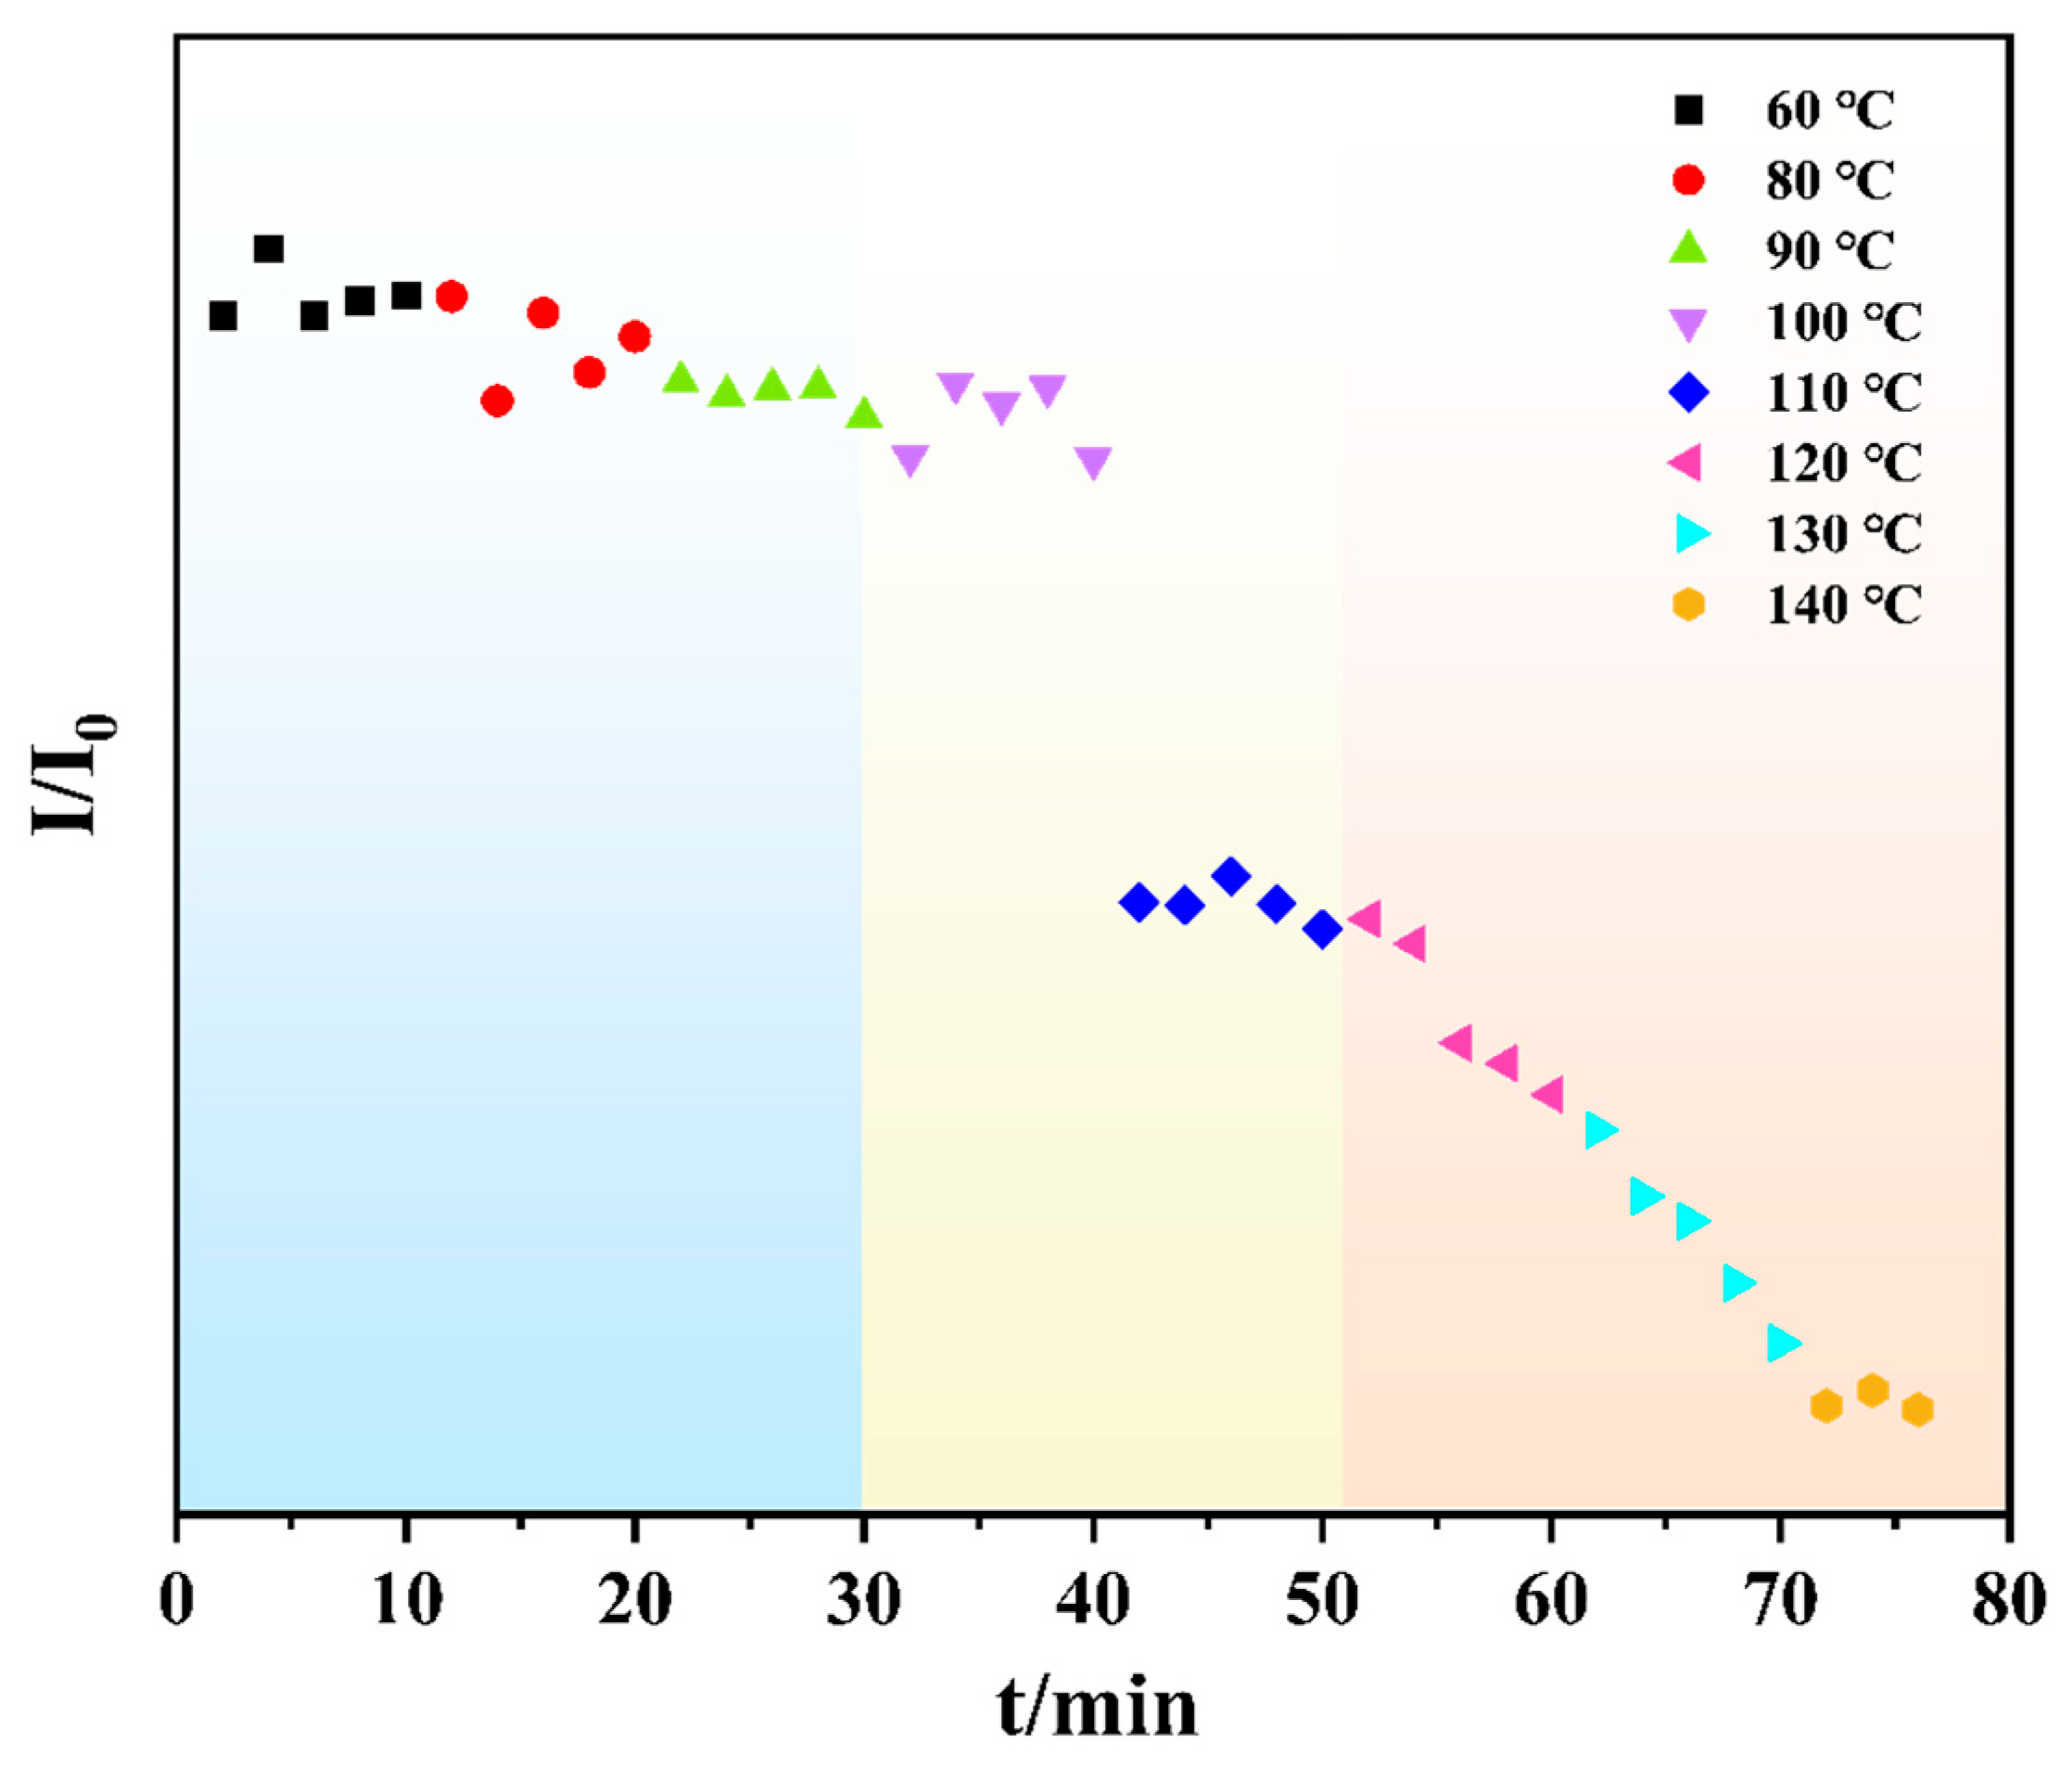
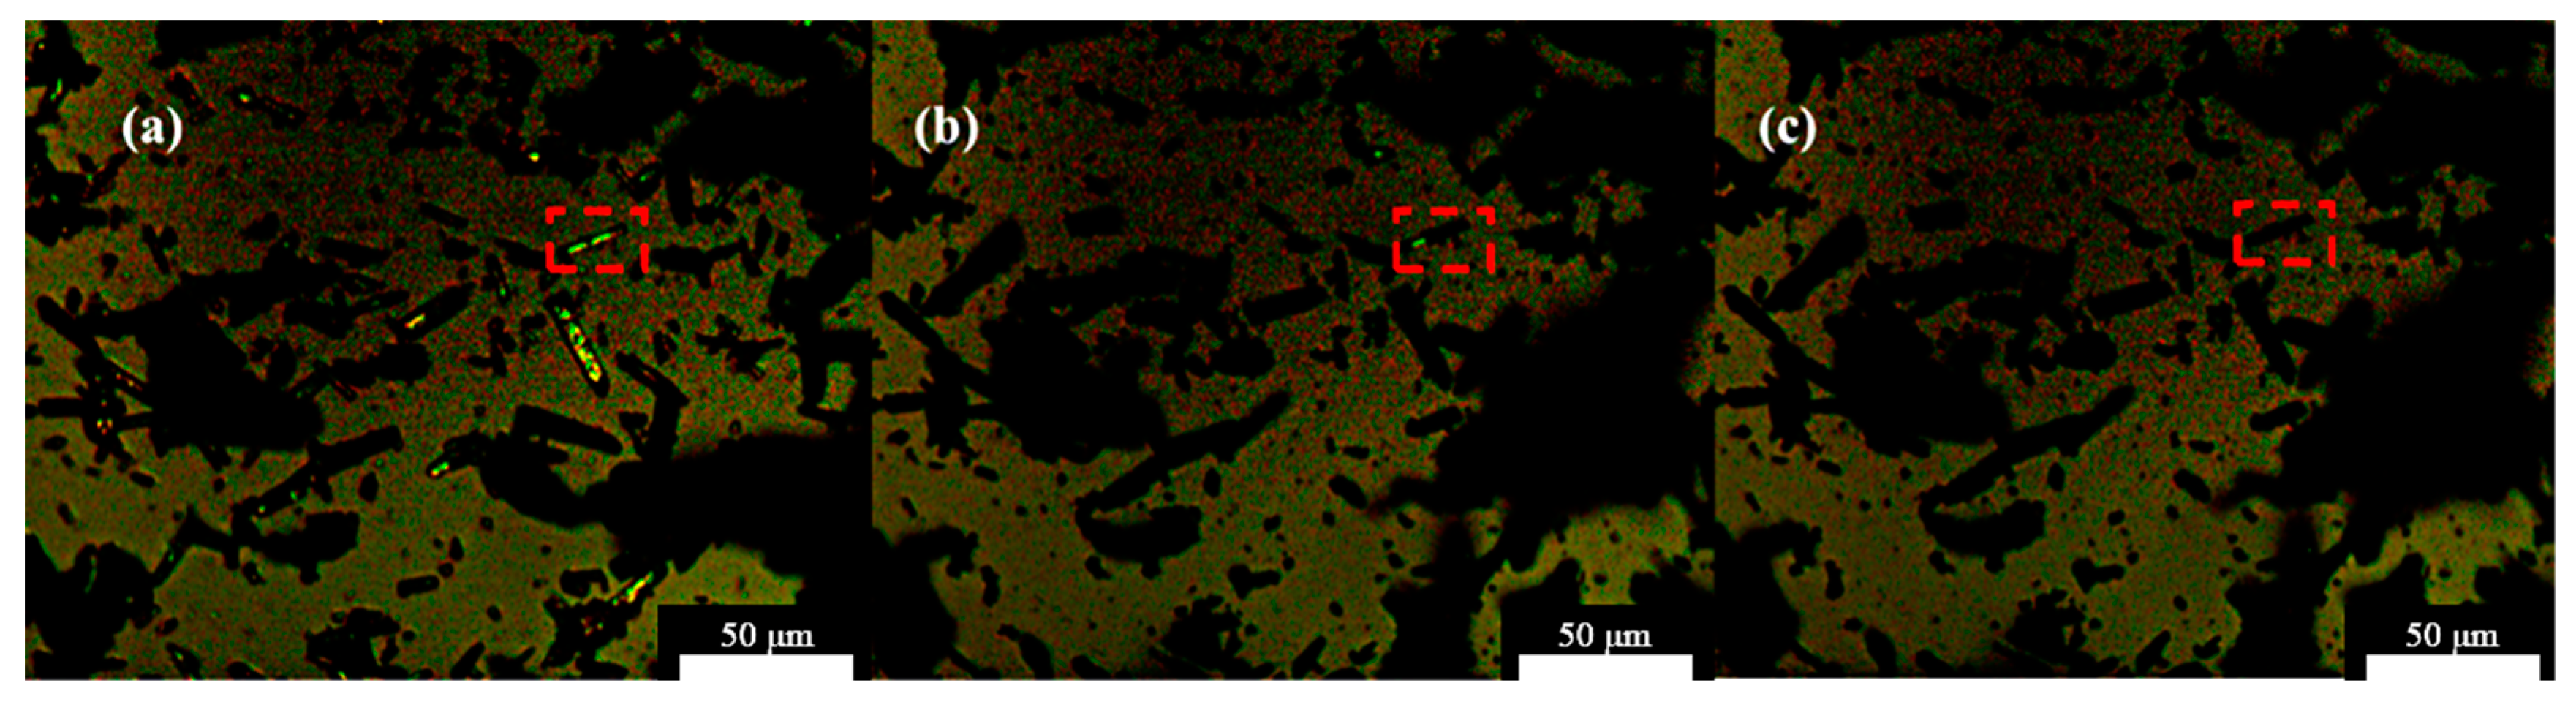
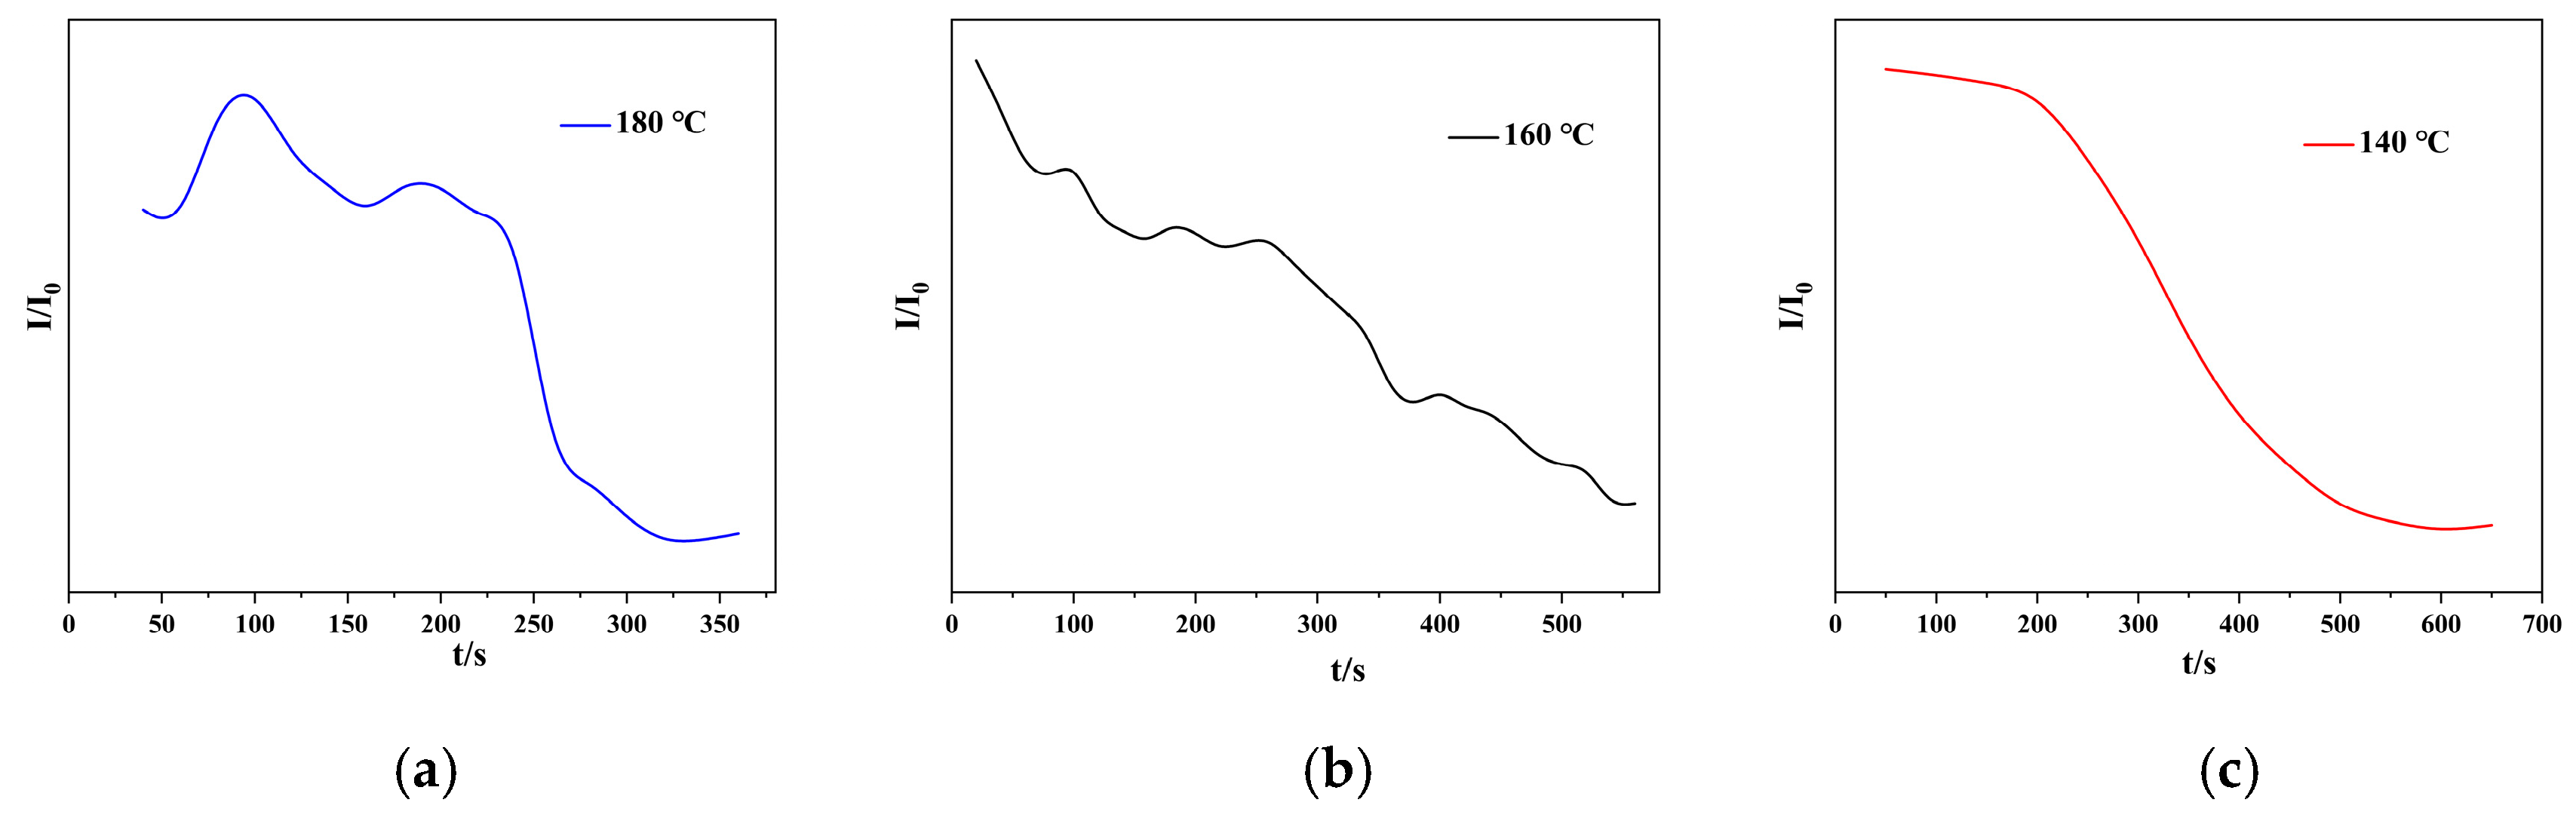
3.4.2. Isothermal Hot Stage Analysis
3.5. Kinetic Analysis of Crystal Phase Transition Mechanisms
4. Discussion
Author Contributions
Funding
Data Availability Statement
Conflicts of Interest
References
- Zidan, R.; Garcia-Diaz, B.L.; Fewox, C.S.; Stowe, A.C.; Gray, J.R.; Harter, A.G. Aluminium hydride: A reversible material for hydrogen storage. Chem. Commun. 2009, 40, 3717–3719. [Google Scholar] [CrossRef] [PubMed]
- Wang, L.; Rawal, A.; Aguey-Zinsou, K.-F. Hydrogen storage properties of nanoconfined aluminium hydride (AlH3). Chem. Eng. Sci. 2019, 194, 64–70. [Google Scholar] [CrossRef]
- Graetz, J. New approaches to hydrogen storage. Chem. Soc. Rev. 2009, 38, 73–82. [Google Scholar] [CrossRef] [PubMed]
- Liu, H.; Yuan, J.; Liao, X.; Sun, Z.; Liu, J. Effect of AlH3 on the energy performance and combustion agglomeration characteristics of solid propellants. Combust. Flame 2023, 256, 112873. [Google Scholar] [CrossRef]
- Yartys, V.A.; Denys, R.V.; Maehlen, J.P.; Frommen, C.; Fichtner, M.; Bulychev, B.M.; Emerich, H. Double-bridge bonding of aluminium and hydrogen in the crystal structure of γ-AlH3. Inorg. Chem. 2007, 46, 1051–1055. [Google Scholar] [CrossRef]
- Graetz, J.; Reilly, J.J. Thermodynamics of the α, β and γ polymorphs of AlH3. J. Alloys Compd. 2006, 424, 262–265. [Google Scholar] [CrossRef]
- Brinks, H.W.; Istad-Lem, A.; Hauback, B.C. Mechanochemical synthesis and crystal structure of α’-Ald3 and A-Ald3. J. Phys. Chem. B 2006, 110, 25833–25837. [Google Scholar] [CrossRef] [PubMed]
- Stecher, O.; Wiberg, E. Über einen nichtflüchtigen, polymeren Aluminiumwasserstoff (AlH3) x und einige flüchtige Verbindungen des monomeren AlH3. Berichte Der Dtsch. Chem. Ges. (A B Ser.) 1942, 75, 2003–2012. [Google Scholar] [CrossRef]
- Finholt, A.; Bond, A., Jr.; Schlesinger, H. Lithium aluminum hydride, aluminum hydride and lithium gallium hydride, and some of their applications in organic and inorganic chemistry1. J. Am. Chem. Soc. 1947, 69, 1199–1203. [Google Scholar] [CrossRef]
- Brower, F.M.; Matzek, N.E.; Reigler, P.F.; Rinn, H.W.; Roberts, C.B.; Schmidt, D.L.; Snover, J.A.; Terada, K. Preparation and properties of aluminum hydride. J. Am. Chem. Soc. 1976, 98, 2450–2453. [Google Scholar] [CrossRef]
- Hlova, I.Z.; Gupta, S.; Goldston, J.F.; Kobayashi, T.; Pruski, M.; Pecharsky, V.K. Dry mechanochemical synthesis of alane from LiH and AlCl3. Faraday Discuss. 2014, 170, 137–153. [Google Scholar] [CrossRef]
- Graetz, J.; Reilly, J.J. Decomposition kinetics of the AlH3 polymorphs. J. Phys. Chem. B 2005, 109, 22181–22185. [Google Scholar] [CrossRef] [PubMed]
- Graetz, J.; Reilly, J.; Kulleck, J.; Bowman, R. Kinetics and thermodynamics of the aluminum hydride polymorphs. J. Alloys Compd. 2007, 446, 271–275. [Google Scholar] [CrossRef]
- Liu, H.; Wang, X.; Dong, Z.; Cao, G.; Liu, Y.; Chen, L.; Yan, M. Dehydriding properties of γ-AlH3. Int. J. Hydrogen Energy 2013, 38, 10851–10856. [Google Scholar] [CrossRef]
- Gao, S.; Liu, H.; Wang, X.; Xu, L.; Liu, S.; Sheng, P.; Zhao, G.; Wang, B.; Li, H.; Yan, M. Hydrogen desorption behaviors of γ-AlH3: Diverse decomposition mechanisms for the outer layer and the inner part of γ-AlH3 particle. Int. J. Hydrogen Energy 2017, 42, 25310–25315. [Google Scholar] [CrossRef]
- Safaie, H.; Coleman, M.; Johnston, R.; Das, A.; Russell, J.; Pleydell-Pearce, C. Circular polarized light microscopy to investigate the crystal orientation of aluminium. Mater. Charact. 2022, 185, 111749. [Google Scholar] [CrossRef]
- Entwistle, A.; Noble, M. The use of polarization analysis in the quantification of fluorescent emission: General principles. J. Microsc. 1992, 165, 331–346. [Google Scholar] [CrossRef]
- Oldenbourg, R. Polarized light microscopy: Principles and practice. Cold Spring Harb. Protoc. 2013, 2013, pdb.top078600. [Google Scholar] [CrossRef]
- Schroeder, A.B.; Dobson, E.T.; Rueden, C.T.; Tomancak, P.; Jug, F.; Eliceiri, K.W. The ImageJ ecosystem: Open-source software for image visualization, processing, and analysis. Protein Sci. 2021, 30, 234–249. [Google Scholar] [CrossRef]
- Liang, W.; Wang, J.; Liu, H.; Meng, Z.; Qiu, L.; Wang, S. Thermally induced polymorphic transformation of Hexanitrohexaazaisowurtzitane (CL-20). Powder Technol. 2022, 395, 732–742. [Google Scholar] [CrossRef]
- Sunagawa, I. Growth and morphology of crystals. Forma 1999, 14, 147–166. [Google Scholar]
- van Huis, M.A.; Young, N.P.; Pandraud, G.; Creemer, J.F.; Vanmaekelbergh, D.; Kirkland, A.I.; Zandbergen, H.W. Atomic imaging of phase transitions and morphology transformations in nanocrystals. Adv. Mater. 2009, 21, 4992–4995. [Google Scholar] [CrossRef] [PubMed]
- Nancollas, G.; Purdie, N. The kinetics of crystal growth. Q. Rev. Chem. Soc. 1964, 18, 1–20. [Google Scholar] [CrossRef]
- Zhang, Q.; Jiang, L.; Mei, X. Thermodynamic and kinetic investigation of agomelatine polymorph transformation. Pharm. Dev. Technol. 2016, 21, 196–203. [Google Scholar] [CrossRef]
- Yan, F.; Sun, Z.; Zhang, H.; Sun, X.; Jiang, Y.; Bai, Z. The fluorescence mechanism of carbon dots, and methods for tuning their emission color: A review. Microchim. Acta 2019, 186, 583. [Google Scholar] [CrossRef]
- Helfrich, W.; Lipsett, F. Fluorescence and defect fluorescence of anthracene at 4.2 K. J. Chem. Phys. 1965, 43, 4368–4376. [Google Scholar] [CrossRef]
- Kempa, P.B.; Thome, V.; Herrmann, M. Structure, chemical and physical behavior of aluminum hybride. Part. Part. Syst. Charact. 2009. [Google Scholar] [CrossRef]
- Savić, M.; Radaković, J.; Batalović, K. Study on electronic properties of α-, β-and γ-AlH3–The theoretical approach. Comput. Mater. Sci. 2017, 134, 100–108. [Google Scholar] [CrossRef]
- Su, W.; Zhao, F.; Ma, L.; Tang, R.; Dong, Y.; Kong, G.; Zhang, Y.; Niu, S.; Tang, G.; Wang, Y. Synthesis and stability of hydrogen storage material aluminum hydride. Materials 2021, 14, 2898. [Google Scholar] [CrossRef]
- Zahn, D.; Anwar, J. Collective displacements in a molecular crystal polymorphic transformation. RSC Adv. 2013, 3, 12810–12815. [Google Scholar] [CrossRef]
- Peng, Y.; Wang, F.; Wang, Z.; Alsayed, A.M.; Zhang, Z.; Yodh, A.G.; Han, Y. Two-step nucleation mechanism in solid–solid phase transitions. Nat. Mater. 2015, 14, 101–108. [Google Scholar] [CrossRef] [PubMed]


| Name | Temperature Points/(°C) | Heating Rate/(°C min−1) | Residence Time/min |
|---|---|---|---|
| γ-100-180 | 100, 120, 140, 160, 180 | 10 | 10 |
| γ-60-160 | 60, 80, 90, 100, 110, 120, 130, 140, 150, 160 | 10 | 10 |
| Name | Interval Time/s | Heating Rate/(°C min−1) | Atmosphere |
|---|---|---|---|
| 100 | 300 | 25 | N2 |
| 120 | 180 | 25 | N2 |
| 140 | 50 | 25 | N2 |
| 160 | 20 | 25 | N2 |
| 180 | 20 | 25 | N2 |
Disclaimer/Publisher’s Note: The statements, opinions and data contained in all publications are solely those of the individual author(s) and contributor(s) and not of MDPI and/or the editor(s). MDPI and/or the editor(s) disclaim responsibility for any injury to people or property resulting from any ideas, methods, instructions or products referred to in the content. |
© 2025 by the authors. Licensee MDPI, Basel, Switzerland. This article is an open access article distributed under the terms and conditions of the Creative Commons Attribution (CC BY) license (https://creativecommons.org/licenses/by/4.0/).
Share and Cite
Sun, M.; Dang, L. Thermally Driven Layered Phase Transition and Decomposition Kinetics of γ-AlH3: A Multiscale Study Integrating Core-Shell Dynamics and Fluorescence-Guided Analysis. Processes 2025, 13, 1321. https://doi.org/10.3390/pr13051321
Sun M, Dang L. Thermally Driven Layered Phase Transition and Decomposition Kinetics of γ-AlH3: A Multiscale Study Integrating Core-Shell Dynamics and Fluorescence-Guided Analysis. Processes. 2025; 13(5):1321. https://doi.org/10.3390/pr13051321
Chicago/Turabian StyleSun, Mengfan, and Leping Dang. 2025. "Thermally Driven Layered Phase Transition and Decomposition Kinetics of γ-AlH3: A Multiscale Study Integrating Core-Shell Dynamics and Fluorescence-Guided Analysis" Processes 13, no. 5: 1321. https://doi.org/10.3390/pr13051321
APA StyleSun, M., & Dang, L. (2025). Thermally Driven Layered Phase Transition and Decomposition Kinetics of γ-AlH3: A Multiscale Study Integrating Core-Shell Dynamics and Fluorescence-Guided Analysis. Processes, 13(5), 1321. https://doi.org/10.3390/pr13051321