1. Introduction
At present, more than half of the coal mines operating in China represent high-gas mines. These mines often suffer from severe gas disasters, with high gas control costs and difficulties. The long gas extraction cycles both on the ground and underground severely restrict mining efficiency [
1,
2]. Coal seam heat injection and gas extraction technology utilize electric heating devices to inject superheated water into the planned mining area of an underground coal seam. By providing heat to the coal seam, it promotes rapid gas desorption, increases gas discharge driving pressure, and achieves the efficient extraction of coal seam gas. This technology is expected to promote revolutionary breakthroughs in mine gas prevention and control [
3,
4,
5].
In implementing CBM thermal extraction, the evolution of the CBM temperature field is the key factor affecting efficiency; as such, it has been widely investigated by many scholars in recent years. Yang Xinle et al. [
6] pointed out that in the process of coal seam heat injection, steam increases the CBM temperature through convection heat exchange and phase change condensation heat conductivity, increasing the amount of CBM desorption. Su Chang et al. [
7] found that in a certain production area and mining time, with an increase in shaft number, the influence range increases, the temperature change increases, and the pressure funnel decreases over a large area, which is conducive to the extraction of CBM from the adsorption state. Liu Jie [
8] pointed out that, during the steam and coal seam convection heat exchange, while the steam undergoes a condensation phase change, the coal seam absorbs a lot of latent vaporization heat. As such, the coal seam temperature significantly increases, thereby promoting gas discharge. Ren Changzai et al. [
9] used a briquette as the experimental sample. Through an intermittent heat desorption experiment on coal samples under different effective stress and gas pressure conditions, they found that different intermittent heat injection time sequences have significant impacts on coal seam temperature and the amount of CBM gas desorption. Ma Yulin et al. [
10] pointed out that when injecting coalbed methane, the temperature gradient of the coal seam changes constantly through intermittent heat injection, and the coal seam is heated and desorbed, which is conducive to the output of coalbed methane. Hu Linjie’s [
11] research shows that, in the process of coal mine heat injection gas extraction, with a gas extraction area layout with one or more holes and arranged drilling circulation heat injection and drainage gas extraction, one can realize an area of efficient single-drilling coal seam heat injection, drilling heat injection, and gas extraction with an effective radius of more than 5 m. Zhu et al. [
12] used the coupled mathematical model of CBM heat injection mining to study the influence of different influencing factors and coupling variables on heat injection mining. Sun Keming et al. [
13] studied the problem of water-phase flow in the process of CBM extraction and established a fluid–solid coupling model; however, in their study, they did not address the effect of temperature on CBM extraction. Zhang Liping [
14] established a heat–fluid–solid coupling CBM mining model considering the effect of temperature and revealed the influence of both CBM stress and temperature on the CBM mining seepage law. Wang Jianmei et al. [
15] established a two-phase flow model for coalbed methane water in coal seam injection mining based on the principles of vaporization and condensation dynamic equilibrium, diffusion, and Darcy’s law. They analyzed the effects of capillary force and gravity on flow under different conditions. Considering the adsorption and desorption effect of CBM and the change in reservoir temperature and pressure, Xu Dani [
16] established a heat–fluid–solid coupling model of CBM water mining and employed Comsol Multiphysics 6.0 software to simulate the calculation under different working conditions. Shahtalebi et al. [
17] conducted significant research to improve the CBM extraction rate through thermal measures. Based on the theories of percolation mechanics and heat transfer, Yang Xu et al. [
18] established a numerical calculation model of flow and heat coupling and carried out numerical simulation research on CBM temperature field change law.
It can be seen from the above studies that, in coal seam mining, the drilling arrangement and heating mode are important factors affecting coal seam temperature field evolution. However, at present, the change patterns and real-time monitoring of coal seam temperature fields under different drilling layout schemes and heat injection methods are not clear. Some numerical calculation models are too complex, and subtle changes in parameters may lead to large errors, which introduces great difficulties to determining the process parameters of gas extraction and gas extraction efficiency prediction. In light of this, in this paper, based on the theory that rock resistivity will change accordingly when the temperature rises, we establish the law of temperature–resistivity correlation and carry out both indoor and outdoor experimental research on the law of resistivity change in different rock strata under changes in the temperature field. The results are of great significance for optimizing gas extraction and improving CBM mining efficiency.
2. Theoretical Research
Rocks are composed of two main parts: skeletons and pores. The rock skeleton itself is nonconductive, but if the pore space is filled with water, the rock can conduct electricity. In other words, electricity is conducted through the electrolyte water solution in the pores of the rock. Generally, as the temperature increases, the electrical conductivity of the aqueous solution also increases, and the resistivity decreases due to the increased movement speed of ions in the pore solution. Through experimentation, scholars such as Yokoyama [
19] from Japan proposed a correlation between the electrical resistivity and temperature of aqueous solutions.
In this formula, T and ρw are the temperature and resistivity of the aqueous solution, respectively.
Arps [
20] also proposed a relationship between the electrical resistivity, porosity, saturation, and pore water resistivity of rocks, as expressed in Equation (2) below:
where ρ
R and ρ
w are the resistivity of the rock and pore water, respectively; φ is the porosity of the rock; s is its saturation; and a, m, and n are the corresponding parameters for different types of rocks.
The above two equations indicate that the electrical resistivity of rock changes with variations in the pore water temperature.
According to statistics, most of the coal seams in Shanxi Province exist in mudstone, sandstone, tuff, and other sedimentary strata. To verify the actual resistivity changes in different rocks with temperature change, heating tests were first conducted on rock samples of coal, tuff, mudstone, and sandstone. The changes in the resistivity of the rock samples were recorded as the temperature increased from 23 °C to 96 °C. After the indoor experiment was completed, in situ heating tests were conducted on the mudstone rock mass in the experimental tunnel. The purpose of this experimental research is to study the actual situation of rock resistivity changes corresponding to temperature changes in rock formations.
3. Indoor Experiment
To study the changes in the electrical resistivity of different rocks with increasing temperature, four sets of coal, five sets of tuff, five sets of sandstone, and five sets of mudstone were selected as experimental samples. The core making in the indoor rock physics test was based on national standards.
The experimental steps for determining the relationship between temperature and resistivity in indoor experiments include the following:
(1) Core sampling, polishing, and sample preparation;
(2) Saturation of the rock sample with a vacuum pump (
Figure 1);
(3) Measurement of physical parameters of rock samples;
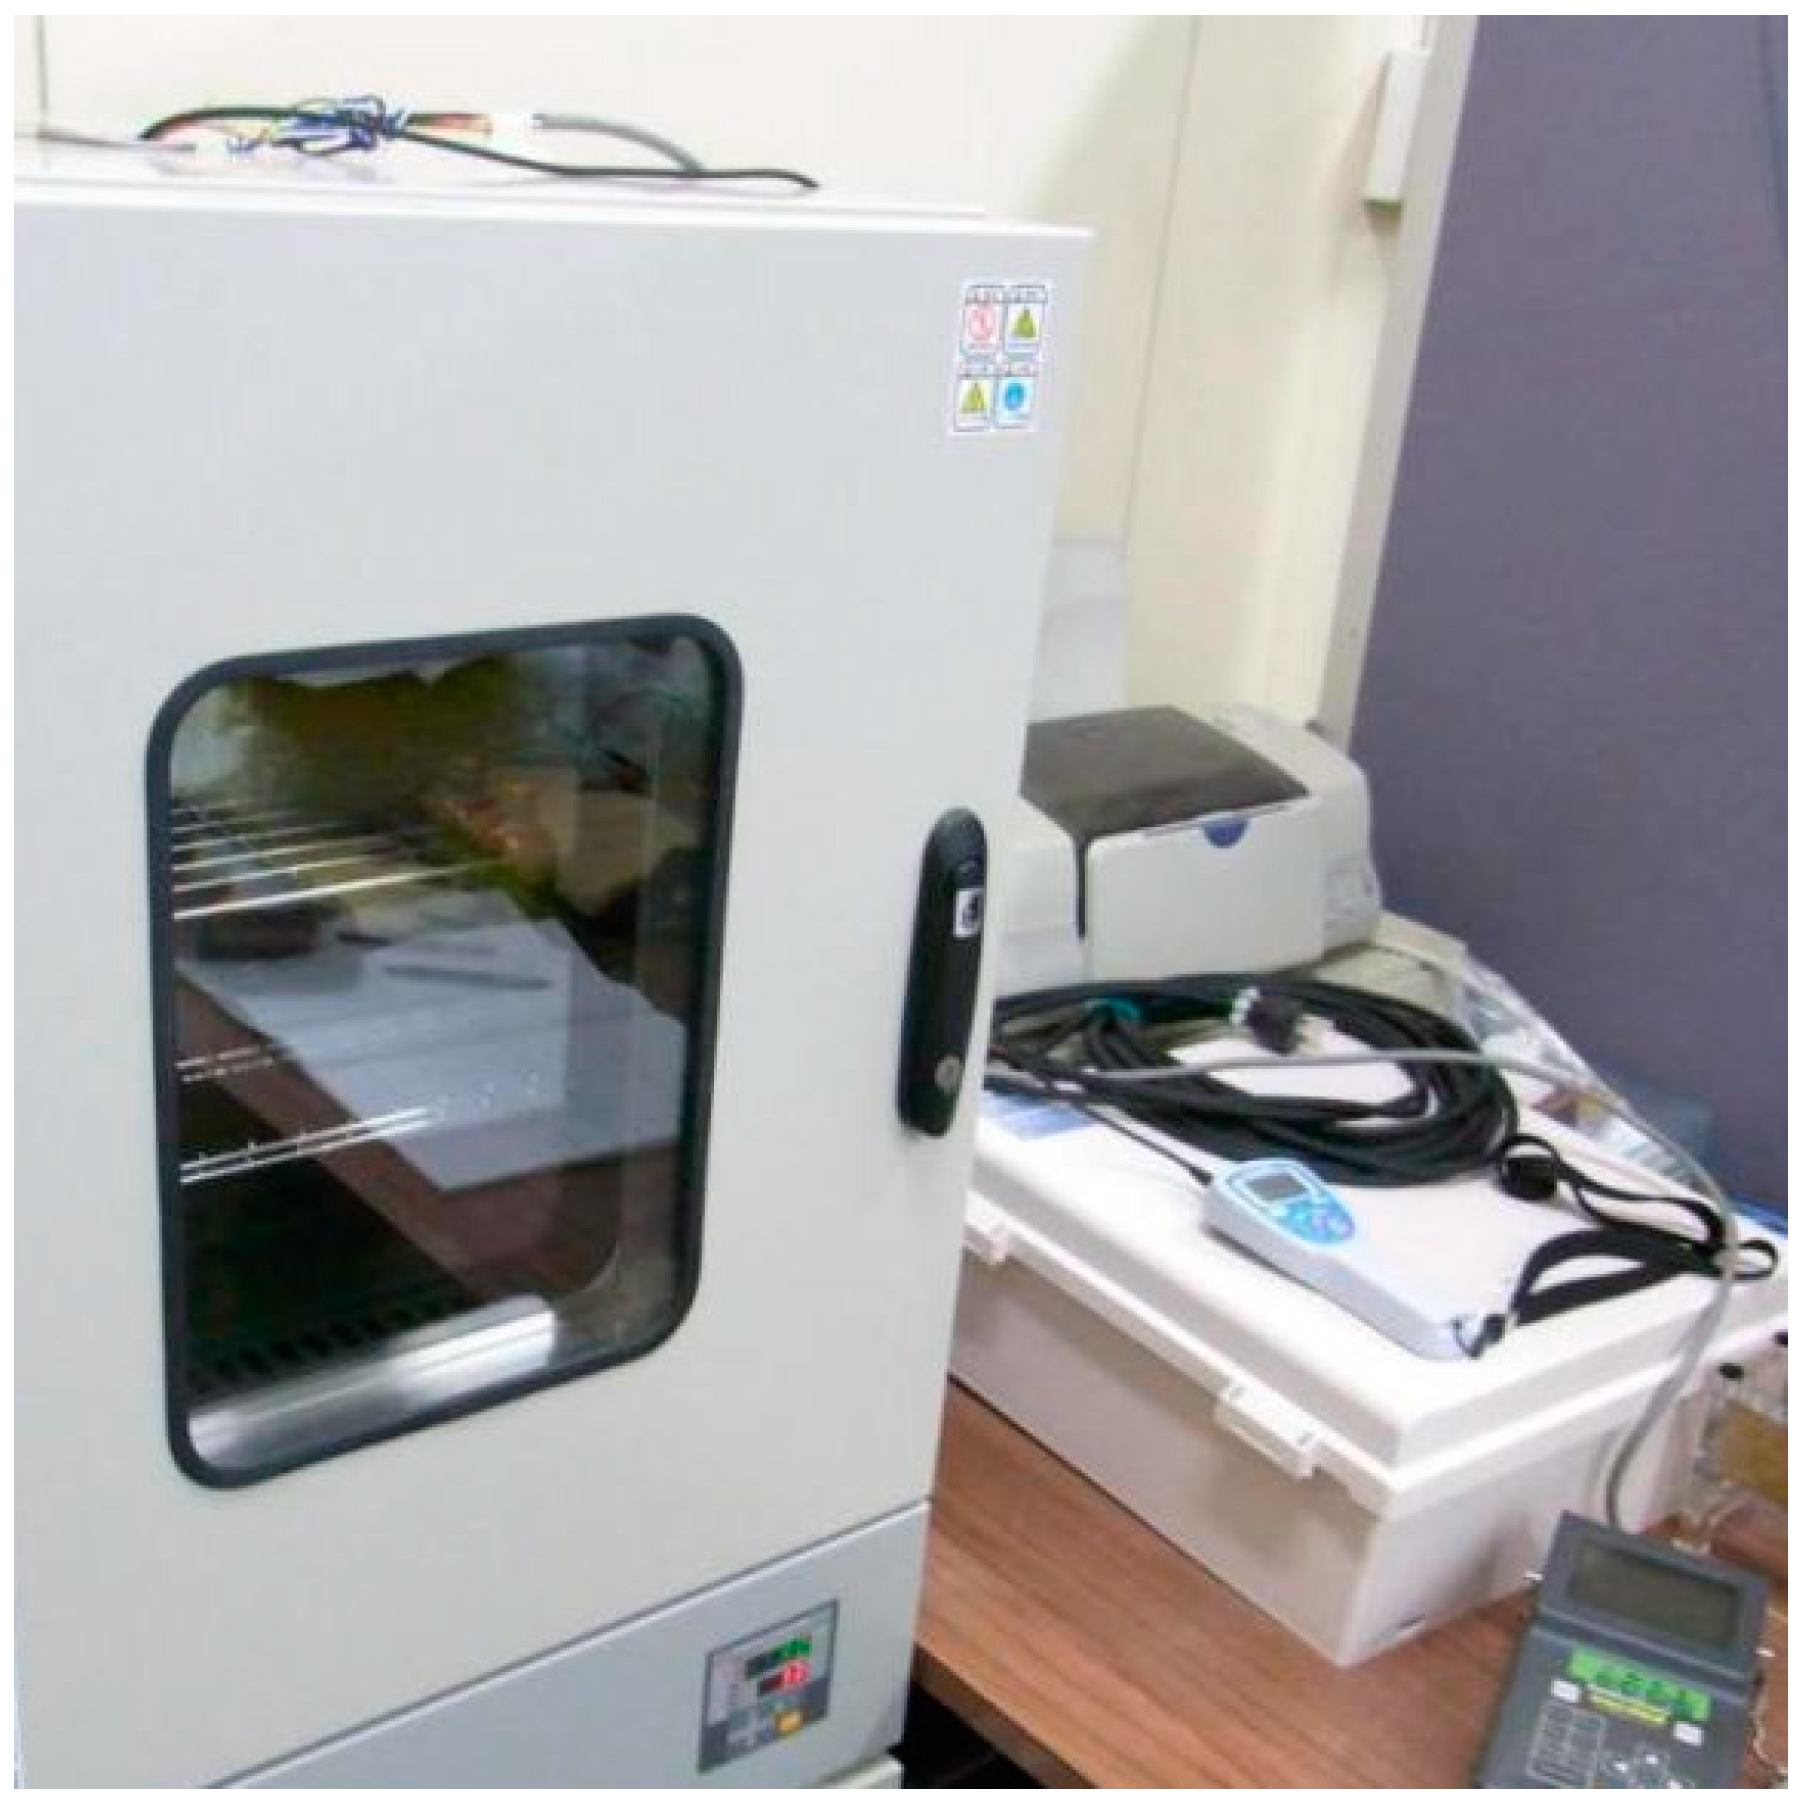
(4) Heating in a temperature-regulating furnace (
Figure 2);
(5) Recording the resistivity values of rocks at different temperatures using a resistivity meter.
The electronic thermometer can reach a resolution of ±0.01 °C and an accuracy of ±0.02 °C. The reaction speed is less than 2.8 s and the measurement range is −50 °C~+150 °C.
The measurement range of the resistivity meter is 0.01~20.00 MΩ, while the accuracy is ±1% F.S.
The basic physical parameters of the five sets of sandstone samples used for indoor testing are shown in
Table 1. In order to obtain reliable experimental data, we randomly selected some different cores.
Five sets of sandstone cores were subjected to heating experiments from 23 °C to 96 °C and relevant data from the heating experiments were obtained. The experimental results were processed to obtain the relationship curve between sandstone resistivity and temperature changes (as shown in
Figure 3). The experimental results indicate that as the temperature increases, the resistivity of sandstone gradually decreases for all the sandstone cores, with a faster decrease from 23 °C to 70 °C and a slightly slower decrease from 70 °C to 96 °C.
By calculating the rate of change in the resistivity of each sandstone core during temperature increase, we can obtain the relationship curve between the rate of change in sandstone resistivity and temperature variation (
Figure 4).
The curve in
Figure 4 shows that although the absolute values of resistivity decrease with increasing temperature for each group of sandstone samples are different, the rate of change in resistivity for each is approximately the same when the temperature increases. After calculation, the regression relationship between the resistivity change rate (ΔR) and temperature change (ΔT) of the five groups of sandstone samples is obtained as follows:
The basic physical parameters of the five sets of mudstone samples tested indoors are shown in
Table 2.
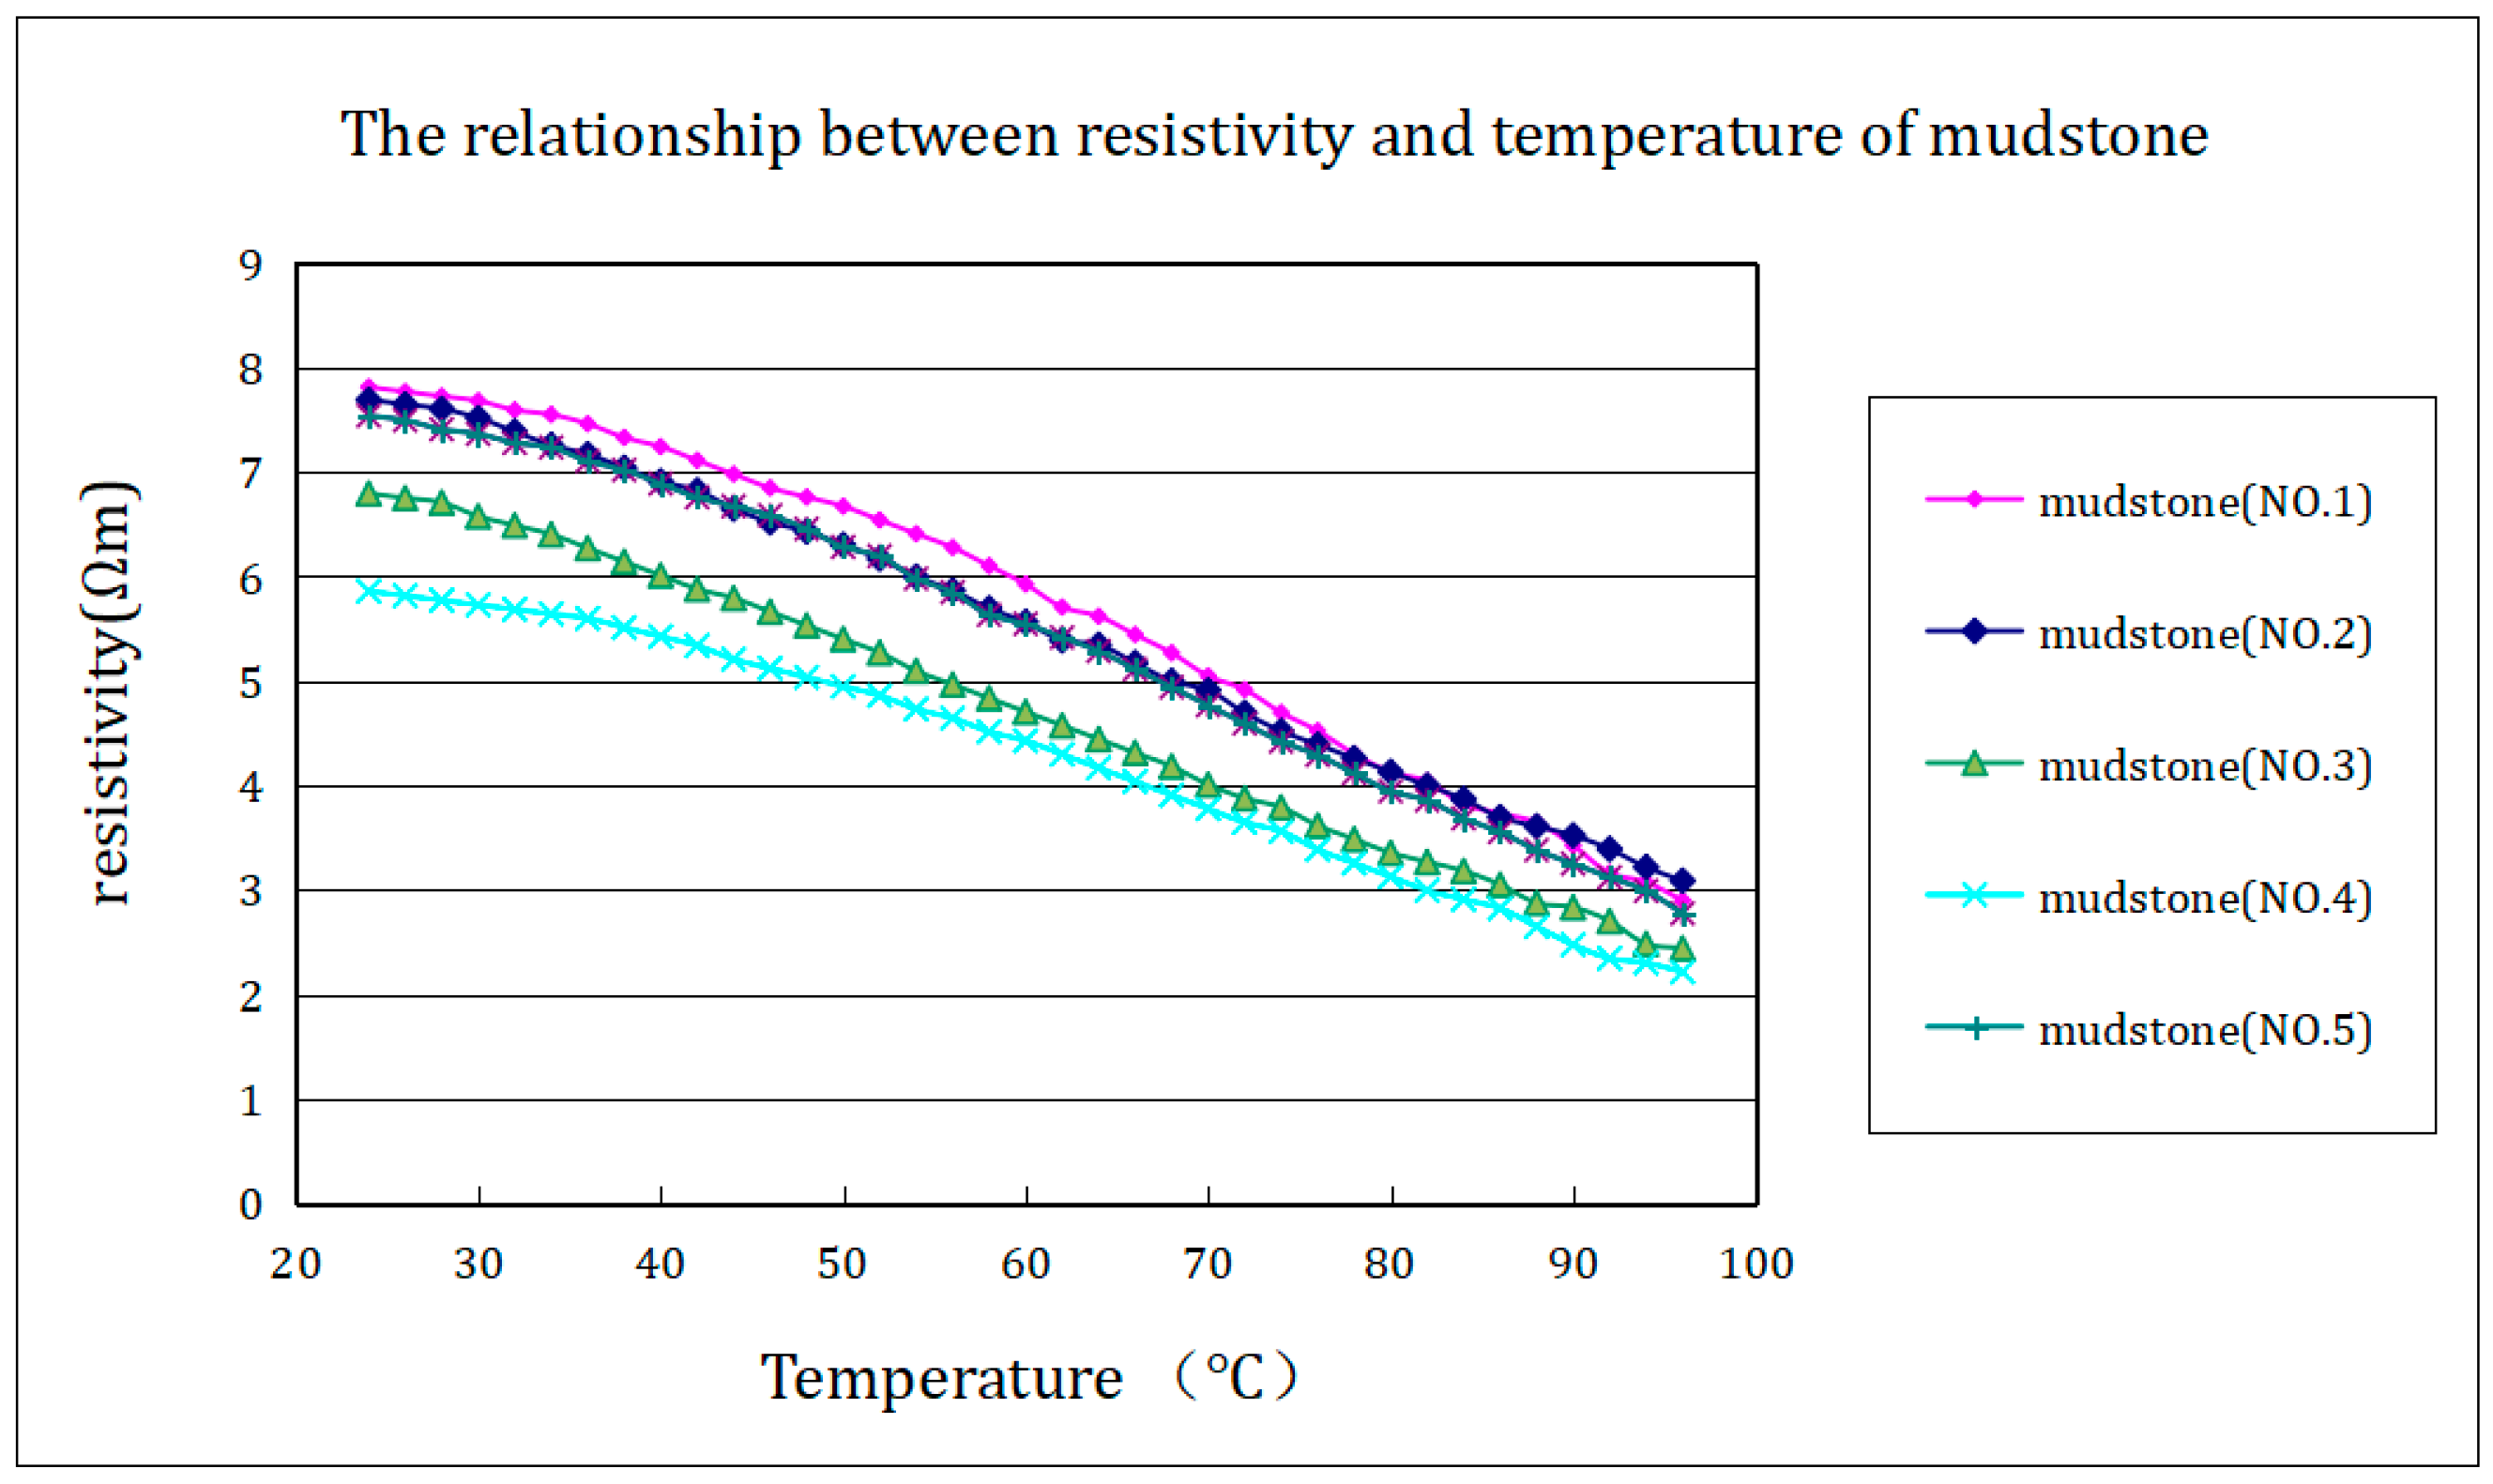
Five groups of mudstones were subjected to heating experiments ranging from 23 °C to 96 °C, and relevant experimental data were obtained. The experimental results were processed to obtain the relationship curve between mudstone resistivity and temperature changes (as shown in
Figure 5). The experimental results indicate that as the temperature increases, the resistivity of all mudstone cores gradually decreases, and there is also a nearly linear relationship between 23 °C and 96 °C.
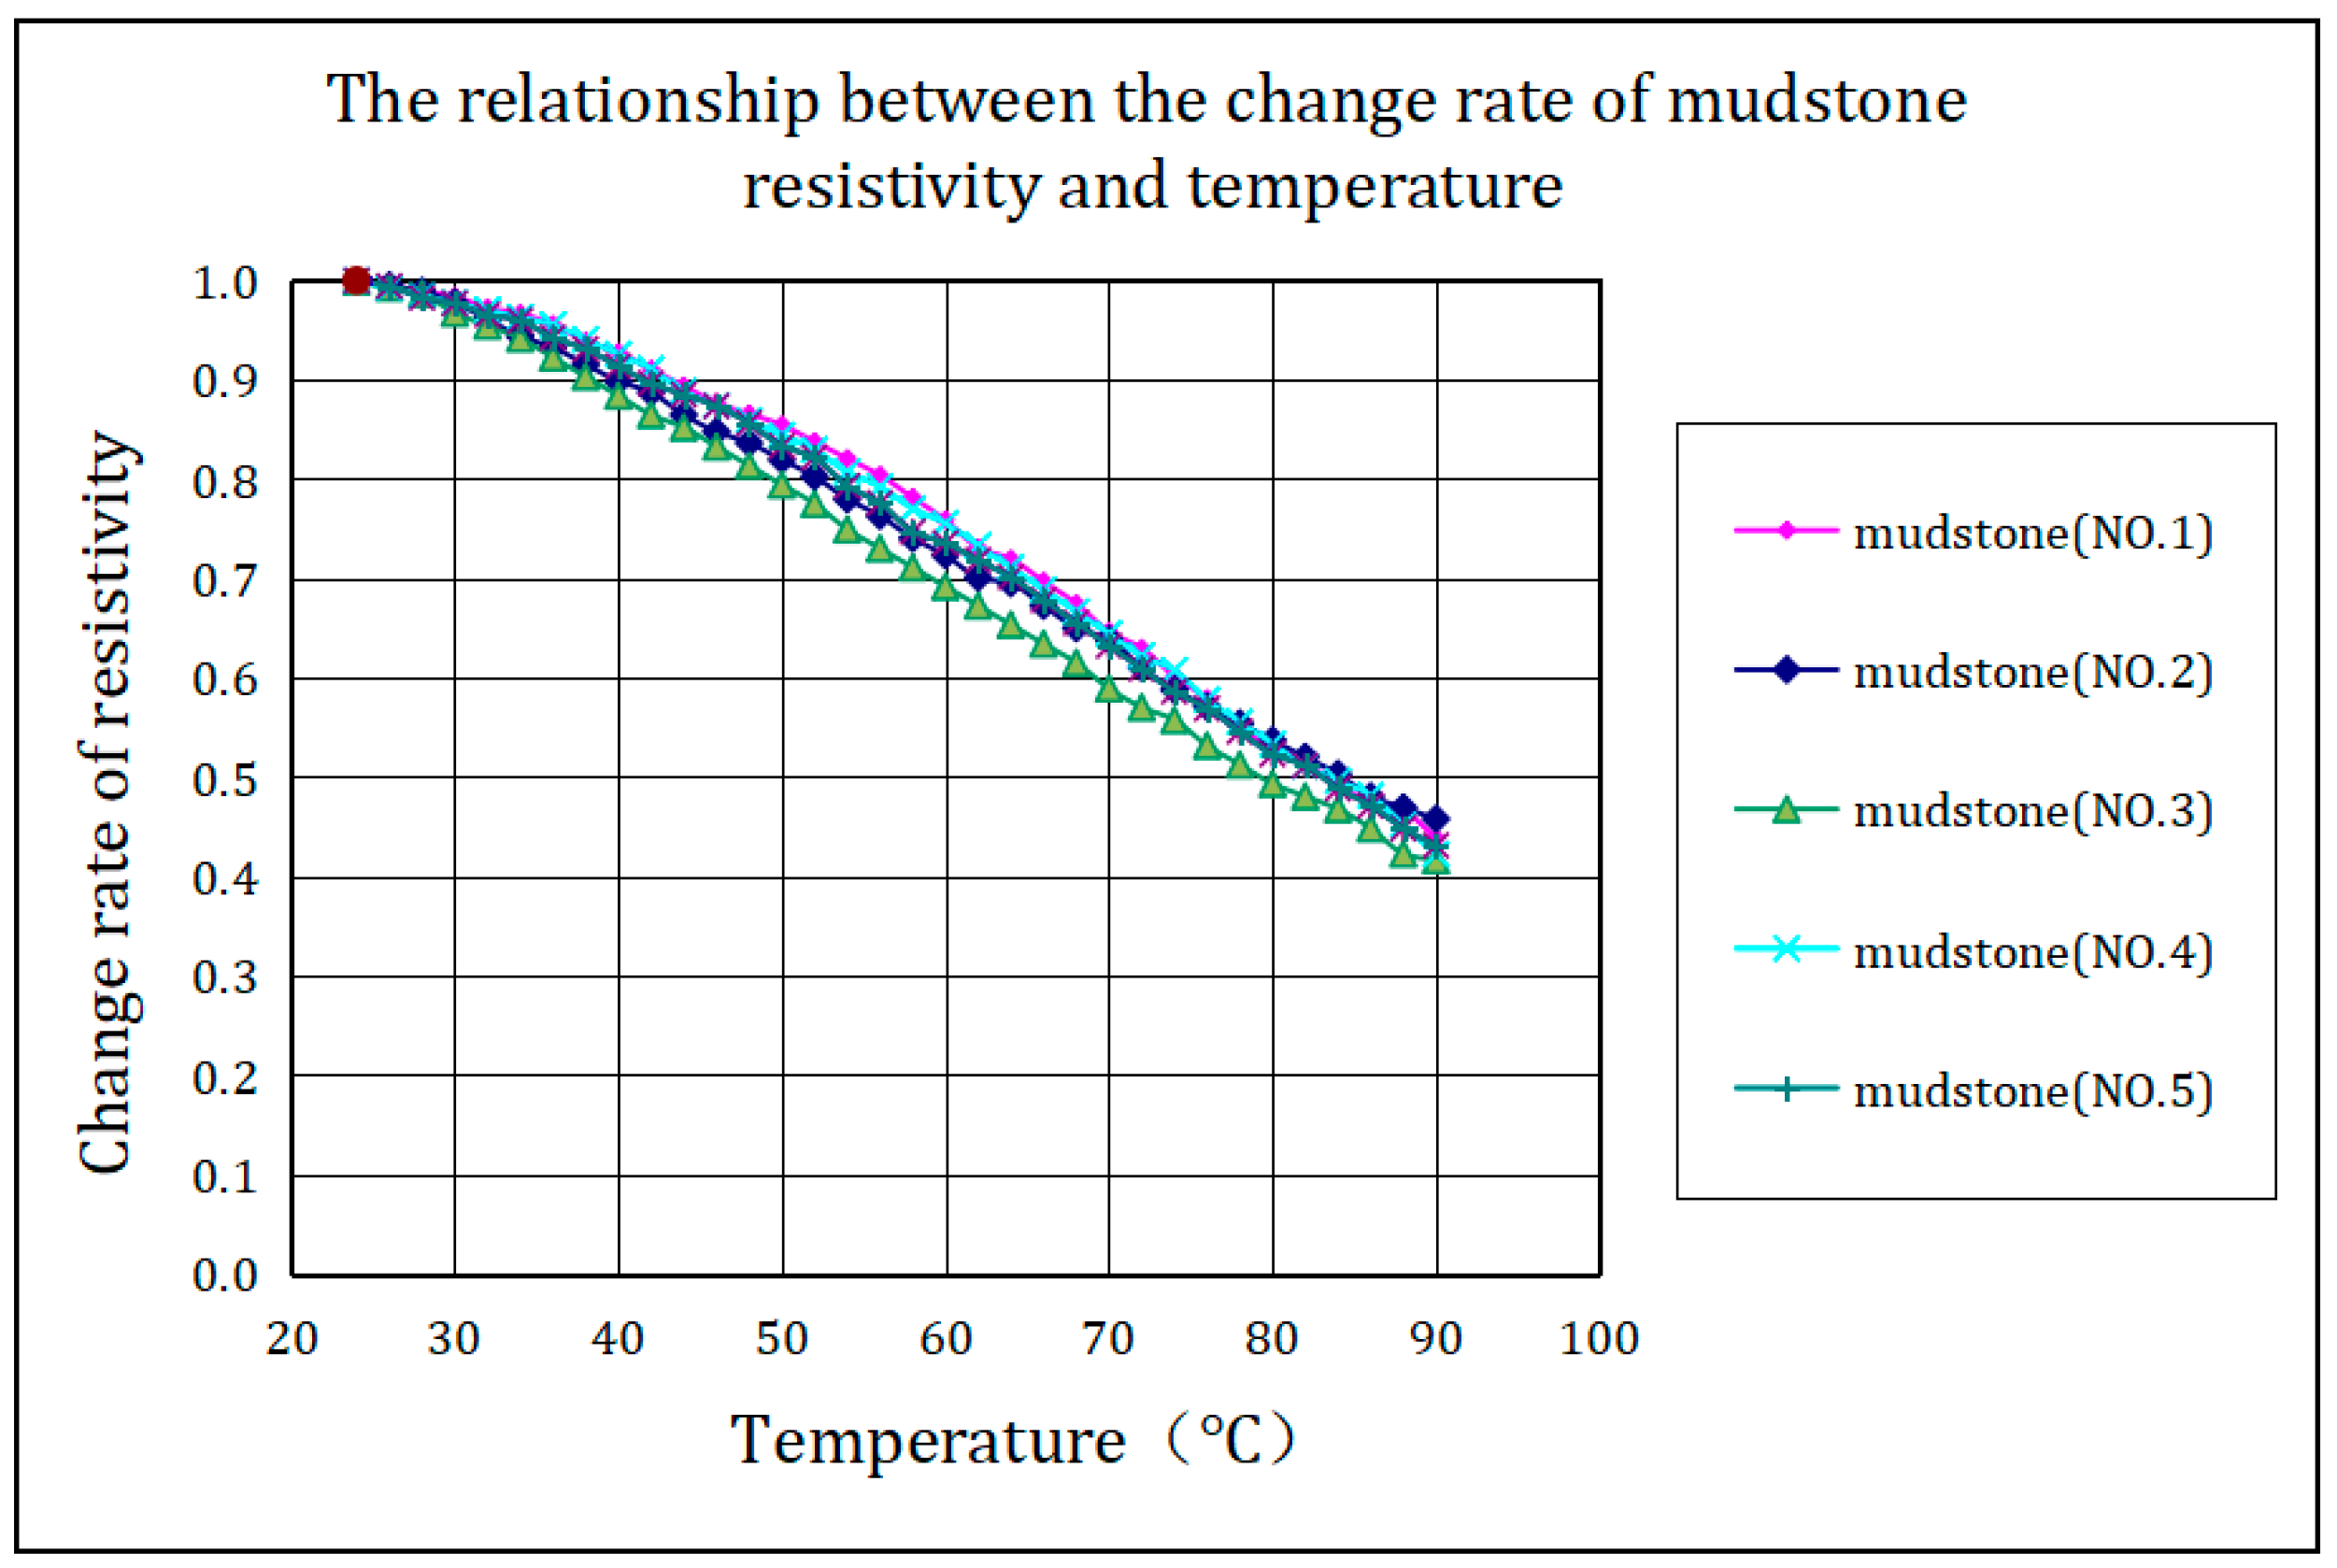
As shown in
Figure 6, the relationship curve between the change rate of mudstone resistivity and temperature change shows that the resistivity change rate of each group of mudstone samples is approximately the same as the temperature increases. After calculation, the regression relationship between the resistivity change rate (ΔR) and temperature change (ΔT) of the five groups of mudstone samples is obtained as follows:
The basic physical parameters of the five sets of tuff rock samples are shown in
Table 3.
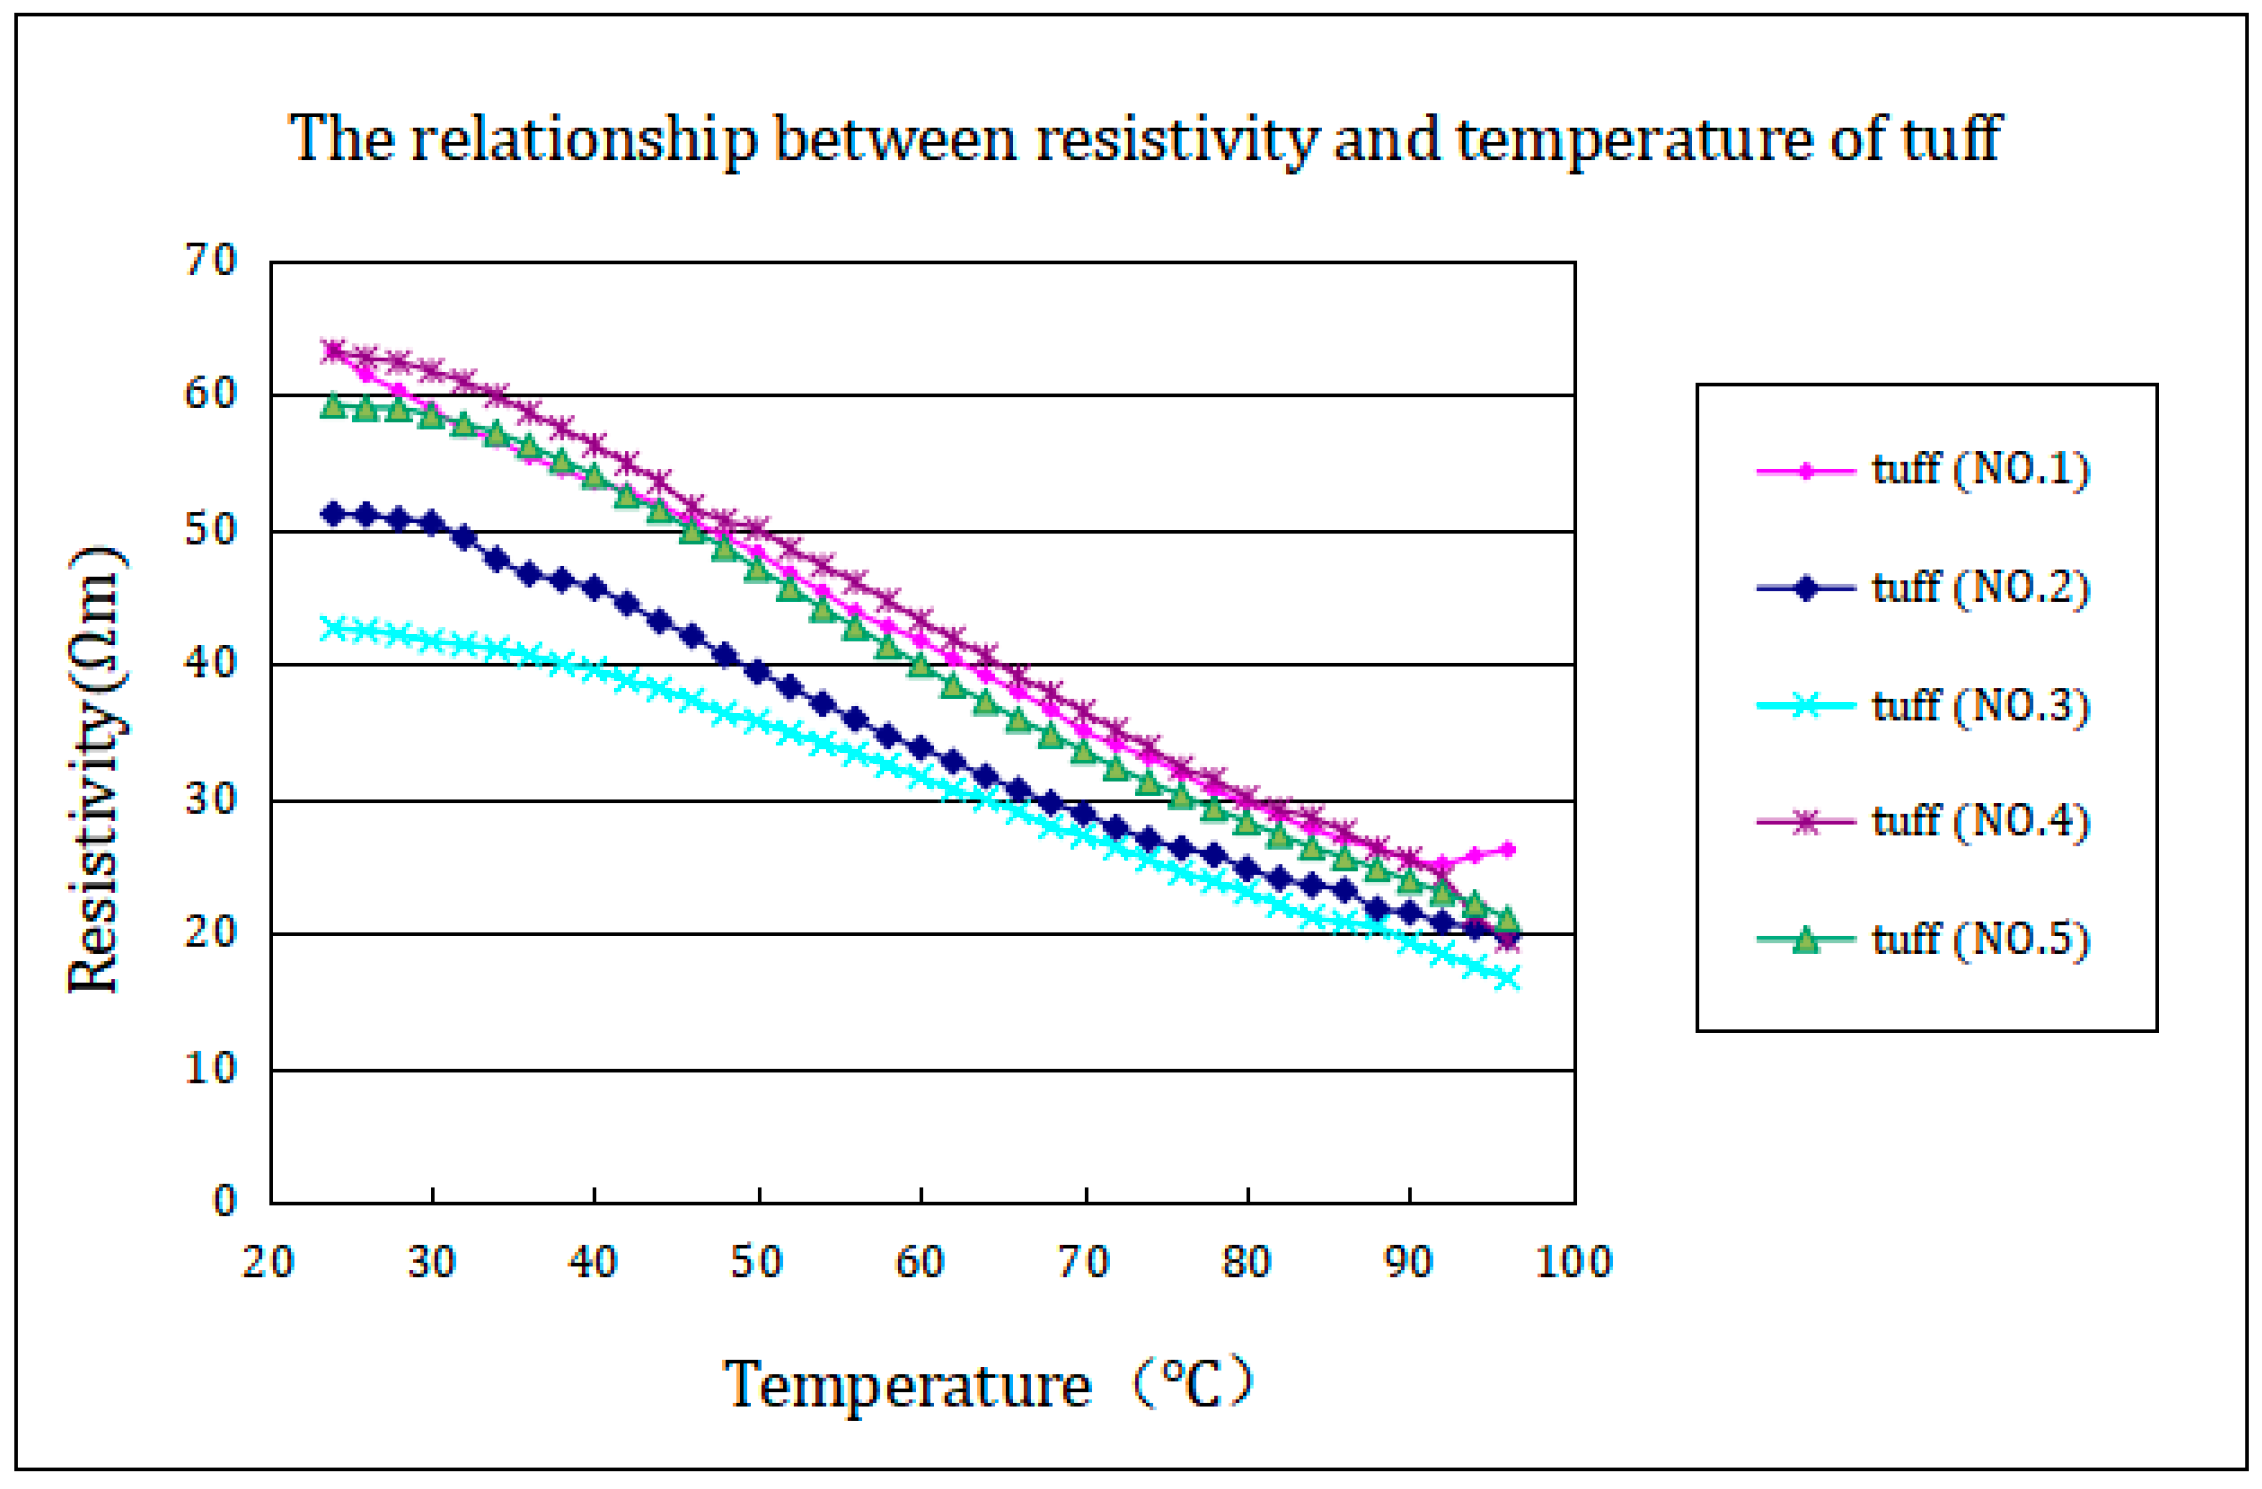
Five sets of tuff rock cores were subjected to heating experiments from 23 °C to 96 °C, and the experimental results were processed to obtain the relationship curve between tuff resistivity and temperature changes (as shown in
Figure 7).
The experimental results indicate that the resistivity of all the tuff rock cores gradually linearly decreases with increasing temperature.
By calculating the rate of change in the resistivity of each group of tuff rock cores during the temperature increase process, we can obtain the relationship curve between the rate of change in tuff resistivity and temperature variation (
Figure 8). The relationship curve between the change rate of resistivity and temperature change in
Figure 8 shows that the resistivity change rate of each group of tuff rock samples is approximately the same as the temperature increases. After calculation, the regression relationship between the resistivity change rate (ΔR) and temperature change (ΔT) of the five groups of tuff rock is obtained as follows:
The basic physical parameters of the four coal rock samples are shown in
Table 4.
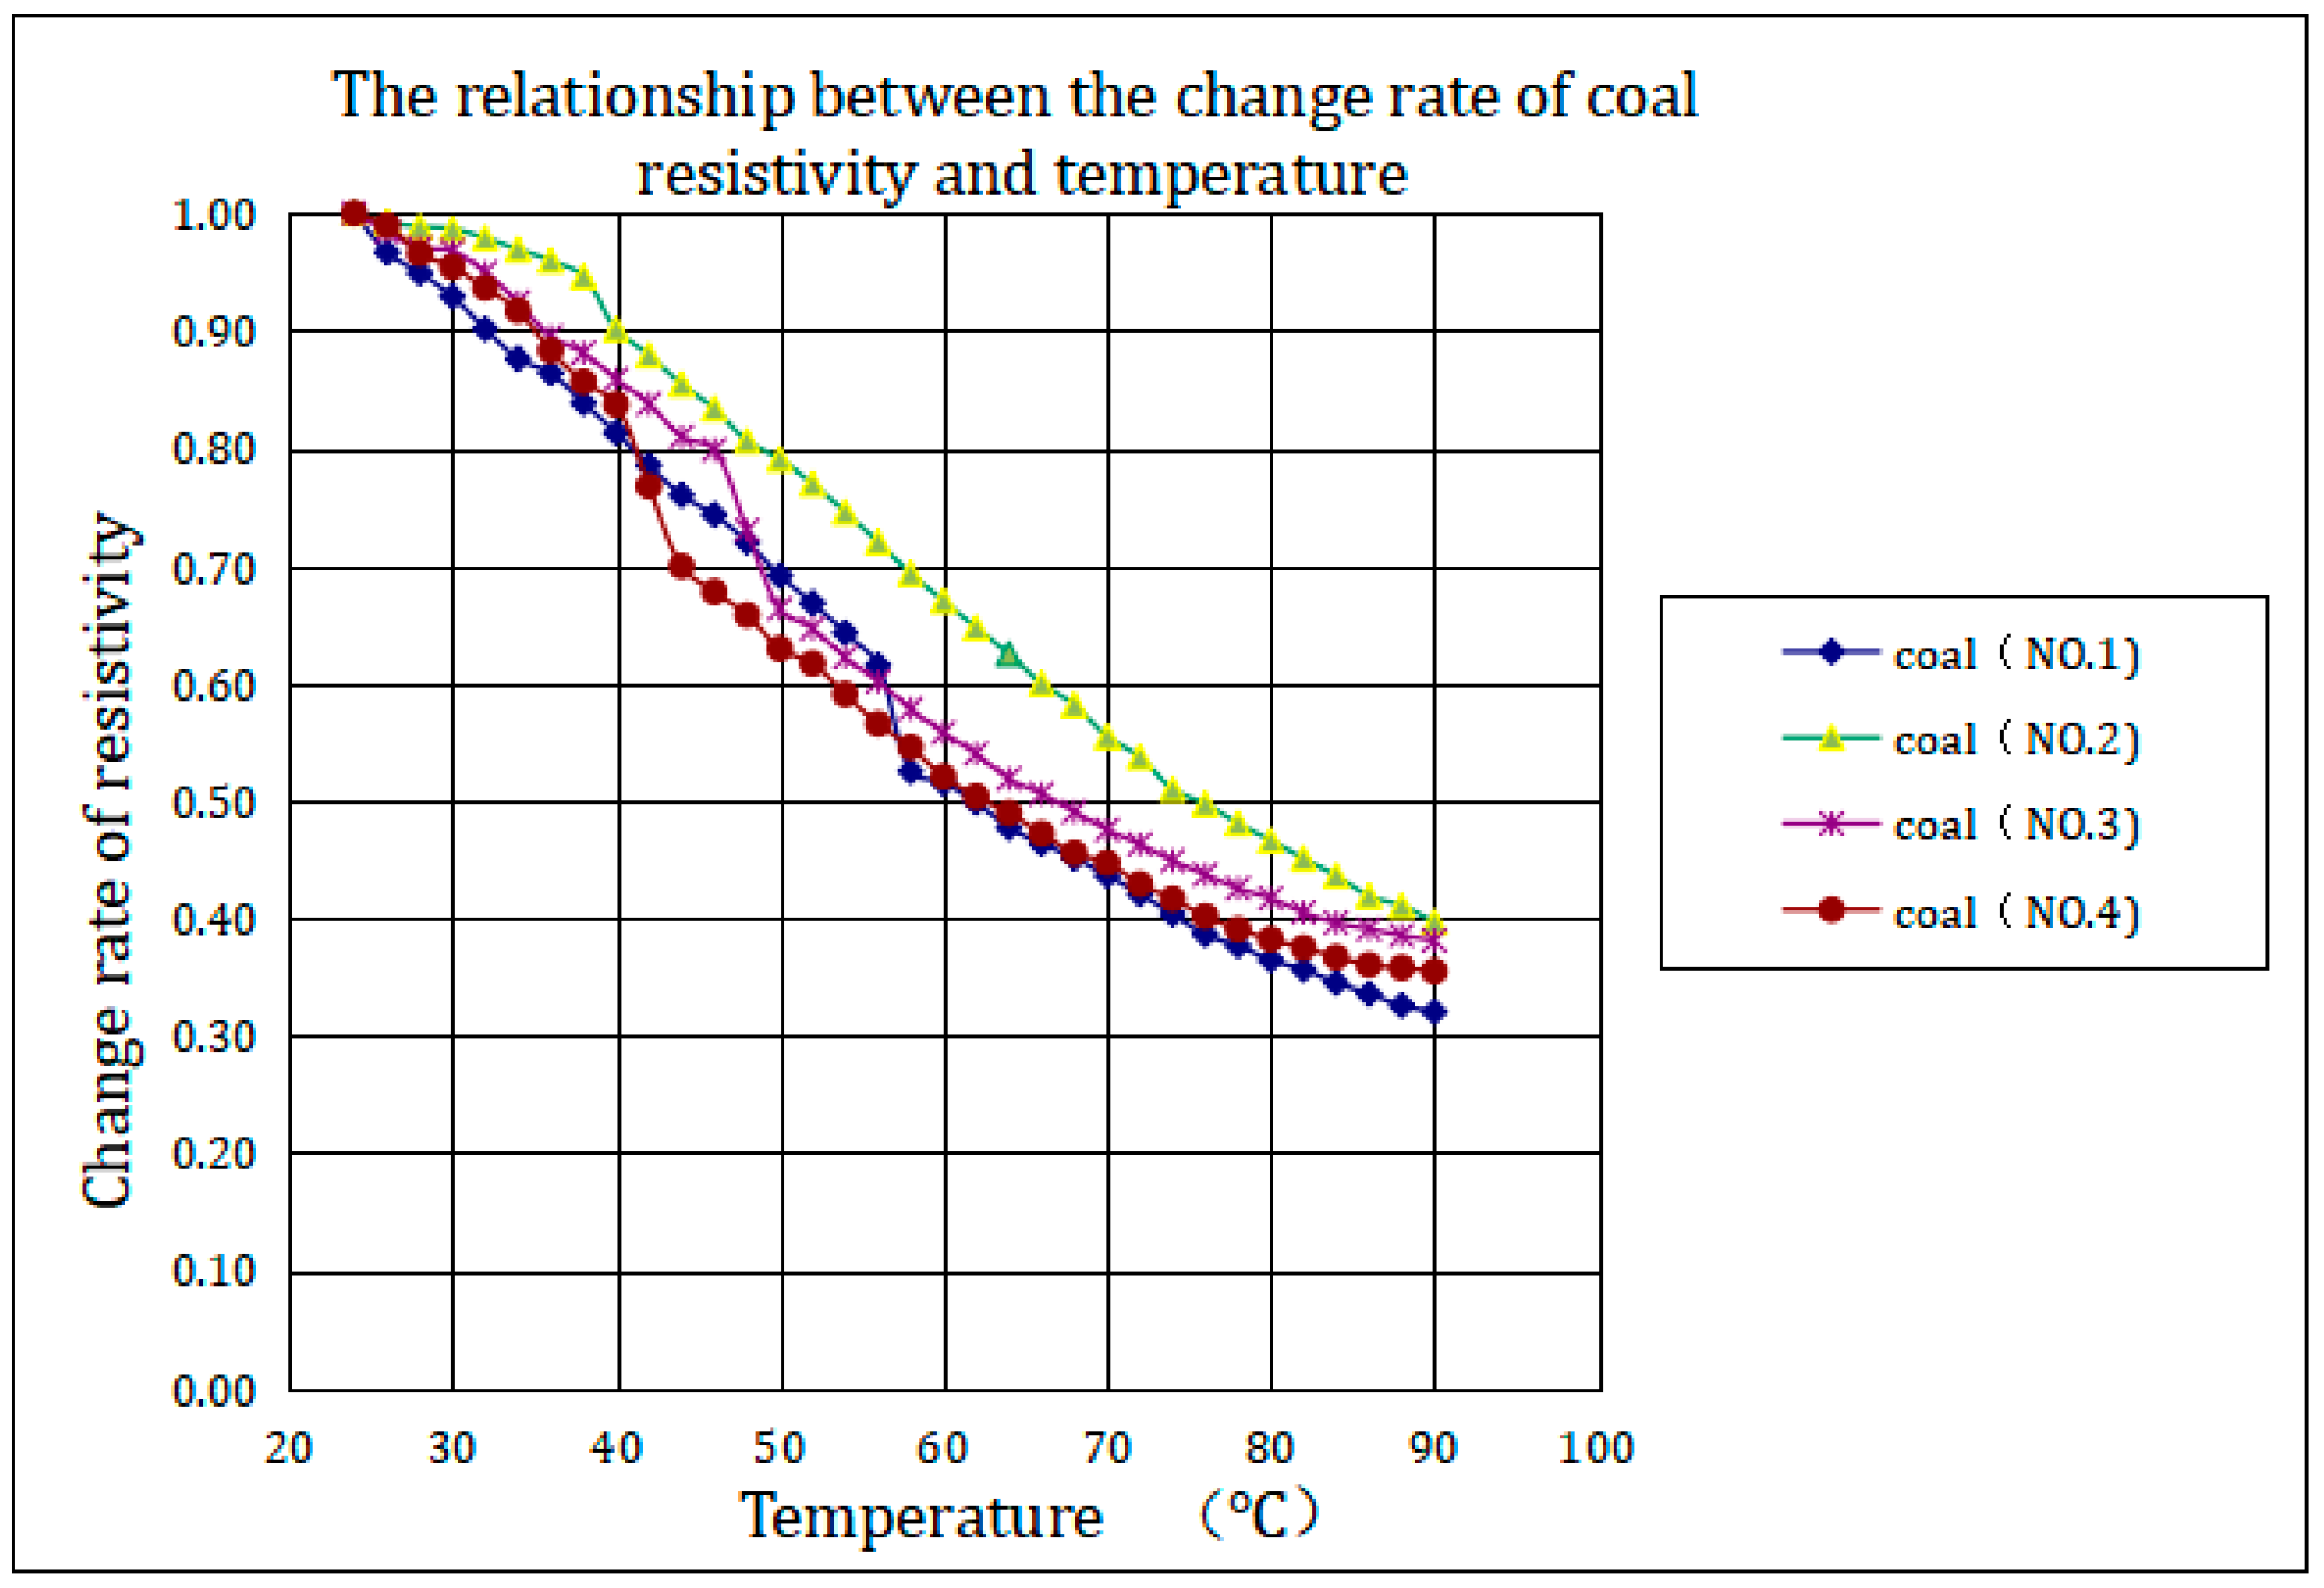
Four sets of coal core samples were subjected to heating experiments from 23 °C to 96 °C, and the experimental results were processed to obtain the relationship curve between coal resistivity and temperature changes (as shown in
Figure 9). From the experimental results, it can be concluded that the resistivity of all the coal core samples gradually decreases with increasing temperature.
By calculating the rate of change in the electrical resistivity of each group of coal cores during the temperature increase process, we can obtain the relationship curve between the rate of change in the coal electrical resistivity and the temperature variation (as shown in
Figure 10).
The relationship curve in
Figure 10 shows that the resistivity change rate of each group of coal rock samples is approximately the same as the temperature increases. After calculation, the regression relationship between the resistivity change rate (ΔR) and temperature change (ΔT) of the four groups of coal is obtained as follows:
4. Analysis of the Indoor Experimental Results
The results of the indoor experiments reveal that with increasing temperature, the electrical resistivities of sandstone, mudstone, tuff, and coal all exhibit a linear decreasing trend.
According to the experiments, after a temperature increase of 20 °C, the resistivity of sandstone decreases to approximately 85% of its initial level. After the temperature increases by 40 degrees, it decreases to approximately 65% of the initial resistivity, while after a temperature increase of 70 degrees, it decreases to less than 45% of the initial value.
According to the experiments with mudstone, after a temperature increase of 20 °C, the resistivity decreases to approximately 90% of the initial level. After a temperature increase of 40 degrees, it can decrease to approximately 75% of the initial resistivity, while after a temperature increase of 70 degrees, the average resistivity decreases to less than 45% of the initial value.
According to the tuff experiment, after a temperature increase of 20 °C, the resistivity decreases to approximately 85% of the initial value. After a temperature increase of 40 degrees, it can decrease to approximately 67% of the initial resistivity, while after a temperature increase of 70 degrees, the average resistivity decreases to less than 45% of the initial level.
According to the coal experiment, after a temperature increase of 20 °C, the resistivity decreases to approximately 78% of its initial value. After a temperature increase of 40 degrees, it decreases to approximately 57% of the initial resistivity, while after a temperature increase of 70 degrees, the average resistivity decreases to less than 35% of the initial level.
5. Field Experiments
5.1. Field Experimental Methods
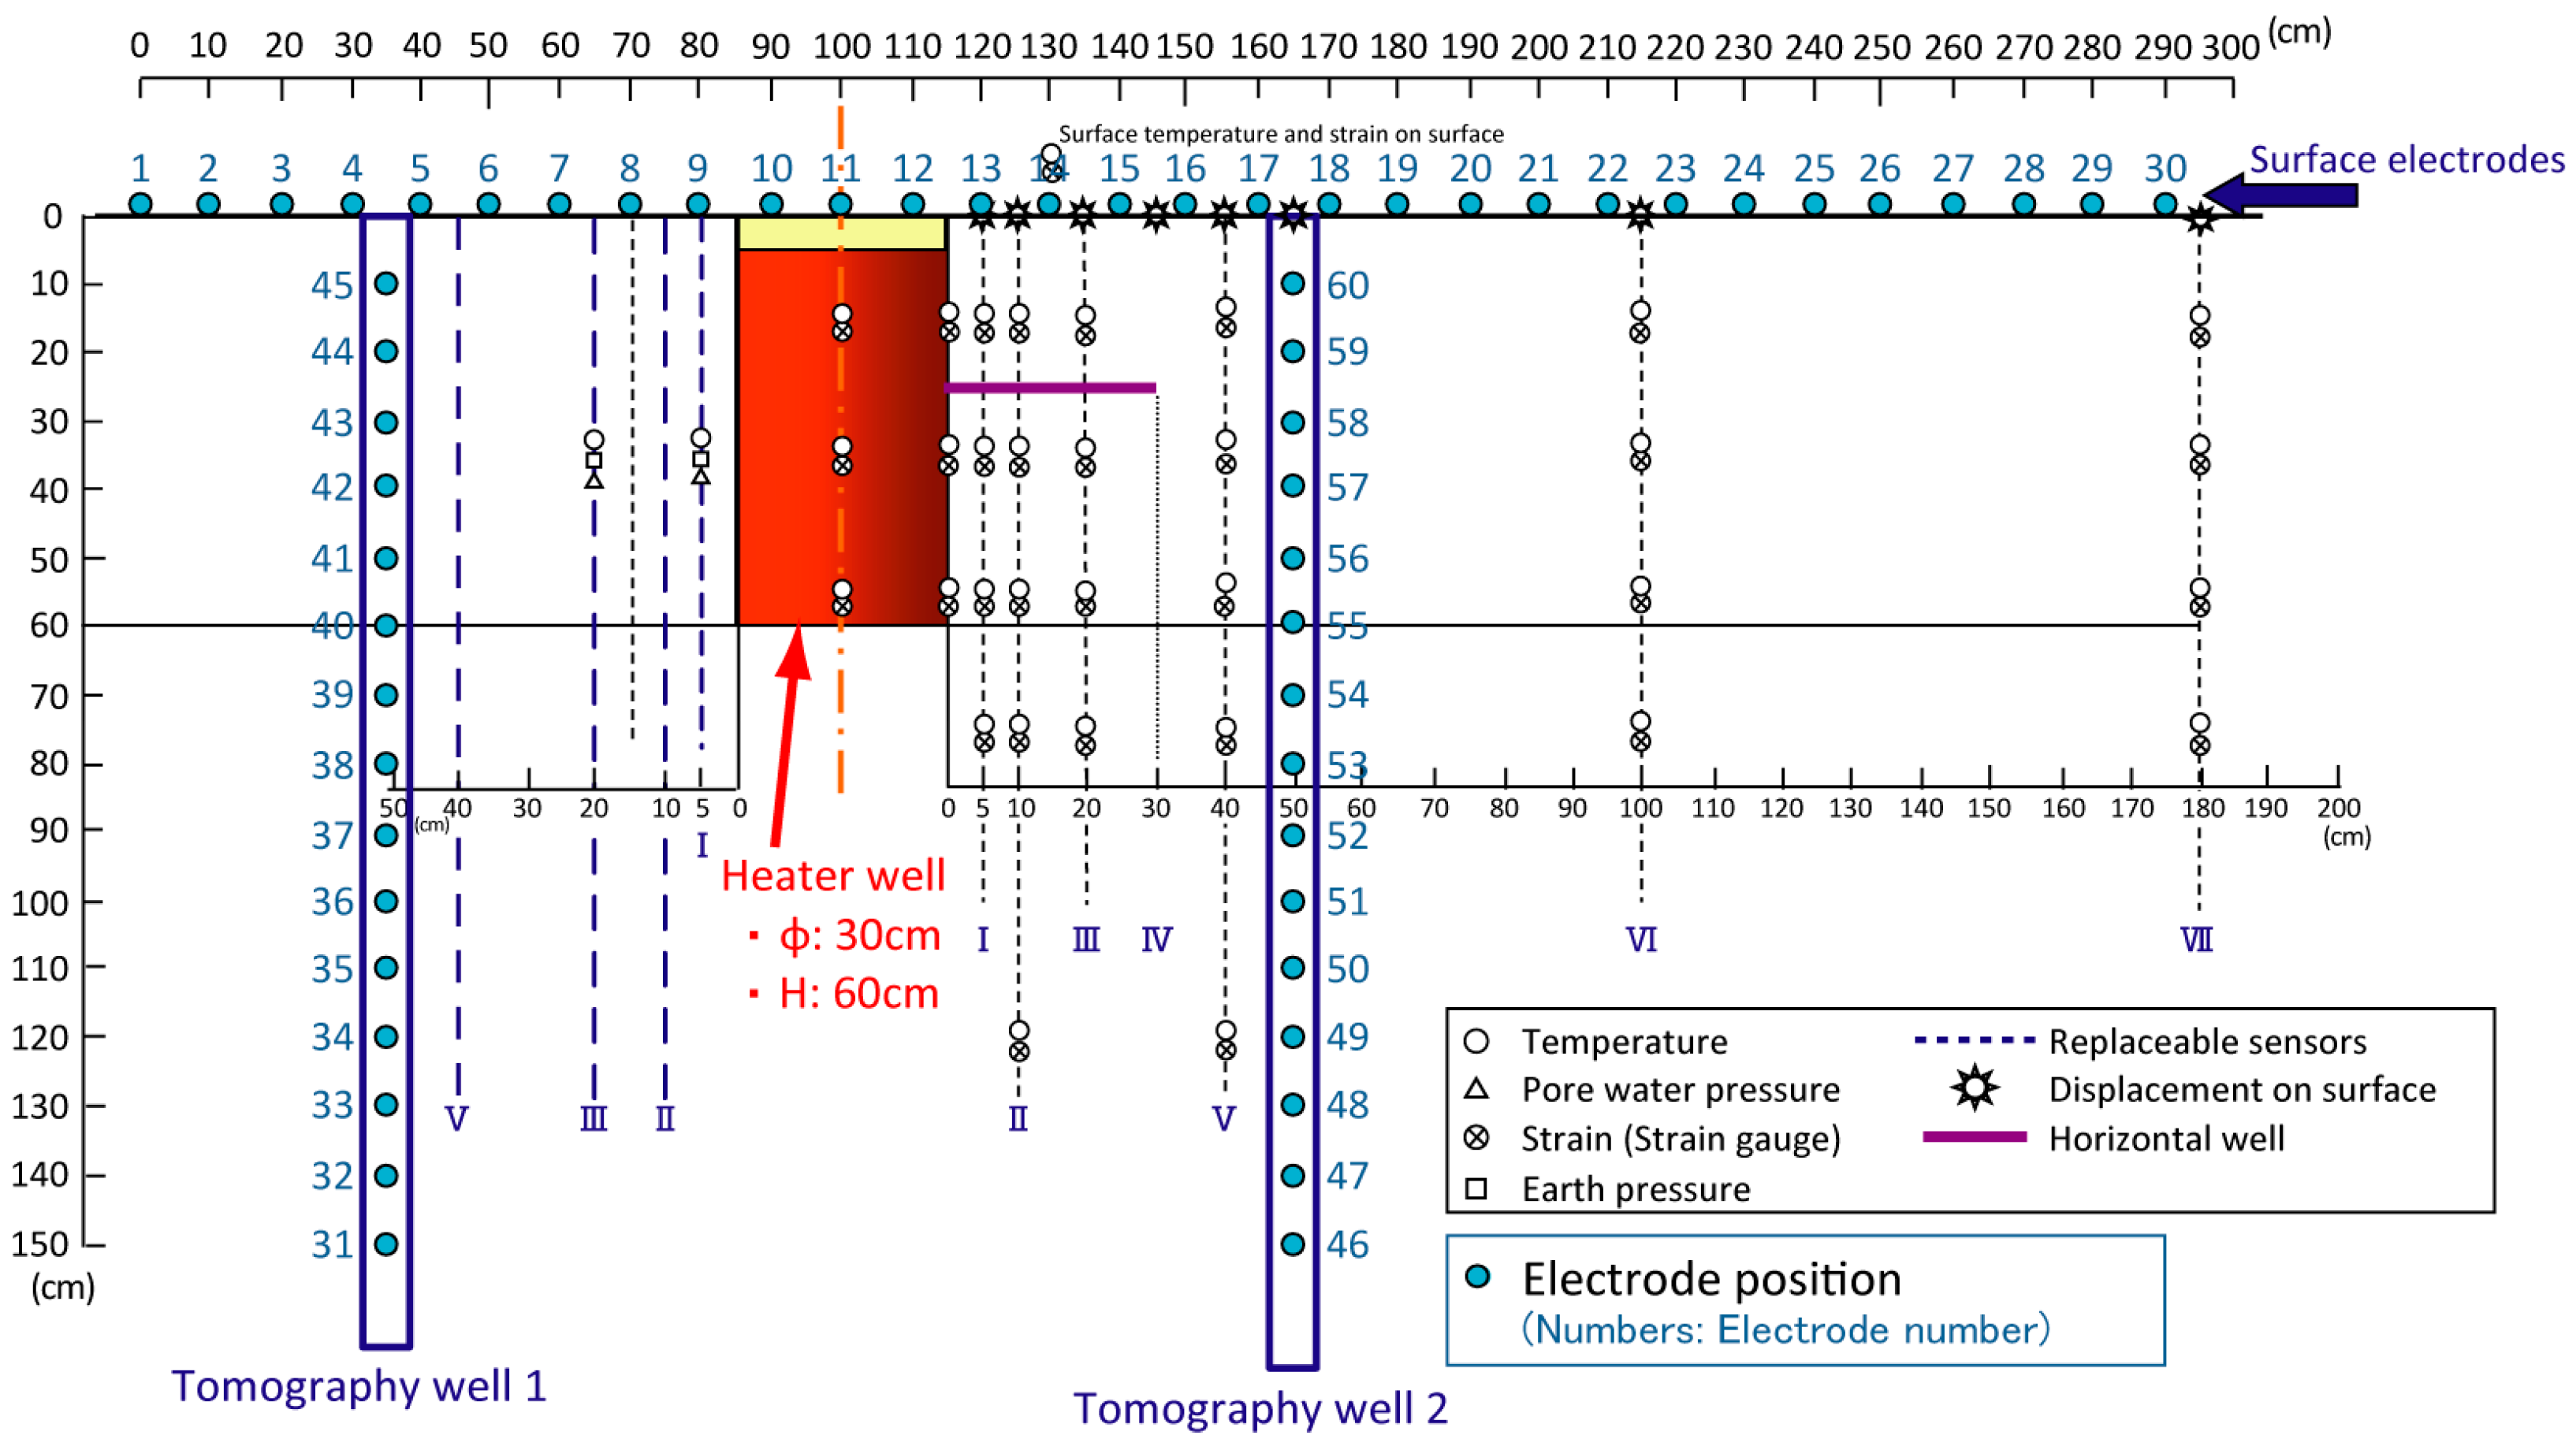
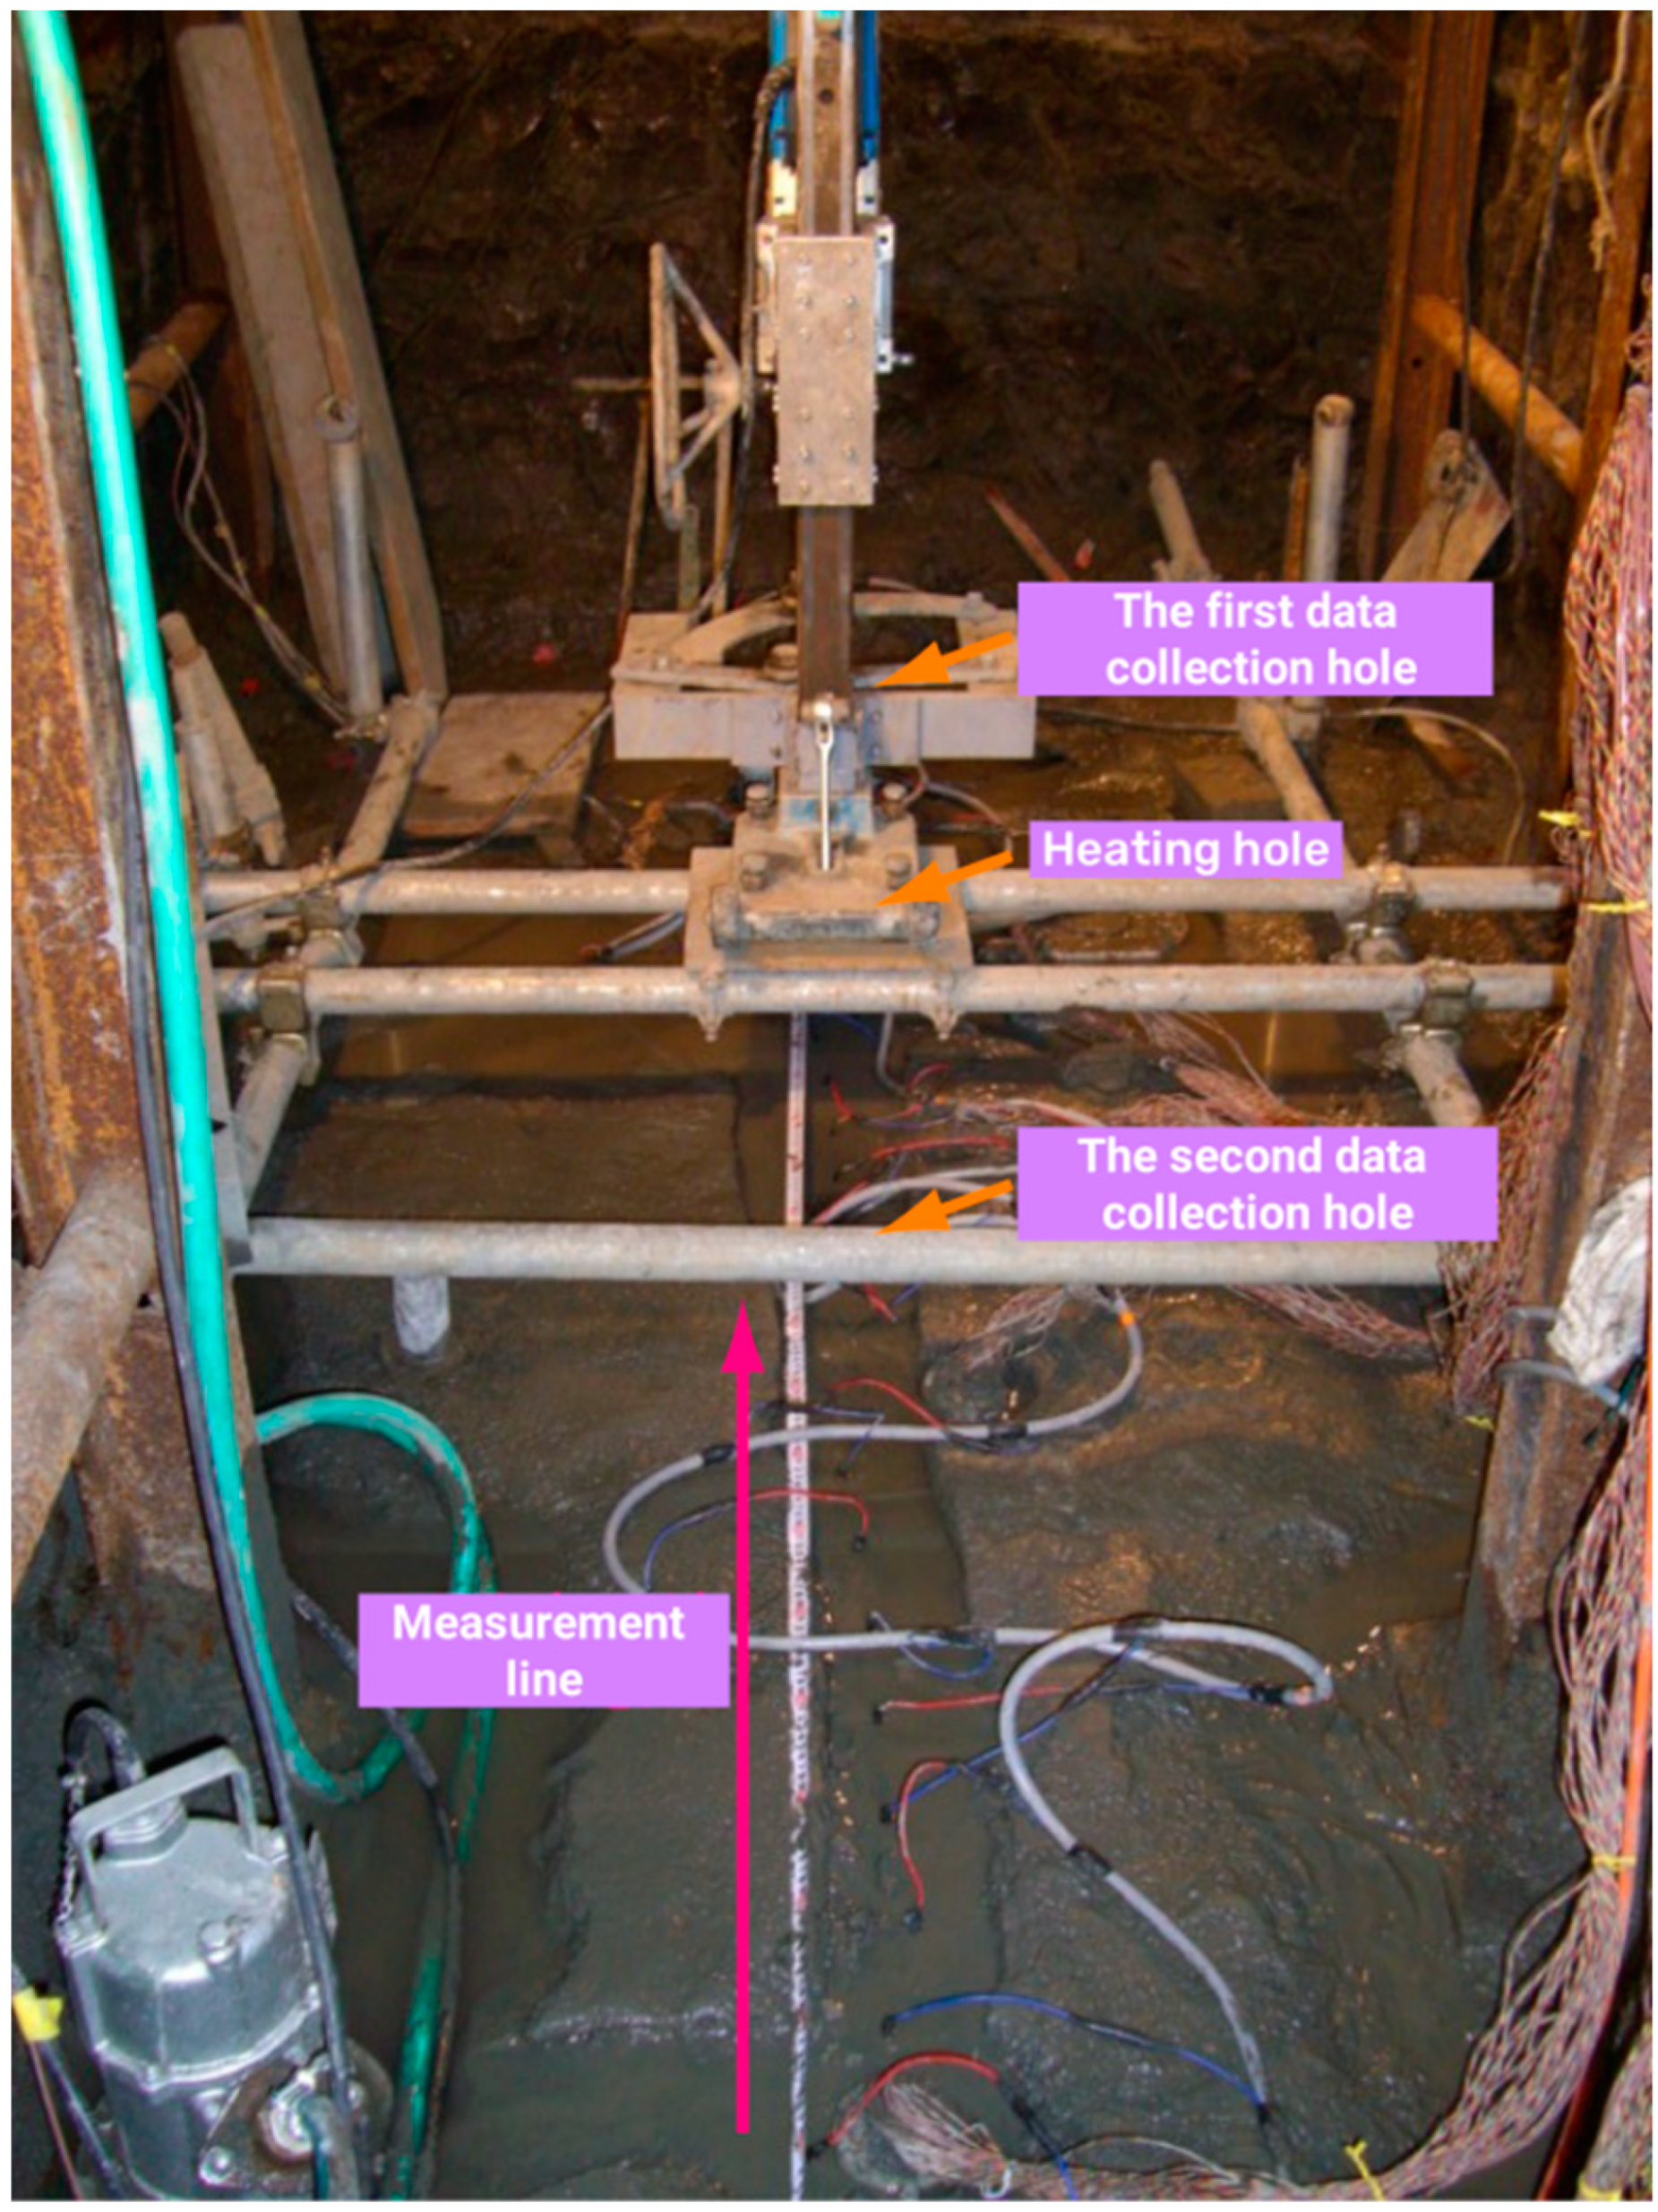
The underground rock layer heating experiment was conducted in the field in a flat tunnel. The rock mass of this formation is mainly mudstone, with a small amount of interbedded thin sandstone. During the experiment, a hole with a diameter of 30 cm and a depth of 60 cm was first drilled on the ground of the test hole. The hole was filled with groundwater, and an electric heater was placed inside to heat the rock mass. At the same time, a mixer was used to mix the groundwater inside the hole so that the water temperature in various parts of the hole could change synchronously. Before heating, the water temperature was 17 °C. After the experiment began, the hole was first heated to 40 °C, and after the data stabilized, this was gradually increased to 90 °C.
5.2. Determination of Onsite Data
One SUS electrode was placed every 10 cm on the ground surface directly above the test hole, for a total of thirty. Two holes with a diameter of 6 cm and a depth of 165 cm were opened at a distance of 50 cm on both sides of the test hole. SUS electrodes were placed every 10 cm in the depth direction, with 15 electrodes arranged in each hole. A total of 60 electrodes were installed on the surface and inside the borehole.
Figure 11 and
Figure 12 show the electrode configuration method used during the experiment. The red and yellow parts in
Figure 11 represent the range of the experimental hole. Data collection was achieved by connecting indoor and onsite computers through wireless signal transmitters, allowing for remote control and uninterrupted data collection.
Measurements were conducted using a high-density resistivity meter, with a voltage range of resistivity meter of ±80 V, a measurement accuracy of ±0.2%, and a maximum sampling voltage resolution of ≤0.01 μV.
5.3. Experimental Results
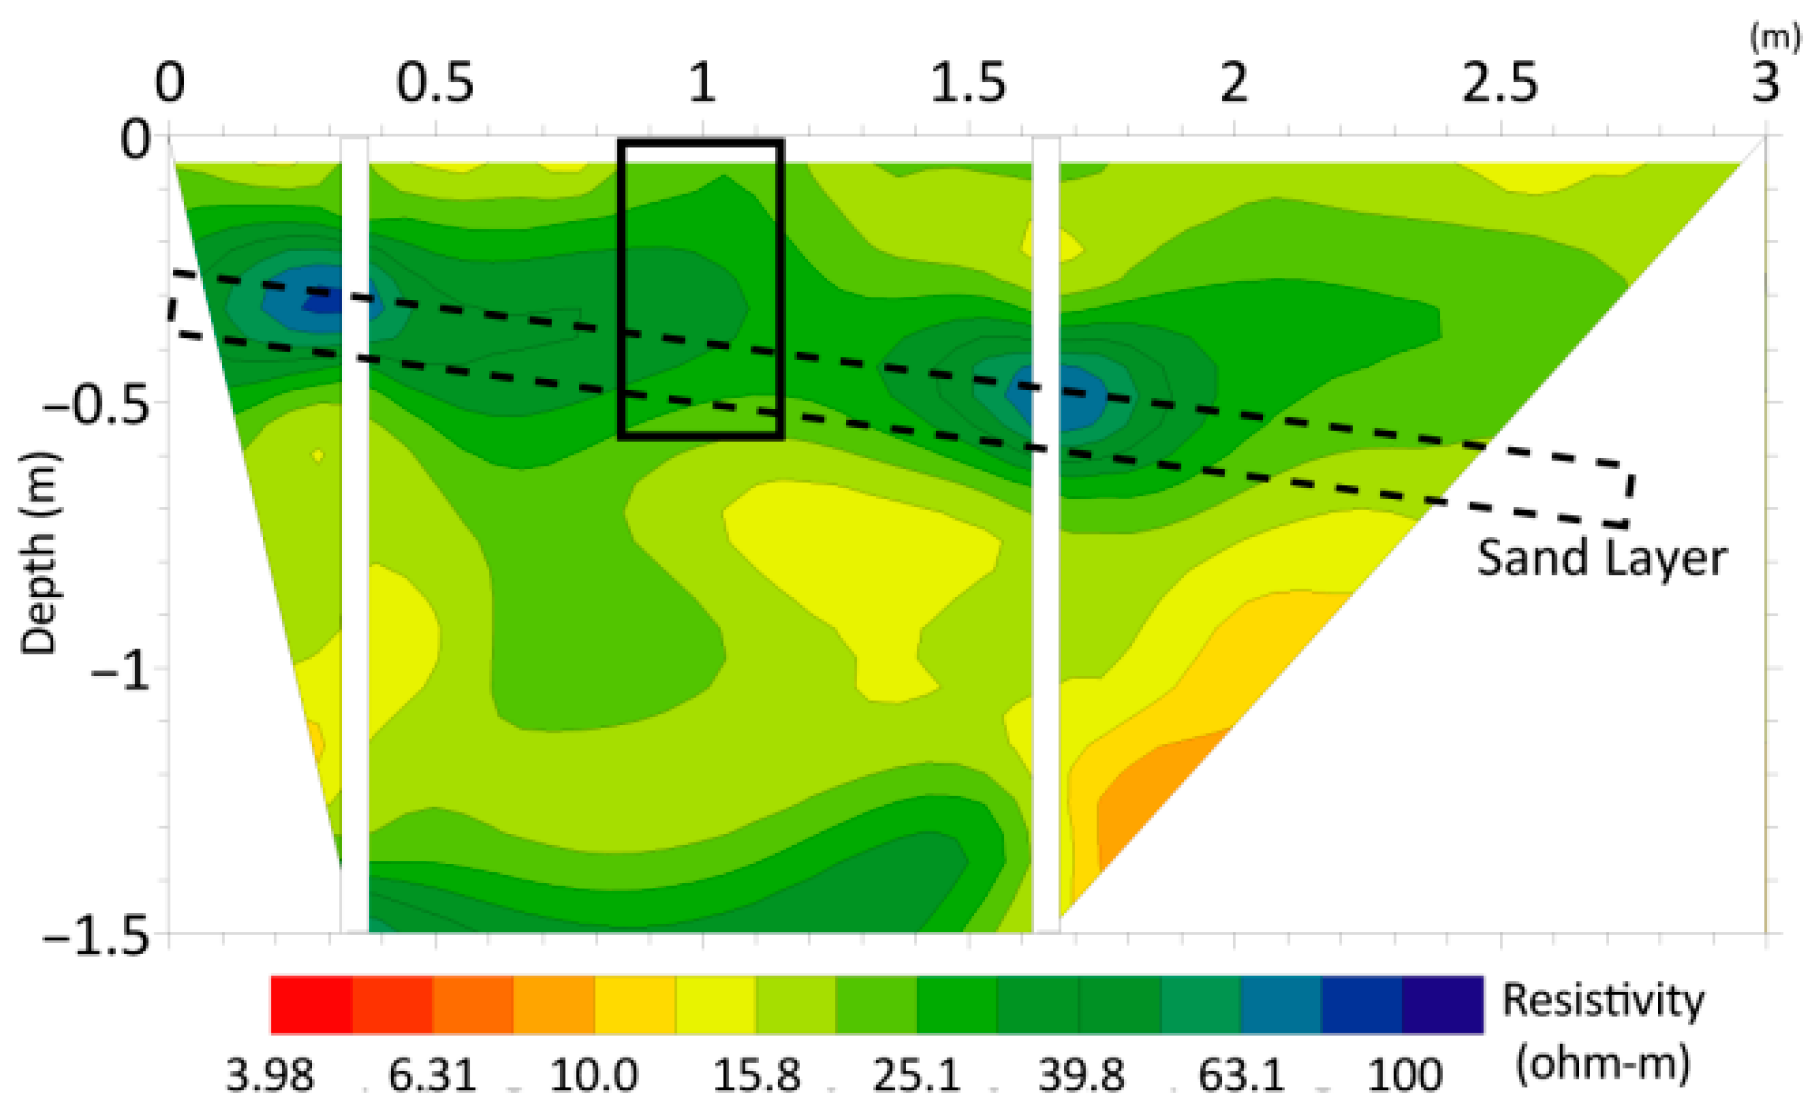
A cross-section of the rock resistivity test before heating is shown in
Figure 13. Within the measurement range, the rock resistivity was approximately 10 Ω to 60 Ω. Within a depth range of approximately 35 cm to 55 cm, the resistivity of local rock layers was higher than that of surrounding rock layers. According to observations, this is due to the presence of thin sandstone interlayers. In the below figure, thin layers of sandstone are shown in the dotted box, and black boxes represent test holes.
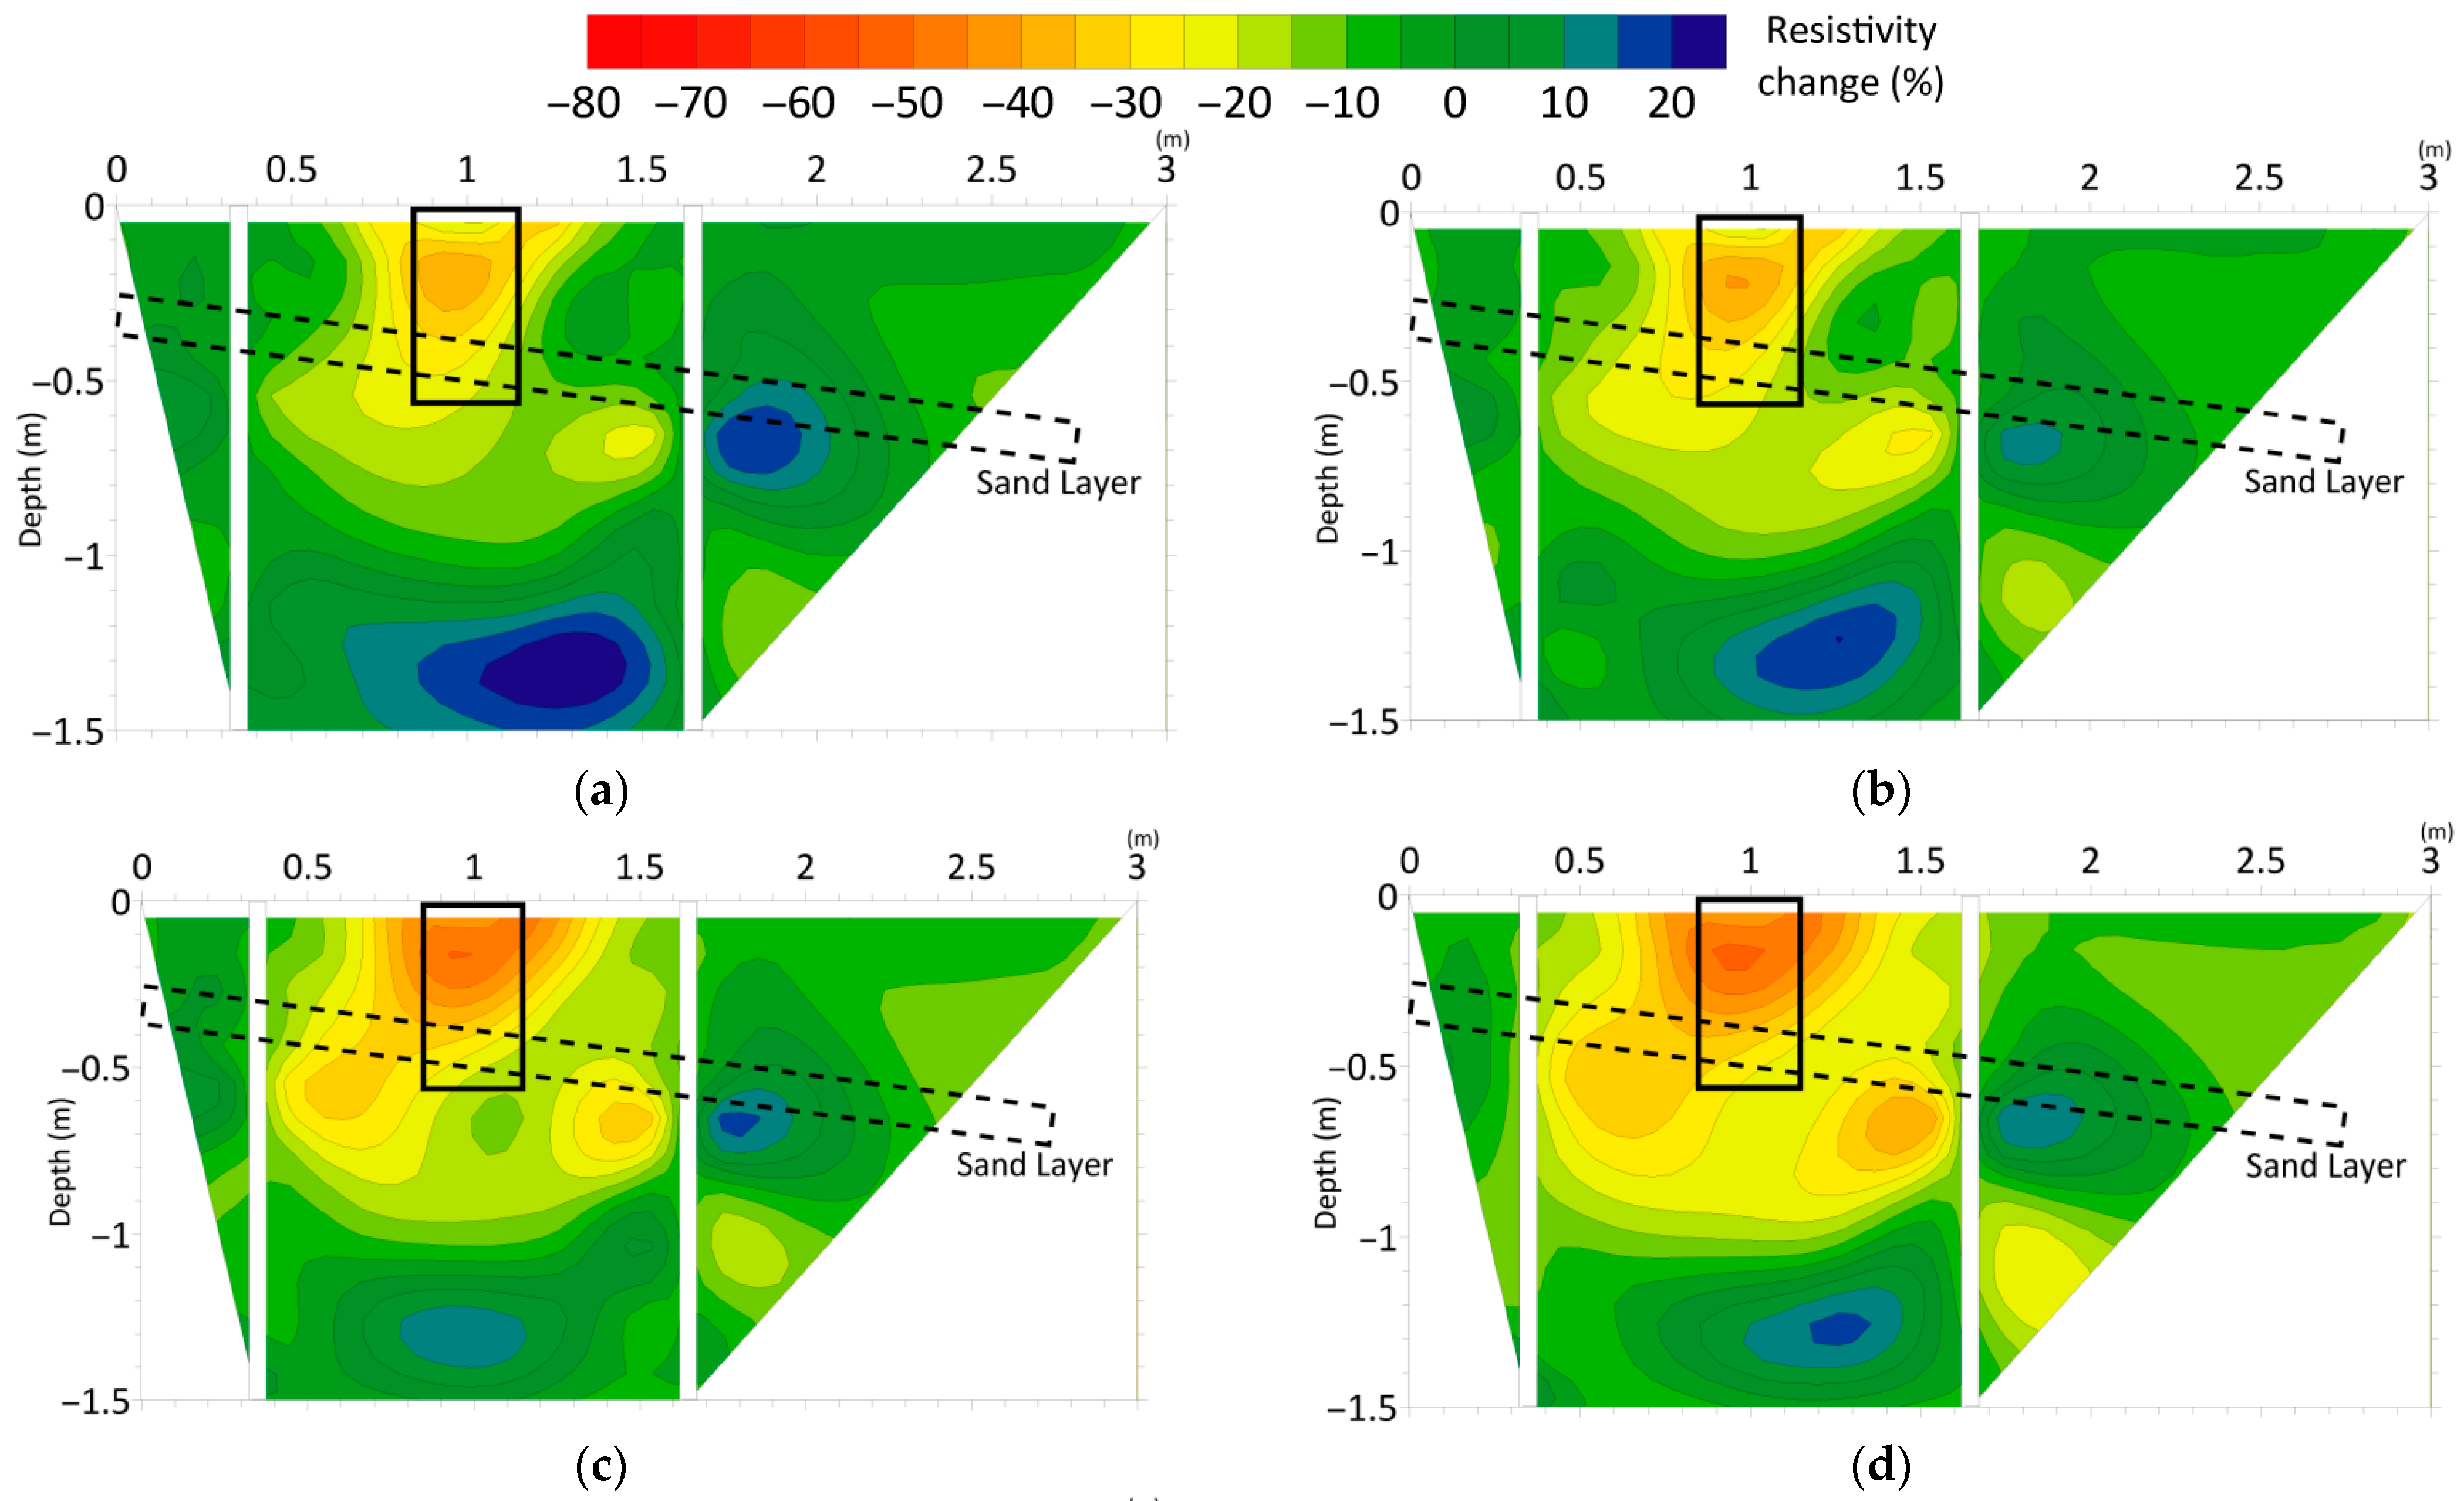
To facilitate the observation of the relative changes in the resistivity of various parts, in the heating experiment, the data were analyzed in terms of the rate of change.
As the temperature increases, the resistivity around the measuring hole begins to decrease (as shown in
Figure 14). During the process of heating to 40 °C, the resistivity decreases by approximately 30%. During the process of increasing the temperature, the range of decrease in rock resistivity gradually expands. During the process of heating to 60 °C, the maximum decrease in resistivity is approximately 45%, and it can be clearly seen that the range of resistivity decrease is even greater. During the stable heating process at 90 °C, the resistivity decreased to approximately 50% of its original value.
5.4. Analysis of Onsite Experimental Results
According to Equation (2), variation in rock resistivity is also related to porosity and saturation [
21,
22,
23]. During the experiment, the test hole was filled with groundwater, and there was no change in saturation. After the experiment began, the rock layers were not disturbed, and the influence of porosity could be ignored. Therefore, temperature changes are the only factor causing changes in rock resistivity in onsite experiments.
The results of in situ resistivity testing reveal that as the temperature of the test hole increases, the resistivity of the surrounding rock mass significantly decreases. The onsite experimental results are consistent with the theory of the relationship between rock resistivity and aqueous solution resistivity (Formula (1)). The resistivity of rock is closely related to that of pore water solutions. As the temperature increases, the resistivity of pore water decreases, and the resistivity of rock decreases with increasing temperature.
6. Conclusions
The purpose of this experiment was to study the changes in rock resistivity when rocks are heated in situ both indoors and outdoors. Through indoor heating tests on four sets of coal, five sets of tuff, five sets of sandstone, and five sets of mudstone samples at 23 °C to 96 °C, as well as in situ heating tests on mudstone at 17 °C to 90 °C, we found that the resistivity of rocks decreases significantly with increasing temperature. This happens because the aqueous solution in the rock contains different mineral ions, and as the temperature rises, the ions move faster and the resistivity decreases. When the rock is heated to 90 °C, the results of both indoor and in situ experiments reveal that the resistivity of the rock decreases to less than 50% of its original value.
These indoor and in situ test results show that as the temperature increases, the change in rock resistivity has a clear decrease. The change in temperature can be inferred by monitoring the rock resistivity. Therefore, as long as the change in rock resistivity is measured, the temperature changes inside the rock can be understood. During the process of using electrical depth measurements for geophysical logging during the gas exhaust process, there is a necessary connection between the abnormal decrease in rock resistivity and the increase in temperature. Studying the change law regarding the resistivity of various rocks with changes in temperature is helpful in fully grasping the temperature change of a coal seam field in real time. Knowing the real-time temperature change in an underground coal seam can help in the timely adjustment of the surface water injection well layout and hot water quantity. Our results have great significance for optimizing gas extraction and improving CBM mining efficiency.
7. Suggestions
In the future, in the process of CBM production experiments and construction, attention should be paid to accumulating actual engineering data, and statistical analysis should be carried out to gradually improve the accuracy of correlations between changes in the resistivity and temperature of various rocks. This would better guide the scientific arrangement of surface injection wells and improve efficiency. This method can also provide a simple and intuitive means of monitoring underground temperature changes during geothermal exploration [
24].


