Abstract
This study aims to investigate the effect of different applied voltages on the biomethanation performance and microbial community characteristics of corn stover (CS) in a microbial electrolysis cell (MEC)-assisted anaerobic digestion (AD) system (MEC-AD). The results showed that the MEC-AD system operating at 0.8 V achieved the highest methane yield of 192.40 mL CH4/g VS (volatile solids), an increase of 14.98% compared to the conventional AD. The system obtained methane yields of 187.74 to 191.18 mL CH4/g VS at lower voltages (0.4 V and 0.6 V), and 156.11–182.75 mL CH4/g VS at higher voltages (1.0 V and 1.2 V), respectively, suggesting that lower or higher voltages would have adversely impacted the methane yield. Correspondingly, the MEC-AD system operating at 0.4–0.8 V achieved over 71.47% conversion rates of total solids (TS), VS, and cellulose. The microbial community analysis revealed that 0.8 V optimally enriched fermentative acidogenic bacteria (FABs, 24.55%) and electroactive bacteria (13.50%), enhancing both hydrolysis acidification efficiency and direct interspecies electron transfer (DIET). Both Methanosarcina and Methanoculleus demonstrated significant positive correlations with FABs, SOBs, and electroactive bacteria. This study reveals that 0.8 V represents the optimal operating voltage for biomethane production in MEC-AD systems, providing critical insights for agricultural waste valorization.
1. Introduction
Corn stover (CS), a major agricultural byproduct of corn cultivation, stands as a significant renewable biomass resource with substantial potential for conversion into clean biofuels [1,2]. Anaerobic digestion (AD) technology, which produces biogas through the degradation of organic waste, offers a viable pathway for clean bioenergy recovery [3]. However, traditional AD systems face several challenges when processing CS, including low organic degradation efficiency, suboptimal biogas/methane yields, and poor operational stability [4]. Therefore, the objective is to optimize AD systems by reducing the start-up time and improving substrate conversion efficiency, thereby enabling more efficient and sustainable bioenergy production.
Recently, the integration of a microbial electrolysis cell (MEC) with AD, known as MEC-AD, has demonstrated significant advantages in addressing the limitations of traditional AD technology [5,6]. Driven by an external power source, electroactive bacteria (EBs) can be enriched on the anode surface of MEC-AD, facilitating the oxidation of anaerobic digestion intermediates into electrons, protons, and CO2. Subsequently, electrons are transferred through an external circuit to the cathode, where they participate in reduction reactions to produce methane [7,8]. Compared to conventional AD, MEC-AD enhances the efficiency of direct interspecies electron transfer (DIET) by leveraging the metabolic activity of electroactive microorganisms under an applied voltage [9,10]. This mechanism not only optimizes the hydrolysis and acidogenesis processes [11], reducing system start-up time and minimizing intermediate accumulation [12], but also significantly improves methane production and system stability [13].
The applied voltage has a significant impact on the anaerobic digestion efficiency of MEC-AD systems. Within an appropriate range, the application of voltage can effectively enhance the methane production performance of anaerobic digestion for organic waste [10]. Studies have shown that a 1.0 V MEC-AD reactor achieved the highest cumulative methane yield of 44.3 mL/g when degrading lignite [14]. Wang et al. demonstrated that a 0.8 V applied voltage significantly enhanced methane production from waste-activated sludge (WAS) in MEC-AD systems, achieving a 7.8-fold increase compared to non-electrified controls [6]. When treating swine manure, the optimal voltage for MEC-AD operation was identified as 0.9 V, yielding a peak methane production rate of 347.7 mL/g VS [15]. For landfill leachate treatment, the maximum COD removal efficiency (51.3%) was attained at 0.6 V [16]. These findings collectively establish the applied voltage as a critical operational parameter governing both methane production efficiency and organic matter degradation in MEC-AD systems across diverse substrates. Moreover, the applied voltage substantially modifies the microbial community structure in MEC-AD systems. In a 0.6 V MEC-AD system, the enrichment of electroactive bacteria such as Enterococcus and Methanobacterium enhanced hydrogenotrophic methanogenesis through interspecies electron transfer processes [17]. In the MEC-AD system treating blackwater at 1.2 V [18], the enrichment of hydrolytic and syntrophic bacteria (e.g., Clostridium, Bacteroidales, Sedimentibacter, Syntrophomonas) and increased abundance of functional genes encoding the metabolism of proteins, carbohydrates, and lipids, collectively enhanced the hydrolysis and acidogenesis processes. For complex and recalcitrant lignocellulosic biomass, studies have demonstrated that MEC-AD systems can enhance methane production from CS by 29.28% compared to conventional AD [13]. However, there is limited research on the applied voltage effects on methanation in CS-fed MEC-AD systems. Thus, this study developed a single-chamber MEC-AD system by integrating an MEC with a conventional AD, specifically aiming to explore the enhancement effects of different applied voltages on the biomethanation process of CS.
The objectives of this study are to (1) evaluate the effect of applied voltages on CS anaerobic digestion performance in MEC-AD systems by analyzing biomethane yield and substance conversion; (2) analyze the effect of different applied voltages on the microbial community characteristics in the anode biofilm and suspended cultures via 16S rRNA gene sequencing and reveal the composition and interaction of functional microorganisms.
2. Materials and Methods
2.1. Feedstock and Inoculum
CS was air-dried and grounded to 20 meshes with a pulverizer (WN-30B1, Beijing Kunjieyucheng Equipment Co., Beijing, China) and stored at room temperature in plastic bags. The original inoculum was the biogas slurry from a CS and cow dung co-fermentation digester in Sanhe City, Hebei Province, China. The electrically acclimated inoculum was obtained from the effluent of a long-term experiment involving CS biogas slurry and sodium acetate-fed MEC-AD systems operating under different applied voltages (0.4, 0.6, 0.8, 1.0, and 1.2 V). The characteristics of the CS and inoculum were measured using the methods described in Section 2.3, and the results are presented in Table 1.

Table 1.
Characteristics of corn stover (CS) and inoculum a.
2.2. Experimental Set-Up and Design
The AD was performed in single-chamber MEC-AD reactors and serum bottles. The single-chamber borosilicate glass MEC-AD (φ7.2 cm * 12 cm * 10 cm, Wenoote, Co., Ltd., Chuzhou, China) was equipped with a butyl rubber sealed sampling port at the top for substrate inlet and biogas outlet. The anode was a graphite brush, and its size was 30 mm in diameter and 30 mm in length. The enrichment of primary anode biofilms in MEC-AD reactors under different applied voltage conditions was conducted as follows: MEC-AD reactors inoculated with initial biogas slurry using sodium acetate as a substrate were maintained at 35 ± 1 °C with an initial pH of 7.5 ± 0.1, and multiple parallel cultures were used under applied voltages of 0.4, 0.6, 0.8, 1.0, and 1.2 V, respectively. During the enrichment process, the methane content (CH4 volume fraction > 55%) was monitored in real-time while the current output (stable value > 3 mA) was recorded. When both the methane production and current output remained stable for three consecutive culture cycles (each cycle lasting 7–10 days), with consistent methanogenic performance and a steady external circuit current output, the successful acquisition of anode biofilms under different voltage conditions was confirmed. The cathode material of MEC-AD was carbon cloth (W1S11011, CeTech Co., Ltd., Taichung City, Taiwan), with a surface area of 12.56 cm2 and a Pt catalyst layer (0.5 mg·cm−2) on one side. The anode and the cathode were on opposite sides. The DC power supply (UTP33313TFL-II, Uni-trend Technology Co., Ltd., Dongguan, China) provided constant voltage (0.4, 0.6, 0.8, 1.0, and 1.2 V) to MEC-AD reactors. The electrically acclimated inoculum obtained under different applied voltages were inoculated into corresponding MEC-AD reactors to establish voltage-regulated MEC-AD systems. In parallel, serum bottles inoculated with the original inoculum were designated as conventional AD reactors to serve as experimental controls. The total volume of each reactor was 400 mL, with a working volume of 300 mL. The organic loading of CS and inoculum for the reactors was set at 25 g VS/L. Subsequently, the reactors were immediately sealed using rubber septa and were incubated at 35 ± 1 °C. All the experiments were run in triplicate.
2.3. Analytical Methods
The daily biogas production from each reactor was measured using the water displacement method. This total daily volume was then converted to a standard temperature and pressure (STP) volume, using the ideal gas law. In order to evaluate the gas composition (H2, CH4, and CO2), the samples were collected from the connection pipes from all the bottles (on daily basis) and the respective methane contents were analyzed by a gas chromatograph (SP-2100, Beifen, Beijing, China), equipped with a detector molecular sieve packed with a stainless steel column (TDX-01) with a length of 2.0 mm and diameter of 3.0 mm, and connected to a thermal conductivity detector (TCD) using argon as the carrier gas. The temperatures for the injector, column, and detector were kept at 140 °C, 150 °C, and 150 °C, respectively [19]. Argon was used as the carrier gas at a flow rate 30 mL/min [20]. Daily biogas production was calculated based on the volatile solid (VS) content after converting to standard conditions. Total solid (TS) and VS contents were analyzed according to the American public health association (APHA) standard methods [21]. The pH value was measured by a pH meter (Thermo Electron, Waltham, MA, USA). The cellulose, hemicellulose, and lignin contents were determined using a fiber analyzer (f2000, Hanon Advanced Technology Group Co., Ltd., Jinan, China) following the method described by Zhao et al. [22]. Current measurements in the MEC-AD reactor system were obtained by monitoring the voltage drop across a 10 Ω precision resistor connected in series with the circuit using a high-accuracy digital multimeter (2700, Keithley Instruments, Cleveland, OH, USA). The recorded voltage data were subsequently converted to current values using Ohm’s law to quantify the electron transfer within the electrochemical system.
The experimental data of the cumulative CH4 yield was fitted by the modified Gompertz equation, as shown in Equation (1).
where H(t) = cumulative CH4 yield mL/g VS, t = fermentative time d, p = CH4 production potential mL/g VS, λ = maximum CH4 yield rate mL/(g VS·d), and a = lag phase time (d). The nonlinear fitting of the models in this study was performed using Origin 2021.
2.4. Microbial Community Analysis
At the termination of reactor fermentation, samples were collected from multiple sources for microbial community analysis, including (1) anode biofilms and suspension from MEC-AD reactors, operating at different applied voltages, and (2) digestate samples from conventional AD reactors. Microbial DNA was extracted according to the manufacturer’ s instructions and then subjected to PCR amplification. Primers for real-time PCR assays included 338F (5′-ACTCCTACGGGAGGCAGCAG-3′) and 806R (5′-GGACTACHVGGGTWTCTAAT-3′) for bacteria, and 524F10ext (5′-TGYCAGCCGCCGCGGTAA-3′) and Arch958Rmod (5′-YCCGGCGTTGAVTCCAATT-3′) for archaea. A third-party biomedical technology company performed microbial community testing, and data analysis was performed using the online Majorbio Cloud Platform (www.majorbio.com (accessed on 15 January 2025)).
2.5. Statistical Analysis
Standard deviations and statistical differences were analyzed using Microsoft Excel 2019. The methane yield was fitted with the modified Gompertz model, and figures in this study were plotted using Origin 2021. For linear regression analysis and microbial community composition and interaction relationships, data were processed using R software (4.4.0) and visualized accordingly.
3. Results and Discussion
3.1. Biogas and Biomethane Production
3.1.1. Daily Biogas Production
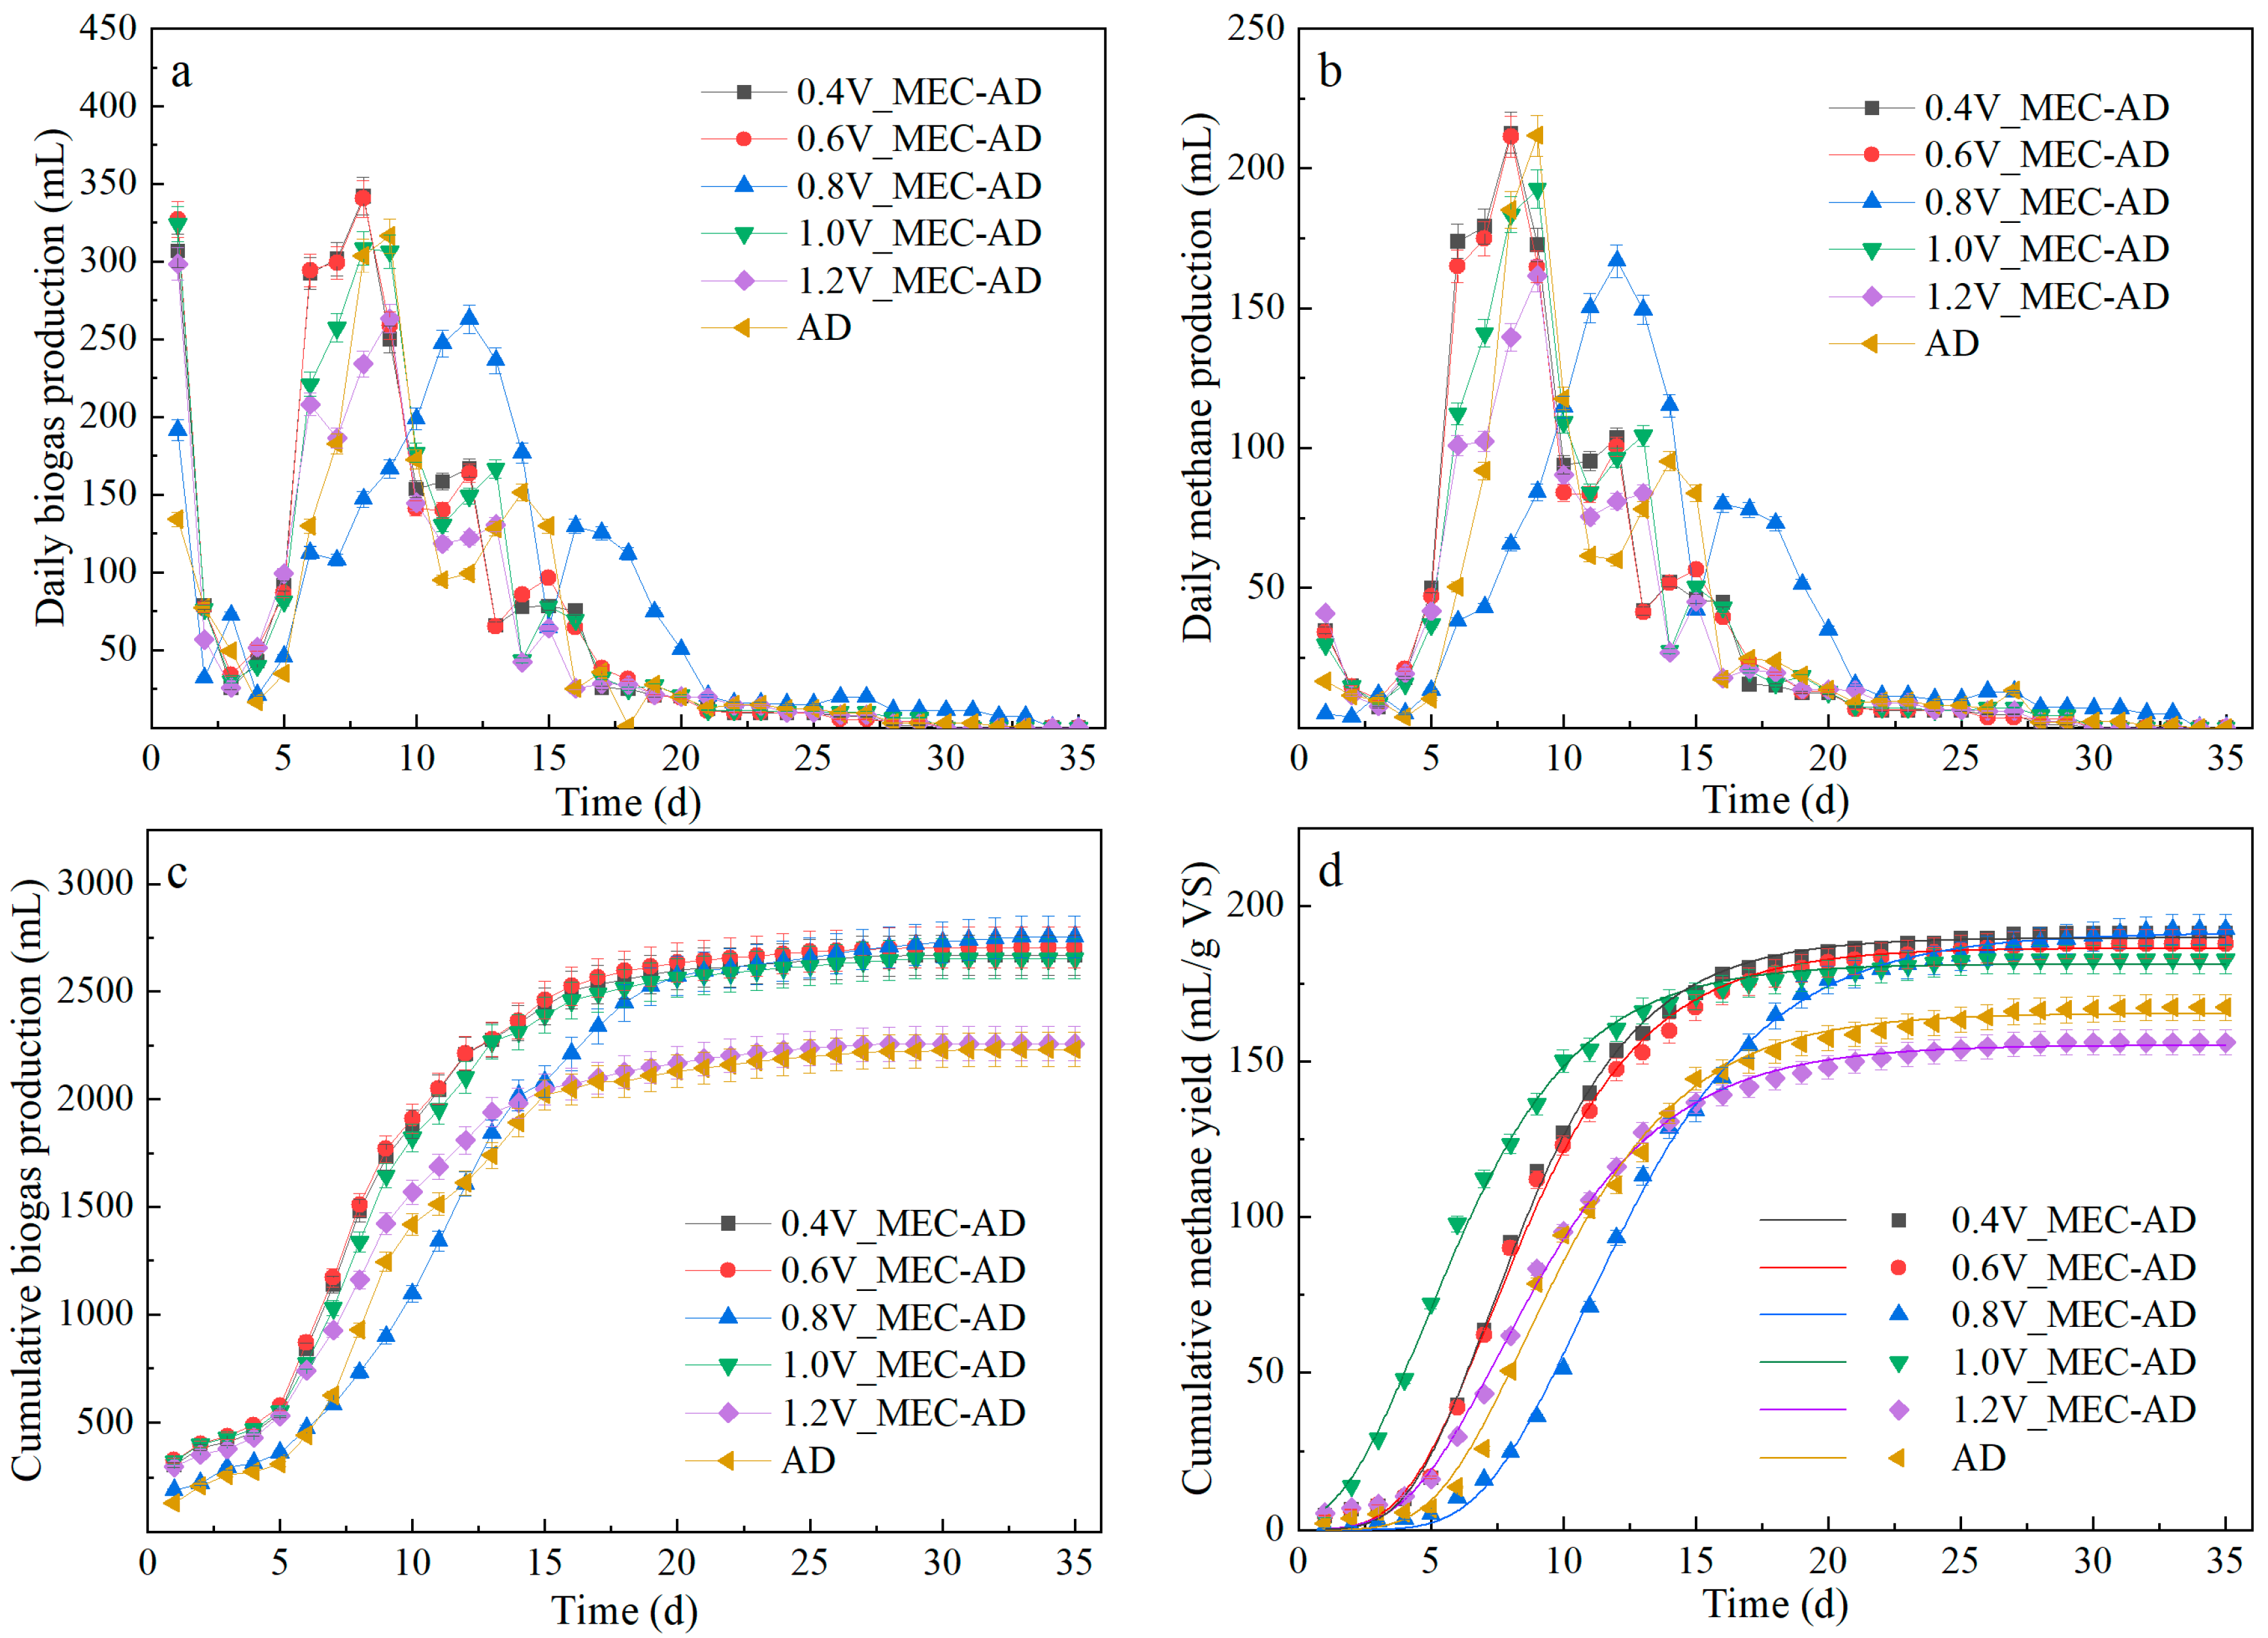
As depicted in Figure 1a, the applied voltage significantly influenced the daily biogas production in the MEC-AD systems during CS digestion. The results revealed that the 0.4, 0.6, and 1.0 V MEC-AD systems reached their maximum biogas production on day 8, with peak values of 342.02 mL, 340.29 mL, and 308.68 mL, respectively. In contrast, the 0.8 and 1.2 V systems exhibited delayed peak production, achieving their maxima on day 12 and day 9, respectively. These systems also showed significantly lower peak values of 262.86 mL and 263.30 mL, representing a 17–29% reduction compared to the 0.4, 0.6, and 1.0 V systems. Notably, despite the delayed peak in biogas production, the 0.8 V MEC-AD system demonstrated an extended gas production duration, surpassing other groups by 7 days, and exhibited a more stable production trend, underscoring its superior operational stability.
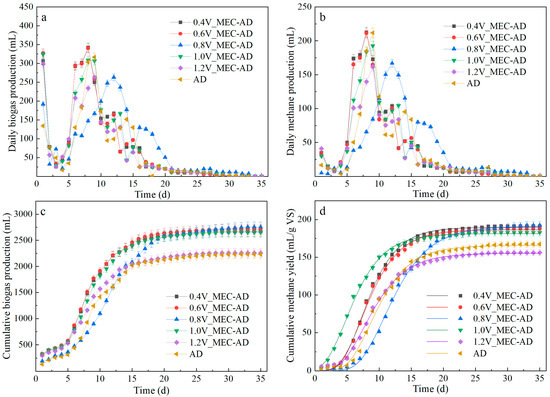
Figure 1.
Daily biogas/methane production (a,b) and cumulative methane yield (c,d) of MEC-AD systems under different applied voltages (solid dots indicate experimental data of CMY and solid lines indicate fitted curves of CMY). AD is the control group.
Figure 1b further illustrates the daily methane production trends in MEC-AD systems during CS digestion under varying applied voltages. The results indicate that the 0.4, 0.6, and 1.0 V MEC-AD systems achieved their initial methane production peaks on days 8 and 9, with peak values of 212.73 mL, 211.30 mL, and 192.56 mL, respectively. These systems subsequently exhibited a secondary, smaller peak on days 12 and 13, with values of 103.64 mL, 100.49 mL, and 104.37 mL. In contrast, the 0.8 V MEC-AD system demonstrated delayed methane production peaks, with reduced values of 166.80 mL and 79.90 mL. Notably, the 1.2 V MEC-AD system displayed only a single methane production peak, recording the lowest peak value (161.59 mL) among all systems. Although the 0.8 V MEC-AD system did not achieve the highest methane production peaks, it exhibited prolonged methanogenic activity. From days 5 to 27, its daily methane production consistently exceeded 10.00 mL, accompanied by a stable and gradually increasing trend. In comparison, the methanogenic activity of the other systems was primarily limited to the first 20 days, characterized by significant fluctuations in daily methane production. These results demonstrate that the 0.8 V MEC-AD system exhibits superior operational stability during the methanogenic conversion of CS, while the 0.4, 0.6, and 1.0 V MEC-AD systems show greater advantages in daily methane production efficiency. However, the application of 1.2 V may potentially impair the methanogenic performance of the MEC-AD system.
3.1.2. Accumulative Biogas Yield
Figure 1c depicts the cumulative biogas production of the MEC-AD system under different applied voltages. The results demonstrate that the 0.8 V MEC-AD system achieved the highest biogas production (2754.78 mL), exceeding the 1.2 V MEC-AD system (2258.57 mL) and the AD system (2231.64 mL) by 21.97% and 23.44%, respectively. Furthermore, the biogas production of the 0.4, 0.6, and 1.0 V MEC-AD systems reached 2667.80 mL, 2704.75 mL, and 2652.04 mL, respectively, representing increases of 17.42–19.75% and 18.84–21.20% compared to the 1.2 V MEC-AD and AD systems. It is noteworthy that the cumulative biogas production of the 1.2 V MEC-AD system showed no significant difference from that of the AD system, suggesting that the 1.2 V applied voltage did not effectively enhance the biogas production efficiency of the MEC-AD system in converting CS. Similar findings have been reported in studies investigating the treatment of swine manure using MEC-AD systems [15].
Figure 1d and Table 2 further illustrate the cumulative methane yield and kinetic properties of the MEC-AD system under varying applied voltages. The results indicate that the MEC-AD system at 0.8 V achieved the highest methane yield of 192.40 mL CH4/g VS, representing a 14.98% increase compared to conventional AD. Under lower voltages (0.4 and 0.6 V), the methane yields were 187.74–191.18 mL CH4/g VS, corresponding to improvements of 12.20% and 14.25%, respectively, over traditional AD. In contrast, under higher voltages (1.0 and 1.2 V), the methane yields were 156.11–182.75 mL CH4/g of VS, respectively. Notably, the 1.0 V (182.75 mL CH4/g VS) condition showed only a 9.22% increase in methane yield compared to AD, while the 1.2 V condition resulted in a 6.70% reduction. These findings further confirm that excessively high applied voltages inhibit the methanogenic process during the anaerobic digestion of CS. The maximum methane production rates (λ), derived from Gompertz model fitting, revealed that the MEC-AD systems under 0.4 V to 1.0 V all exceeded 18.14 mL CH4/ (g VS·d), whereas the rates for the 1.2 V MEC-AD and traditional AD systems were below 17.86 mL CH4/ (g VS·d).
Table 2.
Kinetic analysis of methane yield in MEC-AD systems under different applied voltage conditions.
These results underscore the significant influence of applied voltage on the methanogenic conversion of CS in MEC-AD systems. The 0.8 V MEC-AD system demonstrated optimal performance in achieving high methane yield from CS, while the 1.2 V applied voltage significantly inhibited methane production. This phenomenon may be attributed to the profound impact of different applied voltages on the composition and functionality of microbial communities within the MEC-AD system [18], ultimately determining the efficiency of methane production.
3.2. Substance Conversion
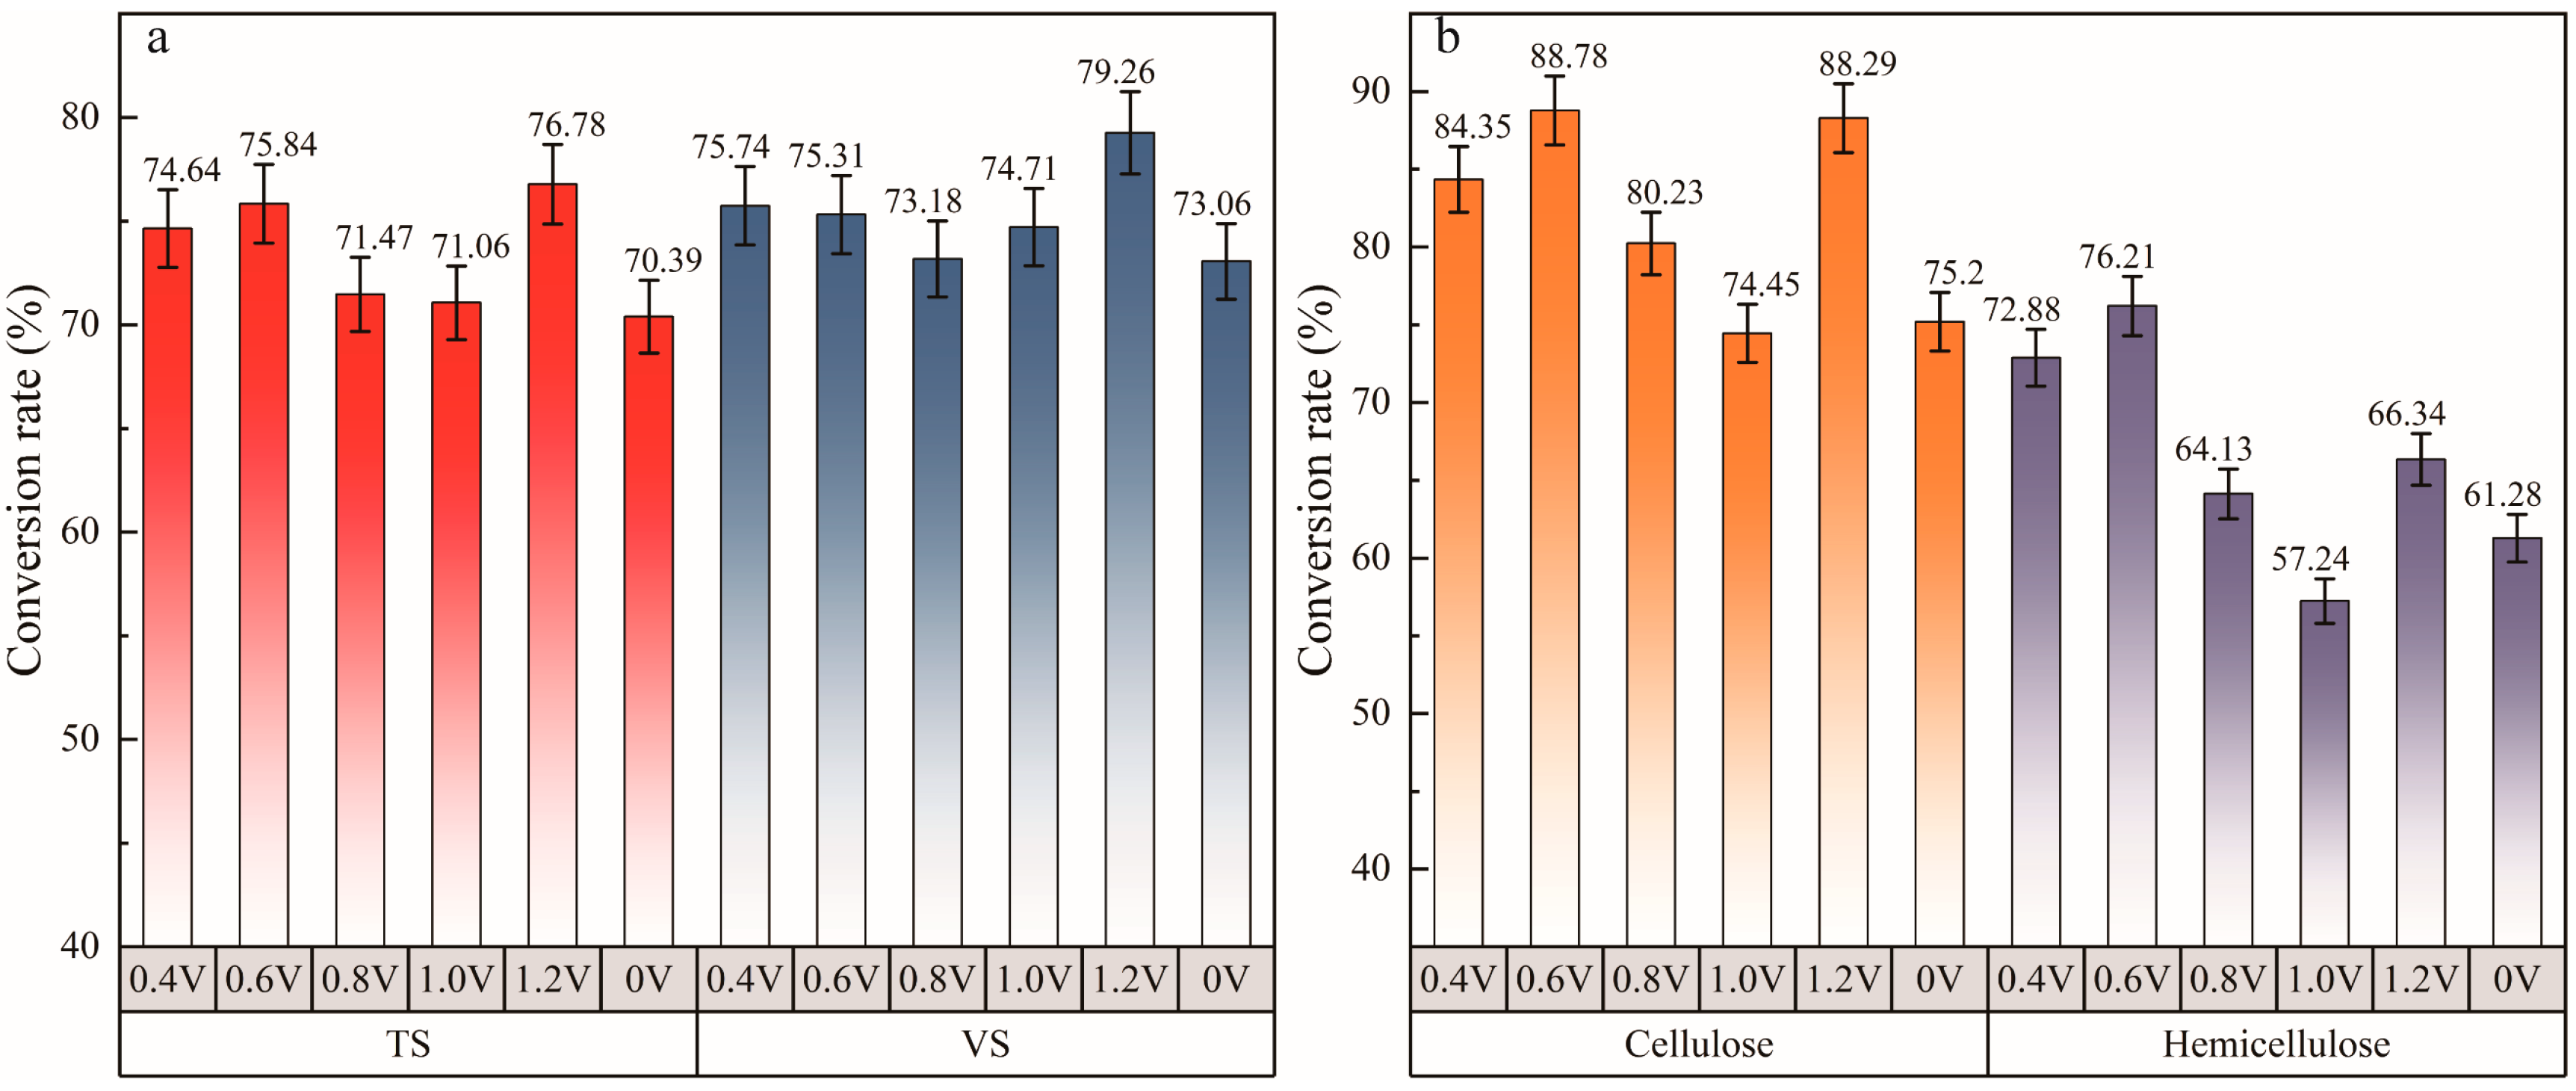
The conversion rates of TS and VS serve as effective indicators of the hydrolysis and transformation efficiency of the total solid organic matter and volatile solid organic matter during the anaerobic digestion of CS. As illustrated in Figure 2a, the TS and VS conversion rates of CS in MEC-AD systems displayed significant variations under different applied voltages. Compared to the control AD system, lower applied voltages (0.4 and 0.6 V) markedly improved the TS and VS conversion rates, reaching 74.64% and 75.74% (0.4 V), and 75.84% and 75.31% (0.6 V), respectively. However, the TS (71.06–71.47%) and VS (71.06–71.47%) conversion rates in the 0.8 and 1.0 V MEC-AD systems were slightly lower than those in the low-voltage groups. Notably, although the 1.2 V MEC-AD system achieved the highest TS and VS conversion rates, at 76.78% and 79.26%, respectively, its biogas and methane production efficiency was the lowest. This phenomenon suggests that the 1.2 V applied voltage, while effectively promoting the decomposition of CS, may have generated phenolic derivatives detrimental to anaerobic microorganisms, thereby inhibiting subsequent methanogenesis [23]. These findings underscore the importance of balancing substrate decomposition promotion and microbial activity maintenance when selecting applied voltages.
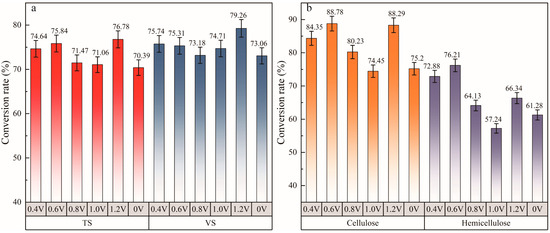
Figure 2.
Final substrate conversion in MEC-AD systems under different applied voltages (a): TS and VS, (b): cellulose and hemicellulose (0.4–1.2 V represents the MEC-AD with applied voltages ranging from 0.4 to 1.2 V and 0 V represents the conventional AD).
Lignocellulose constitutes the primary component of CS, and the biogas produced during its anaerobic digestion predominantly originates from the conversion of cellulose and hemicellulose [24]. Consequently, the conversion rates of cellulose and hemicellulose are frequently employed as critical indicators to assess the biomass conversion performance during the anaerobic digestion of CS. The conversion patterns are illustrated in Figure 2b; the results demonstrated that the MEC-AD system achieved cellulose and hemicellulose conversion rates exceeding 80% and 64%, respectively, under applied voltages ranging from 0.4 to 0.8 V and at 1.2 V. These conversion trends were consistent with those observed for TS and VS conversion rates. Nevertheless, a comprehensive analysis of biogas production efficiency indicated that applied voltages below 1.0 V were particularly effective in enhancing the conversion of cellulose and hemicellulose in CS within the MEC-AD system, leading to a notable improvement in overall system performance. These findings offer valuable guidance for the optimization of operational parameters in MEC-AD systems.
3.3. Bio-Electrochemical Characteristics
3.3.1. Variation in Current
Figure 3a depicts the variation in the external circuit current during the fermentation of CS in MEC-AD systems under different applied voltages. As the applied voltage increased, the current generated by the MEC-AD systems showed significant variations. Overall, the 1.2 V MEC-AD system exhibited the highest current values, while the 0.4 V system displayed the lowest circuit current (<3 mA). Notably, the 1.0 V MEC-AD system initially showed higher current values than the 0.8 V system during the first two days, but its current values subsequently remained consistently lower. This suggests that a 0.8 V applied voltage is more effective in promoting electron transfer activities among microorganisms within the MEC-AD system, thereby reducing internal resistance and enhancing the external circuit current. During the initial 1–2 days of operation, the current values of all systems increased rapidly, with peak currents reaching 2.23, 5.81, 9.55, 15.36, and 14.77 mA, respectively. For systems with lower applied voltages (0.4 and 0.6 V), the current values briefly rose again during the fermentation process before stabilizing and gradually declining until the reaction concluded. In contrast, the current values of the 0.8, 1.0, and 1.2 V MEC-AD systems fluctuated within a low range (4.24–7.70 mA) for four days before rising again, producing two current peaks during the fermentation process, and then declining rapidly.
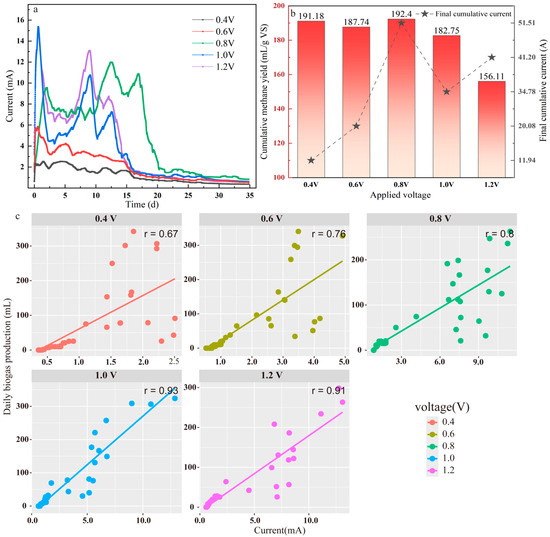
Figure 3.
Daily variations in current under different applied voltages (a); the relationship between cumulative CH4 yield and current at the end of the experiment (b); and regression analysis of current and biogas production in MEC-AD systems under different applied voltages (c).
This phenomenon can be attributed to the sufficient substrate concentration and high microbial activity in the early to mid-stages of the reaction, where intense biochemical reactions generated an abundance of free electrons in the external circuit. As the reaction progressed, the organic matter concentration within the system gradually decreased, leading to a reduction in the number of free electrons. Thus, the current variations in MEC-AD systems under different applied voltages are closely related to the biochemical degradation of CS within the system [25,26]. While the external circuit current increases with higher applied voltages, excessively high applied voltages may inhibit microbial activity within the system, thereby reducing the external circuit current.
3.3.2. Correlation Between Current and Biogas Production
Figure 3b illustrates the relationship between the cumulative current in the external circuit and the cumulative methane yield during the degradation of CS in the MEC-AD system. Within the voltage range of 0.4–0.8 V, as the applied voltage increased, the cumulative current of the system continued to rise, peaking at 0.8 V (51.51 A), while the methane yield simultaneously reached its maximum value (192.40 mL/g VS). However, when the applied voltage was further increased to 1.0–1.2 V, the cumulative current significantly decreased, and the methane yield also declined. This phenomenon suggests that an appropriate applied voltage (0.4–0.8 V) can effectively enhance the metabolic activity of electroactive microorganisms, facilitating the efficient coupling of substrate oxidation and methane synthesis. In contrast, excessively high voltages (e.g., 1.2 V) may inhibit the metabolic activity of methanogens, a finding consistent with previous research conclusions [27]. Figure 3c further reveals the dynamic coupling relationship between current and daily biogas production in the MEC-AD system under different voltage conditions. The linear regression analysis showed a significant positive correlation between daily biogas production and current values (r > 0.67), indicating that an increase in the electron transfer rate can accelerate the hydrolysis and acidification of organic matter, thereby promoting biogas generation [8].
3.4. Microbiological Community Characteristics
3.4.1. Microbial Community Structure
Bacterial Community: Figure 4a illustrates the distribution of bacterial communities at the phylum level in the anode and suspension of MEC-AD systems under different applied voltages. The predominant phyla include Bacteroidota, Bacillota (formerly Firmicutes), Chloroflexota, Spirochaetota, Fibrobacterota, Synergistota, Thermodesulfobacteriota, and Pseudomonadota. Among these, Bacteroidota and Bacillota are renowned for their robust secretion of hydrolytic enzymes, enabling the efficient degradation of complex organic matter [28,29], thereby accelerating the breakdown of macromolecules such as cellulose, proteins, and lipids [30,31]. These two phyla dominate both the anode and suspension, with relative abundances ranging from 40.90 to 53.35% and 54.48 to 66.63%, respectively.
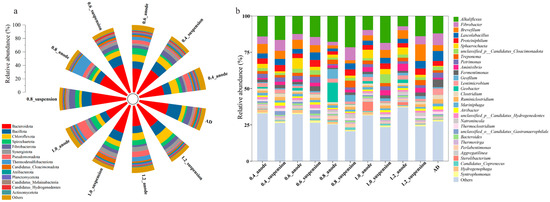
Figure 4.
The relative abundance of bacterial communities in MEC-AD under different applied voltages. (a): phylum level, (b): genus level.
In the anode biofilm, Chloroflexota, Spirochaetota, Thermodesulfobacteriota, and Pseudomonadota are also enriched. Specifically, Chloroflexota is capable of mixotrophic metabolism utilizing reducing gases [32]; Spirochaetota is a typical acidogenic bacterium that converts carbohydrates into simple volatile fatty acids (VFAs) [33]; Thermodesulfobacteriota, a sulfur-reducing microorganism, utilizes sulfides or Fe (III) as energy sources [34], and is notably abundant on the anode surface of the MEC-AD system under the 0.8 V applied voltage (17.00%); Pseudomonadota includes electroactive bacteria that typically attach to the anode surface, directly transferring electrons to the anode electrode, thereby significantly enhancing the operational efficiency of microbial electrochemical systems [35]. These findings indicate that the MEC-AD anode, stimulated by the applied voltage, not only enriches electroactive bacteria but also attracts a substantial number of hydrolytic and acidogenic bacteria. In contrast, the bacterial community in the suspension exhibits distinct characteristics. In addition to the enrichment of hydrolytic bacteria (Bacteroidota and Bacillota) and acidogenic bacteria (Chloroflexota and Spirochaetota), the suspension also shows a significant increase in the relative abundance of cellulose-degrading bacteria (Fibrobacterota, 4.87–8.97%) and organic acid-oxidizing bacteria (Synergistota, 3.28–5.95%).
At the genus level, the applied voltage significantly influenced the distribution of bacterial communities in the MEC-AD system (Figure 4b). Based on their functional characteristics, these bacterial genera can be categorized into three main groups: fermentative acidogenic bacteria (FABs), syntrophic organic acid-oxidizing bacteria (SOBs), and electroactive bacteria (EBs).
The electroactive microbial community, primarily represented by the exoelectrogenic bacterium Geobacter and the electron-exchanging bacterium Sphaerochaeta, is predominantly distributed in the anode biofilm of the MEC-AD system. Under different applied voltages, the relative abundances of these genera exhibit significant variations. Specifically, Geobacter reaches its highest relative abundance (13.50%) in the anode of the 0.8 V MEC-AD system, significantly surpassing its abundance under other voltage conditions (1.20–2.41%). Studies have revealed that Geobacter, as a sulfur-reducing bacterium, enhances system performance through the following mechanisms: (1) establishing direct electron connections with methanogens (e.g., Methanosarcina and Methanothrix) via electrically conductive pili (e-pili), thereby promoting the synergistic degradation of organic matter and methane synthesis [36,37]; (2) forming DIET with hydrogenotrophic methanogens (e.g., Methanobacterium) through conductive materials, enabling electrotrophic methanogenesis [38,39]. In contrast, the relative abundance of Sphaerochaeta under 0.4, 0.6, 1.0, and 1.2 V conditions (2.86%, 7.30%, 5.72%, and 4.84%, respectively) is consistently higher than that under the 0.8 V condition (1.05%), highlighting the distinct responses of different electroactive bacteria to voltage gradients.
The SOBs community, comprising Brevefilum, Fermentimonas, and Ruminiclostridium, exhibited a slightly higher relative abundance in the MEC-AD suspension (5.90–15.73%) compared to the anode region. The core genus Brevefilum, identified as a potential syntrophic propionate-oxidizing bacterium, plays a crucial role in alleviating propionate accumulation and maintaining system stability [40]. Under low-voltage (0.4 V) conditions, the relative abundance of Brevefilum significantly increased, reaching 1.75–2.52 times that observed at 0.8 V. Simultaneously, the low-voltage condition also enriched Fermentimonas and Ruminiclostridium. These genera, functioning as syntrophic acetate-oxidizing bacteria [41,42], are pivotal in fermenting carbohydrates and complex protein substrates. Notably, Ruminiclostridium secretes hemicellulase and cellulase, directly contributing to the degradation of lignocellulose [43]. These findings suggest that the relative abundance of SOBs in the 0.8 V system is significantly lower than under other conditions, indicating that a moderate applied voltage may enhance direct electron transfer pathways, thereby replacing traditional syntrophic metabolic modes. In contrast, low-voltage (0.4 V) conditions promote the enrichment of SOBs, strengthening their syntrophic relationships with methanogens and consequently improving the methane production efficiency of the system.
FABs represent the most abundant functional microbial group in the MEC-AD system, primarily including genera such as Alkaliflexus, Fibrobacter, Lascolabacillus, Proteiniphilum, Treponema, and Aminivibrio. Studies have demonstrated that these genera significantly enhance the hydrolysis efficiency of complex cellulose-based substrates in anaerobic systems [44,45,46], while also generating more small-molecule acids and hydrogen as intermediate products [47]. Under the 0.8 V condition, the relative abundance of FABs in both the anode biofilm and suspension was markedly increased, particularly for Alkaliflexus and Geofilum. The relative abundances of Alkaliflexus reached 17.83% in the anode and 6.72% in the suspension, while those of Geofilum were 21.56% and 4.52%, respectively. Previous research has reported that the significant enrichment of Alkaliflexus is closely associated with improved hydrolysis rates of waste-activated sludge [6], which aligns with the findings of this study. Additionally, Geofilum can utilize various sugars (e.g., D-fructose, D-galactose, and xylose) to produce intermediate metabolites such as acetate, ethanol, and lactate [48]. These findings indicate that the 0.8 V condition enhances the hydrolysis and acidification capabilities of the MEC-AD system, significantly improving substrate degradation efficiency and methane production.
In summary, under the 0.8 V condition, the enrichment of electroactive bacteria (e.g., Geobacter) and hydrolytic acidogenic bacteria (e.g., Alkaliflexus) promotes hydrolytic acidification and DIET processes. In contrast, a low voltage (0.4 V) enhances methanogenic efficiency by strengthening the syntrophic relationship between SOBs (e.g., Brevefilum) and methanogens.
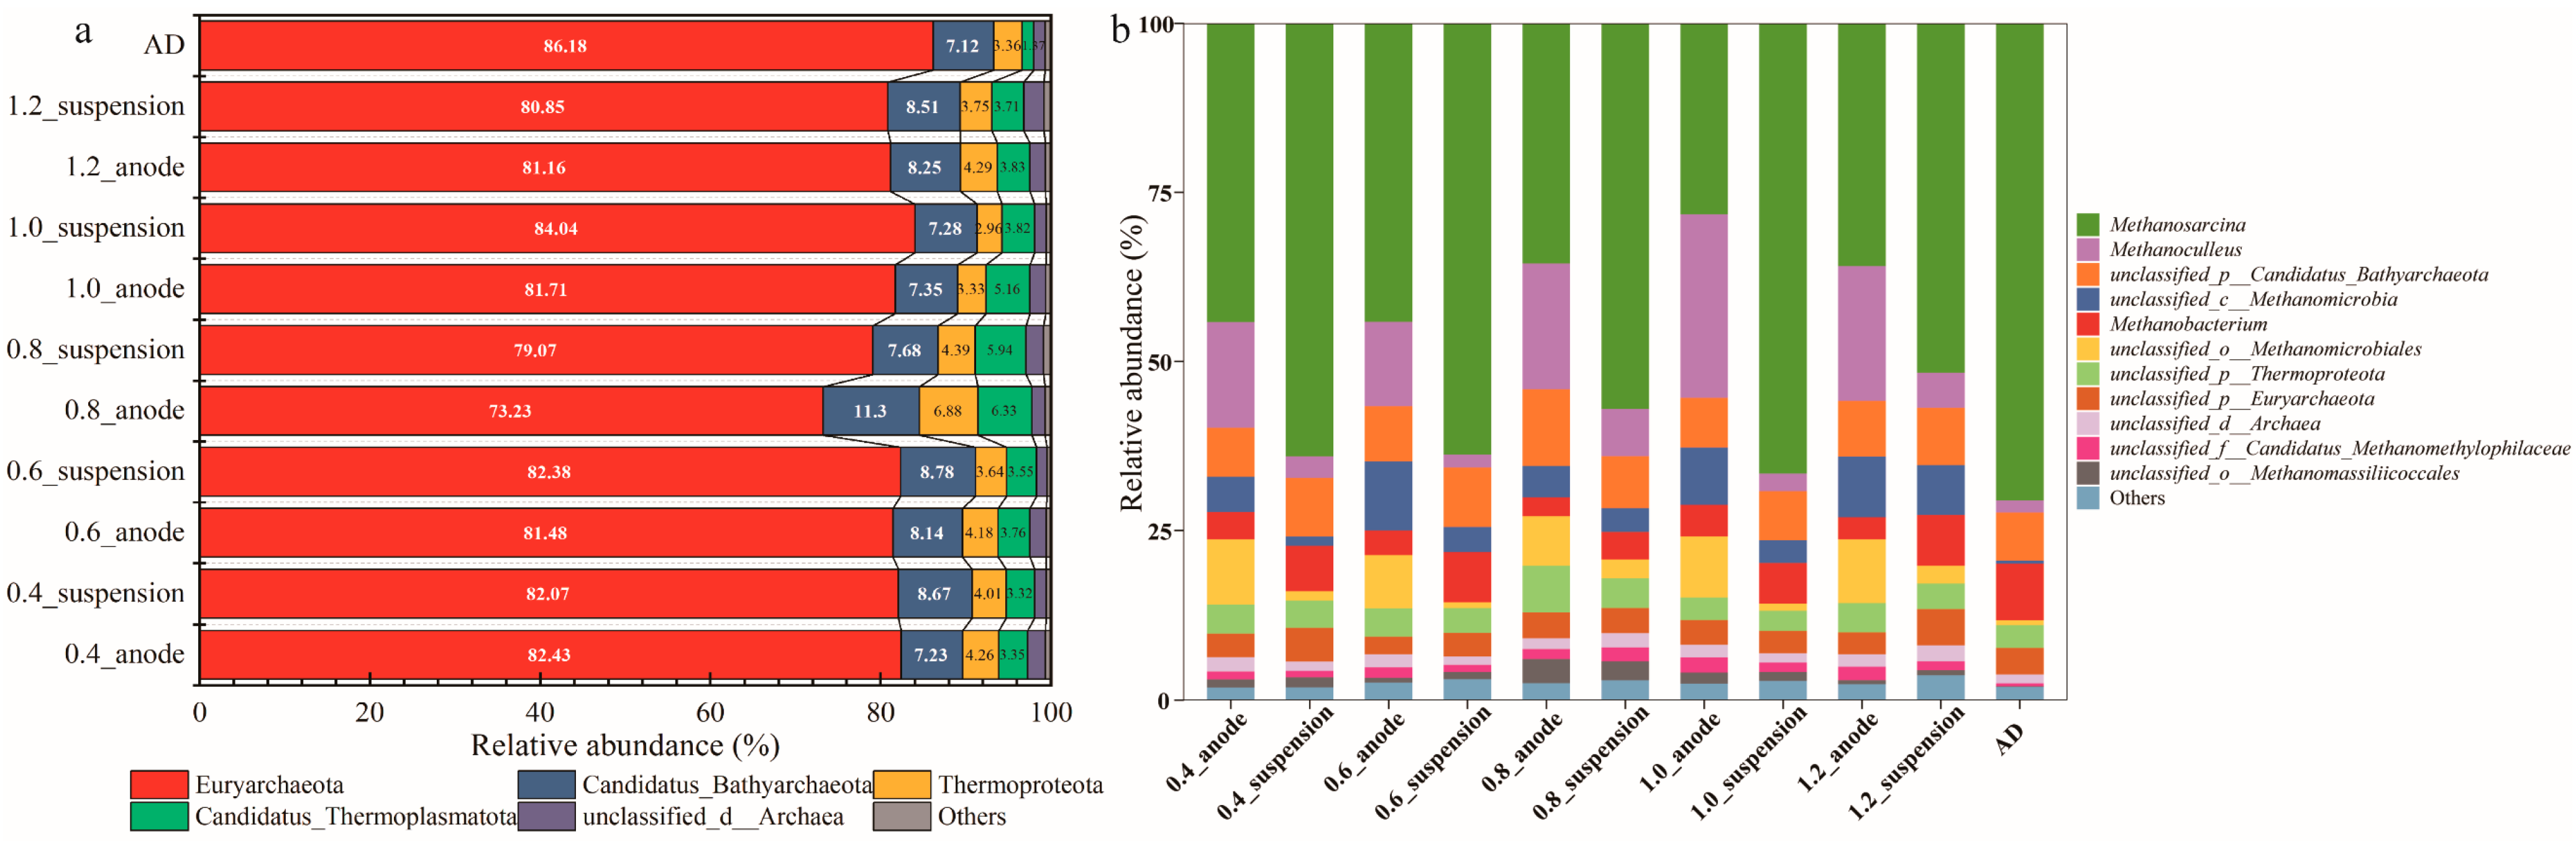
Archaeal community: At the phylum level, the distribution of archaeal communities in the MEC-AD system under different applied voltages is shown in Figure 5a. The dominant archaeal phyla include Euryarchaeota, Candidatus_Bathyarchaeota, Thermoproteota, and Candidatus_Thermoplasmatota. Among these, Euryarchaeota overwhelmingly dominates, with its relative abundance ranging from 73.23% to 86.18%, highlighting its critical role in the archaeal community structure of the MEC-AD system.
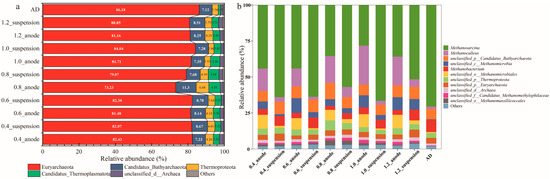
Figure 5.
The relative abundance of archaeal communities in MEC-AD under different applied voltages. (a): phylum level, (b): genus level.
At the genus level, the applied voltage significantly influenced the archaeal community in the MEC-AD system, as illustrated in Figure 5b. In all samples, the cumulative relative abundances of the versatile methanogen Methanosarcina and the hydrogenotrophic methanogen Methanoculleus were notably high, accounting for 54.14–59.84% in the anode and 56.86–67.25% in the suspension across different systems. Both Methanosarcina and Methanoculleus can engage in syntrophic interactions with various functional bacteria (e.g., electroactive bacteria and SOBs) through DIET or mediated interspecies electron transfer (MIET) pathways, thereby promoting methane production [49,50]. Notably, Methanosarcina exhibited higher enrichment under low-voltage conditions (0.4 and 0.6 V), with relative abundances of 44.18–44.19% in the anode and 63.80–64.06% in the suspension. In contrast, Methanoculleus was more prevalent in the anode biofilm under medium-to-high applied voltage conditions (0.8–1.2 V), with relative abundances ranging from 18.62% to 27.11%. This phenomenon may be attributed to the increased hydrogen production under high-voltage conditions, providing ample substrate for hydrogenotrophic methanogens.
In summary, under lower applied voltages, Methanosarcina is predominantly enriched in both the anode and suspension of MEC-AD systems, indicating its potential involvement in methane production through multiple metabolic pathways. In contrast, under medium to high applied voltages, while Methanosarcina remains abundant in the suspension, the anode biofilm is additionally enriched with the hydrogenotrophic methanogen Methanoculleus. This distinct microbial distribution suggests that methanogenesis under medium to high-voltage conditions may involve a more diverse and complex network of metabolic interactions.
3.4.2. Microbial Correlation Analysis
The microbial community interactions based on Spearman correlation are shown in Figure 6. The results indicate that in MEC-AD systems under different applied voltages, microbial interactions exhibit both common features and significant voltage-dependent variations.
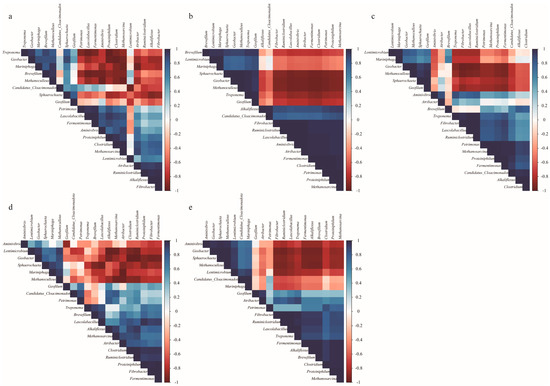
Figure 6.
Microbial community interaction patterns visualized through Spearman correlation heatmaps: (a) 0.4 V-MEC-AD, (b) 0.6 V-MEC-AD, (c) 0.8 V-MEC-AD, (d) 1.0 V-MEC-AD, and (e) 1.2 V-MEC-AD.
From the perspective of common features, various FABs, including Alkaliflexus, Fibrobacter, Lascolabacillus, Proteiniphilum, Petrimonas, Clostridium, Ruminiclostridium, and Atribacter, generally show negative correlations with electroactive bacteria capable of extracellular electron transfer (e.g., Geobacter, Sphaerochaeta, and Mariniphaga). This negative correlation may stem from resource competition for substrates such as glucose and acetate, reflecting inherent conflicts in metabolic pathways and ecological niches between electroactive bacteria and FABs.
From the perspective of voltage-dependent variations, the interaction patterns between methanogens, electroactive bacteria, FABs, and SOBs differ with changes in applied voltage. Under lower voltages (0.4 and 0.6 V), Methanosarcina dominates the methanogen population in the MEC-AD system. This genus exhibits strong correlations with various FABs (e.g., Lascolabrius, Proteiniphilum, Petrimonas, Aminivibrio, and Clostridium) and SOBs (e.g., Fermentimonas). These functional microbial groups provide diverse metabolic substrates (e.g., VFAs and hydrogen) to Methanosarcina, supporting its methane production through multiple pathways such as acetoclastic methanogenesis and CO2 reduction.
Under medium to high applied voltages (0.8, 1.0, and 1.2 V), the microbial interaction patterns in the MEC-AD system undergo significant changes. Methanosarcina shows positive correlations with certain FABs (e.g., Alkaliflexus and Fibrobacter) and SOBs (e.g., Brevefilum). Additionally, the system is enriched with a substantial population of Methanoculleus, which exhibits positive interactions with EBs (e.g., Lentimicrobium, Geobacter, Mariniphaga, and Sphaerochaeta). Previous studies have demonstrated that Methanoculleus can participate in DIET for methane production [51]. This finding suggests that, in MEC-AD systems under 0.8, 1.0, and 1.2 V, in addition to traditional acetoclastic and hydrogenotrophic methanogenesis pathways, electrotrophic methanogenesis via DIET also occurs.
In summary, the applied voltage not only influences the composition of microbial communities in MEC-AD systems but also regulates the interaction patterns among key functional microbial groups, thereby altering the metabolic pathways and functional properties of the system.
4. Conclusions
The MEC-AD system operating at 0.8 V achieved the highest biomethane yield of 192.40 mL CH4/g VS from CS, representing an increase of 14.98% compared to the conventional AD. Lower or higher applied voltages would have an adverse impact on the biomethane yield, as indicated by decreased biomethane yields at lower voltages of 0.4 and 0.6 V, and higher applied voltages of 1.0 and 1.2 V. The MEC-AD system operating at 0.4–0.8 V achieved over 71.47% conversion rates of TS, VS, and cellulose, which generally corresponded to the improvement in the biomethane yield. The microbial composition and interactions were significantly altered at the 0.8 V condition in MEC-AD system. The enrichment of FABs (e.g., Alkaliflexus) and EBs (e.g., Geobacter) effectively promoted hydrolytic acidification and DIET processes. Both Methanosarcina and Methanoculleus exhibited positive correlations with FABs (e.g., Alkaliflexus and Fibrobacter), SOBs (e.g., Brevefilum), and EBs (e.g., Geobacter and Sphaerochaeta). This study demonstrates that the MEC-AD system operating at 0.8 V achieved optimal biomethane production while elucidating the critical mechanisms of applied voltage-regulated microbial community structure and function, providing both theoretical foundations and technical support for agricultural waste valorization.
Future research should focus on (1) developing novel electrode materials to enhance electron transfer efficiency; (2) optimizing reactor configurations for scale-up applications; and (3) deciphering metabolic regulatory networks of key functional microorganisms. These investigations will significantly advance the application potential of MEC-AD systems in biomass-to-energy conversion.
Author Contributions
Q.Z.: investigation, data curation, formal analysis, and writing—original draft. H.Y.: project administration, resources, and supervision. X.L.: methodology, conceptualization, project administration, and funding acquisition. All authors have read and agreed to the published version of the manuscript.
Funding
This research was funded by National Key Research and Development Program of China grant number [No. 2024YFC3909101].
Data Availability Statement
The original contributions presented in this study are included in the article. Further inquiries can be directed to the corresponding author(s).
Acknowledgments
The authors are grateful to the fund supports from the National Key Research and Development Program of China (No. 2024YFC3909101).
Conflicts of Interest
The authors declare no conflict of interest.
References
- Peng, C.; Wang, T.; Feng, Y.; Fan, X.; Niu, J.; Wang, J.; Gao, W.; Zhou, Y.; Hu, W.; Zhang, Q. Enhanced Hydrolysis and Methane Yield of Temperature-Phased Dewatered Sludge Anaerobic Digestion by Microbial Electrolysis Cell. Bioresour. Technol. 2024, 400, 130682. [Google Scholar] [CrossRef] [PubMed]
- Zabed, H.M.; Akter, S.; Yun, J.; Zhang, G.; Zhao, M.; Mofijur, M.; Awasthi, M.K.; Kalam, M.A.; Ragauskas, A.; Qi, X. Towards the Sustainable Conversion of Corn Stover into Bioenergy and Bioproducts through Biochemical Route: Technical, Economic and Strategic Perspectives. J. Clean. Prod. 2023, 400, 136699. [Google Scholar] [CrossRef]
- Ao, T.-J.; Liu, C.-G.; Sun, Z.-Y.; Zhao, X.-Q.; Tang, Y.-Q.; Bai, F.-W. Anaerobic Digestion Integrated with Microbial Electrolysis Cell to Enhance Biogas Production and Upgrading in Situ. Biotechnol. Adv. 2024, 73, 108372. [Google Scholar] [CrossRef]
- Wei, Y.; Chen, W.; Hou, J.; Qi, X.; Ye, M.; Jiang, N.; Meng, F.; Xi, B.; Li, M. Biogas Upgrading Performance and Underlying Mechanism in Microbial Electrolysis Cell and Anaerobic Digestion Integrated System. Bioresour. Technol. 2024, 400, 130683. [Google Scholar] [CrossRef]
- Tripathi, A.; Kumar, S.; Jadhav, G.S.; Jadhav, D.A.; Ghangrekar, M.M.; Surampalli, R.Y. Electromethanogenic Reactor for Biogas Production Using Agricultural and Livestock Waste and Its Comparative Analysis with Biogas Plant: A Mini-Review. Biomass Bioenergy 2024, 185, 107246. [Google Scholar] [CrossRef]
- Wang, X.-T.; Zhao, L.; Chen, C.; Chen, K.-Y.; Yang, H.; Xu, X.-J.; Zhou, X.; Liu, W.-Z.; Xing, D.-F.; Ren, N.-Q.; et al. Microbial Electrolysis Cells (MEC) Accelerated Methane Production from the Enhanced Hydrolysis and Acidogenesis of Raw Waste Activated Sludge. Chem. Eng. J. 2021, 413, 127472. [Google Scholar] [CrossRef]
- Logan, B.E.; Rabaey, K. Conversion of Wastes into Bioelectricity and Chemicals by Using Microbial Electrochemical Technologies. Science 2012, 337, 686–690. [Google Scholar] [CrossRef] [PubMed]
- Cheng, S.; Xing, D.; Call, D.F.; Logan, B.E. Direct Biological Conversion of Electrical Current into Methane by Electromethanogenesis. Environ. Sci. Technol. 2009, 43, 3953–3958. [Google Scholar] [CrossRef]
- Baek, G.; Saikaly, P.E.; Logan, B.E. Addition of a Carbon Fiber Brush Improves Anaerobic Digestion Compared to External Voltage Application. Water Res. 2021, 188, 116575. [Google Scholar] [CrossRef]
- Wang, W.; Lee, D.-J.; Lei, Z. Integrating Anaerobic Digestion with Microbial Electrolysis Cell for Performance Enhancement: A Review. Bioresour. Technol. 2022, 344, 126321. [Google Scholar] [CrossRef]
- Li, M.; Zhang, Q.; Liu, Y.; Zhu, J.; Sun, F.; Cui, M.-H.; Liu, H.; Zhang, T.C.; Chen, C. Enhancing Degradation of Organic Matter in Microbial Electrolytic Cells Coupled with Anaerobic Digestion (MEC-AD) Systems by Carbon-Based Materials. Sci. Total Environ. 2023, 900, 165805. [Google Scholar] [CrossRef] [PubMed]
- Jiang, Z.; Yu, Q.; Sun, C.; Wang, Z.; Jin, Z.; Zhu, Y.; Zhao, Z.; Zhang, Y. Additional Electric Field Alleviates Acidity Suppression in Anaerobic Digestion of Kitchen Wastes via Enriching Electro-Active Methanogens in Cathodic Biofilms. Water Res. 2022, 212, 118118. [Google Scholar] [CrossRef]
- Zhao, Q.; Yuan, H.; Wang, H.; Li, X. Enhancing Biomethane Production from Corn Stover via Anaerobic Digestion Incorporated with Microbial Electrolysis Cell. Chin. J. Chem. Eng. 2025, in press. [Google Scholar] [CrossRef]
- Zhu, G.; Feng, Q.; Wang, K.; Song, Y.-C.; Zhou, Y.; Zhou, Q. Investigating the Performance of Different Applied Voltages on Lignite Biomethanation in Microbial Electrolytic Cell Coupled Anaerobic Digestion. Int. J. Hydrogen Energy 2024, 52, 147–159. [Google Scholar] [CrossRef]
- Zou, L.; Wang, C.; Zhao, X.; Wu, K.; Liang, C.; Yin, F.; Yang, B.; Liu, J.; Yang, H.; Zhang, W. Enhanced Anaerobic Digestion of Swine Manure via a Coupled Microbial Electrolysis Cell. Bioresour. Technol. 2021, 340, 125619. [Google Scholar] [CrossRef]
- Zhu, J.; Zhang, Q.; Li, M.; Sun, F.; Liu, H.; Cui, M.; Chen, C. The Microbial Electrolysis Cell Combined with Anaerobic Digestion for High Salinity Landfill Leachate Treatment: Operation Parameter Optimization, Microbial Analysis and Degradation Pathways. J. Water Process Eng. 2024, 65, 105795. [Google Scholar] [CrossRef]
- Ao, T.-J.; Zhao, X.-Q.; Mehmood, M.A.; Wang, N.; Zhu, H.; Liu, C.-G.; Bai, F.-W. A Double-Chamber Microbial Electrolysis Cell Improved the Anaerobic Digestion Efficiency and Elucidated the Underlying Bio-Electrochemical Mechanism. Chem. Eng. J. 2023, 471, 144228. [Google Scholar] [CrossRef]
- Huang, Q.; Liu, Y.; Ranjan Dhar, B. A Multifaceted Screening of Applied Voltages for Electro-Assisted Anaerobic Digestion of Blackwater: Significance of Temperature, Hydrolysis/Acidogenesis, Electrode Corrosion, and Energy Efficiencies. Bioresour. Technol. 2022, 360, 127533. [Google Scholar] [CrossRef]
- Korai, R.M.; Li, X. Effect of Ultrasonic Assisted KOH Pretreatment on Physiochemical Characteristic and Anaerobic Digestion Performance of Wheat Straw. Chin. J. Chem. Eng. 2020, 28, 2409–2416. [Google Scholar] [CrossRef]
- Li, Z.; Wachemo, A.C.; Yuan, H.; Korai, R.M.; Li, X. Improving Methane Content and Yield from Rice Straw by Adding Extra Hydrogen into a Two-Stage Anaerobic Digestion System. Int. J. Hydrogen Energy 2020, 45, 3739–3749. [Google Scholar] [CrossRef]
- Xu, Z.; Yuan, H.; Li, X. Anaerobic Bioconversion Efficiency of Rice Straw in Continuously Stirred Tank Reactor Systems Applying Longer Hydraulic Retention Time and Higher Load: One-Stage vs. Two-Stage. Bioresour. Technol. 2021, 321, 124206. [Google Scholar] [CrossRef] [PubMed]
- Zhao, Q.; Wang, H.; Liu, R.; Yuan, H.; Li, X. Enhancing Biomethane Yield and Metabolic Pathways in Kitchen Waste Anaerobic Digestion Through Microbial Electrolysis Cell Integration. Energies 2025, 18, 1629. [Google Scholar] [CrossRef]
- Sun, Z.; Liu, Q.; Li, Y.; Mazarji, M.; Feng, L.; Pan, J. Deciphering the Impact of Lignin on Anaerobic Digestion: Focus on Inhibition Mechanisms and Methods for Alleviating Inhibition. ACS Omega 2024, 9, 44033–44041. [Google Scholar] [CrossRef] [PubMed]
- Olatunji, K.O.; Ahmed, N.A.; Ogunkunle, O. Optimization of Biogas Yield from Lignocellulosic Materials with Different Pretreatment Methods: A Review. Biotechnol. Biofuels 2021, 14, 159. [Google Scholar] [CrossRef]
- Vu, M.T.; Noori, M.T.; Min, B. Magnetite/Zeolite Nanocomposite-Modified Cathode for Enhancing Methane Generation in Microbial Electrochemical Systems. Chem. Eng. J. 2020, 393, 124613. [Google Scholar] [CrossRef]
- Shen, R.; Zhao, L.; Yao, Z.; Feng, J.; Jing, Y.; Watson, J. Efficient Treatment of Wood Vinegar via Microbial Electrolysis Cell with the Anode of Different Pyrolysis Biochars. Front. Energy Res. 2020, 8, 216. [Google Scholar] [CrossRef]
- Choi, J.-M.; Lee, C.-Y. Bioelectrochemical Enhancement of Methane Production in Anaerobic Digestion of Food Waste. Int. J. Hydrogen Energy 2019, 44, 2081–2090. [Google Scholar] [CrossRef]
- Mortezaei, Y.; Demirer, G.N.; Williams, M.R. Fate of Intracellular and Extracellular Antibiotic Resistance Genes in Sewage Sludge by Full-Scale Anaerobic Digestion. Sci. Total Environ. 2024, 951, 175760. [Google Scholar] [CrossRef]
- Czatzkowska, M.; Wolak, I.; Harnisz, M.; Korzeniewska, E. Microbial Diversity and Biosafety Judgment of Digestates Derived from Different Biogas Plants for Agricultural Applications. J. Environ. Manag. 2024, 371, 123329. [Google Scholar] [CrossRef]
- Lim, J.W.; Chiam, J.A.; Wang, J.-Y. Microbial Community Structure Reveals How Microaeration Improves Fermentation during Anaerobic Co-Digestion of Brown Water and Food Waste. Bioresour. Technol. 2014, 171, 132–138. [Google Scholar] [CrossRef]
- Zhu, R.; Wang, D.-H.; Zheng, Y.; Zou, H.; Fu, S.-F. Understanding the Mechanisms behind Micro-Aeration to Enhance Anaerobic Digestion of Corn Straw. Fuel 2022, 318, 123604. [Google Scholar] [CrossRef]
- Demergasso, C.; Neilson, J.W.; Tebes-Cayo, C.; Véliz, R.; Ayma, D.; Laubitz, D.; Barberán, A.; Chong-Díaz, G.; Maier, R.M. Hyperarid Soil Microbial Community Response to Simulated Rainfall. Front. Microbiol. 2023, 14, 1202266. [Google Scholar] [CrossRef]
- Yang, B.; Xu, H.; Liu, Y.; Li, F.; Song, X.; Wang, Z.; Sand, W. Role of GAC-MnO2 Catalyst for Triggering the Extracellular Electron Transfer and Boosting CH4 Production in Syntrophic Methanogenesis. Chem. Eng. J. 2020, 383, 123211. [Google Scholar] [CrossRef]
- Lobo, S.A.L.; Warren, M.J.; Saraiva, L.M. Chapter Seven—Sulfate-Reducing Bacteria Reveal a New Branch of Tetrapyrrole Metabolism. In Advances in Microbial Physiology; Poole, R.K., Ed.; Advances in Bacterial Respiratory Physiology; Academic Press: Cambridge, MA, USA, 2012; Volume 61, pp. 267–295. [Google Scholar]
- Jiao, Y.; Yuan, Y.; He, C.; Liu, L.; Pan, X.; Li, P. Enrichment Culture Combined with Microbial Electrochemical Enhanced Low-Temperature Anaerobic Digestion of Cow Dung. Bioresour. Technol. 2022, 360, 127636. [Google Scholar] [CrossRef] [PubMed]
- Lovley, D.R.; Holmes, D.E. Electromicrobiology: The Ecophysiology of Phylogenetically Diverse Electroactive Microorganisms. Nat. Rev. Microbiol. 2022, 20, 5–19. [Google Scholar] [CrossRef] [PubMed]
- Holmes, D.E.; Shrestha, P.M.; Walker, D.J.F.; Dang, Y.; Nevin, K.P.; Woodard, T.L.; Lovley, D.R. Metatranscriptomic Evidence for Direct Interspecies Electron Transfer between Geobacter and Methanothrix Species in Methanogenic Rice Paddy Soils. Appl. Environ. Microbiol. 2017, 83, e00223-17. [Google Scholar] [CrossRef]
- Achinas, S.; Achinas, V.; Euverink, G.J.W. A Technological Overview of Biogas Production from Biowaste. Engineering 2017, 3, 299–307. [Google Scholar] [CrossRef]
- Ajay, C.M.; Mohan, S.; Dinesha, P.; Rosen, M.A. Review of Impact of Nanoparticle Additives on Anaerobic Digestion and Methane Generation. Fuel 2020, 277, 118234. [Google Scholar] [CrossRef]
- Duc, L.V.; Miyagawa, Y.; Inoue, D.; Ike, M. Identification of Key Steps and Associated Microbial Populations for Efficient Anaerobic Digestion under High Ammonium or Salinity Conditions. Bioresour. Technol. 2022, 360, 127571. [Google Scholar] [CrossRef]
- Basak, B.; Patil, S.M.; Kumar, R.; Ahn, Y.; Ha, G.-S.; Park, Y.-K.; Ali Khan, M.; Jin Chung, W.; Woong Chang, S.; Jeon, B.-H. Syntrophic Bacteria- and Methanosarcina-Rich Acclimatized Microbiota with Better Carbohydrate Metabolism Enhances Biomethanation of Fractionated Lignocellulosic Biocomponents. Bioresour. Technol. 2022, 360, 127602. [Google Scholar] [CrossRef]
- Zheng, D.; Wang, H.-Z.; Gou, M.; Nobu, M.K.; Narihiro, T.; Hu, B.; Nie, Y.; Tang, Y.-Q. Identification of Novel Potential Acetate-Oxidizing Bacteria in Thermophilic Methanogenic Chemostats by DNA Stable Isotope Probing. Appl. Microbiol. Biotechnol. 2019, 103, 8631–8645. [Google Scholar] [CrossRef]
- Xie, Z.; Meng, X.; Ding, H.; Cao, Q.; Chen, Y.; Liu, X.; Li, D. The Synergistic Effect of Rumen Cellulolytic Bacteria and Activated Carbon on Thermophilic Digestion of Cornstalk. Bioresour. Technol. 2021, 338, 125566. [Google Scholar] [CrossRef] [PubMed]
- Wang, X.-T.; Zhang, Y.-F.; Wang, B.; Wang, S.; Xing, X.; Xu, X.-J.; Liu, W.-Z.; Ren, N.-Q.; Lee, D.-J.; Chen, C. Enhancement of Methane Production from Waste Activated Sludge Using Hybrid Microbial Electrolysis Cells-Anaerobic Digestion (MEC-AD) Process—A Review. Bioresour. Technol. 2022, 346, 126641. [Google Scholar] [CrossRef]
- Xing, T.; Wang, Z.; Zhen, F.; Liu, H.; Wo, D.; Li, L.; Guo, Y.; Kong, X.; Sun, Y. Initial pH-Driven Production of Volatile Fatty Acid from Hybrid Pennisetum. Bioresour. Technol. 2022, 347, 126426. [Google Scholar] [CrossRef] [PubMed]
- Deng, Y.; Liu, M.; Fang, T.; Ma, H.; Beadham, I.; Ruan, W.; Wang, S.; Zhang, X.; Zhang, C. Enhancement of Anaerobic Digestion of Rice Straw by Amino Acid-Derived Ionic Liquid. Bioresour. Technol. 2023, 380, 129076. [Google Scholar] [CrossRef] [PubMed]
- Wu, Z.; Nguyen, D.; Lam, T.Y.C.; Zhuang, H.; Shrestha, S.; Raskin, L.; Khanal, S.K.; Lee, P.-H. Synergistic Association between Cytochrome Bd-Encoded Proteiniphilum and Reactive Oxygen Species (ROS)-Scavenging Methanogens in Microaerobic-Anaerobic Digestion of Lignocellulosic Biomass. Water Res. 2021, 190, 116721. [Google Scholar] [CrossRef]
- Amin, F.R.; Khalid, H.; El-Mashad, H.M.; Chen, C.; Liu, G.; Zhang, R. Functions of Bacteria and Archaea Participating in the Bioconversion of Organic Waste for Methane Production. Sci. Total Environ. 2021, 763, 143007. [Google Scholar] [CrossRef] [PubMed]
- Dong, H.; Cheng, J.; Li, H.; Yue, L.; Xia, R.; Zhou, J. Electron Transfer from Geobacter Sulfurreducens to Mixed Methanogens Improved Methane Production with Feedstock Gases of H2 and CO2. Bioresour. Technol. 2022, 347, 126680. [Google Scholar] [CrossRef]
- Pierson, L.S.; Pierson, E.A. Metabolism and Function of Phenazines in Bacteria: Impacts on the Behavior of Bacteria in the Environment and Biotechnological Processes. Appl. Microbiol. Biotechnol. 2010, 86, 1659–1670. [Google Scholar] [CrossRef]
- Li, X.; Chu, S.; Wang, P.; Li, K.; Su, Y.; Wu, D.; Xie, B. Potential of Biogas Residue Biochar Modified by Ferric Chloride for the Enhancement of Anaerobic Digestion of Food Waste. Bioresour. Technol. 2022, 360, 127530. [Google Scholar] [CrossRef]


Disclaimer/Publisher’s Note: The statements, opinions and data contained in all publications are solely those of the individual author(s) and contributor(s) and not of MDPI and/or the editor(s). MDPI and/or the editor(s) disclaim responsibility for any injury to people or property resulting from any ideas, methods, instructions or products referred to in the content. |
© 2025 by the authors. Licensee MDPI, Basel, Switzerland. This article is an open access article distributed under the terms and conditions of the Creative Commons Attribution (CC BY) license (https://creativecommons.org/licenses/by/4.0/).